Embed Size (px)
Citation preview

Estimation of Japanese Steel Product Trade
Elasticity of Substitution
Junichiro Oda*, Takashi Homma, Keigo Akimoto
Research Institute of Innovative Technology for the Earth (RITE)
Kyoto, Japan
*Contact us: [email protected]
The 15th IAEE European Conference 2017
September 3-6, 2017
Hofburg Congress Center, Vienna, Austria

-1
0
1
2
3
4
2005 2007 2009 2011 2013 2015
Vo
lum
e (
Mt/
y)
Japan's Exports
Japan's Imports
2017
0
25
50
2001 2003 2005 2007 2009 2011 2013 2015
Vo
lum
e (
Mt/
y)
Japan's exports
China's exports
Contents 2
1. Introduction
2. Analysis 1:
Price elasticity of substitution between
Japan’s export and Japan’s import
3. Analysis 2:
Price elasticity of substitution between
Japan’s export and China’s export
4. Summary
Heavy plate
Flat-rolled steel products

0 25 50 75 100
Import from global
Export to global
Japanese production
(Mt of steel product)
100%
43%
6%
94 Mt
41 Mt
6 Mt
Introduction (1/2) 3
1. Steel is a carbon intensive material.
Japanese steel industry emitted a 187 Mt of CO2 in 2016, accounting for a
17% of Japan's energy-related CO2 emissions.
If an unilateral carbon tax, 30 US$/tCO2, is adapted, steel production cost
could rise by 66 US$/t of steel (+11%).
2. Steel is a tradable commodity.
Japan directly exported 41 Mt of steel products in 2016.
3. The increase in production cost can lead to carbon leakage.
Elasticity is one of the key parameters for the significance of carbon leakage.

Introduction (2/2) 4
Japan’s steel products export to global in 2016
Flat-rolled71%
Semi-finished (Slab, etc) 11%
Long (Sections, etc) 7%
Tubes 2%
Others 9%
Heavy plate7%
Hot-rolled wide strip 32%
Cold-rolled wide strip 7%
Galvanized sheet 7%
Other flat-rolled
(Stainless, etc) 18%
Semi-finished (Slab, etc)
Long (Bars, etc)
Pipes and tubes
Others
Heavy plate
Hot-rolled wide strip
Cold-rolled wide strip
Galvanized sheet
Other flat-rolled
41 Mt
This study focuses on flat-rolled steel products as follows:
Analysis 1 Analysis 2
Flat-rolled steel products ✓ ✓
Heavy plate ✓
Hot-rolled wide strip ✓
・・・ ・・・
*1)http://www.retainingwallsteelql
d.com.au/products.php
*2)https://www.thyssenkrupp-
steel.com/en/products/heavy-
plate/heavy-plate-overview.html
*3)http://www.yogsunsteel.com/fl
at_products.php
*4)http://japanese.galvanized-
steelcoils.com/sale-5372291-
astm-a1008-din16723-
en10130-cold-rolled-steel-plate-
sheet-for-oil-drum.html
*5)https://en.wikipedia.org/wiki/Ho
t-dip_galvanization
*1
*2
*3
*4
*5

0
500
1,000
1,500
2005 2007 2009 2011 2013 2015
Un
it p
rice
(U
S$/t
)
Japan's Exports (FOB)
Japan's Import (CIF)
2017-10
0
10
20
30
2005 2007 2009 2011 2013 2015
Vo
lum
e (
Mt/
y)
Japan's Exports
Japan's Imports
2017
Analysis 1: Elasticity of substitution between Japan’s export and Japan’s import 5
Methodology
1. Previous work for estimating trade elasticity
Armington (1969): substitution between domestic and imported goods
Hoshino (2001): semi-conductor trade elasticity in Japan
2. Based on Hoshino (2001), Analysis 1 applies the following:
𝑙𝑛𝐽𝑎𝑝𝑎𝑛′𝑠 𝑒𝑥𝑝𝑜𝑟𝑡 𝑣𝑜𝑙. [t]
𝐽𝑎𝑝𝑎𝑛′𝑠 𝑖𝑚𝑝𝑜𝑟𝑡 𝑣𝑜𝑙. [t]= 𝑐 + 𝑒𝑙𝑎𝑠𝑡𝑖𝑐𝑖𝑡𝑦 ∙ 𝑙𝑛
𝐽𝑎𝑝𝑎𝑛′𝑠 𝑒𝑥𝑝𝑜𝑟𝑡 𝑝𝑟𝑖𝑐𝑒 [US$/t]
𝐽𝑎𝑝𝑎𝑛′𝑠 𝑖𝑚𝑝𝑜𝑟𝑡 𝑝𝑟𝑖𝑐𝑒 [US$/t]+ 𝑔 ∙ 𝑦𝑒𝑎𝑟
Data Flat-rolled steel products(a) Volume (Mt/y) (b) Unit price (US$/t)
Ref) Ministry of Finance (2017): Trade statistics of Japan, http://www.customs.go.jp/toukei/info/index_e.htm

0
500
1,000
1,500
2005 2007 2009 2011 2013 2015
Un
it p
rice
(U
S$/t
)
Japan's Exports (FOB)
Japan's Imports (CIF)
2017
0
500
1,000
1,500
2005 2007 2009 2011 2013 2015
Un
it p
rice
(U
S$/t
)
Japan's Exports (FOB)
Japan's Imports (CIF)
2017
-5
0
5
10
15
2005 2007 2009 2011 2013 2015
Vo
lum
e (
Mt/
y)
Japan's Exports
Japan's Imports
2017
Analysis 1: Data (1/2) 6
Hot-rolled wide strip(a) Volume (Mt/y) (b) Unit price (US$/t)
Ref) Ministry of Finance (2017): Trade statistics of Japan, http://www.customs.go.jp/toukei/info/index_e.htm
Heavy plate
-1
0
1
2
3
4
2005 2007 2009 2011 2013 2015
Vo
lum
e (
Mt/
y)
Japan's Exports
Japan's Imports
2017
(a) Volume (Mt/y) (b) Unit price (US$/t)
*2
*3

0
500
1,000
1,500
2005 2007 2009 2011 2013 2015
Un
it p
rice
(U
S$/t
)
Japan's Exports (FOB)
Japan's Imports (CIF)
2017
0
500
1,000
1,500
2005 2007 2009 2011 2013 2015
Un
it p
rice
(U
S$/t
)
Japan's Exports (FOB)
Japan's Imports (CIF)
2017
-1
0
1
2
3
4
2005 2007 2009 2011 2013 2015
Vo
lum
e (
Mt/
y)
Japan's Exports
Japan's Imports
2017
-2
0
2
4
2005 2007 2009 2011 2013 2015
Vo
lum
e (
Mt/
y)
Japan's Exports
Japan's Imports
2017
Analysis 1: Data (2/2) 7
Galvanized sheet(a) Volume (Mt/y) (b) Unit price (US$/t)
Ref) Ministry of Finance (2017): Trade statistics of Japan, http://www.customs.go.jp/toukei/info/index_e.htm
Cold-rolled wide strip(a) Volume (Mt/y) (b) Unit price (US$/t)
*4
*5

Analysis 1: Regression results 8
[Monthly data basis]
12 years (Jan. 2005―Jan. 2017) 4 years (Jan. 2013―Jan. 2017)
elasticity g, time trend R2adj elasticity g, time trend R2adj
Flat-rolledsteel products -0.66** -1%/y 0.05 N/A
Heavyplate -1.18** -17**%/y 0.53 -1.83** -24**%/y 0.50
Hot-rolledwide strip -0.64** 7**%/y 0.59 N/A
Cold-rolledwide strip -0.99** -1%/y 0.13 N/A
Galvanizedsheet N/A -1.16** -23**%/y 0.50
Negative time trends imply that Japanese steel industry was losing market share.
Large elasticity implies that price competitiveness was very intensive.
Note) “N/A” means that we can’t observe statistically significant results.
* denotes significance level < 10%. ** denotes significance level < 5%.

Japan’s steel
makers
-5
0
5
10
15
2005 2007 2009 2011 2013 2015
Vo
lum
e (
Mt/
y)
Japan's Exports
Japan's Imports
2017
-1
0
1
2
3
4
2005 2007 2009 2011 2013 2015
Vo
lum
e (
Mt/
y)
Japan's Exports
Japan's Imports
2017
Analysis 1: Discussion 9
[Monthly data basis]12 years (Jan. 2005―Jan. 2017) 4 years (Jan. 2013―Jan. 2017)
elasticity g, time trend R2adj elasticity g, time trend R2adj
Hot-rolled wide strip -0.64** 7**%/y 0.59 N/A
Galvanized sheet N/A -1.16** -23**%/y 0.50
Galvanized
Sheet, GS
(Mt/y)
Hot-rolled
wide strip,
HRS (Mt/y)2000’ 2010’
Hot-rolled wide strip (Mt/y)
Thai car
companies
Japan’s steel
makers
GS
Thai car
companies
GS
Thai re-
rollers
HRS*3
*5
e.g., Toyota Motor Thailand

0
25
50
2001 2003 2005 2007 2009 2011 2013 2015
Vo
lum
e (
Mt/
y)
Japan's Exports
China's Exports
0
500
1,000
2001 2003 2005 2007 2009 2011 2013 2015
Un
it p
rice
(U
S$/t
)
Japan's Exports (FOB)
China's Exports (Benchmark)
Analysis 2: Elasticity of substitution between Japan’s export and China’s export 10
Methodology
Based on Hoshino (2001), Analysis 2 applies the following:
𝑙𝑛𝐽𝑎𝑝𝑎𝑛′𝑠 𝑒𝑥𝑝𝑜𝑟𝑡 𝑣𝑜𝑙. [t]
𝐶ℎ𝑖𝑛𝑎′𝑠 𝑒𝑥𝑝𝑜𝑟𝑡 𝑣𝑜𝑙. [t]= 𝑐 + 𝑒𝑙𝑎𝑠𝑡𝑖𝑐𝑖𝑡𝑦 ∙ 𝑙𝑛
𝐽𝑎𝑝𝑎𝑛′𝑠 𝑒𝑥𝑝𝑜𝑟𝑡 𝑝𝑟𝑖𝑐𝑒 [US$/t]
𝐶ℎ𝑖𝑛𝑎′𝑠 𝑒𝑥𝑝𝑜𝑟𝑡 𝑝𝑟𝑖𝑐𝑒 [US$/t]+ 𝑔 ∙ 𝑦𝑒𝑎𝑟
DataFlat-rolled steel products
(a) Volume (Mt/y) (b) Unit price (US$/t)
Ref) World Steel Dynamics Inc. Steel Benchmarker (2017)

Analysis 2: Regression results 11
(Annual data basis)15 years (2001―2015)
elasticity g, time trend R2adj
Flat-rolled steel products -3.34** -11**%/y 0.87
Negative time trend implies that Japanese steel industry is losing share of global
market. Large elasticity implies that price competitiveness is very intensive.
Discussion
Combining the estimated elasticity (-3.34) and an unilateral carbon tax (30 US$/tCO2)
can lead to carbon leakage.
Japan China Total (net)
Flat-rolled steel production -4.2 Mt/y (-15%) 4.2 Mt/y (+9%) 0
CO2 emission -9.3 MtCO2/y 10.6 MtCO2/y 1.3 MtCO2/y
CO2 intensity of BF steel mill 2.2 tCO2/t 2.5 tCO2/t -
Note) Japanese steel production cost can rise by 66 US$/t of steel (+11%) based on
full cost pass-through rate of carbon cost. 2015 market condition basis.

Summary (1/2) 12
The results indicate large elasticity, which means that price competitiveness was
very intensive.
The results also indicate negative time trends, which means that Japan’s steel
industry was loosing their market share.
Analysis 1: Elasticity of substitution between Japan’s export and Japan’s import
• Galvanized sheet [Jan. 2013―Jan. 2017]
Elasticity: -1.16
• Hot-rolled wide strip [Jan. 2005―Jan. 2017]
Elasticity: -0.64
Note) This is consistent with active overseas production of Thai re-rollers and
Thai car companies (e.g., Toyota Motor Thailand).
Time trend: -23%/y
Time trend: 7%/y *3
*5
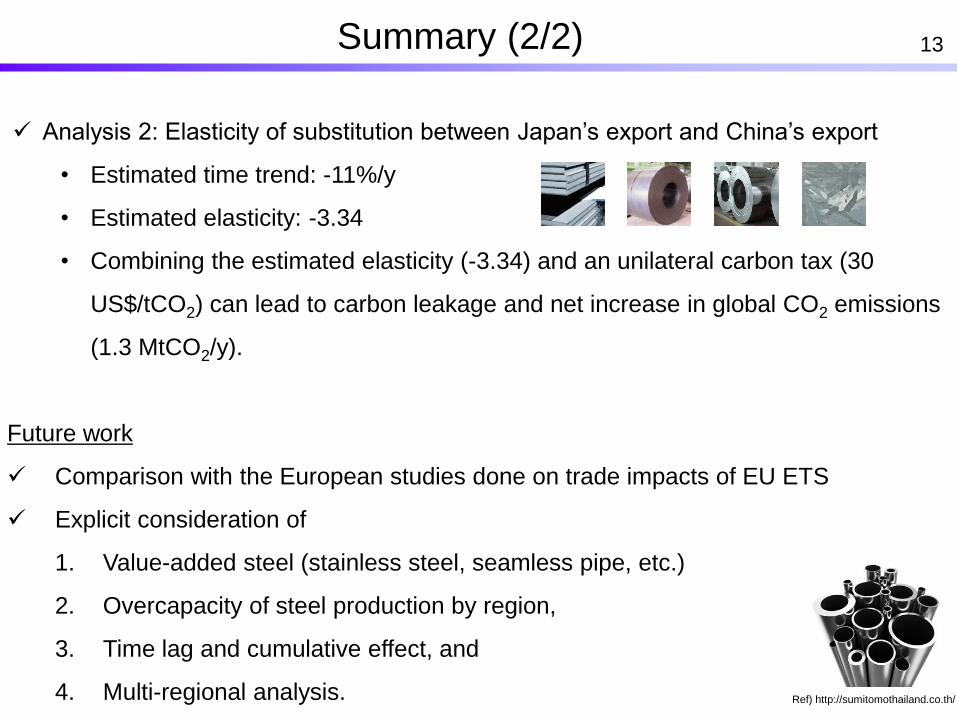
Summary (2/2) 13
Future work
Comparison with the European studies done on trade impacts of EU ETS
Explicit consideration of
1. Value-added steel (stainless steel, seamless pipe, etc.)
2. Overcapacity of steel production by region,
3. Time lag and cumulative effect, and
4. Multi-regional analysis.
Analysis 2: Elasticity of substitution between Japan’s export and China’s export
• Estimated time trend: -11%/y
• Estimated elasticity: -3.34
• Combining the estimated elasticity (-3.34) and an unilateral carbon tax (30
US$/tCO2) can lead to carbon leakage and net increase in global CO2 emissions
(1.3 MtCO2/y).
Ref) http://sumitomothailand.co.th/

Discussion on international steel trade 14
Elasticity and its determinants
• MER
• Transaction mode
Negotiation transaction
Selling at a store
• Product differentiation
Time trend and its determinants
• Overcapacity of steel
production, esp. in China
• Supply chain dynamics
Other factors (and error)
• Anti-dumping, safeguard, and
countervailing duties
General
1. Japan’s re-rollers tend to import hot-rolled
coil in order to keep the bargaining power
against domestic suppliers: NSSMC, JFE.
2. Thai car companies have been shifting
“galvanized sheet import from Japan” to
“galvanized sheet purchase from Thai re-
rollers.”
Example
3. Japan import low-
grade heavy plate,
such as flooring in
construction site.

0
1,000
2,000
3,000
2005
Q1
2006
Q1
2007
Q1
2008
Q1
2009
Q1
2010
Q1
2011
Q1
2012
Q1
2013
Q1
2014
Q1
2015
Q1
2016
Q1
Un
it p
rice
(US$
/met
ric
ton
)
Japan's export price (FOB)
Japan's import price (CIF): Nominal
Japan's import price (CIF): Corrected
-0.5
0.0
0.5
1.0
1.5
2.0
2.520
05Q
1
2006
Q1
2007
Q1
2008
Q1
2009
Q1
2010
Q1
2011
Q1
2012
Q1
2013
Q1
2014
Q1
2015
Q1
2016
Q1Vo
lum
e (m
illio
ns
of m
etri
c to
ns/
qu
arte
r)
Japan's exports
Japan's imports
Appendix: Other flat-rolled steel products 15
(a) Volume (Mt/y) (b) Unit price (US$/t)
Ref) http://sumitomothailand.co.th/
0
1000
2000
3000
0 25 50 75
Jap
an's
imp
ort
pri
ce (C
IF):
No
min
al(U
S$/m
etri
c to
n)
Japan's import volume (103 metric tons/month)
2013 2014
2015 2016
(a+b) Relationship between volume and nominal unit price (monthly)
Japan’s import volume and
nominal unit price of other flat-
rolled steel were fluctuated.
In order to avoid composite effect,
this study developed a corrected
price index based on price
trajectory of 14 steel products.


![Exporter Questionnaire Hot Rolled Coil Steel Exported to ... · [h]ot rolled coil (including in sheet form), a flat rolled product of iron or non-alloy steel, not clad, plated or](https://img.dokumen.tips/doc/110x75/5ea3808aef6d1351eb6602c9/exporter-questionnaire-hot-rolled-coil-steel-exported-to-hot-rolled-coil-including.jpg)