Embed Size (px)
Citation preview

C
fun
sa
Comm
ction
alt ma
munit
in na
arsh h
Co
ty stru
atural
habita
od, M
uctur
and
ats on
MA
e and
resto
n Cap
d
ored
pe
AUTHOJessica BMBL SES ClarksonDepartmPotsdam
ADVISOJohn Sch
The Ecos
Marine B
Woods H
SPECIANick Bar
Miami U
Oxford, O
Jimmy N
The Ecos
Marine B
Woods H
OR Beach S 2014
n University ment of Biologm, NY
OR hade
systems Cent
Biological Lab
Hole, MA
AL THANKSrrett
University
OH
Nelson
systems Cent
Biological Lab
Hole, MA
gy ‘15
er
boratory
er
boratory

‐ 1 ‐
Abstract
A common practice for attempting to restore tidally restricted salt marshes to their previous
condition in New England is to simply remove the barrier to allow full tidal flow. My objective
was to determine if these marshes are truly being restored to the community structure (species
and habitat composition) and function (terrestrial‐aquatic habitat connectivity and secondary
productivity) observed in natural marshes, and to assess how quickly this restoration may
occur. To test this I used a comparative approach by sampling from both natural and restored
marsh sections within each site. I sampled various groups of organisms in three such marsh
sites that varied in time since restoration to assess structural characteristics and used stable
isotopic analysis on mummichogs, a fish species often used as an indicator to determine if
energy flow characteristics were similar between restored and natural marshes. Based on the
results I speculate that recently restored marshes may experience a pulse of productivity (and
similarity among mummichogs diet) related to the opening up of new heterogeneous habitats
(based on data from a 2009 restoration), then over time productivity in the natural vs. restored
sections relaxes to equilibrium and if the restored sections do not retain a level of productivity
and fish diet similar to the natural section then something is missing in the restoration (based
on data from 2006 and 2003 restorations). Alternately, my results may reflect site specific
differences dictated by their individual trajectories of restoration. Further study is required
within these marshes and on other similarly restored marshes to get a better picture of the
success of this restoration method on restoring community structure and function, and to
better see the trajectory of restoration over time.
KEY WORDS: Cape Cod, Massachusetts, salt marsh, ecological restoration, salt marsh
restoration, tidal restoration, aquatic‐terrestrial connectivity, structure, function, productivity,
fish, nekton, mummichogs, Fundulus heteroclitus, zooplankton, insects, spiders, benthic
invertebrates, stable isotope analysis, State Game Farm, Bridge Creek, Bass Creek

‐ 2 ‐
Introduction
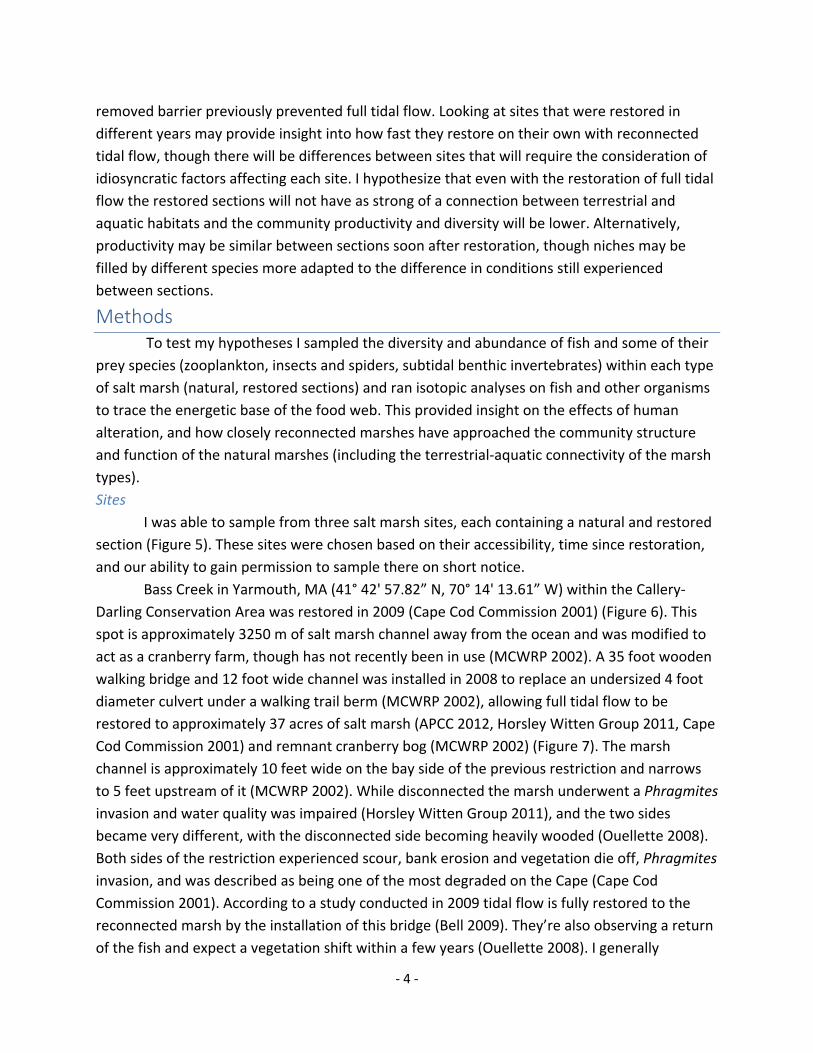
Salt marshes, also known as tidal marshes, are unique natural coastal systems that act
as a transitional zone between terrestrial and aquatic ecosystems. The eastern North American
coast possesses over one‐third of the global extent of these marshes which are structurally
defined by the influence of the oceanic tide. These systems provide a variety of ecosystem
services for humans including natural disaster buffering, protection against waves, nutrient
exchange between salt and freshwater, mitigation of sea level rise, erosion control, nutrient
cycling, water purification, sediment trapping, pollution treatment, mitigation of sea level rise,
oxygen production, and carbon sequestration through the buildup of organic matter as peat, as
well as providing highly productive and diverse habitats and nursery ground for a great number
of economically important, and not directly economically important, species (Carlisle et al.
2002).
These marshes have a high diversity of structure and habitats within them as a result of
the tidal fluctuations they experience throughout the day, during which some areas spend
more time inundated than others, and fluctuate in salinity, temperature, and oxygen content.
Mudflat regions are inundated most of the time and don’t support any rooted vegetation,
lower marsh areas are found bordering channels in narrow bands dominated by Spartina
alterniflora vegetation and are flooded for much of the day, and high marsh can be a very
expansive area dominated by Spartina patens and only inundated at high tide. Upland areas
and marsh borders rarely experience any inundation and contain a diversity of shrubs and trees
(Carlisle et al. 2002; Drociak 2005) (Figure 1). Species groups present in these marshes generally
include phytoplankton, algae, detrital microbes, uniquely adapted vegetation, zooplankton,
benthic invertebrates, terrestrial insects and spiders, mollusks, crustaceans and fish (nekton),
birds, and a very limited number of reptiles and mammals (Drociak 2005). The food web in
these systems is generally fairly simple with few trophic levels, with fish or larger crabs acting as
the top predators, with some predatory influence from the birds and mammals (Carlisle et al.
2002) (Figure 2).
Young fish with tolerances to abrupt salinity changes have a significant presence in
these salt marshes and they provide the central link between the aquatic and terrestrial
components of the system through their food web interactions. Common salt marsh fish, such
as the mummichog (Fundulus heteroclitus), are omnivorous opportunistic feeders and are well
known to consume aquatic phytoplankton, zooplankton, subtidal benthic invertebrates, and
other small fish and crustaceans, as well as terrestrial insects and spiders (larvae and adults),
intertidal benthic invertebrates of the low‐high marsh, and plant‐derived organic matter (Nixon
and Oviatt 1973, Kneib 1986; Weisburg and Lotrich 1982). Studies have indicated that subtidal
food sources alone are not sufficient to support their growth, and that regular access to the
high marsh via tidal fluctuation provides a significant food source and is essential to maintain

‐ 3 ‐
their populations (Butner and Brattstrom 1960; Weisburg and Lotrich 1982) (Figure 3). They
also require access to these areas, obtained by natural tidal fluctuations, as a refuge from
predation and as a nursery for their eggs (Kneib 1986, Taylor 1986). Mummichogs are known to
have the highest productivities reported for fish (Valiela et al. 1977), which can be affected by
the extent of salt marsh that they can use. Natural salt marshes with this terrestrial‐aquatic
connection intact are very productive systems.
As human influence has increased in coastal areas many of these salt marsh systems
have been compromised by human activities, including filling them in for construction, ditching
them for drainage to control mosquito, damming them for agricultural purposes (salt hay
farming, cranberry harvesting), and restricting their tidal flow by building rail lines and roads
(Carlisle et al. 2002; Gedan et al. 2009). The structure of these altered systems goes through
significant changes over time as the result of management and changes to their natural tidal
regime, such as a transition from a depositional to an erosional sediment cycle, and a lower
surface elevation and soil water salinity that leaves it open to Phragmites invasion (Roman et al.
1984; Gedan et al. 2009). In recent years, we have realized the economic and ecological
importance of these systems, and have begun restoration projects consisting primarily of
removing dams and undersized culverts and installing large culverts that would allow the return
of full tidal flow. A marsh system is generally considered restored to a natural state if there is a
return of the tidal flow and vegetative communities return to natural Spartina from invasive
Phragmites dominance (Dionne et al. 1999; Roman et al. 2002, Warren et al. 2002).
Perhaps this does work, but what if it’s just the appearance of restoration? Many
organizations have put forth sets of guidelines for a more in depth assessment of full ecological
restoration, which are generally centered on the return of marsh structure and function to
conditions prior to disturbance, or to the observed condition of an adjacent natural marsh
section (Figure 4). A restoration of structure generally refers to that of species richness of
assemblages of organisms (which requires a restoration of their habitats), and a functional
restoration refers to a measure of production (primary or secondary). Restoration of function
will require, as previously discussed, a restoration of key linkages related to food web structure,
including the aquatic to terrestrial marsh connectivity to support fish production. Restoration
does not necessarily preclude that all species must be the same between the systems, as long
as the functional niches are filled the function returns (Palmer et al. 1997). Variations in fish
diversity and abundance, as well as their expected trophic relationships, in restored marshes
are known to be valuable indicators of habitat suitability and restoration of ecological function
(Kelly and Harwell 1990).
My objective was to answer the following question: are “restored” salt marshes
returning to the community structure and function observed in natural salt marshes? For the
purposes of this study I am defining a natural salt marsh as the section of a marsh that has
always been connected to the ocean, and a restored salt marsh as the section where a recently
‐ 4 ‐
removed barrier previously prevented full tidal flow. Looking at sites that were restored in
different years may provide insight into how fast they restore on their own with reconnected
tidal flow, though there will be differences between sites that will require the consideration of
idiosyncratic factors affecting each site. I hypothesize that even with the restoration of full tidal
flow the restored sections will not have as strong of a connection between terrestrial and
aquatic habitats and the community productivity and diversity will be lower. Alternatively,
productivity may be similar between sections soon after restoration, though niches may be
filled by different species more adapted to the difference in conditions still experienced
between sections.
Methods To test my hypotheses I sampled the diversity and abundance of fish and some of their
prey species (zooplankton, insects and spiders, subtidal benthic invertebrates) within each type
of salt marsh (natural, restored sections) and ran isotopic analyses on fish and other organisms
to trace the energetic base of the food web. This provided insight on the effects of human
alteration, and how closely reconnected marshes have approached the community structure
and function of the natural marshes (including the terrestrial‐aquatic connectivity of the marsh
types).
Sites
I was able to sample from three salt marsh sites, each containing a natural and restored
section (Figure 5). These sites were chosen based on their accessibility, time since restoration,
and our ability to gain permission to sample there on short notice.
Bass Creek in Yarmouth, MA (41° 42' 57.82” N, 70° 14' 13.61” W) within the Callery‐
Darling Conservation Area was restored in 2009 (Cape Cod Commission 2001) (Figure 6). This
spot is approximately 3250 m of salt marsh channel away from the ocean and was modified to
act as a cranberry farm, though has not recently been in use (MCWRP 2002). A 35 foot wooden
walking bridge and 12 foot wide channel was installed in 2008 to replace an undersized 4 foot
diameter culvert under a walking trail berm (MCWRP 2002), allowing full tidal flow to be
restored to approximately 37 acres of salt marsh (APCC 2012, Horsley Witten Group 2011, Cape
Cod Commission 2001) and remnant cranberry bog (MCWRP 2002) (Figure 7). The marsh
channel is approximately 10 feet wide on the bay side of the previous restriction and narrows
to 5 feet upstream of it (MCWRP 2002). While disconnected the marsh underwent a Phragmites
invasion and water quality was impaired (Horsley Witten Group 2011), and the two sides
became very different, with the disconnected side becoming heavily wooded (Ouellette 2008).
Both sides of the restriction experienced scour, bank erosion and vegetation die off, Phragmites
invasion, and was described as being one of the most degraded on the Cape (Cape Cod
Commission 2001). According to a study conducted in 2009 tidal flow is fully restored to the
reconnected marsh by the installation of this bridge (Bell 2009). They’re also observing a return
of the fish and expect a vegetation shift within a few years (Ouellette 2008). I generally

‐ 5 ‐
observed tall Sparina vegetation bordering the natural marsh channel with short Spartina in the
low marsh area and Phragmites on the upland boundary, however the restored side contained
a large amount of woody vegetation interspersed with limited salt marsh vegetation.
Additionally the restored section contained an extensive ditch system, likely related to past
efforts at mosquito control, which provides more tidal aquatic habitat at the expense of tidal
terrestrial habitat (Gedan et al. 2009). Sedimentation here within the channel was primarily
sand on both the natural and restored side. Something of note about this site is that the
restored site is at a higher elevation and has a lot of sand buildup at its entrance, which largely
cuts the two sections off from each other when the tide is low. Also at this site the water was
described as having a “tea coloration”, which was not observed at either of the other sites.
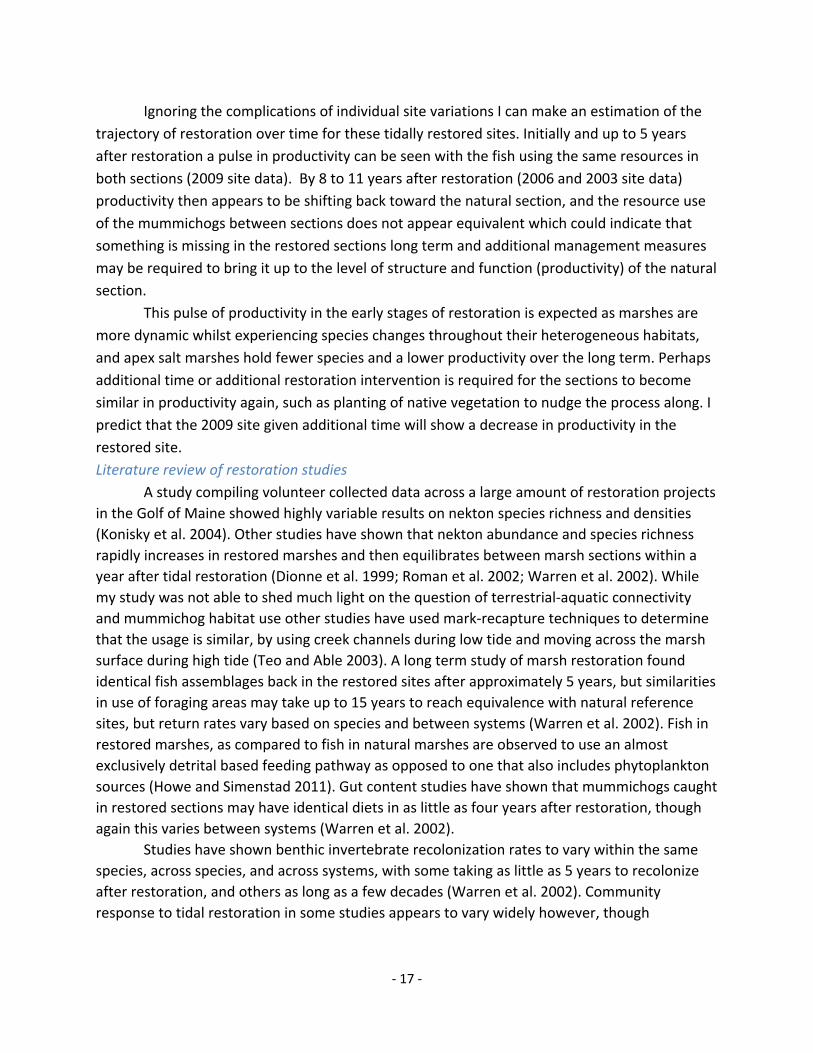
Scorton Creek, which is located within the Massachusetts State Game Farm in East
Sandwich, MA (41° 43' 51.96" N, 70° 25' 38.04" W), and is owned by Massachusetts Fish and
Wildlife and operated by the Thornton Burgess Society within the Barnstable Harbor Area of
Critical Environmental Concern (MCWRP 2002) (Figure 8). This spot is approximately 4800 m of
salt marsh channel away from the ocean. There had been a dam barrier created by a roadbed in
place for 50 years for the purpose of using the disconnected area as a pond for raising trout,
and its removal occurred when the dam became condemned and the goals of the game farm
changed to restoration (MCWRP 2002). The complete cutting off of this marsh by a dam could
have allowed it to completely become a freshwater wetland system while disconnected (Roman
et al. 1984). It was reconnected in 2006 by the construction of a wooden vehicle bridge and
concrete bordered channel underneath that allowed restored tidal flow and fish migration
paths, and reconnected approximately 8 acres that was previously salt marsh (Figure 9). It has
already been reported that there has been an increase in fish species diversity and a decline in
Phragmites dominance (Horsley Witten Group 2010, Thornton W. Burgess Society 2014). Most
of the vegetation bordering the channel was S. alterniflora and S. patens was found in the low
marsh areas, with Phragmites at the upland boundary, but directly surrounding the previous
restriction and along the end of the restored section there were many areas where Phragmites
dominated the channel border as well. A large portion of the high marsh of the restored section
of this site contained piles of dead and decaying Phragmites vegetation. Sedimentation here
was rich mud and organic matter, more so in the restored than the natural, where it was
slightly sandier. Channel bank height at this site was much lower in the restored section, likely
due to a lack of vegetation growth and peat buildup while cut off. Additionally the natural
section appears to have been ditched to some extent, though not as extensively as the restored
section of the 2009 site.
Bridge Creek in Barnstable, MA (41° 42' 11.35” N, 70 21' 44.72” W) at the limits of the
Barnstable Harbor Area of Critical Environmental Concern (WCWRP 2000) (Figure 10). This spot
is approximately 5400 m of salt marsh channel away from the ocean. The marsh channel is 10‐
15 feet wide on both sides of the restriction. The previous restriction was a three foot diameter

‐ 6 ‐
metal culvert under the railroad that clogged often with wooden boards, and vegetation (Figure
11), there was also a similar culvert under the roadway that was also replaced. Prior to the
installation of a large box culvert (to match the one underneath Route 6A) in 2003 the
disconnected side experienced marsh slumping, vegetation die off, ponded water, Phragmites
invasion, a wide scoured basin, and extensive bank erosion. The areas up gradient of the barrier
contained areas of salt marsh vegetation, extensive areas of Phragmites‐dominated marsh, and
shrub and forested swamp. According to a study conducted in 2005 there is full tidal restoration
to 40 acres of marsh upstream of the previous restriction (WCWRP 2000). It has also been
suggested that fish and wildlife are returning to the area. This marsh is known to support
shellfish and anadromous fish (Cape Cod Commission 2001). I observed vegetation similar to
the 2006 site here. Sedimentation consisted of clay interspersed with organic matter in both
the natural and restored areas. Of the three sites this one was the most visually similar
between natural and restored sections.
Sampling
Within each site I sampled from each of the salt marsh types, natural and restored on
either side of the previous barrier. Most sampling occurred around low tide, though some was
conducted during mid‐high tides when necessary.
Terrestrial vegetative samples were collected for isotopic analysis from the 2006 site. I
collected vegetation bordering the channel (sample a, S. alterniflora), vegetation mid‐way
between the channel and the upland boundary (sample b, S. patens), and vegetation at the
upland boundary (sample c, Phragmites) in both the natural and restored sections. The natural
and restored samples were homogenized and ground into a fine powder using a Wigglebug
grinding machine, and placed in small glass scintillation vials for submission for isotopic
analysis.
Insect and spider samples were taken along on the same system as was used to collect
vegetation samples. At each of the three sampling sites the bounds of an approximately 1m x
1m quadrat of representative vegetation in that location was established using a tape measure
or best estimates. A sweep net was vigorously swept ~50 times through all heights of the
vegetation in the quadrat. The insects and vegetation fragments in the tip of the net were
emptied into small scintillation vials periodically to prevent active insects and spiders from
escaping (Davis and Gray 1966). Specimens were preserved ethanol upon returning to the lab
and stored in the fridge. In petri dishes the samples were separated from vegetative debris,
sorted by appearance, and identified using a dissection microscope, or compound microscope
if necessary, and an identification guide.
Zooplankton samples were taken using a large tow net with a mesh size of 200µm and
diameter of 48cm. The net was suspended into the channel assisted by a pole or structural
component of the site at each marsh section for a measured period of time. Preference was
shown for sampling water that was flowing out of the natural site as the tide was coming in and

‐ 7 ‐
flowing out of the restored site as the tide was going out, to collect the most representative
samples for each marsh section. An electronic flowmeter was suspended in the water prior to
beginning the sampling duration to estimate the amount of water that would be passing
through the net. All of the zooplankton was rinsed from the net into the cod end for collection
by dipping the net in the water and spraying with a DI water bottle. The sample was then
transferred from the cod end into a 1L bottle by dumping and thorough rinsing, and the bottle
was filled approximately ½ full with water to maintain the integrity of the sample. Two samples
were taken per marsh section when possible. Samples were stored on ice in field, and the
fridge in lab (Foreman and Nelson 2014). If samples were not examined immediately they were
preserved in acetone and/or lugols solution.
Zooplankton samples containing a large amount of plant matter were filtered through a
1 mm mesh sieve stacked on a 100 µm mesh sieve, with the matter collected on the 1 mm
sieve being thoroughly rinsed to allow all zooplankton collection on the 100 µm mesh. The
collection on the 100 µm mesh sieve was then rinsed back into the sample bottle and diluted
with water if necessary. Graduated cylinders were used to determine the total volume of
sample. To quantitatively count the sample it was first homogenize by shaking the bottle, then
immediately pouring a small (3‐20 ml) subsample amount in a graduated cylinder and into a
petri dish. Lugols solution was added when necessary to increase organism visibility under the
dissection microscope. If there were too many organisms on the plate to count it was poured
back and a smaller subsample was taken and diluted for counting. All organisms on the plate
were identified and counted using dissection and compound microscopes and an identification
guide. Subsample counts were scaled to the full sample based on the previously measured
volume of each sample. These numbers were then extrapolated to count per volume of water
that passed through the net to collect the sample. Since zooplankton cannot be easily weighed
values for the mass of a copepod (0.00005 g) and cladocera (0.0000001 g) were taken from
(Foreman and Nelson 2014), and a literature value was used for ostracods (0.0003 g) (Shuhaimi‐
Othman et al. 2011). For taxonomies where a literature value of mass wasn’t readily available
(i.e. water mite) a value was estimated based on its size compared to the other zooplankton
taxonomies (0.00005 for water mites).
For subtidal benthic invertebrate sampling an Ekman grab was used to collect sediment
from the channel. Preference was shown for selecting a spot as far away from the previous
barrier as possible on each side, then halfway back, and one relatively close to the barrier, and
where sedimentation appeared to be representative of that portion of the channel. The sample
was emptied into a bucket, diluted with water and stirred. The mixture was then dumped
through a course 4mm mesh sieve over a 1mm mesh sieve over a 200 µm mesh sieve to sort
out organisms from sample. The collections of animals from 4mm and 1mm and animals and
sludge from 200µm screens were placed into a bottle to bring back to the lab. This was
repeated for 2‐3 samples in each marsh section at varying distances from the previous barrier.
‐ 8 ‐
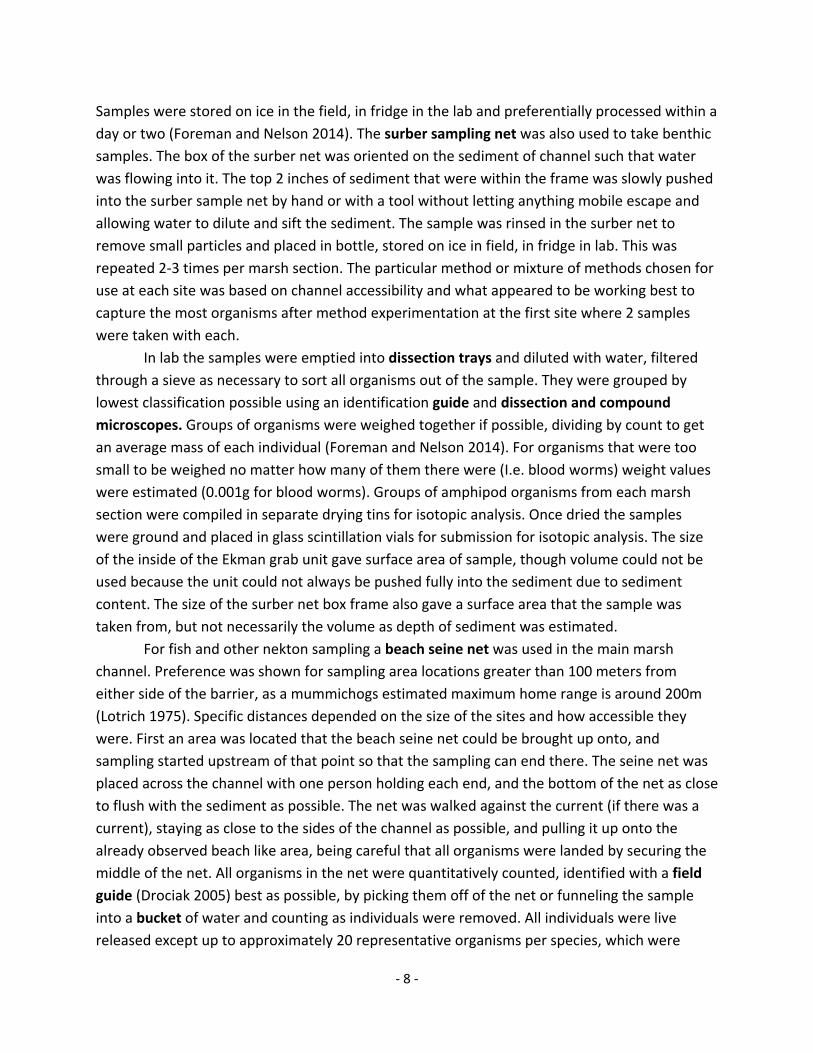
Samples were stored on ice in the field, in fridge in the lab and preferentially processed within a
day or two (Foreman and Nelson 2014). The surber sampling net was also used to take benthic
samples. The box of the surber net was oriented on the sediment of channel such that water
was flowing into it. The top 2 inches of sediment that were within the frame was slowly pushed
into the surber sample net by hand or with a tool without letting anything mobile escape and
allowing water to dilute and sift the sediment. The sample was rinsed in the surber net to
remove small particles and placed in bottle, stored on ice in field, in fridge in lab. This was
repeated 2‐3 times per marsh section. The particular method or mixture of methods chosen for
use at each site was based on channel accessibility and what appeared to be working best to
capture the most organisms after method experimentation at the first site where 2 samples
were taken with each.
In lab the samples were emptied into dissection trays and diluted with water, filtered
through a sieve as necessary to sort all organisms out of the sample. They were grouped by
lowest classification possible using an identification guide and dissection and compound
microscopes. Groups of organisms were weighed together if possible, dividing by count to get
an average mass of each individual (Foreman and Nelson 2014). For organisms that were too
small to be weighed no matter how many of them there were (I.e. blood worms) weight values
were estimated (0.001g for blood worms). Groups of amphipod organisms from each marsh
section were compiled in separate drying tins for isotopic analysis. Once dried the samples
were ground and placed in glass scintillation vials for submission for isotopic analysis. The size
of the inside of the Ekman grab unit gave surface area of sample, though volume could not be
used because the unit could not always be pushed fully into the sediment due to sediment
content. The size of the surber net box frame also gave a surface area that the sample was
taken from, but not necessarily the volume as depth of sediment was estimated.
For fish and other nekton sampling a beach seine net was used in the main marsh
channel. Preference was shown for sampling area locations greater than 100 meters from
either side of the barrier, as a mummichogs estimated maximum home range is around 200m
(Lotrich 1975). Specific distances depended on the size of the sites and how accessible they
were. First an area was located that the beach seine net could be brought up onto, and
sampling started upstream of that point so that the sampling can end there. The seine net was
placed across the channel with one person holding each end, and the bottom of the net as close
to flush with the sediment as possible. The net was walked against the current (if there was a
current), staying as close to the sides of the channel as possible, and pulling it up onto the
already observed beach like area, being careful that all organisms were landed by securing the
middle of the net. All organisms in the net were quantitatively counted, identified with a field
guide (Drociak 2005) best as possible, by picking them off of the net or funneling the sample
into a bucket of water and counting as individuals were removed. All individuals were live
released except up to approximately 20 representative organisms per species, which were

‐ 9 ‐
placed in a collection jar with water to be brought back to the lab (adapted from Foreman and
Nelson 2014). If time was limiting and the sample was small the entire sample was emptied into
the jar for counting in the lab. The volume that the net sampled from was measured using a
200m tape measure for distance walked (L), average width of the channel (W) and average
depth of the water (D). This was repeated 2‐3 times per marsh section. Samples were placed on
ice in the field.
In the lab a small fish tank net was used to filter the organisms out of the sample jar and
into a plastic bag to be frozen overnight. They were then defrosted in bags in the fridge for a
few hours, placed in a dissection tray and sorted by species, confirming the identification with a
field guide. Groups of individuals of each species were placed together into weighing tubs and
average mass was determined by dividing by the count in the lab. Four mummichogs from each
marsh section were dissected and the fillets (removing the skin, head, fins, organs, and spinal
cord) were placed into drying tins, one for natural and one for restored. Mummichogs were
chosen for isotopic analyses because they are the dominant nekton species in all of the
marshes I sampled, they are opportunistic omnivorous feeders, and occupy a level of the food
web that links primary producers and top consumers (Wozniak et al. 2006). These were allowed
to dry for 48 hours and ground with mortar and pestle for isotopic analysis.
Data analysis
Abundance was calculated as the number of individuals sampled per unit area or
volume sampled. Fish (nekton), benthic invertebrate, and zooplankton abundances were scaled
up to densities within natural and restored sections of each site to enhance comparability
across sections and across sites. To do this the GPS coordinate of the main sampling area of
each marsh section was entered into ArcGIS and buffered with a 100m radius (to account for
the 200m range of mummichogs) and the total area that is inundated all of the time (within the
channel) and total area that is inundated during high tide (low‐high marsh, from the edge of the
channel to the upland boundary) was assessed based on satellite imagery. The abundances of
organisms based on the area or volume they were sampled from was multiplied by the total
area of the channel to get a number for organisms that there could be within the channel. This
number was divided by the total area of the low‐high marsh plus the channel area to assess the
density of organisms using the full marsh area during high tide. For zooplankton an additional
estimation had to be made of total depth of water within the channel and over the low‐high
marsh area to calculate this, as their abundance was in units of cubic meters. This provides an
estimate of the organism’s density in the total habitat area that they have access to, based on
individual factors of each marsh section of each site. This was done because organisms have
access to this low marsh area as well as the channel, and this better assesses the capacity of
each section of each site to provide that for them and improves comparability. The proportion
of time inundated was assumed constant across all three marsh sites so that was not accounted
for in this calculation.

‐ 10 ‐
Biomass was calculated as the density, or average number of individuals per unit
sampled (m2 or m3), multiplied by the average wet weight per individual (g), and by the
proportion of wet to dry weight accepted for that organism (0.1 for zooplankton, 0.15 for
insects and benthic invertebrates, 0.2 for fish), and by the proportion of carbon in dry weight
(0.5) (Water 1977). The productivity to biomass ratio was calculated for each taxonomic
classification using equations described in Banse and Mosher 1980, which contain specific
values accepted for different types of organisms and incorporate the average measured wet
weight. A productivity value was obtained by multiplying the calculated biomass by this
estimated P/B ratio. Total measured secondary productivity (zooplankton + benthic
invertebrates + nekton) of each marsh type at each site was calculated for comparison across
the natural and restored sections and across the 3 sites.
Stable isotope analysis has been employed in a variety of studies to trace the flow of
organic matter, or food web support to consumers, in salt marshes (Haines 1976; Peterson et
al. 1985) and has been suggested as a possible approach for assessing ecological recovery in
tide‐restored systems (Currin et al. 2003). Isotopic samples were submitted for δ13C, δ15N, and
δ34S analysis to determine terrestrial‐aquatic habitat connectivity based on the fish’ diet by
assessing what portion is coming from which terrestrial or aquatic sources (3 terrestrial
vegetation and 1 aquatic benthic source) in each marsh section of the 2009 and 2006 sites. No
isotopic analyses were run on the 2003 site because it was sampled after the deadline for
isotopic sample submission. Carbon isotope values assist in determining the primary producer
source of the consumer’s food, such that the consumer and intermediate consumers’ isotopic
ratio will be similar to that of the primary producer itself. Nitrogen isotope values assist in
determining the trophic level of the organism, and a +3 difference is usually observed between
different levels. Sulfur isotope values also help show the source of the organism’s diet,
distinctively supplying a terrestrial signal in low (negative) values and aquatic signal in high
(positive) values (Michener and Kaufman 2007). The three isotope analyses together strengthen
the analysis of the source and flow of organic matter (Peterson et al. 1985). This data was
entered into R and SIAR (Stable Isotope Analysis for R) was used to obtain values for percentage
of fish’s diet from each source, as well as biplots showing the fish isotope values plotted with
the sources (Parnell et al. 2010).
Results Quantitatively sampling groups of organisms produced estimates of their density across
the available habitat in the natural and restored sections of each site. I will first use the biomass
calculations, which are proportional to density and productivity measurements and
calculations, to compare between natural and restored sections of each site. I will then use the
total productivity to compare across sites along the time trajectory.
The 2009 site was higher in zooplankton biomass in the natural section over the
restored section of the marsh. The zooplankton in the natural section was composed mostly of

‐ 11 ‐
Copepod and Ostracod, however the zooplankton in the restored section was primarily
Ostracod. Some Hydrachnidiae were also detected in the natural sample but not the restored
sample, and Cladocera were not found in either. This site had a much lower total zooplankton
biomass than the 2006 or 2003 sites, though it should be noted that only one zooplankton tow
sample was taken per section of this site (Figure 12). Total benthic invertebrate biomass was
also the lowest in this site as well, with the natural section containing more biomass than the
restored section. In the natural section benthic invertebrate biomass primarily came from
isopods and amphipods (Gammarus) with a small contribution from polychete worms, while
the restored section biomass came entirely from amphipods (Gammarus) (Figure 13). Nekton
biomass in this site was similar or higher than at other sites however, with a substantially higher
biomass in the restored section over the natural section. In both sections the total biomass was
primarily made up of mummichogs, with similar small contributions from all other fish found
(Figure 14). Species richness was the same between the sections but species composition was
different, with grass shrimp only found in the natural section and the nine spine stickleback
only in the restored section. Isotopic analysis showed a similar dietary composition of the
mummichogs between the natural and restored sections, with both grouped tightly to S.
alterniflora (Figures 16 and 18).
The 2006 site was measured to have a higher zooplankton biomass per cubic meter in
the natural section over the restored section as well. Total zooplankton biomass at this site was
much higher than the 2009 site. Again the natural section’s biomass consisted mostly of
Copepod and Ostracod, while the restored section consisted mostly of Ostracod (Figure 12).
Species richness was the same between sections of this site, though the natural section
contained Cladocera and the restored section contained Hydrachnidiae. Benthic invertebrate
biomass was higher in the natural over the restored section at this site as well. Total biomass in
the natural section primarily consisted of polychete worms, whereas the restored side had
more amphipods (Gammarus). Benthic invertebrate biomass at this site was much higher than
the 2009 site and only slightly higher than the 2003 site (Figure 13). Taxonomic richness was
slightly lower in the restored section, with no blood worms being found there. Insect/spider
samples were taken only at this site, as it was the first site sampled and seasonal conditions
prevented further insect/spider findings at the other sites. Insect/spider biomass was found to
be greater in the restored site along the marsh channel (sample a, S. alterniflora) with a large
contribution from other insects (flies, larvae, etc.) and similar contribution across sections from
spiders. In the middle of the low‐high marsh area (sample b, S. patens) the natural site
contained a higher biomass with a higher contribution from other insects. Total insect/spider
biomass was overall substantially higher at the upland boundary (sample c, Phragmites). Here
small brown beetles were found to make the largest contribution across both sections, though
the restored site had lower spider biomass and the natural site had greater biomass of other
species (Figure 15). Taxonomic richness was slightly lower in the restored section overall.

‐ 12 ‐
Amphipod (Gammarus) biomass collected in the insect/spider samples was ignored for the total
biomass calculations as they are not insects or spiders, but was overall higher in the restored
site with most of that biomass being found in the low‐high marsh area (sample b). In contrast
most of the amphipod biomass in the natural site was found along the marsh channel (sample
a). Very little amphipod biomass was found in the upland boundary area. Nekton biomass was
found to be slightly higher in the natural over restored section. Both sections had similar
mummichog biomass, but the natural section had a large contribution of biomass of Atlantic
silversides. Total nekton biomass was much lower at this site compared to the others (Figure
14). Taxonomic richness was slightly lower in the restored site, with Atlantic silverside, grass
shrimp, and winter flounder only found in the natural section and three and four spine
sticklebacks only found in the restored section. Isotopic analyses run on mummichogs from
both natural and restored sections showed a difference in dietary composition. In the restored
section benthic invertebrates and Phragmites each provided ~10% more of the fish’ diet than
they did in the natural section, and the fish from the natural section appeared to be feeding
from another source outside of those submitted for isotopic analyses (Figures 17 and 18).
The 2003 site was measured to have similar zooplankton biomasses across the marsh
sections, with similar Copepod‐Ostracod composition and a small contribution from
Hydrachnididae. This site had a much higher zooplankton biomass than any of the other sites
(Figure 12). No Cladocera were found in the restored section, and they only contributed a small
amount to the total zooplankton biomass of the natural section. Total benthic invertebrate
biomass at this site was much higher than at the 2009 site but similar to the 2006 site, and
similar between natural and restored sections. Most of the biomass of this site came from
amphipods (Caprellidae), with a slightly higher contribution to the restored over natural
section. Taxonomic richness was the same between sections and they both had biomass
contributions from blood worms, amphipod (Gammarus) and isopods (Figure 13). Nekton
biomass at this site was much higher in the natural over restored section. The natural section
had a slightly higher mummichog biomass and contained a much higher biomass of grass
shrimp, which contributed almost half of the total biomass in that section (Figure 14). Species
richness was slightly higher in the natural section, with the restored section not containing any
sheepshead minnows. Isotopic analyses were not run for this site.
Total measured secondary productivity (zooplankton + benthic invertebrates + nekton)
for the 2009 site was much higher in the restored compared to the natural section (proportion
of 0.3 natural section productivity/restored section productivity). In contrast, the 2006 and
2003 sites showed a much higher productivity in their natural over restored sections
(proportion 1.4 in 2006, proportion 1.3 in 2003) (Figure 19).
Discussion I will first discuss patterns seen within sites between the natural and restored sections,
and provide possible explanations observed in the field and in literature for these differences

‐ 13 ‐
and what that means for their restoration. Then I will discuss the overall patterns of
productivity observed and what this means for their restoration.
2009‐ Bass Creek
At the 2009 site, the most recently restored, I measured a greater zooplankton biomass
in the natural over restored section, with greater Copepod contribution to biomass in the
natural section. This could indicate more favorable conditions in the natural section as
zooplankton are sensitive to their environment and a change in zooplankton biomass can be
indicative of a subtle environmental change (MarineBio 2014). Such conditions could include
more food resources, differences in sedimentation (no significant differences observed in
sediment from the subtidal benthic samples taken here), water turbidity, and predator access
and predation pressure. Additionally Copepods primarily persist in the water column whereas
Ostracods are more inclined to be in the benthic area and may be more resilient than
Copepods, so they may make up a higher portion of the restored sections biomass for this
reason if it is more of a degraded system (Kulkoyluoglu 2004). Another potential explanation for
lower zooplankton biomass in the restored section lies in their reliance on communities such as
S. alterniflora as habitat and refuge from predation (Rutledge and Fleeger 1993). This is
something that the restored marsh was visibly lacking and instead the low‐high marsh area was
largely made up of woody shrubs, which the lowered water table due to ditching may not even
have been able to reach (further discussed in next paragraph). Only one zooplankton sample
was taken at this site in each the natural and restored sections due to the tidal schedule on the
sampling day, so the observed difference could easily just be sampling variability as well since
there was no repetition. Total benthic invertebrate biomass at this site was very low but higher
in the natural over restored section, consisting primarily of Gammarus amphipods and notably
lacking much worm biomass. While this could be a seasonal variation it could also result from
unfavorable sedimentation (sandy, not much organic matter or mud) or high predation
pressure. Lower benthic biomass can also be expected if there is not a lot of fringing low marsh
habitat for them.
Substantially higher nekton biomass in the restored over natural section could possibly
be explained by the appearance of greater habitat heterogeneity (ditches, woody vegetation) of
the restored section. The ditches observed at this site are known to support woody shrub
vegetative structure in the low‐high marsh area by creating well drained soils (Bourn and
Cottam 1950; Bertness and Ellison 1987). Nekton tend to respond positively to ditching as it
gives them more access to prey species (Lesser et al. 1976; Valiela et al. 1977), and the lack of
marsh ponds discourages use by the birds that prey on them (Clarke et al. 1984). The nekton
abundance difference could explain the pattern seen in zooplankton and benthic invertebrate
abundance by top down controls, by which prey populations are suppressed by high
abundances of predator species, which has been seen in high mummichog density areas before
(Valiela et al. 1977). This high nekton abundance could also reflect a lack of bird use of this
‐ 14 ‐
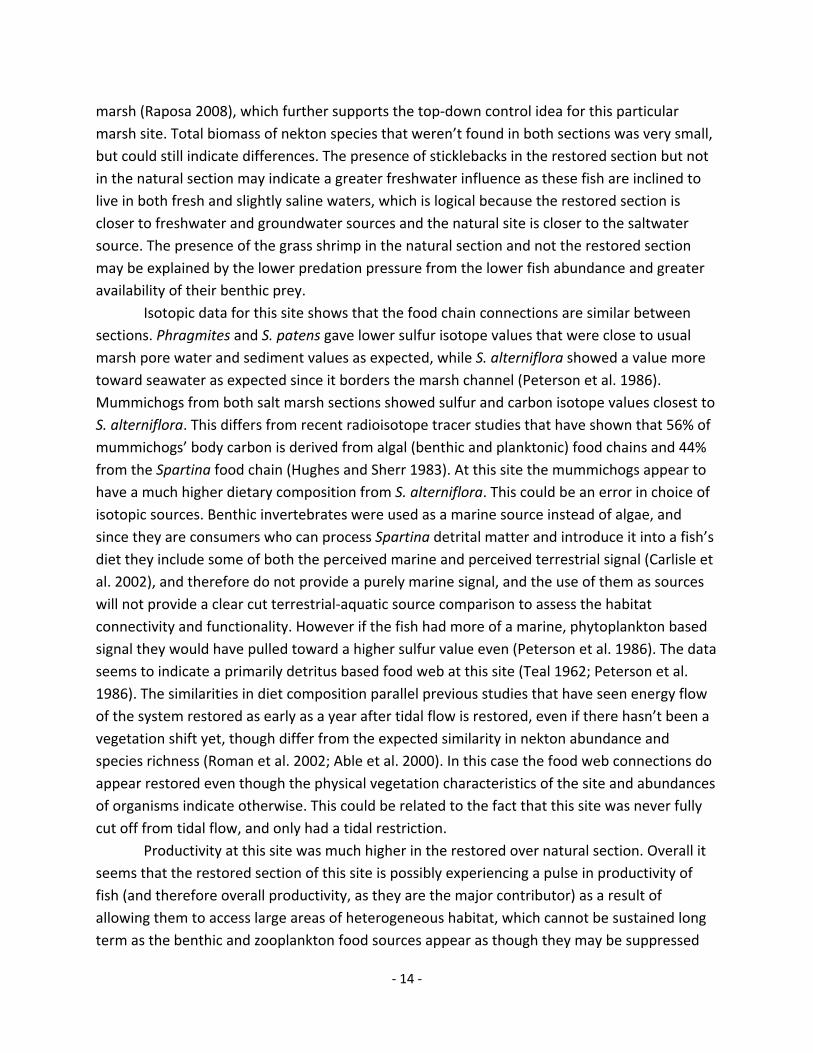
marsh (Raposa 2008), which further supports the top‐down control idea for this particular
marsh site. Total biomass of nekton species that weren’t found in both sections was very small,
but could still indicate differences. The presence of sticklebacks in the restored section but not
in the natural section may indicate a greater freshwater influence as these fish are inclined to
live in both fresh and slightly saline waters, which is logical because the restored section is
closer to freshwater and groundwater sources and the natural site is closer to the saltwater
source. The presence of the grass shrimp in the natural section and not the restored section
may be explained by the lower predation pressure from the lower fish abundance and greater
availability of their benthic prey.
Isotopic data for this site shows that the food chain connections are similar between
sections. Phragmites and S. patens gave lower sulfur isotope values that were close to usual
marsh pore water and sediment values as expected, while S. alterniflora showed a value more
toward seawater as expected since it borders the marsh channel (Peterson et al. 1986).
Mummichogs from both salt marsh sections showed sulfur and carbon isotope values closest to
S. alterniflora. This differs from recent radioisotope tracer studies that have shown that 56% of
mummichogs’ body carbon is derived from algal (benthic and planktonic) food chains and 44%
from the Spartina food chain (Hughes and Sherr 1983). At this site the mummichogs appear to
have a much higher dietary composition from S. alterniflora. This could be an error in choice of
isotopic sources. Benthic invertebrates were used as a marine source instead of algae, and
since they are consumers who can process Spartina detrital matter and introduce it into a fish’s
diet they include some of both the perceived marine and perceived terrestrial signal (Carlisle et
al. 2002), and therefore do not provide a purely marine signal, and the use of them as sources
will not provide a clear cut terrestrial‐aquatic source comparison to assess the habitat
connectivity and functionality. However if the fish had more of a marine, phytoplankton based
signal they would have pulled toward a higher sulfur value even (Peterson et al. 1986). The data
seems to indicate a primarily detritus based food web at this site (Teal 1962; Peterson et al.
1986). The similarities in diet composition parallel previous studies that have seen energy flow
of the system restored as early as a year after tidal flow is restored, even if there hasn’t been a
vegetation shift yet, though differ from the expected similarity in nekton abundance and
species richness (Roman et al. 2002; Able et al. 2000). In this case the food web connections do
appear restored even though the physical vegetation characteristics of the site and abundances
of organisms indicate otherwise. This could be related to the fact that this site was never fully
cut off from tidal flow, and only had a tidal restriction.
Productivity at this site was much higher in the restored over natural section. Overall it
seems that the restored section of this site is possibly experiencing a pulse in productivity of
fish (and therefore overall productivity, as they are the major contributor) as a result of
allowing them to access large areas of heterogeneous habitat, which cannot be sustained long
term as the benthic and zooplankton food sources appear as though they may be suppressed
‐ 15 ‐
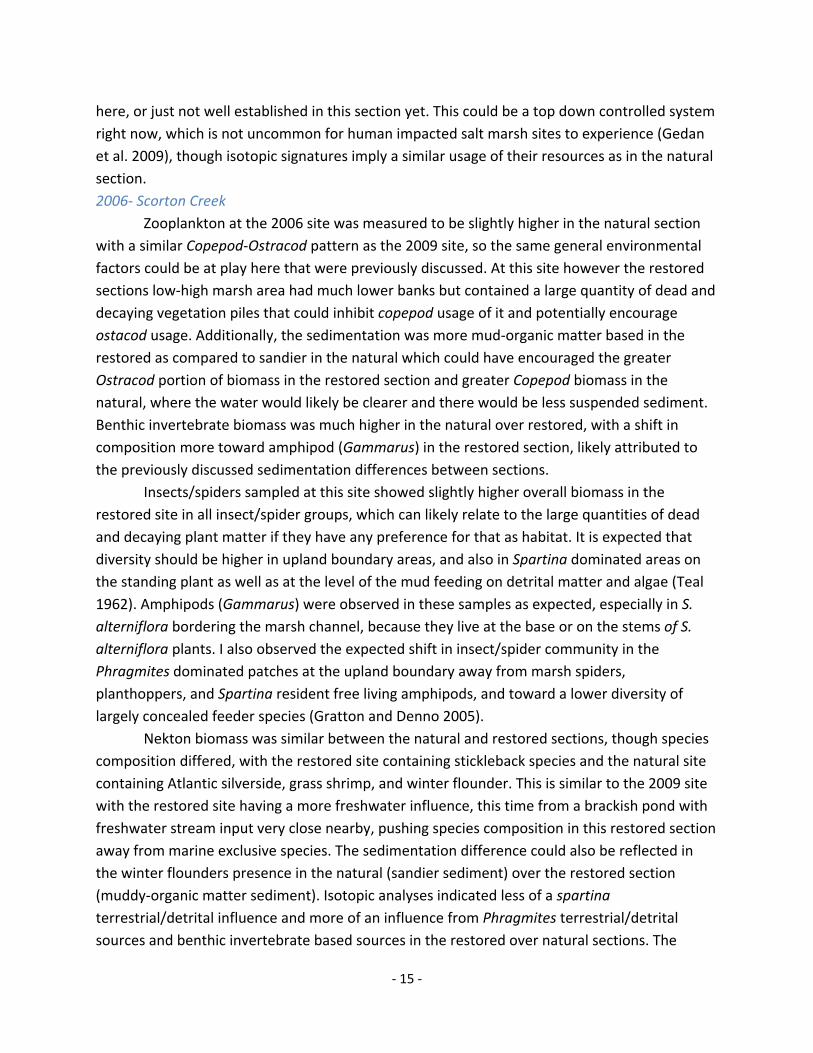
here, or just not well established in this section yet. This could be a top down controlled system
right now, which is not uncommon for human impacted salt marsh sites to experience (Gedan
et al. 2009), though isotopic signatures imply a similar usage of their resources as in the natural
section.
2006‐ Scorton Creek
Zooplankton at the 2006 site was measured to be slightly higher in the natural section
with a similar Copepod‐Ostracod pattern as the 2009 site, so the same general environmental
factors could be at play here that were previously discussed. At this site however the restored
sections low‐high marsh area had much lower banks but contained a large quantity of dead and
decaying vegetation piles that could inhibit copepod usage of it and potentially encourage
ostacod usage. Additionally, the sedimentation was more mud‐organic matter based in the
restored as compared to sandier in the natural which could have encouraged the greater
Ostracod portion of biomass in the restored section and greater Copepod biomass in the
natural, where the water would likely be clearer and there would be less suspended sediment.
Benthic invertebrate biomass was much higher in the natural over restored, with a shift in
composition more toward amphipod (Gammarus) in the restored section, likely attributed to
the previously discussed sedimentation differences between sections.
Insects/spiders sampled at this site showed slightly higher overall biomass in the
restored site in all insect/spider groups, which can likely relate to the large quantities of dead
and decaying plant matter if they have any preference for that as habitat. It is expected that
diversity should be higher in upland boundary areas, and also in Spartina dominated areas on
the standing plant as well as at the level of the mud feeding on detrital matter and algae (Teal
1962). Amphipods (Gammarus) were observed in these samples as expected, especially in S.
alterniflora bordering the marsh channel, because they live at the base or on the stems of S.
alterniflora plants. I also observed the expected shift in insect/spider community in the
Phragmites dominated patches at the upland boundary away from marsh spiders,
planthoppers, and Spartina resident free living amphipods, and toward a lower diversity of
largely concealed feeder species (Gratton and Denno 2005).
Nekton biomass was similar between the natural and restored sections, though species
composition differed, with the restored site containing stickleback species and the natural site
containing Atlantic silverside, grass shrimp, and winter flounder. This is similar to the 2009 site
with the restored site having a more freshwater influence, this time from a brackish pond with
freshwater stream input very close nearby, pushing species composition in this restored section
away from marine exclusive species. The sedimentation difference could also be reflected in
the winter flounders presence in the natural (sandier sediment) over the restored section
(muddy‐organic matter sediment). Isotopic analyses indicated less of a spartina
terrestrial/detrital influence and more of an influence from Phragmites terrestrial/detrital
sources and benthic invertebrate based sources in the restored over natural sections. The
‐ 16 ‐
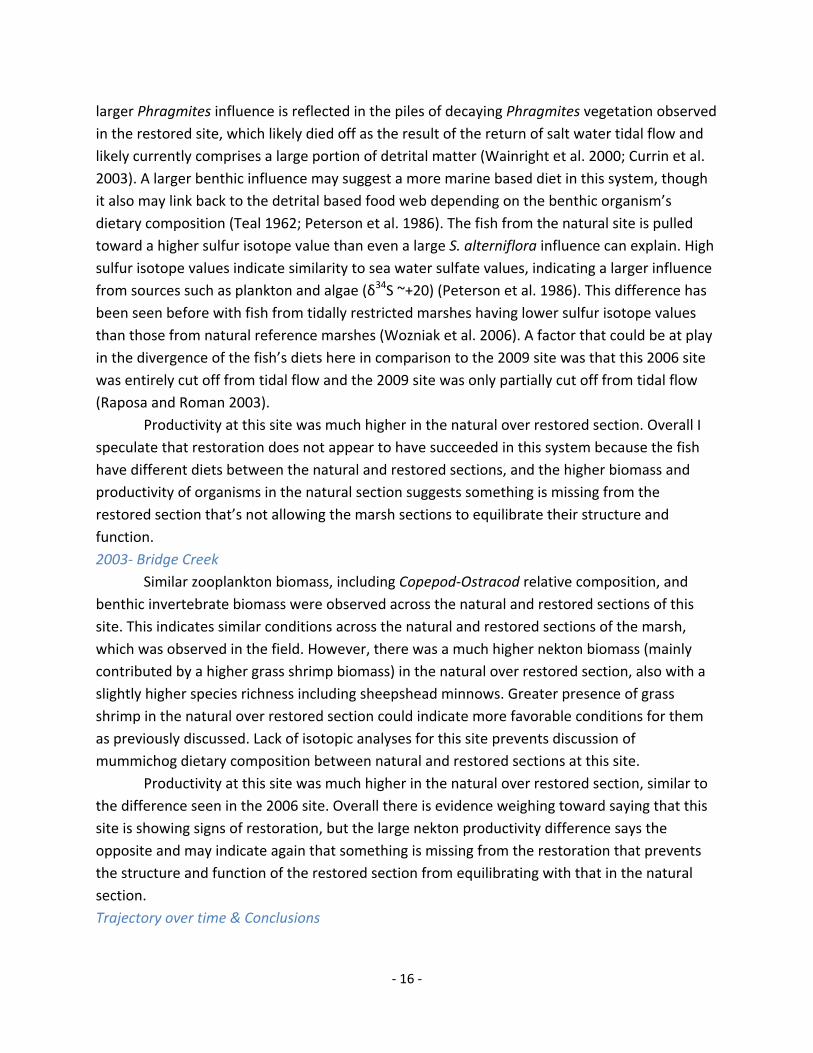
larger Phragmites influence is reflected in the piles of decaying Phragmites vegetation observed
in the restored site, which likely died off as the result of the return of salt water tidal flow and
likely currently comprises a large portion of detrital matter (Wainright et al. 2000; Currin et al.
2003). A larger benthic influence may suggest a more marine based diet in this system, though
it also may link back to the detrital based food web depending on the benthic organism’s
dietary composition (Teal 1962; Peterson et al. 1986). The fish from the natural site is pulled
toward a higher sulfur isotope value than even a large S. alterniflora influence can explain. High
sulfur isotope values indicate similarity to sea water sulfate values, indicating a larger influence
from sources such as plankton and algae (δ34S ~+20) (Peterson et al. 1986). This difference has
been seen before with fish from tidally restricted marshes having lower sulfur isotope values
than those from natural reference marshes (Wozniak et al. 2006). A factor that could be at play
in the divergence of the fish’s diets here in comparison to the 2009 site was that this 2006 site
was entirely cut off from tidal flow and the 2009 site was only partially cut off from tidal flow
(Raposa and Roman 2003).
Productivity at this site was much higher in the natural over restored section. Overall I
speculate that restoration does not appear to have succeeded in this system because the fish
have different diets between the natural and restored sections, and the higher biomass and
productivity of organisms in the natural section suggests something is missing from the
restored section that’s not allowing the marsh sections to equilibrate their structure and
function.
2003‐ Bridge Creek
Similar zooplankton biomass, including Copepod‐Ostracod relative composition, and
benthic invertebrate biomass were observed across the natural and restored sections of this
site. This indicates similar conditions across the natural and restored sections of the marsh,
which was observed in the field. However, there was a much higher nekton biomass (mainly
contributed by a higher grass shrimp biomass) in the natural over restored section, also with a
slightly higher species richness including sheepshead minnows. Greater presence of grass
shrimp in the natural over restored section could indicate more favorable conditions for them
as previously discussed. Lack of isotopic analyses for this site prevents discussion of
mummichog dietary composition between natural and restored sections at this site.
Productivity at this site was much higher in the natural over restored section, similar to
the difference seen in the 2006 site. Overall there is evidence weighing toward saying that this
site is showing signs of restoration, but the large nekton productivity difference says the
opposite and may indicate again that something is missing from the restoration that prevents
the structure and function of the restored section from equilibrating with that in the natural
section.
Trajectory over time & Conclusions
‐ 17 ‐
Ignoring the complications of individual site variations I can make an estimation of the
trajectory of restoration over time for these tidally restored sites. Initially and up to 5 years
after restoration a pulse in productivity can be seen with the fish using the same resources in
both sections (2009 site data). By 8 to 11 years after restoration (2006 and 2003 site data)
productivity then appears to be shifting back toward the natural section, and the resource use
of the mummichogs between sections does not appear equivalent which could indicate that
something is missing in the restored sections long term and additional management measures
may be required to bring it up to the level of structure and function (productivity) of the natural
section.
This pulse of productivity in the early stages of restoration is expected as marshes are
more dynamic whilst experiencing species changes throughout their heterogeneous habitats,
and apex salt marshes hold fewer species and a lower productivity over the long term. Perhaps
additional time or additional restoration intervention is required for the sections to become
similar in productivity again, such as planting of native vegetation to nudge the process along. I
predict that the 2009 site given additional time will show a decrease in productivity in the
restored site.
Literature review of restoration studies
A study compiling volunteer collected data across a large amount of restoration projects
in the Golf of Maine showed highly variable results on nekton species richness and densities
(Konisky et al. 2004). Other studies have shown that nekton abundance and species richness
rapidly increases in restored marshes and then equilibrates between marsh sections within a
year after tidal restoration (Dionne et al. 1999; Roman et al. 2002; Warren et al. 2002). While
my study was not able to shed much light on the question of terrestrial‐aquatic connectivity
and mummichog habitat use other studies have used mark‐recapture techniques to determine
that the usage is similar, by using creek channels during low tide and moving across the marsh
surface during high tide (Teo and Able 2003). A long term study of marsh restoration found
identical fish assemblages back in the restored sites after approximately 5 years, but similarities
in use of foraging areas may take up to 15 years to reach equivalence with natural reference
sites, but return rates vary based on species and between systems (Warren et al. 2002). Fish in
restored marshes, as compared to fish in natural marshes are observed to use an almost
exclusively detrital based feeding pathway as opposed to one that also includes phytoplankton
sources (Howe and Simenstad 2011). Gut content studies have shown that mummichogs caught
in restored sections may have identical diets in as little as four years after restoration, though
again this varies between systems (Warren et al. 2002).
Studies have shown benthic invertebrate recolonization rates to vary within the same
species, across species, and across systems, with some taking as little as 5 years to recolonize
after restoration, and others as long as a few decades (Warren et al. 2002). Community
response to tidal restoration in some studies appears to vary widely however, though

‐ 18 ‐
restoration tends to be less effective in the marshes that had more severe tidal restrictions
(Raposa and Roman 2003).
Several of the challenges I experienced in evaluating what these data mean for
restoration success are commonly recognized as areas that require more research for
understanding, including the lack of knowledge of how restored systems develop over time,
what species diversity means in restored salt marshes, how habitat heterogeneity affects
ecosystem function, and the potential impacts of invasive species on restoring marshes
(Callaway 2005). It is generally accepted that salt marsh restoration has to be individual to the
specific site as no two ecosystems are the same. In the future it would be useful for planning for
tidal marsh restoration to include surveys of organismal abundance prior to restoration and
after restoration for a clearer picture of causation (Herbold et al. 2014).
Additional thoughts and considerations
Salt marshes differ for reasons unrelated to disturbance, including tidal range, geology,
landscape setting, and salinity. Though a tidal restriction may be a major cause of a reduced
biological diversity and increased abundance of invasive species, other factors may be at work
as well. Comparisons of before and after restoration in addition to comparison to a reference
marsh would provide the best picture of restoration effects and success.
Sites differed greatly in their distances from the ocean, with the 2009 site being
significantly closer, which affects the amount of tidal flow they receive throughout the day and
how long the water stands on the low‐high marsh areas. There did not appear to be any
patterns observed as far as greater productivities of sites closer or farther from the ocean, so
based on this small data set I see no reason to think that is a factor affecting the restoration of
these marshes.
The type of previous restriction (dam vs. undersized culvert) and its associated
differences in tidal influence during the duration of restriction from full tidal flow more than
likely plays a role in what the area degraded to and how long it would take for it to return to
normal function once the full tidal flow was restored. Additionally, length of time the restriction
was in place also play a role, affecting how degraded the system became prior to restoration,
which would affect how much time it takes to return it to normal function.

‐ 19 ‐
Acknowledgements I would like to thank my project advisor John Schade for providing me guidance during this
project, all the way from the inspiration for the initial concept in October to the final product in
December. I would also like to thank my teaching assistant Nick Barrett for being in the field
with me every day pulling me out of the mud, helping me adapt and overcome sampling
challenges, and encouraging me to trust my own judgments by answering most of my questions
with “there is no absolutely right or wrong answer in science”, as well as for sticking around to
help through the weeks of data analysis and final presentation preparation. I additionally thank
advisor Jimmy Nelson for his assistance in the development of the concept and field methods
and analysis of the data. My thanks also go out to Amanda Spivak, Ken Foreman, Rich
McHorney, Tyler Messerschmidt, Fiona Jevon, Marshall Otter, Anne Giblin, and Ed Houlihan for
their contributions to this project. This was a very rewarding experience and I couldn’t have
done it without all of you.

‐ 20 ‐
Literature Cited
Able, K. W. and Hagan, S. M. 2000. Effects of common reed (Phragmites australis) Invasion on marsh surface macrofauna: Response of fishes and decapod crustaceans. Estuaries 23: 633‐646.
Association to Preserve Cape Cod (APCC). 2012. Shore Lines Newsletter Spring. Web. http://www.apcc.org/documents/pdfs/newsletters/spring‐2012.pdf
Banse, K. and Mosher, S. 1980. Adult body mass and annual production/biomass relationships of field populations. Ecological Monographs 50: 355‐379.
Bell, J. 2009. Memorandum: Bass Creek Post‐Restoration Tide Study. Commonwealth of Massachusetts: Division of Ecological Resources.
Bertness, M.D. and Ellison, A.M. 1987. Determinants of pattern in a New England salt marsh plant community. Ecological Monographs 57: 129‐147.
Bourn, W.S. and Cottam, C. 1950. Some biological effects of ditching tidewater marshes. US Department Fish and Wildlife Services Res. Rep. 19.
Butner, A. and Brattstrom, B.H. 1960. Local movement in Menidia and Fundulus. Copeia 2: 139‐141.
Callaway, J.C. The challenger of restoring functioning salt marsh ecosystems. Journal of Coastal Research 40: 24‐36.
Cape Cod Commission. 2001. Cape Cod Atlas of Tidally Restricted Salt Marshes. Web. http://www.capecodcommission.org/resources/coastalresources/TidalAtlas.pdf
Carlisle, B.K., Donovan, A.M., Hicks, A.L., Kooken, V.S., Smith, J.P., and Wilbur, A.R. 2002. A Volunteers Handbook for Monitoring New England Salt Marshes. Massachusetts Office of Coastal Zone Management. Web. http://www.mass.gov/eea/docs/czm/habitat/vols‐guide‐salt‐marsh‐2002.pdf
Clarke, J.A., Harrington, B.A., Hruby, T. and Wasserman, F.E. 1984. The effect of ditching for mosquito control on salt marsh use by birds in Rowley, Massachusetts. Journal of Field Ornithology 55: 160‐180.
Currin, C.A., Wainright, S.G., Able, K.W., Weinstein, M.P., and Fuller, G.M. 2003. Determination of food web support and trophic position of the mummichog, Fundulus heteroclitus, in a New Jersey smooth cordgrass (S. alterniflora), common reed (Phragmites australis), and restored salt marshes. Estuaries 26: 495‐510.
Davis, L.V. and Gray, I.E. 1966. Zonal and Seasonal Distribution of insects in North Carolina Salt Marshes. Ecological Society of America 36: 275‐295.
Dionne, M., Short, F.T., and Burdick, D.M. 1999. Fish utilization of restored, created, and reference salt marsh habitat in the Gulf of Maine. American Fisheries Society Symposium 22: 384‐404.
Drociak, J. 2005. Life in New Hampshire Salt Marshes: A Quick Reference Field Guide. New Hampshire Department of Environmental Science: Coastal Program. Web. http://des.nh.gov/organization/commissioner/pip/publications/wd/documents/wd‐04‐19.pdf
Eilefson, E. and Young, M. Benthic macroinvertebrate and sediment composition monitoring in the reconnected Nisqually Estuary. St. Martins University.
Foreman, K. and Nelson, J. 2014. Analysis of secondary productivity and trophic structure. Lab handout: printed 09/17/14.
Gedan, K.B., Silliman, B.R., and Bertness, M.D. 2009. Centuries of human driven change in salt marsh ecosystems. Annual Review Marine Science 1: 117‐141.
Gratton, C. and Denno, R.F. 2005. Restoration of arthropod assemblages in a Spartina salt marsh following the removal of the invasive plant Phragmites australis. Restoration Ecology 13: 358‐372.

‐ 21 ‐
GOM. 2014. Golf of Maine: Habitat Restoration Program. Web. Accessed Dec. 2014 http://www.gulfofmaine.org/2/habitat‐restoration‐program‐homepage/overview/
Haines, E.B. 1976. Stable carbon isotope ratios in the biota, soils, and tidal water of a Georgia salt marsh. Estuarine and Coastal Marine Science 4: 609‐616.
Herbold, B., Baltz, D.M., Brown, L., Grossinger, R., Kinnerer, W., Lehman, P., Moyle, P.B., Nobriga, M. and Simenstad, S.A. 2014. The role of tidal marsh restoration in fish management in the San Francisco Estuary. San Francisco Estuary and Watershed Science 12.
Horsley Witten Group. 2010. Scorton Creek Salt Marsh Restoration Project. Horsleywitten.com
Horsley Witten Group. 2011. Hydrodynamic Evaluation and Design of Tidal Flushing Improvements for Replacement Channel Opening: Timber‐Span Bridge, Yarmouth, Massachusetts. Web. http://www.horsleywitten.com/wordpress/wp‐content/uploads/2011/07/5025‐bass‐creek.pdf
Howe, E.R. and Simenstad, C.A. 2011. Isotopic determination of food web origins in restoring and ancient estuarine wetlands of the San Francisco Bay and Delta. Estuaries and Coasts 34: 597‐617.
Hughes, E.H. and Sherr, E.B. 1983. Subtidal food webs in a Georgia estuary: δ13C analysis. Journal of Experimental Marine Biology and Ecology: 67: 227‐242.
Kelly, J.R. and Harwell, M.A. 1990. Indicators of ecosystem recovery. Environmental Management 14: 527‐545.
Kneib, R. T. and Stiven, A. E. 1987. Growth, reproduction, and feeding of Fundulus Heteroclitus on a North Carolina Salt Marsh. Biological Ecology 31: 121‐140.
Koninsky, R.A., Burdick, D.M., Dionne, M., and Neckles, H.A. 2004. A regional assessment of salt marsh restoration and monitoring in the Golf of Maine. Web. http://www.rargom.org/sites/rargom.gmri.org/files/documents/themes/2004/Theme%20Session%2004%20‐3%20Regional%20Assessment%20of%20Saltmarsh.pdf
Kulkoyluoglu, O. 2004. On the usage of ostracods (Crustacea) as bioindicator species in different aquatic habitats in the Bolu region, Turkey. Ecological Indicators 4: 139‐147.
Lesser, C.R., Murphy, F.J., and Lake, R.W. 1976. Some effects of grid mosquito control ditching on salt marsh biota in Delaware. Mosquito News 36: 6977.
Lotrich, V.A. Summer home range and movements of Fundulus heteroclitus in a tidal creek. Ecology 56: 191‐198.
MarineBio. 2014. Zooplankton. MarineBio Conservation Society Web. Accessed Nov. 2014. http://marinebio.org/oceans/zooplankton
Massachusetts Corporate Wetlands Restoration Partnership (MCWRP). 2000. Project Summary: Bridge Creek. Massachusetts Executive Office of Environmental Affairs.
Massachusetts Corporate Wetlands Restoration Partnership (MCWRP). 2002. Project Recommendation: Bass Creek. Massachusetts Executive Office of Environmental Affairs.
Massachusetts Corporate Wetlands Restoration Partnership (MCWRP). 2002. Project Recommendation: State Game Farm. Massachusetts Executive Office of Environmental Affairs.
Michener, R.H. and Kaufman, L. 2007. Stable isotope ratios as tracers in marine food webs: an update. Stable isotopes in ecology and environmental science: CH 9.
Nixon, S.W. and Oviatt, C.A. 1973. Ecology of a New England Salt Marsh. Ecological Monographs 43: 463‐498.
Ouellette, Jen. “In the flow.” Wicked Local. 2008, June 05. Accessed 12/1/2014: http://www.wickedlocal.com/article/20080605/NEWS/306059280

‐ 22 ‐
Palmer, M.A., Ambrose, R.F., and LeRoy Poff, N. 1997. Ecological Theory and Community Restoration Ecology. Restoration Ecology 5: 291‐300.
Parnell, A.C., Inger R., Bearhop, S. & Jackson, A.L. 2010. Source partitioning using stable isotopes: coping with too much variation. PLoS ONE, 5(3), e9672.
Peterson, B.J., Howarth, R.W., and Garritt, R.H. 1985. Multiple stable isotopes used to trace the flow of organic matter in estuarine food webs. Science 227: 1361‐1363.
Peterson, B.J., Howarth, R.W., and Garritt, R.H. 1986. Sulfur and Carbon isotopes as tracers of salt‐marsh organic matter flow. Ecology 67: 865‐874.
Raposa, K.B. and Roman, C.T. 2003. Using gradients in tidal restriction to evaluate nekton community responses to salt marsh restoration. Estuaries 26: 98‐105.
Raposa, K.B. 2008. Early ecological responses to hydrologic restoration of a tidal pond and salt marsh complex in Narragansett Bay, Rhode Island. Journal of Coastal Research 55: 180‐192.
Rollins College. 2014. Profile of a salt marsh. Web. Accessed Dec. 2014. http://myweb.rollins.edu/jsiry/Profile_of_Salt_Marsh.gif
Roman, C.T., Niering, W.A., and Warren, R.S. 1984. Salt marsh vegetation change in response to tidal restriction. . Environmental Management 8: 141‐150.
Roman, C.T., Raposa, K.B., Adamowicz, S.C., James‐Perri, J., and Catena, J.G. 2002. Quantifying vegetation and nekton response to tidal restoration of a New England salt marsh. Restoration Ecology 10: 450‐460.
Rutledge, P.A. and Fleeger, J.W. 1993. Abundance and seasonality of meiofauna, including harpacticoid copepods species, associated with stems of the salt marsh cord grass, Spartina alterniflora. Estuaries 16: 760‐768.
SER. 2004. SER International Primer on Ecological Restoration. Society for Ecological Restoration, Science & Policy Working Group. Web. Accessed Nov. 2014. http://www.ser.org/resources/resources‐detail‐view/ser‐international‐primer‐on‐ecological‐restoration
Shuhaimi‐Othman, M., Yakub, N., Ramle, N., and Abas, A. 2011 Toxicity of metals to a freshwater Ostracod: Stenocypris major. Journal of Toxicity.
Taylor, M.H. 1986. Environmental and endocrine influences on reproduction of Fundulus heteroclitus. American Zoology 26: 159‐171.
Teal, J.M. 1962. Energy Flow in the Salt Marsh Ecosystem of Georgia. Ecological Society of America 43: 614‐624.
Teo, S.L.H. and Able, K.W. 2003. Habitat use and movement of the mummichog (Fundulus heteroclitus) in a restored salt marsh. Estuaries 26: 720‐730.
Thornton W. Burgess Society. 2014. East Sandwich Game Farm. Web. thorntonburgess.org/EastSandwichGameFarm.htm
URI and USGS. 2002. Field Methods Manual: US Fish and Wildlife Service (Region 5) salt marsh study. http://www.gso.uri.edu/mjjp/Field%20Manual%20for%20Monitoring%20Protocols.pdf
Valiela, I., Wright, J.E., Volkmann, S.B., and Teal, J.M. 1977. Growth, production, and energy transformations in the salt marsh killifish Fundulus heteroclitus. Marine Biology 40: 135‐144.
Wainright, S.C., Weinstein M.P., Able K.W., and Currin C.A. 2000. Relative importance of benthic microalgae, phytoplankton and the detritus of smooth cordgrass (Spartina) and the common reed (Phragmites) to brackish marsh food webs. Marine Ecology Progress Series 200: 77–91.

‐ 23 ‐
Warren, R.S., Fell, P.E., Rozsa, R., Brawley, A.H., Orsted, A.C., Olson, E.T., Swamy, V. and Niering, W.A. 2002. Salt Marsh Restoration in Connecticut: 20 years of science and management. Restoration Ecology 10: 497‐513.
Waters, T.F. 1977. Secondary production in inland waters. Advanced Ecological Research 10: 91‐164.
Weinstein, M.P., Litvin, S.Y., Bosley, K.L., Fuller, C.M., and Wainright, S.C. 2000. The role of tidal salt marsh as an energy source for marine transient and resident finfishes: a stable isotope approach. Transactions of the American Fisheries Society 129: 797‐810.
Weisberg, S.B. and Lotrich, V.A. 1982. The importance of an infrequently flooded intertidal marsh surface as an energy source for the mummichog Fundulus heteroclitus: An experimental approach. Marine Biology 66: 307‐310.
Wozniak, A.S., Roman, C.T., Wainright, S.C., McKinney, R.A., and James‐Perri, M. 2006. Monitoring food web changes in tide‐restored salt marshes: a carbon stable isotope approach. Estuaris and Coasts 29: 568‐578.

Figures
Figure 1.
Aquat
s & Table
Inundation
ic
s
gradient an
d habitat str
‐ 24 ‐
ructure of saalt marshes (Rollins Coll
Terre
ege 2014).
estrial

‐ 25 ‐
Figure 2. Generalized food web trophic structure of salt marsh ecosystem.
Birds and Mammals
Fish
Zooplankton
Insects/Spiders
Intertidal benthic
invertebrates
Subtidal benthic
invertebrates
Marsh
plants
Phytoplankton
Benthic Algae

‐ 26 ‐
Figure 3. (A) Salt marsh with little to no tidal flow. The fish are restricted to channels and ponds
with little to no access to terrestrial insects/spiders and intertidal benthic invertebrates residing
in the low‐high marsh area. (B) Natural (and potentially restored) salt marsh with functionality
of aquatic‐terrestrial ecosystem linkage established through tidal flow. Here the fish are able to
access the vegetation communities during high tide and obtain insect/spider and intertidal
benthic invertebrate prey.
(A) (B)

Figure 4.
ecosyste
The SER Int
m (SER 2004
ternational P
4).
Primer on Ec
‐ 27 ‐
cological Resstoration staandards for aa restored

Figure 5.
Map of sitee locations o
n the northe
‐ 28 ‐
ern side of CCape Cod, MA.

Figure 6.
sections
Figure 7.
Yarmout
2009 site‐ B
identified, a
Before and
h, MA (Hors
Nat
Bass Creek in
as well as ba
after photo
sley Witten G
ural
n Yarmouth,
rrier location
os of tidal res
Group 2011,
Prev
‐ 29 ‐
MA satellite
ns.
storation pro
APPC 2012)
vious barrier
e imagery w
oject at 2009
).
Res
with natural a
9 site, Bass C
stored
and restored
Creek in
d
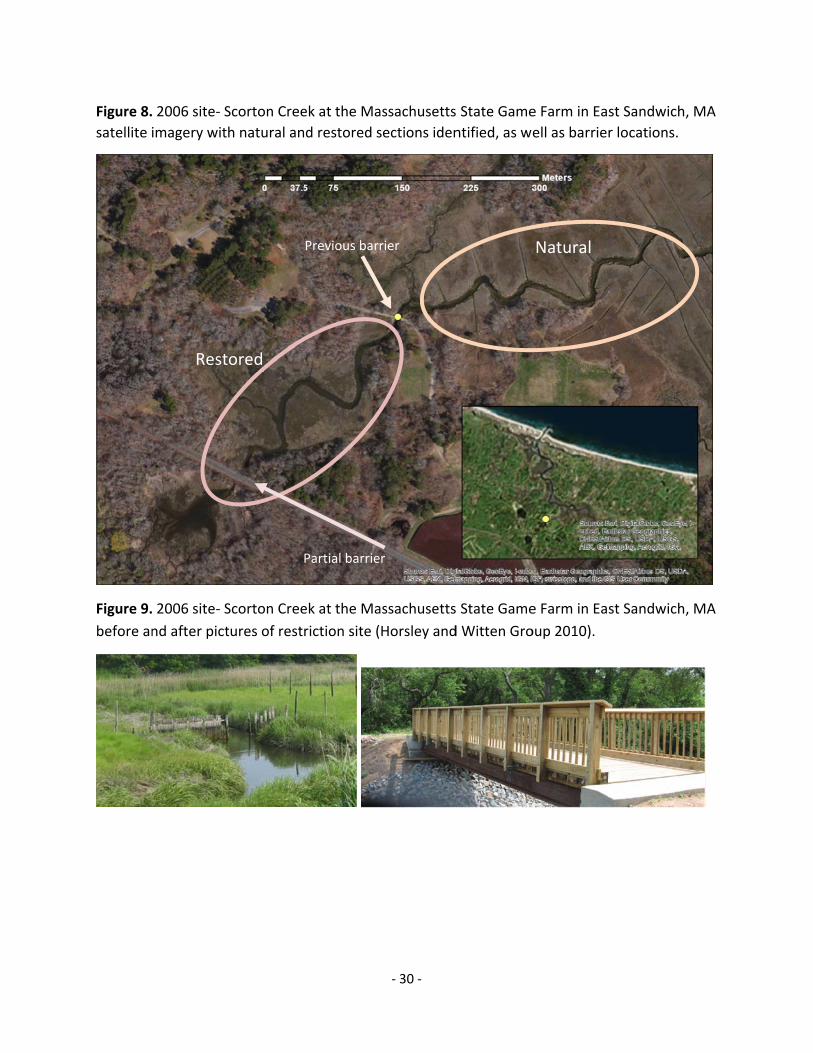
Figure 8.
satellite i
Figure 9.
before an
2006 site‐ S
imagery wit
2006 site‐ S
nd after pict
Rest
Scorton Cree
h natural an
Scorton Cree
tures of rest
ored
ek at the Ma
d restored s
ek at the Ma
riction site (
Previous barr
Partial barrie
‐ 30 ‐
assachusetts
sections iden
assachusetts
Horsley and
rier
r
State Game
ntified, as w
State Game
d Witten Gro
e Farm in Ea
ell as barrie
e Farm in Ea
oup 2010).
Natural
st Sandwich
r locations.
st Sandwich
, MA
, MA

Figure 10
sections
Figure 11
Barnstab
0. 2003 site‐
identified, a
1. Before an
ble, MA insta
Bridge Cree
as well as ba
d after phot
alled in 2003
P
ek in Barnsta
rrier location
tos of tidal re
3 (GOM 2014
Rest
Previous barr
‐ 31 ‐
able, MA sat
ns.
estoration p
4).
tored
rier
tellite image
project at 200
ry with natu
03 site, Brid
ural and rest
ge Creek in
Natural
ored
‐ 32 ‐
Figure 12. Zooplankton biomass for each the natural (N) and restored (R) sections of each site.
0
0.5
1
1.5
2
2.5
3
3.5
4
4.5
5
N R N R N R
dry m
g C/m
3
2009 2006 2003
Zooplankton biomass
Copepod Cladocera Ostracod Hydrachnidiae

‐ 33 ‐
Figure 13. Benthic invertebrate biomass for each the natural (N) and restored (R) sections of
each site.
0
10
20
30
40
50
60
N R N R N R
dry m
g C/m
2
2009 2006 2003
Benthic invertebrate biomass
Polychete worm Blood worms Amphipod (Gammarus)
Isopod Amphipod (Caprellidae)

‐ 34 ‐
Figure 14. Nekton (fish, shrimp) biomass for each the natural (N) and restored (R) sections of
each site.
0
0.02
0.04
0.06
0.08
0.1
0.12
0.14
0.16
0.18
0.2
N R N R N R
dry g C/m
2
2009 2006 2003
Nekton biomass
Mummichog Striped killifish Atlantic silverside
Four spined stickleback Three spined stickleback Ninespine stickleback
Sheepshead minnow Winter flounder Sand shrimp
Grass shrimp

‐ 35 ‐
Figure 15. Insect/spider biomass for each the natural (N) and restored (R) sections of 2006 site
along the sample a (S. alterniflora), b (S. patens), and c (Phragmites) vegetation types.
0
1
2
3
4
5
6
7
8
Na Ra Nb Rb Nc Rc
dry m
g C/m
2
2009 2006 2003
Insect biomass
Spider (Pardosa) Small brown beetle (Corylophidae) Other

‐ 36 ‐
Figure 16. Biplot of sulfur and carbon isotope data for 2009 site.
N Fish
R Fish
Benthic
S. alternifloraS. patens
Phragmites
‐30
‐25
‐20
‐15
‐10
‐5
0
‐10 ‐5 0 5 10
δ13C
δ34S

‐ 37 ‐
Figure 17. Biplot of sulfur and carbon isotope data for 2006 site.
N Fish
R Fish
Benthic
S. alterniflora
S. patens
Phragmites
‐30
‐25
‐20
‐15
‐10
‐5
0
‐10 ‐5 0 5 10 15
δ13C
δ34S

‐ 38 ‐
Figure 18. Proportion of fish (one set from natural and one set from restored of each site) diet
that comes from each source (terrestrial plants, benthic invertebrates) as determined by C, N,
and S isotope data for 2009 and 2006 sites.
0
0.1
0.2
0.3
0.4
0.5
0.6
0.7
0.8
0.9
1
N R N R
Proportion of diet
2009 2006
Phragmites
S. patens
S. alterniflora
Benthic

‐ 39 ‐
Figure 19. Total measured secondary productivity (zooplankton + benthic invertebrate + fish
productivity) for each the natural (N) and restored (R) section of each site.
0.00
0.10
0.20
0.30
0.40
0.50
0.60
0.70
0.80
0.90
N R N R N R
dry g C/m
2yr
2009 2006 2003
Total Productivity
Fish Zooplankton Benthic