Embed Size (px)
Citation preview

Salt Marsh Carbon Sequestration: a Baseline Study. City of Arcata, California
Prepared by Reid Whittlesey, Matt Brush and Shayne Holler
ENVS 410: Environmental Science Capstone/Practicum December 16th, 2013

Salt Marsh Carbon Sequestration: a Baseline Study. City of Arcata, California
Prepared by Reid Whittlesey, Matt Brush and Shayne Holler
Abstract
Coastal wetlands, including salt marshes, have the potential to sequester vast amounts of carbon and store it over decennial and multi-millennial timescales. Unlike terrestrial ecosystems, salt marshes do not become carbon saturated over time as they subside under their own weight, increasing bulk density and allowing for continued accretion through sedimentation and biomass production. Salt marshes along San Francisco Bay have been recorded to keep pace with sea level rise, suggesting these ecosystems have the potential to function as negative feedback mechanisms in climate change mitigation. Our project began an investigation into the ability of the salt marshes of Humboldt Bay to sequester and store carbon. This was done through determining soil organic carbon (SOC) content and extrapolating sequestration rates from proxy studies. We measured total area, SOC, and potential carbon storage in metric tons of the salt marshes within the jurisdiction of the City of Arcata. We found ~481 acres of salt marsh to currently exists. Through GIS analysis of 1870 maps we determined ~1418 acres of salt marsh at that time, the loss occurring due to diking and land conversion for agricultural purposes. Through calculations using data from our sampling as well as other studies of salt marshes along the west coast, we project that salt marshes within the City of Arcata currently sequester about 396 metric tons (mT) of carbon per year. If the lands which were historically salt marsh were to be restored, around 1169 mT would be sequestered annually. We also measured SOC of an agriculture field which was salt marsh prior to conversion, as well as the amount of subsidence which has occurred due to conversion..
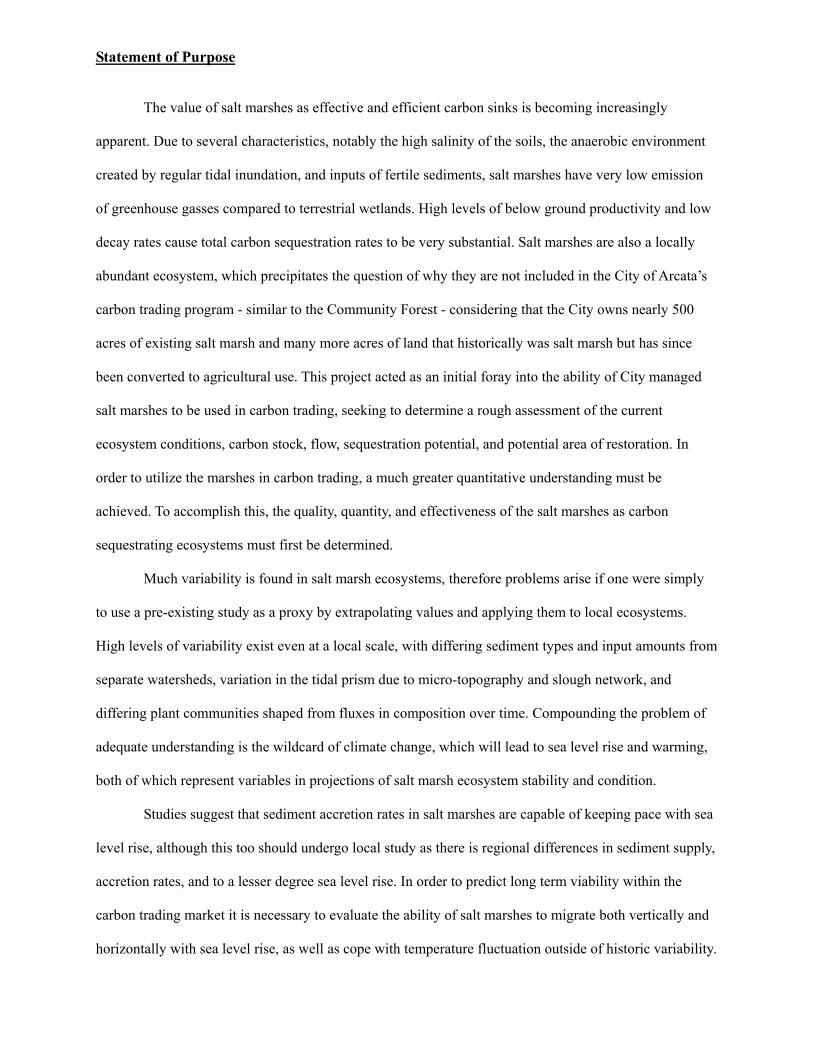
Statement of Purpose
The value of salt marshes as effective and efficient carbon sinks is becoming increasingly
apparent. Due to several characteristics, notably the high salinity of the soils, the anaerobic environment
created by regular tidal inundation, and inputs of fertile sediments, salt marshes have very low emission
of greenhouse gasses compared to terrestrial wetlands. High levels of below ground productivity and low
decay rates cause total carbon sequestration rates to be very substantial. Salt marshes are also a locally
abundant ecosystem, which precipitates the question of why they are not included in the City of Arcata’s
carbon trading program - similar to the Community Forest - considering that the City owns nearly 500
acres of existing salt marsh and many more acres of land that historically was salt marsh but has since
been converted to agricultural use. This project acted as an initial foray into the ability of City managed
salt marshes to be used in carbon trading, seeking to determine a rough assessment of the current
ecosystem conditions, carbon stock, flow, sequestration potential, and potential area of restoration. In
order to utilize the marshes in carbon trading, a much greater quantitative understanding must be
achieved. To accomplish this, the quality, quantity, and effectiveness of the salt marshes as carbon
sequestrating ecosystems must first be determined.
Much variability is found in salt marsh ecosystems, therefore problems arise if one were simply
to use a pre-existing study as a proxy by extrapolating values and applying them to local ecosystems.
High levels of variability exist even at a local scale, with differing sediment types and input amounts from
separate watersheds, variation in the tidal prism due to micro-topography and slough network, and
differing plant communities shaped from fluxes in composition over time. Compounding the problem of
adequate understanding is the wildcard of climate change, which will lead to sea level rise and warming,
both of which represent variables in projections of salt marsh ecosystem stability and condition.
Studies suggest that sediment accretion rates in salt marshes are capable of keeping pace with sea
level rise, although this too should undergo local study as there is regional differences in sediment supply,
accretion rates, and to a lesser degree sea level rise. In order to predict long term viability within the
carbon trading market it is necessary to evaluate the ability of salt marshes to migrate both vertically and
horizontally with sea level rise, as well as cope with temperature fluctuation outside of historic variability.

Once a thorough quantitative understanding of the processes and mechanisms involved in greenhouse gas
exchange by salt marshes is established the worth within the carbon trading market may be determined.
The purpose of our project was to take initial steps in understanding the efficiency and value of
the City of Arcata’s salt marsh in relation to climate change mitigation. Our primary intentions were to
identify the major ecological processes of salt marshes which influence carbon cycling and storage,
determine a rough estimate of the carbon flow and stock held within City managed salt marshes, calculate
the potential area available for restoration based upon the historic extent of the marshes, and finally to
apply a carbon-loss value to conversion of salt marshes to agricultural land. Through research and
implementation of a rudimentary study we were able to make significant headway towards accomplishing
our intended goals.
Introduction
Salt marshes and other coastal wetlands are highly productive ecosystems with high primary
productivity, biotic activity, and low decomposition rates associated with the tidally influenced saline
environment (Chmura et al 2003, Broome and Craft 2000). Characterized by predictable periodic tidal
inundation, salt marshes are found in protected, low-energy coastal areas such as bays, estuaries, lagoons
and river mouths. If freshwater inflow is substantial, marshes can be found along a gradient of saline to
freshwater. As salinity decreases along the gradient methane emission increases, diminishing the
efficiency and value of the system as a climate change mitigating mechanism (Broome and Craft, 2000).
The importance of this gradient should not be underestimated, as methane is more than 20 times as potent
of a greenhouse gas as carbon dioxide (Forester et al 2007).
Vegetation of salt marshes is characterized by halophytes and saline tolerant species, with
emergent vascular plant communities composed mostly of species from the families Poaceae, Juncaceae,
and Cyperaceae. Locally dominant species include Distichlis spicata, Salicornia virginica, Spartina
densiflora, and Triglochin maritima. Other non-dominant species include Atriplex patula, Limonium
californicum, Grindelia stricta, Deschampsia caespitosa. Two rare ESA listed species include Humboldt
Bay Owl’s clover, Castilleja ambigua ssp. humboltiensis, and Point Reyes bird’s beak, Cordylanthus

maritimus ssp. palustris. Although the species are low in stature, high primary production rates occur,
with between 2-4 kg dry matter/ m2/yr produced on average. Low decomposition rates cause much of the
living organic matter to be retained as soil organic carbon after senescence.
The 2007 climate change assessment report prepared by the Intergovernmental Panel on Climate
Change stated that in order to limit global temperature rise to 2ºC it is necessary to reduce atmospheric
concentrations of carbon dioxide to 85% of 2000 levels. Original strategies for the reduction of
atmospheric carbon dioxide concentration focused on decreasing emissions, although more recently
developed strategies suggest a two-pronged approach, still including emission reduction but heightening
the role of sequestration. Luckily for the conservation-minded, preserving, restoring, and managing
natural ecosystems which have a high capacity for sequestering carbon is one of the most effective means
of mitigation.
While every ecosystem sequesters some amount of carbon, the amount, temporal span, and
emissions of other greenhouse gases vary greatly. Aerobic ecosystems with high productivity also often
have high rates of decay, causing the carbon that is sequestered by growth to be re-emitted within several
decades to hundreds of years through natural functioning of detritivores and saprophytes. Anaerobic
ecosystems differ by exhibiting higher soil organic carbon levels achieved through suppressed
decomposition. Sediments rich in organic matter (such as those regularly deposited by tides in salt
marshes) which become buried through accretion may store carbon for thousands of years (Duarte et al.
2005).
The preservation of carbon in coastal wetland soils results from regular tidal flooding and the
maintenance of saturated soils in which low oxygen availability ensures low decay rates and therefore
little release of carbon dioxide. These coastal systems do not become saturated with carbon as do
terrestrial ecosystems. Coastal systems such as salt marshes continue to accrete vertically in elevation,
adding sediment and burying biomass. The ability to accrete also allows these systems to keep pace with
climate change associated sea level rise as well as recover from subsidence associated with land
conversion (McLeod et al 2011). As salt marshes accrete they subside under their own weight, squeezing
out water, increasing density, and allowing for further surface level accretion and carbon burial (Crooks et

al 2011). Sediment accretion rates are closely related to carbon storage, with greater rates of sediment
accumulation garnering higher rates of carbon capture (Chmura et al. 2003, Mcleod et al. 2011). Many
variables influence both the rate of carbon capture as well as the amount of captured carbon lost through
decomposition, including accretion rates, salinity, composition and water content of soils, and available
nutrients (Brevik et al. 2004, Chmura et al. 2003, Crooks et al. 2011, Li et al. 2010).
High water content, salinity, and anaerobic conditions of the soil greatly represses microbial
decomposition, greatly heightening the ability of salt marshes to hold the organic carbon sequestered
during the photosynthesis process through decreased decay rates (Li et al. 2010). Sediment accumulation
caused by soil particles settling out of the water column during the tidal transition – when water velocity
drops near zero – allow for upward plant growth and continued burial of dead organic matter. These
processes not only allows for long-term carbon storage, but also allows salt marshes to keep pace with sea
level rise (Brevik et al. 2004, Callaway et al. 2012).
While sediment accumulation rates are one of the most important factors in determining the
amount of carbon capture and storage of a salt marsh, it is invariably linked to site specific conditions and
associated processes that influence plant growth and SOC decomposition. Adding to the complexity is
that salt marshes are each a continuous gradient of elevation, salinity, inundation regime, and water
chemistry. Varying nutrient loads showed somewhat counter-intuitive effects on carbon capture, with
higher nitrogen lessening the amount of carbon stored possibly due the plants not needing to produce as
deep of a root system (Mcleod et al. 2011). Even within the same estuary much variation in SOC was
found, although it was always high in comparison to terrestrial wetland systems, especially considering
the low greenhouse gas outputs of salt marshes (Callaway et al. 2013)
Compared to terrestrial wetlands salt marshes produce vastly less methane. One study by Bartlett
et al. (1987) recorded 5.7g CH4 m-2yr-1 at 18.1 parts per thousand (ppt) soil salinity versus 213g CH4 m-
2yr-1 at 0.4 ppt soil salinity. The high salinity inhibits methane producing microbial communities, as well
as lessening decomposition rates (Brevik et al. 2004, Bartlett et al. 2004). Corresponding with the low
rates of decomposition is a long period of holding. Carbon rich soil cores over 10m long have been
extracted from some salt marshes, representing carbon sequestered over 6000 years ago (Mcleod et al.
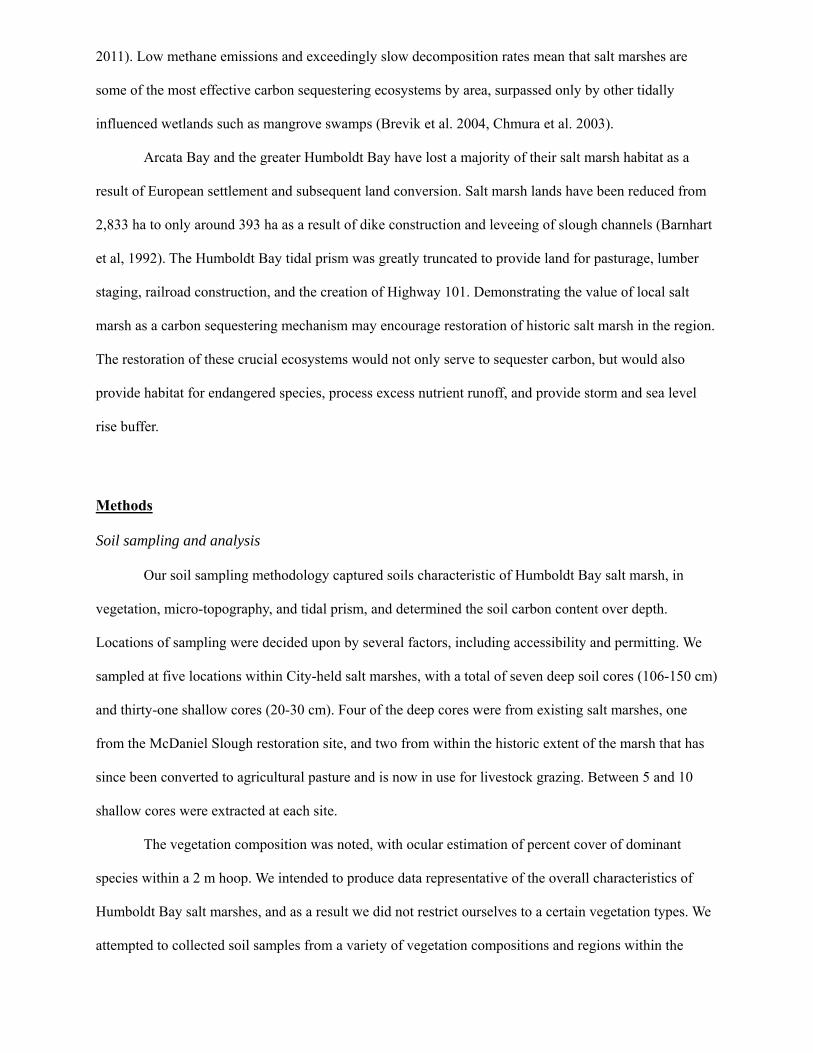
2011). Low methane emissions and exceedingly slow decomposition rates mean that salt marshes are
some of the most effective carbon sequestering ecosystems by area, surpassed only by other tidally
influenced wetlands such as mangrove swamps (Brevik et al. 2004, Chmura et al. 2003).
Arcata Bay and the greater Humboldt Bay have lost a majority of their salt marsh habitat as a
result of European settlement and subsequent land conversion. Salt marsh lands have been reduced from
2,833 ha to only around 393 ha as a result of dike construction and leveeing of slough channels (Barnhart
et al, 1992). The Humboldt Bay tidal prism was greatly truncated to provide land for pasturage, lumber
staging, railroad construction, and the creation of Highway 101. Demonstrating the value of local salt
marsh as a carbon sequestering mechanism may encourage restoration of historic salt marsh in the region.
The restoration of these crucial ecosystems would not only serve to sequester carbon, but would also
provide habitat for endangered species, process excess nutrient runoff, and provide storm and sea level
rise buffer.
Methods
Soil sampling and analysis
Our soil sampling methodology captured soils characteristic of Humboldt Bay salt marsh, in
vegetation, micro-topography, and tidal prism, and determined the soil carbon content over depth.
Locations of sampling were decided upon by several factors, including accessibility and permitting. We
sampled at five locations within City-held salt marshes, with a total of seven deep soil cores (106-150 cm)
and thirty-one shallow cores (20-30 cm). Four of the deep cores were from existing salt marshes, one
from the McDaniel Slough restoration site, and two from within the historic extent of the marsh that has
since been converted to agricultural pasture and is now in use for livestock grazing. Between 5 and 10
shallow cores were extracted at each site.
The vegetation composition was noted, with ocular estimation of percent cover of dominant
species within a 2 m hoop. We intended to produce data representative of the overall characteristics of
Humboldt Bay salt marshes, and as a result we did not restrict ourselves to a certain vegetation types. We
attempted to collected soil samples from a variety of vegetation compositions and regions within the

Cities' salt marsh holdings to achieve a wide diversity of samples. Samples were collected in five plant
community types, with transects in pasture, predominantly native vegetation, mixed native and S.
densiflora, and S. densiflora dominated communities, and one within the McDaniel Slough restored area
(figure 1). The vegetation within McDaniel slough was undergoing a rapid change from pastureland to
salt marsh vegetation due to the reintroduction of the tidal prism, with many of the existing species dying
back because of the brackish waters.
Samples were extracted along a 100 m linear transects oriented across an elevation gradient from
the bay towards the upland. A deep core (usually 150 cm depending on soil characteristics) was extracted
at either end of the transect. The site of extraction was chosen to avoid anomalous areas such as
depressions, mounds, or pools. Shallow cores were extracted within a 10 m swath on either side of the
transect down the length, at more or less random intervals, and were subject to the same anomaly
avoidance procedure as the deep cores. Samples were bagged, labeled appropriately (in sequence of
extraction if part of a deep core), and brought to the Natural Resources soils lab on campus for
processing.
Due to the sheer volume of the material extracted by the corer, it was infeasible to dry, weigh, and
heat to loss on ignition (LOI) all of the material drawn up by the corer. Therefore a smaller, representative
sample was taken of each original extracted sample. This sub-sample, while decreasing resolution,
allowed for feasibility in processing. Having intact cores was extremely rare due to the composition of the
soils, therefore identifying horizons and sampling within them was not possible. The sub-samples used for
analysis were taken from the approximate center of the core – if the core had maintained a relative shape
– or by selection of representative textures. The sub-samples were roughly a handful in size.
In the lab samples were oven dried in tins at 60 degrees C for four days to insure adequate
moisture loss. The samples were not ground to a uniform texture before placing in crucibles as is common
in LOI procedures. After drying 5-10 gram samples were transferred to pre-weighed crucibles, weighed
and recorded to hundredths of a gram, then placed in a muffle furnace to be heated to 700 degrees C to
produce carbon loss on ignition. They were kept at this temperature for 24 hours to produce adequate
carbon loss. At that time the furnace was turned off and the door left closed - to minimize reabsorption of

moisture - until the samples cooled to a workable level. This time was usually around 24 hours. They
were then re-weighed to determine the percent carbon content.
GIS and Mapping
In order to determine the total area of the existing salt marshes currently managed by the City of
Arcata, we first needed to create a file using GeoSpatial Data. We used ArcMap to create a map of the city
of Arcata boundaries and included in that map a shapefile with existing salt marshes as of 2013, and
projected the data into NAD 1983 State Plane California I FIPS 0401. We obtained additional spatial data
from the Humboldt Bay Harbor District which contained data on the salt marshes present in 1870 and was
compiled for the California Coastal Commission.
The data we obtained from the City of Arcata Environmental Services was current up to July of
2013. The data included about 250 acres of existing saltmarsh. The newly restored McDaniel Slough site
included an additional 320+acres of salt marsh that was now managed under the city of Arcata. We used
an edit polygon feature and hand traced all of the boundaries of the McDaniel slough site to incorporate
that into the map.
Finally, we used both the intersect and clip features in ArcGIS to determine the historical and
current boundaries of the salt marsh, that were also contained in the boundaries of the City of Arcata.
Once we had that clipped file, we were able to re-calculate the geometry and statistics and determine the
total number of acres that were both historic salt marshes from 1870 and existing salt marshes on the
North Bay. See Figure 1 for the completed map.

Figure 1. Current salt marshes within City of Arcata jurisdiction shown in purple. 1870 Salt marsh of the north bay shown in green, and potential for marsh restoration and carbon sequestration is depicted in light green.
Surveying
A level loop was used to determine to a greater accuracy the amount of subsidence that occurred
in the sampled pastureland adjacent to McDaniel Slough. The resolution of available LIDAR data was
only 2 m, well beyond that needed to perceive subsidence. The level loop method we conducted took a

reading off a stadia rod placed in the pasture from a position on the levee. The stadia rod was then moved
to the other side of the level and an additional reading was taken. Keeping the position of the stadia rod,
the level was re-located farther towards the bay along the levee and a reading from the new position was
taken from the stadia rod at its held position. The stadia rod was then again moved and the process was
repeated. When the final reading was taken on the water’s edge of the salt marsh, the entire sequence was
repeated back up the levee until the stadia rod was in its original place, allowing for observation of any
error in the loop. In this manner a reading of elevation was kept along the length of the survey, allowing
for a much more accurate determination of subsidence than provided by LIDAR.
Results
Soils
The converted agriculture and existing salt marsh soils had much different soil carbon amounts
and rates of decrease. Likely due to the high decomposition rates in the converted land resulting from
heightened microbial activity associated with aerobic conditions and low salinity, soil carbon percentages
were much lower than in salt marsh soils. The mean percent carbon for the converted land determined by
the shallow cores is 5.1%. Mean percent carbon of the shallow cores for salt marsh soils was 19.1%. The
rates of decrease over depths were much different as well, with the converted land diminishing to 1.4%
carbon at the bottom of the deep cores (at 106 cm) and the salt marsh soils diminishing to only 5.5% (at
150 cm). See figure 2 for graphic depiction of results and table 1-4 for additional information.

Table 1. Flow of annual carbon sequestration and accumulation in Arcata salt marsh in metric tons.
Table 2 Stock of carbon held in Arcata salt marsh in metric tons.
Depth (m)
4 24445 72018
6 36667 108028
8 48890 144037
10 61112 180046
Existing (metric tons
Historic (metric tons)
Existing Salt Marsh Historic Salt Marsh
396.9 1169.2
6890.9 20301.7
6243.1 18393.2
955.1 2813.9
Metric Tons Carbon Per Year (Average of two mean global and four S.F. Bay rates of
sequestration)
Average NPP (Averaged from Two methods) Metric Tons
Average Below Ground NPP (Averaged from Two methods)
Metric Tons
Average Above Ground NPP (Averaged from Two methods)
Metric Tons

Table 3. Area of converted Arcata Historic Marsh and extent of subsidence.
Fig. 2. Carbon content of four soil samples in percent content over depth. Note differing scales of axis, illustrating the much higher carbon content of salt marsh soils than agricultural soils. McDaniel samples taken in pre-existing salt marsh adjacent to restoration site.
Marsh Reclaimed
19.0 5.1
5.5 1.4
Shallow cores average carbon content (%)
Carbon content at terminal depth (%)
Survey
Through a level loop survey the agricultural land adjacent to McDaniel Slough restoration area
was found to be 1.6 feet lower than the salt marsh that borders the bay on the other side of McDaniel
Slough, with an error of 0.37 ft.
Discussion:
Results/findings of Soil cores
The sample size of the soil analysis was enough to show trends and relationships but not
statistical significance. Only two deep cores were taken in converted salt marsh and only five shallow
samples. The difference between them is striking, and it seems that with appropriate sample sizes
statistically significant differences would be apparent. The rate of diminishing is of particular interest as it
represents carbon held and or lost over a long time span. Not only did the salt marsh have a higher content
at a greater depth but it appeared that carbon loss may decrease to a very low rate. Our cores did not
capture the bottom of the soils and deeper coring may find a depth at which carbon loss increases. The
converted land appeared to be undergoing a more steady, rapid rate of carbon loss.
Survey
The survey, while of a much higher accuracy than available LIDAR data, was not up to the 0.05 ft
margin of error required by professional surveyors. It, like the rest of our data, is a rough illustration of
the trends within the existing and historic salt marshes. To have a greater significance it would be
necessary to replicate the survey across more salt marsh-to-agriculture land gradients. Our findings of 1.6
+/- 0.37 ft of subsidence do show that through conversion decomposition and disturbance rates increase
resulting in soil loss and corresponding release of carbon. Combined with the soil carbon data provided
through the soil analysis, our limited data shows that converting salt marsh to pastureland may results in
large carbon emissions. With further study the amount of loss could be more refined. Reintroduction of

tidal influence to previously reclaimed and since subsided coastal lands has been demonstrated to result in
an accelerated rate of accretion and thereby increased sequestration. Although rapid accretion will occur
until the pre-subsidence elevation is regained, some systems may not have the sediment supply or primary
productivity to accomplish this.
Discussion of Sampling Regime: critiques, qualifications, and lessons learned
Our samples represent relative carbon content of the salt marsh soils, and due to sample size and
discrepancies in methods, the data associated with deep cores lack statistical significance. They are purely
illustrative of general patterns and trends and are not intended to be conclusive or within a narrow scope
of accuracy. Much was learned in the process pertaining to study design, sampling methods, and
fieldwork logistics which would influence subsequent study were there an opportunity to do so.
Unfortunately many of these lessons were learned during the analysis of the data, at which point it was
too late to ratify the failures by enacting more rigorous methodology and practice. In particular, extracting
more deep cores with higher levels of technique replication would have benefited our study and would be
crucial in accurate assessment of the carbon stock of the salt marshes. Using the same corer for all
samples – we had two, similar but of slightly differing designs – for example, would have ensured a more
uniform method of extraction. Similar realizations of equal simplicity occurred throughout the project.
Unfortunately most were due to the clarity of hindsight.
Soil conditions were not conducive whatsoever to the extraction of clean, intact, and well defined
cores. The soils of the salt marshes were clayey, saturated, and fine textured. The samples resisted being
cleanly extracted from the maw of the coring device, causing significant exertion, messiness, and
frustration. We had originally envisioned being able to arrange in sequence fully intact cores that we
would then be able to cut to size in order to process uniform-depth samples. This, we soon found, was an
impossibility using our corers. We were forced to resulting to pulling the cores from the device by any
means possible (grabbing small hand-fulls, using a trowel, etc… none of which preserved the integrity of
the cores) because the soils were so congealed, unstructured, and generally very, very, mucky. This
procedure resulted in significant inter-stratigraphic mixing of the portion of soil extracted by the corer at
any given time.
Measuring the depth of each core would have allowed a greater control of resolution. Due to
varying soil conditions between sites the number of cores extracted to reach 150 cm differed. Some cores
would reach 150 cm in 7 or 8 pulls (screwing the corer down until the chamber was filled then pulling up
and emptying the contents at the surface, resulting in one sample), whereas to achieve the same 150 cm
depth, other sites required significantly more force and exertion and would produce as many as 12
samples. Since each sample was a unit of measurement representing depth, with the sub-sample made
within the soils lab a representation of the whole sample, the differences in numbers of samples per core
caused a difference in resolution across all of the deep cores.
Recommendations for Further Study
Due to many constraints (time, money, and expertise the primary three) we were inhibited from
conducting a thorough examination of the salt marsh. Through our research we arrived only at a
rudimentary understanding of the variables which have the greatest affect on the ability of a salt marsh to
function as a climate change mitigating device; many elements are in need of further study. Our primary
recommendations are to install sediment accretion measurement plots, collect further sampling of soil
cores, establish a grid of accurate soil depth measurements within the salt marsh, and to date the soil cores
using radiocarbon dating methods to apply a timescale to the carbon stock. It may also become necessary
to quantify the exchange of other greenhouse gases such as nitrous oxide and methane in order to more
accurately evaluate the mitigation potential of the marsh lands, this can be done through the establishment
of small gas-flow measurement chambers.
Even if further study of the salt marshes is decided to be low priority, we would strongly
recommend that sediment accretion plots be installed. This is for three reasons: they are cheap, provide
crucial data in determining if the salt marshes can keep pace with climate change, and due to the slow rate
of accretion (millimeters to centimeters per year) the longer they are installed, the more informative the
data. Accretion plots can be as simple as spreading a layer of white clay across the surface and over time
extracting a core (using an exterior-beveled PVC pipe) that can be opened to show the amount of
accretion above the clay layer. We would recommend installing one within the McDaniel Slough
restoration area as well, as the area has likely subsided due to conversion. It would be extremely
interesting to see if accretion rates in the subsided area are greater than within preexisting salt marshes.
Studies have shown that a significant increase in accretion can occur in tidally re-connected subsided
areas, which represents a large pickup in the amount of carbon sequestered. Correspondingly, these areas
would have a greater worth in the carbon trading market until accretion rates stabilize and elevations
reach a pre-subsidence level.
Collecting more soils cores under a more rigorous methodology would allow for a greater
understanding of the soil conditions and soil carbon content. While the augers we used were effective at
reaching the intended depths, they did not do it cleanly. Using a device that would extract clean cores
allowing for cutting at regular intervals would give a better understanding of carbon content over depth.
Establishing the depth of soils within the salt marsh is necessary in the calculation of existing carbon
stock. Lastly, finding a means to date the soils at various depths would provide a much needed timescale
to the determining of carbon storage potential. We could find no signs of a sediment or sand layer that
could be correlated to a specific datable event, such as the 1964 flood or the 1700 tsunami.
Conclusion
We were able to meet our goals of measuring the potential area and estimate of the stock for
carbon sequestration in the salt marshes. We faced the challenges of not taking enough samples in the
field, and therefore have limited analysis of the samples collected. Arcata Marsh, McDaniel Slough and
the surrounding salt marshes have great potential to sequester carbon long term for the city of Arcata and
Humboldt County. More research and analysis of the depth and sediment accretion rates is certainly
needed and recommended, but the marshes appear to provide a substantial offset to the city’s carbon
footprint. Finding innovative techniques to adapt and mitigate for climate change should be a primary
objective of restoration projects as well as community planning. The value of local salt marsh is apparent
not only in its ability to efficiently sequester carbon, but also in its ability to provide complex habitat for a
myriad of species (some threatened or endangered), to improve the health of local fisheries including the
shellfish industry, and to filter nutrients and pollutants preventing eutrophication and dead zones.
Works Cited
Barnhart, Roger A., Milton J. Boyd, and John E. Pequegnat. (1992). The Ecology of Humboldt Bay, California: An Estuarine Profile. U.S. Fish and Wildlife Service Biological Report 1.pp121
Bartlett, Karenlett, et al. (1987). Methane emissions along a salt marsh salinity gradient. Biogeochemistry. 4. 183-202. Web. 17 Sep. 2013.
Brevik, Eric, and Jeffrey Homburg.(2004). A 5000 year record of carbon sequestration from a coastal lagoon and wetland complex, Southern California, USA. CATENA. 57. 221-232. Print.
Boorman, L., J. Hazelden, & M. Boorman. New Salt Marsh for Old - Salt Marsh Creation and Management.Littoral. The Changing Coast, Eurocoast/EUCC, Porto- Portugal, ISBN 972-8558-09-0
Bridgham, Scott D., J. Patrick Megonigal, et al. (2006). The Carbon Balance of North American Wetlands. Wetlands, Vol.26, No. 4, pp. 889- 916
Broome, S.W., C.B. Craft.(2000). Tidal Salt Marsh Restoration, Creation, and Mitigation. Restoration of Drastically Disturbed Lands. Ch.37, 939-959.
Burden, A. , R.A. Garbutt, et al.(2013) Carbon sequestration and biogeochemical cycling in a saltmarsh subject to coastal managed realignment. Estuarine, Coastal, and Shelf Science. 120. 12-20. Web. 17 Sep. 2013.
California. Coastal Conservancy. (2012). McDaniel Slough Wetland Restoration. Northern Shore of Humboldt Bay, Arcata, California: Humboldt County. Print.
Callaway, John, Evyan Borgnis, et al. (2012). Carbon sequestration and sediment accretion in San Francisco bay tidal wetlands. Estuaries and Coasts. 3.5. 1163-1182. Web. 17 Sep. 2013. <http://link.springer.com/article/10.1007/s12237-012-9508-9>.
Chmura, L. Gail, S.C. Anisfeld, et al.(2003).Global Carbon Sequestered in Tidal, Saline Wetland Soils. Global Biogeochemical Cycles, Vol. 17, No. 4
Choi, Yonghoon, and Yang Wang. (2004).Dynamics of carbon sequestration in a coastal wetland using radiocarbon measurements. Global Biogeochemical Cycles 18.4
Connor, Richard F., Gail L. Chmura, & C. Beth Beecher.(2001) Carbon Sequestration in Bay of Fundy Salt Marshes: Implications for Restoration of Reclaimed Marshes. Global Biogeochemical Cycles, Vol. 0, No. 0, Pg. 1-12
Crooks, Stephen, Dorothee Herr, et al.(2011) Mitigating Climate Change through Restoration and Management of Coastal Wetlands and Near-shore Marine Ecosystems: Challenges and Opportunities. The World Bank. Environmental Department Papers. Paper No. 121. Marine Ecosystems Series
Forster, P., et al.(2007). Changes in atmospheric constituents and in radiative forcing; Climate change 2007: The physical science basis. IPCC fourth assessment. p. 129-234
Kathilankal, James C., et al. (2008).Tidal influences on carbon assimilation by a salt marsh. Environmental Research Letters 3.4. 044010.
Laffoley, D. d’A, G. Grimsditch. (2009).The Management of Natural Coastal Carbon Sinks. IUCN, Gland, Switzerland. 53 pp.

Laird, Aldaron. (2010). Humboldt Shoreline Inventory, Mapping and Sea Level Rise Vulnerability Assessment. State Coastal Commission.
Lal, Rattan. (2008).Carbon Sequestration. Phil. Trans. R. Soc. B 363, p. 815-830. doi: 10.1098/rstb.2007.2185
Li, Yan-li, et al. (2010). Variability of soil carbon sequestration capability and microbial activity of different types of salt marsh soils at Chongming Dongtan. Ecological Engineering 36.12. 1754-1760.
Mcleod, Elizabeth, Gail Chmura, et al. (2011). A blueprint for blue carbon: toward an improved understanding of the role of vegetated coastal habitats in sequestering CO2. Front Ecol Environ. 9.10. pp 552-560. Print.
Murray, Alison and Robert Warner. (1980). A Study of the Jacoby Creek Watershed, Humboldt County, California. Jacoby Creek Canyon Community, INC .Bayside, California.
Moseman-Valierra, Serena, Rosalinda Gonzalez, et al. (2011). Short-term nitrogen additions can shift a coastal wetland from a sink to a source of N20. Atmospheric Environment. 45. .4390-4397. Web. 17 Sep. 2013. http://www.sciencedirect.com/science/article/pii/S1352231011005504.
Schlosser, Susan. (2012). Humboldt Bay Region Sea Level Rise Data Synthesis. PWA Report No. 11096601.
The World Bank. (2011). Environmental Department Papers. Paper No. 121. Marine Ecosystems Series
Cover Photo Credits Top Left: McDaniel Slough Restoration Project.Times Standard copyright image 2013. http://www.times-standard.com/northcoastlife/ci_24497915/major-wetland-restoration-complete Bottom Left: Arcata Marsh painting “Arcata Marsh Wildlife”. Larry Eifert 1989. http://larryeifert.com/wordpress/?p=1878 Right: Humboldt Bay Salt Marshes of 1870. US Fish and Wildlife Service 2005.