Embed Size (px)
Citation preview
Funds
12/31/2019ANNUAL REPORT
Beginning on January 1, 2021, as permitted by regulations adopted by the Securities and Exchange Commission, paper copies of the Fund’s shareholder reports like this one will no longer be sent by mail, unless you specifically request from your financial intermediary (such as a broker-dealer or bank) or the Fund to receive (free of charge) paper copies of the reports. Instead, the reports will be made available on the Fund’s website www.ancorafunds.com, and you will be notified by mail each time a report is posted and provided with a website link to access the report.
If you already elected to receive shareholder reports electronically, you will not be affected by this change and you need not take any action. You may elect to receive shareholder reports and other communications from the Fund electronically by contacting your financial intermediary or, if you are a direct investor, by following the instructions included with paper Fund documents that have been mailed to you.
INTRODUCTION TABLE OF CONTENTS
INTRODUCTION INCLUDING SHAREHOLDER LETTER……….………....…..….1
ANCORA INCOME FUND……….……………………………………………………….……..4
ANCORA/THELEN SMALL-MID CAP FUND…………….……………………….….....8
ANCORA MICROCAP FUND…………….………….….……..……………………….…….14
ANCORA SPECIAL OPPORTUNITY FUND….……….…………….……………….….20
ANCORA DIVIDEND VALUE EQUITY FUND………………………………………… 25
FINANCIAL REVIEW…..………………………………………...............................………..31
FUND EXPENSES………………………………..……………………………….….…....…….56
TRUSTEES & OFFICERS …………………………………..………….….…........................58
PRIVACY POLICY ……………………………………………………………………………….60
1-866-6-ANCORA Please feel free to dial our toll-free number to speak directly to a knowledgeable representative who can answer any questions or assist you with any issues concerning your account.
www.ancorafunds.com This report and the financial statements contained herein are provided for the general information of the shareholders of the Ancora Funds. Investors should carefully consider before investing each Fund’s investment objective, risks and expenses. For a prospectus, which contains that information and more information about each Fund, please call 866-626-2672 or visit our website at www.ancorafunds.com. Please read it carefully before you invest or send money.

INTRODUCTION
1
Dear Shareholders: Thank you for choosing the Ancora Family of Mutual Funds. We have built the Ancora Funds to capitalize on the evolving opportunities in the investment landscape. Our management style centers on building long-term results for the investors of our Funds. While no mutual fund can guarantee performance, the Ancora Funds promise that our investment decisions will be based upon dedicated research and thoughtful execution. ANCORA INCOME FUND The Ancora Income Fund Class I had an excellent year in 2019 returning 13.5%, well outpacing its benchmark index, the Barclay’s Aggregate Index, which returned 8.7% for the year. Tighter credit spreads for both high yield and lower investment grade credits resulted in higher bond prices in 2019. In addition, lower interest rates across the yield curve also contributed to bond appreciation last year. The portfolio’s duration fell slightly to under 4-years (excluding a larger than average cash balance at year end). The fund remains a mixture of perpetual preferred issues, closed-end and exchange traded bond funds and a few equity/convertible holdings. As long as rates remain low, the yield curve remains relatively flat, and asset prices (equity valuations) remain intact, the fund is well suited to produce attractive relative income and maintain steady unit prices. The portfolio’s current indicated dividend yield remains around 4%, which is quite attractive in this low interest rate environment. Some shorter, preferred holdings nearing maturity that were purchased last year and short-term Treasury fund holdings should help to mitigate the potential higher duration risks associated with the portfolio if longer rates were to increase or the yield curve were to steepen. ANCORA/THELEN SMALL-MID CAP FUND For 2019, the Ancora/Thelen Small-Mid Cap Fund Class I and Class S shares advanced 24.9% and 25.2% respectively, trailing the Russell 2500 Index performance of 27.8%. The slight underperformance was due entirely to sector allocation, which more than offset good stock selection. Sector selection weakness was due mostly to an underweight in higher-growth industries and our slight cash holdings that caused a drag in a very strong environment. From a macro perspective, we had positive stock selection in the majority of sectors with the largest relative contributors being industrials and financials. Best performing stocks were Arconic and Arcosa, both of which were added in 2019. The financial sector was the second-best contributor with the average holding increasing 37.7% versus the respective index return of 26.0%. The outperformance was paced by Cannae Holdings, whose stock advanced more than 117% during the year. Negatives for the year again included the underweight position in technology and healthcare and, to a lesser extent, stock selection in materials and energy. The materials sector is very small, but relative performance was hurt primarily by weakness in Orion Engineered Carbons and Suncoke Energy. Energy underperformed primarily due to weakness at KLX Energy. After a very strong year in 2019, small and mid-cap stocks, as a whole, have reached valuations that are approaching the high end by historical standards. Importantly, small and mid-cap value stocks are not nearly as expensive as small and mid-cap growth stocks. This dynamic has historically normalized over time. This should bode well for value stocks and our strategy due to our value orientation. We will continue to apply our time-tested process of finding stocks that fit into our defined categories; special situations, underfollowed stocks, and franchise companies when the stocks are temporarily cheap. We continue to find opportunities in all three categories, particularly in corporate spinoffs. This focused strategy has worked well in a variety of economic and market environments.
INTRODUCTION
2
We are extremely mindful of our responsibility to create value for our shareholders. We are committed to working very hard to earn and retain your trust. ANCORA MICROCAP FUND The Ancora MicroCap Fund returned 11.1% for 2019, underperforming the Russell Microcap Index, which returned 22.4% for the year. After a short-lived reversion towards value in the third quarter, once again, growth stocks outperformed value stocks in the fourth quarter. For example, the Russell Microcap Value Index posted a return of 10.5%, underperforming the Russell Microcap Growth Index, which posted a 17.7% return, by 7.2% in the fourth quarter. From an attribution standpoint, our sector allocation detracted from performance during the year. Our underweight to healthcare was the largest detractor, followed by an overweight to energy and underweight to real estate. Somewhat offsetting this was an overweight to technology. Our cash holdings were also a drag on performance. Security selection also detracted from performance during the year. Despite this, in the long run, we expect that security selection will be a tailwind to performance. The companies that added the most to our performance during the year were: Perma-Fix Environmental, up 287.2%, Telenav, up 158.4% and Maxwell Technologies, up 127.5%. Telenav was sold after the large gains were achieved and sold off significantly after our sale. Maxwell Technologies was acquired by Tesla. The companies that detracted most from performance during the year were: Armstrong Flooring, down 63.9%, FreightCar America, down 69.1% and Richardson Electronics, down 32.6%. The headwinds to value investing continue to be very stiff. Unfortunately, we cannot predict when this will turn. However, we can say that the difference between growth and value has not been this extended since the TMT (technology, media, telecommunications) bubble circa 2000. Over the long term, academic research has shown that value stocks tend to outperform growth stocks, despite periodic episodes of growth trouncing value. We continue to believe that bargain hunting in the stock market will outperform in the long term. Therefore, despite these challenging times, we are sticking with our disciplined value philosophy and process. Our philosophy remains unchanged; we are focused on building a portfolio of companies that we believe are trading at a significant discount to their true value. We continue to screen for deeply undervalued stocks with great balance sheets, potential catalysts, and positive signals from insiders. We will execute our philosophy with patience and discipline. Regardless of broad market valuation, we believe an inefficiently followed segment like microcap stocks can always provide fertile ground for new ideas that can outperform the market. ANCORA SPECIAL OPPORTUNITY FUND The Ancora Special Opportunity Fund Class I shares returned 29.5% for 2019, underperforming the Wilshire 5000 Index return of 31.0% for the year. At year end, approximately 18% of the fund’s holdings were cash or cash equivalents as investments that met the fund’s required objectives were more difficult to find. One of the outstanding securities in the portfolio was Enphase Energy, which rose from approximate $5 per share at the beginning of 2019, to $26 per shares at year end. The company produces microinverters which are used to convert the sun’s energy into electricity. Two securities which disappointed were Equus Total Return and Manning & Napier. For the past five years, Equus management has been promising a major event to transform the company, but nothing has transpired. Meanwhile, management has been drawing substantial salaries. In the case of Manning & Napier, an investment management company with assets under management around $20 billion, portfolio performance has been mediocre. The shares traded at $1.74 at year end. Based upon any reasonable calculation of a buyout price, the shares should be worth in excess of $5 per share. While the Ancora Special Opportunity Fund is an all-cap fund, meaning it can invest in companies of all sizes, the focus is on companies in which anticipated future events might drive the price

INTRODUCTION
3
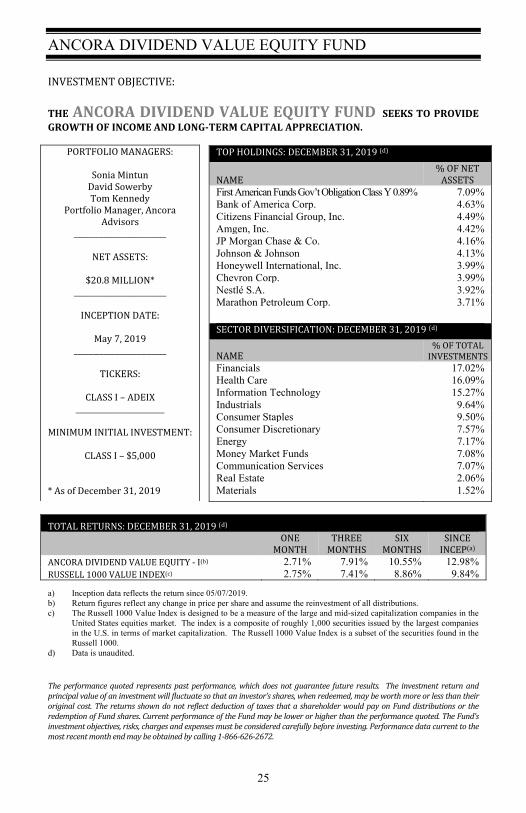
higher. These types of events tend to occur in the smaller-capitalization sector of the market, causing the fund’s average capitalization to lean towards the small-cap value space. ANCORA DIVIDEND VALUE EQUITY FUND Ancora’s Dividend Value Equity Fund returned 13.0% since the fund’s launch on May 7, 2019, through year-end 2019, outperforming the Russell 1000 Value Index return of 9.8%. Our overweight in technology, along with strong stock selection in health care were contributors while our zero-weight in utilities, underweight in financials as well as stock selection in materials detracted from performance. Within technology, Apple had a total return of 46.3% since the fund’s inception. After a rough start to 2019, the stock rebounded once investors saw traction in the services business and became more confident that it could drive long-term growth. In addition, the outlook also improved for the iPhone and “wearables” businesses. During the fourth quarter, we slightly trimmed our weighting in technology as valuations became a little stretched, but we remain convicted in our holdings long-term. Health care performance was led by Amgen, returning 41.8% during the period. Amgen has a proven track-record in the biotechnology industry, and a number of catalysts including their impressive oncology pipeline and continued ability to drive significant volume growth with their recent acquisition of Otezla. Our zero-weight in utilities was the largest detractor from relative performance. While we remain mindful of the underweight position, there continues to be a “high hurdle rate” for purchasing companies in the sector. Valuations are not attractive in our view, particularly given the low interest rate environment we are in. The negative effect from stock selection in materials was further amplified by our underweight position. The materials sector has been plagued by weak and uncertain fundamentals, paired with the added headwind of the China trade war. These factors have made it difficult to navigate investing in the sector, and drove a -4.79% total return from DuPont during the period, which was our only holding in the sector at year-end. Looking past the industry uncertainty, we continue to believe DuPont’s business optionality as a recent spinoff can unlock significant long-term value for shareholders. At year-end, the fund’s weighted average dividend yield was 2.4%, compared to the 1.9% yield on the 10-year U.S. Treasury. Since our fund launched in May 7 of this year, of our holdings announced a dividend increase with an average growth rate of 13.5%. Our focused portfolio with solid catalysts drove strong outperformance versus the benchmark in 2019. We are confident that our selection in companies that consistently grow their dividend and generate attractive free cash flow margins will be able to navigate market volatility, should economic outlook become less certain, as well as perform well in strong markets.
Bradley Zucker Richard A. Barone Dan Thelen Michael Santelli President, Treasurer Portfolio Manager Portfolio Manager Portfolio Manager & Secretary
Sonia Mintun Portfolio Manager
ANCORA INCOME FUND
4
INVESTMENT OBJECTIVE:
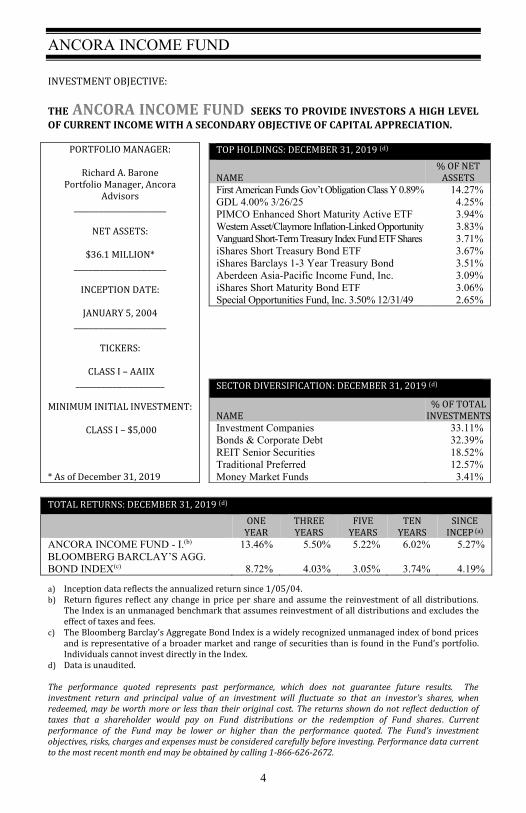
THE ANCORA INCOME FUND SEEKS TO PROVIDE INVESTORS A HIGH LEVEL
OF CURRENT INCOME WITH A SECONDARY OBJECTIVE OF CAPITAL APPRECIATION.
TOTAL RETURNS: DECEMBER 31, 2019 (d)
ONE YEAR
THREE YEARS
FIVE YEARS
TEN YEARS
SINCE INCEP (a)
ANCORA INCOME FUND - I.(b) 13.46% 5.50% 5.22% 6.02% 5.27% BLOOMBERG BARCLAY’S AGG. BOND INDEX(c) 8.72% 4.03% 3.05% 3.74% 4.19%
a) Inception data reflects the annualized return since 1/05/04. b) Return figures reflect any change in price per share and assume the reinvestment of all distributions.
The Index is an unmanaged benchmark that assumes reinvestment of all distributions and excludes the effect of taxes and fees.
c) The Bloomberg Barclay’s Aggregate Bond Index is a widely recognized unmanaged index of bond prices and is representative of a broader market and range of securities than is found in the Fund’s portfolio. Individuals cannot invest directly in the Index.
d) Data is unaudited. The performance quoted represents past performance, which does not guarantee future results. The investment return and principal value of an investment will fluctuate so that an investor’s shares, when redeemed, may be worth more or less than their original cost. The returns shown do not reflect deduction of taxes that a shareholder would pay on Fund distributions or the redemption of Fund shares. Current performance of the Fund may be lower or higher than the performance quoted. The Fund’s investment objectives, risks, charges and expenses must be considered carefully before investing. Performance data current to the most recent month end may be obtained by calling 1-866-626-2672.
PORTFOLIO MANAGER:
Richard A. Barone Portfolio Manager, Ancora
Advisors _________________________
NET ASSETS:
$36.1 MILLION*
_________________________
INCEPTION DATE:
JANUARY 5, 2004 _________________________
TICKERS:
CLASS I – AAIIX
________________________
MINIMUM INITIAL INVESTMENT:
CLASS I – $5,000 * As of December 31, 2019
TOP HOLDINGS: DECEMBER 31, 2019 (d)
NAME % OF NET
ASSETS First American Funds Gov’t Obligation Class Y 0.89% 14.27% GDL 4.00% 3/26/25 4.25% PIMCO Enhanced Short Maturity Active ETF 3.94% Western Asset/Claymore Inflation-Linked Opportunity 3.83% Vanguard Short-Term Treasury Index Fund ETF Shares 3.71% iShares Short Treasury Bond ETF 3.67% iShares Barclays 1-3 Year Treasury Bond 3.51% Aberdeen Asia-Pacific Income Fund, Inc. 3.09% iShares Short Maturity Bond ETF 3.06% Special Opportunities Fund, Inc. 3.50% 12/31/49 2.65%
SECTOR DIVERSIFICATION: DECEMBER 31, 2019 (d)
NAME % OF TOTAL
INVESTMENTS Investment Companies 33.11% Bonds & Corporate Debt 32.39% REIT Senior Securities 18.52% Traditional Preferred 12.57% Money Market Funds 3.41%

ANCORA INCOME FUND PERFORMANCE ILLUSTRATION (UNAUDITED)
5
The chart above assumes an initial investment of $10,000 made on January 5, 2004 (commencement of Fund operations) and held through December 31, 2019. THE FUND’S RETURN REPRESENTS PAST PERFORMANCE AND DOES NOT GUARANTEE FUTURE RESULTS. The returns shown assume the reinvestment of all distributions and do not reflect deduction of taxes that a shareholder would pay on Fund distributions or the redemption of Fund shares. Investment returns and principal values will fluctuate so that your shares, when redeemed, may be worth more or less than their original purchase price.
Past performance is no guarantee of future results. Performance is unaudited.
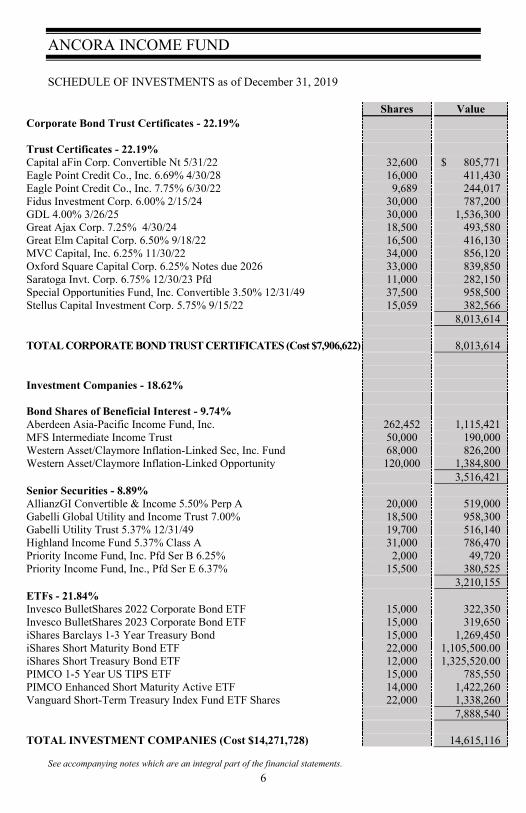
ANCORA INCOME FUND SCHEDULE OF INVESTMENTS as of December 31, 2019
6
Shares Value Corporate Bond Trust Certificates - 22.19%
Trust Certificates - 22.19% Capital aFin Corp. Convertible Nt 5/31/22 32,600 $ 805,771 Eagle Point Credit Co., Inc. 6.69% 4/30/28 16,000 411,430 Eagle Point Credit Co., Inc. 7.75% 6/30/22 9,689 244,017 Fidus Investment Corp. 6.00% 2/15/24 30,000 787,200 GDL 4.00% 3/26/25 30,000 1,536,300 Great Ajax Corp. 7.25% 4/30/24 18,500 493,580 Great Elm Capital Corp. 6.50% 9/18/22 16,500 416,130 MVC Capital, Inc. 6.25% 11/30/22 34,000 856,120 Oxford Square Capital Corp. 6.25% Notes due 2026 33,000 839,850 Saratoga Invt. Corp. 6.75% 12/30/23 Pfd 11,000 282,150 Special Opportunities Fund, Inc. Convertible 3.50% 12/31/49 37,500 958,500 Stellus Capital Investment Corp. 5.75% 9/15/22 15,059 382,566
8,013,614
TOTAL CORPORATE BOND TRUST CERTIFICATES (Cost $7,906,622) 8,013,614
Investment Companies - 18.62%
Bond Shares of Beneficial Interest - 9.74% Aberdeen Asia-Pacific Income Fund, Inc. 262,452 1,115,421 MFS Intermediate Income Trust 50,000 190,000 Western Asset/Claymore Inflation-Linked Sec, Inc. Fund 68,000 826,200 Western Asset/Claymore Inflation-Linked Opportunity 120,000 1,384,800
3,516,421 Senior Securities - 8.89% AllianzGI Convertible & Income 5.50% Perp A 20,000 519,000 Gabelli Global Utility and Income Trust 7.00% 18,500 958,300 Gabelli Utility Trust 5.37% 12/31/49 19,700 516,140 Highland Income Fund 5.37% Class A 31,000 786,470 Priority Income Fund, Inc. Pfd Ser B 6.25% 2,000 49,720 Priority Income Fund, Inc., Pfd Ser E 6.37% 15,500 380,525
3,210,155 ETFs - 21.84% Invesco BulletShares 2022 Corporate Bond ETF 15,000 322,350 Invesco BulletShares 2023 Corporate Bond ETF 15,000 319,650 iShares Barclays 1-3 Year Treasury Bond 15,000 1,269,450 iShares Short Maturity Bond ETF 22,000 1,105,500.00 iShares Short Treasury Bond ETF 12,000 1,325,520.00 PIMCO 1-5 Year US TIPS ETF 15,000 785,550 PIMCO Enhanced Short Maturity Active ETF 14,000 1,422,260 Vanguard Short-Term Treasury Index Fund ETF Shares 22,000 1,338,260
7,888,540
TOTAL INVESTMENT COMPANIES (Cost $14,271,728) 14,615,116 See accompanying notes which are an integral part of the financial statements.

ANCORA INCOME FUND SCHEDULE OF INVESTMENTS as of December 31, 2019 (CONTINUED)
7
Shares Value Traditional Preferred Securities - 9.47% AGNC Investment Corp. 6.87% 26,000 $ 670,280 Air T, Inc., Pfd 8.00% 69,000 173,846 Apollo Global Mgmt LLC Pfd Ser 6.37% 13,500 359,100 Compass Diversified Holdings Pfd Ser C 7.87% 10,000 256,400 Ellington Financial, Inc. 6.75% Pfd 12,000 304,200 Energy Transfer Operating, L.P. 7.60% 10,000 253,200 Equitable Holdings, Inc. 5.25% 3,000 78,300 Oaktree Capital Group 6.55% Series B Pfd 28,500 770,640 OFS Credit Co., Inc. Pfd Ser A 6.87% 5,000 129,050 Priority Income Fund, Inc. Pfd Ser C 6.62% 17,000 426,360
3,421,376
TOTAL TRADITIONAL PREFERRED SECURITIES (Cost $3,281,795) 3,421,376
REIT Senior Securities - 13.55% Braemar Hotels & Resorts, Inc. 5.50% 6/11/20 50,000 950,000 Brookfield Property Partners LP 33,500 869,995 Global Net Lease, Inc. 6.87% 25,000 641,000 Landmark Infrastructure Partners LP 33,000 859,657 New Residential Investment Corp. 7.12% 5,000 129,600 Pebblebrook Hotel Trust Pfd Ser C 6.50% 12,000 304,800 PennyMac Mortgage Investment Trust 15,000 393,300 Summit Hotel Properties, Inc. 6.45% 12/31/49 4,170 107,578 UMH Properties, Inc. 6.37% Perp Pfd 25,500 638,010
4,893,940
TOTAL REIT SENIOR SECURITIES (Cost $4,605,509) 4,893,940
Money Market Funds - 14.27% First American Funds Government Obligation Class Y 0.89% (a) 5,152,004 5,152,004
5,152,004
TOTAL MONEY MARKET FUNDS (Cost $5,152,004) 5,152,004
TOTAL INVESTMENTS (Cost $35,217,658) 99.95% 36,096,050
Other Assets In Excess of Liabilities - (0.02)% 19,580
TOTAL NET ASSETS - 100.00% $ 36,115,630 (a) Variable rate security; the coupon rate shown represents the 7-day yield as of December 31, 2019. See accompanying notes which are an integral part of the financial statements.
ANCORA /THELEN SMALL-MID CAP FUND
8
INVESTMENT OBJECTIVE:
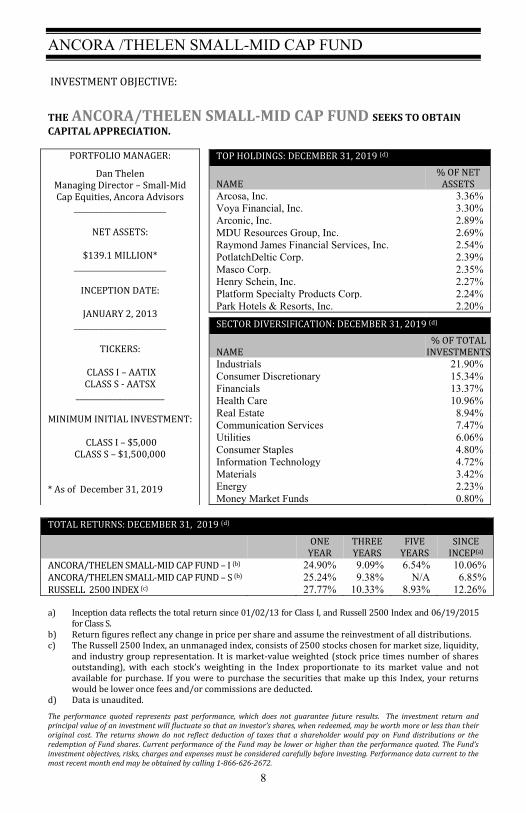
THE ANCORA/THELEN SMALL-MID CAP FUND SEEKS TO OBTAIN
CAPITAL APPRECIATION.
TOTAL RETURNS: DECEMBER 31, 2019 (d)
ONE YEAR
THREE YEARS
FIVE YEARS
SINCE INCEP(a)
ANCORA/THELEN SMALL-MID CAP FUND – I (b) 24.90% 9.09% 6.54% 10.06% ANCORA/THELEN SMALL-MID CAP FUND – S (b) 25.24% 9.38% N/A 6.85% RUSSELL 2500 INDEX (c) 27.77% 10.33% 8.93% 12.26% a) Inception data reflects the total return since 01/02/13 for Class I, and Russell 2500 Index and 06/19/2015
for Class S. b) Return figures reflect any change in price per share and assume the reinvestment of all distributions. c) The Russell 2500 Index, an unmanaged index, consists of 2500 stocks chosen for market size, liquidity,
and industry group representation. It is market-value weighted (stock price times number of shares outstanding), with each stock’s weighting in the Index proportionate to its market value and not available for purchase. If you were to purchase the securities that make up this Index, your returns would be lower once fees and/or commissions are deducted.
d) Data is unaudited.
The performance quoted represents past performance, which does not guarantee future results. The investment return and principal value of an investment will fluctuate so that an investor’s shares, when redeemed, may be worth more or less than their original cost. The returns shown do not reflect deduction of taxes that a shareholder would pay on Fund distributions or the redemption of Fund shares. Current performance of the Fund may be lower or higher than the performance quoted. The Fund’s investment objectives, risks, charges and expenses must be considered carefully before investing. Performance data current to the most recent month end may be obtained by calling 1-866-626-2672.
PORTFOLIO MANAGER:
Dan Thelen Managing Director – Small-Mid Cap Equities, Ancora Advisors
_________________________
NET ASSETS:
$139.1 MILLION* _________________________
INCEPTION DATE:
JANUARY 2, 2013
_________________________
TICKERS:
CLASS I – AATIX CLASS S - AATSX
________________________
MINIMUM INITIAL INVESTMENT:
CLASS I – $5,000 CLASS S – $1,500,000
* As of December 31, 2019
TOP HOLDINGS: DECEMBER 31, 2019 (d)
NAME % OF NET
ASSETS Arcosa, Inc. 3.36% Voya Financial, Inc. 3.30% Arconic, Inc. 2.89% MDU Resources Group, Inc. 2.69% Raymond James Financial Services, Inc. 2.54% PotlatchDeltic Corp. 2.39% Masco Corp. 2.35% Henry Schein, Inc. 2.27% Platform Specialty Products Corp. 2.24% Park Hotels & Resorts, Inc. 2.20%
SECTOR DIVERSIFICATION: DECEMBER 31, 2019 (d)
NAME % OF TOTAL
INVESTMENTS Industrials 21.90% Consumer Discretionary 15.34% Financials 13.37% Health Care 10.96% Real Estate 8.94% Communication Services 7.47% Utilities 6.06% Consumer Staples 4.80% Information Technology 4.72% Materials 3.42% Energy 2.23% Money Market Funds 0.80%
ANCORA /THELEN SMALL-MID CAP FUND PERFORMANCE ILLUSTRATION (UNAUDITED)
9
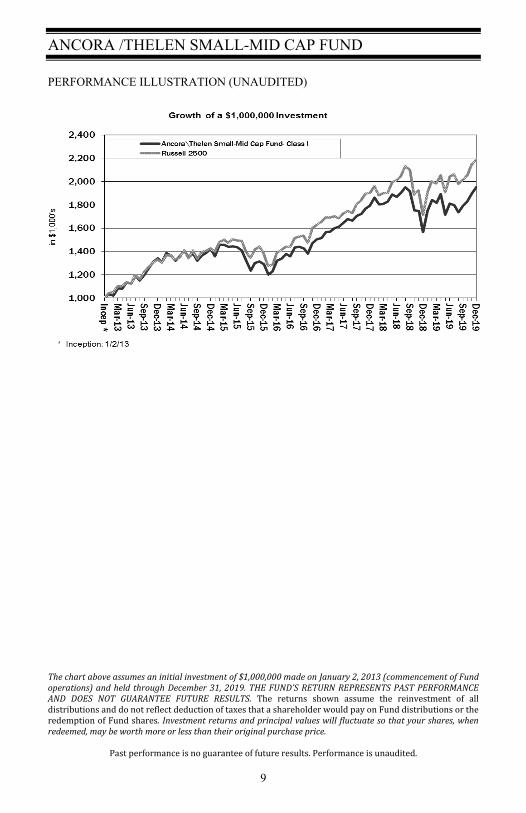
The chart above assumes an initial investment of $1,000,000 made on January 2, 2013 (commencement of Fund operations) and held through December 31, 2019. THE FUND’S RETURN REPRESENTS PAST PERFORMANCE AND DOES NOT GUARANTEE FUTURE RESULTS. The returns shown assume the reinvestment of all distributions and do not reflect deduction of taxes that a shareholder would pay on Fund distributions or the redemption of Fund shares. Investment returns and principal values will fluctuate so that your shares, when redeemed, may be worth more or less than their original purchase price.
Past performance is no guarantee of future results. Performance is unaudited.
ANCORA /THELEN SMALL-MID CAP FUND SCHEDULE OF INVESTMENTS as of December 31, 2019
10
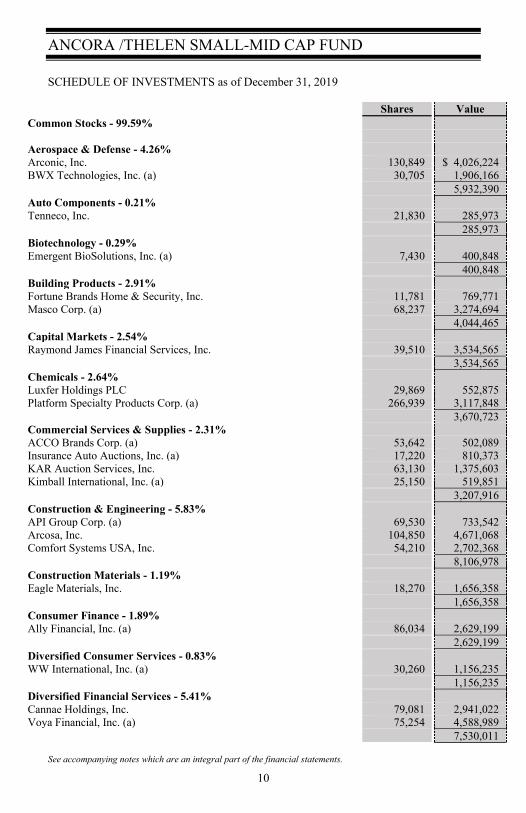
Shares Value Common Stocks - 99.59% Aerospace & Defense - 4.26% Arconic, Inc. 130,849 $ 4,026,224 BWX Technologies, Inc. (a) 30,705 1,906,166 5,932,390 Auto Components - 0.21% Tenneco, Inc. 21,830 285,973 285,973 Biotechnology - 0.29% Emergent BioSolutions, Inc. (a) 7,430 400,848 400,848 Building Products - 2.91% Fortune Brands Home & Security, Inc. 11,781 769,771 Masco Corp. (a) 68,237 3,274,694 4,044,465 Capital Markets - 2.54% Raymond James Financial Services, Inc. 39,510 3,534,565 3,534,565 Chemicals - 2.64% Luxfer Holdings PLC 29,869 552,875 Platform Specialty Products Corp. (a) 266,939 3,117,848 3,670,723 Commercial Services & Supplies - 2.31% ACCO Brands Corp. (a) 53,642 502,089 Insurance Auto Auctions, Inc. (a) 17,220 810,373 KAR Auction Services, Inc. 63,130 1,375,603 Kimball International, Inc. (a) 25,150 519,851 3,207,916 Construction & Engineering - 5.83% API Group Corp. (a) 69,530 733,542 Arcosa, Inc. 104,850 4,671,068 Comfort Systems USA, Inc. 54,210 2,702,368 8,106,978 Construction Materials - 1.19% Eagle Materials, Inc. 18,270 1,656,358 1,656,358 Consumer Finance - 1.89% Ally Financial, Inc. (a) 86,034 2,629,199 2,629,199 Diversified Consumer Services - 0.83% WW International, Inc. (a) 30,260 1,156,235 1,156,235 Diversified Financial Services - 5.41% Cannae Holdings, Inc. 79,081 2,941,022 Voya Financial, Inc. (a) 75,254 4,588,989 7,530,011
See accompanying notes which are an integral part of the financial statements.

ANCORA /THELEN SMALL-MID CAP FUND SCHEDULE OF INVESTMENTS as of December 31, 2019 (CONTINUED)
11
Shares Value Diversified Telecommunication Services - 0.76% Iridium Communications, Inc. (a) 43,080 $ 1,061,491 1,061,491 Electrical Equipment - 0.98% MasTec, Inc. (a) 11,100 712,176 nVent Electric Plc. 25,360 648,709 1,360,885 Electrical Equipment, Instruments & Comp - 0.32% Kimball Electronics, Inc. (a) 25,295 443,927 443,927 Energy Equipment & Services-0.3% KLX Energy Services Holdings, Inc. (a) 65,187 419,804 419,804 Equity Real Estate Investment Trusts - 8.98% Alpine Income Property Trust, Inc. 36,245 689,742 Cyrusone, Inc. (a) 20,390 1,334,118 Gaming and Leisure Properties, Inc. 48,970 2,108,159 JBG SMITH Properties (a) 49,390 1,970,167 Park Hotels & Resorts, Inc. (a) 118,561 3,067,173 PotlatchDeltic Corp. 76,850 3,325,300 12,494,659 Food Products - 4.07% Nomad Foods, Ltd. 114,762 2,567,226 Post Holdings, Inc. (a) 9,860 1,075,726 TreeHouse Foods, Inc. (a) 41,662 2,020,607 5,663,559 Gas Utilities - 1.84% ONE Gas, Inc. (a) 8,720 815,930 South Jersey Industries, Inc. (a) 30,989 1,022,017 UGI Corp. 15,867 716,554 2,554,501 Health Care Equipment & Supplies - 3.47% Utah Medical Products, Inc. (a) 17,934 1,935,079 Varex Imanging Corp. 24,660 735,115 Varian Medical Systems, Inc. 15,210 2,159,972 4,830,166 Health Care Providers & Services - 4.93% BioTelemetry, Inc. 29,540 1,367,702 Corvel Corp. 11,335 990,226 Henry Schein, Inc. (a) 47,420 3,163,862 The Pennant Group, Inc. (a) 40,652 1,344,362 6,866,152 Health Care Technology - 0.42% Simulations Plus, Inc. (a) 20,335 591,138 591,138
See accompanying notes which are an integral part of the financial statements.

ANCORA /THELEN SMALL-MID CAP FUND SCHEDULE OF INVESTMENTS as of December 31, 2019 (CONTINUED)
12
Shares Value Hotels, Restaurants & Leisure - 6.81% Brinker International, Inc. 18,568 $ 779,856 Dine Brands Global, Inc. 9,066 757,192 Eldorado Resorts, Inc. (a) 39,819 2,374,805 J. Alexander's Holdings, Inc. C (c) 95,077 908,936 Marriott Vacations Worldwide Corp. 15,350 1,976,466 Wyndham Hotels & Resorts, Inc. 42,740 2,684,499 9,481,754 Household Products - 0.75% Energizer Holdings, Inc. (a) 20,865 1,047,840 1,047,840 IT Services - 4.42% Black Knight, Inc. 17,652 1,138,201 Leidos Holdings, Inc. (a) 30,906 3,025,388 Perspecta, Inc. (a) 74,920 1,980,885 6,144,474 Independent Power and Renewable - 1.56% Vistra Energy Corp. 94,350 2,169,107 2,169,107 Internet & Catalog Retail - 1.12% GCI Liberty, Inc. Class A (a) 21,941 1,554,520 1,554,520 Internet Software & Services - 0.18% Points International, Ltd. (a) 16,276 248,290 248,290 Leisure Products - 0.73% Brunswick Corp. 16,980 1,018,460 1,018,460 Life Sciences Tools & Services - 1.88% Charles River Laboratories International, Inc. (a) 17,150 2,619,834 2,619,834 Machinery - 4.29% Harsco Corp. (a) 17,730 407,967 Pentair Plc (a) 57,691 2,646,286 SPX Corp. (a) 57,295 2,915,170 5,969,423 Media - 5.62% Cumulus Media, Inc. (a) 72,079 1,266,428 iHeartMedia, Inc. (a) 44,210 747,149 Liberty Braves Group Series C 77,809 2,298,478 Liberty SiriusXM Group Series C 36,267 1,745,893 Marchex, Inc. 131,190 495,898 Meredith Corp. 25,880 840,324 ViacomCBS, Inc. 10,000 419,700 7,813,870 Multi-Utilities -2.69% MDU Resources Group, Inc. 125,880 3,739,895 3,739,895
See accompanying notes which are an integral part of the financial statements.

ANCORA /THELEN SMALL-MID CAP FUND SCHEDULE OF INVESTMENTS as of December 31, 2019 (CONTINUED)
13
Shares Value Oil, Gas & Consumable Fuels - 1.93% Amplify Energy Corp. 87,440 $ 577,978 Arch Coal, Inc. (a) 7,430 533,028 Cabot Oil & Gas Corp. 90,599 1,577,329 2,688,335 Specialty Retail - 1.94% Citi Trends, Inc. 34,594 799,813 Guess, Inc. 15,000 335,700 Urban Outfitters, Inc. (a) 56,347 1,564,756 2,700,269 Textiles, Apparel, & Luxury Goods - 4.7% Kontoor Brands, Inc. 63,890 2,682,741 Vera Bradley, Inc. (a) 101,195 1,194,101 Wolverine World Wide, Inc. 78,721 2,656,047 6,532,889 Thrifts & Mortgage Finance - 3.58% Columbia Financial, Inc. (a) 177,523 3,007,240 Kearny Financial Corp. (a) 142,606 1,972,241 4,979,481 Trading Companies & Distributors - 1.02% HD Supply Holdings, Inc. (a) 12,360 497,119 Transcat, Inc. (a) 28,925 921,550 1,418,669 TOTAL COMMON STOCKS (Cost $113,343,784) 138,569,053 Money Market Funds - 0.81% First American Funds Government Obligation Class Y 0.89% (b) 1,120,504 1,120,504 1,120,504 TOTAL MONEY MARKET FUNDS (Cost $1,120,504) 1,120,504 TOTAL INVESTMENTS (Cost $114,464,288) 100.39% 139,689,557 Liabilities In Excess of Other Assets - (0.39)% (547,830) TOTAL NET ASSETS - 100.00% $139,141,727
(a) Non-Income producing. (b) Variable rate security; the coupon rate shown represents the 7-day yield as of December 31, 2019. (c) Adviser owns more than 5% of the outstanding voting shares of the company and is considered an affiliated security. See accompanying notes which are an integral part of the financial statements.

ANCORA MICROCAP FUND
14
INVESTMENT OBJECTIVE:
THE ANCORA MICROCAP FUND SEEKS TO OBTAIN CAPITAL
APPRECIATION.
TOTAL RETURNS: DECEMBER 31, 2019 (d)
ONE YEAR
THREE YEARS
FIVE YEARS
TEN YEARS
SINCE INCEP(a)
ANCORA MICROCAP FUND - I(b) 11.09% 0.58% 1.66% 8.85% 7.57% RUSSELL MICROCAP INDEX(c) 22.43% 6.39% 6.57% 11.26% 8.25%
a) Inception data reflects the annualized return since 09/02/08. b) Return figures reflect any change in price per share and assume the reinvestment of all distributions. c) The Russell Microcap Index measures the performance of the Microcap segment of the U.S. equity market. It
makes up less than 3% of the U.S. equity market. It includes 1,000 of the smallest securities in the small-cap Russell 2000 Index based on a combination of their market cap and current index membership. If you were to purchase the securities that make up this index, your return would be lower once fees and/or commissions are deducted.
d) Data is unaudited. The performance quoted represents past performance, which does not guarantee future results. The investment return and principal value of an investment will fluctuate so that an investor’s shares, when redeemed, may be worth more or less than their original cost. The returns shown do not reflect deduction of taxes that a shareholder would pay on Fund distributions or the redemption of Fund shares. Current performance of the Fund may be lower or higher than the performance quoted. The Fund’s investment objectives, risks, charges and expenses must be considered carefully before investing. Performance data current to the most recent month end may be obtained by calling 1-866-626-2672.
PORTFOLIO MANAGER:
Michael Santelli Managing Director – Microcap
Equities, Ancora Advisors
_________________________
NET ASSETS:
$18.6 MILLION* _________________________
INCEPTION DATE:
SEPTEMBER 2, 2008 _________________________
TICKERS:
CLASS I – ANCIX
________________________
MINIMUM INITIAL INVESTMENT:
CLASS I – $5,000 * As of December 31, 2019
TOP HOLDINGS: DECEMBER 31, 2019 (d)
NAME % OF NET
ASSETS Vaalco Energy, Inc. 3.17% Adams Resources & Energy, Inc. 3.07% Amtech Systems, Inc. 2.95% Lakeland Industries, Inc. 2.94% ZAGG, Inc. 2.70% INTEVAC, Inc. 2.59% Perma-Fix Environmental Services, Inc. 2.33% COWEN, Inc. 2.27% First American Funds Gov’t Obligation Class Y 0.89% 2.27% First Internet Bancorp 2.24%
SECTOR DIVERSIFICATION: DECEMBER 31, 2019 (d)
NAME % OF TOTAL
INVESTMENTS Information Technology 20.40% Industrials 18.21% Financials 16.55% Consumer Discretionary 12.94% Energy 12.01% Materials 5.10% Health Care 4.71% Consumer Staples 3.92% Communication Services 2.27% Money Market Funds 2.27% Real Estate 1.61%

ANCORA MICROCAP FUND PERFORMANCE ILLUSTRATION (UNAUDITED)
15
The chart above assumes an initial investment of $10,000 made on September 2, 2008 (commencement of Fund operations) and held through December 31, 2019. THE FUND’S RETURN REPRESENTS PAST PERFORMANCE AND DOES NOT GUARANTEE FUTURE RESULTS. The returns shown assume the reinvestment of all distributions and do not reflect deduction of taxes that a shareholder would pay on Fund distributions or the redemption of Fund shares. Investment returns and principal values will fluctuate so that your shares, when redeemed, may be worth more or less than their original purchase price.
Past performance is no guarantee of future results. Performance is unaudited.
ANCORA MICROCAP FUND SCHEDULE OF INVESTMENTS as of December 31, 2019
16
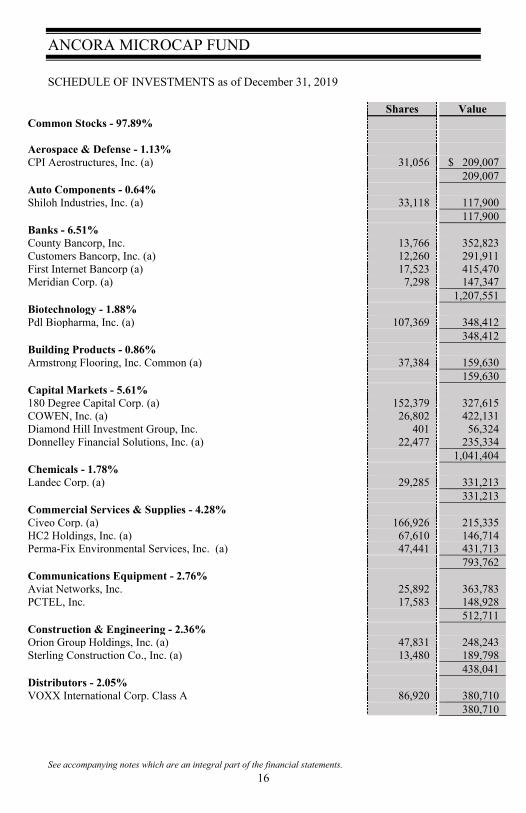
Shares Value Common Stocks - 97.89% Aerospace & Defense - 1.13% CPI Aerostructures, Inc. (a) 31,056 $ 209,007
209,007 Auto Components - 0.64% Shiloh Industries, Inc. (a) 33,118 117,900
117,900 Banks - 6.51% County Bancorp, Inc. 13,766 352,823 Customers Bancorp, Inc. (a) 12,260 291,911 First Internet Bancorp (a) 17,523 415,470 Meridian Corp. (a) 7,298 147,347
1,207,551 Biotechnology - 1.88% Pdl Biopharma, Inc. (a) 107,369 348,412
348,412 Building Products - 0.86% Armstrong Flooring, Inc. Common (a) 37,384 159,630
159,630 Capital Markets - 5.61% 180 Degree Capital Corp. (a) 152,379 327,615 COWEN, Inc. (a) 26,802 422,131 Diamond Hill Investment Group, Inc. 401 56,324 Donnelley Financial Solutions, Inc. (a) 22,477 235,334
1,041,404 Chemicals - 1.78% Landec Corp. (a) 29,285 331,213
331,213 Commercial Services & Supplies - 4.28% Civeo Corp. (a) 166,926 215,335 HC2 Holdings, Inc. (a) 67,610 146,714 Perma-Fix Environmental Services, Inc. (a) 47,441 431,713
793,762 Communications Equipment - 2.76% Aviat Networks, Inc. 25,892 363,783 PCTEL, Inc. 17,583 148,928
512,711 Construction & Engineering - 2.36% Orion Group Holdings, Inc. (a) 47,831 248,243 Sterling Construction Co., Inc. (a) 13,480 189,798
438,041 Distributors - 2.05% VOXX International Corp. Class A 86,920 380,710
380,710 See accompanying notes which are an integral part of the financial statements.
ANCORA MICROCAP FUND SCHEDULE OF INVESTMENTS as of December 31, 2019 (CONTINUED)
17
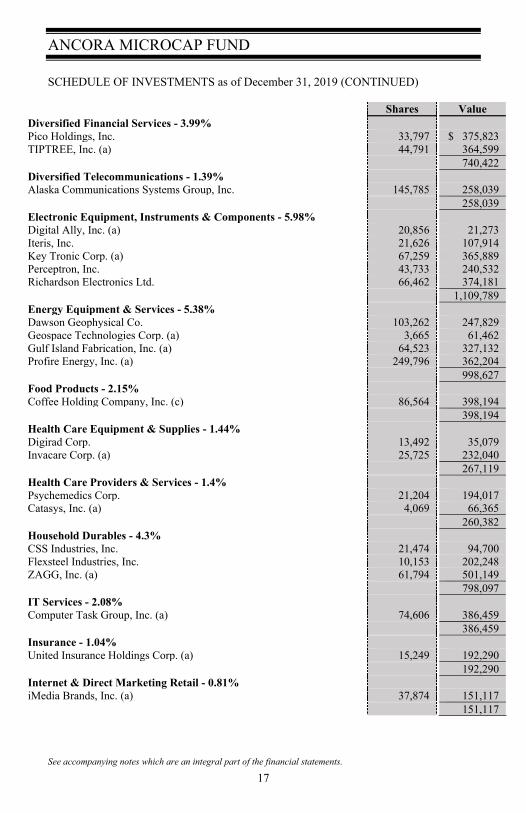
Shares Value Diversified Financial Services - 3.99% Pico Holdings, Inc. 33,797 $ 375,823 TIPTREE, Inc. (a) 44,791 364,599
740,422 Diversified Telecommunications - 1.39% Alaska Communications Systems Group, Inc. 145,785 258,039
258,039 Electronic Equipment, Instruments & Components - 5.98% Digital Ally, Inc. (a) 20,856 21,273 Iteris, Inc. 21,626 107,914 Key Tronic Corp. (a) 67,259 365,889 Perceptron, Inc. 43,733 240,532 Richardson Electronics Ltd. 66,462 374,181
1,109,789 Energy Equipment & Services - 5.38% Dawson Geophysical Co. 103,262 247,829 Geospace Technologies Corp. (a) 3,665 61,462 Gulf Island Fabrication, Inc. (a) 64,523 327,132 Profire Energy, Inc. (a) 249,796 362,204
998,627 Food Products - 2.15% Coffee Holding Company, Inc. (c) 86,564 398,194
398,194 Health Care Equipment & Supplies - 1.44% Digirad Corp. 13,492 35,079 Invacare Corp. (a) 25,725 232,040
267,119 Health Care Providers & Services - 1.4% Psychemedics Corp. 21,204 194,017 Catasys, Inc. (a) 4,069 66,365
260,382 Household Durables - 4.3% CSS Industries, Inc. 21,474 94,700 Flexsteel Industries, Inc. 10,153 202,248 ZAGG, Inc. (a) 61,794 501,149
798,097 IT Services - 2.08% Computer Task Group, Inc. (a) 74,606 386,459
386,459 Insurance - 1.04% United Insurance Holdings Corp. (a) 15,249 192,290
192,290 Internet & Direct Marketing Retail - 0.81% iMedia Brands, Inc. (a) 37,874 151,117
151,117 See accompanying notes which are an integral part of the financial statements.
ANCORA MICROCAP FUND SCHEDULE OF INVESTMENTS as of December 31, 2019 (CONTINUED)
18
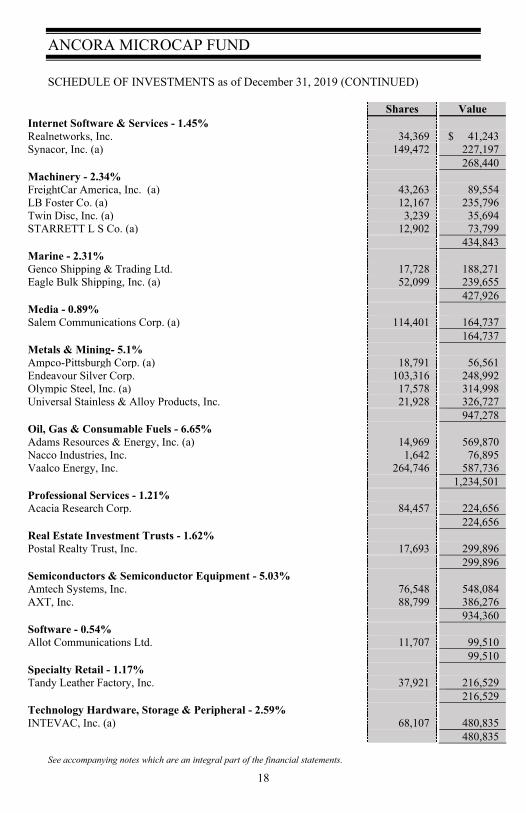
Shares Value Internet Software & Services - 1.45% Realnetworks, Inc. 34,369 $ 41,243 Synacor, Inc. (a) 149,472 227,197
268,440 Machinery - 2.34% FreightCar America, Inc. (a) 43,263 89,554 LB Foster Co. (a) 12,167 235,796 Twin Disc, Inc. (a) 3,239 35,694 STARRETT L S Co. (a) 12,902 73,799
434,843 Marine - 2.31% Genco Shipping & Trading Ltd. 17,728 188,271 Eagle Bulk Shipping, Inc. (a) 52,099 239,655
427,926 Media - 0.89% Salem Communications Corp. (a) 114,401 164,737
164,737 Metals & Mining- 5.1% Ampco-Pittsburgh Corp. (a) 18,791 56,561 Endeavour Silver Corp. 103,316 248,992 Olympic Steel, Inc. (a) 17,578 314,998 Universal Stainless & Alloy Products, Inc. 21,928 326,727
947,278 Oil, Gas & Consumable Fuels - 6.65% Adams Resources & Energy, Inc. (a) 14,969 569,870 Nacco Industries, Inc. 1,642 76,895 Vaalco Energy, Inc. 264,746 587,736
1,234,501 Professional Services - 1.21% Acacia Research Corp. 84,457 224,656
224,656 Real Estate Investment Trusts - 1.62% Postal Realty Trust, Inc. 17,693 299,896
299,896 Semiconductors & Semiconductor Equipment - 5.03% Amtech Systems, Inc. 76,548 548,084 AXT, Inc. 88,799 386,276
934,360 Software - 0.54% Allot Communications Ltd. 11,707 99,510
99,510 Specialty Retail - 1.17% Tandy Leather Factory, Inc. 37,921 216,529
216,529 Technology Hardware, Storage & Peripheral - 2.59% INTEVAC, Inc. (a) 68,107 480,835
480,835 See accompanying notes which are an integral part of the financial statements.
ANCORA MICROCAP FUND SCHEDULE OF INVESTMENTS as of December 31, 2019 (CONTINUED)
19
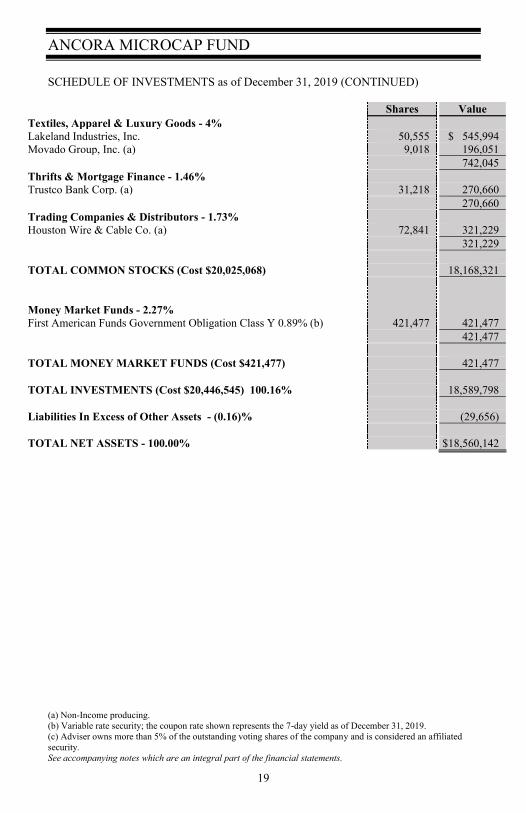
Shares Value Textiles, Apparel & Luxury Goods - 4% Lakeland Industries, Inc. 50,555 $ 545,994 Movado Group, Inc. (a) 9,018 196,051
742,045 Thrifts & Mortgage Finance - 1.46% Trustco Bank Corp. (a) 31,218 270,660
270,660 Trading Companies & Distributors - 1.73% Houston Wire & Cable Co. (a) 72,841 321,229
321,229
TOTAL COMMON STOCKS (Cost $20,025,068) 18,168,321
Money Market Funds - 2.27% First American Funds Government Obligation Class Y 0.89% (b) 421,477 421,477
421,477
TOTAL MONEY MARKET FUNDS (Cost $421,477) 421,477
TOTAL INVESTMENTS (Cost $20,446,545) 100.16% 18,589,798
Liabilities In Excess of Other Assets - (0.16)% (29,656)
TOTAL NET ASSETS - 100.00% $18,560,142 (a) Non-Income producing. (b) Variable rate security; the coupon rate shown represents the 7-day yield as of December 31, 2019. (c) Adviser owns more than 5% of the outstanding voting shares of the company and is considered an affiliated security. See accompanying notes which are an integral part of the financial statements.

ANCORA SPECIAL OPPORTUNITY FUND
20
INVESTMENT OBJECTIVE:
THE ANCORA SPECIAL OPPORTUNITY FUND SEEKS TO PROVIDE
INVESTORS A HIGH TOTAL RETURN, BY INVESTING IN COMPANIES WITH THE
POTENTIAL FOR SUPERIOR RETURNS.
TOTAL RETURNS: DECEMBER 31, 2019 (d)
ONE YEAR
THREE YEARS
FIVE YEARS
TEN YEARS
SINCE INCEP(a)
ANCORA SPECIAL OPPORTUNITY FUND - I(b) 29.46% 9.81% 8.55% 9.70% 7.27% WILSHIRE 5000 INDEX(c) 31.02% 14.52% 11.38% 13.44% 9.25%
a) Inception data reflects the annualized return since 01/05/04. b) Return figures reflect any change in price per share and assume the reinvestment of all distributions. c) The Wilshire 5000 Index measures the performance of all U.S. equity securities with readily available price data. Over
5,000 capitalization weighted security returns are used to adjust the index. It is market-value weighted (stock price times number of shares outstanding), with each stock’s weighting in the Index proportionate to its market value and not available for purchase. If you were to purchase the securities that make up this index, your returns would be lower once fees and/or commissions are deducted.
d) Data is unaudited.
The performance quoted represents past performance, which does not guarantee future results. The investment return and principal value of an investment will fluctuate so that an investor’s shares, when redeemed, may be worth more or less than their original cost. The returns shown do not reflect deduction of taxes that a shareholder would pay on Fund distributions or the redemption of Fund shares. Current performance of the Fund may be lower or higher than the performance quoted. The Fund’s investment objectives, risks, charges and expenses must be considered carefully before investing. Performance data current to the most recent month end may be obtained by calling 1-866-626-2672.
PORTFOLIO MANAGER:
Richard A. Barone Portfolio Manager, Ancora
Advisors _________________________
NET ASSETS:
$18.3 MILLION*
_________________________
INCEPTION DATE:
JANUARY 5, 2004 _________________________
TICKERS:
CLASS I – ANSIX
________________________
MINIMUM INITIAL INVESTMENT:
CLASS I – $5,000 * As of December 31, 2019
TOP HOLDINGS: DECEMBER 31, 2019 (d)
NAME % OF NET
ASSETS First American Funds Gov’t Obligation Class Y 0.89% 18.12% Bed Bath & Beyond, Inc. 3.98% Dividend and Income Fund 3.69% iShares Russell 2000 Value ETF 3.52% DuPont de Nemours, Inc. 3.52% Bristol-Myers Squibb Co. 3.52% Mace Security International, Inc. 3.42% iShares Core S&P Mid-Cap ETF 3.38% Boulder Growth & Income Fund, Inc. 3.23% Manning & Napier, Inc. 3.09%
SECTOR DIVERSIFICATION: DECEMBER 31, 2019 (d)
NAME % OF TOTAL
INVESTMENTS Financials 19.19% Money Market Funds 18.20% Investment Companies 16.34% Information Technology 9.06% Consumer Discretionary 8.35% Materials 7.68% Health Care 6.92% Industrials 6.80% Energy 3.78% Communication Services 2.31% Real Estate 1.38%

ANCORA SPECIAL OPPORTUNITY FUND PERFORMANCE ILLUSTRATION (UNAUDITED)
21
500
1,000
1,500
2,000
2,500
3,000
3,500
4,000
4,500
Ince
p *
Jun
-04
De
c-0
4
Jun
-05
De
c-0
5
Jun
-06
De
c-0
6
Jun
-07
De
c-0
7
Jun
-08
De
c-0
8
Jun
-09
De
c-0
9
Jun
-10
De
c-1
0
Jun
-11
De
c-1
1
Jun
-12
De
c-1
2
Jun
-13
De
c-1
3
Jun
-14
De
c-1
4
Jun
-15
De
c-1
5
Jun
-16
De
c-1
6
Jun
-17
De
c-1
7
Jun
-18
De
c-1
8
Jun
-19
De
c-1
9
in $
1,0
00
's
* Inception: 1/5/04
Growth of a $10,000 Investment
Ancora Special Opportunity Fund - Class I Wilshire 5000 Index
The chart above assumes an initial investment of $10,000 made on January 5, 2004 (commencement of Fund operations) and held through December 31, 2019. THE FUND’S RETURN REPRESENTS PAST PERFORMANCE AND DOES NOT GUARANTEE FUTURE RESULTS. The returns shown assume the reinvestment of all distributions and do not reflect deduction of taxes that a shareholder would pay on Fund distributions or the redemption of Fund shares. Investment returns and principal values will fluctuate so that your shares, when redeemed, may be worth more or less than their original purchase price.
Past performance is no guarantee of future results. Performance is unaudited.
ANCORA SPECIAL OPPORTUNITY FUND SCHEDULE OF INVESTMENTS as of December 31, 2019
22
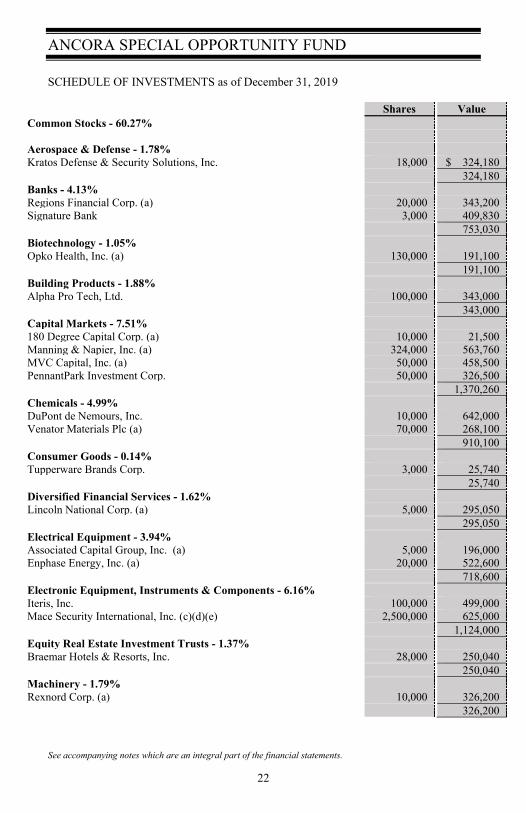
Shares Value Common Stocks - 60.27% Aerospace & Defense - 1.78% Kratos Defense & Security Solutions, Inc. 18,000 $ 324,180 324,180 Banks - 4.13% Regions Financial Corp. (a) 20,000 343,200 Signature Bank 3,000 409,830 753,030 Biotechnology - 1.05% Opko Health, Inc. (a) 130,000 191,100 191,100 Building Products - 1.88% Alpha Pro Tech, Ltd. 100,000 343,000 343,000 Capital Markets - 7.51% 180 Degree Capital Corp. (a) 10,000 21,500 Manning & Napier, Inc. (a) 324,000 563,760 MVC Capital, Inc. (a) 50,000 458,500 PennantPark Investment Corp. 50,000 326,500 1,370,260 Chemicals - 4.99% DuPont de Nemours, Inc. 10,000 642,000 Venator Materials Plc (a) 70,000 268,100 910,100 Consumer Goods - 0.14% Tupperware Brands Corp. 3,000 25,740 25,740 Diversified Financial Services - 1.62% Lincoln National Corp. (a) 5,000 295,050 295,050 Electrical Equipment - 3.94% Associated Capital Group, Inc. (a) 5,000 196,000 Enphase Energy, Inc. (a) 20,000 522,600 718,600 Electronic Equipment, Instruments & Components - 6.16% Iteris, Inc. 100,000 499,000 Mace Security International, Inc. (c)(d)(e) 2,500,000 625,000 1,124,000 Equity Real Estate Investment Trusts - 1.37% Braemar Hotels & Resorts, Inc. 28,000 250,040 250,040 Machinery - 1.79% Rexnord Corp. (a) 10,000 326,200 326,200
See accompanying notes which are an integral part of the financial statements.
ANCORA SPECIAL OPPORTUNITY FUND SCHEDULE OF INVESTMENTS as of December 31, 2019 (CONTINUED)
23
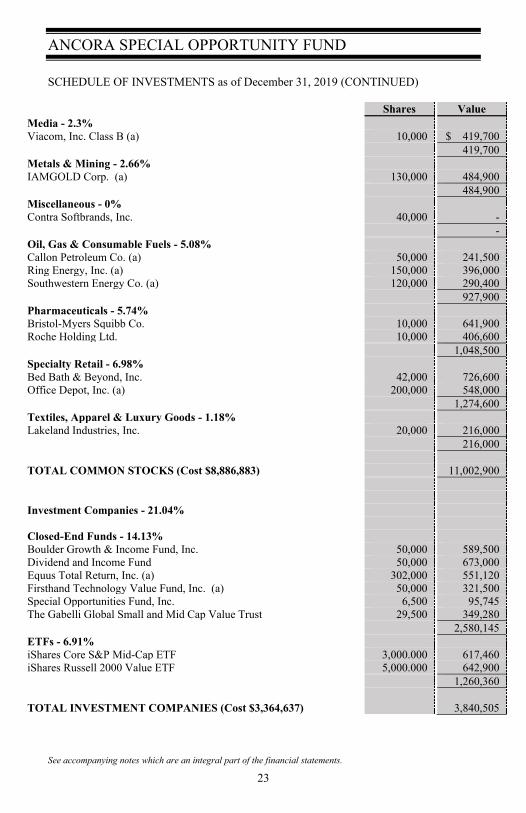
Shares Value Media - 2.3% Viacom, Inc. Class B (a) 10,000 $ 419,700 419,700 Metals & Mining - 2.66% IAMGOLD Corp. (a) 130,000 484,900 484,900 Miscellaneous - 0% Contra Softbrands, Inc. 40,000 - - Oil, Gas & Consumable Fuels - 5.08% Callon Petroleum Co. (a) 50,000 241,500 Ring Energy, Inc. (a) 150,000 396,000 Southwestern Energy Co. (a) 120,000 290,400 927,900 Pharmaceuticals - 5.74% Bristol-Myers Squibb Co. 10,000 641,900 Roche Holding Ltd. 10,000 406,600 1,048,500 Specialty Retail - 6.98% Bed Bath & Beyond, Inc. 42,000 726,600 Office Depot, Inc. (a) 200,000 548,000 1,274,600 Textiles, Apparel & Luxury Goods - 1.18% Lakeland Industries, Inc. 20,000 216,000 216,000 TOTAL COMMON STOCKS (Cost $8,886,883) 11,002,900 Investment Companies - 21.04% Closed-End Funds - 14.13% Boulder Growth & Income Fund, Inc. 50,000 589,500 Dividend and Income Fund 50,000 673,000 Equus Total Return, Inc. (a) 302,000 551,120 Firsthand Technology Value Fund, Inc. (a) 50,000 321,500 Special Opportunities Fund, Inc. 6,500 95,745 The Gabelli Global Small and Mid Cap Value Trust 29,500 349,280 2,580,145 ETFs - 6.91% iShares Core S&P Mid-Cap ETF 3,000.000 617,460 iShares Russell 2000 Value ETF 5,000.000 642,900 1,260,360 TOTAL INVESTMENT COMPANIES (Cost $3,364,637) 3,840,505
See accompanying notes which are an integral part of the financial statements.
ANCORA SPECIAL OPPORTUNITY FUND SCHEDULE OF INVESTMENTS as of December 31, 2019 (CONTINUED)
24
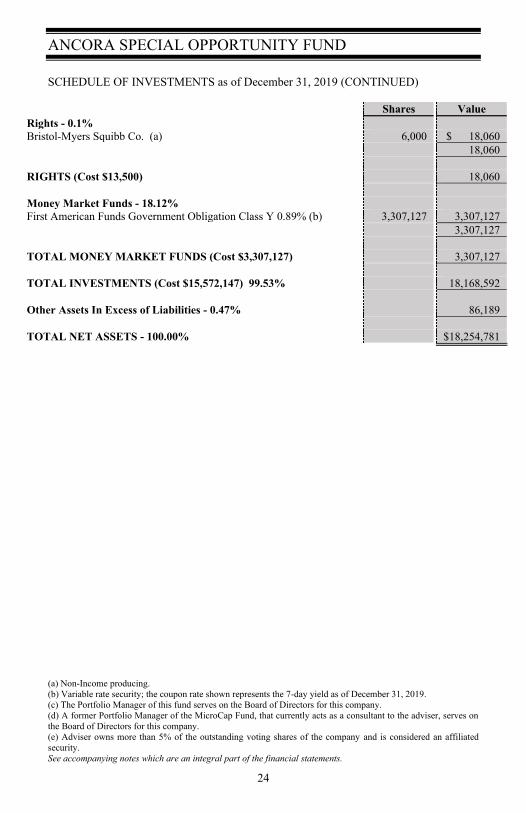
Shares Value Rights - 0.1% Bristol-Myers Squibb Co. (a) 6,000 $ 18,060 18,060 RIGHTS (Cost $13,500) 18,060 Money Market Funds - 18.12% First American Funds Government Obligation Class Y 0.89% (b) 3,307,127 3,307,127 3,307,127 TOTAL MONEY MARKET FUNDS (Cost $3,307,127) 3,307,127 TOTAL INVESTMENTS (Cost $15,572,147) 99.53% 18,168,592 Other Assets In Excess of Liabilities - 0.47% 86,189 TOTAL NET ASSETS - 100.00% $18,254,781
(a) Non-Income producing. (b) Variable rate security; the coupon rate shown represents the 7-day yield as of December 31, 2019. (c) The Portfolio Manager of this fund serves on the Board of Directors for this company. (d) A former Portfolio Manager of the MicroCap Fund, that currently acts as a consultant to the adviser, serves on the Board of Directors for this company. (e) Adviser owns more than 5% of the outstanding voting shares of the company and is considered an affiliated security. See accompanying notes which are an integral part of the financial statements.
ANCORA DIVIDEND VALUE EQUITY FUND
25
INVESTMENT OBJECTIVE:
THE ANCORA DIVIDEND VALUE EQUITY FUND SEEKS TO PROVIDE
GROWTH OF INCOME AND LONG-TERM CAPITAL APPRECIATION.
TOTAL RETURNS: DECEMBER 31, 2019 (d)
ONE
MONTH THREE
MONTHS SIX
MONTHS SINCE
INCEP(a) ANCORA DIVIDEND VALUE EQUITY - I(b) 2.71% 7.91% 10.55% 12.98% RUSSELL 1000 VALUE INDEX(c) 2.75% 7.41% 8.86% 9.84%
a) Inception data reflects the return since 05/07/2019. b) Return figures reflect any change in price per share and assume the reinvestment of all distributions. c) The Russell 1000 Value Index is designed to be a measure of the large and mid-sized capitalization companies in the
United States equities market. The index is a composite of roughly 1,000 securities issued by the largest companies in the U.S. in terms of market capitalization. The Russell 1000 Value Index is a subset of the securities found in the Russell 1000.
d) Data is unaudited. The performance quoted represents past performance, which does not guarantee future results. The investment return and principal value of an investment will fluctuate so that an investor’s shares, when redeemed, may be worth more or less than their original cost. The returns shown do not reflect deduction of taxes that a shareholder would pay on Fund distributions or the redemption of Fund shares. Current performance of the Fund may be lower or higher than the performance quoted. The Fund’s investment objectives, risks, charges and expenses must be considered carefully before investing. Performance data current to the most recent month end may be obtained by calling 1-866-626-2672.
PORTFOLIO MANAGERS:
Sonia Mintun David Sowerby Tom Kennedy
Portfolio Manager, Ancora Advisors
_________________________
NET ASSETS:
$20.8 MILLION* _________________________
INCEPTION DATE:
May 7, 2019
_________________________
TICKERS:
CLASS I – ADEIX ________________________
MINIMUM INITIAL INVESTMENT:
CLASS I – $5,000
* As of December 31, 2019
TOP HOLDINGS: DECEMBER 31, 2019 (d)
NAME % OF NET
ASSETS First American Funds Gov’t Obligation Class Y 0.89% 7.09% Bank of America Corp. 4.63% Citizens Financial Group, Inc. 4.49% Amgen, Inc. 4.42% JP Morgan Chase & Co. 4.16% Johnson & Johnson 4.13% Honeywell International, Inc. 3.99% Chevron Corp. 3.99% Nestlé S.A. 3.92% Marathon Petroleum Corp. 3.71% SECTOR DIVERSIFICATION: DECEMBER 31, 2019 (d)
NAME % OF TOTAL
INVESTMENTS Financials 17.02% Health Care 16.09% Information Technology 15.27% Industrials 9.64% Consumer Staples 9.50% Consumer Discretionary 7.57% Energy 7.17% Money Market Funds 7.08% Communication Services 7.07% Real Estate 2.06% Materials 1.52%

ANCORA DIVIDEND VALUE EQUITY FUND PERFORMANCE ILLUSTRATION (UNAUDITED)
26
The chart above assumes an initial investment of $1,000,000 made on May 7, 2019 (commencement of Fund operations) and held through December 31, 2019. THE FUND’S RETURN REPRESENTS PAST PERFORMANCE AND DOES NOT GUARANTEE FUTURE RESULTS. The returns shown assume the reinvestment of all distributions and do not reflect deduction of taxes that a shareholder would pay on Fund distributions or the redemption of Fund shares. Investment returns and principal values will fluctuate so that your shares, when redeemed, may be worth more or less than their original purchase price. Past performance is no guarantee of future results. Performance is unaudited.

ANCORA DIVIDEND VALUE EQUITY FUND SCHEDULE OF INVESTMENTS as of December 31, 2019
27
Shares Value Common Stocks - 91.19% Aerospace & Defense - 3.39% L3Harris Technologies, Inc. 3,575 $ 707,385 707,385 Banks - 13.28% Bank of America Corp. 27,400 965,028 Citizens Financial Group, Inc. 23,035 935,451 JP Morgan Chase & Co. 6,225 867,765 2,768,244 Beverages - 3.88% Diageo Plc 2,350 395,787 PepsiCo, Inc. 3,025 413,427 809,214 Biotechnology - 4.42% Amgen, Inc. 3,825 922,093 922,093 Capital Markets - 2.23% BlackRock, Inc. 925 464,997 464,997 Chemicals - 2.05% DuPont de Nemours, Inc. 6,650 426,930 426,930 Communications Equipment - 2.58% Cisco Systems, Inc. 11,225 538,351 538,351 Consumer Finance - 1.76% Discover Financial Services 4,325 366,846 366,846 Diversified Telecommunication Services - 3.49% AT&T, Inc. 7,975 311,663 Verizon Communications, Inc. 6,775 415,985 727,648 Electrical Equipment - 2.48% Eaton Corp. Plc 5,450 516,224 516,224 Entertainment - 3.71% Disney Walt Co. 5,350 773,771 773,771 Food Products - 3.92% Nestlé S.A. 7,550 817,363 817,363 Health Care Equipment & Supplies-2.4% Medtronic, Inc. 4,400 499,180 499,180
See accompanying notes which are an integral part of the financial statements.
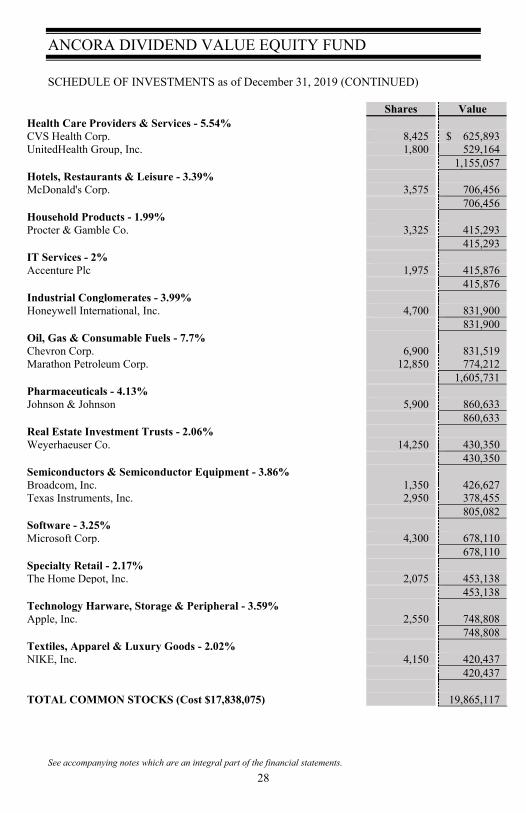
ANCORA DIVIDEND VALUE EQUITY FUND SCHEDULE OF INVESTMENTS as of December 31, 2019 (CONTINUED)
28
Shares Value Health Care Providers & Services - 5.54% CVS Health Corp. 8,425 $ 625,893 UnitedHealth Group, Inc. 1,800 529,164 1,155,057 Hotels, Restaurants & Leisure - 3.39% McDonald's Corp. 3,575 706,456 706,456 Household Products - 1.99% Procter & Gamble Co. 3,325 415,293 415,293 IT Services - 2% Accenture Plc 1,975 415,876 415,876 Industrial Conglomerates - 3.99% Honeywell International, Inc. 4,700 831,900 831,900 Oil, Gas & Consumable Fuels - 7.7% Chevron Corp. 6,900 831,519 Marathon Petroleum Corp. 12,850 774,212 1,605,731 Pharmaceuticals - 4.13% Johnson & Johnson 5,900 860,633 860,633 Real Estate Investment Trusts - 2.06% Weyerhaeuser Co. 14,250 430,350 430,350 Semiconductors & Semiconductor Equipment - 3.86% Broadcom, Inc. 1,350 426,627 Texas Instruments, Inc. 2,950 378,455 805,082 Software - 3.25% Microsoft Corp. 4,300 678,110 678,110 Specialty Retail - 2.17% The Home Depot, Inc. 2,075 453,138 453,138 Technology Harware, Storage & Peripheral - 3.59% Apple, Inc. 2,550 748,808 748,808 Textiles, Apparel & Luxury Goods - 2.02% NIKE, Inc. 4,150 420,437 420,437 TOTAL COMMON STOCKS (Cost $17,838,075) 19,865,117
See accompanying notes which are an integral part of the financial statements.
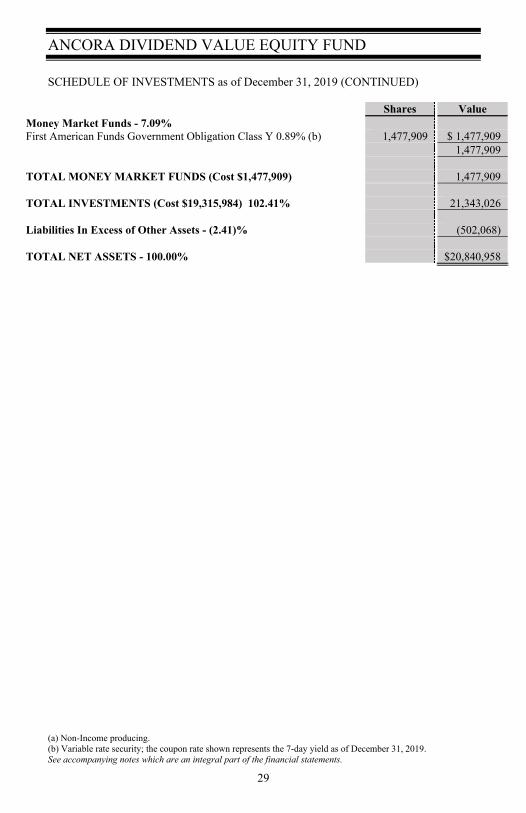
ANCORA DIVIDEND VALUE EQUITY FUND SCHEDULE OF INVESTMENTS as of December 31, 2019 (CONTINUED)
29
Shares Value Money Market Funds - 7.09% First American Funds Government Obligation Class Y 0.89% (b) 1,477,909 $ 1,477,909 1,477,909 TOTAL MONEY MARKET FUNDS (Cost $1,477,909) 1,477,909 TOTAL INVESTMENTS (Cost $19,315,984) 102.41% 21,343,026 Liabilities In Excess of Other Assets - (2.41)% (502,068) TOTAL NET ASSETS - 100.00% $20,840,958
(a) Non-Income producing. (b) Variable rate security; the coupon rate shown represents the 7-day yield as of December 31, 2019. See accompanying notes which are an integral part of the financial statements.
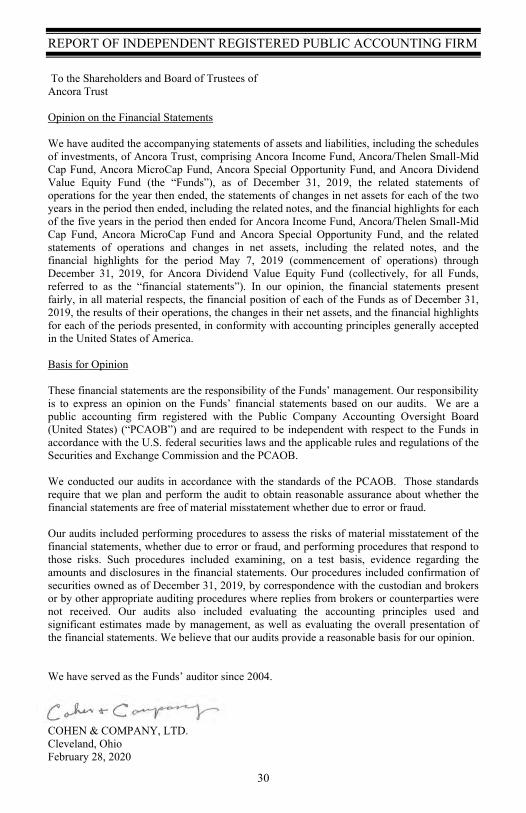
REPORT OF INDEPENDENT REGISTERED PUBLIC ACCOUNTING FIRM
30
To the Shareholders and Board of Trustees of Ancora Trust Opinion on the Financial Statements We have audited the accompanying statements of assets and liabilities, including the schedules of investments, of Ancora Trust, comprising Ancora Income Fund, Ancora/Thelen Small-Mid Cap Fund, Ancora MicroCap Fund, Ancora Special Opportunity Fund, and Ancora Dividend Value Equity Fund (the “Funds”), as of December 31, 2019, the related statements of operations for the year then ended, the statements of changes in net assets for each of the two years in the period then ended, including the related notes, and the financial highlights for each of the five years in the period then ended for Ancora Income Fund, Ancora/Thelen Small-Mid Cap Fund, Ancora MicroCap Fund and Ancora Special Opportunity Fund, and the related statements of operations and changes in net assets, including the related notes, and the financial highlights for the period May 7, 2019 (commencement of operations) through December 31, 2019, for Ancora Dividend Value Equity Fund (collectively, for all Funds, referred to as the “financial statements”). In our opinion, the financial statements present fairly, in all material respects, the financial position of each of the Funds as of December 31, 2019, the results of their operations, the changes in their net assets, and the financial highlights for each of the periods presented, in conformity with accounting principles generally accepted in the United States of America. Basis for Opinion These financial statements are the responsibility of the Funds’ management. Our responsibility is to express an opinion on the Funds’ financial statements based on our audits. We are a public accounting firm registered with the Public Company Accounting Oversight Board (United States) (“PCAOB”) and are required to be independent with respect to the Funds in accordance with the U.S. federal securities laws and the applicable rules and regulations of the Securities and Exchange Commission and the PCAOB. We conducted our audits in accordance with the standards of the PCAOB. Those standards require that we plan and perform the audit to obtain reasonable assurance about whether the financial statements are free of material misstatement whether due to error or fraud. Our audits included performing procedures to assess the risks of material misstatement of the financial statements, whether due to error or fraud, and performing procedures that respond to those risks. Such procedures included examining, on a test basis, evidence regarding the amounts and disclosures in the financial statements. Our procedures included confirmation of securities owned as of December 31, 2019, by correspondence with the custodian and brokers or by other appropriate auditing procedures where replies from brokers or counterparties were not received. Our audits also included evaluating the accounting principles used and significant estimates made by management, as well as evaluating the overall presentation of the financial statements. We believe that our audits provide a reasonable basis for our opinion. We have served as the Funds’ auditor since 2004.
COHEN & COMPANY, LTD. Cleveland, Ohio February 28, 2020
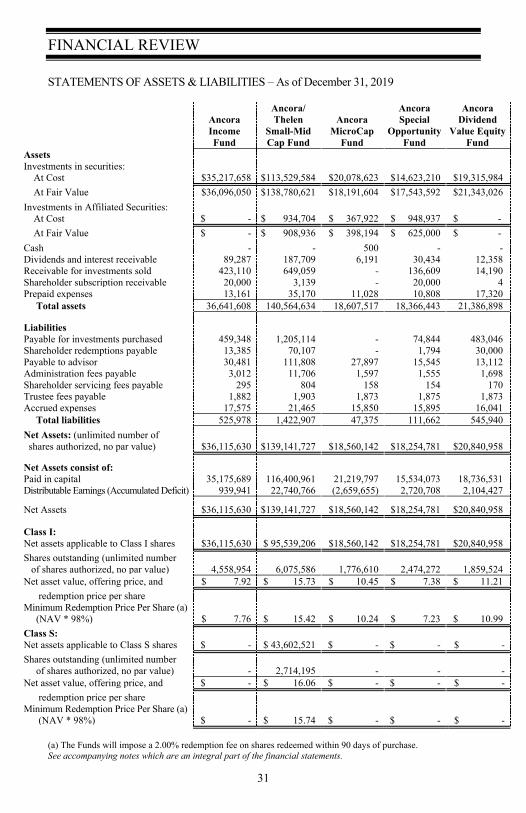
FINANCIAL REVIEW STATEMENTS OF ASSETS & LIABILITIES – As of December 31, 2019
31
Ancora Income Fund
Ancora/ Thelen
Small-Mid Cap Fund
Ancora MicroCap
Fund
Ancora Special
Opportunity Fund
Ancora Dividend
Value Equity Fund
Assets Investments in securities: At Cost $35,217,658 $113,529,584 $20,078,623 $14,623,210 $19,315,984 At Fair Value $36,096,050 $138,780,621 $18,191,604 $17,543,592 $21,343,026 Investments in Affiliated Securities: At Cost $ - $ 934,704 $ 367,922 $ 948,937 $ - At Fair Value $ - $ 908,936 $ 398,194 $ 625,000 $ - Cash - - 500 - - Dividends and interest receivable 89,287 187,709 6,191 30,434 12,358 Receivable for investments sold 423,110 649,059 - 136,609 14,190 Shareholder subscription receivable 20,000 3,139 - 20,000 4 Prepaid expenses 13,161 35,170 11,028 10,808 17,320 Total assets 36,641,608 140,564,634 18,607,517 18,366,443 21,386,898 Liabilities Payable for investments purchased 459,348 1,205,114 - 74,844 483,046 Shareholder redemptions payable 13,385 70,107 - 1,794 30,000 Payable to advisor 30,481 111,808 27,897 15,545 13,112 Administration fees payable 3,012 11,706 1,597 1,555 1,698 Shareholder servicing fees payable 295 804 158 154 170 Trustee fees payable 1,882 1,903 1,873 1,875 1,873 Accrued expenses 17,575 21,465 15,850 15,895 16,041 Total liabilities 525,978 1,422,907 47,375 111,662 545,940
Net Assets: (unlimited number of shares authorized, no par value) $36,115,630 $139,141,727 $18,560,142 $18,254,781 $20,840,958 Net Assets consist of: Paid in capital 35,175,689 116,400,961 21,219,797 15,534,073 18,736,531 Distributable Earnings (Accumulated Deficit) 939,941 22,740,766 (2,659,655) 2,720,708 2,104,427
Net Assets $36,115,630 $139,141,727 $18,560,142 $18,254,781 $20,840,958 Class I: Net assets applicable to Class I shares $36,115,630 $ 95,539,206 $18,560,142 $18,254,781 $20,840,958 Shares outstanding (unlimited number of shares authorized, no par value) 4,558,954 6,075,586 1,776,610 2,474,272 1,859,524 Net asset value, offering price, and $ 7.92 $ 15.73 $ 10.45 $ 7.38 $ 11.21 redemption price per share Minimum Redemption Price Per Share (a) (NAV * 98%) $ 7.76 $ 15.42 $ 10.24 $ 7.23 $ 10.99 Class S: Net assets applicable to Class S shares $ - $ 43,602,521 $ - $ - $ - Shares outstanding (unlimited number of shares authorized, no par value) - 2,714,195 - - - Net asset value, offering price, and $ - $ 16.06 $ - $ - $ - redemption price per share Minimum Redemption Price Per Share (a) (NAV * 98%) $ - $ 15.74 $ - $ - $ -
(a) The Funds will impose a 2.00% redemption fee on shares redeemed within 90 days of purchase. See accompanying notes which are an integral part of the financial statements.
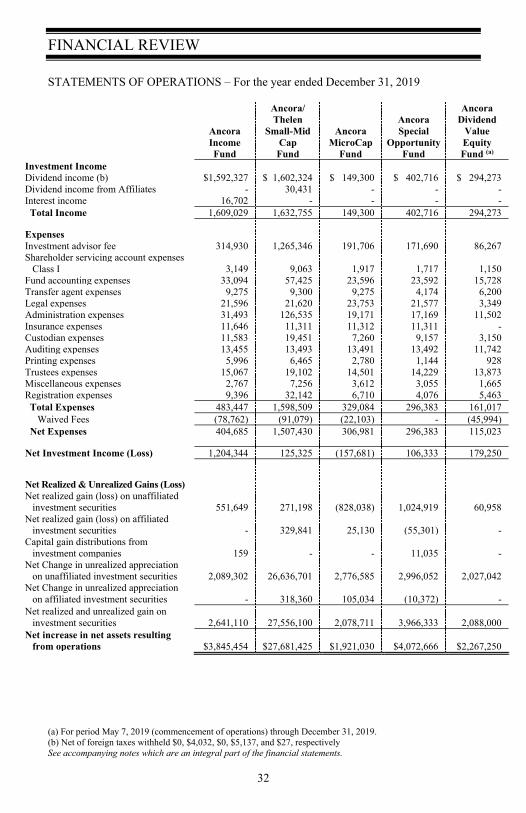
FINANCIAL REVIEW STATEMENTS OF OPERATIONS – For the year ended December 31, 2019
32
Ancora Income Fund
Ancora/ Thelen
Small-Mid Cap Fund
Ancora MicroCap
Fund
Ancora Special
Opportunity Fund
Ancora Dividend
Value Equity Fund (a)
Investment Income Dividend income (b) $1,592,327 $ 1,602,324 $ 149,300 $ 402,716 $ 294,273 Dividend income from Affiliates - 30,431 - - - Interest income 16,702 - - - - Total Income 1,609,029 1,632,755 149,300 402,716 294,273
Expenses Investment advisor fee 314,930 1,265,346 191,706 171,690 86,267 Shareholder servicing account expenses Class I 3,149 9,063 1,917 1,717 1,150 Fund accounting expenses 33,094 57,425 23,596 23,592 15,728 Transfer agent expenses 9,275 9,300 9,275 4,174 6,200 Legal expenses 21,596 21,620 23,753 21,577 3,349 Administration expenses 31,493 126,535 19,171 17,169 11,502 Insurance expenses 11,646 11,311 11,312 11,311 - Custodian expenses 11,583 19,451 7,260 9,157 3,150 Auditing expenses 13,455 13,493 13,491 13,492 11,742 Printing expenses 5,996 6,465 2,780 1,144 928 Trustees expenses 15,067 19,102 14,501 14,229 13,873 Miscellaneous expenses 2,767 7,256 3,612 3,055 1,665 Registration expenses 9,396 32,142 6,710 4,076 5,463 Total Expenses 483,447 1,598,509 329,084 296,383 161,017 Waived Fees (78,762) (91,079) (22,103) - (45,994) Net Expenses 404,685 1,507,430 306,981 296,383 115,023
Net Investment Income (Loss) 1,204,344 125,325 (157,681) 106,333 179,250
Net Realized & Unrealized Gains (Loss) Net realized gain (loss) on unaffiliated investment securities 551,649 271,198 (828,038) 1,024,919 60,958 Net realized gain (loss) on affiliated investment securities - 329,841 25,130 (55,301) - Capital gain distributions from investment companies 159 - - 11,035 - Net Change in unrealized appreciation on unaffiliated investment securities 2,089,302 26,636,701 2,776,585 2,996,052 2,027,042 Net Change in unrealized appreciation on affiliated investment securities - 318,360 105,034 (10,372) - Net realized and unrealized gain on investment securities 2,641,110 27,556,100 2,078,711 3,966,333 2,088,000 Net increase in net assets resulting from operations
$3,845,454
$27,681,425 $1,921,030 $4,072,666 $2,267,250
(a) For period May 7, 2019 (commencement of operations) through December 31, 2019. (b) Net of foreign taxes withheld $0, $4,032, $0, $5,137, and $27, respectively See accompanying notes which are an integral part of the financial statements.
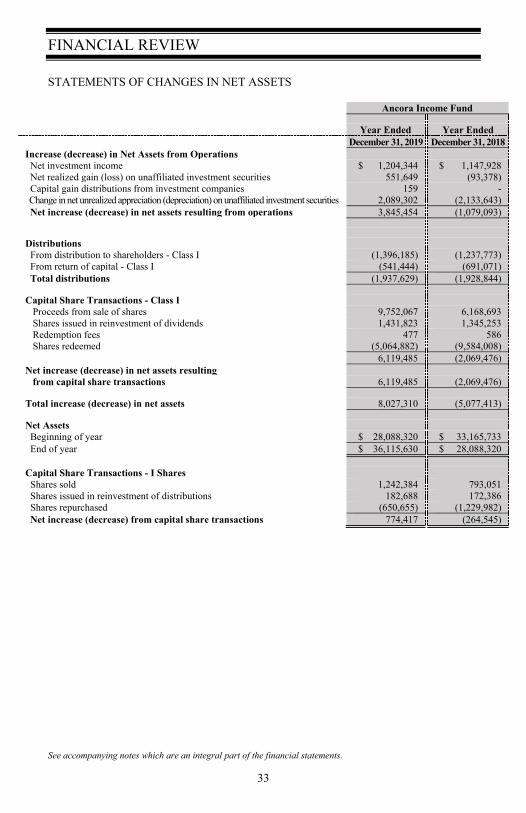
FINANCIAL REVIEW STATEMENTS OF CHANGES IN NET ASSETS
33
Ancora Income Fund Year Ended Year Ended December 31, 2019 December 31, 2018
Increase (decrease) in Net Assets from Operations Net investment income $ 1,204,344 $ 1,147,928 Net realized gain (loss) on unaffiliated investment securities 551,649 (93,378) Capital gain distributions from investment companies 159 - Change in net unrealized appreciation (depreciation) on unaffiliated investment securities 2,089,302 (2,133,643) Net increase (decrease) in net assets resulting from operations 3,845,454 (1,079,093)
Distributions From distribution to shareholders - Class I (1,396,185) (1,237,773) From return of capital - Class I (541,444) (691,071) Total distributions (1,937,629) (1,928,844)
Capital Share Transactions - Class I Proceeds from sale of shares 9,752,067 6,168,693 Shares issued in reinvestment of dividends 1,431,823 1,345,253 Redemption fees 477 586 Shares redeemed (5,064,882) (9,584,008)
6,119,485 (2,069,476) Net increase (decrease) in net assets resulting from capital share transactions 6,119,485 (2,069,476)
Total increase (decrease) in net assets 8,027,310 (5,077,413)
Net Assets Beginning of year $ 28,088,320 $ 33,165,733 End of year $ 36,115,630 $ 28,088,320 Capital Share Transactions - I Shares Shares sold 1,242,384 793,051 Shares issued in reinvestment of distributions 182,688 172,386 Shares repurchased (650,655) (1,229,982) Net increase (decrease) from capital share transactions 774,417 (264,545)
See accompanying notes which are an integral part of the financial statements.
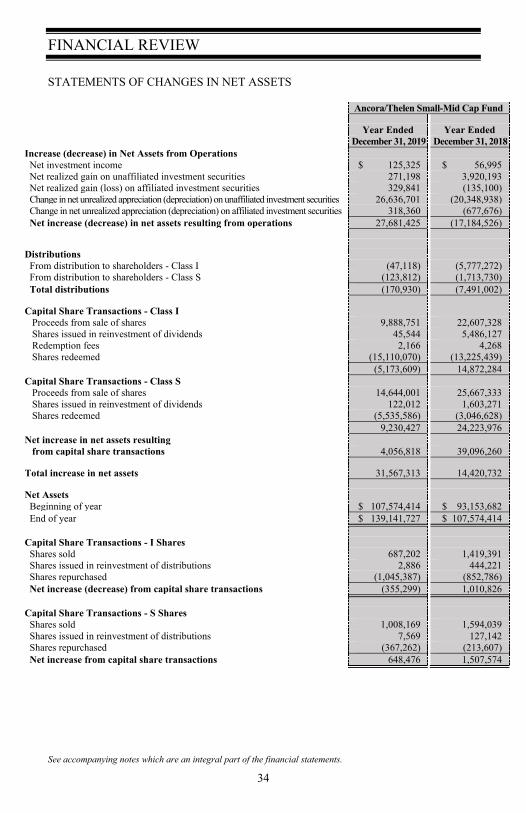
FINANCIAL REVIEW STATEMENTS OF CHANGES IN NET ASSETS
34
Ancora/Thelen Small-Mid Cap Fund Year Ended Year Ended
December 31, 2019 December 31, 2018 Increase (decrease) in Net Assets from Operations Net investment income $ 125,325 $ 56,995 Net realized gain on unaffiliated investment securities 271,198 3,920,193 Net realized gain (loss) on affiliated investment securities 329,841 (135,100) Change in net unrealized appreciation (depreciation) on unaffiliated investment securities 26,636,701 (20,348,938) Change in net unrealized appreciation (depreciation) on affiliated investment securities 318,360 (677,676) Net increase (decrease) in net assets resulting from operations 27,681,425 (17,184,526)
Distributions From distribution to shareholders - Class I (47,118) (5,777,272) From distribution to shareholders - Class S (123,812) (1,713,730) Total distributions (170,930) (7,491,002)
Capital Share Transactions - Class I Proceeds from sale of shares 9,888,751 22,607,328 Shares issued in reinvestment of dividends 45,544 5,486,127 Redemption fees 2,166 4,268 Shares redeemed (15,110,070) (13,225,439)
(5,173,609) 14,872,284 Capital Share Transactions - Class S Proceeds from sale of shares 14,644,001 25,667,333 Shares issued in reinvestment of dividends 122,012 1,603,271 Shares redeemed (5,535,586) (3,046,628)
9,230,427 24,223,976 Net increase in net assets resulting from capital share transactions 4,056,818 39,096,260
Total increase in net assets 31,567,313 14,420,732
Net Assets Beginning of year $ 107,574,414 $ 93,153,682 End of year $ 139,141,727 $ 107,574,414 Capital Share Transactions - I Shares Shares sold 687,202 1,419,391 Shares issued in reinvestment of distributions 2,886 444,221 Shares repurchased (1,045,387) (852,786) Net increase (decrease) from capital share transactions (355,299) 1,010,826
Capital Share Transactions - S Shares Shares sold 1,008,169 1,594,039 Shares issued in reinvestment of distributions 7,569 127,142 Shares repurchased (367,262) (213,607) Net increase from capital share transactions 648,476 1,507,574
See accompanying notes which are an integral part of the financial statements.
FINANCIAL REVIEW STATEMENT OF CHANGES IN NET ASSETS
35
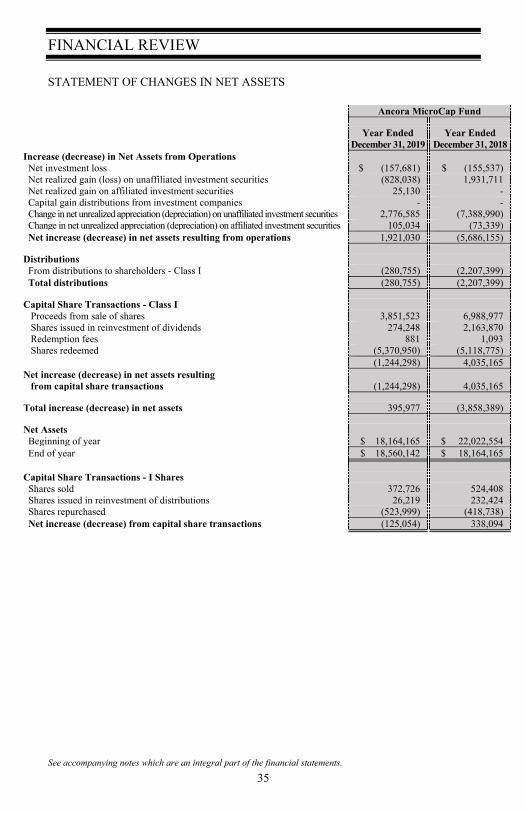
Ancora MicroCap Fund
Year Ended Year Ended December 31, 2019 December 31, 2018
Increase (decrease) in Net Assets from Operations Net investment loss $ (157,681) $ (155,537) Net realized gain (loss) on unaffiliated investment securities (828,038) 1,931,711 Net realized gain on affiliated investment securities 25,130 - Capital gain distributions from investment companies - - Change in net unrealized appreciation (depreciation) on unaffiliated investment securities 2,776,585 (7,388,990) Change in net unrealized appreciation (depreciation) on affiliated investment securities 105,034 (73,339) Net increase (decrease) in net assets resulting from operations 1,921,030 (5,686,155)
Distributions From distributions to shareholders - Class I (280,755) (2,207,399) Total distributions (280,755) (2,207,399)
Capital Share Transactions - Class I Proceeds from sale of shares 3,851,523 6,988,977 Shares issued in reinvestment of dividends 274,248 2,163,870 Redemption fees 881 1,093 Shares redeemed (5,370,950) (5,118,775) (1,244,298) 4,035,165 Net increase (decrease) in net assets resulting from capital share transactions (1,244,298) 4,035,165
Total increase (decrease) in net assets 395,977 (3,858,389)
Net Assets Beginning of year $ 18,164,165 $ 22,022,554 End of year $ 18,560,142 $ 18,164,165 Capital Share Transactions - I Shares Shares sold 372,726 524,408 Shares issued in reinvestment of distributions 26,219 232,424 Shares repurchased (523,999) (418,738) Net increase (decrease) from capital share transactions (125,054) 338,094
See accompanying notes which are an integral part of the financial statements.

FINANCIAL REVIEW STATEMENT OF CHANGES IN NET ASSETS
36
Ancora Special Opportunity Fund Year Ended Year Ended December 31, 2019 December 31, 2018
Increase (decrease) in Net Assets from Operations Net investment income $ 106,333 $ 88,291 Net realized gain on unaffiliated investment securities 1,024,919 1,291,709 Net realized gain (loss) on affiliated investment securities (55,301) - Capital gain distributions from investment companies 11,035 82,921 Change in net unrealized appreciation (depreciation) on unaffiliated investment securities 2,996,052 (2,931,641) Change in net unrealized appreciation (depreciation) on affiliated investment securities (10,372) (308,863) Net increase (decrease) in net assets resulting from operations 4,072,666 (1,777,583)
Distributions From distribution to shareholders - Class I (971,580) (1,496,876) Total distributions (971,580) (1,496,876)
Capital Share Transactions - Class I Proceeds from sale of shares 5,232,347 1,667,018 Shares issued in reinvestment of dividends 565,860 1,218,227 Redemption fees 17 1,032 Shares redeemed (5,075,365) (2,291,137)
722,859 595,140 Net increase in net assets resulting from capital share transactions 722,859 595,140
Total increase (decrease) in net assets 3,823,945 (2,679,319)
Net Assets Beginning of year $ 14,430,836 $ 17,110,155 End of year $ 18,254,781 $ 14,430,836 Capital Share Transactions - I Shares Shares sold 752,191 228,531 Shares issued in reinvestment of distributions 76,675 203,717 Shares repurchased (754,691) (316,264) Net increase from capital share transactions 74,175 115,984
See accompanying notes which are an integral part of the financial statements.

FINANCIAL REVIEW STATEMENT OF CHANGES IN NET ASSETS
37
Ancora Dividend Value Equity Fund
Period Ended December 31, 2019 (a) Increase in Net Assets from Operations Net investment income $ 179,250 Net realized gain on unaffiliated investment securities 60,958 Change in net unrealized appreciation on unaffiliated investment securities 2,027,042 Net increase in net assets resulting from operations 2,267,250 Distributions From distribution to shareholders - Class I (162,823) Total distributions (162,823) Capital Share Transactions - Class I Proceeds from sale of shares 20,167,349 Shares issued in reinvestment of dividends 161,613 Redemption fees 2,895 Shares redeemed (1,595,326) 18,736,531 Net increase in net assets resulting from capital share transactions 18,736,531 Total increase in net assets 20,840,958 Net Assets Beginning of period $ - End of period $ 20,840,958 Capital Share Transactions - I Shares Shares sold 1,992,012 Shares issued in reinvestment of distributions 14,391 Shares repurchased (146,879) Net increase from capital share transactions 1,859,524
(a) For period May 7, 2019 (commencement of operations) through December 31, 2019. See accompanying notes which are an integral part of the financial statements.

FINANCIAL REVIEW FINANCIAL HIGHLIGHTS FOR A FUND SHARE OUTSTANDING – throughout each year
38
Ancora Income Fund Year Ended Year Ended Year Ended Year Ended Year Ended
CLASS I SHARES 12/31/2019 12/31/2018 12/31/2017 12/31/2016 12/31/2015 Selected Per Share Data Net asset value, beginning of year $ 7.42 $ 8.19 $ 8.13 $ 8.15 $ 8.44 Income from investment operations Net investment income (a) 0.30 0.30 0.31 0.33 0.34 Net realized and unrealized gain (loss) 0.68 (0.57) 0.26 0.17 (0.06) Total from investment operations 0.98 (0.27) 0.57 0.50 0.28 Less Distributions to shareholders: From net investment income (0.35) (0.32) (0.32) (0.31) (0.35) From net realized gain - - (0.07) (0.04) (0.08) From return of capital (0.13) (0.18) (0.12) (0.17) (0.14) Total distributions (0.48) (0.50) (0.51) (0.52) (0.57) Paid in capital from redemption fees - (e) - (e) - (e) - (e) - (e) Net asset value, end of year $ 7.92 $ 7.42 $ 8.19 $ 8.13 $ 8.15 Total Return (b) 13.46% (3.40)% 7.14% 6.21% 3.41% Ratios and Supplemental Data Net assets, end of year (000) $ 36,116 $ 28,088 $ 33,166 $ 19,880 $ 13,814 Ratio of expenses to average net assets (c) 1.28% 1.29% 1.28% 1.28% 1.28% Ratio of expenses to average net assets before waiver & reimbursement (c) 1.53% 1.49% 1.41% 1.43% 1.42% Ratio of net investment income (loss) to average net assets (c) (d) 3.82% 3.78% 3.76% 4.04% 4.08% Ratio of net investment income (loss) to average net assets before waiver & reimbursement (c) (d) 3.57% 3.57% 3.63% 3.90% 3.94% Portfolio turnover rate 103.17% 56.98% 54.84% 76.34% 88.64%
(a) Net investment income per share is based on average shares outstanding. (b) Total return represents the rate that the investor would have earned or lost on an investment in the Fund, assuming reinvestment of dividends. (c) These ratios exclude the impact of expenses of the underlying security holdings as represented in the schedule of investments. (d) Recognition of net investment income (loss) by the Fund is affected by the timing of the declaration of dividends by the underlying investment companies in which the Fund invests. (e) Amount is less than $0.005. See accompanying notes which are an integral part of the financial statements.
FINANCIAL REVIEW FINANCIAL HIGHLIGHTS FOR A FUND SHARE OUTSTANDING – throughout each year
39
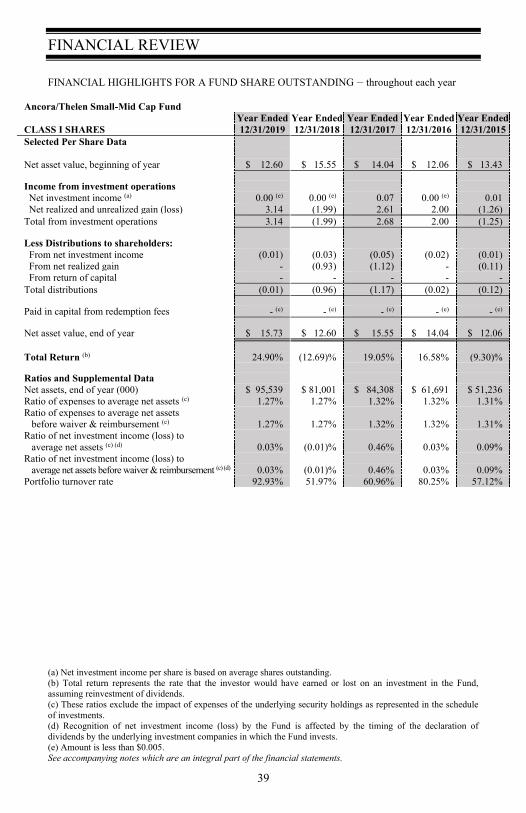
Ancora/Thelen Small-Mid Cap Fund Year Ended Year Ended Year Ended Year Ended Year Ended
CLASS I SHARES 12/31/2019 12/31/2018 12/31/2017 12/31/2016 12/31/2015 Selected Per Share Data Net asset value, beginning of year $ 12.60 $ 15.55 $ 14.04 $ 12.06 $ 13.43 Income from investment operations Net investment income (a) 0.00 (e) 0.00 (e) 0.07 0.00 (e) 0.01 Net realized and unrealized gain (loss) 3.14 (1.99) 2.61 2.00 (1.26) Total from investment operations 3.14 (1.99) 2.68 2.00 (1.25) Less Distributions to shareholders: From net investment income (0.01) (0.03) (0.05) (0.02) (0.01) From net realized gain - (0.93) (1.12) - (0.11) From return of capital - - - - - Total distributions (0.01) (0.96) (1.17) (0.02) (0.12) Paid in capital from redemption fees - (e) - (e) - (e) - (e) - (e) Net asset value, end of year $ 15.73 $ 12.60 $ 15.55 $ 14.04 $ 12.06 Total Return (b) 24.90% (12.69)% 19.05% 16.58% (9.30)% Ratios and Supplemental Data Net assets, end of year (000) $ 95,539 $ 81,001 $ 84,308 $ 61,691 $ 51,236 Ratio of expenses to average net assets (c) 1.27% 1.27% 1.32% 1.32% 1.31% Ratio of expenses to average net assets before waiver & reimbursement (c) 1.27% 1.27% 1.32% 1.32% 1.31% Ratio of net investment income (loss) to average net assets (c) (d) 0.03% (0.01)% 0.46% 0.03% 0.09% Ratio of net investment income (loss) to average net assets before waiver & reimbursement (c) (d) 0.03% (0.01)% 0.46% 0.03% 0.09% Portfolio turnover rate 92.93% 51.97% 60.96% 80.25% 57.12%
(a) Net investment income per share is based on average shares outstanding. (b) Total return represents the rate that the investor would have earned or lost on an investment in the Fund, assuming reinvestment of dividends. (c) These ratios exclude the impact of expenses of the underlying security holdings as represented in the schedule of investments. (d) Recognition of net investment income (loss) by the Fund is affected by the timing of the declaration of dividends by the underlying investment companies in which the Fund invests. (e) Amount is less than $0.005. See accompanying notes which are an integral part of the financial statements.

FINANCIAL REVIEW FINANCIAL HIGHLIGHTS FOR A FUND SHARE OUTSTANDING – throughout each year
40
Ancora MicroCap Fund Year Ended Year Ended Year Ended Year Ended Year Ended
CLASS I SHARES 12/31/2019 12/31/2018 12/31/2017 12/31/2016 12/31/2015 Selected Per Share Data Net asset value, beginning of year $ 9.55 $ 14.09 $ 12.87 $ 11.20 $ 14.15 Income from investment operations Net investment income (loss) (a) (0.09) (0.09) (0.14) 0.03 (0.12) Net realized and unrealized gain (loss) 1.15 (3.10) 2.46 1.85 (1.09) Total from investment operations 1.06 (3.19) 2.32 1.88 (1.21) Less Distributions to shareholders: From net investment income - - - (c) (0.03) - From net realized gain (0.16) (1.35) (1.10) (0.18) (1.74) Total distributions (0.16) (1.35) (1.10) (0.21) (1.74) Paid in capital from redemption fees - (c) - (c) - (c) - (c) - (c) Net asset value, end of year $ 10.45 $ 9.55 $ 14.09 $ 12.87 $ 11.20 Total Return (b) 11.09% (22.37)% 18.00% 16.73% (8.61)% Ratios and Supplemental Data Net assets, end of year (000) $ 18,560 $ 18,164 $ 22,023 $ 16,195 $ 14,665 Ratio of expenses to average net assets 1.60% 1.55% 1.60% 1.60% 1.60% Ratio of expenses to average net assets before waiver & reimbursement 1.72% 1.55% 1.60% 1.65% 1.60% Ratio of net investment income (loss) to average net assets (0.82)% (0.66)% (0.98)% 0.28% (0.90)% Ratio of net investment income (loss) to average net assets before waiver & reimbursement (0.94)% (0.66)% (0.98)% 0.22% (0.90)% Portfolio turnover rate 25.56% 31.20% 35.15% (d) 13.60% 26.97%
(a) Net investment income (loss) per share is based on average shares outstanding. (b) Total return represents the rate that the investor would have earned or lost on an investment in the Fund, assuming reinvestment of dividends. (c) Amount is less than $0.005. (d) Excludes the impact of in-kind transactions. See accompanying notes which are an integral part of the financial statements.

FINANCIAL REVIEW FINANCIAL HIGHLIGHTS FOR A FUND SHARE OUTSTANDING – throughout each year
41
Ancora Special Opportunity Fund Year Ended Year Ended Year Ended Year Ended Year Ended
CLASS I SHARES 12/31/2019 12/31/2018 12/31/2017 12/31/2016 12/31/2015 Selected Per Share Data Net asset value, beginning of year $ 6.01 $ 7.49 $ 6.94 $ 6.18 $ 6.48 Income from investment operations Net investment income (loss) (a) 0.04 0.04 (0.03) (0.01) 0.02 Net realized and unrealized gain (loss) 1.73 (0.85) 1.04 1.07 (0.21) Total from investment operations 1.77 (0.81) 1.01 1.06 (0.19) Less Distributions to shareholders: From net investment income (0.04) (0.04) - - - From net realized gain (0.36) (0.63) (0.46) (0.30) (0.11) From return of capital - - - - - Total distributions (0.40) (0.67) (0.46) (0.30) (0.11) Paid in capital from redemption fees - (e) - (e) - - - Net asset value, end of year $ 7.38 $ 6.01 $ 7.49 $ 6.94 $ 6.18 Total Return (b) 29.46% (10.70)% 14.54% 17.19% (2.89)% Ratios and Supplemental Data Net assets, end of year (000) $ 18,255 $ 14,431 $ 17,110 $ 3,820 $ 2,930 Ratio of expenses to average net assets (c) 1.73% 1.67% 1.64% 1.73% 1.76% Ratio of expenses to average net assets before waiver & reimbursement (c) 1.73% 1.67% 1.64% 1.73% 1.76% Ratio of net investment income (loss) to average net assets (c) (d) 0.62% 0.52% (0.43)% (0.10)% 0.24% Ratio of net investment income (loss) to average net assets before waiver & reimbursement (c) (d) 0.62% 0.52% (0.43)% (0.10)% 0.24% Portfolio turnover rate 103.11% 70.99% 100.67% 141.57% 200.23%
(a) Net investment income (loss) per share is based on average shares outstanding. (b) Total return represents the rate that the investor would have earned or lost on an investment in the Fund, assuming reinvestment of dividends. (c) These ratios exclude the impact of expenses of the underlying security holdings as represented in the schedule of investments. (d) Recognition of net investment income (loss) by the Fund is affected by the timing of the declaration of dividends by the underlying investment companies in which the Fund invests. (e) Amount is less than $0.005. See accompanying notes which are an integral part of the financial statements.
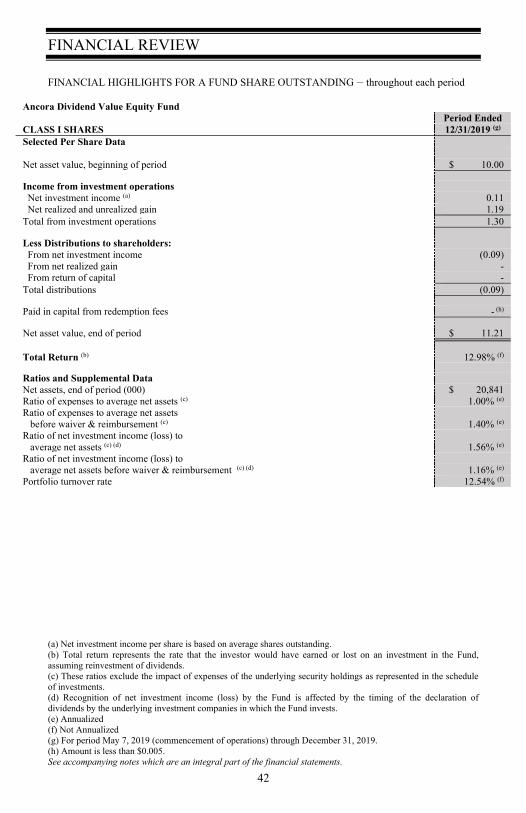
FINANCIAL REVIEW FINANCIAL HIGHLIGHTS FOR A FUND SHARE OUTSTANDING – throughout each period
42
Ancora Dividend Value Equity Fund Period Ended
CLASS I SHARES 12/31/2019 (g) Selected Per Share Data Net asset value, beginning of period $ 10.00 Income from investment operations Net investment income (a) 0.11 Net realized and unrealized gain 1.19 Total from investment operations 1.30 Less Distributions to shareholders: From net investment income (0.09) From net realized gain - From return of capital - Total distributions (0.09) Paid in capital from redemption fees - (h) Net asset value, end of period $ 11.21 Total Return (b) 12.98% (f) Ratios and Supplemental Data Net assets, end of period (000) $ 20,841 Ratio of expenses to average net assets (c) 1.00% (e) Ratio of expenses to average net assets before waiver & reimbursement (c) 1.40% (e) Ratio of net investment income (loss) to average net assets (c) (d) 1.56% (e) Ratio of net investment income (loss) to average net assets before waiver & reimbursement (c) (d) 1.16% (e) Portfolio turnover rate 12.54% (f)
(a) Net investment income per share is based on average shares outstanding. (b) Total return represents the rate that the investor would have earned or lost on an investment in the Fund, assuming reinvestment of dividends. (c) These ratios exclude the impact of expenses of the underlying security holdings as represented in the schedule of investments. (d) Recognition of net investment income (loss) by the Fund is affected by the timing of the declaration of dividends by the underlying investment companies in which the Fund invests. (e) Annualized (f) Not Annualized (g) For period May 7, 2019 (commencement of operations) through December 31, 2019. (h) Amount is less than $0.005. See accompanying notes which are an integral part of the financial statements.

FINANCIAL REVIEW FINANCIAL HIGHLIGHTS FOR A FUND SHARE OUTSTANDING – throughout each year/period
43
Ancora/Thelen Small-Mid Cap Fund Year Ended Year Ended Year Ended Year Ended Period Ended
CLASS S SHARES 12/31/2019 12/31/2018 12/31/2017 12/31/2016 12/31/2015 (g) Selected Per Share Data Net asset value, beginning of year/period $ 12.86 $ 15.85 $ 14.29 $ 12.23 $ 14.00 Income from investment operations Net investment income (a) 0.04 0.05 0.12 0.05 0.01 Net realized and unrealized gain (loss) 3.21 (2.06) 2.66 2.03 (1.66) Total from investment operations 3.25 (2.01) 2.78 2.08 (1.65) Less Distributions to shareholders: From net investment income (0.05) (0.05) (0.10) (0.02) (0.01) From net realized gain - (0.93) (1.12) - (0.11) From return of capital - - - - - Total distributions (0.05) (0.98) (1.22) (0.02) (0.12) Net asset value, end of year/period $ 16.06 $ 12.86 $ 15.85 $ 14.29 $ 12.23 Total Return (b) 25.24% (12.53)% 19.45% 16.97% (11.77)% (f) Ratios and Supplemental Data Net assets, end of year/period (000) $ 43,603 $ 26,573 $ 8,846 $ 7,267 $ 3,981 Ratio of expenses to average net assets (c) 1.00% 1.00% 1.00% 0.99% 0.99% (e) Ratio of expenses to average net assets before waiver & reimbursement (c) 1.25% 1.27% 1.31% 1.31% 1.31% (e) Ratio of net investment income (loss) to average net assets (c) (d) 0.29% 0.36% 0.79% 0.34% 0.15% (e) Ratio of net investment income (loss) to average net assets before waiver & reimbursement (c) (d) 0.04% 0.09% 0.48% 0.01% (0.16)% (e) Portfolio turnover rate 92.93% 51.97% 60.96% 80.25% 57.12% (f)
(a) Net investment income per share is based on average shares outstanding. (b) Total return represents the rate that the investor would have earned or lost on an investment in the Fund, assuming reinvestment of dividends. (c) These ratios exclude the impact of expenses of the underlying security holdings as represented in the schedule of investments. (d) Recognition of net investment income (loss) by the Fund is affected by the timing of the declaration of dividends by the underlying investment companies in which the Fund invests. (e) Annualized (f) Not Annualized (g) For period June 19, 2015 (commencement of operations) through December 31, 2015. See accompanying notes which are an integral part of the financial statements.

FINANCIAL REVIEW Ancora Trust Notes to the Financial Statements December 31, 2019
44
NOTE 1. ORGANIZATION Ancora Income Fund (the “Income Fund”), Ancora/Thelen Small-Mid Cap Fund (the “Small-Mid Cap Fund”), Ancora MicroCap Fund (the “MicroCap Fund”), Ancora Special Opportunity Fund (the “Special Opportunity Fund”) and Ancora Dividend Value Equity Fund (the “Dividend Value Equity Fund”), (each, a “Fund” and collectively, the “Funds”) are each a separate series of Ancora Trust (the “Trust”), an Ohio business trust under a Declaration of Trust dated August 20, 2003. The Declaration of Trust permits the Trust to issue an unlimited number of shares of beneficial interest representing interests in separate funds of securities, and it permits the Trust to offer separate classes of each such series. The Income Fund’s investment objective is to obtain a high level of income, with a secondary objective of capital appreciation. The Small-Mid Cap Fund’s investment objective is to obtain capital appreciation in the value of its shares. The MicroCap Fund’s investment objective is to obtain capital appreciation in the value of its shares. The Special Opportunity Fund’s investment objective is obtaining a high total return through a combination of income and capital appreciation in the value of its shares. The Dividend Value Equity Fund commenced investment operations on May 7, 2019. The Dividend Value Equity Fund’s investment objective is to provide growth of income and long-term capital appreciation. Each Fund is an “open-end” management investment company as defined in the Investment Company Act of 1940, as amended (the “1940 Act”). Each Fund is a “diversified” company as defined in the 1940 Act. The Board of Trustees (the “Board”) of the Trust has authorized that shares of the Funds may be offered in two classes: Class I and Class S. Class S shares are currently offered in the Small-Mid Cap Fund only. Class I and Class S shares are identical, except as to minimum investment requirements and the services offered to and expenses borne by each class. Class S and Class I shares are offered continuously at net asset value (“NAV”). Class I shares are subject to shareholder service fees. Class I and Class S shares are subject to a contractual limit on total operating expenses. Income and realized/unrealized gains or losses are allocated to each class based on relative net assets. The investment advisor of the Funds is Ancora Advisors LLC (the “Advisor”). The Funds will deduct a 2% redemption fee from redemption proceeds if shares are purchased and then redeemed within 90 days. For the year ended December 31, 2019, the Income Fund – Class I collected $477 in redemption fees. For the year ended December 31, 2019, the Small-Mid Cap Fund – Class I collected $2,166 in redemption fees. For the year ended December 31, 2019, the Microcap Fund – Class I collected $881 in redemption fees. For the year ended December 31, 2019, the Opportunity Fund – Class I collected $17 in redemption fees. For the year ended December 31, 2019, the Small-Mid Cap Fund Class S did not collect any redemption fees. For the period ended December 31, 2019, the Dividend Value Equity Fund Class I collected $2,895 in redemption fees. Each Fund is an investment company and accordingly follows the investment company accounting and reporting guidance of the Financial Accounting Standards Board (“FASB”) Accounting Standard Codification Topic 946 Financial Services – Investment Companies. NOTE 2. SIGNIFICANT ACCOUNTING POLICIES The following is a summary of significant accounting policies followed by the Funds in the preparation of their financial statements. These policies are in conformity with accounting principles generally accepted in the U.S. (“GAAP”).

FINANCIAL REVIEW Ancora Trust Notes to the Financial Statements (CONTINUED) December 31, 2019
45
Security Valuation - All investments in securities are recorded at their estimated fair value, as described in Note 3. Use Of Estimates - The preparation of financial statements in conformity with accounting principles generally accepted in the United States of America requires management to make estimates and assumptions that affect the reported amounts of assets and liabilities and disclosure of contingent assets and liabilities at the date of the financial statements and the reported amounts of increases and decreases in net assets from operations during the reporting year. Actual results could differ from those estimates. Federal Income Taxes - The Funds’ policy is to continue to comply with the requirements of the Internal Revenue Code that are applicable to regulated investment companies and to distribute all of their taxable income to shareholders. Therefore, no federal income tax provision is required. It is the Funds’ policy to distribute annually, prior to the end of the calendar year, dividends sufficient to satisfy excise tax requirements of the Internal Revenue Code. This Internal Revenue Code requirement may cause an excess of distributions over the book year-end accumulated income. In addition, it is the Funds’ policy to distribute annually, after the end of the fiscal year, any remaining net investment income and net realized capital gains. The Funds recognize the tax benefits of certain tax positions only where the position is “more likely than not” to be sustained assuming examination by tax authorities. Management has analyzed the Funds’ tax positions, and has concluded that no liability for unrecognized tax benefits should be recorded related to uncertain tax positions taken on returns filed. Funds identify their major tax jurisdiction as U.S. Federal; however the Funds’ are not aware of any tax positions for which it is reasonably possible that the total amounts of unrecognized tax benefits will change materially in the next twelve months. As of and during the year ended December 31, 2019, the Funds’ did not have a liability for any unrecognized tax benefits. The Funds’ recognize interest and penalty, if any, related to recognized tax benefits or income tax expense on the Statements of Operations. During the year or period ended December 31, 2019, the Funds’ did not incur any interest or penalties. Distributions To Shareholders – The Income Fund intends to distribute substantially all of its net investment income, if any, as dividends to its shareholders on a monthly basis. The Special Opportunity Fund, MicroCap Fund, Small-Mid Cap Fund, and Dividend Value Equity Fund intend to distribute substantially all of their net investment income, if any, as dividends to their shareholders on at least an annual basis. Distributions to shareholders are recorded on the ex-dividend date. All the Funds intend to distribute their net realized long term capital gains and net realized short term capital gains, if any, at least once a year. The treatment for financial reporting purposes of distributions made to shareholders during the year from net investment income or net realized capital gains may differ from their ultimate treatment for federal income tax purposes. These differences are caused by differences in the timing and recognition of certain components of income, expense, or realized capital gain for federal income tax purposes. Where such differences are permanent in nature, they are reclassified in the components of the net assets based on their ultimate characterization for federal income tax purposes. Any such reclassifications will have no effect on net assets, the results of operations, or net asset value per share of a fund. The permanent reclassifications were mainly due to return of capital distributions, net operating losses and distribution re-designations.
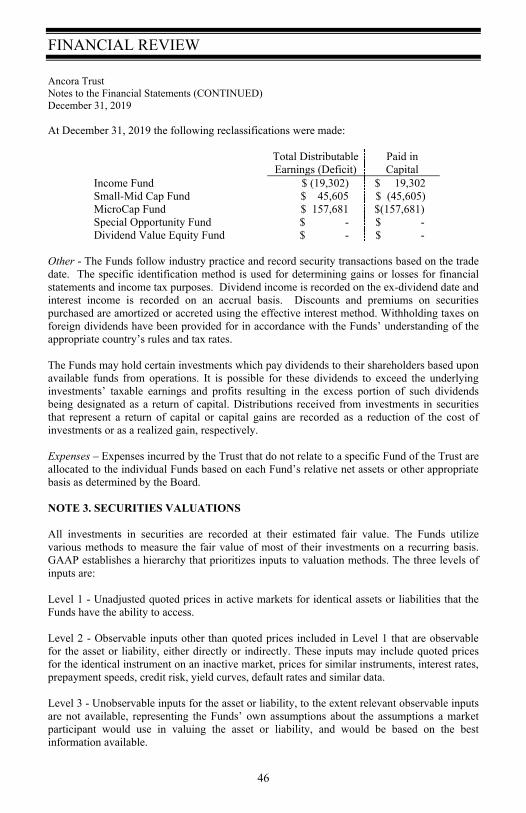
FINANCIAL REVIEW Ancora Trust Notes to the Financial Statements (CONTINUED) December 31, 2019
46
At December 31, 2019 the following reclassifications were made:
Total Distributable Earnings (Deficit)
Paid in Capital
Income Fund $ (19,302) $ 19,302 Small-Mid Cap Fund $ 45,605 $ (45,605) MicroCap Fund $ 157,681 $(157,681) Special Opportunity Fund $ - $ - Dividend Value Equity Fund $ - $ -
Other - The Funds follow industry practice and record security transactions based on the trade date. The specific identification method is used for determining gains or losses for financial statements and income tax purposes. Dividend income is recorded on the ex-dividend date and interest income is recorded on an accrual basis. Discounts and premiums on securities purchased are amortized or accreted using the effective interest method. Withholding taxes on foreign dividends have been provided for in accordance with the Funds’ understanding of the appropriate country’s rules and tax rates. The Funds may hold certain investments which pay dividends to their shareholders based upon available funds from operations. It is possible for these dividends to exceed the underlying investments’ taxable earnings and profits resulting in the excess portion of such dividends being designated as a return of capital. Distributions received from investments in securities that represent a return of capital or capital gains are recorded as a reduction of the cost of investments or as a realized gain, respectively.
Expenses – Expenses incurred by the Trust that do not relate to a specific Fund of the Trust are allocated to the individual Funds based on each Fund’s relative net assets or other appropriate basis as determined by the Board. NOTE 3. SECURITIES VALUATIONS All investments in securities are recorded at their estimated fair value. The Funds utilize various methods to measure the fair value of most of their investments on a recurring basis. GAAP establishes a hierarchy that prioritizes inputs to valuation methods. The three levels of inputs are: Level 1 - Unadjusted quoted prices in active markets for identical assets or liabilities that the Funds have the ability to access. Level 2 - Observable inputs other than quoted prices included in Level 1 that are observable for the asset or liability, either directly or indirectly. These inputs may include quoted prices for the identical instrument on an inactive market, prices for similar instruments, interest rates, prepayment speeds, credit risk, yield curves, default rates and similar data. Level 3 - Unobservable inputs for the asset or liability, to the extent relevant observable inputs are not available, representing the Funds’ own assumptions about the assumptions a market participant would use in valuing the asset or liability, and would be based on the best information available.
FINANCIAL REVIEW Ancora Trust Notes to the Financial Statements (CONTINUED) December 31, 2019
47
The availability of observable inputs can vary from security to security and is affected by a wide variety of factors, including, for example, the type of security, whether the security is new and not yet established in the marketplace, the liquidity of markets, and other characteristics particular to the security. To the extent that valuation is based on models or inputs that are less observable or unobservable in the market, the determination of fair value requires more judgment. Accordingly, the degree of judgment exercised in determining fair value is greatest for instruments categorized in Level 3. The inputs used to measure fair value may fall into different levels of the fair value hierarchy. In such cases, for disclosure purposes, the level in the fair value hierarchy within which the fair value measurement falls in its entirety, is determined based on the lowest level input that is significant to the fair value measurement in its entirety. Fair Value Measurements - A description of the valuation techniques applied to the Funds’ major categories of assets and liabilities measured at fair value on a recurring basis follows. Money market funds are generally priced at the ending NAV provided by the service agent of the fund. The money market funds will be categorized as Level 1 within the fair value hierarchy. Equity securities (common stocks including real estate investment trust senior securities, traditional preferred securities, investment companies, and corporate bond trust certificates) - are valued by using market quotations furnished by a pricing service when the Advisor believes such prices accurately reflect the fair value of such securities. Securities that are traded on any stock exchange are valued by the pricing service at the last quoted sale price. Lacking a last sale price, an exchange traded security is valued by the pricing service at its last bid price. Securities traded in the NASDAQ over-the-counter market are valued by the pricing service at the NASDAQ Official Closing Price. When market quotations are not readily available, when the Advisor determines that the market quotation or the price provided by the pricing service does not accurately reflect the current market value or when restricted or illiquid securities are being valued, such securities are valued at a fair price as determined by the Advisor in good faith, in accordance with guidelines adopted by and subject to review of the Board of Trustees. Manually priced securities held by the Funds (if any) are reviewed by the Board on a quarterly basis. To the extent these securities are actively traded and valuation adjustments are not applied, they are classified in Level 1 within the fair value hierarchy. Fixed income securities - Fixed income securities are valued by a pricing service when the Advisor believes such prices are accurate and reflect the fair value of such securities. If the Advisor decides that a price provided by the pricing services does not accurately reflect the fair value of the securities, when prices are not readily available from a pricing service or when restricted or illiquid securities are being valued, securities are valued at fair value as determined in good faith by the Advisor. Short term investments in fixed income securities with maturities of less than 60 days when acquired, or which subsequently are within 60 days of maturity, are valued by using the amortized cost method of valuation. Generally, fixed income securities are categorized as Level 2 within the fair value hierarchy.

FINANCIAL REVIEW Ancora Trust Notes to the Financial Statements (CONTINUED) December 31, 2019
48
The following table summarizes the inputs used to value each Fund’s assets measured at fair value as of December 31, 2019:
Income Fund Valuation Inputs of Assets * Level 1 Level 2 Level 3 Total Corporate Bond Trust Certificates $ 8,013,614 $ - $ - $ 8,013,614 Investment Companies 14,615,116 - - 14,615,116 Traditional Preferred Securities 3,421,376 - - 3,421,376 REIT Senior Securities 4,893,940 - - 4,893,940 Money Market Funds 5,152,004 - - 5,152,004 Total $ 36,096,050 $ - $ - $ 36,096,050 Small-Mid Cap Fund Valuation Inputs of Assets * Level 1 Level 2 Level 3 Total Common Stocks $ 138,569,053 $ - $ - $ 138,569,053 Money Market Funds 1,120,504 - - 1,120,504 Total $ 139,689,557 $ - $ - $ 139,689,557 MicroCap Fund Valuation Inputs of Assets * Level 1 Level 2 Level 3 Total Common Stocks $ 18,168,321 $ - $ - $ 18,168,321 Money Market Funds 421,477 - - 421,477 Total $ 18,589,798 $ - $ - $ 18,589,798 Special Opportunity Fund Valuation Inputs of Assets * Level 1 Level 2 Level 3 Total Common Stocks $ 11,002,900 $ - $ - $ 11,002,900 Investment Companies 3,840,505 - - 3,840,505 Rights 18,060 18,060 Money Market Funds 3,307,127 - - 3,307,127 Total $ 18,168,592 $ - $ - $ 18,168,592 Dividend Value Equity Fund Valuation Inputs of Assets * Level 1 Level 2 Level 3 Total Common Stocks $ 19,865,117 $ - $ - $ 19,865,117 Money Market Funds 1,477,909 - - 1,477,909 Total $ 21,343,026 $ - $ - $ 21,343,026
* The Funds did not hold any Level 3 assets during the year ended December 31, 2019. For more detail on the investments in securities please refer to the Schedules of Investments. The Funds did not hold any derivative investments at any time during the year ended December 31, 2019. The following table sets forth a summary of the changes in the fair value of each Fund’s investments in affiliated issuers for the year ended December 31, 2019:

FINANCIAL REVIEW Ancora Trust Notes to the Financial Statements (CONTINUED) December 31, 2019
49
Small-Mid Cap Fund
TESSCO Technologies, Inc. Balance Beginning at December 31, 2018 $ 936,456 Net Realized Gain on Sale of Investments 321,275 Net Change in Unrealized Appreciation on Investment Securities 179,070 Purchases - Sales (1,436,801) Balance End at December 31, 2019 $ - Dividend Income $ 30,431
J. Alexander’s Holdings, Inc. Balance Beginning at December 31, 2018 $ 842,653 Net Realized Gain on Sale of Investments 8,566 Net Change in Unrealized Appreciation on Investment Securities 139,290 Purchases - Sales (81,573) Balance End at December 31, 2019 $ 908,936 Dividend Income $ -
MicroCap Fund
Mace Security International, Inc. Balance Beginning at December 31, 2018 $ 40,343 Net Realized Loss on Sale of Investments (5,079) Net Change in Unrealized Appreciation on Investment Securities 6,418 Purchases - Sales (41,682) Balance End at December 31, 2019 $ - Dividend Income $ - Coffee Holding Company, Inc. Balance Beginning at December 31, 2018 $ 277,829 Net Realized Gain on Sale of Investments 30,209 Net Change in Unrealized Appreciation on Investment Securities 98,616 Purchases 87,787 Sales (96,247) Balance End at December 31, 2019 $ 398,194 Dividend Income $ -
Special Opportunity Fund
Mace Security International, Inc. Balance Beginning at December 31, 2018 $ 700,000 Net Realized Gain on Sale of Investments - Net Change in Unrealized Depreciation on Investment Securities (75,000) Purchases - Sales - Balance End at December 31, 2019 $ 625,000 Dividend Income $ -
FINANCIAL REVIEW Ancora Trust Notes to the Financial Statements (CONTINUED) December 31, 2019
50
Alithya Group, Inc. (Previously Edgewater Technology, Inc.) Balance Beginning at December 31, 2018 $ 50,415 Net Realized Loss on Sale of Investments (55,301) Net Change in Unrealized Appreciation on Investment Securities 64,628 Purchases - Sales (59,742) Balance End at December 31, 2019 $ - Dividend Income $ -
NOTE 4. FEES AND OTHER TRANSACTIONS WITH AFFILIATES The Trust retains Ancora Advisors LLC to manage the Funds’ investments. The Ancora Group, Inc. is the parent company of the Advisor. Ancora Holdings Inc. is the parent company to The Ancora Group, Inc. Under the terms of the Investment Advisory Agreement, (the “Agreement”), the Advisor manages the Funds’ investments in accordance with the stated policies of the Funds, subject to approval of the Board. The Advisor makes investment decisions for each Fund and places the purchase and sale orders for portfolio transactions. As compensation for management services, the Income Fund, Small-Mid Cap Fund, MicroCap Fund and Special Opportunity Fund are obligated to pay the Advisor a fee computed and accrued daily and paid monthly at an annual rate of 1.00% of the average daily net assets of each Fund. As compensation for management services, the Dividend Value Equity Fund is obligated to pay the Advisor a fee computed and accrued daily and paid monthly at an annual rate of 0.75% of the average daily net assets of the Fund. For the year ended December 31, 2019, the Advisor earned fees of $314,930 from the Income Fund, $1,265,346 from the Small-Mid Cap Fund, $191,706 from the MicroCap Fund, and $171,690 from the Special Opportunity Fund. For the period May 7, 2019 (commencement of operations), through December 31, 2019, the Advisor earned $86,267 from the Dividend Value Equity Fund. At December 31, 2019, payables to the Advisor were $30,481, $111,808, $27,897, $15,545, and 13,112 for the Income Fund, Small-Mid Cap Fund, MicroCap Fund, Special Opportunity Fund, and Dividend Value Equity Fund, respectively. The Advisor has contractually agreed to waive management fees in order to limit total annual operating expenses (excluding dividend expenses relating to short sales, interest, taxes, brokerage commissions and the cost of acquired fund fees and expenses) for the Income Fund to 1.285% for Class I shares until May 1, 2020, but can be terminated by a vote of the Board if they deem the termination to be beneficial to the Fund shareholders. For the year ended December 31, 2019, the Advisor waived management fees of $78,762 for the Income Fund Class I shares. The Advisor has contractually agreed to waive management fees, to the extent of management fees, in order to limit total annual operating expenses for the Small-Mid Cap Fund to 1.39% for Class I shares and 1.00% for Class S shares until May 1, 2020, but can be terminated by a vote of the Board if they deem the termination to be beneficial to the Fund shareholders. For the year ended December 31, 2019, the Advisor waived management fees of $91,079 for the Small-Mid Cap Fund Class S shares. The Advisor has contractually agreed to waive management fees, to the extent of management fees, in order to limit total annual operating expenses for the MicroCap Fund to 1.60% for Class I shares until May 1, 2020, but can be terminated by a vote of the Board if they deem the termination to be beneficial to the Fund shareholders. For the year ended December 31, 2019, the Adviser waived management fees of $22,103 for the MicroCap Fund Class I shares. The Advisor has contractually agreed to waive management fees, to the extent of management fees, in order to limit total annual

FINANCIAL REVIEW Ancora Trust Notes to the Financial Statements (CONTINUED) December 31, 2019
51
operating expenses for the Dividend Value Equity Fund to 1.00% for Class I shares until May 1, 2020, but can be terminated by a vote of the Board if they deem the termination to be beneficial to the Fund shareholders. For the period May 7, 2019 (commencement of operations), through December 31, 2019, the Adviser waived management fees of $45,994 for the Dividend Value Equity Fund Class I shares. The Advisor is entitled to recover such waived amounts within the same fiscal year in which the Advisor reduced its fee. No recoupment will occur except to the extent that the Funds’ expenses, together with the amount recovered, do not exceed the applicable expense limitation within the same fiscal year. The Special Opportunity Fund Class I does not have an expense waiver agreement. The Funds have entered into an Administration Agreement with The Ancora Group, Inc., an affiliate of the advisor. Pursuant to the Administration Agreement, each of the Funds will pay an administration fee equal to 0.10% of average net assets of each Fund monthly. Under the Administration Agreement, The Ancora Group, Inc. will assist in maintaining office facilities, furnish clerical services, prepare and file documents with the Securities and Exchange Commission, coordinate the filing of tax returns, assist with the preparation of the Funds’ Annual and Semi-Annual Reports to shareholders, monitor the Funds’ expense accruals and pay all expenses, monitor the Funds’ sub-chapter M status, maintain the Funds’ fidelity bond, monitor each Funds’ compliance with such Funds’ policies and limitations as set forth in the Prospectus and Statement of Additional Information and generally assist in the Funds’ operations. For the year ended December 31, 2019, The Ancora Group, Inc. earned $31,493 from the Income Fund, $126,535 from the Small-Mid Cap Fund, $19,171 from the MicroCap Fund, and $17,169 from the Special Opportunity Fund. For the period May 7, 2019 (commencement of operations), through December 31, 2019, The Ancora Group, Inc. earned $11,502 from the Dividend Value Equity Fund. As of December 31, 2019, The Ancora Group, Inc. was owed $3,012, $11,706, $1,597, $1,555, and $1,698 by the Income Fund, Small-Mid Cap Fund, MicroCap Fund, Special Opportunity Fund, and Dividend Value Equity Fund, respectively, for administrative services. The Trust retained Arbor Court Capital LLC (the “Distributor”), to act as the principal distributor of its shares. The Distributor charges $8,000 per year for its services which is paid by the Advisor. Arbor Court is an affiliated entity to the Trust’s transfer agent and fund accountant. Pursuant to the Shareholder Services Agreement with The Ancora Group, Inc., each of the Funds will pay a shareholder service fee equal to 0.01% of average net assets of the Class I Shares. Certain officers of the Trust are also officers or employees of the Advisor or its affiliates. They receive no fee for serving as officers of the Trust.
FINANCIAL REVIEW Ancora Trust Notes to the Financial Statements (CONTINUED) December 31, 2019
52
NOTE 5. INVESTMENTS For the year and period ended December 31, 2019, purchases and sales of investment securities, other than short-term investments, in-kind purchases and sales, and short-term U.S. Government obligations were as follows:
Income Fund
Small-Mid Cap Fund
MicroCap
Fund
Special Opportunity
Fund
Dividend Value Equity Fund
Purchases U.S. Government Obligations $ - $ - $ - $ - $ - Other $ 32,864,507 $120,560,924 $ 4,670,108 $ 15,373,443 $ 19,910,129
Sales U.S. Government Obligations $ - $ - $ - $ - $ - Other $ 30,571,613 $112,242,619 $ 6,339,073 $ 18,251,161 $ 2,133,012
At December 31, 2019, the costs of securities for federal income tax purposes were $35,156,107, $115,406,944, $20,446,545, $15,826,688, and $19,315,984 for the Income Fund, Small-Mid Cap Fund, MicroCap Fund, Special Opportunity Fund, and Dividend Value Equity Fund, respectively. As of December 31, 2019, the net unrealized appreciation (depreciation) of investments for tax purposes was as follows:
Income Fund
Small-Mid Cap Fund
MicroCap Fund
Special Opportunity
Fund
Dividend Value Equity Fund
Gross Appreciation $ 997,122 $ 26,255,780 $ 2,433,643 $ 3,426,333 $ 2,164,343 Gross (Depreciation) (57,179) (1,973,167) (4,290,390) (1,084,429) (137,301) Net Appreciation (Depreciation) on Investments $ 939,943 $ 24,282,613 $(1,856,747) $ 2,341,904 $ 2,027,042
The difference between book and tax unrealized is mainly attributable to the tax deferral of wash sales and partnership basis adjustments. NOTE 6. DISTRIBUTIONS TO SHAREHOLDERS The tax character of distributions paid during year and period ended December 31, 2019 is as follows:
Income Fund
Small-Mid Cap Fund
MicroCap Fund
Special Opportunity
Fund
Dividend Value Equity Fund
Ordinary income $ 1,378,494 $ 125,325 $ 119,089 $ 188,193 $ 162,823 Long-term capital gain 17,689 - 161,666 783,387 - Return of capital 541,444 45,606 - - - $ 1,937,627 $ 170,931 $ 280,755 $ 971,580 $ 162,823
FINANCIAL REVIEW Ancora Trust Notes to the Financial Statements (CONTINUED) December 31, 2019
53
The tax character of distributions paid during year ended December 31, 2018 is as follows:
Income Fund
Small-Mid Cap Fund
MicroCap Fund
Special Opportunity
Fund Ordinary income $ 1,185,166 $ 502,299 $ - $ 187,690 Long-term capital gain 49,195 6,988,703 2,207,399 1,309,186 Return of capital 694,483 - - - $ 1,928,844 $ 7,491,002 $ 2,207,399 $ 1,496,876
As of December 31, 2019, the following Funds had the following capital loss carryforwards for federal income tax purposes. These capital loss carryforwards may be utilized in future years to offset net realized capital gains, if any, prior to distributing such gains to shareholders and may be carried forward indefinitely retaining their character as short-term and/or long-term.
Income Fund
Small-Mid Cap Fund
MicroCap Fund
Special Opportunity
Fund
Dividend Value Equity Fund
Short-Term Capital Loss Carry Forward $ - $ (1,541,848) $ (1,616) $ - $ - Long-Term Capital Loss Carry Forward - - (801,292) - - Total Capital Loss Carry Forward $ - $ (1,541,848) $ (802,908) $ - $ -
As of December 31, 2019, the components of distributable earnings on a tax basis were as follows:
Income Fund
Small-Mid Cap Fund
MicroCap
Fund
Special Opportunity
Fund
Dividend Value Equity Fund
Accumulated undistributed ordinary income (loss)
$ -
$ -
$ -
$ 130,238
$ 77,385
Accumulated undistributed capital gain (loss) - - - 248,568 - Other Accumulated Losses - (1,541,848) (802,908) - - Unrealized appreciation (depreciation) 939,943 24,282,613 (1,856,747) 2,341,903 2,027,042 $ 939,943 $ 22,740,765 $ (2,659,655) $ 2,720,709 $ 2,104,427
NOTE 7. BENEFICIAL OWNERSHIP The beneficial ownership, either directly or indirectly, of more than 25% of the voting securities of a fund creates a presumption of control of the fund, under Section 2(a)(9) of the Investment Company Act of 1940. As of December 31, 2019, National Financial Services,
FINANCIAL REVIEW Ancora Trust Notes to the Financial Statements (CONTINUED) December 31, 2019
54
LLC. owned, for the benefit of its customers, the following percentages of the outstanding shares: Income Fund 71.62% Small-Mid Cap Fund 46.72% MicroCap Fund 59.42% Special Opportunity Fund 76.74% Dividend Value Equity Fund 66.16% As of December 31, 2019, Charles Schwab & Co., Inc. owned, for the benefit of its customers, the following percentages of the outstanding shares: MicroCap Fund 34.42% Dividend Value Equity Fund 27.43% NOTE 8. SUBSEQUENT EVENTS The Funds are required to recognize in the financial statements the effects of all subsequent events that provide additional evidence about conditions that existed at the date of the Statements of Assets and Liabilities. For non-recognized subsequent events that must be disclosed to keep the financial statements from being misleading, the Funds are required to disclose the nature of the event as well as an estimate of its financial effect, or a statement that such an estimate cannot be made. Management has evaluated the impact of all subsequent events on the Funds through the issuance date of these financial statements and has noted no such events requiring accounting or disclosure. NOTE 9. NEW ACCOUNTING PRONOUNCEMENT In August 2018, FASB issued ASU 2018-13, Fair Value Measurement (Topic 820): Disclosure Framework – Changes to the Disclosure Requirements for Fair Value Measurement (“ASU 2018-13”). The primary focus of ASU 2018-13 is to improve the effectiveness of the disclosure requirements for fair value measurements. The changes affect all companies that are required to include fair value measurement disclosures. In general, the amendments in ASU 2018-13 are effective for all entities for fiscal years and interim periods within those fiscal years, beginning after December 15, 2019. An entity is permitted to early adopt the removed or modified disclosures upon the issuance of ASU 2018-13 and may delay adoption of the additional disclosures, which are required for public companies only, until their effective date. Early adoption is permitted and the Funds have adopted ASU 2018-13 within these financial statements. There was no material impact to the financial statements due to this adoption.

FINANCIAL REVIEW Ancora Trust Additional Information December 31, 2019
55
PORTFOLIO HOLDINGS DISCLOSURE POLICY (UNAUDITED) The Funds’ disclose their portfolio holdings in the following manner: (i) the funds file complete schedules of portfolio holdings with the Commission for the first and third quarter each year on Form N-Q; (ii) the Funds’ form N-Q are available on the Commission website at http:www.sec.gov and in annual and semi-annual reports to shareholders’ (iii) the Funds’ Form N-Q may be reviewed and copied at the Commission Public Reference Room in Washington, DC, and that information on the operation of the Public Reference Room may be obtained by calling 1-800-SEC-0330; (iv) on the Funds’ internet site www.ancorafunds.com approximately 10 days after the end of each fiscal quarter, which information is current as of the end of such fiscal quarter’ and (v) is available upon request by contacting the Funds in writing or by phone. PROXY VOTING (UNAUDITED) A description of the policies and procedures that the Funds use to determine how to vote proxies relating to portfolio securities and information regarding how the Funds voted those proxies during the most recent 12 month period ended June 30, is available without charge upon request by (1) calling the Funds at (866) 626-2672; and (2) from the Funds’ documents filed with the Securities and Exchange Commission (“SEC”) on the SEC’s website at www.sec.gov.
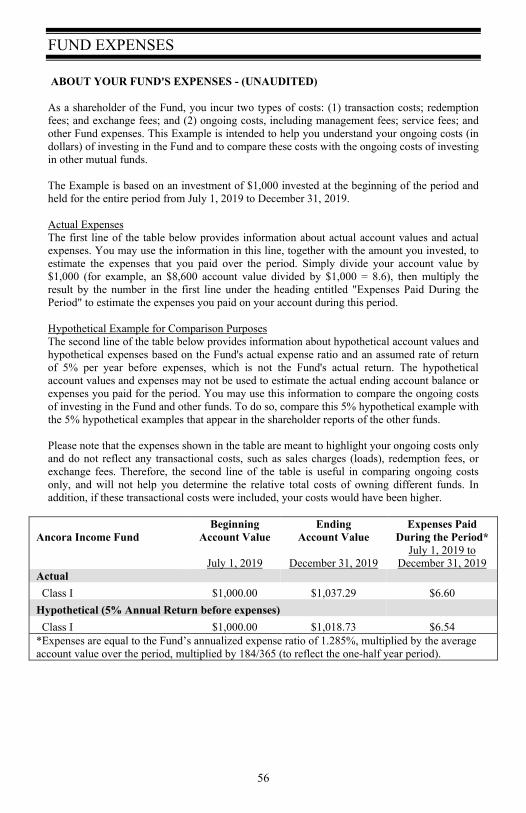
FUND EXPENSES
56
ABOUT YOUR FUND'S EXPENSES - (UNAUDITED) As a shareholder of the Fund, you incur two types of costs: (1) transaction costs; redemption fees; and exchange fees; and (2) ongoing costs, including management fees; service fees; and other Fund expenses. This Example is intended to help you understand your ongoing costs (in dollars) of investing in the Fund and to compare these costs with the ongoing costs of investing in other mutual funds. The Example is based on an investment of $1,000 invested at the beginning of the period and held for the entire period from July 1, 2019 to December 31, 2019. Actual Expenses The first line of the table below provides information about actual account values and actual expenses. You may use the information in this line, together with the amount you invested, to estimate the expenses that you paid over the period. Simply divide your account value by $1,000 (for example, an $8,600 account value divided by $1,000 = 8.6), then multiply the result by the number in the first line under the heading entitled "Expenses Paid During the Period" to estimate the expenses you paid on your account during this period. Hypothetical Example for Comparison Purposes The second line of the table below provides information about hypothetical account values and hypothetical expenses based on the Fund's actual expense ratio and an assumed rate of return of 5% per year before expenses, which is not the Fund's actual return. The hypothetical account values and expenses may not be used to estimate the actual ending account balance or expenses you paid for the period. You may use this information to compare the ongoing costs of investing in the Fund and other funds. To do so, compare this 5% hypothetical example with the 5% hypothetical examples that appear in the shareholder reports of the other funds. Please note that the expenses shown in the table are meant to highlight your ongoing costs only and do not reflect any transactional costs, such as sales charges (loads), redemption fees, or exchange fees. Therefore, the second line of the table is useful in comparing ongoing costs only, and will not help you determine the relative total costs of owning different funds. In addition, if these transactional costs were included, your costs would have been higher.
Ancora Income Fund Beginning
Account Value Ending
Account Value Expenses Paid
During the Period*
July 1, 2019 December 31, 2019 July 1, 2019 to
December 31, 2019 Actual Class I $1,000.00 $1,037.29 $6.60 Hypothetical (5% Annual Return before expenses) Class I $1,000.00 $1,018.73 $6.54 *Expenses are equal to the Fund’s annualized expense ratio of 1.285%, multiplied by the average account value over the period, multiplied by 184/365 (to reflect the one-half year period).
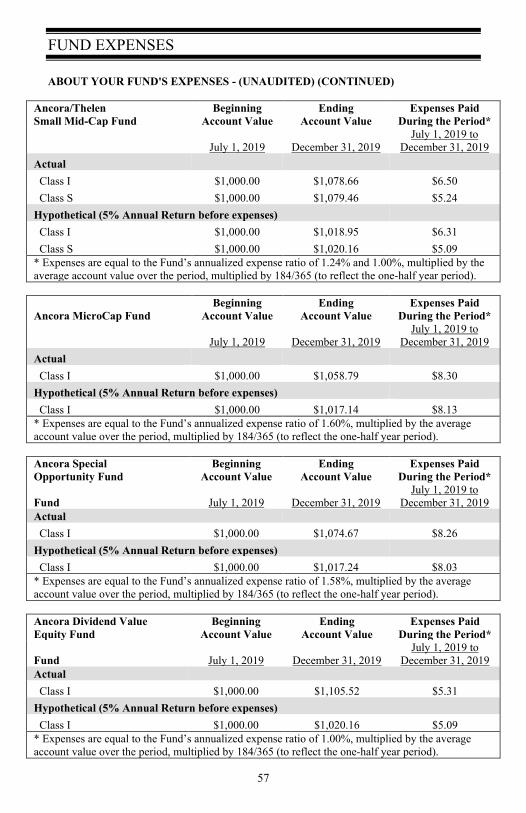
FUND EXPENSES
57
ABOUT YOUR FUND'S EXPENSES - (UNAUDITED) (CONTINUED)
Ancora/Thelen Small Mid-Cap Fund
Beginning Account Value
Ending Account Value
Expenses Paid During the Period*
July 1, 2019 December 31, 2019 July 1, 2019 to
December 31, 2019 Actual Class I $1,000.00 $1,078.66 $6.50 Class S $1,000.00 $1,079.46 $5.24 Hypothetical (5% Annual Return before expenses) Class I $1,000.00 $1,018.95 $6.31 Class S $1,000.00 $1,020.16 $5.09 * Expenses are equal to the Fund’s annualized expense ratio of 1.24% and 1.00%, multiplied by the average account value over the period, multiplied by 184/365 (to reflect the one-half year period).
Ancora MicroCap Fund Beginning
Account Value Ending
Account Value Expenses Paid
During the Period*
July 1, 2019 December 31, 2019 July 1, 2019 to
December 31, 2019 Actual Class I $1,000.00 $1,058.79 $8.30 Hypothetical (5% Annual Return before expenses) Class I $1,000.00 $1,017.14 $8.13 * Expenses are equal to the Fund’s annualized expense ratio of 1.60%, multiplied by the average account value over the period, multiplied by 184/365 (to reflect the one-half year period).
Ancora Special Opportunity Fund
Beginning Account Value
Ending Account Value
Expenses Paid During the Period*
Fund July 1, 2019 December 31, 2019 July 1, 2019 to
December 31, 2019 Actual Class I $1,000.00 $1,074.67 $8.26 Hypothetical (5% Annual Return before expenses) Class I $1,000.00 $1,017.24 $8.03 * Expenses are equal to the Fund’s annualized expense ratio of 1.58%, multiplied by the average account value over the period, multiplied by 184/365 (to reflect the one-half year period).
Ancora Dividend Value Equity Fund
Beginning Account Value
Ending Account Value
Expenses Paid During the Period*
Fund July 1, 2019 December 31, 2019 July 1, 2019 to
December 31, 2019 Actual Class I $1,000.00 $1,105.52 $5.31 Hypothetical (5% Annual Return before expenses) Class I $1,000.00 $1,020.16 $5.09 * Expenses are equal to the Fund’s annualized expense ratio of 1.00%, multiplied by the average account value over the period, multiplied by 184/365 (to reflect the one-half year period).

TRUSTEES & OFFICERS (UNAUDITED)
58
The Board of Trustees is responsible for managing the Funds’ business affairs and for exercising each Fund’s powers except those reserved for the shareholders. The day-to-day operations of the Funds are conducted by its officers. The following table provides biographical information with respect to each current Trustee and officer of the Funds.
Name, Address and Age
Position(s) Held with the Fund
Term of Office (1) and
Length of Time Served
Principal Occupation(s)
During the Past 5 Years
Number of Portfolios in Fund Complex Overseen Other Directorships
Independent Trustees: Frank J. Roddy
29500 Solon Road Solon, OH 44139
Trustee Since April 30, 2019
Retired Executive Vice President of Finance and Administration at Swagelok Company
from 2012 until 2018.
5 Member of: Board of Cleveland Central Catholic
High School; Northeast Ohio Alumni Advisory
Board for Ernst & Young; Cleveland Advisory Board
of FM Global; Conrad Companies Board of Advisors; VEC Inc. Advisory Board; and Swagelok Company
Advisory Board.
58
Jennifer A. Rasmussen Trustee Since April 30, Chief Operating Officer
of FSM Capital Management, LLC,
since July 2007.
5 None. 6060 Parkland Boulevard,
Suite 200 Cleveland, Ohio 44124
45
2019
Cindy Flynn
1801 East 9th Street Cleveland, OH 44114
Trustee
Since April 30, 2019
Executive Vice President & Chief
Administrative Officer of New York
Community Bancorp., Inc. from 2009 to 2018.
5 Board Member of: Greater Cleveland Sports
Commission; University Hospitals Cleveland
Medical Center; Rainbow Babies & Children’s Foundation; Western
Reserve Historical Society; and the Recreation League
of Cleveland
55
Frank DeFino Trustee Since June
2014 President and owner of
AJD Holding Co. (private
equity firm) from 1976 to the
present.
5 None. 2181 Enterprise Parkway Twinsburg, OH 44087
65
(1) Each trustee holds office for an indefinite term until the earlier of (i) the election of his or her successor or (ii) the date the trustee dies, resigns or is removed. For the year ended December 31, 2019, former trustees, Raj Aggarwal, Donald Lerner, and Anne Peterson Ogan, were paid a fee of $3,900. For the year ended December 31, 2019, trustee, Frank DeFino, was paid a fee of $18,900. For the year ended December 31, 2019, trustees, Frank J. Roddy, Jennifer A. Rasmussen, and Cindy Flynn, were paid a fee of $15,000. Mandatory age retirement was approved at the February 13, 2019 board meeting.
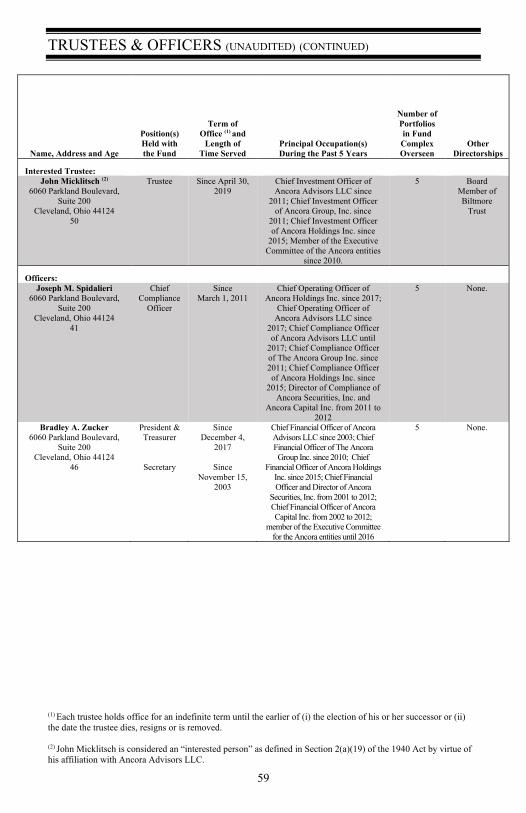
TRUSTEES & OFFICERS (UNAUDITED) (CONTINUED)
59
Name, Address and Age
Position(s) Held with the Fund
Term of Office (1) and
Length of Time Served
Principal Occupation(s) During the Past 5 Years
Number of Portfolios in Fund Complex Overseen
Other Directorships
Interested Trustee: John Micklitsch (2)
6060 Parkland Boulevard, Suite 200
Cleveland, Ohio 44124 50
Trustee Since April 30, 2019
Chief Investment Officer of Ancora Advisors LLC since
2011; Chief Investment Officer of Ancora Group, Inc. since
2011; Chief Investment Officer of Ancora Holdings Inc. since
2015; Member of the Executive Committee of the Ancora entities
since 2010.
5 Board Member of Biltmore
Trust
Officers: Joseph M. Spidalieri
6060 Parkland Boulevard, Suite 200
Cleveland, Ohio 44124 41
Chief Compliance
Officer
Since March 1, 2011
Chief Operating Officer of Ancora Holdings Inc. since 2017;
Chief Operating Officer of Ancora Advisors LLC since
2017; Chief Compliance Officer of Ancora Advisors LLC until
2017; Chief Compliance Officer of The Ancora Group Inc. since 2011; Chief Compliance Officer of Ancora Holdings Inc. since
2015; Director of Compliance of Ancora Securities, Inc. and
Ancora Capital Inc. from 2011 to 2012
5 None.
Bradley A. Zucker 6060 Parkland Boulevard,
Suite 200 Cleveland, Ohio 44124
46
President & Treasurer
Secretary
Since December 4,
2017
Since November 15,
2003
Chief Financial Officer of Ancora Advisors LLC since 2003; Chief Financial Officer of The Ancora Group Inc. since 2010; Chief
Financial Officer of Ancora Holdings Inc. since 2015; Chief Financial Officer and Director of Ancora
Securities, Inc. from 2001 to 2012; Chief Financial Officer of Ancora Capital Inc. from 2002 to 2012;
member of the Executive Committee for the Ancora entities until 2016
5 None.
(1) Each trustee holds office for an indefinite term until the earlier of (i) the election of his or her successor or (ii) the date the trustee dies, resigns or is removed. (2) John Micklitsch is considered an “interested person” as defined in Section 2(a)(19) of the 1940 Act by virtue of his affiliation with Ancora Advisors LLC.

PRIVACY POLICY
60
PRIVACY POLICY
FACTS
WHAT DOES ANCORA, WHOSE FAMILY OF COMPANIES INCLUDE ANCORA ADVISORS LLC, ANCORA FAMILY WEALTH ADVISORS, LLC, INVERNESS SECURITIES LLC, ANCORA RETIREMENT PLAN ADVISORS, INC., & ANCORA TRUST (“ANCORA”) DO WITH YOUR PERSONAL INFORMATION?
WHY?
Financial companies choose how they share your personal information. Federal law gives consumers the right to limit some but not all sharing. Federal law also requires us to tell you how we collect, share, and protect your personal information. Please read this notice carefully to understand what we do.
WHAT?
The types of personal information we collect and share depend on the product or service you have with us. This information may include, but is not limited to, the following: › Social security number › Risk tolerance › Income › Transaction history › Assets
› Account Numbers › Wire transfer instructions › Contact Information › Investment Experience › Account Balances
HOW?
All financial companies need to share customers’ personal information to run their everyday business. In the section below, we list the reasons financial companies can share their customers’ personal information; the reasons Ancora chooses to share; and whether you can limit this sharing.
Reasons we can share your personal information: Does
Ancora Share?
Can you limit this sharing?
For our everyday business purposes - such as to process your transactions, maintain your accounts(s) or respond to court orders and legal investigations.
Yes No
For our marketing purposes - to offer our products and services to you. Yes No
For joint marketing with other financial companies. Yes No For our affiliates' everyday business purposes - information about your transactions and experiences. Yes Yes
For our affiliates' everyday business purposes – information about your creditworthiness. No We don’t share
For our affiliates to market to you. Yes Yes For non-affiliates to market to you. No We don’t share
To limit our sharing:
To limit sharing, the Data Protection Officer can be contacted by email at [email protected] or by mail at: Data Protection Officer, Ancora, 6060 Parkland Boulevard, Suite 200, Cleveland, OH 44124.
Please note: Ancora cannot guarantee the security of your Personal Data while it’s in transit to us. Therefore, if you choose to contact the Data Protection Officer by email, we advise that you keep Personal Data to a minimum, and in particular that you do not include full account information. If you are a new customer, we can begin sharing your information [30] days from the date we sent this notice. When you are no longer our customer, we continue to share your information as described in this notice. However, you can contact us at any time to limit our sharing.
Questions? Call Jason Geers at 216-593-5020 or visit www.ancora.net/privacy_policy
eDelivery To opt out of eDelivery, call Jason Geers at 216-593-5020.
PRIVACY POLICY
61
Privacy Policy Page 2 Who We Are
Ancora Holdings Inc.
Ancora Holdings, Inc. is an employee owned, Cleveland, Ohio based holding company which wholly owns three separate and distinct SEC Registered Investment Advisers, Ancora Advisors, Inc., Ancora Family Wealth Advisors, LLC and Ancora Retirement Plan Advisors, Inc. and Inverness Securities LLC, a broker dealer.
Ancora Advisors LLC specializes in customized portfolio management for individual investors, high net worth investors, investment companies (mutual funds), pooled investments (hedge funds/investment limited partnerships), and institutions such as pension/profit sharing plans, corporations, charitable & “Not-for-Profit” organizations, and unions.
Ancora Family Wealth Advisors, LLC is a leading, regional investment and wealth advisor managing assets on behalf families and high net-worth individuals.
Ancora Retirement Plan Advisors, Inc. specializes in providing investment guidance and investment management for small and midsize employer sponsored retirement plans.
Inverness Securities, LLC is a FINRA registered Broker Dealer. Ancora Trust is the Trust of the Ancora Mutual Funds.
What We Do
How does Ancora protect my personal information?
To protect your personal information from unauthorized access and use, we use security measures that comply with federal law. These measures include computer safeguards and secured files and buildings.
How does Ancora collect my personal information?
We collect your personal information, for example, when you › Enter into an investment advisory contract › Seek financial advice › Make deposits or withdrawals from your account › Tell us about your investment or retirement portfolio › Give us your employment history
Why can’t I limit sharing?
Federal law gives you the right to limit only › sharing for affiliates’ everyday business purposes—
information about your creditworthiness › affiliates from using your information to market to you › sharing for nonaffiliates to market to you
State laws and individual companies may give you additional rights to limit sharing.
Definitions
Affiliates Companies related by common ownership or control. They can be financial and nonfinancial companies. › Ancora does share with our affiliates.
Nonaffiliates
Companies not related by common ownership or control. They can be financial and nonfinancial companies. › Ancora does not share with nonaffiliates so they can market to you.
Joint Marketing A formal agreement between nonaffiliated financial companies that together market financial products or services to you. › Ancora does not jointly market.
Cayman Island Data Protection Law and GDPR EU Privacy Policy visit www.ancora.net/disclosures

TRUSTEES Frank J. Roddy Jennifer A. Rasmussen Cindy Flynn Frank DeFino John Micklitsch OFFICERS Bradley Zucker, President, Treasurer, & Secretary Joseph Spidalieri, Chief Compliance Officer INVESTMENT ADVISOR Ancora Advisors LLC 6060 Parkland Boulevard, Suite 200 Cleveland, Ohio 44124 DISTRIBUTOR Arbor Court Capital LLC 8000 Town Center Drive, Suite 400 Broadview Heights, Ohio 44147 INDEPENDENT REGISTERED PUBLIC ACCOUNTING FIRM Cohen & Company, Ltd. 1350 Euclid Avenue, Suite 800 Cleveland, Ohio 44115 LEGAL COUNSEL McDonald Hopkins LLC 2100 Bank One Center 600 Superior Avenue E. Cleveland, Ohio 44114 CUSTODIAN U.S. Bank N.A. 425 Walnut Street Cincinnati, Ohio 45202 TRANSFER AGENT AND FUND ACCOUNTANT Mutual Shareholder Services, LLC. 8000 Town Centre Drive, Suite 400 Broadview Heights, Ohio 44147 This report is intended only for the information of shareholders or those who have received the Funds’ prospectus which contains information about the Funds’ management fee and expenses. Please read the prospectus carefully before investing.
The Funds’ Statement of Additional Information includes additional information about the Funds and is available upon request at no charge by calling the Fund.
Distributed by Arbor Court Capital LLC Member FINRA/SIPC


![Expectations of Risk Management Outpacing Capabilities – It’s Time For Action [Infographics suite]](https://img.dokumen.tips/doc/110x75/554dce7fb4c905d10e8b45c2/expectations-of-risk-management-outpacing-capabilities-its-time-for-action-infographics-suite.jpg)