Embed Size (px)
Citation preview
8/6/2019 Fitch - Growth of Leverage in China Still Outpacing GDP Growth_2011
http://slidepdf.com/reader/full/fitch-growth-of-leverage-in-china-still-outpacing-gdp-growth2011 1/8
Banks
www.fitchratings.com
China
Special Report
Chinese Banks Growth of Leverage Still Outpacing GDP Growth
Summary Two years after the peak of the 2009 lending boom, credit levels in China remainelevated. Although bank lending has slowed, this moderation is being offset by aburgeoning of new credit channels both within and outside the banking system.Consequently, growth of leverage continues to outpace growth of the economy.
In 2010, Fitch Ratings published reports on two key sources of credit leakage — theinformal securitisation of loans and the surge in undiscounted acceptances — andcalled for a broader view when assessing credit trends in mainland China. Since
then, the authorities have introduced a new measure, total societal financing (TSF),which is an important step in this direction. However, the TSF still omits a numberof items, and hence does not fully capture total formal and shadow financing.
Fitch has developed an adjusted TSF incorporating critical items currently omittedfrom the official gauge. The agency’s measure shows that China’s post‐crisis creditboom — often portrayed as a brief, isolated event in H109 — actually lasted twosolid years, and is still running quite strong. With credit still so loose, it is difficultto foresee inflation moving off the policy agenda any time soon, and any prematureeasing could risk a quicker‐than‐expected re‐acceleration of price increases.
· Fitch’s adjusted TSF shows that total financing is expected to exceed CNY18trnin 2011, or 38% of GDP, CNY3.5trn above the agency’s year‐end estimate for the
official TSF and more than double its CNY8trn estimate for new loans (Figure 1). · The main components of this uncaptured financing include letters of credit
(LoCs), credit from domestic trust companies, lending by other domestic non‐bank financial institutions (NBFIs) and loans from Hong Kong banks. All of theseare on pace to reach CNY700bn‐1trn in 2011.
· By end‐2011, total financing/GDP could reach 185%, up 61pp from 2007.Increases of similar magnitude have been seen elsewhere in the years leadingup to banking stress, underscoring the agency’s cautious outlook on the sector.
· That China’s economy is slowing while financing is still so abundant illustrateshow dependent growth remains on loose financing (Figure 2). This is furtherhighlighted by the continued low incremental economic return on new credit.Pre‐crisis, a CNY1 increase in financing yielded roughly CNY0.75 in new GDP,
but in 2009 this plummeted to CNY0.18. The economic return on credit is slowlyrising, but still has yet to fully recover.
Figure 1 Figure 2
09
18
27
36
45
2006 2007 2008 2009 2010 2011e Q111
Fitch additional credit financingTSF capital market financingTSF other credit financingTSF loans
Fitch‐Adjusted TSF
(% of GDP)
Source: PBOC
CNY3.5trn+
0
6,000
12,000
18,000
2006 2007 2008 2009 2010 2011
Fitch‐adjusted TSF net new financingTSF net new financingChange in nominal GDP
Trends in Financing & GDP
(CNYbn)
Source: PBOC
Financing/
GDP
0.76 0.78 0.70 0.18 0.34 0.42
Analysts
Charlene Chu+8610 8517 [email protected]
Chunling Wen+8610 8517 [email protected]
Hiddy He
+8610 8517 [email protected]
Jonathan Cornish+852 2263 [email protected]
Related Research
Applicable Criteria
· Global Financial Institutions Rating Criteria
(August 2010)
Other Research
· Fitch Affirms China's Ratings, Revises Local
Currency Outlook to Negative (April 2011)
· Fitch Affirms China's State Banks, But SeesSector Risks Rising (April 2011)
· China (April 2011)
· Chinese Banks: No Pause in Credit Growth,
Still on Pace with 2009 (December 2010)
· The Impact of a China Slowdown on Global
Credit Quality (November 2010)
· Macro‐Prudential Risk Monitor (June 2010)
· China: Stimulus Hangover? (October 2010)
· Chinese Banks: Informal SecuritisationIncreasingly Distorting Credit Data
(July 2010)
8/6/2019 Fitch - Growth of Leverage in China Still Outpacing GDP Growth_2011
http://slidepdf.com/reader/full/fitch-growth-of-leverage-in-china-still-outpacing-gdp-growth2011 2/8
Banks
Chinese BanksJuly 2011 2
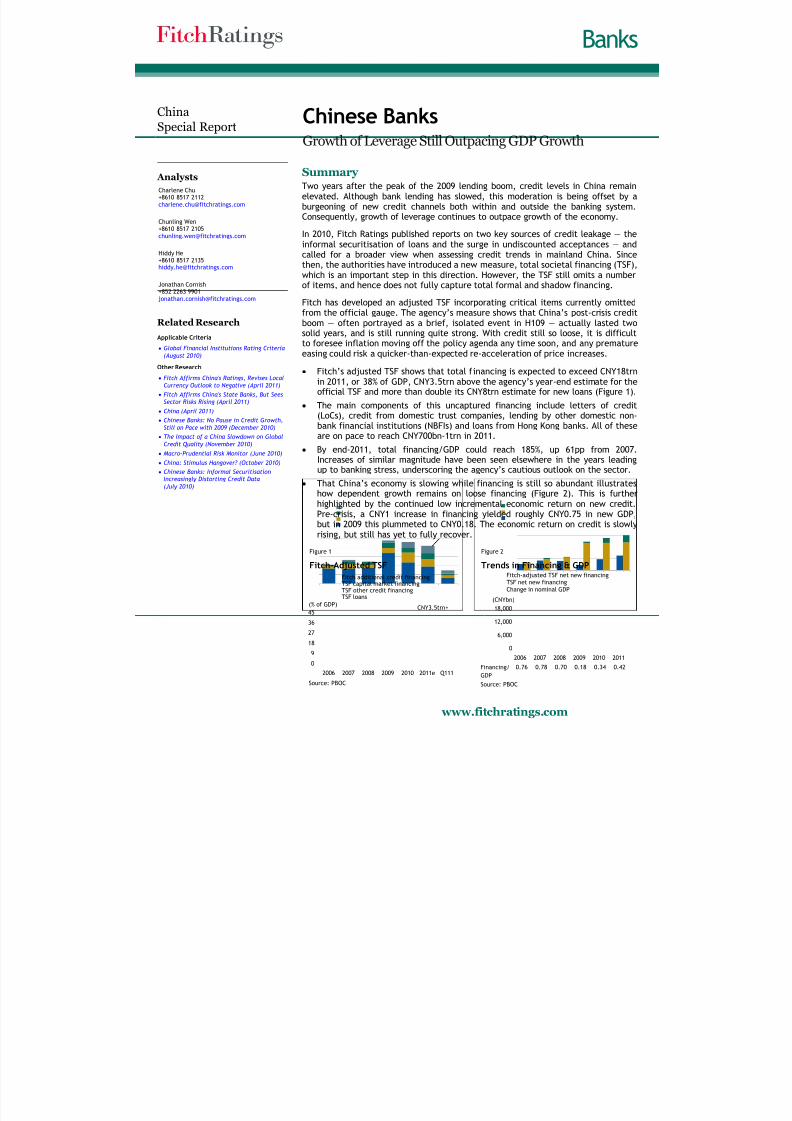
Behind the Official TSFThe People’s Bank of China’s (PBOC; the central bank) TSF consists of sevenprimary components: bank loans, undiscounted acceptances, tri‐party entrusted
lending, a small portion of trust company lending, domestic corporate bond andequity fundraising, insurance company investment in real estate, and insurancepolicy payouts to households and corporates. Also included is a small “other”category, which largely consists of lending by micro‐lenders (which are excludedfrom system‐wide loan figures) and private equity. Below are details on the mostcomplex items.
Bankers’ Acceptance Bills Bankers’ acceptance bills refer to undiscounted acceptances, or the gap betweenthe banking system’s off‐balance‐sheet acceptances and on‐balance‐sheetdiscounted bills. When a Chinese bank discounts an acceptance, the moneyextended is considered a form of lending and should be recorded in its loanportfolio. However, as Fitch observed last year, Chinese banks began heavily
offloading discounted bills in 2010, which has the effect of masking their true creditgrowth and credit exposure. As a result, the gap between acceptances and bills hassoared. This gap is expected to exceed CNY5trn outstanding by end‐June 2011,equivalent to more than an entire year of new bank loans before the global crisis(Figure 3).
Entrusted Loans Entrusted loans represent tri‐party loans in which entities not legally permitted toextend loans (e.g., corporates) do so by entrusting the money to a bank or financecompany, which then on‐lends the money to the designated borrower. Banks actmerely as transfer agents in such transactions, and take on no direct credit risk.
Trust Loans
Trust loans refer to credit extended through a specific type of trust product createdjointly with banks and whose underlying assets consist solely of loans. Issuance ofthese products has plummeted amid stricter regulation. However, many marketparticipants have incorrectly extrapolated this to mean that all trust activity haswaned, when in fact issuance of other trust products remains robust (see CreditFrom Domestic Trust Companies below).
Figure 4
0
3,000
6,000
9,000
12,000
15,000
2005 2006 2007 2008 2009 2010 Q110 Q111
0
9
18
27
36
45
Loans (LHS) Undiscounted acceptances (LHS)Entrusted loans (LHS) Trust loans (LHS)Insurance, bonds, equity, other (LHS) TSF (RHS)
Total Societal Financing
(CNYbn)
Source: PBOC
(% of GDP)
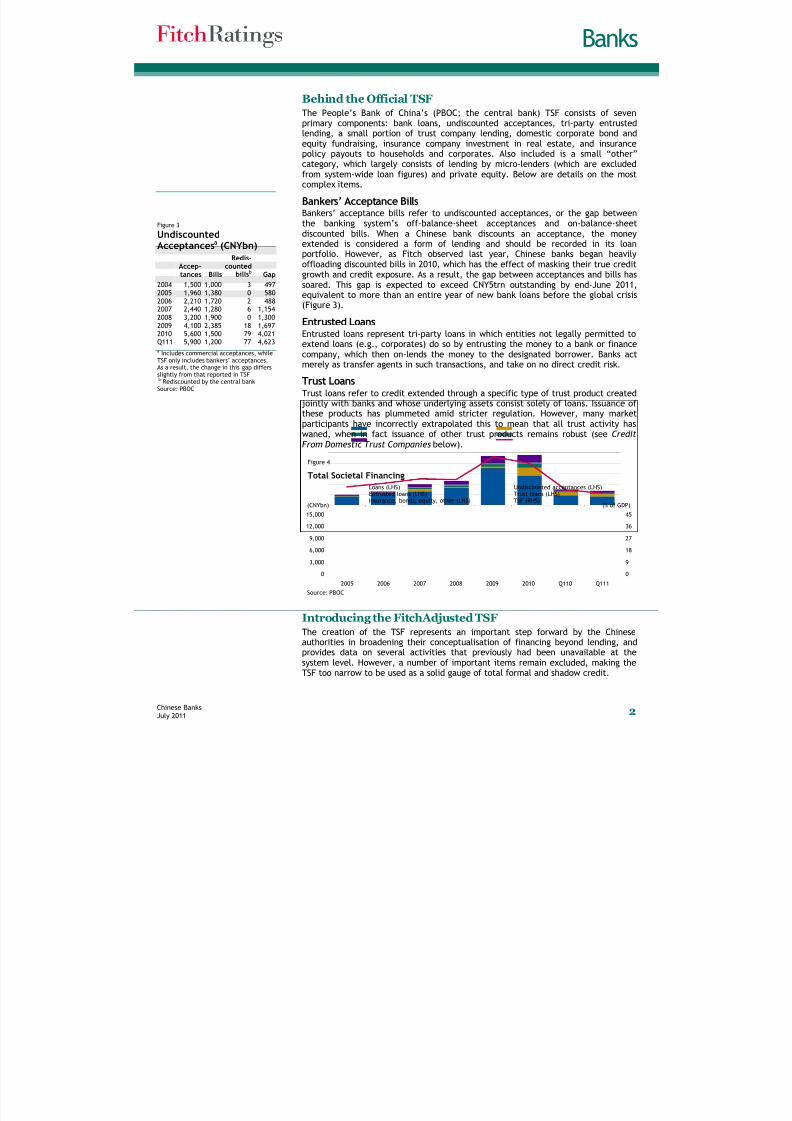
Introducing the Fitch Adjusted TSFThe creation of the TSF represents an important step forward by the Chineseauthorities in broadening their conceptualisation of financing beyond lending, and
provides data on several activities that previously had been unavailable at thesystem level. However, a number of important items remain excluded, making theTSF too narrow to be used as a solid gauge of total formal and shadow credit.
Figure 3
UndiscountedAcceptancesa (CNYbn)
Accep‐tances Bills
Redis‐countedbillsb Gap
2004 1,500 1,000 3 4972005 1,960 1,380 0 5802006 2,210 1,720 2 4882007 2,440 1,280 6 1,1542008 3,200 1,900 0 1,3002009 4,100 2,385 18 1,6972010 5,600 1,500 79 4,021Q111 5,900 1,200 77 4,623a Includes commercial acceptances, whileTSF only includes bankers’ acceptances.As a result, the change in this gap differsslightly from that reported in TSFb Rediscounted by the central bankSource: PBOC

8/6/2019 Fitch - Growth of Leverage in China Still Outpacing GDP Growth_2011
http://slidepdf.com/reader/full/fitch-growth-of-leverage-in-china-still-outpacing-gdp-growth2011 3/8
8/6/2019 Fitch - Growth of Leverage in China Still Outpacing GDP Growth_2011
http://slidepdf.com/reader/full/fitch-growth-of-leverage-in-china-still-outpacing-gdp-growth2011 4/8
8/6/2019 Fitch - Growth of Leverage in China Still Outpacing GDP Growth_2011
http://slidepdf.com/reader/full/fitch-growth-of-leverage-in-china-still-outpacing-gdp-growth2011 5/8
Banks
Chinese BanksJuly 2011 5
and single‐investor trust products, themajority of which are sold to banks,which then on‐sell the product to
investors as a bank wealth‐managementproduct (item 1.c.i. in Figure 8).Products sold on as bank wealth‐management products are generallyconsidered liabilities of banks, as theywould be reputationally on the hook forinvestor losses on any products sold bythem. Trust products not sold on bybanks are considered liabilities of thetrust companies themselves.
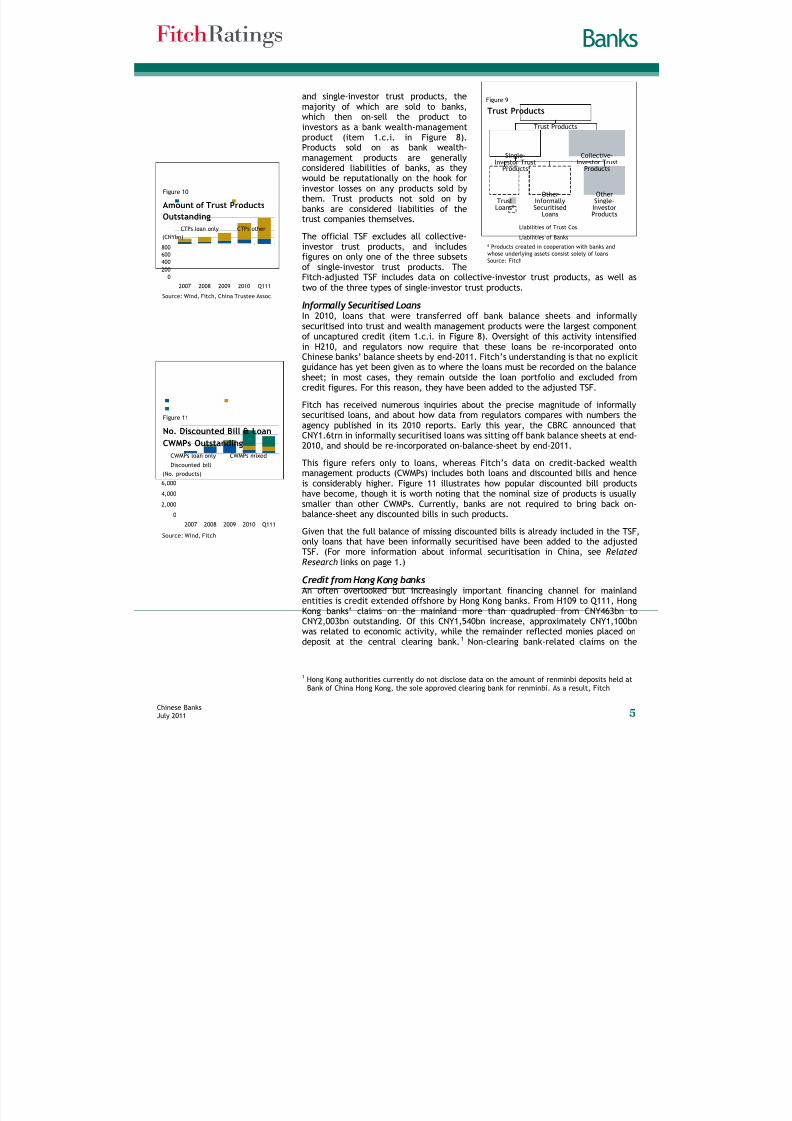
The official TSF excludes all collective‐investor trust products, and includes
figures on only one of the three subsetsof single‐investor trust products. TheFitch‐adjusted TSF includes data on collective‐investor trust products, as well astwo of the three types of single‐investor trust products.
Informally Securitised Loans In 2010, loans that were transferred off bank balance sheets and informallysecuritised into trust and wealth management products were the largest componentof uncaptured credit (item 1.c.i. in Figure 8). Oversight of this activity intensifiedin H210, and regulators now require that these loans be re‐incorporated ontoChinese banks’ balance sheets by end‐2011. Fitch’s understanding is that no explicitguidance has yet been given as to where the loans must be recorded on the balancesheet; in most cases, they remain outside the loan portfolio and excluded from
credit figures. For this reason, they have been added to the adjusted TSF.Fitch has received numerous inquiries about the precise magnitude of informallysecuritised loans, and about how data from regulators compares with numbers theagency published in its 2010 reports. Early this year, the CBRC announced thatCNY1.6trn in informally securitised loans was sitting off bank balance sheets at end‐2010, and should be re‐incorporated on‐balance‐sheet by end‐2011.
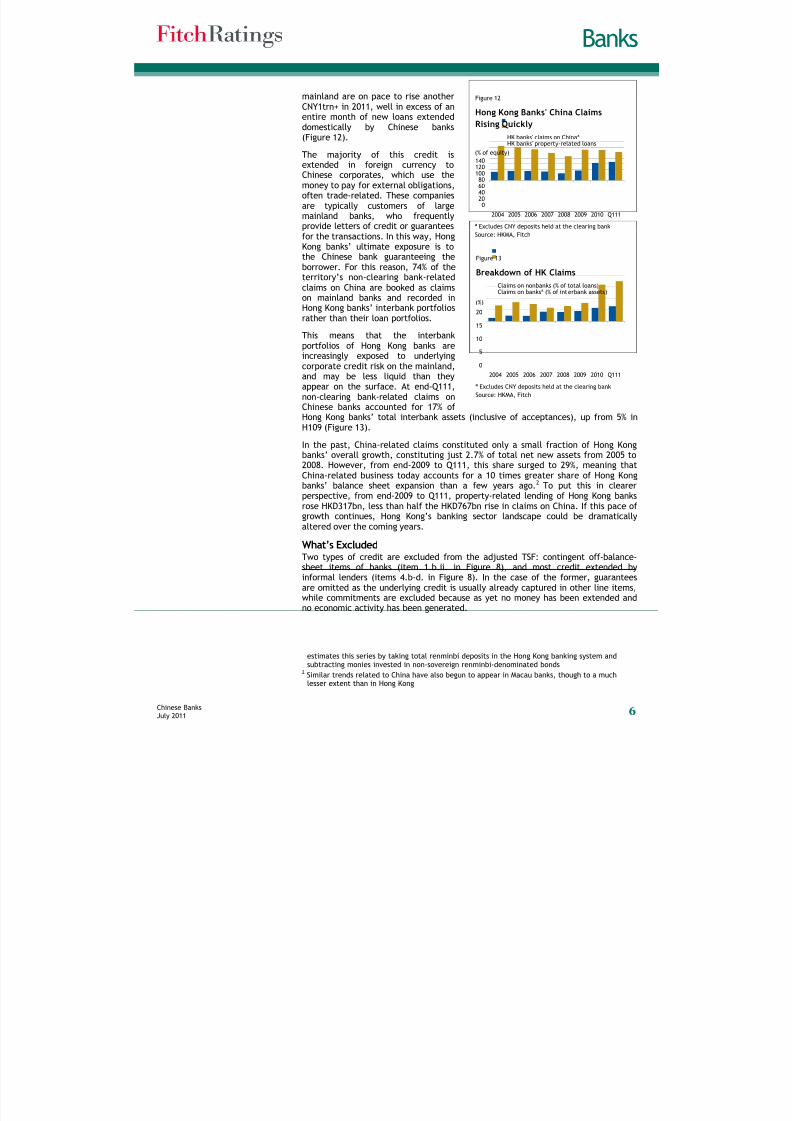
This figure refers only to loans, whereas Fitch’s data on credit‐backed wealthmanagement products (CWMPs) includes both loans and discounted bills and henceis considerably higher. Figure 11 illustrates how popular discounted bill productshave become, though it is worth noting that the nominal size of products is usuallysmaller than other CWMPs. Currently, banks are not required to bring back on‐balance‐sheet any discounted bills in such products.
Given that the full balance of missing discounted bills is already included in the TSF,only loans that have been informally securitised have been added to the adjustedTSF. (For more information about informal securitisation in China, see Related Research links on page 1.)
Credit from Hong Kong banks An often overlooked but increasingly important financing channel for mainlandentities is credit extended offshore by Hong Kong banks. From H109 to Q111, HongKong banks’ claims on the mainland more than quadrupled from CNY463bn toCNY2,003bn outstanding. Of this CNY1,540bn increase, approximately CNY1,100bnwas related to economic activity, while the remainder reflected monies placed ondeposit at the central clearing bank. 1 Non‐clearing bank‐related claims on the
1 Hong Kong authorities currently do not disclose data on the amount of renminbi deposits held atBank of China Hong Kong, the sole approved clearing bank for renminbi. As a result, Fitch
Figure 9
Trust Products
ª Products created in cooperation with banks andwhose underlying assets consist solely of loans
Source: Fitch
Trust Products
Single‐Investor Trust
Products
Collective‐Investor Trust
Products
TrustLoansª
OtherInformallySecuritised
Loans
OtherSingle‐InvestorProducts
Liabilities of Trust Cos.
Liabilities of Banks
Figure 10
0
200400
600
800
2007 2008 2009 2010 Q111
CTPs loan only CTPs other
Amount of Trust Products
Outstanding
(CNYbn)
Source: Wind, Fitch, China Trustee Assoc.
Figure 11
0
2,000
4,000
6,000
2007 2008 2009 2010 Q111
CWMPs loan only CWMPs mixed
Discounted bill
No. Discounted Bill & Loan
CWMPs Outstanding
(No. products)
Source: Wind, Fitch
8/6/2019 Fitch - Growth of Leverage in China Still Outpacing GDP Growth_2011
http://slidepdf.com/reader/full/fitch-growth-of-leverage-in-china-still-outpacing-gdp-growth2011 6/8
Banks
Chinese BanksJuly 2011 6
mainland are on pace to rise anotherCNY1trn+ in 2011, well in excess of anentire month of new loans extended
domestically by Chinese banks(Figure 12).
The majority of this credit isextended in foreign currency toChinese corporates, which use themoney to pay for external obligations,often trade‐related. These companiesare typically customers of largemainland banks, who frequentlyprovide letters of credit or guaranteesfor the transactions. In this way, HongKong banks’ ultimate exposure is to
the Chinese bank guaranteeing theborrower. For this reason, 74% of theterritory’s non‐clearing bank‐relatedclaims on China are booked as claimson mainland banks and recorded inHong Kong banks’ interbank portfoliosrather than their loan portfolios.
This means that the interbankportfolios of Hong Kong banks areincreasingly exposed to underlyingcorporate credit risk on the mainland,and may be less liquid than theyappear on the surface. At end‐Q111,non‐clearing bank‐related claims onChinese banks accounted for 17% ofHong Kong banks’ total interbank assets (inclusive of acceptances), up from 5% inH109 (Figure 13).
In the past, China‐related claims constituted only a small fraction of Hong Kongbanks’ overall growth, constituting just 2.7% of total net new assets from 2005 to2008. However, from end‐2009 to Q111, this share surged to 29%, meaning thatChina‐related business today accounts for a 10 times greater share of Hong Kongbanks’ balance sheet expansion than a few years ago. 2 To put this in clearerperspective, from end‐2009 to Q111, property‐related lending of Hong Kong banksrose HKD317bn, less than half the HKD767bn rise in claims on China. If this pace ofgrowth continues, Hong Kong’s banking sector landscape could be dramaticallyaltered over the coming years.
What’s Excluded Two types of credit are excluded from the adjusted TSF: contingent off‐balance‐sheet items of banks (item 1.b.ii. in Figure 8), and most credit extended byinformal lenders (items 4.b‐d. in Figure 8). In the case of the former, guaranteesare omitted as the underlying credit is usually already captured in other line items,while commitments are excluded because as yet no money has been extended andno economic activity has been generated.
estimates this series by taking total renminbi deposits in the Hong Kong banking system andsubtracting monies invested in non‐sovereign renminbi‐denominated bonds
2 Similar trends related to China have also begun to appear in Macau banks, though to a muchlesser extent than in Hong Kong
Figure 12
020406080
100120140
2004 2005 2006 2007 2008 2009 2010 Q111
HK banks' claims on ChinaªHK banks' property‐related loans
Hong Kong Banks' China Claims
Rising Quickly
(% of equity)
ª Excludes CNY deposits held at the clearing bank
Source: HKMA, Fitch
Figure 13
0
5
10
15
20
2004 2005 2006 2007 2008 2009 2010 Q111
Claims on nonbanks (% of total loans)Claims on banksª (% of interbank assets)
Breakdown of HK Claims
(%)
ª Excludes CNY deposits held at the clearing bank
Source: HKMA, Fitch
8/6/2019 Fitch - Growth of Leverage in China Still Outpacing GDP Growth_2011
http://slidepdf.com/reader/full/fitch-growth-of-leverage-in-china-still-outpacing-gdp-growth2011 7/8
Banks
Chinese BanksJuly 2011 7
Informal lending, particularly inter‐enterprise credit, has accelerated in 2011, butso far no comprehensive, reliable sources of data exist except for that on micro‐lending companies, which is already included in the TSF under the “other” category.
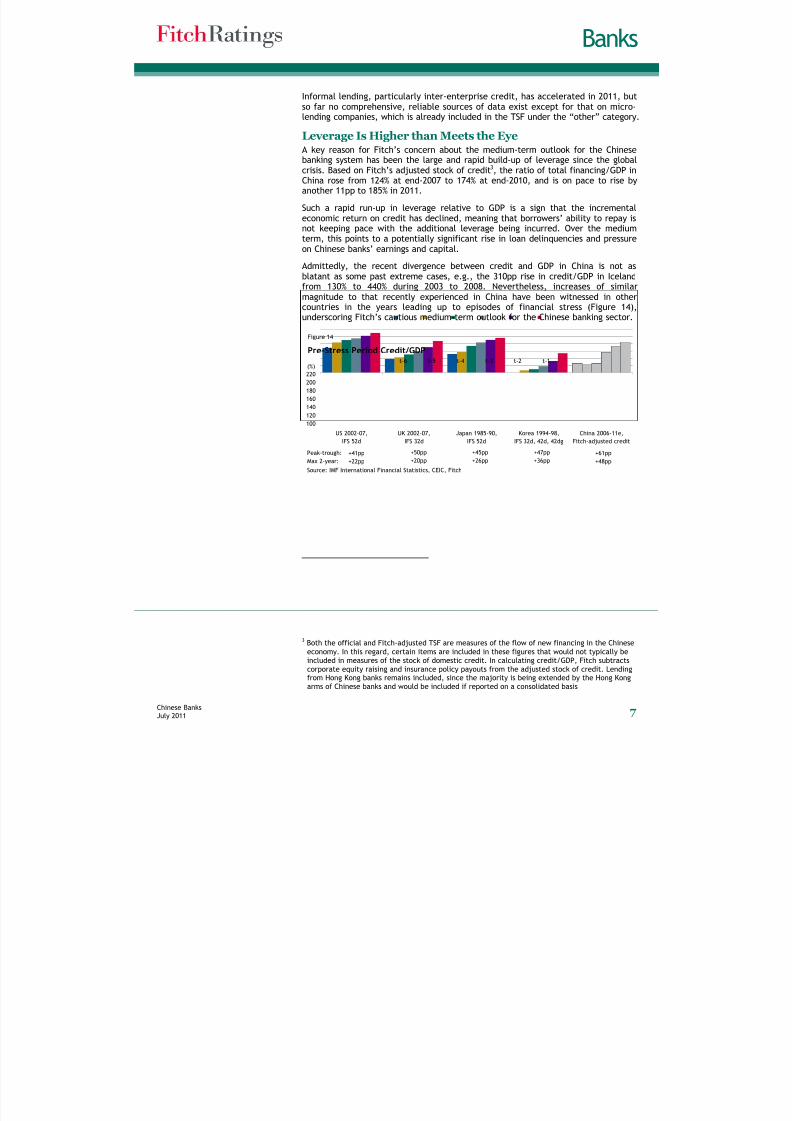
Leverage Is Higher than Meets the EyeA key reason for Fitch’s concern about the medium‐term outlook for the Chinesebanking system has been the large and rapid build‐up of leverage since the globalcrisis. Based on Fitch’s adjusted stock of credit3, the ratio of total financing/GDP inChina rose from 124% at end‐2007 to 174% at end‐2010, and is on pace to rise byanother 11pp to 185% in 2011.
Such a rapid run‐up in leverage relative to GDP is a sign that the incrementaleconomic return on credit has declined, meaning that borrowers’ ability to repay isnot keeping pace with the additional leverage being incurred. Over the mediumterm, this points to a potentially significant rise in loan delinquencies and pressureon Chinese banks’ earnings and capital.
Admittedly, the recent divergence between credit and GDP in China is not asblatant as some past extreme cases, e.g., the 310pp rise in credit/GDP in Icelandfrom 130% to 440% during 2003 to 2008. Nevertheless, increases of similarmagnitude to that recently experienced in China have been witnessed in othercountries in the years leading up to episodes of financial stress (Figure 14),underscoring Fitch’s cautious medium‐term outlook for the Chinese banking sector.
Figure 14
100
120
140
160180
200
220
US 2002‐07,
IFS 52d
UK 2002‐07,
IFS 32d
Japan 1985‐90,
IFS 52d
Korea 1994‐98,
IFS 32d, 42d, 42dg
China 2006‐11e,
Fitch‐adjusted credit
t‐6 t‐5 t‐4 t‐3 t‐2 t‐1
Pre‐Stress Period Credit/GDP
(%)
Source: IMF International Financial Statistics, CEIC, Fitch
+61pp
+48pp
+47pp
+36pp
+45pp
+26pp
+50pp
+20pp
+41pp
+22pp
Peak‐trough:
Max 2‐year:
3 Both the official and Fitch‐adjusted TSF are measures of the flow of new financing in the Chinese
economy. In this regard, certain items are included in these figures that would not typically beincluded in measures of the stock of domestic credit. In calculating credit/GDP, Fitch subtractscorporate equity raising and insurance policy payouts from the adjusted stock of credit. Lendingfrom Hong Kong banks remains included, since the majority is being extended by the Hong Kongarms of Chinese banks and would be included if reported on a consolidated basis
8/6/2019 Fitch - Growth of Leverage in China Still Outpacing GDP Growth_2011
http://slidepdf.com/reader/full/fitch-growth-of-leverage-in-china-still-outpacing-gdp-growth2011 8/8
Banks
Chinese BanksJuly 2011 8
ALL FITCH CREDIT RATINGS ARE SUBJECT TO CERTAIN LIMITATIONS AND DISCLAIMERS. PLEASE READTHESE LIMITATIONS AND DISCLAIMERS BY FOLLOWING THIS LINK:HTTP://FITCHRATINGS.COM/UNDERSTANDINGCREDITRATINGS . IN ADDITION, RATING DEFINITIONS ANDTHE TERMS OF USE OF SUCH RATINGS ARE AVAILABLE ON THE AGENCY'S PUBLIC WEB SITE ATWWW.FITCHRATINGS.COM. PUBLISHED RATINGS, CRITERIA, AND METHODOLOGIES ARE AVAILABLE FROMTHIS SITE AT ALL TIMES. FITCH'S CODE OF CONDUCT, CONFIDENTIALITY, CONFLICTS OF INTEREST,AFFILIATE FIREWALL, COMPLIANCE, AND OTHER RELEVANT POLICIES AND PROCEDURES ARE ALSOAVAILABLE FROM THE CODE OF CONDUCT SECTION OF THIS SITE.
Copyright © 2011 by Fitch, Inc., Fitch Ratings Ltd. and its subsidiaries. One State Street Plaza, NY, NY 10004.Telephone: 1‐800‐753‐4824,(212) 908‐0500. Fax: (212) 480‐4435. Reproduction or retransmission in whole or in part is prohibited except by permission. All rightsreserved. In issuing and maintaining its ratings, Fitch relies on factual information it receives from issuers and underwriters and fromother sources Fitch believes to be credible. Fitch conducts a reasonable investigation of the factual information relied upon by it inaccordance with its ratings methodology, and obtains reasonable verification of that information from independent sources, to the extentsuch sources are available for a given security or in a given jurisdiction. The manner of Fitch’s factual investigation and the scope of thethird‐party verification it obtains will vary depending on the nature of the rated security and its issuer, the requirements and practices inthe jurisdiction in which the rated security is offered and sold and/or the issuer is located, the availability and nature of relevant publicinformation, access to the management of the issuer and its advisers, the availability of pre‐existing third‐party verifications such as auditreports, agreed‐upon procedures letters, appraisals, actuarial reports, engineering reports, legal opinions and other reports provided bythird parties, the availability of independent and competent third‐party verification sources with respect to the particular security or inthe particular jurisdiction of the issuer, and a variety of other factors. Users of Fitch’s ratings should understand that neither an enhancedfactual investigation nor any third‐party verification can ensure that all of the information Fitch relies on in connection with a rating willbe accurate and complete. Ultimately, the issuer and its advisers are responsible for the accuracy of the information they provide to Fitchand to the market in offering documents and other reports. In issuing its ratings Fitch must rely on the work of experts, includingindependent auditors with respect to financial statements and attorneys with respect to legal and tax matters. Further, ratings areinherently forward‐looking and embody assumptions and predictions about future events that by their nature cannot be verified as facts.As a result, despite any verification of current facts, ratings can be affected by future events or conditions that were not anticipated atthe time a rating was issued or affirmed.
The information in this report is provided “as is” without any representation or warranty of any kind. A Fitch rating is an opinion as to thecreditworthiness of a security. This opinion is based on established criteria and methodologies that Fitch is continuously evaluating andupdating. Therefore, ratings are the collective work product of Fitch and no individual, or group of individuals, is solely responsible for arating. The rating does not address the risk of loss due to risks other than credit risk, unless such risk is specifically mentioned. Fitch isnot engaged in the offer or sale of any security. All Fitch reports have shared authorship. Individuals identified in a Fitch report wereinvolved in, but are not solely responsible for, the opinions stated therein. The individuals are named for contact purposes only. A reportproviding a Fitch rating is neither a prospectus nor a substitute for the information assembled, verified and presented to investors by theissuer and its agents in connection with the sale of the securities. Ratings may be changed or withdrawn at anytime for any reason in thesole discretion of Fitch. Fitch does not provide investment advice of any sort. Ratings are not a recommendation to buy, sell, or hold anysecurity. Ratings do not comment on the adequacy of market price, the suitability of any security for a particular investor, or the tax‐exempt nature or taxability of payments made in respect to any security. Fitch receives fees from issuers, insurers, guarantors, otherobligors, and underwriters for rating securities. Such fees generally vary from US$1,000 to US$750,000 (or the applicable currency
equivalent) per issue. In certain cases, Fitch will rate all or a number of issues issued by a particular issuer, or insured or guaranteed by aparticular insurer or guarantor, for a single annual fee. Such fees are expected to vary from US$10,000 to US$1,500,000 (or the applicablecurrency equivalent). The assignment, publication, or dissemination of a rating by Fitch shall not constitute a consent by Fitch to use itsname as an expert in connection with any registration statement filed under the United States securities laws, the Financial Services andMarkets Act of 2000 of Great Britain, or the securities laws of any particular jurisdiction. Due to the relative efficiency of electronicpublishing and distribution, Fitch research may be available to electronic subscribers up to three days earlier than to print subscribers.