Embed Size (px)
Citation preview

Thailand Steel Industry 2009 and yOutlook 2010
Iron and Steel Institute of Thailand
18 May 201018 May 2010
1

Contents
Macro economics situation
Downstream industry situation
Steel industry in 2009 and 2010 outlook
2

Thai economy contracted by 2.3 % in 2009, faster than expected
Source: National Board of Economic and Social Development3
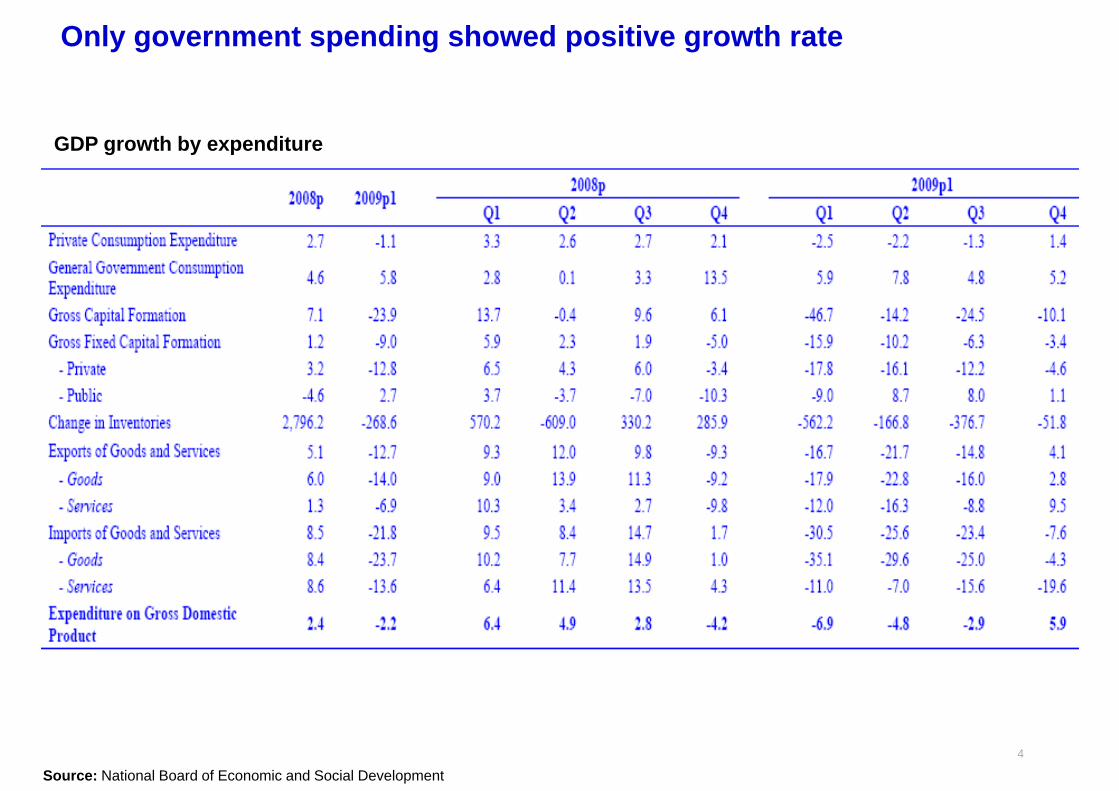
Only government spending showed positive growth rate
GDP growth by expenditure
Source: National Board of Economic and Social Development4

Before demonstration in center of Bangkok, economic outlook seem so well
Thailand GDP growth projection (%)
Jan 2010 Mar 2010
2010 2011 2010 2011
Capital Nomura 3.0 5.0 3.8 5.0
Kasikorn Research 3.0 4.0 4.8 4.5
Standard Charter 2 8 4 5 2 8 4 5Standard Charter 2.8 4.5 2.8 4.5
ING 4.0 5.0 4.8 5.2
DBS Bank 4.2 4.4 6.0 4.9
HSBC 4.6 4.7 5.7 4.4
Average 3.6 4.6 4.7 4.8
NESDB 3 0 – 4 0 n a 3 5 – 4 5 n aNESDB 3.0 – 4.0 n.a. 3.5 – 4.5 n.a.
Source: Bank of Thailand Inflation Report Apr 20105

Political unrest, lead to gloomy economic outlook
Transmission channels of political unrest into economic slower growth
Source: Nomura Global Economics6

Some research institutes revise economic outlook
E i tl k ith liti l t iEconomic outlook with political unrest issue
Remark* G fi d it l f ti
Source: Capital Nomura Securities
* Gross fixed capital formation** Customs department basis
7

Contents
Macro economics summary
Downstream industry summary
Steel industry in 2009 and 2010 outlook
8

Construction boom period already passed since 2004Permitted area for construction - Housing
20,000
22,000
Permitted area for construction - Total
14,000
16,000
Permitted area for construction Housing
16,000
18,000
10,000
12,000
10,000
12,000
14,000 2005 2006 2007 2008 2009
5,000
Permitted area for construction - Commercial
10,000
2005 2006 2007 2008 2009
2,000
3,000
4,000
0
1,000
2,000
2005 2006 2007 2008 2009
09/08
Highest record
during last 10 years
Highest record year
C t ti ('000 t )
5,000
Permitted area for construction - Industry
Construction ('000 square meter)
Permitted area for construction - Total -3% 22,698 2004
Permitted area for construction - Housing -12% 16,111 2004
Permitted area for construction Commercial 29% 3 755 2009
2,000
3,000
4,000Permitted area for construction - Commercial 29% 3,755 2009
Permitted area for construction - Industry 8% 2,947 2004
0
1,000
2005 2006 2007 2008 2009Source: Bank of Thailand
9

Housing structure change from house to condominium New housing registration in Bangkok and vicinity
90,000
100,000
New housing registration in Bangkok and vicinity area - Total
30,000
40,000
New housing registration in Bangkok and vicinity area - House
50 000
60,000
70,000
80,000
90,000
20,000
30,000
20,000
30,000
40,000
50,00010,000
2005 2006 2007 2008 2009
New housing registration in Bangkok and vicinity area - Condominium
10,000
2005 2006 2007 2008 2009
30,000
40,000
50,000
0
10,000
20,000
2005 2006 2007 2008 2009
40,000
New housing registration in Bangkok and vicinity area - Own construction
20 000
30,000
Source: Bank of Thailand10,000
20,000
2005 2006 2007 2008 2009
10
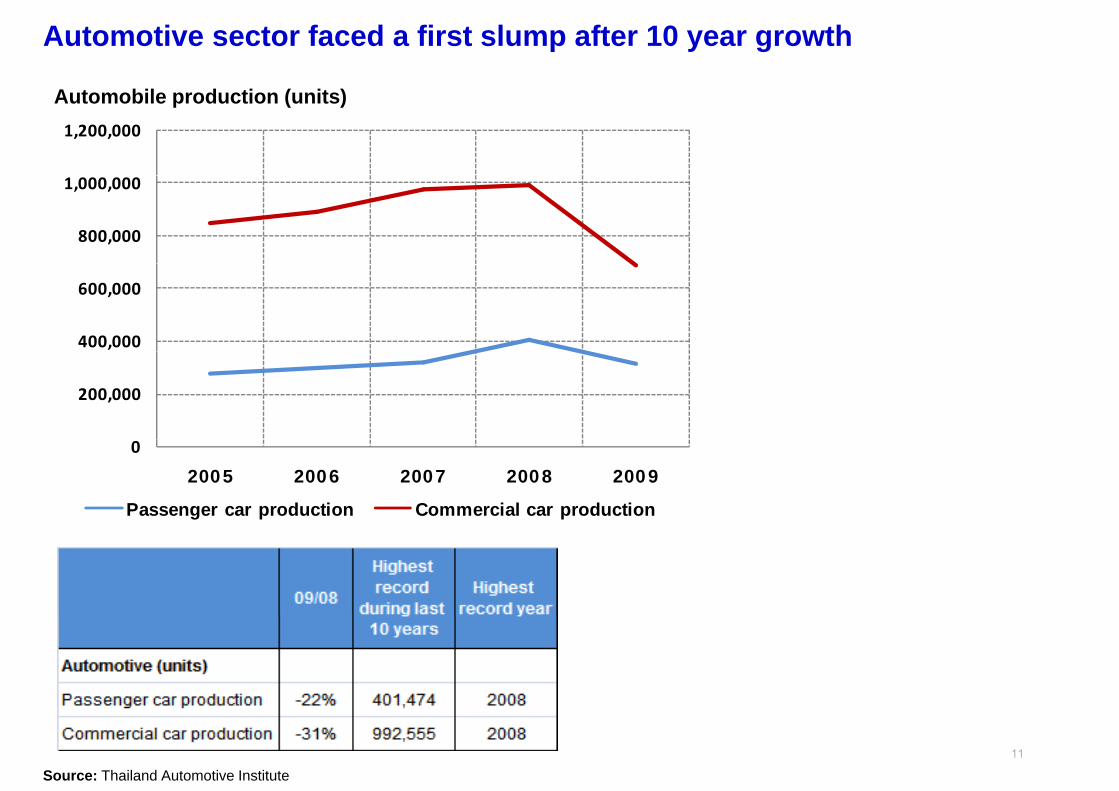
Automotive sector faced a first slump after 10 year growth
Automobile production (units)1,200,000
800,000
1,000,000
400,000
600,000
200,000
0
2005 2006 2007 2008 2009
Passenger car production Commercial car production
Source: Thailand Automotive Institute11
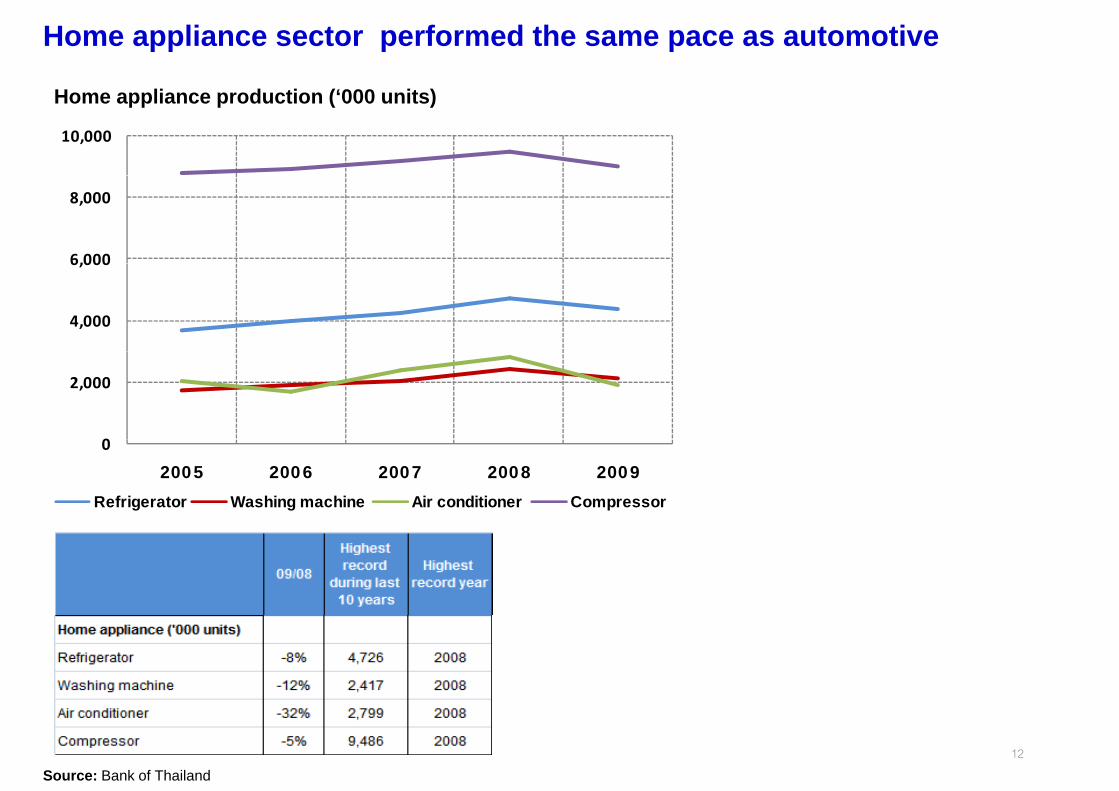
Home appliance sector performed the same pace as automotive
Home appliance production (‘000 units)
10,000
6,000
8,000
4,000
6,000
0
2,000
0
2005 2006 2007 2008 2009
Refrigerator Washing machine Air conditioner Compressor
Source: Bank of Thailand12

Hard disk production did not drop even facing global economic downturn
Hard disk production (‘000 units)
Hard disk
250,000
300,000
150,000
200,000
50,000
100,000
0
,
2005 2006 2007 2008 2009
Source: Bank of Thailand13
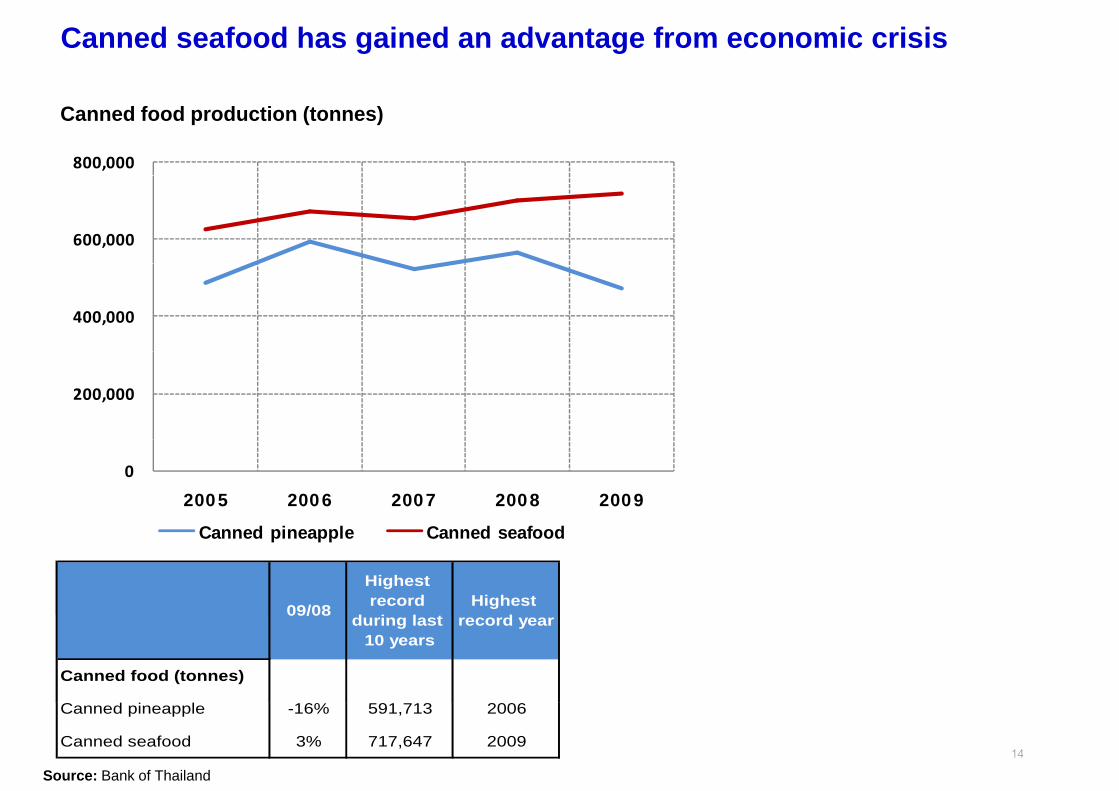
Canned seafood has gained an advantage from economic crisis
800,000
Canned food production (tonnes)
600,000
400,000
200,000
0
2005 2006 2007 2008 2009
C d i l C d f dCanned pineapple Canned seafood
09/08
Highest record
d i l tHighest
d09/08 during last 10 years
record year
Canned food (tonnes)
C d i l 16% 91 13 2006
Source: Bank of Thailand
Canned pineapple -16% 591,713 2006
Canned seafood 3% 717,647 200914

Contents
Macro economics situation
Downstream industry situation
Steel industry in 2009 and 2010 outlook
15
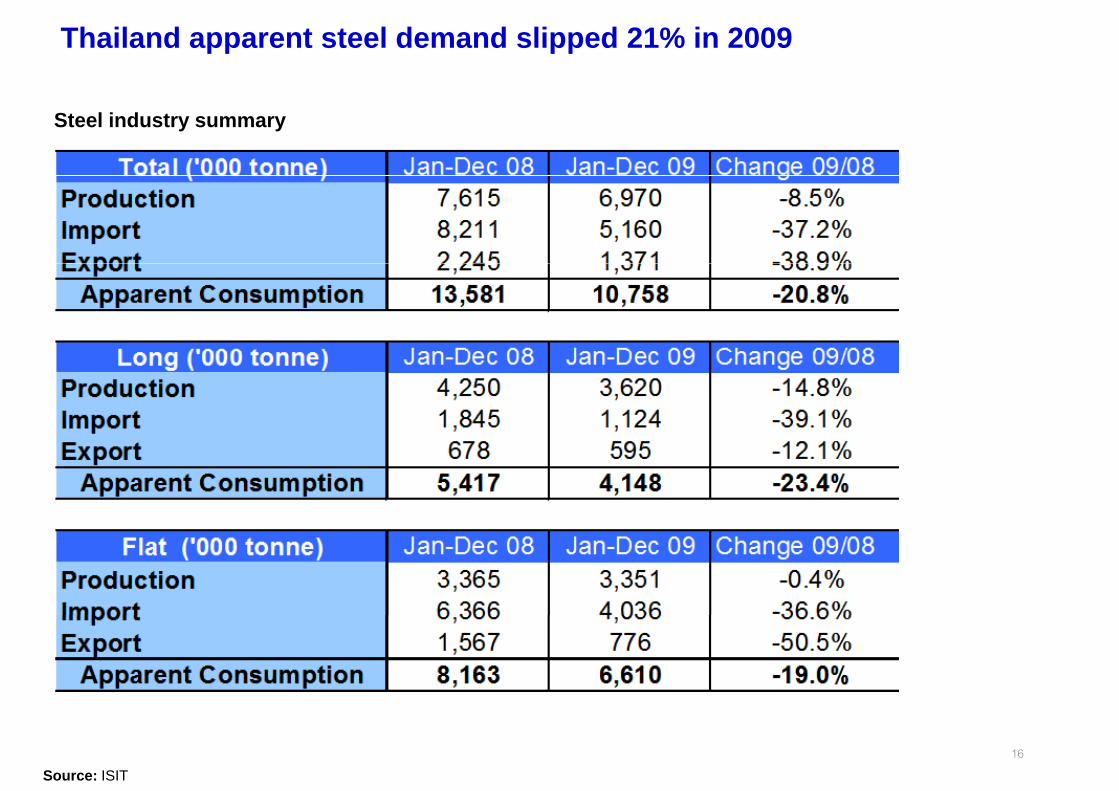
Thailand apparent steel demand slipped 21% in 2009
Steel industry summary
Source: ISIT16
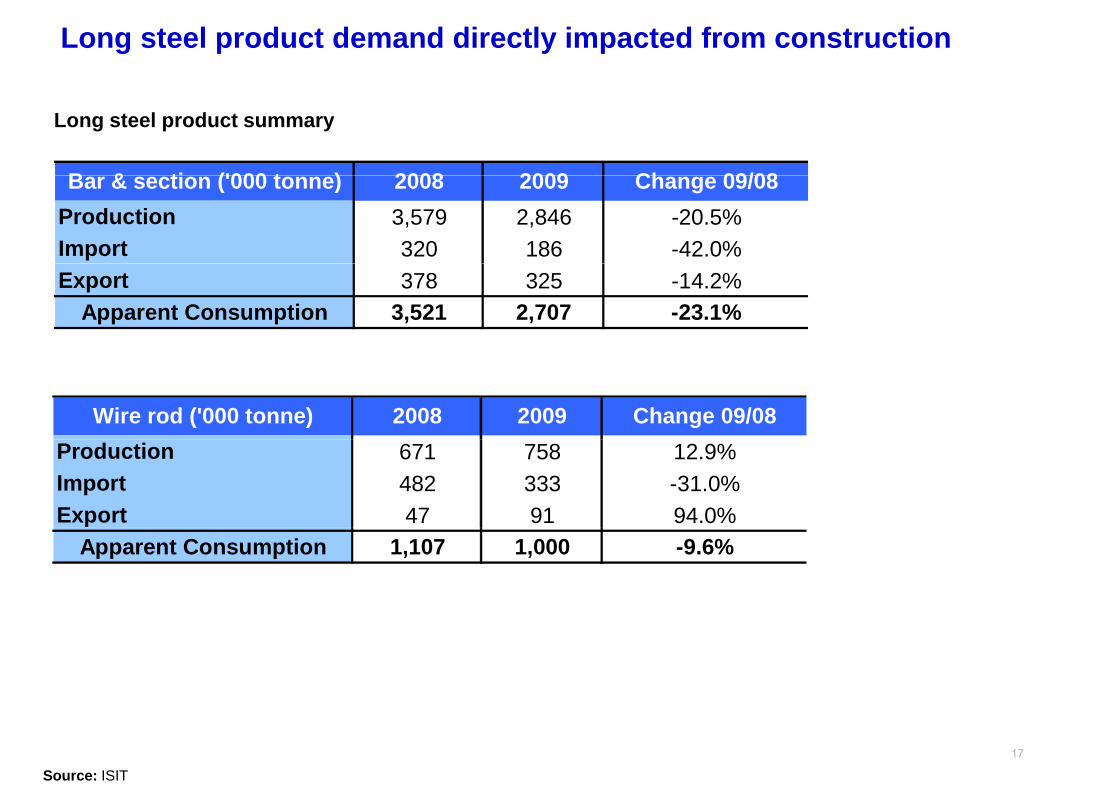
Long steel product demand directly impacted from construction
Long steel product summary
B & ti ('000 t ) 2008 2009 Ch 09/08Bar & section ('000 tonne) 2008 2009 Change 09/08Production 3,579 2,846 -20.5%Import 320 186 -42.0%Export 378 325 -14.2%
Apparent Consumption 3,521 2,707 -23.1%
Wire rod ('000 tonne) 2008 2009 Change 09/08Production 671 758 12.9%Import 482 333 -31.0%Export 47 91 94.0%
Apparent Consumption 1,107 1,000 -9.6%
Source: ISIT17

Imported steel dropped significantly due to production cut in manufacturing sectors
Flat steel product summary
HRC inc P&O ('000 tonne) 2008 2009 Change 09/08
g
HRC inc. P&O ( 000 tonne) 2008 2009 Change 09/08Production 2,846 3,042 6.9%Import 2,467 1,419 -42.5%E t 558 299 46 4%Export 558 299 -46.4%
Apparent Consumption 4,756 4,162 -12.5%
HRP ('000 tonne) 2008 2009 Change 09/08Production 518 308 -40.5%Import 162 92 -43.3%Export 255 66 -74.1%
Apparent Consumption 426 335 -21.4%
CRC carbon & stainless steel ('000 tonne) 2008 2009 Change 09/08Production 1,639 1,225 -25.2%Import 868 616 -29.1%Export 277 149 -46.1%
A C i 2 230 1 691 24 1%Apparent Consumption 2,230 1,691 -24.1%
Source: ISIT18
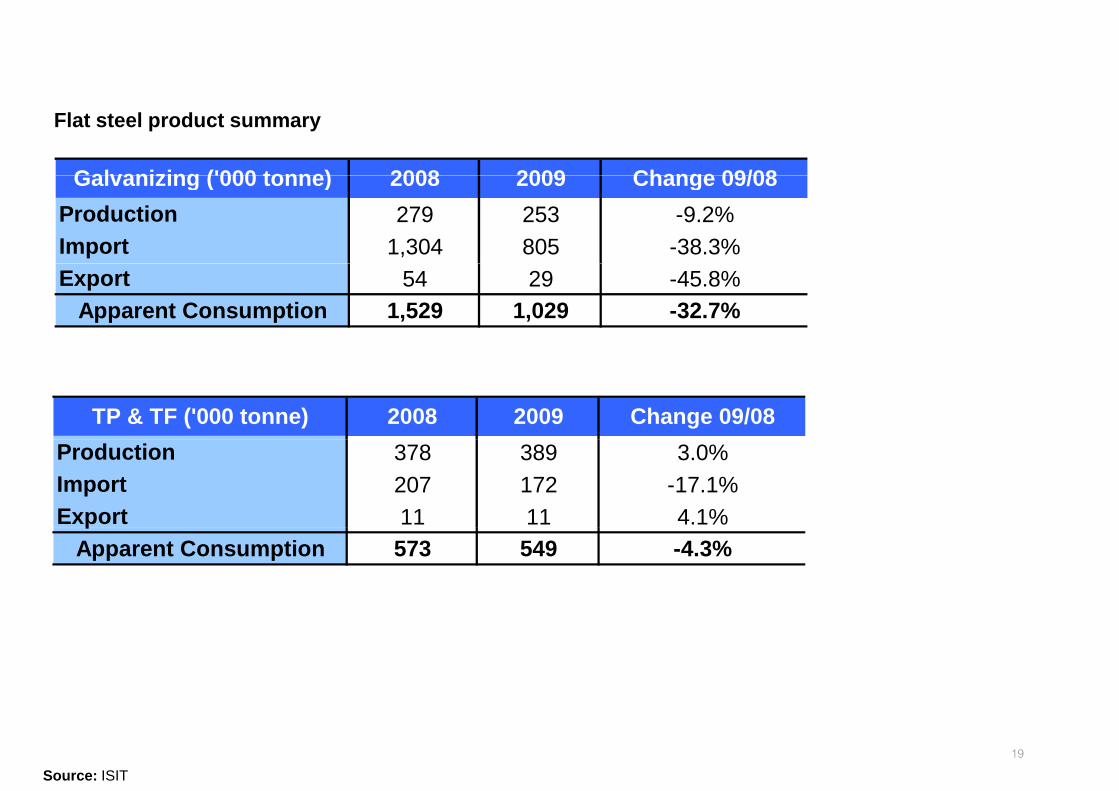
Flat steel product summary
Galvanizing ('000 tonne) 2008 2009 Change 09/08Galvanizing ( 000 tonne) 2008 2009 Change 09/08Production 279 253 -9.2%Import 1,304 805 -38.3%Export 54 29 -45.8%
Apparent Consumption 1,529 1,029 -32.7%
TP & TF ('000 tonne) 2008 2009 Change 09/08Production 378 389 3.0%Import 207 172 -17.1%Export 11 11 4.1%p
Apparent Consumption 573 549 -4.3%
Source: ISIT19

Recovery on manufacturing sectors has led to steel improving demand, especially import volume.p y p
Steel industry summary
Total ('000 tonne) Jan-Mar 09 Jan-Mar 10 Change 10/09Total ( 000 tonne) Jan Mar 09 Jan Mar 10 Change 10/09Production 1,409 2,138 51.8%Import 900 1,927 114.1%Export 362 435 20 4%Export 362 435 20.4%
Apparent Consumption 1,947 3,629 86.4%
L ('000 t ) J M 09 J M 10 Ch 10/09Long ('000 tonne) Jan-Mar 09 Jan-Mar 10 Change 10/09Production 709 1,133 59.8%Import 213 406 90.2%Export 133 188 40.9%
Apparent Consumption 790 1,351 71.2%
Flat ('000 tonne) Jan-Mar 09 Jan-Mar 10 Change 10/09Production 700 1,005 43.6%Import 686 1 521 121 6%Import 686 1,521 121.6%Export 228 248 8.5%
Apparent Consumption 1,158 2,278 96.8%
Source: ISIT20

Steel market already return to 2008 level
1,800,000
Steel industry situation
1,400,000
1,600,000
1 000 000
1,200,000
800,000
1,000,000
400,000
600,000
0
200,000
Jan
Feb
Mar
Apr
May
Jun
Jul
Aug Se
pO
ctN
ov Dec Jan
Feb
Mar
Apr
May
Jun
Jul
Aug Se
pO
ctN
ov Dec Jan
Feb
Mar
Apr
May
Jun
Jul
Aug Se
pO
ctN
ov Dec Jan
Feb
Mar
2007 2008 2009 2010
Production Import Export Consumption
Source: ISIT21

Construction is major consuming sector, but share decrease from 60% in last five years y
Steel industry demand structure in 2008100% = 13.5 million tonnes
Industrial13.1% Appliance
12 3%
Auto15.8%
12.3%
Packaging4.9%
OthersOthers0.3%
ConstructionConstruction53.6%
Source: ISIT22

In 2010, steel consuming industries are predicted to gain increasing growth in line with expanding Thailand economy.
10%Automotive production (unit)
35%New housing units in Bangkok Metropolis and Vicinity (unit)
100 068
120,000
1,287,3461,394,029 1,349,1601,400,000
1,600,000
67,82978,116 74,221 77,726
90,971100,068
60,000
80,000
100,000 1,125,315 1,188,0441,287,346
999,378
800,000
1,000,000
1,200,000
20,000
40,000
,
200,000
400,000
600,000
H li d ti ( 000 it) C d f d d ti ( 000 it)
0
2005 2006 2007 2008 2009 2010E0
2005 2006 2007 2008 2009 2010E
Home appliances production (,000 unit) 14% 8%Canned food production (,000 unit)
20,000
1 000 000
1,200,000
2 3802,799
1 9082,175
8,770 8,9079,187
9,4869,019
10,281
10,000
15,000
624,866670,092
652,950699,858
717,647775,059
600,000
800,000
1,000,000
3,686 3,985 4,227 4,726 4,367 4,9791,727 1,905 2,010 2,417 2,133 2,4322,023 1,681 2,380 1,908
0
5,000486,343
591,713 522,146 563,040 473,387 511,258
0
200,000
400,000
Source : REIC, TAI, NFI, EEI and ISIT analysis
2005 2006 2007 2008 2009 2010ERefrigerator Washing machine Air conditioner Compressor
02005 2006 2007 2008 2009 2010ECanned pineapple Canned seafood
23

Apparent steel demand in 2010 is projected to be 12.4 – 13.4 million tonnes
16,000
Apparent steel consumption forecast (‘000 tonnes)
% 10/09
13,876
12 15412,718
13,528
12 31612,000
14,000 13,407 24%
14%12,154
10,765
12,316
8 000
10,000
14%
6,000
8,000
2,000
4,000
02005 2006 2007 2008 2009 2010E
AssumptionConstruction sector expand with 5-10%Automotive production expand 30 -40%Electrical appliance production expand 10-20%
Source: ISIT
Electrical appliance production expand 10 20%Industrial sector expand 3% - 9%Export of canned food increase by 5-10%
24