Embed Size (px)
Citation preview

Chapter-II
TEXTILE INDUSTRY OF INDIA
In this chapter, an attempt has been made to bring out the
development perspective of Textile Industry of India. This brief review
helps us to forecast the future opportunities for Indian textile
industry.
2.1 Introduction
The Indian textile industry is a personification of Indian culture.
It has always occupied a place of honour in the industrial system of
India. The spindles and the spinning wheels found in the excavation of
the Sindhu Valley have proved that the textile industry is as old as
Sindhu Valley civilization1.
India had traditionally been the cotton textile producing
country. Cotton was grown, spun and cloth was woven in our country
even much earlier than other countries started manufacturing it.
Indian textiles were famous for their exquisite beauty and fineness. It
had become the symbol of aristocracy, gracefulness and artistry in the
high society of Europe. It reached the zenith of glory before the dawn
of industrial revolution in the west.
Mahatma Gandhi discovered the power of Charaka and used it
to spin the dream of Swaraj / Independence from the British Yoke.
Khadi being spun on Charaka has been associated with our heritage
and history since time immemorial.

32
But due to British Supremacy over India and impact of
industrial research and technology, unsystematic attitude of the
Government, lack of capital and severe competition from the foreign
countries, the Indian textile industry is facing many challenges, to
which there is need to find out solutions.
Today textile industry of India comprises of Khadi, Woolen, Silk
traditional handloom sector with primitive technology; powerloom
sector which is technologically improved form of the handloom sector
and the composite mill sector with its advanced technology. Among all
the three, the handloom sector is most scattered and spread
throughout the country and is seen even in remote country side.
Powerloom sector is decentralized and scattered in and around some
identified centers of handloom sector. The mill sector is well organised
and integrated with spinning, weaving and processing in the same
roof.
2.2 Handlooms of India
The process of weaving primarily constitutes interlacement of
two sets of threads viz warp and weft and the equipment which
operates this interlacement is called ‘loom’. The handloom is made up
of a stick or wooden frame for weaving but more often it is defined as
a frame for weaving equipped with some wooden devices2.
In India various types of looms are traditionally in practice. They
can be noted on the nature of cloth produced or the places of their
origin. They are generally named as pit loom, frame loom, Manipuri

33
loom, Rajasthani loom, Kashmiri loom etc. Very recently automatic
and semi automatic jacquard looms and mechanical jacquard looms
are becoming familiar in India.
Pit looms are the most widely used handlooms in India.
Interestingly, even today the finest varieties of fabrics, known for their
beautiful designs and textures, are produced on throw shuttle pit
looms. The famous ‘brocades’ of Varanasi, the ‘Jamdanies’ of Tanda,
the ‘Patola’ Saris of Patan, the Himroos’ of Aurangabad, to mention
only a few of a vast range of exquisite hand-woven fabric of India, are
produced on these simple throw shuttle pit looms. As the name
implies, the loom stands over a pit and the process of picking is done
by throwing the shuttle across the sley by hand3.
Frame looms have come into existence due to certain
advantages they have in weaving designed varieties with more than
two treadles. These are also helpful in weaving fabric requiring mass
production. Frame looms are employed in manufacturing attractive
furnishings, bed sheets and made up items on a large scale.
Semi-automatic looms are now acquiring popularity in some
weaving centers in the country. Only a limited range of fabrics can be
manufactured on these semi-automatic looms. These looms are
operated by human effort by pedaling with legs or by moving the sley
by hand.

34
Though the methods employed in making handloom fabric are
simple, the results are rather extra ordinary. The human involvement
and ingenuity results in creations which are unique and aesthetically
delightful.
According to the statistics available the handloom industry of
India provides livelihood to nearly 124 lakhs people4. Out of which
60% are women, 12% SC and 20% ST (Ministry of Textiles 2001) while
the exact numbers are not available, a chunk of handloom weavers
belong to minorities.
Indian handloom products range from coarse cloth to very fine
fabrics from a variety of fibers such as cotton, silk, tasar, jute, wool
and synthetic blends. Handlooms are developed in different regions of
the country. There are independent weavers, weavers organised into
co-operatives, and there are those working under master weavers. We
do not have up dated figures on the number of looms or people. The
first handloom census was conducted in 1988 and the second census
was conducted in 1995-96. According to the 1995-96 census the state
wise distribution of the handlooms in the country is as given in the
table 2.1

35
Table-2.1
State-wise Distribution of Handlooms in India (1995-96 census)
Sl.No. State / District No. of Looms
1 Assam 132056
2 Andhra Pradesh 202100
3 Arunachal Pradesh 39692
4 Bihar 34906
5 Chandigarh NA
6 Chattisgarh 8111
7 Delhi 7027
8 Goa NA
9 Gujarat 20550
10 Haryana 22718
11 Himachal Pradesh 47631
12 Jammu & Kashmir 18154
13 Jharkhand 13314
14 Karnataka 70605
15 Kerala 49508
16 Madhya Pradesh 14425
17 Maharastra 39900
18 Manipur 281496
19 Meghalaya NA
20 Mizoram NA
21 Nagaland 87878
22 Orissa 92869
23 Pondicherry 3106
24 Punjab 6556
25 Rajasthan 34343
26 Sikkim 838
27 Tamil Nadu 43174
28 Tripura 117792
29 Uttra Pradesh 182539
30 Uttranchal 7031
31 West Bengal 350654
TOTAL 34,87,146
Source: Web.http://texmin.nic.in

36
According to the handloom census conducted in 1995-96 it is
the West Bengal, which has the highest number of handlooms
(3,50,654), followed by Manipur (2,81,496), Andhra Pradesh
(2,02,100) and Uttar Pradesh (1,82,539). Karnataka has 70,605
handloom units. As the nature of handloom industry in India is, it is
scattered and unorganized; it is difficult to get updated statistics.
Third Handloom Census:
The third census of handlooms was conducted in April 2008.
The National Council of Applied Economic Research (NCAER) was
asked to conduct the third census of Handloom workers and issue
photo Identity cards to weavers and Allied workers by Development
Commissioner (Handloom). The challenge before NCAER was not only
the coverage of eligible handloom households and workers but also to
photograph all adults for the issuance of photo identity Cards. The
survey for the Third census of handlooms was initiated in September
2009 and covered all the 30 states / Union territories of India, across
both rural and urban locations. The coverage of the third census of
handlooms in 2009-10 is larger compared to the earlier census
exercises conducted in 1987-88 and 1995-96.
Objectives of Third Handloom Census:
1. Assessment of the total number of units both households and non-
households engaged in handloom activities.
2. Assessment of the total number of workers involved in the activities
of weaving, pre-loom and post-loom activities.

37
3. Assessment of the total number of looms both households and
non-households and assessment of working and idle looms.
4. Assessment of the employment structure of the handloom sector
for weavers and allied workers; and.
5. Undertake the photography of all handloom weavers and allied
activity workers aged 18 and above, and collect their individual
details for photo identity cards5.
Major Highlights of the Third Handloom Census:
Handloom activity is mainly a rural phenomenon. 87% of total
household units (27.83 lakh) are located in rural areas.
Nearly 61% handloom worker households reside in the north-east
and are into domestic production.
Majority (82%) are weaver households, only 13% households
exclusively are engaged in allied activities.
But a little over half of the total household units are engaged
exclusively in commercial activities.
Nearly 47% of handloom worker households are BPL and rest are
non-BPL.
The majority of the household looms in India are Frame looms
(59%) followed by Pit looms (25%). While over 78% of looms in
north-eastern states are Frame looms, other regions are dominated
by pit looms.

38
Nearly 75% of total workforce engaged in handloom activities is
female.
A majority (60%) of adult handloom work force has attained little or
no schooling.
Nearly 67% weavers are engaged on a full-time basis.
The third census of handlooms is an e-census, i.e. paperless
exercise, since entire exercise was undertaken using personal digital
assistant mobile technology. Not only does it provide a data base of
weavers and allied workers and handlooms throughout the country, it
also has photo-linked data base of all eligible handloom weavers and
allied workers in the handloom sector.
As in the case of every census, there are some limitations in the
survey. Third census enumeration has been conducted primarily in
the list of the locations provided by the state government, although
additional concentrations have been covered as well using local
knowledge. Additionally, all information collected from eligible
households has been based on their self-declaration, and it has been
only possible to physically verify the information on the looms.
The report of the Third Handloom Census (2009-10) has been
published on the eve of the formulation of the 12th Five year plan and
it is hoped that this census will facilitate in formulating a more
effective policy and business decisions for the development of the
sector and the welfare of weavers and allied workers6.

39
2.3 Khadi Handlooms of India
One can’t think of textile industry of India without mentioning
about khadi handlooms. Before independence, khadi handlooms
acquired great importance due to efforts of Mahatma Gandhiji who
used the weaving instrument ‘Charaka’ as an instrument to achieve
Swaraj / independence.
But before independence promotion of khadi was mainly
undertaken by the voluntary agencies in a decentralized manner.
However, after independence the development of khadi handlooms in
an organized manner was felt essential for the overall rural
employment generation in the country. Accordingly, the Khadi and
Village Industries Commission (KVIC) was constituted by the
Government of India by an Act of parliament passed in 1956 and KVIC
came into being in April 1957.
KVIC is one of the key players engaged in the task of rural
industrialization and keeping alive the khadi weaving activity in the
country. KVIC is operating through 34 number of state and Divisional
Offices and with the partnership of 33 number of states’ and Union
territories’ Khadi and Village Industries Boards as well as 27 public
sector Banks for implementing its schemes.
The khadi and village Industries sector has a wide network in
the form of around 5000 institutions, more than 4 lakhs rural
entrepreneurs and 7050 sales outlets run by its implementing
Agencies to market its products. The sector involves more than one
40
crore people and the 11th plan envisages providing employment to
1.44 crore people under khadi and village industries activities. KVIC is
working day and night to achieve this target. KVIC has a ‘Vision’ for
bringing self-reliance and self sufficiency among the village artisans,
spinners and weavers.
KVIC looks after the khadi handloom activity by creating 6
zones throughout the country.
1. North zone: It includes the states / union territories like-
Chandigarh, Delhi, Haryana, Himachal Pradesh, Jammu and
Kashmir, Punjab and Rajasthan.
2. East zone: Which consists of states /union territories like-
Andaman and Nicobar Islands, Bihar, Jharkhand, Orissa, and West
Bengal.
3. North-East zone: In which there are states / union territories like-
Arunachal Pradesh, Assam, Manipur, Meghalay, Mizoram,
Nagaland, Sikkim, and Tripura.
4. South zone: Includes states / union territories like- Andhra
Pradesh, Karnataka, Kerala, Lakshadweep, Pondicherry, Tamil
Nadu.
5. West zone: There are the states / union territories like- Dadra and
Nagar Haveli, Daman and Diu, Goa, Gujarat, Maharastra.
6. Central zone: Which includes states / union territories like-
Chattisgarh, Madhya Pradesh, Uttarakhand, and Uttar Pradesh.

41
We can have the birds’ eye view of the present position
(2007-08) of khadi handlooms with the details in the table 2.2
Table-2.2
Position of Khadi Handlooms in India (2007-08)
Sl. No.
Items Cotton Woolen Silk Total
1 Khadi Production (value: Rs in lakhs) 32393.87 8909.16 13035.83 54338.86
2 Khadi Sales (value: Rs in lakhs) 43632.90 13060.39 15746.12 72439.41
3 Employment in Khadi Production (lakhs persons) 6.09 2.12 0.95 9.16
4
Earnings from Khadi
Production (Rs in lakhs) 19840.48 5021.28 8086.55 32948.31
Source: KVIC Annual Report 2007-08
In a big country like India, even though the contribution of
khadi handlooms to the textile industry is less, none the less it is a
source of livelihood to the extent of 9.16 lakhs persons. Khadi which
represents the culture and heritage of our country, if implements
product diversification and blended production can do much better
than at present. It is because khadi handlooms are also spread all
over the country.
2.4 Powerlooms in India
During the 20th century, there has been a considerable
development in mechanical devices of weaving operations. Several new
types of looms have come to use, where as older have been refined and

42
their scope extended. Powerloom means a loom which is worked by
power and which is used or may be used for weaving cloth7, Power
represents electrical energy or any other form of energy which is
mechanically transmitted and is not generated by human or animal
agency8. Thus powerloom sector consists of manufacturing cloth with
the help of up-graded handloom technology by the weavers.
The introduction of powerlooms in India in the decentralized
sector dates back to 1904 when the Jahagirdar of Ichalkaranji (the
princely state) gave encouragement to weavers to install powerlooms
and improve their standards of living9. Later they were introduced in
the Indian weaving industry in 1922. Till 1927 the growth of this
industry was slow. Infact, this was major breakthrough in the
decentralized weaving industry as manpower was substituted by
mechanical power.
In the early thirties many small entrepreneurs purchased looms
discarded by mills in Bombay and Ahmadabad and converted them
into powerlooms. This practice of using discarded looms continues
even today but looms manufactured as powerlooms are also in
evidence. Since these looms are reducing the strain of weaving
operation and are relatively less expensive with better efficiency,
productivity and higher margin of profit, the powerlooms have become
more popular.
During the II world war, the increased requirement of defence
demand for cloth and also the civilian population boosted the

43
development of powerlooms. Further the expansion of electricity
services in the country also helped the powerloom sector to strengthen
its roots during this period.
The post independence period, with Government supporting
conversion plan i.e. conversion of handlooms to powerlooms also
helped. Allthis changing situation gave the proliferation of powerlooms
in the decentralized sector of the textile industry.
The table 2.3 gives the picture of growth of powerlooms in India
since 1951 to the present day.
Table-2.3
Growth of Powerlooms in the Country
Year No. of Powerlooms
1951 24078
1961 160465
1971 221200
1981 599020
1991 1057000
2001 1661550
2011 2269469
Source:1. Ambedkar Institute for labour studies, Bombay 2. AIFCOSPIN Silver Jubilee Annual 1988 and year Book, 1991, Bombay. 3. Abid Hussain Committee Report, 1990, New Delhi. 4. www.indiastat.com
The table 2.3 gives the estimated number of powerlooms in
decentralized sector. Unlike the handlooms, the powerlooms are of
recent origin. The growth of powerlooms was actually started in the

44
1960s decade and year after year there is tremendous growth in
number of powerlooms. As a result presently we have more than 22.69
lakhs powerlooms. Looking at the speed of increase in number of
powerlooms, one may calculate the good future and prospect for
powerlooms industry.
DIAGRAM 2.3 (a)
Presently the powerlooms are also established throughout the
country. But some states are far ahead in developing powerlooms. The
table 2.4 gives the details of state wise registration of powerlooms and
employment in India.
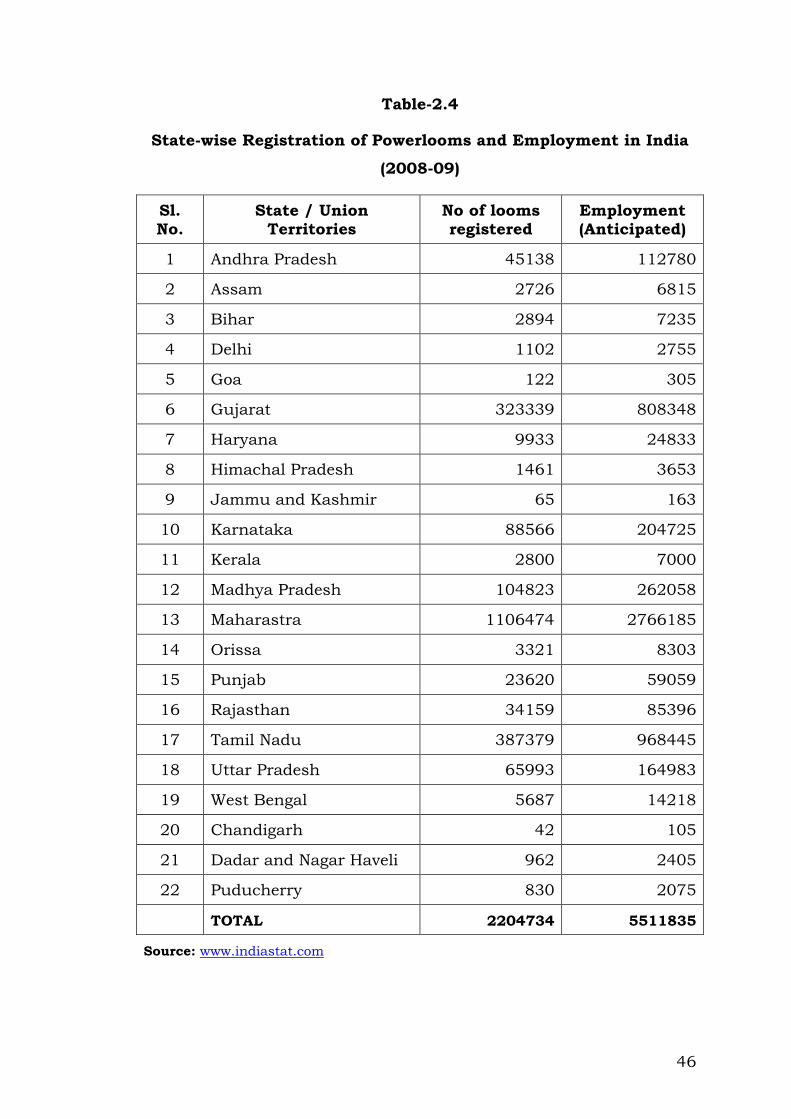
The table 2.4 clearly states that Maharashtra has the highest
number of registered powerlooms (11,06,474) employing 27,66,185
persons followed by Tamil Nadu (38,73,79) employing 96,84,45
persons and third state in respect number of registered powerlooms is

45
Gujarat (32,33,39) employing 80,83,48 persons, and then comes
Madhya Pradesh with 10,48,23 registered powerlooms, providing
employment to 26,20,58 persons. Karnataka is the 5th state in respect
of number of registered powerlooms (88,566), giving employment to
2,04,725 persons.
It is evident from these details that the states which have
provided all the basic facilities and incentives for production of cloth
in powerlooms are also economically well developed. It means to
increase the contribution of powerlooms towards the development of
states, there is need to provide good facilities for the establishment of
powerlooms in the state.
46
Table-2.4
State-wise Registration of Powerlooms and Employment in India
(2008-09)
Sl. No.
State / Union Territories
No of looms registered
Employment (Anticipated)
1 Andhra Pradesh 45138 112780
2 Assam 2726 6815
3 Bihar 2894 7235
4 Delhi 1102 2755
5 Goa 122 305
6 Gujarat 323339 808348
7 Haryana 9933 24833
8 Himachal Pradesh 1461 3653
9 Jammu and Kashmir 65 163
10 Karnataka 88566 204725
11 Kerala 2800 7000
12 Madhya Pradesh 104823 262058
13 Maharastra 1106474 2766185
14 Orissa 3321 8303
15 Punjab 23620 59059
16 Rajasthan 34159 85396
17 Tamil Nadu 387379 968445
18 Uttar Pradesh 65993 164983
19 West Bengal 5687 14218
20 Chandigarh 42 105
21 Dadar and Nagar Haveli 962 2405
22 Puducherry 830 2075
TOTAL 2204734 5511835
Source: www.indiastat.com

47
2.5 Production of cloth in India:
MAP-I
STATE WISE DISTRIBUTION OF Handlooms
(1995-96) and Powerlooms (2008-09) in India
Handlooms
Powerlooms

48
One of the basic necessities of life, viz. cloth is produced by the
textile industry. The share of cloth produced by Mill, Handloom and
Powerloom sector in the total cloth production in textile industry is
shown in the table 2.5
Table-2.5
Sector-wise Production of Cloth in India
(Mn Sq mtr)
Year Mill Handloom Powerloom
Total Textile
cloth*production
1980-81 4533 3109 4802 12444
1985-86 3544 4135 9534 17213
1990-91 2589 4295 13348 23330
1995-96 2019 7202 17201 31958
2000-01 1670 7506 23803 40233
2005-06 1656 6108 30626 49577
2007-08* 1781 6947 34736 56036
Note: 1) 1990-91 to 2007-08 the total textile cloth production figures include cloth production under hosiery, khadi, wool and silk sector.
2) * Provisional
Source: Ministry of Textiles GOI Annual Report 2008-09
If we observe the contents of the table we can say that,
comparatively speaking, it is the powerloom sector which is
progressing remarkably. The cloth production in powerloom sector
which was just 4802 mn sq mtrs in 1980-81has increased to 34736
mn sq mtrs in 2007-08. There is also progress in handloom sector but
we find ups and downs. It is clear from the table that the handloom
cloth production reached its height in 2000-01 with 7506 mn sq mtrs

49
but then on wards in the decade 2000 the handloom sector is facing
critical time due to internal and external reasons. Speaking about Mill
sector, there is downward trend and so both the mills and handlooms
have been conquered by the powerlooms.
From the same table 2.5 we can also infer the relative
percentage share of Mill, Handloom and Powerloom sector in the total
production of cloth in textile industry.
Table-2.6
Percentage Share of Mill, Handloom and Powerloom Sector in Total Cloth Production in India (Percentage)
(1980-81 to 2007-08)
Sector /
Year
1980-
81
1985-
86
1990-
91
1995-
96
2000-
01
2005-
06
2007-
08
Mill 36.42 20.58 11.09 6.31 4.15 3.34 3.17
Handloom 24.98 24.02 18.4 22.53 18.65 12.32 12.39
Powerloom 38.58 55.38 57.21 58.82 59.16 61.77 61.98
DIAGRAM 2.6 (a)
50
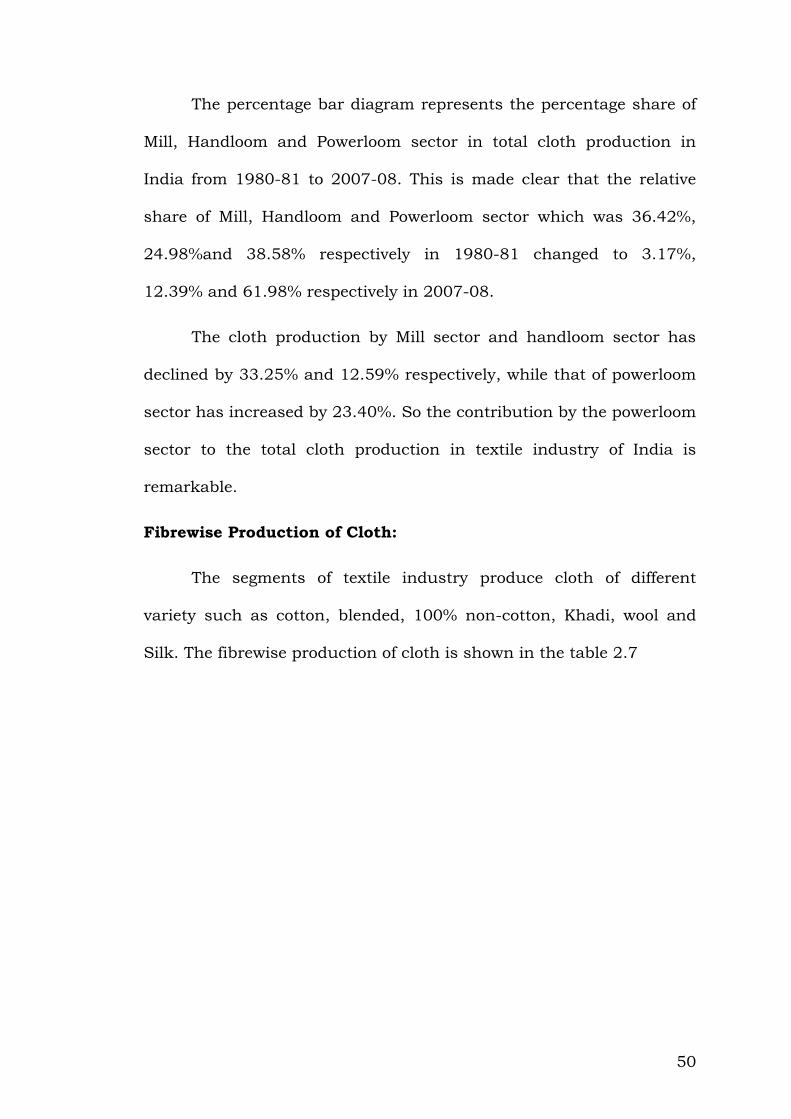
The percentage bar diagram represents the percentage share of
Mill, Handloom and Powerloom sector in total cloth production in
India from 1980-81 to 2007-08. This is made clear that the relative
share of Mill, Handloom and Powerloom sector which was 36.42%,
24.98%and 38.58% respectively in 1980-81 changed to 3.17%,
12.39% and 61.98% respectively in 2007-08.
The cloth production by Mill sector and handloom sector has
declined by 33.25% and 12.59% respectively, while that of powerloom
sector has increased by 23.40%. So the contribution by the powerloom
sector to the total cloth production in textile industry of India is
remarkable.
Fibrewise Production of Cloth:
The segments of textile industry produce cloth of different
variety such as cotton, blended, 100% non-cotton, Khadi, wool and
Silk. The fibrewise production of cloth is shown in the table 2.7

51
Table-2.7
Fibrewise Production of Cloth by Textile Industry of India
(Mn Sq Mtrs)
Year Cotton Blended 100% Non-
Cotton Total
1980-81 8368 1270 1350 10988
1985-86 12467 1660 3086 17213
1990-91 15431 2371 5126 23330
1995-96 18900 4025 8535 31958
2000-01 19718 6351 13606 40233
2005-06 23873 6298 18637 49577
2007-08 27196 6888 21173 56036
Note: From 199091 to 2007-08 the total figures include figures for Kahdi, Wool and Silk.
Source: Ministry of Textile GOI.
The table 2.7 makes it clear that the production of cotton
blended and 100% non-cotton varieties of cloth picked up the trend of
progress since 1985-86. The production of cotton variety cloth which
was 8368 mn sq mtrs in 1980-81 increased to 12467 mn sq mtrs in
1985-86. Since then till 2007-08 there is positive trend and so in the
year 2007-08 the production is 27196 mn sq mtrs. In the same way
the blended and 100% non-cotton fabric production has shown
positive trend. But comparatively speaking it is the cotton fabric
production which is the highest. But 100% non-cotton fabric is the
close competitor in textile industry.
52
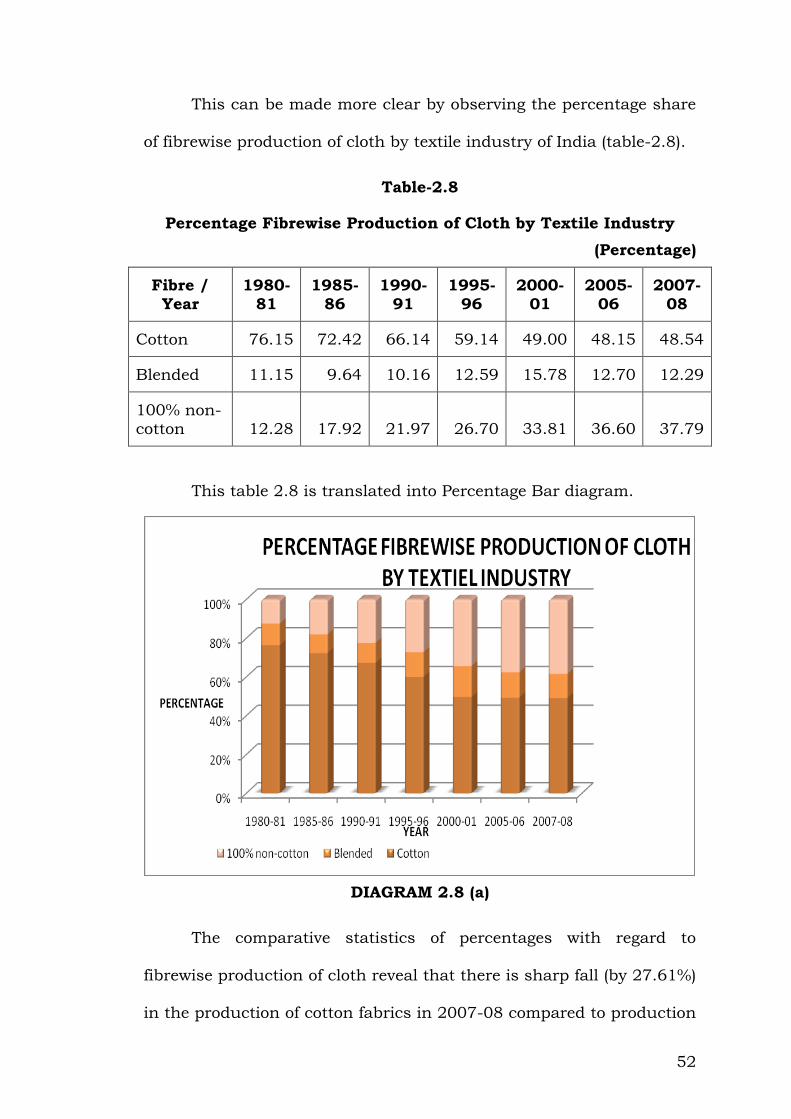
This can be made more clear by observing the percentage share
of fibrewise production of cloth by textile industry of India (table-2.8).
Table-2.8
Percentage Fibrewise Production of Cloth by Textile Industry
(Percentage)
Fibre / Year
1980-81
1985-86
1990-91
1995-96
2000-01
2005-06
2007-08
Cotton 76.15 72.42 66.14 59.14 49.00 48.15 48.54
Blended 11.15 9.64 10.16 12.59 15.78 12.70 12.29
100% non-cotton 12.28 17.92 21.97 26.70 33.81 36.60 37.79
This table 2.8 is translated into Percentage Bar diagram.
DIAGRAM 2.8 (a)
The comparative statistics of percentages with regard to
fibrewise production of cloth reveal that there is sharp fall (by 27.61%)
in the production of cotton fabrics in 2007-08 compared to production

53
in 1980-81. At the same time the production of 100% non-cotton
fabric has increased by 25.51% in 2007-08 compared to production in
1980-81. Another fact is that there is little progress in the production
of blended fabric i.e. by 1.14% in the year 2007-08 compared to the
production of blended fabric in 1980-81. All this means that the
textile industry is turning towards product diversification and wants
to expand its production base.
2.6 Indian Textile Exports
Today the textile industry of India contributes around 14% to
industrial production in the country, 4% to the GDP, is estimated to
directly employ approximately 35 million people apart from the
indirect employment in allied sectors, thus making it the second
largest employer after agriculture. It accounts for about 15% of the
country’s exports, and is, in sum, an important economic engine for
the nation10.
Textiles US
$ 10Bn
Clothing US $ 30Bn
Textiles US
$ 12Bn
Clothing
US $ 10Bn
Exports US
$ 22Bn
Domestic Market US
$ 40Bn
Indian Textile and Apparel Market US $
62Bn

54
The Indian textile export basket consists of wide range of items
containing cotton yarn and fabrics, man-mad yarn and fabrics, wool
and silk fabrics, made-ups and variety of garments.
The present size of Indian textile and appeared market is US $
62 Billion of which US $ 22 Billion is exports while the rest US $ 40
Billion is the domestic market. According to the latest statistics by
Apparel Export Promotion Council (AEPC), India’s textile exports have
reached US $ 12 Billion and US $ 10.64 Billion of garment exports in
2009-10. With the revival of demand in western markets, India’s
textile exports may grow up to US $ 24 billion in 2010-11 with the
support of the government.
2.6 (A) Global Perspectives:
According to the world Trade Organization (WTO) report11 the
Global textile Production will grow up to 25% by the year 2010 and
50% by 2014. The world textile and apparel industry has gone into a
phase of transformation since the elimination of quota in the year
2005. Over the years production has converged towards Asia from
western countries leading to increase in Global Textile and Apparel
Trade.

55
Table-2.9
Global Textile and Apparel Trade (US $ Billions)
US $ Billion 2000 2006 2007 2008 2009 2015 2020
Textile 157 220 240 250 200 300 350
Apparel 198 309 346 362 310 500 650
Total 355 529 586 612 510 800 1000
Source: WTO, UN Contrade and Technopak Analysis 2010.
DIAGRAM 2.9(a)
With the WTO replacing the Multi Fibre Agreement (MFA), the
global textile industry is stated to undergo major structural changes.
The globalization of the textile trade will increase sourcing from
developing countries owing to low labour costs and local availability of
raw material. Countries like China and India are likely to emerge as
the largest beneficiaries in the post quota regime.

56
Under the MFA regime, the world trade in textiles was restricted
and the developing countries were allowed to protect their domestic
industry against the competitive imports. With removal of quota, cost
competitiveness and quality are expected to be only two factors
determining the success of a country’s textile sector in global market.
While the new regime opens up the market to fierce competition it also
provides opportunities to countries like India, which have a natural
competitive edge on account of availability of raw material, cost-
effective labour and healthy domestic market.
Hence there is an opportunity for India to reach US $ 80 Billion
exports by 2020. This is clear by the table 2.10 regarding growing
world trade in textile between 1990-2020.
Table-2.10
Growth of World Textile Trade 1990-2020
Sl. No.
US $ Billion 1990 2000 2005 2008 2009 2015 2020
1 World GDP 23000 32000 45400 61000 57000 82000 111027
2 World Trade 4338 7902 12752 19344 15341 24600 33308
3 World Textile and Apparel Trade
213 353 486 612 510 800 1000
4 China Textile and Apparel exports
16 52 104 175 157 236 350
5 India Textile and Apparel exports
4.6 11.4 15 21 23 45 80
6 India’s Share in
Global Textile and Apparel Trade
2.10% 3.20% 3.10% 3.40% 4.50% 5.60% 8.00%
Source: WTO. UN Comtrade and Techno pack Analysis 2010.
57
So the table 2.10 makes it clear, the potential for India to
almost double global export share. China will remain the biggest
exporter but with rising costs and rising domestic demand, it may
cede some export opportunity. So we must grab opportunity to earn
more through our textile items by producing high quality goods at
reasonable prices12. Further, going forward, Indian economy has a
very positive outlook.
58
REFERENCES
1. Government of Karnataka-(1993): ‘ Textile Policy’, P-I (Ministry of
Textile).
2. Dr. M. Sundarapandian: ‘Growth and prospects of Handloom
sector in India’, occasional Paper-22 NABARD Mumbai.
3. Ibid.
4. K. Rajendra Nair: ‘India’s Handloom sector’ 11th F.Y.Plan VIII Vol.,
p. 107.
5. Government of India: ‘Third National Handloom Census of
Weavers and Allied workers-2010’, Chapter-I.
6. Rajesh Shukla: ‘Census Weaves Rich Handloom Data’, The
Economic Times, February 7th 2011.
7. Government of India: ‘Textile Control Order, 1986’.
8. Government of India: ‘Factories Act, 1948’ section 2 clause (9).
9. Government of India: ‘Report of the Powerloom Enquiry,
Committee (Ashok Mehta)’ May, 1964.
10. Souvenir: ‘66th All India Textile conference’ January 28th, 29th,
2011.
11. Ibid.
12. Editorial: ‘Opportunities for Entrepreneur Indian Textile Industry’
Science Tech Entrepreneur August 2007.