Embed Size (px)
Citation preview

TEXT OVERLAP PATTERNS IN SCIENTIFIC LITERATURE:
MEASURING AND INTERPRETING PLAGIARISM ON ARXIV
Daniel T. Citron
Paul Ginsparg Department of Physics, Cornell University
6/24/13

Background: What is arXiv? • www.arXiv.org • Created by Paul Ginsparg • Repository of scientific articles, hosted by Cornell’s library • Established 1991 • 849,000 submissions as of May 2013 • ~85,000 new submissions in 2012

Plagiarism case in 2007 • Middle East Technical University in Turkey • Physics theorist grad student had considerable publications record • 40 submissions to arXiv in 22 months
• During B exam, committee member began to suspect a lack of necessary language skills… • Upon closer examination, it was found that the submitted papers
contained mostly borrowed text and few original ideas or work. • Papers were later removed from arXiv • One is still available from J. High Energy Physics
• Collection of all papers removed due to plagiarism: http://arxiv.org/new/withdrawals.aug.07.html

Questions Prompted • How common is behavior like this? • Is reuse of text from other publications normal or not? • What should our standards for “normal” be?
• How many people engage in this behavior? • Does everyone do it some of the time? • Are there serial copiers? If so, how do we find them?
• To what extent is this behavior an indicator of quality? • Do important articles reuse text from other articles? • Do prominent researchers habitually reuse text?
• How do we analyze the arXiv to find answers to these questions?

Clarifications about “Plagiarism” • OED: “The action or practice of taking someone else’s work,
idea, etc., and passing it off as one’s own; literary theft” • Text reuse is a mode of plagiarism • Our methods detect text overlaps, not idea overlaps • Not all plagiarism cases can be found using our methods
• We do not attempt to interpret motivation for text reuse: • Cheating with intent to steal ideas • Inflation of publication records • Republishing previous results with slight updates • Two experimental papers can have identical procedures, boilerplate
• We do not mean to disparage researchers of their practices. We can only make empirical statements about observed patterns in text reuse.

How do we detect text overlaps? • Need to pairwise compare text from all ~1M articles • O(1M2) comparisons is very expensive… • Decrease computation time using hashing scheme
1. Identify a characteristic subset of 7-grams E.g. “We first consider two point-like proteins” E.g. “In this paper we discuss”
2. Ignore common phrases used by many non-overlapping authors E.g. “We verify these calculations using Monte Carlo”
3. Obtain a hash “fingerprint” summarizing the text content • Compute pairwise overlaps between fingerprints of all
papers
Text examples taken from: Machta,B.B., Veatch, S.L., Sethna, J.P. Critical Casimir forces in cellular membranes. Physical Review Letters 109, 138101(2012) <http://arxiv.org/pdf/1203.2199.pdf>

Example of Text Overlap
• Generated on arXiv’s website • Red indicates overlapping portions of text • In this case, only 1 7-gram in common between the two papers

Another Example of Text Overlap

Another Example of Text Overlap (cont’d)

Another Example of Text Overlap (cont’d)

Another Example of Text Overlap (cont’d)

Another Example of Text Overlap (cont’d)
Another Example of Text Overlap (cont’d)
• The two papers in this example: • One author in common • Submitted 2 months apart • ~1300 words in common, > 40% of complete text of each article
• We focus on cases like these, with large amounts of overlapping text

Distribution of Overlap Sizes • Cumulative histogram of
article pairs with overlap ≥X 7-grams • Blue: Author in common • Green: No common
authors, later paper cites earlier paper
• Red: No common authors, no citations
• Example: ~100,000 cases of papers reusing ≥100 7-grams from another paper

Distribution of Overlap Sizes • Good news • Copying without citing
others is relatively rare • Most cases of text copying
are for small amounts of text, a few 10s of words
• Bad news • Still many cases of large
amounts of text overlap (see heavy tail, toward right)

Distribution of Overlaps • Who is responsible for the text overlaps shown on the previous
slide? • We know how many papers and authors there are • We know how many overlap instances there are • So how are those overlaps distributed among the authors?
• For each author: • Identify all papers • Count fraction of author’s papers with text copied from elsewhere
i.e. an author’s tendency to reuse text • Allows us to measure distribution of authors’ tendency to copy
Distribution of overlaps
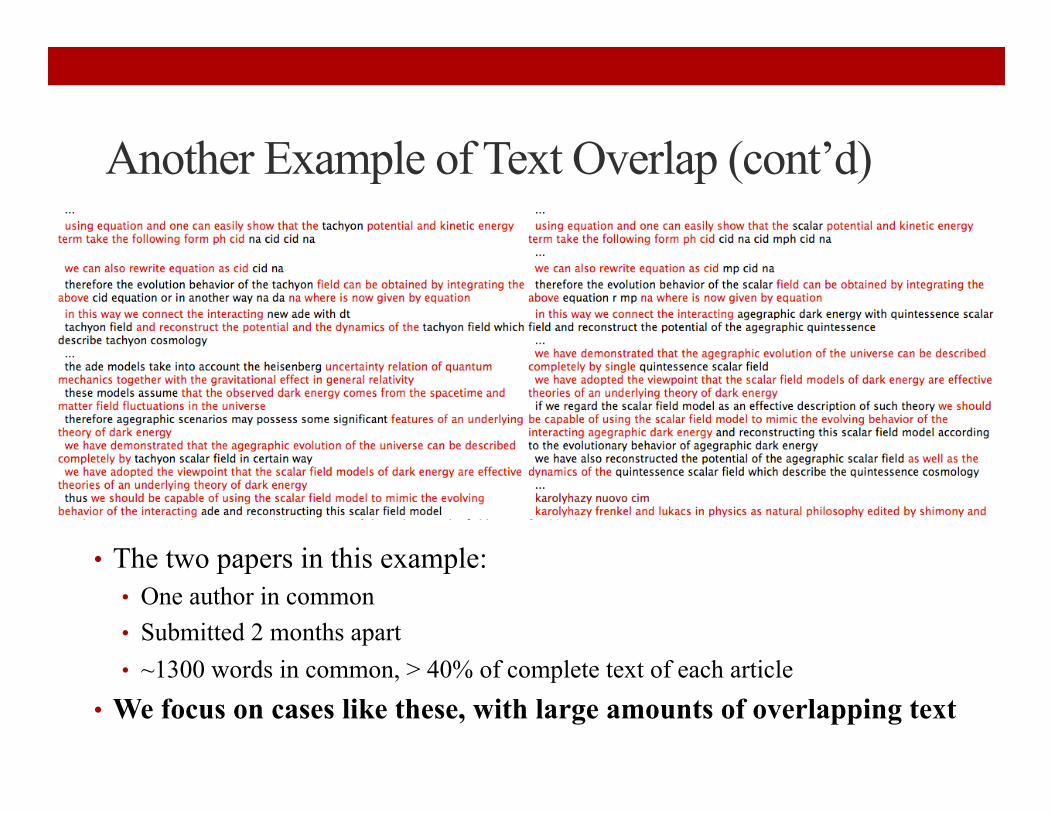
• A) Histogram – authors with a given fraction of articles that reuse text • B) Cumulative histogram – authors with fraction ≥X articles that reuse text • Bimodal distribution (Note: semilog y-axis) • Vast majority of authors have no text reuse • Tail of distribution represents a minority of authors who copy
A) B)
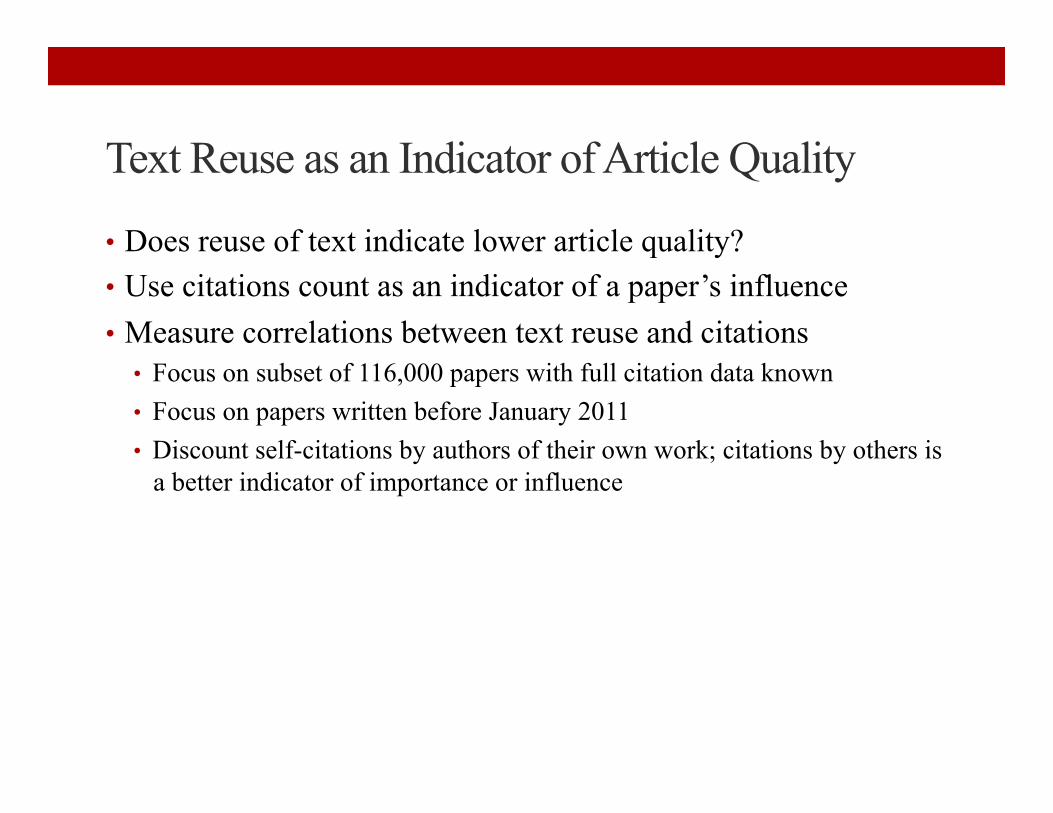
Text Reuse as an Indicator of Article Quality
• Does reuse of text indicate lower article quality? • Use citations count as an indicator of a paper’s influence • Measure correlations between text reuse and citations • Focus on subset of 116,000 papers with full citation data known • Focus on papers written before January 2011 • Discount self-citations by authors of their own work; citations by others is
a better indicator of importance or influence

Text Reuse as an Indicator of Article Quality
• Blue: Scatter data of citations vs. fraction of copied content for all articles • Green: Median citations • Note negative correlation:
Papers with large amounts of copied content receive fewer citations • Articles with large amounts
of copied content are not the ones receiving a lot of attention

Summary and Conclusions • arXiv has a new tool that efficiently detects papers that have
borrowed large amounts of text from other papers • We have examined the frequency and distribution of these
incidences of text reuse • Occurrences of text reuse are common • A small minority of authors is responsible for the majority of cases of
large text overlaps • Suggests that, generally, the scientific community at least tacitly adheres
to a standard of avoiding text reuse
• Frequent text reuse is correlated with fewer citations • Suggests that the papers that reprint older material are not the focus of the
research community’s interest

Further Work • Hand off project to sociology/bibliometry • Familiar with general trends in citations practices • Familiar with motivation or psychology of plagiarism • Familiar with international differences in publications practices • Equipped to carry out ethnographic studies of small groups of authors
• Examine higher-order network structure: • Current methods only detect pairwise overlaps • Triangles can lead to false positives

Acknowledgements and Citations • Principal investigator: Paul Ginsparg • Former collaborators: Daria Sorokina, Johannes Gehrke,
Simeon Warner
• Timmer, John. “Plagiarism and falsified data slip into the scientific literature: a report.” Ars Technica. 8 Aug. 2007. Web. 10 Oct. 2012. http://arstechnica.com/features/2007/08/plagiarism-and-falsified-data-slip-into-the-scientific-literature/ • Sorokina et. al. “Plagiarism Detection in arXiv.” In proceedings
of the 6th IEEE International Conference on Data Mining (ICDM’06)

Details of Winnowing Algorithm
• Algorithm outline: • Look at 6 consecutive 7-grams (12 words) • Deterministically hash each 7-gram, pick shortest (least memory) hash • Examine next group of 7-grams, pull out shortest (least memory) hash • Compare consecutive hashes: add hash to hash string if different from
previous • Results in a series of minimum-length hashes that represents the full
text content of the paper • Hashing reduces number of words by factor of ~3.6 • Hashing scheme designed so that hash collisions are rare
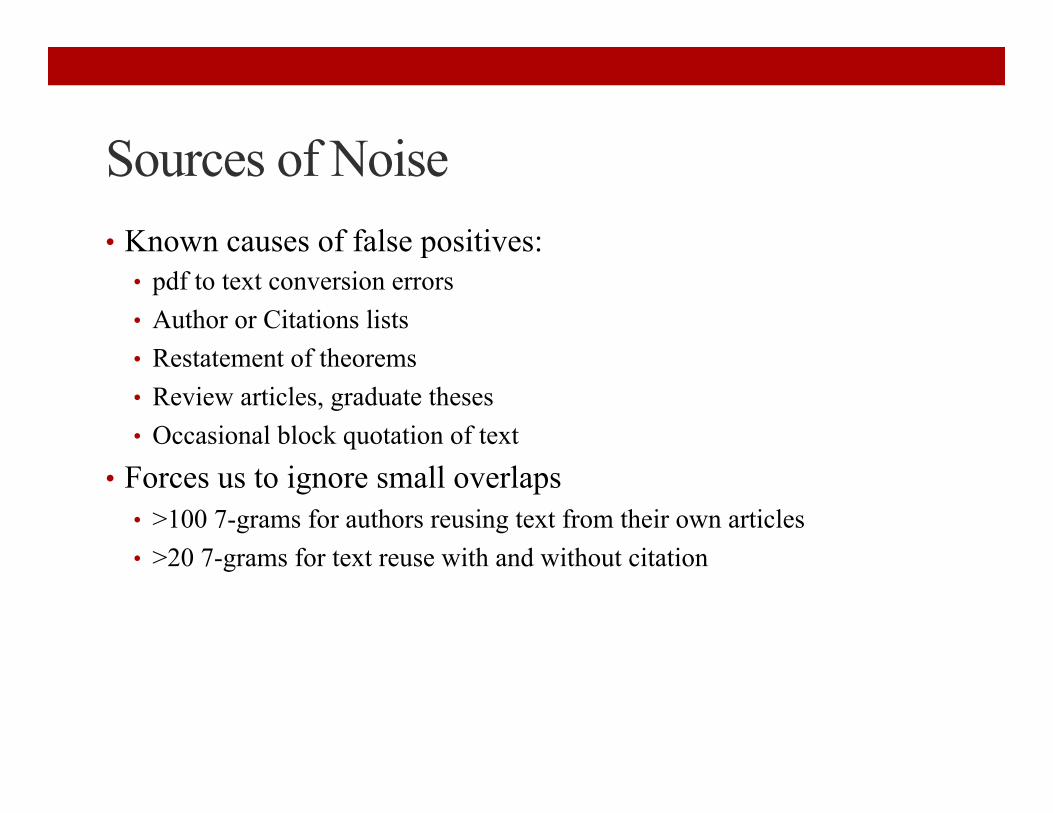
Sources of Noise • Known causes of false positives: • pdf to text conversion errors • Author or Citations lists • Restatement of theorems • Review articles, graduate theses • Occasional block quotation of text
• Forces us to ignore small overlaps • >100 7-grams for authors reusing text from their own articles • >20 7-grams for text reuse with and without citation

Geographic Distribution • How are the serial copiers distributed geographically? • Determine country of origin of submissions • Email domain names of primary submitter stored in article metadata • E.g.: .uk, .ca, .fr
• Measure text reuse distribution between countries • Ignore countries with few authors and few submissions
(e.g. Moldova, with only 53 papers) • Measure fraction of papers that include significant amounts of copied
material for each country

Geographic Distribution • Habitual copying is not evenly spread between countries • Examples of countries with highest fraction of papers with significant copied
content:
• Note that these are all countries were English is not widely spoken as a first
language • Possible that authors from these countries are learning to write in English by
mimicking other articles • But this does not explain why serial copiers copy from themselves or their colleagues,
not from established English-speaking authors
• Note: We do not intend to disparage any country’s scientific education system or publishing practices: we merely point out that these patterns exist and may be corrected for.
• Belarus • Colombia • Armenia • Greece
• Egypt • Bulgaria • Iran • Georgia

Visualization of Text Overlap using Networks
• Text Overlap Networks • Collection of nodes connected by edges • Edges represent relationships between the nodes • Helpful formalism for parsing large, densely interconnected data sets
• Nodes – represent individual papers by a single author • Edges – represent text reuse relationship between papers • Directed edges – future papers borrow from past papers • Colored edges – three modes of text reuse
• Graph visualization: • Intuition of text overlap patterns • Visualization reveals the existence of serial copiers

Visualization of Text Overlap using Networks- Example 1
96 20 139 15534
1183326
66
83
88
100 176
113132
138
126
1172
127 5325
119150
61 14984 106
37 13728
50
9939
13087154
13
174 10574
131
175
1 21157 69 146 148
166
43
140
9360
98 49108 152
31
29 110
109 147
86
47 470
23
2 8063 67
55 91134
121 124
89
145
3238
35 76
16765 143 129
90 75 71
17 116 172
128 13659 18
14
111 9579
112
92
165
94 3862
42
9 1922
164
82 16
30
156
556 48 40
120 44 85 1336 0
45
104 135
153
27 158162 10315 10246169
36123
7 161101 163
12 78 168141 58
117
160
68 114 171 159
1041 81 107 144
52
51 73
142 24
64
12257
54 77
125
173 97 115
170
151

Visualization of Text Overlap using Networks – Example 2
• Grey nodes represent papers by other authors that the offending author reused text from • Note density of edges, as well as presence of Red and Green edges
128
1
148
14 135
201
152
134 182117
22 12578
166
160
4948
129
18
74
12
6970
8
143
224
217
109
15
156
13 31
28
32
39
37
186
163
63
101 138
196
114
10
106
57
83
131
62
47 77194219
91
161
80
199
203
159
3
209
45
216
46
25 8811
1105136
525896 121
195 197
44 30 177
81 200 206
51 116 187
68 19387220
61 99 89
17155 72 43
222
154
150
108
97
157 53
170
4260
122
175
147
90
207
228158
9
145
141
6
192
176214
73
181184
144
34103
185
4
118
202
20
124
112
146
41 142168
180
23
64
210
40 190
139
27 33
55 149
67 92130
119 0
26
213
120 3835
169 174183
76
66
132
100
50
7
165
36
191
104
126140 98
86
1058294
223178
164
65
12329188
211
218
189
56
102
93
162
7175
133151
205
226153
167 212
172
54
198
204
221 19 85 115
215
137
79162
84 111
95
173
208 227
21 24
113 225
171
59
107
127 179


![Patterns of resource use and isotopic niche overlap among ......dard) - 1] * 1000 and R is 13C/12Cor15N/14N (the ratioof‘heavycarbon’to‘lightcarbon’) andnitrogen, d15N (the](https://img.dokumen.tips/doc/110x75/608db5c1e8f07028c80ab9d7/patterns-of-resource-use-and-isotopic-niche-overlap-among-dard-1-1000.jpg)