Embed Size (px)
Citation preview

FFI-rapport 2012/00442
Tests of Hesco gabions June 2011
Knut B. Holm, Morten Huseby and Haakon Fykse
Norwegian Defence Research Establishment (FFI)
6 March 2012

2 FFI-rapport 2012/00442
FFI-rapport 2012/00442
106501
P: ISBN 978-82-464-2044-8
E: ISBN 978-82-464-2045-5
Keywords
Gabioner
Fysisk beskyttelse
Sprengningsforsøk
Approved by
Rune Lausund Project Manager
Svein Rollvik Director of Research
Jan Ivar Botnan Director

FFI-rapport 2012/00442 3
English summary
In June 2011 a number of tests of the protective properties of Hesco gabions relative to various
weapon threats were accomplished. The experiments are part of a series of tests involving
physical force protection. This report is primarily a documentation of the test results.
3.5 kg and 7.5 kg TNT charges corresponding to 120 mm and 155 mm grenades and also real
155 mm artillery ammunition were fired against Hesco MIL 3 units with different fill materials.
The TNT charges destroyed the front side of the MIL 3 cells and threw out a large part of the fill
materials, but the back side remained intact. Crushed rock and especially local soil were thrown
considerably farther than sand and gravel. These types of fill material are therefore more
dangerous to people. Tents behind the MIL 3 units were damaged by the 7.5 kg charges detonated
against gabions directly in front of the tents. Detonation of 155 mm shells destroyed several MIL
3 cells and spread the fill material widely. The effect was much stronger than from the 7.5 kg
TNT charges. Thus MIL 3 units are incapable as protection against 155 mm grenades.
400 kg TNT charges were detonated 20 m and 60 m in front of Hesco MIL 10 walls. The charges
simulated car bombs (VBIEDs). The pressure behind the walls was measured to find the
mitigating effect of the wall. Analysis of the pressure data will be presented in an upcoming
report. With the charge 20 m from the wall the effect of the pressure wave to the tents behind the
wall was devastating. An unprotected tent 70-80 m from the detonation got some damage.
The test series also included firings of 340 g shaped charges against gabions with different fill
materials. The charges correspond to shaped charges used in RPG-7 weapons. The penetration
depth was between 70 cm and 90 cm with a general trend of less penetration with larger stones in
the fill material.

4 FFI-rapport 2012/00442
Sammendrag
Det ble i juni 2011 gjennomført en rekke forsøk for å teste Hesco-gabioners evne til å beskytte
mot ulike våpentrusler. Forsøkene er en del av en serie tester knyttet til fysisk styrkebeskyttelse.
Hensikten med denne rapporten er primært å dokumentere forsøksresultatene.
Ladninger på 3,5 kg og 7,5 kg TNT som tilsvarer ladningene i 120 mm og 155 mm granater, samt
virkelig 155 mm artilleriammunisjon ble satt av mot Hesco MIL 3-enheter med forskjellige
fyllmaterialer. TNT-ladningene ødela forsiden av gabionene og kastet ut en stor del av
fyllmaterialet, men baksiden ble ikke skadet. Kult og spesielt stedlig masse ble kastet betraktelig
lengre enn sand og pukk. Disse fyllmaterialene vil derfor lettere skade mennesker. Telt på
baksiden av MIL 3-gabionene ble skadet av 7,5 kg TNT når detonasjonen av disse ladningene
skjedde mot gabioner rett foran teltene. Sprengning av 155 mm granater ødela flere MIL 3-celler
og spredte fyllmaterialet vidt ut. Virkningen var mye større enn fra ladningene på 7,5 kg TNT og
viste at MIL 3 beskytter dårlig mot 155 mm granater.
TNT-ladninger på 400 kg ble detonert 20 m og 60 m foran Hesco MIL 10-vegger. Ladningene
simulerte bilbomber. Trykket bak veggene ble målt for å finne veggens trykkdempende effekt.
Analysen av måledataene vil bli presentert i en kommende rapport. Når ladningen ble detonert
20 m foran veggen, var trykkbølgen helt ødeleggende på teltene bak veggen. Ved en avstand på
70-80 m fra detonasjonen ble det noe skade på et ubeskyttet telt.
Forsøksserien omfattet også fyringer av 340 g bikubeladninger mot gabioner med ulike
fyllmaterialer. Ladningene svarer til hulladninger som brukes i våpen av type RPG-7.
Inntrengningsdybden var mellom 70 cm og 90 cm, og større steiner i fyllmaterialet ga generelt
mindre inntrengning.

FFI-rapport 2012/00442 5
Contents
1 Introduction 7
2 The tests 7
2.1 Tests with 3.5 kg and 7.5 kg TNT charges and 155 mm shells 8
2.1.1 Description 8
2.1.2 Results 13
2.2 Tests with 400 kg TNT 25
2.2.1 Description 25
2.2.2 Results 30
2.3 Tests with shaped charges 41
2.3.1 Description 41
2.3.2 Results 42
3 Conclusions 44
References 46
Appendix A Pressure sensors 47
A.1 8-channel pencil pressure sensors 47
A.2 BTD sensors 49


FFI-rapport 2012/00442 7
1 Introduction
In November 2010 a test series was carried out at Setermoen [1] to investigate the protective
properties of field fortifications against relevant weapon threats. The fortifications were walls and
shelters made of Hesco Concertainer units [2], which were filled with different soil materials.
A following second test series was carried out at Rena in June 2011 and is described in this
report. Except omitting shelters as test objects, the tests at Rena were quite similar to the first tests
at Setermoen. They were designed according to threat levels specified in STANAG 2280 [3], and
uncased charges were detonated to simulate direct hits of certain weapon threats. In this second
series the shaped charges were of a smaller calibre, and in addition some 155 mm artillery shells
were detonated. A major distinction between the two test series was that the fill materials at
Setermoen were frozen, which was not the case at Rena.
The Rena tests included tents. They were put up behind the Hesco walls to study how they were
affected by the detonations.
The preparation and performance of the tests were made by the Norwegian Army Weapons
School and the Norwegian Defence Logistics Organisation with support from the Military
Academy and Norwegian Defence Research Establishment (FFI). FFI was responsible for the test
registrations by pressure transducers and video cameras.
2 The tests
Figure 2.1 shows an overview of the test site. A squad tent and two NM 240 tents were placed
between two walls of Hesco gabions. MIL 3 and MIL 10 designate Hesco units of different sizes.
The bold numbers in the figure indicate the firing positions. First the 400 kg TNT charge behind
the MIL 10 wall distant from the other objects test was detonated (test 2.1). Then 3.5 and 7.5 kg
charges and 155 mm grenades were set off against MIL 3 units, at the opposite side of the tents
(test 1.1-1.14). These tests were performed in the order the numbers specify, except that tests 2.2
and 2.3 were made between test 1.11 and 1.12.
In addition shaped charges were detonated against MIL 2 units. They are not included in the
figure.
All the tests were captured by a HD video camera and a high-speed video camera.

8 FFI-rapport 2012/00442
Figure 2.1 Firing positions of 3.5 kg/7.5 kg charges and 155 mm shells as numbered in table
2.1 (1.1-1.14) and of the 400 kg charges (2.1-2.3)
2.1 Tests with 3.5 kg and 7.5 kg TNT charges and 155 mm shells
2.1.1 Description
In the tests with 3.5 kg and 7.5 kg TNT charges and 155 mm shells (test 1) the charges were
detonated in contact with the side of MIL 3 Hesco bastions. 3.5 kg and 7.5 kg TNT correspond to
the explosives mass of 120 mm mortar ammunition and 155 artillery ammunition. The purpose
was to find how different fill materials affect the debris thrown out and to compare the effects of
NM 240
Buried MIL 10 MIL 10
3.5 m
2.2
20 m
4.8 m
NM 240Squadtent
20
m
MIL 1
0B
uried
MIL 1
0
2.3
2.1
40
m
1.1 1.2 1.3 1.4 1.5 1.6 1.7
1.8 1.9 1.10
1.11 1.121.13
1.14
MIL 3
MIL 3

FFI-rapport 2012/00442 9
155 mm grenades and uncased 7.5 kg TNT charges. The result of the detonation to the tents
nearby was also considered.
A MIL 3 wall is made of 1 m x 1 m x 1 m cells, usually with five cells horizontally lined up. The
cells are open at the top. In the test they were filled with sand (0-8 mm), medium gravel (8-22
mm), crushed rock (10-120 mm) or soil from the location (many small stones, but also stones up
to 5-6 cm).
The three charge types were fired at each of four MIL 3 walls with different fill materials. The
test shots are listed in table 2.1. The two tests with 7.5 kg TNT at gabions with gravel and crushed
rock were repeated because the high speed video camera failed during the first attempts. An
additional test was made with a 155 shell detonating against a MIL 10 wall (test 1.14).
Shot Charge Fill material
1.1 3.5 kg TNT Sand
1.2 7.5 kg TNT Sand
1.3 3.5 kg TNT Gravel
1.4 7.5 kg TNT Gravel
1.5 7.5 kg TNT Crushed rock
1.6 3.5 kg TNT Crushed rock
1.7 7.5 kg TNT Local soil
1.8 7.5 kg TNT Gravel
1.9 7.5 kg TNT Crushed rock
1.10 3.5 kg TNT Local soil
1.11 155 mm shell Sand
1.12 155 mm shell Local soil
1.13 155 mm shell Gravel
1.14 155 mm shell Local soil
Table 2.1 Test shots with 3.5 kg and 7.5 kg TNT and 155 mm shells
A high-speed video camera filmed the back side of the walls during the explosions, see figure 2.2.
In addition ordinary video cameras were used.

10 FFI-rapport 2012/00442
Figure 2.2 High-speed video camera in test 1.1
Pictures of some of the walls and charges before the tests are shown in figures 2.3-2.7.
Figure 2.3 Setup of test 1.1 with 3.5 kg TNT at a MIL 3 wall with sand

FFI-rapport 2012/00442 11
Figure 2.4 Setup of test 1.4 with 7.5 kg TNT at a MIL 3 wall with gravel
Figure 2.5 Setup of test 1.10 with 3.5 kg TNT at a MIL 3 wall with local soil
12 FFI-rapport 2012/00442
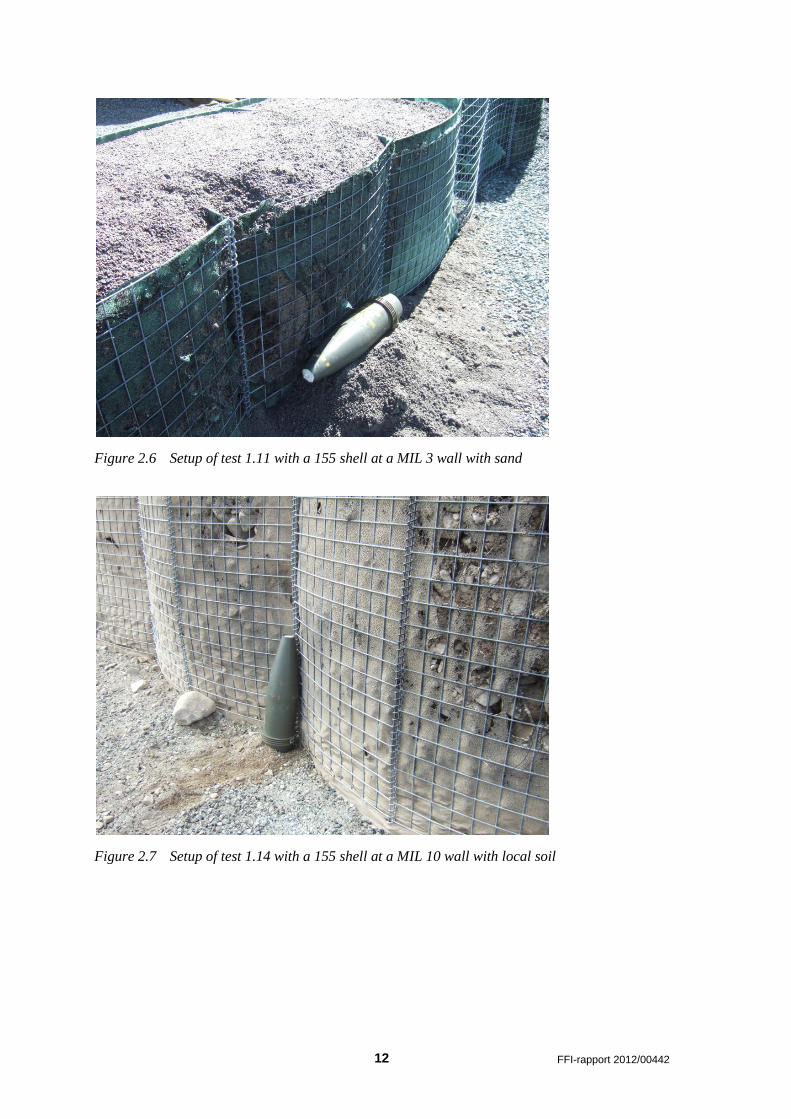
Figure 2.6 Setup of test 1.11 with a 155 shell at a MIL 3 wall with sand
Figure 2.7 Setup of test 1.14 with a 155 shell at a MIL 10 wall with local soil

FFI-rapport 2012/00442 13
2.1.2 Results
Figures 2.8-2.29 show pictures of the walls after the detonations.
Figure 2.8 Front side of MIL 3 wall with sand after detonation of 3.5 kg TNT (test 1.1)
Figure 2.9 Front side of MIL 3 wall with sand after detonation of 7.5 kg TNT (test 1.2)

14 FFI-rapport 2012/00442
Figure 2.10 MIL 3 wall with sand after detonation of 7.5 kg TNT (test 1.2)
Figure 2.11 Back side of MIL 3 wall with sand after detonation of 7.5 kg TNT (test 1.2)
The sand lifted out of the MIL 3 cell by the 3.5 kg charge did not go very far. The 7.5 kg charge
threw away some more sand, but still a short distance.

FFI-rapport 2012/00442 15
Figure 2.12 Front side of MIL 3 wall with gravel after detonation of 3.5 kg TNT (test 1.3)
Figure 2.13 Back side of MIL 3 wall with gravel after detonation of 3.5 kg TNT (test 1.3)

16 FFI-rapport 2012/00442
Figure 2.14 Front side of MIL 3 wall with gravel after detonation of 7.5 kg TNT (test 1.4)
Figure 2.15 Back side of MIL 3 wall with gravel after detonation of 7.5 kg TNT (test 1.8)
The amount of soil thrown out from the MIL 3 cells with gravel was a bit larger than with sand.
With the 3.5 kg charge most of it landed close to the wall, while it was somewhat more spread out
with the 7.5 kg charge.

FFI-rapport 2012/00442 17
Figure 2.16 Front side of MIL 3 wall with crushed rock after detonation of 3.5 kg TNT (test 1.6)
Figure 2.17 Back side of MIL 3 wall with crushed rock after detonation of 3.5 kg TNT (test 1.6)

18 FFI-rapport 2012/00442
Figure 2.18 Front side of MIL 3 wall with crushed rock after detonation of 7.5 kg TNT (test 1.5)
Figure 2.19 Back side of MIL 3 wall with crushed rock after detonation of 7.5 kg TNT (test 1.9)
As the pictures show, the crushed rock was not thrown very far forward. In the backward
direction, however, some stones were thrown 50 m – 80 m with the 7.5 kg charge.

FFI-rapport 2012/00442 19
Figure 2.20 Back side of MIL 3 wall with local soil after detonation of 3.5 kg TNT (test 1.10)
Figure 2.21 Front side of MIL 3 wall with local soil after detonation of 3.5 kg TNT (test 1.10)

20 FFI-rapport 2012/00442
Figure 2.22 Front side of MIL 3 wall with local soil after detonation of 7.5 kg TNT (test 1.7)
Figure 2.23 Back side of MIL 3 wall with local soil after detonation of 7.5 kg TNT (test 1.7)
The local soil was spread over a large area by the 7.5 kg charge. Some stones flew over a small
hill about 75 m from the charge.

FFI-rapport 2012/00442 21
Figure 2.24 MIL 3 wall with sand after detonation of a 155 mm grenade (test 1.11)
Figure 2.25 Roof of NM 240 tent after detonation of a 155 mm grenade (test 1.11) at the opposite
side of a MIL 3 wall with sand

22 FFI-rapport 2012/00442
Figure 2.26 MIL 3 wall with local soil after detonation of a 155 mm grenade (test 1.12)
Figure 2.27 MIL 3 wall with gravel after detonation of a 155 mm grenade (test 1.13)

FFI-rapport 2012/00442 23
Figure 2.28 Front side of MIL 10 wall with local soil after detonation of a 155 mm grenade (test
1.14)
Figure 2.29 Back side of MIL 10 wall with local soil after detonation of a 155 mm grenade (test
1.14)
When 155 mm artillery shells were detonated against MIL 3 walls, the Hesco units closest to the
detonation were blown away, and the units next to them were destroyed. The sand was thrown
onto the opposite MIL 10 wall, 15 m away. The effect was similar with gravel, and the stones
from the local soil were spread far out.

24 FFI-rapport 2012/00442
When detonated against the MIL 10 wall the 155 mm grenade damaged the wall, but did not
break it.
The velocity of some of the stones thrown out of the MIL 3 walls is determined from high-speed
video recordings, see table 2.2. The camera’s field of view did not cover the stones that landed
more than a few meters from the walls.
Shot Charge Fill material Velocity /
m/s
Description
1.1 3.5 kg Sand 2.4
1.3 3.5 kg Gravel 2.4
4.1
Front of stream
At the end of the stream
1.6 3.5 kg Crushed rock 1.8
4.8
Front of stream
Large stone at the end
1.7 7.5 kg Local soil 4.0
5.9
11
Front of stream
Middle of stream
At the end of the stream, stone landing 1
m from the wall
1.8 7.5 kg Gravel 2.1
6.0
2.6
Front of stream
At the end of the stream
Single stones at the end
1.9 7.5 kg Crushed rock 3.0
6.5
Front of stream
Large stone at the end
1.10 3.5 kg Local soil 4.1
2.7
Front of stream
At the end of the stream
1.12 155 mm Local soil 3.2
9.8
First part of the stream
Large stone at the end
1.13 155 mm Gravel 8.5
6.6
5.7
19
Front of stream
Stream from the bottom of the wall
Falling vertical stream of stones
Stones at the end of the vertical stream
Table 2.2 Velocities of stones from MIL 3 walls after detonation of charges
The stream refers to the flood of stones streaming out from the top of the walls. The velocities are
in general quite moderate. The largest velocities are found for the falling stones that have been
thrown upwards by the explosion.
The 7.5 kg charges detonated near the NM 240 tents caused all the distance rods in the tents (see
figure 2.30) as well as the top beams and the tie beams of the ridge frame to break. After test 1.5
the ridge tensioners had lost their attachments and the guy lines were broken. The beams of the
framework of the adjacent NM 240 tent broke or were displaced during test 1.8. In test 1.9 the
inner canvas roof of this tent fell down.

FFI-rapport 2012/00442 25
Figure 2.30 Distance rod of NM 240 tent after detonation of 7.5 kg TNT at the opposite side of a
MIL 3 wall with crushed rock (test 1.4)
With the 7.5 kg charge against MIL 3 with sand (test 1.2) all the pegs attached to the bottom of
the squad tent were destroyed because they were not flexible. The tent was lifted and displaced
and a little deformed, but easy to fix. The 155 mm charge in test 2.11 ripped the canvas of the
squad tent, and the end section fell flat.
2.2 Tests with 400 kg TNT
2.2.1 Description
In the tests with 400 kg TNT the charges were detonated 20 m and 60 m from a MIL 10 wall
placed on the ground beside a MIL 10 wall buried 0.5 m below the ground, see figure 2.31. A
MIL 10 wall is 1.52 m deep and 2.12 m high, and the width of each wall was 15 m (ten cells).
The walls were filled with local soil. The charge, which simulated a car bomb (VBIED),
consisted of 0.5 kg blocks in a wooden case, see figure 2.32.

26 FFI-rapport 2012/00442
Figure 2.31 400 kg TNT 20 m in front of a buried and an unburied MIL 10 wall (test 2.1)
Figure 2.32 400 kg TNT charge
Pressure measurements were made with pencil gauges, for details see appendix A.1. In addition a
blast test device (BTD) as shown in figure 2.33 was used. This device is an aluminium cylinder
with four pressure gauges at 90° intervals around the cylinder (appendix A.2), 1.22 m above the
ground. The cylinder is 0.762 m long and has a diameter of 0.305 m, and it simulates the thorax
of a standing man [4]. The measured pressures are input to the Axelsson model, which is used to
estimate blast injury to the thorax [5].
Figure 2.33 Blast test
device
FFI-rapport 2012/00442 27
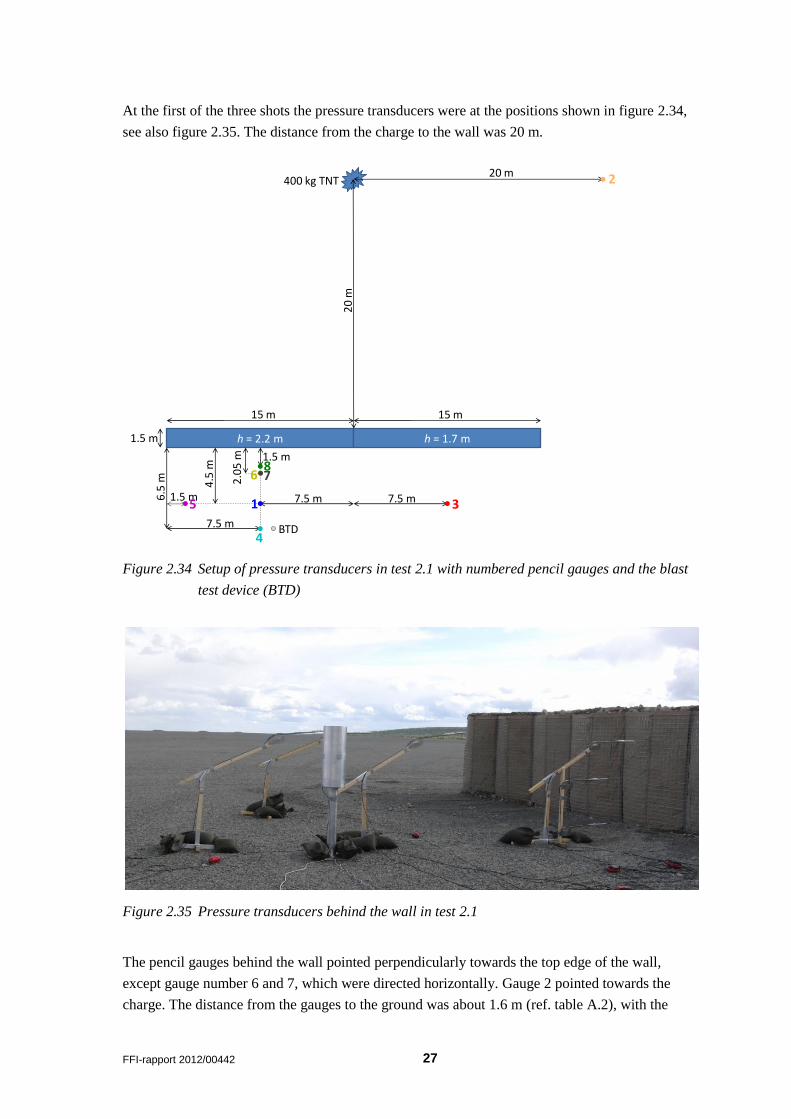
At the first of the three shots the pressure transducers were at the positions shown in figure 2.34,
see also figure 2.35. The distance from the charge to the wall was 20 m.
Figure 2.34 Setup of pressure transducers in test 2.1 with numbered pencil gauges and the blast
test device (BTD)
Figure 2.35 Pressure transducers behind the wall in test 2.1
The pencil gauges behind the wall pointed perpendicularly towards the top edge of the wall,
except gauge number 6 and 7, which were directed horizontally. Gauge 2 pointed towards the
charge. The distance from the gauges to the ground was about 1.6 m (ref. table A.2), with the
1.5 m
h = 2.2 m h = 1.7 m
4.5
m
6.5
m
15 m 15 m
20 m
20
m
7.5 m
400 kg TNT
7.5 m 7.5 m
1.5 m
2.0
5 m
87
1.5 m
3
4BTD
15
2
6

28 FFI-rapport 2012/00442
exception of the three mentioned above: The height above ground was 1.25 m for gauge 2, 0.25 m
for gauge 6 and 0.99 m for gauge 7.
In test 2.2 and 2.3 400 kg charges were detonated in front of a MIL 10 wall with tents behind the
wall as the photo in figure 2.36 shows.
Figure 2.36 Hesco MIL 10 wall (left) and tents before test 2.2 and 2.3
Figure 2.37 shows the position of the pressure sensors in test 2.2 with the charge 20 m from the
wall. In test 2.3 the distances from the charge to the wall and from the charge to gauge 2 were
both 60 m. In this test gauge number 1 was not used.

FFI-rapport 2012/00442 29
Figure 2.37 Setup of pressure transducers in test 2.2 with numbered pencil gauges and the blast
test device
The gauges’ height above ground was the same in test 2.2 and 2.3 as in test 2.1. Figure 2.39
shows pictures of the sensors behind the MIL 10 wall.
The blast test device was oriented with the direction of its sensors as shown in figure 2.38, where
the drawing is oriented in the same direction as figure 2.34 and figure 2.37.
Figure 2.38 Position of sensors on the blast test device
2.0
7 m
6.5
2 m
15 m 15 m
19.6 m
20
m
3.5
m
400 kg TNT
6.4 m
1.5 m1
1.7
m
6.0
m4
.8 m
10.5 m
2.5 m 5.0 m
2.6
m
NM240
MIL 3
MIL 10
7.8
m
h = 1.7 m h = 2.2 m
2
51
4
8
BTD
S1
S2 S4
S3
30 FFI-rapport 2012/00442
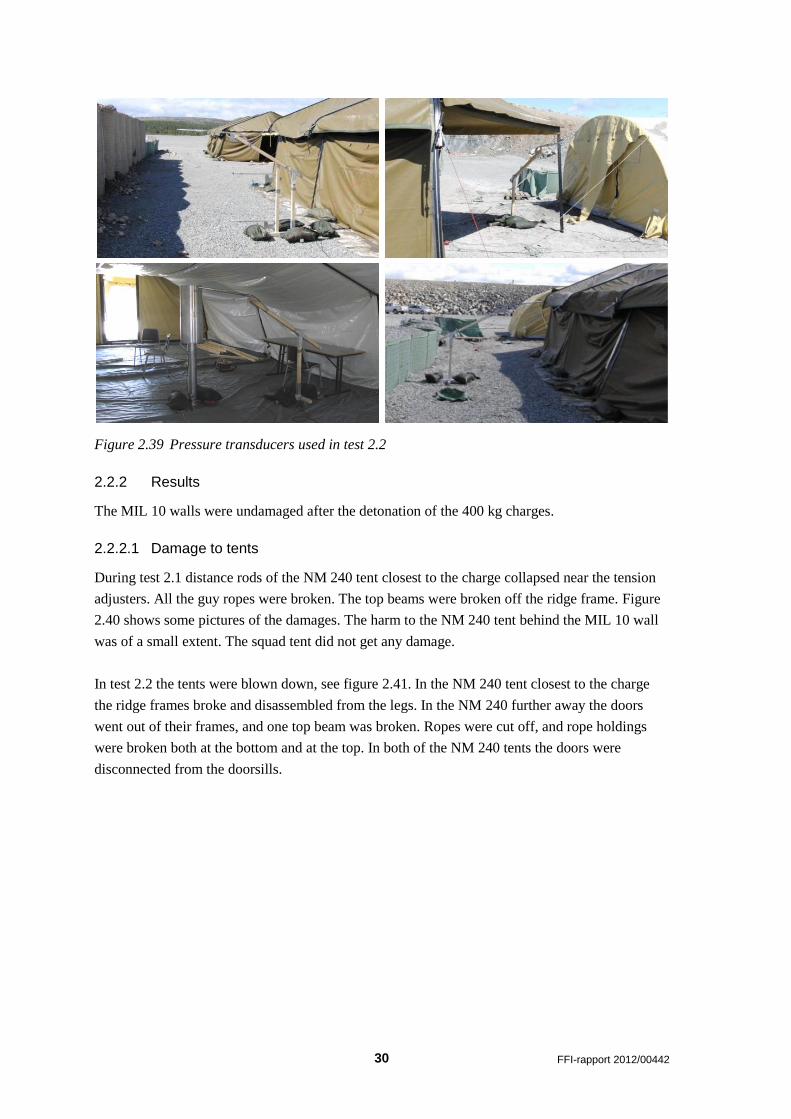
Figure 2.39 Pressure transducers used in test 2.2
2.2.2 Results
The MIL 10 walls were undamaged after the detonation of the 400 kg charges.
2.2.2.1 Damage to tents
During test 2.1 distance rods of the NM 240 tent closest to the charge collapsed near the tension
adjusters. All the guy ropes were broken. The top beams were broken off the ridge frame. Figure
2.40 shows some pictures of the damages. The harm to the NM 240 tent behind the MIL 10 wall
was of a small extent. The squad tent did not get any damage.
In test 2.2 the tents were blown down, see figure 2.41. In the NM 240 tent closest to the charge
the ridge frames broke and disassembled from the legs. In the NM 240 further away the doors
went out of their frames, and one top beam was broken. Ropes were cut off, and rope holdings
were broken both at the bottom and at the top. In both of the NM 240 tents the doors were
disconnected from the doorsills.

FFI-rapport 2012/00442 31
Figure 2.40 NM 240 tent after detonation of 400 kg TNT in test 2.1 about 70 m away
32 FFI-rapport 2012/00442
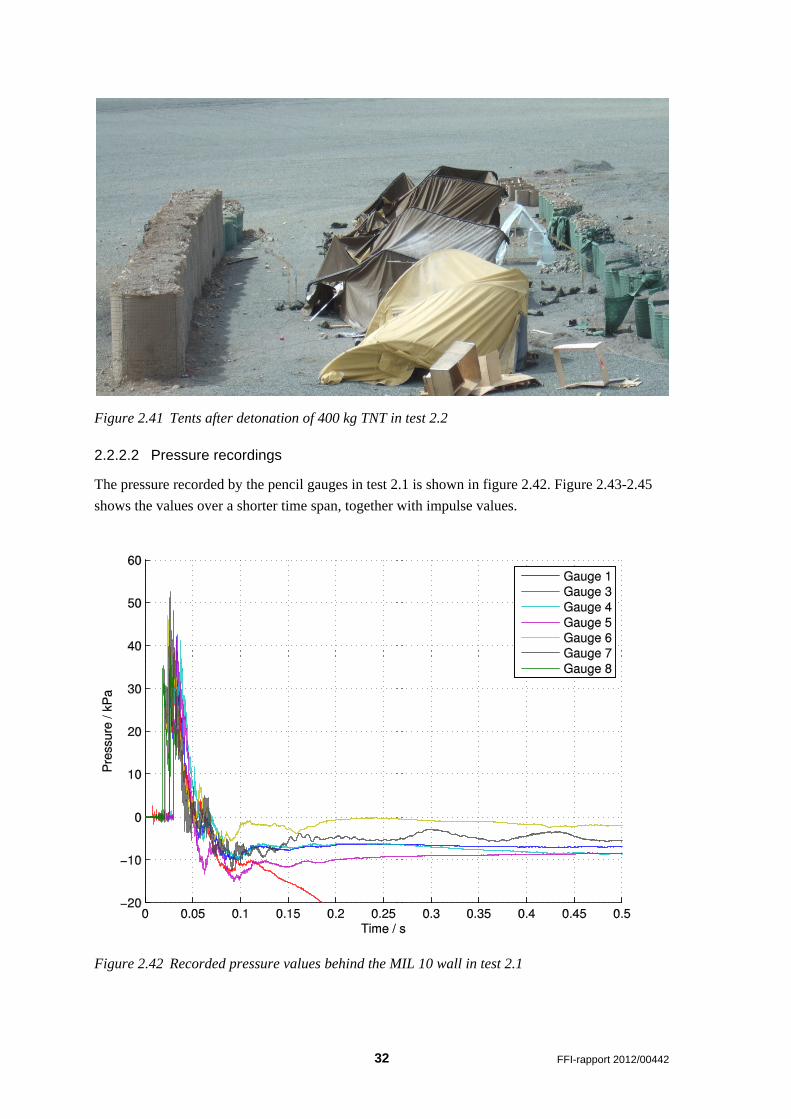
Figure 2.41 Tents after detonation of 400 kg TNT in test 2.2
2.2.2.2 Pressure recordings
The pressure recorded by the pencil gauges in test 2.1 is shown in figure 2.42. Figure 2.43-2.45
shows the values over a shorter time span, together with impulse values.
Figure 2.42 Recorded pressure values behind the MIL 10 wall in test 2.1

FFI-rapport 2012/00442 33
Figure 2.43 Pressure and impulse values (dashed lines) from the gauges 4.5 m behind the MIL
10 wall in test 2.1
Figure 2.44 Pressure and impulse values (dashed lines) from the gauges at different distances
behind the middle of the buried MIL 10 wall in test 2.1
34 FFI-rapport 2012/00442
Figure 2.45 Pressure and impulse values (dashed lines) from the gauges at different heights,
closest to the buried MIL 10 wall in test 2.1
The impulse values from gauge 8 are not shown because it produced signals only up to 0.033 s.
The maximum values of the pressure and the impulse and the duration of the first positive
pressure phase are shown in table 2.3.
Gauge
number
Maximum
pressure / kPa
Impulse / Pas Duration / ms
1 42 460 23
2*
3 40 420 24
4 41 490 26
5 43 410 21
6 47 550 27
7 53 530 21
8 38 *Sensor number 2 did not give any usable results.
Table 2.3 Properties of the pressure signals measured by the pencil gauges behind the MIL 10
wall in test 2.1
FFI-rapport 2012/00442 35
In the curves there are several peaks in the first positive phase of the pressure wave. They must be
due to reflections on the ground.
The distance from the charge to gauge 1 and gauge 3 was the same, but the wall in front of gauge
3 was 0.5 m lower than the wall in front of gauge 1. Still the pressure at gauge 3 was not higher
than at gauge 1, and the pressure wave arrived at the two gauges at the same time.
The differences between the pressure values at various distances from the wall are quite small
(figure 2.44). Near the wall the maximum pressure is higher at gauge 7, 0.99 m above ground
than at gauge 6, 0.25 m above ground (figure 2.45). At gauge 6 closer to the wall the reflection on
the ground does not enhance the pressure as much as farther out.
Pressure values registered by the blast test device are shown in figure 2.46.
Figure 2.46 Pressures on the BTD in test 2.1
The maximum values of the pressure and the impulse and duration of the first positive phase are
given in table 2.4.

36 FFI-rapport 2012/00442
Gauge Maximum
pressure / kPa
Impulse / Pas Duration / ms
S1 53 400 21
S2 56 360 24
S3 38 400 26
S4 39 410 26
Table 2.4 Properties of the measured pressure signals at the BTD in test 2.1
Although gauge S1 was more directed towards the charge than gauge S2 (figure 2.38), the latter
measured the highest pressure. The pressure waves behind the wall are however complex and also
affected by the blast test device itself.
The pressure measured on the blast test device is quite similar to the pressure at gauge 4 (figure
2.44), which was close to the blast test device.
The pressure signals from test 2.2 are shown in figure 2.47.
Figure 2.47 Recorded pressure values in test 2.2
Gauge 2 recorded the free field pressure 19.6 m from the charge. According to the Kingery-
Bulmash relations [6] the measured maximum pressure of 115 kPa corresponds to a charge
weight of 280 kg on the ground or 440 kg in free air. In both cases the corresponding duration is

FFI-rapport 2012/00442 37
18 ms. Therefore the measured pressure-time history with a duration of 2 ms and the resultant
impulse seem unreliable.
Figure 2.48 shows the pressure of the first 100 ms from the other gauges together with the
impulse.
Figure 2.48 Pressure and impulse values (dashed lines)behind the MIL 10 wall in test 2.2
The maximum pressures and the duration and impulse of the first positive phase of the pressure
wave are given in table 2.5.
Gauge
number
Maximum
pressure / kPa
Impulse / Pas Duration / ms
1 27 490 37
2 115
4 23 460 42
5 33† 420 34
8 46 460 32 †The sharp peak at 0.17 s reaches 91 kPa.
Table 2.5 Properties of the pressure signals measured by the pencil gauges in test 2.2

38 FFI-rapport 2012/00442
A comparison of the pressure at gauge 1 inside the tent with the pressure outside at gauge 5 may
indicate how the tent affects the pressure wave. The distances from the gauges to the wall were
different, but the distances to the charge were similar. The pressure at gauge 1 is somewhat lower
than at gauge 5, but the difference between the impulses is smaller.
The blast test device measured pressures as shown in figure 2.49 and table 2.6.
Figure 2.49 Pressure on the BTD in test 2.2
Gauge Maximum
pressure / kPa
Impulse / Pas Duration / ms
S1 31 590 49
S2 24 480 38
S3 26 520 44
S4 25 480 35
Table 2.6 Properties of the measured pressure signals at the BTD in test 2.2
The durations of the first positive phase are considerably larger in test 2.2 than in test 2.1 (table
2.4), and the maximum pressures are smaller. Similar relations can be found in the measurements
outside the tent. A comparison of the pressure values from the BTD and from gauge 1, where the
incident pressure close to the BTD was registered, shows a reasonable agreement.
The pressure recordings from test 2.3 are shown in figure 2.50 and with the impulse included in
figure 2.51.

FFI-rapport 2012/00442 39
Figure 2.50 Recorded pressures in test 2.3
Figure 2.51 Pressure and impulse values (dashed lines) in test 2.3

40 FFI-rapport 2012/00442
Table 2.7 shows the maximum pressures, impulses and the duration of the first positive phase.
Gauge
number
Maximum
pressure / kPa
Impulse / Pas Duration / ms
2 7.6 24 7
4 3.6 22 11
5 5.3 23 8
8 12.5 25‡ 6 ‡The maximum impulse of 34 Pas at -1.7 ms includes the second positive phase.
Table 2.7 Properties of the pressure signals measured by the pencil gauges in test 2.3
Figure 2.52 shows the maximum pressures measured in all the three tests. In this figure the
symbol colours are given by the sideways distance, and the different shots have different symbol
shapes. Figure 2.53 shows the corresponding diagram for the impulses.
Figure 2.52 Maximum pressures behind the wall in the tests with 400 kg TNT where x is the
sideways distance from the left edge of the wall and z is height above ground

FFI-rapport 2012/00442 41
Figure 2.53 Maximum impulses behind the wall in the tests with 400 kg TNT where x is the
sideways distance from the left edge of the wall and z is height above ground
The maximum pressure and the impulse 6.5 m from the wall were lower in test 2.2 (gauge 5) than
in test 2.1 (gauge 4). This suggests that the magnitude of the incident blast wave was larger in test
2.1. It may be noticed that relative to values at other positions the impulse values inside and
behind the tent in test 2.2 (x = 13.9 m, distance from wall 7.5 m and 11.7 m) are higher than the
pressure values.
2.3 Tests with shaped charges
2.3.1 Description
To investigate the penetration of shaped charges into different soil types, 340 g charges of
RDX/TNT were set off against MIL 2 units. The charges are similar to warheads used in RPG-7
systems, which are shoulder-launched anti-tank weapons.
A MIL 2 unit consists of two cells attached together. The side lengths of the cubic cells are
0.61 m. Wallboards were placed at the middle and at the end of the cells as indicators of the
penetration depth. As in test 1 the soil types were sand, gravel, crushed rock and local soil. Figure
2.54 shows the setup of the first shot against sand.

42 FFI-rapport 2012/00442
Figure 2.54 Setup of the test with a 340 g shaped charge against MIL 2 with sand
2.3.2 Results
The effect of the shaped charges to the MIL 2 units with different fill materials is shown in
figures 2.55-2.58.
Figure 2.55 Front side of MIL 2 filled with sand after detonation of a 340 g shaped charge

FFI-rapport 2012/00442 43
Figure 2.56 Front side of MIL 2 filled with gravel after detonation of a 340 g shaped charge
Figure 2.57 Front side of MIL 2 filled with crushed rock after detonation of a 340 g shaped
charge

44 FFI-rapport 2012/00442
Figure 2.58 Front side of MIL 2 filled with local soil after detonation of a 340 g shaped charge
After the firings the position of the liner slug (figure 2.59) was measured. Table 2.8 shows the
values.
3 Conclusions
In tests where TNT charges simulating 120 mm mortar and 155 mm artillery rounds were
detonated against Hesco MIL 3 units, considerable damage was made to the cells in contact with
the charge, and the front side was mainly destroyed. The amount of fill material that was thrown
out increased somewhat with the stone size. The throw distance was much larger with crushed
rock and local soil then with sand and gravel, and the velocity of the stones was correspondingly
higher. Therefore crushed rock and local soil cannot be recommended as fill material in gabions.
Figure 2.59 Shaped charge slug
Soil type Penetration / cm
Sand 90
Gravel 85
Crushed rock 72
Local soil 80
Table 2.8 Penetration depth of shaped
charges in MIL 2 with different
fill materials

FFI-rapport 2012/00442 45
MIL 3 units with sand and gravel provide quite good protection against one 3.5 kg or 7.5 kg TNT
charge detonated in contact with the unit.
155 mm shells fired against MIL 3 units blew away three cells and damaged more. Thus MIL 3
gabions give little protection against this threat. Besides, the conclusions drawn from the tests
with uncased charges of 7.5 kg TNT are not applicable to cased warheads. The amount of debris
was about the same for all the fill materials. Still, sand and gravel will cause less damage to
persons and objects than the larger stones of crushed rock and local soil.
3.5 kg TNT charges caused no damage to the tents behind the MIL 3 walls. The damage to NM
240 tents near the detonation of 7.5 kg charges was however significant. The squad tent was
deformed, but only the pegs were destroyed. The 400 kg charge detonated 20 m in front of a MIL
10 wall made extensive damage to the tents behind the wall. Thus a car bomb at this distance may
cause damage to people being hit by beams or other hard objects. Some damage was also made to
the NM 240 tent unprotected by the MIL 10 wall when a 400 kg TNT charge was detonated 70-
80 m away.
Pressure values registered behind the MIL 10 walls when 400 kg TNT was detonated in front are
presented in this report. These values and values from the previous test series are employed to
verify simulations [6] and will be further analysed and compared with criteria for air blast
damage.
The penetration of a 340 g shaped charge into a gabion decreases when the size of the stones in
the fill material increases. The penetration depth in local soil with a mixture of stone sizes also
depends on whether the charge liner hits a large stone or not. The fronts of the gabions were
partly damaged by the charge simulating a RPG-7 warhead, but the gabions were still so intact
that they seemed to offer good protection against additional shots.
46 FFI-rapport 2012/00442
References
[1] K. B. Holm and H. Fykse, "Tests of Hesco shelters - November 2010," Norwegian Defence
Research Establishment (FFI),FFI-rapport 2011/01276, 2011.
[2] "Hesco Concertainer - Engineered fortification systems," Leeds, United Kingdom: Hesco
Bastion Limited, 2010.
[3] "Design threat levels and handover procedures for temporary protective structures," NATO
Standardization Agency (NSA),STANAG 2280, 2008.
[4] J. H. Y. Yu, E. J. Vasel, and J. H. Stuhmiller, "Modeling of the non-auditory response to
blast overpressure. Design and field test of a blast overpressure test module," JAYCOR,
San Diego, California,Contract No. DAMD17-85-C-5238, 1990.
[5] H. Axelsson and J. T. Yelverton, "Chest wall velocity as a predictor of non auditory blast
injury in a complex wave environment," Journal of Trauma: Injury, infection and critical
care, vol. 40, no. 3S, p. S31-S37, 1996.
[6] J. A. Teland, "Trykkforplantning fra bilbombe bak barriere," Norwegian Defence Research
Establishment (FFI),FFI-rapport 2011/01738, 2011.
[7] "FR/GE/US International Test Operations Procedure (ITOP), 4-2-822 Electronic
Measurement of Airblast Overpressure and Impulse Noise," Commander, U.S. Army
Development Test Command, Aberdeen Proving Ground, Maryland,2000.
FFI-rapport 2012/00442 47
Appendix A Pressure sensors
The recorded pressure data were filtered by a fourth-order Bessel filter with a cut-off frequency of
22 kHz [7].
A.1 8-channel pencil pressure sensors
The pressure sensors for measuring incident pressure were pencil gauges of type PCB 137 A23.
They were connected through 100 m coax-cables to two PCB 482C16 amplifiers. Data were
sampled with a frequency of 204 800 Hz at a data acquisition card of type National Instruments
PCI-4462 controlled by a Labview program.
The following sensors were connected to the data acquisition system:
Sensor
number
Serial
number
kPa/V Dev name
1 8823 71.37 Dev2/ai0
2 8824 69.82 Dev2/ai1
3 8825 70.75 Dev2/ai2
4 8826 72.63 Dev2/ai3
5 8839 75.81 Dev5/ai0
6 8840 72.69 Dev5/ai1
7 8841 70.99 Dev5/ai2
8 8851 74.30 Dev5/ai3
Table A.1 Data for 8-channel pressure sensors
In test 2.1 the pressure sensors were at the positions shown in table A.2.
Sensor
number
Height above
ground / m
Distance from wall
/ m
Sideways distance
from wall edge / m
1 1.67 4.50 7.50
2 1.25
3 1.58 4.50 22.50
4 1.63 6.50 7.50
5 1.64 4.50 1.50
6 0.25 2.04 7.50
7 0.99 2.05 7.50
8 1.61 1.5 7.50
Table A.2 Position of 8-channel pressure sensors in test 2.1
Sensor number 2 was not behind the wall, but positioned 20 m to the side of the charge.
48 FFI-rapport 2012/00442
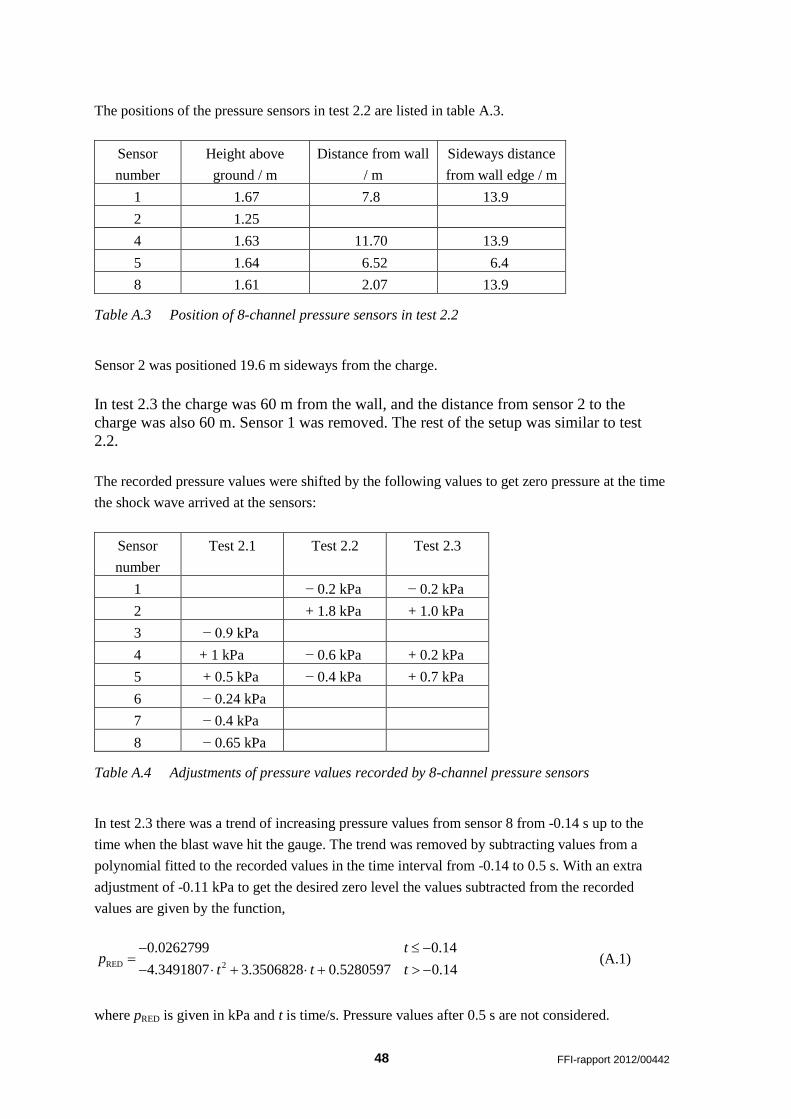
The positions of the pressure sensors in test 2.2 are listed in table A.3.
Sensor
number
Height above
ground / m
Distance from wall
/ m
Sideways distance
from wall edge / m
1 1.67 7.8 13.9
2 1.25
4 1.63 11.70 13.9
5 1.64 6.52 6.4
8 1.61 2.07 13.9
Table A.3 Position of 8-channel pressure sensors in test 2.2
Sensor 2 was positioned 19.6 m sideways from the charge.
In test 2.3 the charge was 60 m from the wall, and the distance from sensor 2 to the
charge was also 60 m. Sensor 1 was removed. The rest of the setup was similar to test
2.2.
The recorded pressure values were shifted by the following values to get zero pressure at the time
the shock wave arrived at the sensors:
Sensor
number
Test 2.1 Test 2.2 Test 2.3
1 − 0.2 kPa − 0.2 kPa
2 + 1.8 kPa + 1.0 kPa
3 − 0.9 kPa
4 + 1 kPa − 0.6 kPa + 0.2 kPa
5 + 0.5 kPa − 0.4 kPa + 0.7 kPa
6 − 0.24 kPa
7 − 0.4 kPa
8 − 0.65 kPa
Table A.4 Adjustments of pressure values recorded by 8-channel pressure sensors
In test 2.3 there was a trend of increasing pressure values from sensor 8 from -0.14 s up to the
time when the blast wave hit the gauge. The trend was removed by subtracting values from a
polynomial fitted to the recorded values in the time interval from -0.14 to 0.5 s. With an extra
adjustment of -0.11 kPa to get the desired zero level the values subtracted from the recorded
values are given by the function,
RED 2
0.0262799 0.14
4.3491807 3.3506828 0.5280597 0.14
tp
t t t
(A.1)
where pRED is given in kPa and t is time/s. Pressure values after 0.5 s are not considered.

FFI-rapport 2012/00442 49
A.2 BTD sensors
The blast test device (BTD) has four sensors of type PCB 102A05 which are connected to a PCB
482C64 amplifier. The data were sampled at 205 128 Hz with a compact DAQ device of type
National Instruments 9188 with a 9223 module. The data acquisition was controlled by a Labview
program. The properties of the sensors are specified in table A.5.
Serial number Dev name mV/kPa (up to 10 psi)
32617 ai0 7.178
32618 ai1 7.061
32616 ai2 7.417
32614 ai3 7.521
Table A.5 Data for pressure sensors at the blast test device
In this report the sensors are labelled S1-S4 in accordance with figure A.1. The labels thus
represent different sensors in the two tests.
Figure A.1 Position of sensors at the BTD in test 2.1 and 2.2
Adjustments were also made to pressure values recorded by the BTD sensors:
Sensor Test 2.1 Test 2.2
S1 + 0.85 kPa − 0.04 kPa
S2 + 0.58 kPa − 0.09 kPa
S3 + 0.26 kPa − 0.03 kPa
S4 + 0.15 kPa 0
Table A.6 Adjustments of pressure values recorded by BTD sensors
ai3
ai0 ai1
ai2
ai2
ai1 ai0
ai3
Test 2.1 Test 2.2
S1
S2 S4
S3