Embed Size (px)
Citation preview

Multiple Choices: Testing Students in Tennessee John G. Morgan Comptroller of the Treasury Office of Education Accountability March 2002
A B C D E


This report is dedicated to the memory of Colleen Marie Brick (1973-2001), a former employee of the Office of Education Accountability and original project leader for this report. Colleen’s memory and contributions to our staff remain
with us always.


i
EXECUTIVE SUMMARY What do tests really tell teachers, parents, and the public? How much can the state rely on the information in the test reports to develop and build on school improvement measures? And what is “too much” emphasis on testing? Testing has become one of the hottest issues in education reform – in part because parents and the public like the accountability that comes with testing and in part because the standards movement that boomed in the 1990s demands better quality tests. This report looks at the national movement toward more – and better – testing to determine what tests actually measure and the impact tests have on student achievement. Tennessee tests its students every year in grades 3-8 with a norm-referenced achievement test,1 and uses a statistical program, the Tennessee Value-Added Assessment System (TVAAS), to interpret the results. The state recently replaced the minimum competency exit exam with the rigorous Gateway assessments, and has other end-of-course exams in high school and a writing assessment in grades 4, 7 and 11. In addition, Tennessee is one of 41 states that participates in national exams offered by the National Assessment of Educational Progress (NAEP), the nation’s testing program.2 Some educators have looked to Tennessee as a model of testing reforms, while others have criticized states such as Tennessee that heavily emphasize assessments. The report looks at testing in Tennessee and answers these questions: • What is standards-based reform and how does it relate to testing? • What does it mean to have a high quality testing program? • What is Tennessee using to test its students? • How do other states test their students? • What are the limitations and consequences of testing? • How can Tennessee improve its testing program? The report concludes: The Gateway tests provide a new means to assure that Tennessee’s high school graduates have attained certain requisite skills, but many students will need remediation to pass them. Beginning with the class of 2005, all students must pass the Gateway exams in Algebra I, Biology, and English II to receive a high school diploma. The Gateways have been implemented in an attempt to raise the standards for high school graduation. Though many educators are concerned that a large percentage of students will fail the tests – and therefore not receive a diploma – the state is not providing significant assistance to students because of a lack of funding. The Education Reform Act of 2001 1 A norm-referenced test is a standardized test that compares a group of students to a national sample (norm) of representative students. Norm-referenced tests can include any subject and can be used in any grade level. These tests are not based on a specific set of standards or criteria. 2 The National Assessment of Educational Progress web site explains: “The National Assessment of Educational Progress (NAEP), also known as "the Nation's Report Card," is the only nationally representative and continuing assessment of what America's students know and can do in various subject areas.” http://nces.ed.gov/nationsreportcard/about/ (accessed 10/29/01).

ii
would have provided additional funds for remediation for these students. The Department of Education is working with limited resources to provide remedial assistance to students at-risk of failing the Gateways, but more appears to be needed. (See pages 27-29.) In the past, several education organizations have rated Tennessee’s standards and assessments low; however, Tennessee showed significant improvement in this area during 2001. Quality Counts 2002, Education Week’s annual report on state education issues, illustrated the state’s commitment to improving its standards – Tennessee went from a grade of “F” in standards and assessments in 2001 to a “C+” in 2002. However, the American Federation of Teachers has reviewed the state’s assessment program and has concluded that it still needs improvement. (See pages 29-32.) The reauthorization of the federal Elementary and Secondary Education Act will impact Tennessee’s assessment system in a variety of ways. The law increases federal education funds for Tennessee by approximately $67.3 million, $6.9 million of which is targeted to assessment.3 The Department is looking at developing criterion-referenced assessments to comply with the federal legislation. ESEA also requires that the state develop options for parents of students in chronically failing schools (See pages 32-33.) The state requires students to take one of three exit exams to receive a high school diploma; however, the exit exams, with no passing score required, may not be needed. Tennessee Code Annotated §49-6-6001(2)(b) mandates that students take an exit exam to graduate in an effort “to assess the student’s readiness for the workplace or higher education.” However, no passing score is required. Tennessee students may select from the ACT, SAT or Work Keys assessments, but because the students have no stake in the test outcomes, some students may not take the tests seriously. In addition, the Work Keys exam, though a potential resource for both vocational students and businesses, has never been used in a significant way in Tennessee. With the implementation of the Gateway tests as a graduation requirement, these exit exams may not be needed. (See pages 33-34.) The state uses tests as one measure of its accountability system, a major component of which is placing low-performing schools on notice of probation. The Department issued the first such list in September 2001, when it placed 98 schools on notice. Tennessee Code Annotated §49-1-602 states that schools that do not make progress in their year on notice may be placed on probation. Schools on probation for two years risk school superintendent and board member removals by the state. The Department and the State Board are in the process of developing plans for enacting this sanction. (See pages 34-35.) Too few schools and systems appear to use test data to improve student learning. Interviews with system testing coordinators and an informal survey of several school superintendents indicate that many schools and systems do not use test data, particularly TVAAS results, to improve student learning. Confusing data reports and a lack of 3 Jeff Roberts, Deputy Commissioner, Tennessee Department of Education, E-mail from the author, 3/14/02.

iii
training for teachers and administrators are the commonly reported reasons test data is not used to enhance classroom learning. As a result, schools do not benefit from test data as intended. The Department has recently added a web-based system for reviewing test results that may increase use of test data. (See pages 35-37.) Issuing school and district report cards has been a major step in making student performance information readily available to the public; however, state and local officials should continue to strengthen and enhance them. The Department could improve school and system report cards by including more information about teacher qualifications, school finances, and parent involvement, and by better defining terms used on the cards. In addition, the local systems could encourage wider distribution of the report cards. (See pages 37-38.) Tennessee’s test databases have attracted the attention of researchers nationwide. Consequently, the state may need to consider what policies are desirable to allow access to qualified researchers, but provide adequate controls over data releases. Some well-known researchers with private foundation funding have complained about the difficulty in obtaining Tennessee’s test data, even though they were willing to pay for it and adhere to state restrictions on its use. Tennessee has limited resources to conduct education research and could likely benefit from others’ efforts. (See pages 38-40.) Tennessee’s testing security system may need to be enhanced. Some system testing coordinators are concerned that teacher cheating may increase because of pressure from the increasingly high-stakes exams. The state may see a trend in this area, especially with the administration of the Gateway examinations in high school. The Department has a general guideline for testing security, but it lacks detail and allows much of the testing security to fall on the systems. (See page 40.)
District officials expressed frustration with test processing after the testing center moved from Knoxville to Nashville in 1998. However, the second year following the move has seen drastic improvements and a decrease in spending on test processing and storage. (See pages 40-41.) RECOMMENDATIONS Based on the report’s conclusions, the Office of Education Accountability makes the following legislative and administrative recommendations. A response from the Department of Education to these recommendations can be found in Appendix A. A complete list of the recommendations begins on page 42. Legislative Recommendations The General Assembly may wish to consider additional funding initiatives for assisting students at risk of failing the Gateway graduation exams.

iv
The General Assembly may wish to consider abolishing the requirement that all students take an exit exam to assess college and workplace readiness. Administrative Recommendations The State Board of Education may wish to consider whether the Gateway should be the primary instrument used to grant or withhold a high school diploma. An alternate evaluation method or appeals process may be desirable for some students who otherwise meet graduation requirements. The Department of Education needs to provide more ongoing professional development to schools and systems on interpreting test score data and using it to improve student learning. The Department of Education should continue to evaluate the format of the school report cards in an effort to improve communication with parents and the public at large. The Department of Education should develop a policy regarding the use of TVAAS and other education data for research purposes. The Department of Education needs to review its policies for test security and disseminate clear information to the systems on security procedures.

TABLE OF CONTENTS Introduction ...........................................................................................1 Methodology....................................................................................2 Background...........................................................................................2 Standards-Based Reform and the Focus on Testing.......................2 Support for Standards-Based Reform and High Quality Tests ........3 What Does It Mean to Have a High Quality Testing Program?........5 Developing a Testing Infrastructure ...........................................5 Determining the Types of Tests to Use ......................................6 Testing Systems in the Southeastern States...................................7 Southeastern States and Norm-Referenced Tests.....................7 Southeastern States and Criterion-Referenced Tests................8 Southeastern States and Exit Exams.........................................9 Limitations and Repercussions of Testing .....................................10 The Achievement Gap .............................................................11 Increases in Failure and Dropout Rates...................................12 Effects on Teaching and Learning............................................13 A Rise in Teacher Cheating .....................................................13 Reporting Test Results to the Public .............................................13 Tennessee’s Approach to Testing .................................................14 Tennessee’s Performance Model.............................................16 Tennessee Value-Added Assessment System (TVAAS) .........17 The TCAP Achievement Test...................................................19
Overview of TCAP Achievement Test Data..............................21 Performance Standards for the TCAP Achievement Test ........21 Tennessee and NAEP..............................................................22 Testing Costs in Tennessee.....................................................23 Testing Students in Special Education in Tennessee ..............24 Testing English Language Learners (ELL) in Tennessee ........25 Analysis and Conclusions ...................................................................27 The Gateway Tests .......................................................................27 Tennessee’s Standards.................................................................29 The Reauthorization of the Elementary and Secondary Education Act ................................................................................32 Exit Exams.....................................................................................33 On Notice Schools.........................................................................34 Using Test Data to Improve Student Learning...............................35 School and District Report Cards ..................................................37 Access to Tennessee Test Data....................................................38 Tennessee’s Testing Security System...........................................40 Moving the Testing Center from Knoxville to Nashville..................40 Recommendations ..............................................................................42 Legislative Recommendations.......................................................42 Administrative Recommendations .................................................42
Appendix A: Response from the Department of Education.................45 Appendix B: Glossary of Terms ..........................................................46 Appendix C: Persons Interviewed.......................................................51 Appendix D: Sample Report Card.......................................................53 Appendix E: Example of an Ohio School Report Card........................55 Appendix F: Example of a South Carolina School Report Card..........60 Appendix G: Tennessee’s ELL Testing Policy ....................................62 Appendix H: Example of a Tennessee School Report Card ...............63 Tables and Map Table 1: Norm-Referenced Tests in Southeastern States ...............8 Table 2: Criterion-Referenced Tests in Southeastern States ..........9 Table 3: Exit Exams in Southeastern States .................................10 Table 4: Testing in Tennessee ......................................................15 Table 5: Goals in the State Board’s Performance Model...............17 Table 6: The Life of a TCAP Achievement Test.............................20 Table 7: TCAP Achievement Test Data, Grade 4, 1997-2001.......21 Table 8: TCAP Achievement Test Data, Grade 8, 1997-2001.......21 Table 9: Performance Standards for 2001 TCAP Achievement
Test and Value-Added Scores, Grades K-5 ..................................22 Table 10: Performance Standards for 2001 TCAP Achievement Test and Value-Added Scores, Grades 6-8...................................22
Map 1: NAEP 2000 Mathematics Scores in the 50 States.............23 Table 11: Cost of Individual Tests in Tennessee...........................24 Table 12: Definitions of the State’s Report Card Grades...............38

1
INTRODUCTION A March 2001 Education Week article reports that states are spending roughly $400 million a year on testing in schools. The range in spending is large – from nothing in Iowa (Iowa does not mandate a statewide testing program1) to $44 million in California.2 Testing has become one of the hottest issues in education reform – in part because parents and the public like the accountability that comes with testing and in part because the standards movement that boomed in the 1990s demands better quality tests. Tennessee tests its students every year in grades 3-8 with a norm-referenced achievement test,3 and uses a statistical program, the Tennessee Value-Added Assessment System (TVAAS), to interpret the results. The state recently replaced the minimum competency exit exam with the more rigorous Gateway assessments, and has other end-of-course exams in high school and a writing assessment in grades 4, 7 and 11. In addition, Tennessee is one of 41 states that participates in national exams offered by the National Assessment of Educational Progress, the nation’s testing program.4 Some educators have looked to Tennessee as a model of testing reforms, while others have criticized states such as Tennessee that heavily emphasize assessments. This report looks at the national movement toward more – and better – testing to determine what tests actually measure and the impact tests have on student achievement. It also looks at testing in Tennessee and answers these questions: • What is standards-based reform and how does it relate to testing? • What does it mean to have a high quality testing program? • What is Tennessee using to test its students? • How do other states test their students? • What are the limitations and consequences of testing? • How can Tennessee improve its testing program? The report attempts to examine the issue of testing and provide objective recommendations to improve Tennessee’s testing system. Because many terms in this report are unique to assessment, a glossary of terms can be found in Appendix B. 1 The Iowa Department of Education web site explains: “The Iowa Department of Education does not maintain test scores for individual Iowa school districts since the state does not have a mandated statewide testing program.” www.state.ia.us/educate/fis/pre/eddata/schooltestresults.html (accessed 3/14/02). 2 David J. Hoff, “States Spend Nearly Half-a-Billion on Testing,” Education Week, 3/14/01. 3 A norm-referenced test is a standardized test that compares a group of students to a national sample (norm) of representative students. Norm-referenced tests can include any subject and can be used in any grade level. These tests are not based on a specific state set of standards or criteria. 4 The National Assessment of Educational Progress web site explains: “The National Assessment of Educational Progress (NAEP), also known as "the Nation's Report Card," is the only nationally representative and continuing assessment of what America's students know and can do in various subject areas.” http://nces.ed.gov/nationsreportcard/about/ (accessed 10/29/01).

2
Methodology The conclusions reached and recommendations made in this report are based on: • Interviews with staff at the Tennessee Department of Education and the State
Board of Education; • An extensive literature review of assessment research; • A review of test data for Tennessee and other states; • A review of Tennessee’s assessment system; • A review of other states’ assessment systems; • Interviews with testing coordinators in school districts; • Interviews with representatives from higher education, the business
community, the Tennessee Education Association, Tennessee’s contracted testing company (CTB/McGraw-Hill), and various education organizations (see Appendix C for a list of persons interviewed for this report);
• A review of Tennessee’s contracts relating to testing services; and • A review of Tennessee statutes pertaining to testing. BACKGROUND Standards-Based Reform and the Focus on Testing In the early 1980s, the education reform movement focused on minimum competency testing. Most states, including Tennessee, rapidly adopted tests that seemingly measured the bare minimum of what states expect students to know before finishing high school. In the 1990s and into this century, there has been a new emphasis on tests that focus on high standards of learning. In the past 20 years, various states have adopted testing reform measures that run the gamut – annual testing in every grade, infrequent testing, testing in all subjects, testing only in math and reading, testing tied to student accountability, and many others. Nationally, testing companies such as CTB/McGraw-Hill have expanded their teams and established more contracts with states. Organizations devoted to testing – like FairTest and the National Board on Educational Testing and Public Policy – have sprung up in response to the emphasis on testing. And test preparation groups, such as Kaplan and Princeton Review, have seen a surge of interest in the past decade. Standards-based reform is the cause of much of the focus on testing. Standards-based reform targets student performance in schools by implementing rigorous and challenging standards and then basing assessments on those standards. Most of the highest-achieving nations have implemented standards-based reform over the last two decades and international assessments indicate that these nations may be doing something right. The Third International Mathematics and Science Study-Repeat (TIMSS-R) has shown an enormous disparity between U.S. students and students in other nations, particularly in the high school years. TIMSS-R illustrates that nations that are not as wealthy as the U.S. and that spend

3
less money on education are achieving at higher levels than the United States, a fact that is particularly troubling for U.S. educators.5 In 1983, a report titled A Nation at Risk suggested that American youth were not prepared to be economically productive because of poor standards in school.6 Recognizing a struggling school system, coupled with a need for global competitiveness, states began implementing standards-based reforms. With the desire to be on par with other leading nations, an increase in funding for standards-based reforms in practically every state, and a national emphasis on high standards, it is clear that standards-based reform will remain the focus in education policy for some time. And with standards-based reform comes an emphasis on high quality testing. Support for Standards-Based Reform and High Quality Tests Standards-based reform has garnered support from many areas, and is a cornerstone of President Bush’s education plan, No Child Left Behind. Some of the main tenets of the federal plan, signed into law in January 2002, include: • An emphasis on high standards for all students and on accountability for
schools and districts based on improvement gains; • Annual assessments in reading and math in grades 3-8 that would provide
data to be used in highlighting improvement gains from year to year; • Assistance and consequences for schools that are not adequately educating
their disadvantaged students, which includes alternative forms of school governance if a school fails to improve.7
In addition to the federal advocacy for high standards and an emphasis on tests, testing companies also support the standards-based reform initiative. Educational Testing Service (ETS), a company that creates and administers tests, argues that basing assessments on a state’s standards is the best new approach to testing because the standards-setting process produces a dialogue about what should be taught at each grade level.8 This dialogue results in a stronger curriculum, and, ideally, in a stronger learning environment. ETS, however, also emphasizes that
5 U.S. Department of Education, National Center for Education Statistics, Pursuing Excellence: A Study of U.S. Twelfth-Grade Mathematics and Science Achievement in International Context, NCES 98-049, (Washington DC: U.S. Government Printing Office, 1998). 6 U.S. Department of Education, A Nation at Risk: The Imperative for Educational Reform, A Report to the Nation and the Secretary of Education, United States Department of Education, by the National Commission on Excellence in Education, 4/83, www.ed.gov/pubs/NatAtRisk/title.html (accessed 10/29/01). 7 U.S. Department of Education, “No Child Left Behind,” www.ed.gov/inits/nclb/titlepage.html (accessed 10/29/01). 8 Basing a state’s assessments on its standards is called aligning the assessment to the standards. Some tests are not based on what students are learning in the state curriculum, but rather what a national company has deemed appropriate at a given grade level.

4
strong standards and assessments tied to those standards are only effective if used to increase learning in the classroom and revise outdated teaching plans.9 Standards-based reform, with its emphasis on accountability, reflects a business model, and as a result has become very popular within the business community. Groups such as the National Alliance of Business and the Business Roundtable have supported standards-based tests from the beginning of the standards movement. Another business research group, the Committee for Economic Development, released a position paper titled “Measuring What Matters” in 2000. The paper explains business support for standards-based tests: “Public scrutiny of testing is healthy and contributes to improved policies and practices…however, we must not lose sight of a key fact: measuring student achievement is an essential element of effective school reform. As business leaders, we know that we can’t improve what we don’t measure.”10 It further clarifies why standards-based tests are effective because they: • Assist teachers by highlighting strengths and weaknesses in the classroom; • Provide a means for holding teachers, students, and schools accountable; and • Allow systems and schools to report clear results to the public. In addition to the federal government, testing companies, and the business community, educators have supported the standards-based reform movement. The American Federation of Teachers (AFT) has applauded the standards movement and is one of several groups that annually review the status of state standards. The AFT writes:
With clear and rigorous standards to guide them, educators and other stakeholders can focus their energies and resources on improving the academic performance of our nation's students. Sound standards-based systems can help guarantee that all children, regardless of background or neighborhood, will be exposed to a rigorous academic curriculum throughout their educational careers. Such systems hold students to much higher standards than they have been expected to meet in the past and ensure that the standards and curriculum will be common across schools and districts, reducing the problems of low expectations for disadvantaged students and ameliorating the impact of student mobility. States and districts can help all students reach the standards by making the necessary resources and assistance
9 Paul E. Barton, Too Much Testing of the Wrong Kind; Too Little of the Right Kind in K-12 Education, Educational Testing Service, (Princeton, NJ: Policy Information Center, 1999). 10 Committee for Economic Development, Research and Policy Committee, Measuring What Matters: Using Assessment and Accountability to Improve Student Learning, (Washington, DC: Committee for Economic Development, 2000).

5
available to those students in danger of failing…It all begins with a strong set of standards.11
What Does It Mean to Have a High Quality Testing Program? Since its beginning, standards-based reform has required high quality assessments as an integral part of the movement. But what does a high quality testing program look like? Who decides what those world-class standards are? Opinions on what makes up a high quality testing program vary as much as the types of tests. This section seeks to highlight the more common positions on assessment systems, as well as describe various types of tests. Developing a Testing Infrastructure In “Implementing Standards-Based Reform: Challenges for State Policy,” Margaret E. Goertz, the Co-Director for policy and governance at the Consortium for Policy Research in Education at the University of Pennsylvania, writes that standards-based reform has three main tenets that must be put in place to reap the benefits of the initiative: • A “unifying vision and goals” that clearly outline the education initiatives and
purposes of each component of the standards-based reform; • A comprehensive agenda that includes all aspects of standards-based reform,
including curriculum materials, professional development, and assessment; and
• A clear distribution of responsibilities indicating who is in charge of every aspect of the reform, including how the new content will be mainstreamed into the classroom.12
The North Carolina Regional Laboratory elaborates on the “unifying vision” described by Goertz in “Using Student Assessment Data: What Can We Learn from Schools?”:
Limit assessments to those with a specific purpose and those that contribute to a common “vision” for student achievement…Tests added to school-based student assessment systems without regard to a clear purpose, or that do not promote a common, unified vision for student achievement, may be disruptive to ongoing school programs. They may confuse students, school staff, and parents about which outcomes are valued. They may also further limit time spent on instruction.13
In addition, many educators agree that it is important to develop high quality, comprehensive state standards first, and then follow with the testing system.
11 American Federation of Teachers, http://www.aft.org/edissues/standards99/intro.htm (accessed 10/29/01). 12 Margaret E. Goertz, “Implementing Standards-Based Reform: Challenges for State Policy,” Closing the Gap, a special report by the Council for Basic Education, 2/00. 13 Allison Cromey, “Using Student Assessment Data: What Can We Learn from Schools?,” North Central Regional Educational Laboratory, Policy Issues, Issue 6, 11/00.

6
Robert L. Linn, a nationally recognized education expert at the University of Colorado, explains: “Develop standards, then assessments. Revision of existing tests, or creation of new ones, must closely measure the standards and accurately report student achievement.”14 When states do not develop the standards first, they usually try to mold existing tests to standards-in-progress, a process that could result in weak standards and assessments. Determining the Types of Tests to Use There are two primary types of assessments: norm-referenced and criterion-referenced. Norm-referenced tests measure how well a given student performs compared to a national sample of representative students. Results from a norm-referenced test can show that a student is achieving at about the same levels as his/her counterparts in the nation, but they cannot show that the student has mastered a given subject area. Norm-referenced test scores are given in percentiles – with 50 percent being the average or mean score on the assessment. For example, Tennessee’s K-5 students scored at the 52nd percentile in reading on the state’s 2001 achievement test, a norm-referenced test. This means that Tennessee students are scoring just above the national average (50 percent) on that assessment. To compare a state’s scores on a norm-referenced test, a testing company establishes a norming pool of representative students from across the country. The norming pool sets the average score, or norm, used to compare to individual states’ students. The same norming pool’s average score is used for several years until it is determined that a new norming pool is needed. The opposition to norm-referenced tests lies in the content of the test itself – the material may not be based on high standards or on what students should know and be able to do. The issue of norming the test – setting the 50 percent national norm and using students’ scores to determine what that will be – has also been controversial because of inaccurate norming pools, meaning that the students used to set the norm were not reflective of the nation. Finally, norm-referenced tests do not tell teachers what standards their students have mastered, making it difficult to use results to change curriculum or improve student learning. Proponents of norm-referenced tests argue that it is important to know how a given state performs compared to the rest of the nation. Norm-referenced tests also tend to be less expensive than criterion-referenced assessments. Perhaps the most important support for norm-referenced tests in Tennessee rests with the Tennessee Value-Added Assessment System (TVAAS), an analysis of student achievement that highlights the improvement growth that students make from year to year. The system uses a norm-referenced test and has received national attention for its innovative approach to improvement scores. Criterion-referenced tests, on the other hand, measure how well a student has learned certain information, or criteria. The Thomas B. Fordham Foundation 14 Robert L. Linn, “Standards-Based Accountability – Ten Suggestions,” CRESST Policy Brief, National Center for Research on Evaluation, Standards, and Student Testing, 2000.

7
clarifies: “The purpose of criterion-referenced tests (CRTs) is to gauge whether a student knows or can do specific things.”15 These tests are based on a set of standards and related questions that a student must answer correctly to receive a high score. The test results are not dependent on other students’ performance – only on how much information a given student knows. When one hears about aligning a state’s assessment with the state standards, the assessment would, by definition, be a criterion-referenced test. Critics of criterion-referenced tests argue that it is very difficult to determine what the standard of learning should be – and what qualifies as high or world-class standards. Other critics have argued that high standards can be detrimental to students and schools when high stakes are associated with tests based on the standards.16 These concerns are valid, and are essential to bear in mind when implementing standards-based reform. However, most educators have accepted that standards-based reform will remain a focus in education policy, and that standards-based reform and criterion-referenced tests can be implemented in such a way as to avoid some of these problems. Testing Systems in the Southeastern States Tennessee’s testing system mirrors the systems in several Southeastern states, but has some unique characteristics. Southeastern States and Norm-Referenced Tests All southeastern states except Florida and Texas use norm-referenced tests to assess English/language arts and mathematics, and six of them – Alabama, Arkansas, Georgia, Louisiana, Tennessee, and West Virginia – also use a norm-referenced test to assess additional subjects, namely science and history/social studies. Alabama and West Virginia use the norm-referenced test in the most grades – nine – while North Carolina only uses a norm-referenced test in two grades. Five states use the Stanford 9 test, three use TerraNova (including Tennessee), and two use the Iowa Test of Basic Skills (ITBS). One state, Kentucky, uses the Comprehensive Test of Basic Skills, Fifth Edition (CTBS-5) assessment. Table 1 illustrates the norm-referenced tests used in the Southeastern states and shows the grades and subjects tested with those norm-referenced tests.
15 Gregory J. Cizek, “Filling in the Blanks – Putting Standardized Tests to the Test,” The Thomas B. Fordham Foundation, 10/98. 16 Chris Pipho, “The Sting of High-Stakes Testing and Accountability,” Phi Delta Kappan, 5/00; Donald B. Gratz, “High Standards for Whom?,” Phi Delta Kappan, 5/00; Peter Schrag, “High Stakes Are for Tomatoes,” The Atlantic Monthly, 8/00.

8
Table 1: Norm-Referenced Tests in Southeastern States
SUBJECTS TESTED STATE TEST NAME GRADES TESTED E M Sc SS O
Alabama Stanford 9 3, 4, 5, 6, 7, 8, 9, 10, 11 X X X X Arkansas Stanford 9 5, 7, 10 X X X X X Florida Not applicable Georgia Stanford 9 3, 5, 8 X X X X X Kentucky CTBS-5 3, 6, 9 X X Louisiana ITBS and ITED17 3, 5, 6, 7, 9 X X X X X Mississippi TerraNova 3, 4, 5, 6, 7, 8 X X North Carolina ITBS 5, 818 X X South Carolina TerraNova 4, 7, 1019 X X Tennessee TerraNova 3, 4, 5, 6, 7, 8 X X X X Texas Not applicable Virginia Stanford 9 4, 6, 9 X X West Virginia Stanford 9 3, 4, 5, 6, 7, 8 ,9, 10, 11 X X X X X
SOURCE: State Department of Education web sites
Southeastern States and Criterion-Referenced Tests All the southeastern states use criterion-referenced assessments for at least part of their assessment program. The majority of the southeastern states – Louisiana, Mississippi, North Carolina, South Carolina, Tennessee, Texas, and Virginia – use end-of-course assessments aligned with the state’s standards in high school, all criterion-referenced. One state – West Virginia – uses only one criterion-referenced test; the majority of the states, however, use criterion-referenced tests to test the four core subjects. Tennessee’s writing assessment in the 4th, 7th, and 11th grades is criterion-referenced. Tennessee is the only southeastern state that does not use a criterion-referenced math test in elementary or middle school.
17 The ITBS is given in grades 3, 5, 6, and 7; the ITED is given in grade 9. 18 A representative sample of students in grades 5 and 8 takes the norm-referenced test in North Carolina. 19 South Carolina alternates grades tested with TerraNova. In 1999, grades 3, 6, and 9 were tested, in 2000, grades 5, 8, and 11 were tested, and in 2001, grades 4, 7, and 10 will be tested.
KEY E: English/language arts (could be reading, writing, or both) M: Mathematics Sc: Science SS: History/Social studies O: Subjects in addition to English, math, science, and social studies are tested (such as art)

9
Table 2: Criterion-Referenced Tests in Southeastern States SUBJECTS TESTED STATE GRADES TESTED
E M Sc SS O Alabama 1, 2, 5, 7, 11 X X X Arkansas 4, 6, 8 X X Florida 4, 5, 8, 10, 11 X X Georgia 4, 6, 8, 11 X X X X Kentucky 4, 5, 7, 8, 10, 11, 12 X X X X X Louisiana 4, 8, high school20 X X X X Mississippi 2, 3, 4, 5, 6, 7, 8, high school21 X X X X North Carolina 3, 4, 5, 6, 7, 8, 9, 10, 11, 1222 X X X X South Carolina 3, 4, 5, 6, 7, 8, 9, 10, 11, 1223 X X X X Tennessee 4, 7, High school24 X X X X25 Texas 3, 4, 5, 6, 7, 8, high school26 X X X X Virginia 3, 5, 8, high school27 X X X X West Virginia 4, 7, 10 X
SOURCE: State Department of Education web sites Southeastern States and Exit Exams States use two types of exit exams: 1) exams that students must take but do not need to pass to receive a diploma; and 2) exams that students must take and pass to receive a diploma (often called graduation exams). Though accountability is clearly attached to the second definition of an exit exam, many states have not based their exit exams on high standards. The competency test used in Tennessee, currently being phased out and replaced by the Gateway exams, is based on 8th grade standards.28
20 The high school criterion-referenced exit exam can be taken in either 10th or 11th grade in Louisiana. 21 Mississippi has end-of-course assessments in high school. 22 North Carolina administers end-of-course tests in high school, but requires that they be taken in a specific year. 23 In South Carolina, students take end-of-course tests in 10th, 11th, and 12th grades. 24 Tennessee uses end-of-course tests in high school. 25 A high school end-of-course test in U.S. History will be added by the 2004-05 school year. 26 Texas uses end-of-course tests in high school. 27 Virginia uses end-of-course tests in high school. 28 Claudette Williams, Executive Director, Office of Curriculum and Instruction, Tennessee Department of Education, E-mail from the author, 12/07/01.
KEY E: English/language arts (could be reading, writing, or both) M: Mathematics Sc: Science SS: History/Social studies O: Subjects in addition to English, math, science, and social studies are tested (such as art)

10
Table 3 highlights the southeastern states’ requirements for exit exams, indicating whether students must pass the exit exam to receive a high school diploma, and on what grade level the exit exam is based.
Table 3: Exit Exams in Southeastern States WHAT SUBJECTS ARE
TESTED? STATE DOES THE STATE HAVE
AN EXIT EXAM THAT STUDENTS MUST PASS
TO RECEIVE A DIPLOMA? E M Sc SS
AT WHAT GRADE LEVEL IS THE EXIT
EXAM BASED?
Alabama YES X X29 X X 11 Arkansas NO Florida YES X X High school30 Georgia YES X X X X High school31 Kentucky NO Louisiana YES X X X X High school Mississippi YES X X High school North Carolina YES X X 7-11 South Carolina YES X X X X 10 Tennessee32 YES X X X High school Texas YES X X X X High school Virginia YES X X X X High school West Virginia NO
SOURCE: State Department of Education web sites The majority of the states began implementing minimum competency exit exams in the 80s. Since then, the standards for these graduation requirements have risen. Most states, including Tennessee, are moving toward implementing high-stakes exit exams based on specific course material – end-of-course exams. Of the southeastern states, only Tennessee requires students to take another test - the ACT, SAT, or Work Keys - without requiring that the student also pass the test. Limitations and Repercussions of Testing What do tests really tell teachers, parents, and the public? How much can the state rely on the information in the test reports to develop and build on school improvement measures? And what is “too much” emphasis on testing? 29 The math and science portions of the exit exam will be effective with the class of 2002 and the social studies portion with the class of 2003. 30 Florida currently uses the High School Competency Test in communications and mathematics, but this test will be replaced by the Florida Comprehensive Achievement Test in 10th grade in reading and math in 2003. 31 If the grade level on which the exit exam is based says “high school,” then the test is an end-of-course assessment (for instance, Algebra I is taken in 9th grade by some students and 10th grade by others). 32 The Department of Education began implementing the Gateway exams in Algebra I and Biology in fall 2001. The English II Gateway exam will be implemented in fall 2002. Students in the class of 2005 will be required to pass the tests to receive a high school diploma.

11
It is important to remember that the test score itself tells the public very little about what is happening in a given school. In “The Ninth Bracey Report on the Condition of Public Education,” Gerald W. Bracey explains: “The important research has not been done: research that would tell us why or how some teachers change test scores while others don’t. It would also provide a description of what test-ineffective teachers are actually doing. We might – or might not – be impressed with “effective” teachers. One might wonder whether parents, principals, or other teachers in the system, if asked to name “good” teachers, would come up with the same list.”33 The Committee for Economic Development in Measuring What Matters discussed testing limitations. The report defines two issues directly tied to the limitations of testing: • Some students do not perform at high levels on tests; and • Tests cannot measure all skills that are important for a student’s education.34 Because of these concerns, the Committee for Economic Development points out that tests should not be viewed as perfect tools of measurement, but rather as important instruments for improving learning in the classroom. Educators, policy makers, and the public need to remember that the test is not an end in itself, but a means to an improved school learning environment. The Achievement Gap In its publication Closing the Gap, the Council for Basic Education (CBE) addresses many of the limitations of standards-based reform, and mentions equity as one that cannot be ignored:
How do we ensure that all students can meet these high standards? Questions about the resources certain groups of children are less likely to have – a qualified teacher, adequate materials, extra help – are worrisome to those who envisioned standards as a way to get past the excuses we make for the fact that our poor and minority children are so much more likely to get a sub-par educational experience. There is also great concern about how to make sure that students with disabilities or students who are learning English are included in new systems of higher expectations.35
A 1998 book titled The Black/White Test Score Gap includes a series of essays and various theories for the variation of test scores between racial groups. Studies have indicated that the racial gap in test scores in the nation had decreased during 33 Gerald W. Bracey, “The Ninth Bracey Report on the Condition of Public Education,” Phi Delta Kappan, 10/99. 34 Committee for Economic Development, Research and Policy Committee, Measuring What Matters: Using Assessment and Accountability to Improve Student Learning, (Washington, DC: Committee for Economic Development, 2000). 35 Council for Basic Education, Closing the Gap – A Report on the Wingspread Conference, Special Report, 2/00.

12
the 1980s, but has stalemated since the late 80s. The National Assessment Governing Board (NAGB) explains: “The average scores [from NAEP] for 17-year-old black students in reading and math are about the same as the averages for 13-year-old-whites.”36 The Education Trust seeks to assist low income groups, Latinos, African Americans and others by researching and providing a voice for these groups on various education issues. Kati Haycock, the Executive Director of Education Trust and a standards-based reform supporter, argues that most students can succeed with high standards and rigorous tests if given the right tools. Instead of looking at home environment and income level, Education Trust focuses on what occurs with these students at school, and seeks to make changes in those areas. For instance, Education Trust emphasizes that to perform well on tests, many of the students in these groups will need extra assistance.37 A limitation of a standards-based test, therefore, is that it alone could heighten the achievement gap that already exists. Intervention for students at risk of failing a standards-based test is necessary to continue to close this gap. Increases in Failure and Dropout Rates Tests can affect the dropout rate if enough students consistently fail them, which has caused many parents and educators to react strongly to the national emphasis on testing. Several states have faced serious public backlash to high-stakes graduation exams. Massachusetts, Wisconsin, Virginia, and New York all have witnessed a series of parent protests, some inciting enough opposition to override exit exam requirements. Some states have switched from a one-test-score-get-a-diploma system to a variety of measurements to determine if students have achieved high school standards to receive a diploma.38 Dane Linn, a research specialist at the National Governors’ Association, explains that graduation exams “pose significant issues for state policymakers.”39 He argues that states must evaluate the following issues when implementing a high-stakes graduation exam: • Does the test measure what it is supposed to measure? • Is the test reliable and consistent? • Is there an appropriate and strict testing security system in place? • Are there inherent biases in the test? • How do states know whether they are testing the right set of knowledge and
skills? • How do states ensure that the minimum passing score for a test does not
become the maximum passing score that students reach for?
36 Michael T. Nettles, “Statement on the NAEP 1999 Trends Report,” National Assessment Governing Board, August 24, 2000. 37 Kati Haycock, “Closing the Achievement Gap,” Educational Leadership, 3/01. 38 Peter Schrag, “High Stakes Are for Tomatoes,” The Atlantic Monthly, 8/00. 39 Dane Linn, “High School Exit Exams: Setting High Expectations,” National Governors’ Association, 9/98.

13
• What intervention will take place for students who do not pass the tests?40 Without addressing these issues, states will continue to see a backlash to high-stakes testing, and failure and dropout rates may continue to increase. Effects on Teaching and Learning In “Filling in the Blanks – Putting Standardized Tests to the Test,” the Thomas B. Fordham Foundation explains the effects that tests have on teaching and learning. First, because most educators are not required to develop the skills necessary to understand highly quantitative information, results from standardized tests – which use norms, equivalent scores, etc. – are not used in a substantive way and are probably not used at all in many schools to improve teaching and learning. Second, educators will work to ensure high performance on a standardized high-stakes test and “may go beyond the desired effects of emphasizing certain educational objectives to narrowing the curriculum to focus almost exclusively on a limited set of knowledge or skills.”41 Both of these concerns should force states to analyze the purpose of the tests and ask whether the tests add to or detract from classroom learning. A Rise in Teacher Cheating A Newsweek special report titled “When Teachers Are Cheaters” highlights the common inappropriate actions that are a result of the focus on testing. The article argues that, though cheating is a negative consequence of the increased focus on tests, the true outcome of cheating may cause more than just a negative view toward testing.42 By attaching strong school accountability to test scores, some teachers may engage in inappropriate methods for test preparation – including providing too much assistance during test taking or encouraging specific low-performing students to stay home on test day. The effects that high stakes assessments have on teachers need to be considered when implementing strong assessment and accountability programs. Reporting Test Results to the Public Educators and the public need to understand the purpose tests serve to ensure they are used appropriately and not overemphasized. To help explain tests to the public, and as a form of accountability, 45 states – including Tennessee – issue report cards that include test scores, demographic information, and, in some cases, school ratings. Many states, however, have not disseminated the report cards effectively, and have not explained many terms on these cards to the public. As a companion report to Education Week’s Quality Counts ’99, A- Plus Communications released “Reporting Results – What the Public Wants to Know.” The report highlighted discussions with citizens in small working groups and
40 Ibid. 41 Gregory J. Cizek, “Filling in the Blanks – Putting Standardized Tests to the Test,” The Thomas B. Fordham Foundation, 10/98. 42 Barbara Kantrowitz and Daniel McGinn, “When Teachers are Cheaters,” Newsweek, 6/19/00.

14
larger community groups. The discussions focused on the details that concerned citizens would like to see on school report cards, including: • Performance data, including promotion rates; • Safety indicators, such as number of suspensions and number of acts of
violence; • Teacher qualifications, including percentage with Master’s degrees and
percentage certified; The report also showed that parents and concerned citizens want comparisons between their school and the district and state, and want reports to be concise and easy to follow.43 (See Appendix D for a copy of the sample report card produced by A-Plus Communications that includes these requirements.) Many states have struggled with the content on the school report cards and have changed the format, the amount of information, and the descriptions of terms based on public displeasure. Some states, however, have been lauded for their accurate and easy-to-follow report cards. Ohio, for instance, has a section devoted to suggestions for parents and others on how to use the information on the report card and follow up with the schools. South Carolina’s front page of its annual school report card lists the school’s rating in the state, and clearly defines the terms used on the report card. See Appendices E and F for copies of the Ohio and South Carolina report cards. The Heritage Foundation listed ten model report cards on the Internet in: “The Report Card Report: America's Best Web Sites for School Profiles.” Colorado topped its list. The Heritage Foundation writes: “Colorado’s site contains a wide variety of data, including important information on teachers, such as how many received degrees in their respective teaching fields. The report card includes school ratings, parent-friendly descriptions of individual school features, and the ability to compare different schools.” Other states mentioned by the Heritage Foundation as having strong on-line report cards include Kentucky, Pennsylvania, and Arizona.44 Tennessee’s Approach to Testing Tennessee has tested its students for nearly 40 years, but these tests have undergone many revisions and reforms. In 1984, the General Assembly passed TCA §49-5-5023, which implemented a norm-referenced test in three grade levels. The Education Improvement Act, passed by the General Assembly in 1992, brought about end-of-course assessments and the TVAAS system for analyzing growth in achievement. More recently, the General Assembly implemented the writing assessment in grades 4, 7, and 11 in 1997. As of the 2001-02 school year, Tennessee students take the following assessments as part of the Tennessee Comprehensive Assessment Program (TCAP): 43 “Reporting Results – What the Public Wants to Know,” A-Plus Communications, A companion report to Education Week’s Quality Counts ’99, 1999. 44 The Heritage Foundation, www.heritage.org/reporTCArds/top10.html (accessed 10/29/01).

15
• Achievement test in grades 3-8; subjects tested are English/language arts, mathematics, science, and social studies
• Writing assessment in grades 4, 7, and 11 • End-of-course subject matter test for high school students in Math
Foundations II45 • Gateway graduation tests for high school students in Algebra I, English II,
and Biology (students must pass the Gateways to receive a diploma)46 All students also must take either a college readiness exam (the ACT or SAT) or a work readiness exam (the Work Keys) to graduate, though no passing score is required. Every two years on average, Tennessee students participate in a state NAEP assessment as well. In 2002, Tennessee 4th and 8th graders will participate in the state NAEP in reading and writing. The following table illustrates Tennessee’s tests and requirements:
Table 4: Testing in Tennessee TEST SUBJECT(S) GRADES
ADMINISTERED PERFORMANCE
GOAL Achievement Test (TerraNova)
English/language arts, mathematics, science, social studies
3-8 Equal to or greater than the national average on TerraNova; value-added increase
Competency Test (NOTE: Beginning in the 2001-02 school year, the competency test will be phased out with the introduction of the Gateway tests in fall 2001)
English/language arts, mathematics
Entering Freshman take this test until they pass
70% or better out of 100% on both the English/ language arts and the mathematics sections
Writing Assessment
Writing 4, 7, 11 4.0 or better out of 6.0 (6.0 being an exemplary writing sample)
45 According to the Tennessee Department of Education, end-of-course assessments will be developed in Algebra II, Geometry, Physical Science, Chemistry, and American History, but have been postponed temporarily because of a lack of funding. The end-of-course assessment for English I is undergoing field testing in the 2001-02 school year and will be fully operational in the 2002-03 school year; www.state.tn.us/education/tshssmttable.htm (accessed 12/12/01). 46 The English II Gateway assessment will be administered in the 2001-02 school year, but will not be totally operational until the 2002-03 school year; www.state.tn.us/education/tshssmttable.htm (accessed 12/12/01).
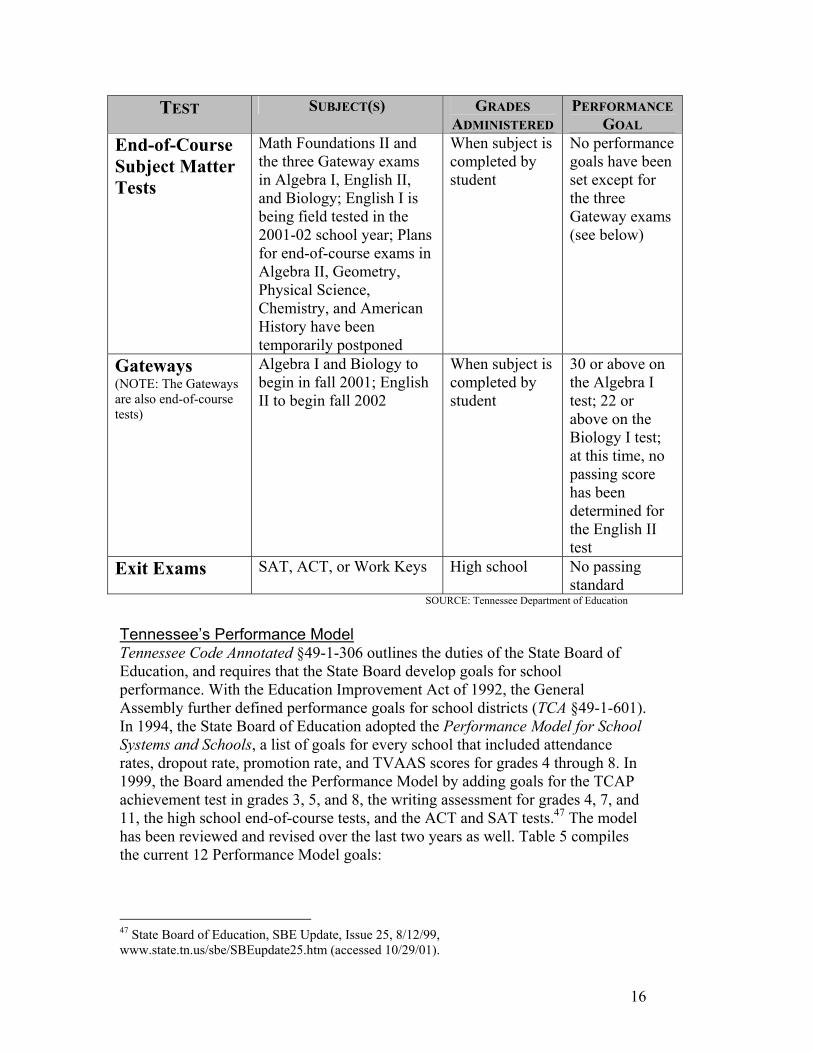
16
TEST SUBJECT(S) GRADES ADMINISTERED
PERFORMANCE GOAL
End-of-Course Subject Matter Tests
Math Foundations II and the three Gateway exams in Algebra I, English II, and Biology; English I is being field tested in the 2001-02 school year; Plans for end-of-course exams in Algebra II, Geometry, Physical Science, Chemistry, and American History have been temporarily postponed
When subject is completed by student
No performance goals have been set except for the three Gateway exams (see below)
Gateways (NOTE: The Gateways are also end-of-course tests)
Algebra I and Biology to begin in fall 2001; English II to begin fall 2002
When subject is completed by student
30 or above on the Algebra I test; 22 or above on the Biology I test; at this time, no passing score has been determined for the English II test
Exit Exams SAT, ACT, or Work Keys High school No passing standard
SOURCE: Tennessee Department of Education Tennessee’s Performance Model Tennessee Code Annotated §49-1-306 outlines the duties of the State Board of Education, and requires that the State Board develop goals for school performance. With the Education Improvement Act of 1992, the General Assembly further defined performance goals for school districts (TCA §49-1-601). In 1994, the State Board of Education adopted the Performance Model for School Systems and Schools, a list of goals for every school that included attendance rates, dropout rate, promotion rate, and TVAAS scores for grades 4 through 8. In 1999, the Board amended the Performance Model by adding goals for the TCAP achievement test in grades 3, 5, and 8, the writing assessment for grades 4, 7, and 11, the high school end-of-course tests, and the ACT and SAT tests.47 The model has been reviewed and revised over the last two years as well. Table 5 compiles the current 12 Performance Model goals:
47 State Board of Education, SBE Update, Issue 25, 8/12/99, www.state.tn.us/sbe/SBEupdate25.htm (accessed 10/29/01).

17
Table 5: Goals in the State Board’s Performance Model Category Goal
Student attendance Average rate of at least 95 percent for K-6 and 93 percent for 7-12
Dropout rate No more than 10 percent for 9-12 Promotion rate At least 97 percent for K-8 Value Added Average score increase equal to or greater than the
national increase in grades 4-8 in reading, language, and math
Academic Attainment, Grades 3-8
At or above the national average in reading and math
Elementary and Middle Writing Assessment, Grades 4 and 7
Average performance at or above the proficient level
Gateway Exams Percentage passing the tests in Algebra I, English II, and Biology
Academic Attainment, High School
End-of-course goals to be determined
Value Added, High School Average score equal to or greater than 100 percent of the expected performance in ten high school subjects
High School Writing Assessment, Grade 11
Average performance at or above proficient level
Attainment, ACT and SAT At or above level specified for admission into Tennessee higher education institutions
Value Added, ACT and SAT
Average score equal to or greater than 100 percent of the expected performance
SOURCE: State Board of Education48 Statute requires the State Board to review and revise the model annually. The State Board has established an accountability committee responsible for ensuring that the model contains appropriate measures. The intent of the Performance Model is to give schools and systems a clear description of goals that must be met. The Department of Education is supposed to follow the Performance Model when implementing consequences and rewards in the accountability program. Tennessee Value-Added Assessment System (TVAAS) In addition to the actual tests taken by students in the state, Tennessee has a statistical system to analyze achievement and improvement, called the Tennessee Value-Added Assessment System. When the General Assembly passed the Education Improvement Act (EIA) in 1992, most people and a good percentage of
48 State Board of Education, www.state.tn.us/sbe/performance_model.htm (accessed 3/15/02).
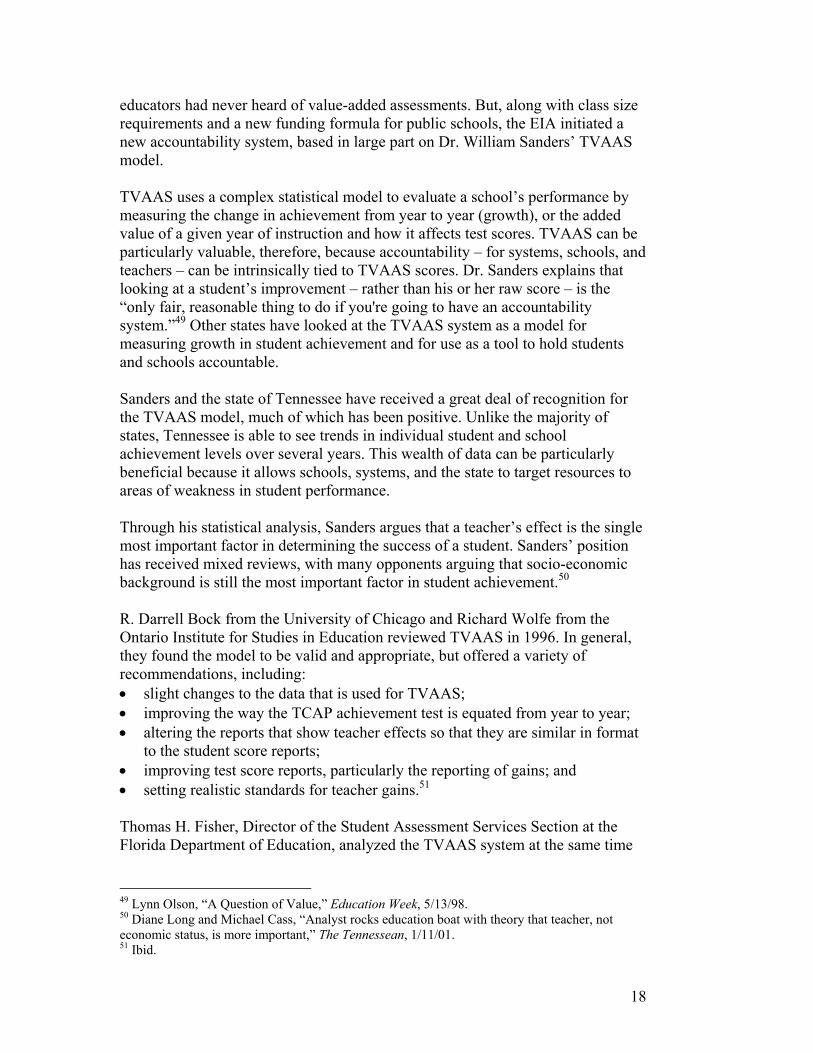
18
educators had never heard of value-added assessments. But, along with class size requirements and a new funding formula for public schools, the EIA initiated a new accountability system, based in large part on Dr. William Sanders’ TVAAS model. TVAAS uses a complex statistical model to evaluate a school’s performance by measuring the change in achievement from year to year (growth), or the added value of a given year of instruction and how it affects test scores. TVAAS can be particularly valuable, therefore, because accountability – for systems, schools, and teachers – can be intrinsically tied to TVAAS scores. Dr. Sanders explains that looking at a student’s improvement – rather than his or her raw score – is the “only fair, reasonable thing to do if you're going to have an accountability system.”49 Other states have looked at the TVAAS system as a model for measuring growth in student achievement and for use as a tool to hold students and schools accountable. Sanders and the state of Tennessee have received a great deal of recognition for the TVAAS model, much of which has been positive. Unlike the majority of states, Tennessee is able to see trends in individual student and school achievement levels over several years. This wealth of data can be particularly beneficial because it allows schools, systems, and the state to target resources to areas of weakness in student performance. Through his statistical analysis, Sanders argues that a teacher’s effect is the single most important factor in determining the success of a student. Sanders’ position has received mixed reviews, with many opponents arguing that socio-economic background is still the most important factor in student achievement.50 R. Darrell Bock from the University of Chicago and Richard Wolfe from the Ontario Institute for Studies in Education reviewed TVAAS in 1996. In general, they found the model to be valid and appropriate, but offered a variety of recommendations, including: • slight changes to the data that is used for TVAAS; • improving the way the TCAP achievement test is equated from year to year; • altering the reports that show teacher effects so that they are similar in format
to the student score reports; • improving test score reports, particularly the reporting of gains; and • setting realistic standards for teacher gains.51 Thomas H. Fisher, Director of the Student Assessment Services Section at the Florida Department of Education, analyzed the TVAAS system at the same time
49 Lynn Olson, “A Question of Value,” Education Week, 5/13/98. 50 Diane Long and Michael Cass, “Analyst rocks education boat with theory that teacher, not economic status, is more important,” The Tennessean, 1/11/01. 51 Ibid.

19
as Bock and Wolfe.52 Fisher, who was not as favorable to TVAAS as Bock and Wolfe, issued recommendations for administering the contracts between the state and testing entities, implementing a broader accountability program based on the testing program, and changing the uses of TVAAS, including a recommendation that TVAAS not be used to hold teachers accountable. Fisher also broached other controversial areas relating to testing, such as fraud in testing administration and the articulation of scores to the public. At this time, the state has not adopted most of the recommendations offered by Bock, Wolfe, and Fisher. However, Sanders and the Department have developed a better way to distribute TVAAS results to educators by using a web-based delivery system. This system allows teachers to see student data clearly and immediately.53 The TCAP Achievement Test The main focus of the state’s assessment program is the TCAP achievement test, a norm-referenced test developed by CTB/McGraw-Hill. The state bases accountability for schools in part on TCAP achievement test results. The TVAAS analysis is compiled from achievement test data. And more students take the achievement test each year than any other test in Tennessee’s assessment program. The state contracts with TRICOR, an independent organization affiliated with the Department of Correction, to assist with sorting the achievement tests. TRICOR provides prisoners from the Women’s Prison who sort tests and prepare them to be sent to the systems (see Table 6 below). The testing system in Nashville is located in two areas. First, the assessment staff at the Department of Education is located in the Department’s building. Here, the tests are run through scanners and scored. Second, the prisoners and other Department staff work out of a warehouse at MetroCenter in Nashville, where the tests are stored temporarily for sorting and organizing. Table 6 illustrates what happens to the achievement test from the date it is printed by the testing company to the date that parents and students find out their scores.
52 R. Darrell Bock, Richard Wolfe, and Thomas H. Fisher, A Review and Analysis of the Tennessee Value-Added Assessment System, contracted by the Office of Education Accountability, Comptroller of the Treasury, State of Tennessee, 1996, www.comptroller.state.tn.us/orea/reports/index.htm (accessed 3/14/02). 53 William Sanders, Research Fellow, University of North Carolina and Manager, Value-Added Research and Assessment, SAS inSchool, E-mail from the author, 7/16/01.

20
Table 6: The Life of a TCAP Achievement Test
Month Action CTB/McGraw-Hill sends achievement tests to warehouse in Nashville Department of Education sends order forms to all school systems School systems return order forms to Department of Education, indicating the number of tests they need
January
Department of Education sends order forms to TRICOR February Prisoners at the Women’s Prison sort through order forms and prepare orders February/
March Orders are sent from warehouse to school systems
School system testing coordinators sort tests and send them to schools March Schools sort tests by grade and teacher Tests are administered April Schools send tests back to school system testing coordinator
April/May School system testing coordinator sends all tests back to TRICOR Boxes opened and reports of irregularities and breach of security sheets removed Used tests are separated from unused Unused tests are stored on tractor trailers Tests are divided into sections (called ops) Tests are counted and compared to header documents sent in with tests Tags are created for each box of tests and boxes are labeled Discrepancies and irregularity reports are double checked Tests are boxed, checked, and shipped to women's prison Tests are double checked for problems on arrival at prison Test booklets and answer documents are cut and re-boxed Boxes of tests are shrink-wrapped Boxes of tests are transported to Department of Education and housed in basement Shrink-wrap is slit open and header documents are removed Header documents entered and processed in CTB/McGraw-Hill mainframe computer Answer documents for corresponding header documents are brought up to the 7th floor at the Department of Education Answer documents are cleaned up if necessary to prepare for scanner Answer documents are scanned Answer documents placed back in their corresponding boxes and moved to editors Editors crosscheck the original answer document with the scanner's red flags to determine student’s intent on a flagged question, if possible Answer documents forwarded to a master editor who double checks the editors' workTeam of Department of Education staff review remaining irregularity reports Scores from separate ops are regrouped with their systems Scores for each system are uploaded to the CTB/McGraw-Hill mainframe as each system is completed CTB/McGraw-Hill prints reports for each system CTB/McGraw-Hill sends reports to each system, the Department, and Dr. Sanders (for TVAAS evaluation)
May
Systems distribute reports to schools May/June Schools prepare parent reports and send out
SOURCE: Karen Jenkins, Director of Testing, Tennessee Department of Education

21
Overview of TCAP Achievement Test Data from 1997-2001 Tennessee students saw slight gains in the majority of grades and subjects in 2000, but did not maintain the gains in the 2001 test. The following two tables show the TCAP achievement test data for all subjects in two grades – 4th and 8th. The scores are based on a norm of 50 percent, meaning that when Tennessee students score a 51 or higher, they are performing above the national average. When they score a 49 or lower, they are below the national average. The ( ) indicate whether the score was a decrease from the previous year (-), an increase (+), or no change (0). It is important to note that some of the changes were very slight – only a point or two – and may not be significant in indicating a change.
Table 7: TCAP Achievement Test Data, Grade 4, 1997-2001 Subject 1997 1998 1999 2000 2001
Reading 58 55(-) 53(-) 55(+) 52(-) Language 62 60(-) 59(-) 60(+) 58(-) Math 62 56(-) 57(+) 58(+) 59(+) Science 66 51(-) 50(-) 54(+) 52(-) Social Studies 61 54(-) 49(-) 55(+) 55(0)
SOURCE: Tennessee Department of Education
Table 8: TCAP Achievement Test Data, Grade 8, 1997-2001 Subject 1997 1998 1999 2000 2001
Reading 56 51(-) 58(+) 54(-) 54(0) Language 63 59(-) 59(0) 58(-) 58(0) Math 60 55(-) 57(+) 58(+) 56(-) Science 60 54(-) 56(+) 53(-) 52(-) Social Studies 56 54(-) 53(-) 56(+) 49(-)
SOURCE: Tennessee Department of Education Performance Standards for the TCAP Achievement Test Tennessee Code Annotated §49-1-601 mandates that performance standards for Tennessee schools be developed. The State Board developed a two-tiered system of performance standards – minimum expectations and maximum goals and assigned letter grades to each of these levels. Minimum expectations would be considered average – and receive a grade of “C.” Maximum goals attained would receive an “A.” The 2001 statewide report card, issued by the Department of Education, indicates that Tennessee has improved in a few areas, but the state still has work to do. The report card is a striking example of the two different views of student success – achievement vs. gain. In general, the state’s achievement scores (raw scores on the TCAP achievement test) are roughly average, but the value-added or improvement scores vary widely – ranging from deficient to above average.
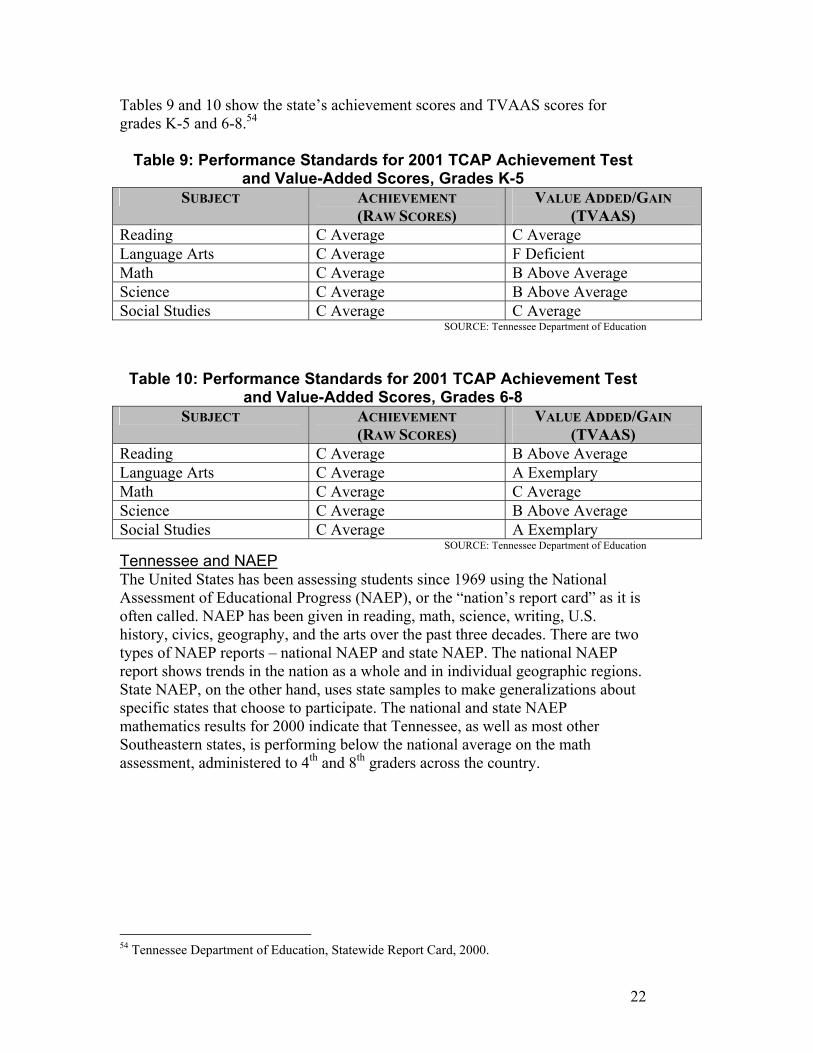
22
Tables 9 and 10 show the state’s achievement scores and TVAAS scores for grades K-5 and 6-8.54
Table 9: Performance Standards for 2001 TCAP Achievement Test and Value-Added Scores, Grades K-5
SUBJECT ACHIEVEMENT (RAW SCORES)
VALUE ADDED/GAIN (TVAAS)
Reading C Average C Average Language Arts C Average F Deficient Math C Average B Above Average Science C Average B Above Average Social Studies C Average C Average
SOURCE: Tennessee Department of Education
Table 10: Performance Standards for 2001 TCAP Achievement Test and Value-Added Scores, Grades 6-8
SUBJECT ACHIEVEMENT (RAW SCORES)
VALUE ADDED/GAIN (TVAAS)
Reading C Average B Above Average Language Arts C Average A Exemplary Math C Average C Average Science C Average B Above Average Social Studies C Average A Exemplary
SOURCE: Tennessee Department of Education Tennessee and NAEP The United States has been assessing students since 1969 using the National Assessment of Educational Progress (NAEP), or the “nation’s report card” as it is often called. NAEP has been given in reading, math, science, writing, U.S. history, civics, geography, and the arts over the past three decades. There are two types of NAEP reports – national NAEP and state NAEP. The national NAEP report shows trends in the nation as a whole and in individual geographic regions. State NAEP, on the other hand, uses state samples to make generalizations about specific states that choose to participate. The national and state NAEP mathematics results for 2000 indicate that Tennessee, as well as most other Southeastern states, is performing below the national average on the math assessment, administered to 4th and 8th graders across the country.
54 Tennessee Department of Education, Statewide Report Card, 2000.

23
Map 1: NAEP 2000 Mathematics Scores in the 50 States
SOURCE: National Assessment of Educational Progress, National Center for Educational Statistics Tennessee and most Southeastern states have consistently ranked below the national average on recent NAEP assessments. The exceptions are Virginia, Texas and North Carolina, the latter two of which have seen NAEP gains that some attribute to education reforms in those states. A recent RAND reports warns of overestimating the effects of education reforms on NAEP gains.55 However, it is clear that these states are outperforming Tennessee. Testing Costs in Tennessee The Department of Education reports that Tennessee spends approximately $10.3 million on testing each year. The state budgets roughly $3.1 billion for K-12 education.56 Testing costs account for less than one percent of total K-12 spending. Table 11 illustrates the costs of individual tests in the state:
55 David W. Grissmer, Ann Flanagan, Jennifer Kawata, and Stephanie Williamson, Improving Student Achievement: What State NAEP Test Scores Tell Us, RAND, 2000. 56 State of Tennessee web site, www.state.tn.us/finance/bud/overview/buddoc.html (accessed 10/25/01).

24
Table 11: Cost of Individual Tests in Tennessee
TEST TOTAL COST (IN MILLIONS, ROUNDED) Gateway tests and other end-of-course tests $05.2 TCAP Achievement Test and Competency Test
$04.5
Writing Assessment $00.6 Total for all tests: $10.357
SOURCE: John Sharp, Tennessee Department of Education The Tennessee state budget groups testing in the accountability portion of the budget, which totaled an estimated $23 million in the 2001-2002 final work program. This number encompasses items other than just the development and operation of the testing program in the state, including aspects of the accountability system and payroll costs. It is difficult to compare Tennessee’s spending on testing to other states’ spending on testing because each state includes different items in its testing budget. For instance, some states include costs of preparing and assisting students who are doing poorly on the tests as part of the budget for testing, while other states include only the costs of testing contracts with companies like CTB/McGraw-Hill. Testing Students in Special Education in Tennessee58 The Individuals with Disabilities Education Act (IDEA) of 1997 requires that every state provide a Free Appropriate Public Education (FAPE) for all students, including those with disabilities of any kind. The Act states that students must be placed in the least restrictive environment in which they can still be successful learners (the least restrictive environment would be the regular classroom). The IDEA also requires that every student – including those with disabilities – participate in the state assessment system, and the assessments must be aggregated and disaggregated to show the special education population in relation to the general student population. IDEA allows an alternative assessment in some cases, but a state may not give an alternative assessment to more than two percent of the total student population. Tennessee uses the TCAP-Alternative Assessment (TCAP-ALT) to test students who, because of a disability, cannot take the regular TCAP achievement test. The TCAP-ALT is a portfolio assessment that is compiled throughout the year. The goals of the TCAP-ALT are linked to the state standards, and the subjects assessed are the same as those in the TCAP achievement test – English/language arts, mathematics, science, and social studies. State-trained teachers grade the assessment.
57 The $10.3 million does not include personnel costs or warehouse storage and other supply costs. 58 This section is based on interviews with Joseph Fisher, Ann Sanders, and Christy Gunn, Office of Assistant Commissioner of Special Education, Tennessee Department of Education, 5/29/01.

25
Students may participate in TCAP-ALT if they are severely disabled and when no other modifications (large print, Braille, etc.) would assist them in taking the regular test. The Individual Education Program (IEP) team that determines a special education student’s course of study determines whether the student is eligible for the TCAP-ALT. According to Department staff, teachers previously had been resistant to the TCAP-ALT. Before IDEA, special education teachers were never held accountable and were left on their own to teach. With IDEA, special education teachers must prove that their students are learning. As teachers have become familiar with the TCAP-ALT, they have begun to understand the value of this type of assessment. The statewide training for the TCAP-ALT, for instance, has seen an increase in attendance each year, according to Department of Education officials. The TCAP-ALT likely is underused, however, and the Department may need to disseminate better information about the TCAP-ALT to schools and systems. The TCAP-ALT is expensive, but it, along with the training for the assessment, is entirely funded through federal dollars. The state is developing another assessment option – the Academic Skills Assessment. This option would allow a student to take the regular TCAP achievement test at the student’s functioning level rather than grade or age level. The scores for this assessment would be reported with the TCAP-ALT scores. Students must qualify for the TCAP-ALT to take the Academic Skills Assessment. All special education students who function between kindergarten and 8th grade would take the Academic Skills Assessment. Only students who function below kindergarten level would participate in the TCAP-ALT portfolio assessment. The Division of Assessment and Evaluation at the Department of Education monitors the tests and determines if large numbers of students are staying home on test day or if a teacher encourages special education students not to take the test. Students may be exempted from the test for medical reasons, and there are several accommodations, such as large print, Braille, and audio questions for both the TCAP-ALT and the regular TCAP achievement test. To receive a regular high school diploma, special education students have to pass the Gateway exams like all other students. The state will continue to grant a special education diploma to students who are in special education and who do not pass the Gateways. Testing English Language Learners (ELL) in Tennessee In September 2000, Tennessee entered into a voluntary agreement with the federal Office of Civil Rights that indicated the state’s intent for providing services to

26
ELL students.59 The agreement reads: “The Tennessee State Department of Education voluntarily agrees to take the actions specified in this agreement to ensure that all national origin minority (NOM) LEP students in the state receive required educational services pursuant to Title VI of the Civil Rights Act of 1964.”60 Currently ELL students take the math computations section, a subsection of the math section on the TCAP achievement test, in their first year in the school system. In the second year, the student adds vocabulary and language mechanics. In the third year, ELL students take the entire TCAP achievement test battery. The Department of Education has recently implemented a new testing policy for ELL students. The policy states that ELL students are exempt for the first year they are in school, but in the second year, they take the full battery of tests in the TCAP achievement test unless they receive an exemption. Exemptions are based on student scores on an English proficiency exam administered each year. After three years in the school system, all ELL students are required to take the full battery of tests in the TCAP achievement test. (See Appendix G for a copy of the ELL policy.) Other issues that affect ELL student testing include: • Starting in the 2001-02 school year, the state is adding ESL to the BEP as
a new component. In the 2001 legislative session, the General Assembly approved an appropriation of $5.2 million that will help fund ESL instructors and translators through the BEP formula.61
• The Department is working on establishing a policy for disaggregating ELL students in the testing system. The TCAP achievement test can be disaggregated for ELL students, but currently the state results include this population per federal law. Including ELL students in TVAAS results has been controversial among teachers; however, others believe that if ELL students are not included, schools have fewer incentives to help them learn English.
• ELL students will still have to take and pass the Gateways to receive a high school diploma. ESL classes can be counted for English requirements in high school. ELL students taking ESL I freshman year would not take English II (the class on which the Gateway in English is based) until senior year. This limits the number of times an ELL student can retake the English II Gateway test, and may limit the number of ELL students in the state with high school diplomas.
59 The term ELL (English Language Learners) is the current appropriate term for students whose first language is not English. The term LEP (Limited English Proficiency) used to be common, but has been replaced by ELL. The term ESL (English as Second Language) should still be used when describing programs, but not when describing students. 60 Voluntary agreement between the Office of Civil Rights and the Tennessee Department of Education, courtesy of the Tennessee Department of Education. 61 State Board of Education, SBE Update, Issue 34, July 20, 2001, www.state.tn.us/sbe/update34.htm (accessed 12/12/01).

27
ANALYSIS AND CONCLUSIONS The Gateway tests provide a new means to assure that Tennessee’s high school graduates have attained certain requisite skills, but many students will need remediation to pass them. Beginning with the class of 2005, all students must pass the Gateway exams in Algebra I, Biology, and English II to receive a high school diploma. In 1999, the State Board of Education passed policy requiring the implementation of end-of-course exams in ten subjects. Three of these exams – Algebra I, Biology, and English II – are used as graduation requirements. In fall 2001, students began taking these new exams. Students must meet the proficient level on all three exams to receive a high school diploma. Proficient levels are 30 and 22 for Algebra I and Biology I respectively. The Department of Education has not released the passing score for the English II exam as of January 2002. Students will have several opportunities to retake the tests in case they fail one, two, or all three exams. In January 2002, the Department of Education released the results from the first administration of the Gateway exams in Algebra I and Biology. The results showed that 76.4 percent of students were proficient or advanced in Algebra I and 94.5 percent of students were proficient or advanced in Biology. Though the results, particularly the Biology results, seem good, the Department warned against overstating these initial results. In a press release about the Gateways, Ben Brown of the Department of Education explains: “The students taking this first administration of the test were a unique population. They include only those students in schools with block scheduling and those students who took Algebra I as eighth graders and did not pass the screening test. Many of the latter students are not even taking algebra at this time. In addition, any student taking one of these courses had to take the appropriate test, not just ninth graders. Many of the students taking the Biology I test, for example, were sophomores."62 Graduation exams like the Gateways have appeared in several states over the past few years – all attempts to increase the standards required for a high school diploma. Previously several states, including Tennessee, have only required high school graduates to be competent in subjects at an 8th grade – or even a 6th grade – level. High school diplomas based on low standards imply that students are not adequately prepared to master higher-level material or skills. An Achieve, Inc. policy brief explains the importance of raising the standards for tests:
To say that accountability systems place unfair consequences on student performance ignores the fact that students face consequences all the time – for example, when they get out of high school and find they lack the preparation for college or a career.
62 Tennessee Department of Education News Release, “First Administration of Gateway Tests Successful,” 1/3/02.

28
For too many young people, the education system has been a path toward closed doors.63
High standards for graduation could help better prepare students for successful careers, benefiting the economy as a whole. But high stakes tests based on high standards come at a cost. Many educators are concerned that a large percentage of students will fail the tests and not receive a diploma. Without assistance for students who struggle to pass these high-stakes exams, more students may drop out. The Southern Regional Education Board explains:
When states set higher standards and implement more challenging assessments, the initial results may be sizable numbers of students who do not meet those expectations…Many people fear that setting high expectations will result in too many students who fail and who drop out of school. States should work to prevent this situation by having programs that combine efforts to • improve teacher training; • increase parental involvement; • and help schools learn to identify struggling students early and
to provide them with the assistance they need to catch up.64 In addition, students who do not drop out but still fail the Gateways will be ineligible for a high school diploma. A significant decrease in the number of high school graduates could be very damaging to the state’s economy. Though businesses in general support higher standards and high stakes to ensure a well-prepared workforce, they also are aware that assistance needs to be offered to the students before the high stakes are implemented. Withholding a high school diploma because a student failed a test without adequately assisting the student to pass the test may cause a serious public backlash as well. Other states have witnessed parent and community protests to similar graduation tests, and in some of those states the standard has been lowered in part because of public pressure. In spring 2001, the General Assembly passed the Education Reform Act of 2001, which would have included $10 million targeted to student assistance in the first year of implementation. The legislation, however, was not funded. The program, titled “Catching Up,” would have required the Commissioner of Education to develop a program for intervention for 7th, 8th, and 9th graders at risk of failing the Gateway assessments. The Commissioner would submit the plan to the State Board of Education. The plan would have included assessment of students in 7th and 8th grades to determine those at risk of failing. It would also have clarified how the state would have notified parents that their child is at-risk. The local school, the student, and his/her parents would develop the individual intervention 63 Achieve, Inc., “Testing: Setting the Record Straight,” Achieve Policy Brief, Issues Number One, Summer 2000. 64 Southern Regional Education Board, “Student Achievement in SREB States,” April 2000.
29
programs. The Commissioner would have provided grants to school systems for intervention purposes. New legislation in the 2002 session incorporates intervention programs for students at risk of failing graduation requirements. At this point, it is unlikely that this legislation will be funded. By summer 2001, the Department had developed a proposed timeline for establishing the intervention program, which included an emphasis on professional development. The lack of funding for the initiative will hamper the state’s ability to assist students at risk of failing the tests. Despite the lack of funding for student assistance, however, the Department is moving forward with its professional development “institutes” to prepare educators for the Gateway exams. The Department began hosting the institutes, which targeted each of the three subjects (Algebra I, Biology, and English II), in June 2001. In addition, the first 25 percent of extended contract funding for 2001-2002 was for remedial or intervention efforts for students.65 According to the Department of Education, the Office of Curriculum and Instruction provides technical assistance to systems and schools only when requested. The Department targets areas that are weak as indicated on TCAP achievement test scores and on Gateway results. The Office of Curriculum and Instruction also has provided professional development to teachers that focused on assisting students who were having difficulty passing the TCAP competency test. This year, the Department provided training for new Gateway consultants that included interpreting score results. These consultants, like the competency test consultants, assist systems and schools only when requested by the systems. The Office of Curriculum and Instruction indicates that resources, though limited, will continue to be available to assist systems with testing issues.66 In the past, several education organizations have rated Tennessee’s standards and assessments low; however, Tennessee showed significant improvement in this area during 2001. Education Week’s Quality Counts issues an annual grade for the 50 states in a variety of education improvement categories, including standards, assessment, and accountability.67 The assessment category includes the following measures: • Whether the state uses criterion-referenced assessments aligned to state
standards (alone or in addition to norm-referenced tests); • The subjects and grade levels (elementary, middle, and high school) that are
tested using the criterion-referenced assessment; • Types of test questions (multiple choice, short answer, etc.) • Whether the state participated in the National Assessment of Educational
Progress (NAEP) 2000 test. 65 Phone interview with Claudette Williams, Executive Director, Office of Curriculum and Instruction, Tennessee Department of Education, 1/10/02. 66 Ibid. 67 Education Week, Quality Counts 2002, www.edweek.org/sreports/qc02/ (accessed 1/11/02).

30
Using these criteria, Education Week Quality Counts 2002 ranks Maryland at the top of the assessment chart because the state uses multiple choice, short answer, and extended response criterion-referenced questions at all three grade levels in the four core subjects (English/language arts, mathematics, history/social studies, and science). In addition, the state participated in NAEP 2000. The top three states behind Maryland, all of whom received an “A” or “A-“ as their grade, include New York, Kentucky, and Louisiana. Tennessee received a “C+” for its standards and accountability – a strong improvement from last year’s “F.” Tennessee does not have a criterion-referenced test in mathematics, science, or social studies in elementary or middle school, and therefore received a lower score for assessment. Education Week did give Tennessee credit for its criterion-referenced writing assessment in grades 4, 7, and 11. Tennessee’s Department of Education contracted with the Council of Chief State School Officers (CCSSO) to facilitate a benchmarking of content standards session, which occurred in June 2001. The Department used the results from the “Report of Findings” developed in the CCSSO work to revise the standards. The State Board of Education approved the final version of the standards – in English/language arts and math for K-8, science and social studies for K-12, and visual and performing arts for 6-12 – in August 2001.68 The American Federation of Teachers has established criteria for analyzing state standards, curriculum, assessments, accountability (which includes student incentives and intervention), and a state’s overall program – “putting the pieces together.” In analyzing a state’s efforts in developing a cohesive testing program, AFT asks the following questions:
• Are the tests aligned to the standards? • If yes, are all of the tests based on strong standards? • Are curricula developed in all of the aligned test areas? • Are all promotion or graduation policies based on aligned tests? • Do all promotion or graduation policies include intervention?69
The AFT report highlights Illinois and Pennsylvania as two states that have put these pieces together well, and that have assessments aligned to strong standards. Tennessee receives credit for aligning some of its tests to standards, but falls short in developing a system that clearly links strong standards and tests to curriculum and accountability issues.70 Reviewing the above analyses of state standards and assessments, Tennessee’s testing system has been criticized for the following reasons:
68 Claudette Williams, Executive Director, Office of Curriculum and Instruction, Tennessee Department of Education, E-mail from the author, 12/18/01. 69 American Federation of Teachers, www.aft.org/edissues/standards/MSM2001/Index.htm (accessed 3/12/02). 70 Ibid.

31
• Some of the standards to which tests are aligned are neither strong nor clear;71 • The state does not use enough criterion-referenced tests;72 • The state does not have enough extended response questions in its tests;73 • The state has not established a coherent system that incorporates standards,
assessments, curriculum, and accountability.74 According to a U.S. Department of Education’s review of Tennessee’s Title I compliancy, which concluded that Tennessee is out of Title I compliance, the tests and standards in Tennessee do not appear to be well-aligned.75 The compliancy is based on the 1994 reauthorization of the federal Elementary and Secondary Education Act, which made changes to federal programs that furthered state efforts in standards-based reform. The U.S. Department of Education clarifies the new requirements:
The reauthorization…reformed federal programs to support State efforts to establish challenging standards, to develop aligned assessments, and to build accountability systems for districts and schools that are based on educational results. In particular, the Act includes explicit requirements to ensure that students served by Title I are given the same opportunity to achieve to high standards and are held to the same high expectations as all students in each State.76
Specifically, the federal government instructed states to have assessments aligned with the state’s standards by the 2000-01 school year. The U.S. Department of Education also requires that states with mandated assessment for all students must use the same assessment for Title I students. In the 2001 Tennessee review for Title I compliance, the U.S. Department of Education declared that Tennessee “does not yet meet the assessment requirements of the Title I statute.”77 The U.S. Department asked questions relating to comprehensiveness, emphasis, depth, and alignment with performance standards. The Peer Review Report that accompanied the U.S. Department review concluded: 71 Education Week, the Thomas B. Fordham Foundation, and the American Federation of Teachers have reviewed Tennessee’s standards and have found some of them to be neither strong nor clear, though Education Week and the American Federation of Teachers give credit to Tennessee for improvements. 72 Education Week, Quality Counts 2002, www.edweek.org/sreports/qc02/ (accessed 1/11/02). 73 Ibid. 74 American Federation of Teachers, www.aft.org/edissues/standards/MSM2001/Index.htm (accessed 3/12/02). 75 Alignment means that a state’s standards are closely linked to the state’s tests, indicating that students are tested on material they are taught in the classroom. 76 U.S. Department of Education, Peer Reviewer Guidance for Evaluating Evidence of Final Assessments under Title I of the Elementary and Secondary Education Act, www.ed.gov/offices/OESE/cpg.pdf (accessed 10/29/01). 77 Letter from Tomas M. Corwin, Acting Deputy Assistant Director, U.S. Department of Education to E. Vernon Coffey, Commissioner of Education, Tennessee Department of Education, 5/7/01, www.ed.gov/offices/OESE/saa/tn.html (accessed 10/30/01).

32
No documentation has been provided to indicate how well the Terra Nova or any other part of the assessment system aligns with Tennessee’s standards. [CTB/McGraw-Hill’s] technical manual for the TerraNova was provided in the spring of 2001. It is recommended that this information be supplemented with how the content of the TerraNova reflects Tennessee’s content and performance [standards]…There does not appear to be evidence provided of the match between the content standards and the end-of-course tests. The standards setting approach to be undertaken also is not specified. As such, a determination on the degree to which Tennessee’s assessment reflects its content and performance standards in terms of depth and match, and covers the range of cognitive skills, may not be determined.78
Alignment between tests and standards is important to ensure that students are tested on the material they learn in the classroom. Previously, the Department of Education and CTB/McGraw-Hill claimed that parts of the norm-referenced test were in fact aligned to state standards. However, in discussions over the state’s compliance with the recent reauthorization of the Elementary and Secondary Education Act, the Department has stated that it will be reviewing the alignment of the Achievement Test to the state standards. The state has been working with Achieve, Inc. to look into the alignment. Achieve is in the early stages of its review of Tennessee’s alignment, and their report should be released to the state sometime in 2002. This review will help the state comply with Title I requirements that mandate alignment between state standards and tests. In addition, the Department of Education is finalizing a request for proposal for a new testing contract for the Tennessee Comprehensive Assessment Program.79 The reauthorization of the federal Elementary and Secondary Education Act will impact Tennessee’s assessment system in a variety of ways. President’s Bush’s plan, No Child Left Behind, passed the U.S. House and Senate with overwhelming bipartisan support in December 2001, and was signed into law in January 2002. The law will increase federal education funds for Tennessee by approximately $67.3 million, $6.9 million of which is targeted to assessments.80 The Department is working on a request for proposals for the development of a criterion-referenced test in grades 3-8, which would be funded by a portion of the $6.9 million allocated for developing compliant tests. The state currently uses the norm-referenced TerraNova exam in these grades for national comparison purposes and for the TVAAS analysis.
78 Peer Review Report on Tennessee – Evidence of Final Assessment System under Title I of the Elementary and Secondary Education Act, 5/00 with a 4/01 update. 79 Claudette Williams, Executive Director, Office of Curriculum and Instruction, Tennessee Department of Education, E-mail from the author, 12/18/01. 80 Jeff Roberts, Deputy Commissioner, Tennessee Department of Education, E-mail from the author, 3/14/02.

33
The development of a criterion-referenced test for grades 3-8 will bring the state into compliance, and will also allow the state to compare student achievement against the state’s standards to see if Tennessee’s students are learning what the state expects them to know and be able to do at these grade levels. A primary component of the legislation includes providing additional options for parents of students in failing schools. The federal fact sheet for No Child Left Behind explains that parents would have the following options:
• Public School Choice: Parents with children in failing schools would be allowed to transfer their child to a better-performing public or charter school immediately after a school is identified as failing.
• Supplemental Services: Federal Title I funds (approximately $500 to $1,000 per child) can be used to provide supplemental educational services - including tutoring, after school services, and summer school programs - for children in failing schools.
• Charter Schools: [the law] expands federal support for charter schools by giving parents, educators and interested community leaders greater opportunities to create new charter schools.81
In addition, the federal law requires that all students and schools make adequate yearly progress as defined by the state. The Department of Education is currently developing the definition of adequate yearly progress. The state requires that students take one of three exit exams to receive a high school diploma; however, the exit exams, with no passing score required, may not be needed. Tennessee Code Annotated §49-6-6001 (2) (b) mandates that students take an exit exam with no passing score required as part of the state’s graduation requirements. The law calls for the State Board of Education to adopt an exit exam of its choosing. The State Board selected the SAT or the ACT for students going on to college and the Work Keys exam for students who were entering the job market. The original idea was that the Work Keys assessment, developed in collaboration with business leaders by ACT, would assist businesses in selecting applicants. The scoring system of the Work Keys exam is based on a five point scale, and businesses could determine how many “threes” they needed in certain areas, how many “fours,” and so on. According to Dave Goetz, president of Tennessee Association of Business and an original supporter of the Work Keys program, the Tennessee Board of Regents was responsible for establishing the Work Keys centers at their community colleges, some of which may not have fully bought into the idea of Work Keys.82 The Board of Regents explained that 81 Fact Sheet – The No Child Left Behind Act of 2001; http://www.ed.gov/offices/OESE/esea/factsheet.html (accessed 2/6/02). 82 Phone interview with Dave Goetz, President, Tennessee Association of Business, 12/10/01.

34
the individual community colleges were responsible for promoting Work Keys and that some of the colleges may have done a better job at doing this than others.83 The result, according to Goetz, was that the program was not adequately sold to businesses in the state. The Board of Regents, though supportive of the program, explains that Work Keys may have been less successful at some community colleges because of their rural locations – the types of businesses in urban areas possibly fit more appropriately with Work Keys than businesses in rural areas. In either case, Work Keys does not seem to have secured enough support to make it an efficient or effective tool for businesses. The business community was hesitant to use it for fear of discrimination problems as well.84 Because of these reasons, the Work Keys exam, though a potential resource for both vocational students and businesses, has never been used in a significant way in Tennessee. In addition, some students may view this exam and the SAT or ACT exams as hollow requirements. At the inception of Work Keys, many students did not understand the purpose of the test and were not explained the usefulness of it.85 And because the state does not require a passing score with the exit exams, many students simply may not take the tests seriously. With the advent of the Gateway graduation exams, which do have passing requirements, the old exit exam mandate may not be necessary. Finally, the BEP generates $1,318,041 total in state and local funds to be used for the ACT, SAT, and Work Keys requirement. Both the state and local education agencies could save money if the law were permissive and not mandatory. The state uses tests as one measure of its accountability system, a major component of which is placing low-performing schools on notice of probation. The Department issued the first such list in September 2001, when it placed 98 schools on notice. Tennessee Code Annotated §49-1-602 authorizes the Department to release a list of schools on notice. The Department explains that K-8 schools on notice have 48 to 73 percent of their student population below average in reading, language arts, and math on the TCAP achievement test. In addition, the schools have not met at least one of the following: • 100 percent TVAAS score in reading, language arts, and math for three years;
OR • reducing the achievement gap between students in the below average group
and the rest of the school in reading, language arts, math, and writing.86
83 Phone interview with Kay Clark, Assistant Vice Chancellor for Academic Affairs, Tennessee Board of Regents, 1/10/02. 84 Phone interview with Dave Goetz, President, Tennessee Association of Business, 12/10/01. 85 Ibid. 86 Fact Sheet – Placing Schools on Notice; www.state.tn.us/education/nr010920a3.htm (accessed 10/29/01).

35
Criteria for placing high schools on notice differs slightly. High schools on notice have below average scores in at least two of the following: Algebra I end-of-course exam, 11th grade writing exam, and the ACT. In addition, high schools must meet all three of the following growth goals to avoid the on notice list: • positive TVAAS scores (moving in the right direction); • reducing the achievement gap in the below average group of students; and • reducing the dropout rate.87 The Department of Education developed the criteria for placing schools on notice in conjunction with the State Board of Education’s Performance Model for schools. The State Board of Education has devised an accountability committee to revise the Board’s Performance Model. This committee, which includes district superintendents and principals as well as many Department and Board officials, has begun to discuss the future of the state’s accountability program. Though Tennessee Code Annotated §49-1-602 explains that schools that are on probation for two years risk school superintendent and board member removals by the state, the Department and the State Board have not finalized a plan for enacting this sanction. According to Douglas Wood, Executive Director of the State Board of Education, State Board staff are beginning to look at the necessary steps involved in removing school staff or taking over a school in response to a request by State Board member Avron Fogelman.88 Fogelman is the State Board representative from Memphis, which includes two-thirds of the states’ on notice schools. Tennessee Code Annotated §49-1-602 explains that a system or school may be placed on notice for one year. If no improvement has been made by the end of the on notice year, the Commissioner has the authority to place the system or school on probation. If a system or school remains on probation for two consecutive years, the Commissioner can recommend to the State Board that the superintendent and/or board members be removed. Given this timeline, the on notice schools would be at risk of a state takeover or removal of personnel in the 2004-2005 school year. Too few schools and systems appear to be using test data to improve student learning. Interviews with system testing coordinators and an informal survey of several school superintendents indicate that many schools and systems do not use test data, particularly TVAAS results, to improve student learning.89 As a result, schools do not benefit from test data as intended. The TVAAS model, enacted by the General Assembly with the Education Improvement Act of 1992, provides the state with an incredible source of data on student and teacher performance and has been looked at by other states as a model for accountability data. Ideally, schools would use TVAAS scores as a diagnostic tool to assist them in making
87 Ibid. 88 TEA News, Tennessee Education Association, Volume 33, Number 5, December 2001. 89 Interview with Gerry Hausman, Student Data Director, Williamson County Schools, 5/14/01, phone interview with Larry Martin, Testing Coordinator, Maryville City Schools, 6/07/01, and Tennessee Organization of School Superintendents Survey 4/17/01.

36
improvements, developing School Improvement Plans required by the state, and highlighting particularly weak areas in their curriculum. Maryville Middle School teachers, for example, use TVAAS results among other indicators to plan curriculum and activities throughout the year. However, most Tennessee schools have not followed suit. One reason for this, according to the Tennessee Education Association (TEA), is that teachers fear TVAAS because they don’t understand it.90 Although TVAAS should be used as only one component of a teacher’s evaluation, a few principals apparently have used it inappropriately, causing distrust. TEA indicates, however, that teachers support TVAAS when they understand the information that it provides.91 The Department of Education will provide TVAAS training if requested by a school system, and the Office of Training and Professional Development at the Department has held sessions titled “Focus on Success: Data Analysis for Decision Making” in Jackson, Nashville, Dickson, and Greeneville. These sessions were open to system and school staff. 92 The sessions reviewed using student achievement data, including “identifying, implementing, monitoring, evaluating, and modifying the specific strategies and activities that must be implemented at a given school to improve student performance.”93 Sessions scheduled for Memphis and Knoxville were cancelled by the Department because of low enrollment. Each session included participants from a number of systems and schools, and material was generalized to accommodate a variety of issues. Though these sessions are a good start to informing schools about the uses of test data, it is clear that more specialized professional development sessions – specifically sessions geared to individual schools – are still needed. Dr. William Sanders, who created the TVAAS model, believes that the Department of Education can help improve educators’ and the public’s understanding of TVAAS. He explains:
The [Department of Education] can accelerate its in-service training activities to teach principals and teachers how to use the wealth of positive diagnostic information available to them from the totality of the TVAAS reports. Some Tennessee districts have done a good job of informing their educators, others have not. For example, we still are learning from some [Tennessee] educators that they have never seen the "gain by achievement" reports that have been produced for each district and each school since 1994 (a set of reports that educators tell us are some of the most valuable information that they receive).94
90 Interview with Peggy Killough, Nancy Duggin, Terrance Gibson, and Susan Young, Office of Instructional and Professional Development, Tennessee Education Association, 5/23/01. 91 Ibid. 92 Phone interview with Dennis Bunch, Director, Tennessee Academy of School Leaders, Tennessee Department of Education, 3/12/02. 93 “Focus on Success: Data Analysis for Decision-Making,” Tennessee Department of Education. 94 William Sanders, Research Fellow, University of North Carolina and Manager, Value-Added Research and Assessment, SAS inSchool, E-mail from the author, 7/16/01.

37
Currently the Department produces a primer for understanding and interpreting TVAAS scores. However, the existing primer is confusing and likely does little to alleviate distrust of TVAAS. It is far too technical for schools to use the primer as a guide for applying TVAAS results to improvement plans. The Department of Education has recently launched a web-based delivery system for the TVAAS results and descriptive reports. With this new way of disseminating the results from TVAAS, perhaps educators’ understanding will increase. Dr. Sanders writes: “access to the totality of the information will be readily available to all appropriately authorized educators. This accessibility will enable "drill down" to the student level, so that properly authorized individuals can see all of a student's previous history.”95 The potential uses of the TVAAS data to improve student learning are considerable, but the state must broaden its purpose from a tool for reviewing student performance to a tool impacting student achievement. Issuing school and district report cards has been a major step in making student performance information readily available to the public; however, state and local officials should continue to strengthen and enhance them. The school report cards for Tennessee include: • The name of the school and system, and the name of the district
superintendent; • The grades served by and number of students at the school; • The racial breakdown of all students at the school; • The number of expulsions and suspensions at the school disaggregated by race
and gender; and • The achievement scores and value-added scores – listed as a proficiency level
(above average, exemplary, etc.).96 See Appendix H for a sample of a Tennessee school report card.
Based on national citizen group discussions facilitated by A-Plus Communications, parents would like to see additional information on report cards.97 The school report card would ideally include teacher qualification information. The report card should also be easier to understand by using clearly defined terms, particularly for TVAAS or value-added, and could accomplish this by incorporating into the hard copy of the reports some of the information in the “Report Card Explained” section of the web site. The school report card defines the achievement and value-added scores as the following:
95 Ibid. 96 Tennessee Department of Education, www.k-12.state.tn.us/rptcrd00/default.asp (accessed 10/30/01). 97 “Reporting Results – What the Public Wants to Know,” A-Plus Communications, A companion report to Education Week’s Quality Counts ’99, 1999.
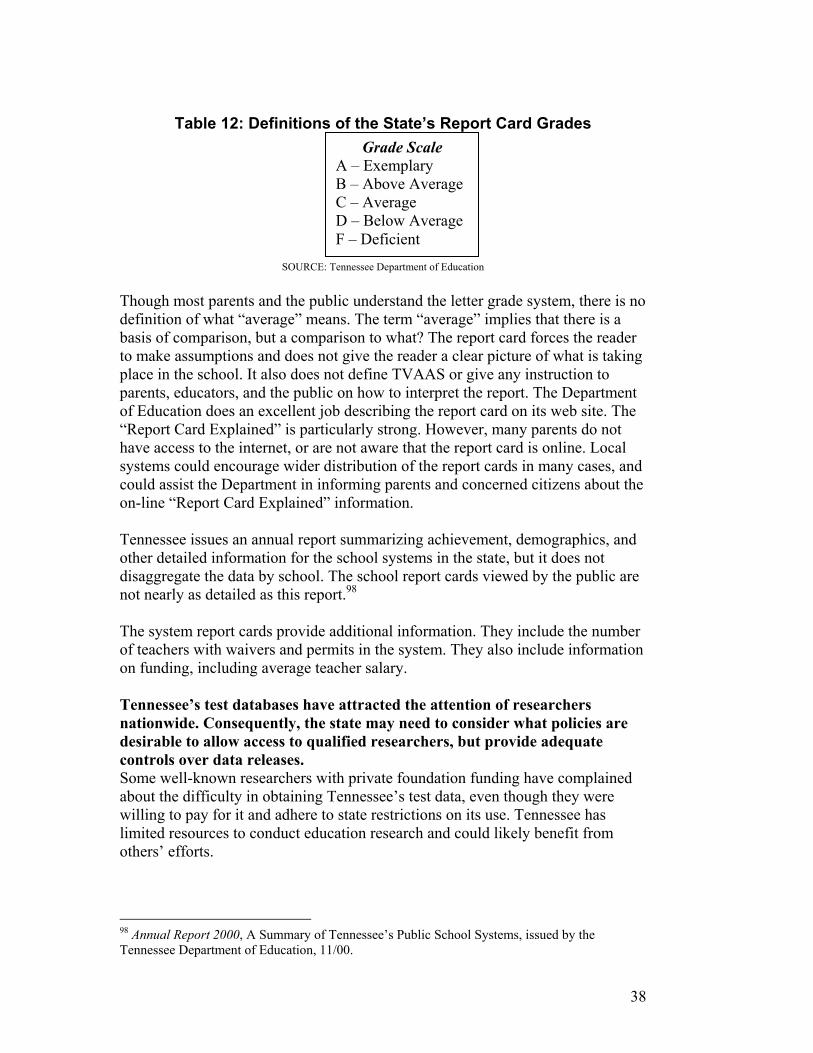
38
Table 12: Definitions of the State’s Report Card Grades
SOURCE: Tennessee Department of Education Though most parents and the public understand the letter grade system, there is no definition of what “average” means. The term “average” implies that there is a basis of comparison, but a comparison to what? The report card forces the reader to make assumptions and does not give the reader a clear picture of what is taking place in the school. It also does not define TVAAS or give any instruction to parents, educators, and the public on how to interpret the report. The Department of Education does an excellent job describing the report card on its web site. The “Report Card Explained” is particularly strong. However, many parents do not have access to the internet, or are not aware that the report card is online. Local systems could encourage wider distribution of the report cards in many cases, and could assist the Department in informing parents and concerned citizens about the on-line “Report Card Explained” information. Tennessee issues an annual report summarizing achievement, demographics, and other detailed information for the school systems in the state, but it does not disaggregate the data by school. The school report cards viewed by the public are not nearly as detailed as this report.98 The system report cards provide additional information. They include the number of teachers with waivers and permits in the system. They also include information on funding, including average teacher salary. Tennessee’s test databases have attracted the attention of researchers nationwide. Consequently, the state may need to consider what policies are desirable to allow access to qualified researchers, but provide adequate controls over data releases. Some well-known researchers with private foundation funding have complained about the difficulty in obtaining Tennessee’s test data, even though they were willing to pay for it and adhere to state restrictions on its use. Tennessee has limited resources to conduct education research and could likely benefit from others’ efforts.
98 Annual Report 2000, A Summary of Tennessee’s Public School Systems, issued by the Tennessee Department of Education, 11/00.
Grade Scale A – Exemplary B – Above Average C – Average D – Below Average F – Deficient

39
The state has never done an official request for proposals for TVAAS work - instead the Department entered into a sole-source contract with Sanders. Department officials argue that no other organizations or individuals could provide the same services. Currently, the Educational Value Added Assessment Services (Dr. Sanders’ company) receives $36,283 monthly in a four-year contract, totaling $1,741,600 or roughly $435,000 a year. It is unclear if others could offer similar services at a competitive rate. Tennessee has garnered much support for TVAAS in the national community, and has already invested millions to perpetuate the trend data analysis. However, improved language in the contract with the Educational Value Added Assessment Services could allow for greater understanding of the services provided, and a better justification for the state to enter into a sole-source contract. The language in the contract effective from January 1, 2000 to December 31, 2003 reads:
The books, records, and documents of the Contractor [Sanders], insofar as they relate to work performed or money received under this contract…shall be subject to audit at any reasonable time and upon reasonable notice by the State, the Comptroller of the Treasury, or their duly appointed representatives…the State shall have all ownership right, title, and interest, including ownership of copyright, in all work products created, designed, developed, derived, documented, installed, or delivered to the State under this Contract…The Contractor shall furnish such information and data upon request of the State, in accordance with the Contract and applicable State law.
The language above states that Tennessee, not Educational Value Added Assessment Services, owns the TVAAS data. Therefore, the state should make decisions on who has access to the information. Education researchers, such as Robert L. Linn from the University of Colorado, Boulder, and organizations such as the Carnegie Foundation have requested data directly from Sanders only to be turned down or stalled. Even officials within the state government have had trouble securing access to Sanders’ data. Many of these organizations could provide excellent reviews of the TVAAS system and assist the state – free of charge – in analyzing data. Though other organizations within state government have complained about access to the data, the Department of Education seems to have a very good working relationship with Sanders.99 The Department indicates it is working on a policy for receiving data from Sanders for use by other companies and organizations.100 The policy may include a review of the request by an advisory council, and will include final approval by the Commissioner of Education. Because of the looming national interest in Tennessee data, state officials need to
99 Interview with Ben Brown, Executive Director, Office of Assessment and Evaluation, Tennessee Department of Education, 5/24/01. 100 Ibid.

40
expedite a working policy on access to education data of all kinds – not just for TVAAS statistics – by researchers. Tennessee’s testing security system may need to be enhanced. Some system testing coordinators are concerned that teacher cheating may increase caused by the pressure placed on teachers by the increasingly high-stakes exams. The state may see a trend in this area, especially with the administration of the Gateway examinations in high school. The Department of Education makes clear that teachers can lose their licenses if test security is violated, but this action rarely has occurred. The Department has a general guideline for testing security, but it lacks detail and allows much of the testing security to fall on the systems. Each system is required to publish a detailed manual for test administration and file a security policy with the Department of Education. The Department, however, does not have a specific policy for dealing with security investigations. In his 1996 review of TVAAS, Thomas Fisher wrote: “It is not clear how violations will be investigated. This is no small problem, because trained investigators may be needed to conduct investigations into security breaches. The assessment staff can hardly be expected to perform these duties.”101 With the increased emphasis on high-stakes testing, a detailed policy for investigating security breaches may need to be developed.
District officials expressed frustration with test processing after the testing center moved from Knoxville to Nashville in 1998. However, the second year following the move saw drastic improvements and a decrease in spending on test processing and storage. When then-Commissioner of Education Jane Walters decided to move the test processing center from Knoxville to Nashville in 1999, many educators and employees were surprised by the decision and unclear about the motive. Walters explained that the state moved the testing center to save money, particularly in storage costs.102 When the testing center was at the University of Tennessee Knoxville, roughly 43,000 square feet of warehouse space was used to store old materials and documents. The move allowed the state to eliminate unnecessary materials and avoid wasting money on extra storage space.103 The move caused many problems in the first year. Test scores were late returning to schools (though this was also caused by an error by CTB/McGraw-Hill). In addition, some testing coordinators do not feel that the testing center staff is as helpful as they were in Knoxville. Some coordinators said that Nashville staff have not handled their requests efficiently. In contrast, system testing coordinators
101 R. Darrell Bock, Richard Wolfe, and Thomas H. Fisher, A Review and Analysis of the Tennessee Value-Added Assessment System, contracted by the Office of Education Accountability, Office of the Comptroller, State of Tennessee, March 1996. 102 Phone interview with Jane Walters, Executive Director, Partners in Public Education, 10/25/01. 103 Interview with Karen Jenkins, Director, Testing Services, Office of Assessment and Evaluation, Tennessee Department of Education, 6/5/01.

41
had the ability to call the warehouse in Knoxville directly, and a timely response was returned, according to several coordinators. The Department of Education enacted a listserv for all system testing coordinators to better disseminate information about the testing program in the state. Several systems said that the listserv has been helpful. However, it is clear that communication could still be improved between the Department of Education and the systems. One system testing coordinator said that it is difficult to get quick responses from the Department in part because the warehouse where the tests are sorted and prepared is in a separate location from the Department’s testing office. Other system officials said that though staff at the Department were friendly and knowledgeable, it sometimes took awhile to receive answers back on urgent issues relating to testing. In comparison to the first year after the move of the testing center to Nashville, however, testing coordinators said they have noticed improvements in communication and in the way the Department has handled testing in general. The Department has explained that the first year after the move, the test processing procedure did not run smoothly for a variety of reasons. Staff added, however, that the Department learned from the first year and that the procedures improved drastically in the 2000-2001 school year. For example, most districts received their test scores from the Department before the end of the school year.104 Testing coordinators have said that they have noticed improvements in the 2001-2002 school year. The test processing procedure in Nashville also seems to be more efficient. Karen Jenkins, Director of Testing at the Department of Education, explained that in the first year after the move, the Department “limped” along trying to get the testing materials scanned and processed.105 Right after the move, the structure of the testing center was divided into two areas, causing additional confusion. The scanning and editing responsibilities were under the Technology Division while the programming and managing duties were under the Accountability and Assessment Division. In December 2000, the offices were restructured and the Division of Assessment and Evaluation was created. Several Department staff noted that the move has allowed the Department to better understand how testing fits into the bigger picture of education reform. Staff has said that the various divisions at the Department are better connected with testing now, and the whole Department is more knowledgeable and stronger because of the move.106 104 Interviews with Ben Brown, Executive Director, Office of Assessment and Evaluation, Tennessee Department of Education, 5/24/01, Karen Jenkins, Director, Testing Services, Office of Assessment and Evaluation, Tennessee Department of Education, 6/5/01, and Gerry Hausman, Student Data Director, Williamson County Schools, 5/14/02. 105 Interview with Karen Jenkins, Director, Testing Services, Office of Assessment and Evaluation, Tennessee Department of Education, 6/5/01. 106 Ibid.

42
RECOMMENDATIONS Legislative Recommendations The General Assembly may wish to consider additional funding initiatives for assisting students at risk of failing the Gateway graduation exams. Because it is likely that many students will not pass the Gateway exams in the first few years, the state should provide low-performing students with opportunities to improve. The Education Reform Act of 2001 and pending legislation in the 2002 session include initiatives to target students at risk of failing the exams. However, these programs cannot be accomplished without funding. The General Assembly may wish to consider abolishing the requirement that all students take an exit exam to assess college and workplace readiness. With the introduction of the high-stakes Gateway exit exams this year, the state may no longer need to require that students take another exit exam, especially since the ACT/SAT/Work Keys exit exam mandate does not require a passing score. In addition, if this mandate were made permissive, it is likely that the state would save money. Administrative Recommendations The State Board of Education may wish to consider whether the Gateway should be the primary instrument used to grant or withhold a high school diploma. An alternate evaluation method or appeals process may be desirable for some students who otherwise meet graduation requirements. Some states, including Wisconsin, require local boards to look at several indicators – one of which is the graduation test – when determining graduation requirements.107 The decision to grant or withhold the diploma does not necessarily depend on the score on the graduation exam. In Alaska, local school boards may grant waivers from the high school graduation test to students. The waivers are granted on a per-student basis, based on other indicators of achievement determined by the State Board of Education.108 Other states with high-stakes graduation tests also have considered granting waivers. Several states have moved toward more than one diploma, which could be an option for Tennessee as well. Virginia, for example, offers honors, regular, and special education diplomas. Tennessee previously administered an honors diploma prior to the dual path system that established separate curriculums for college-bound and vocational students.
107 Fact Sheet on High School Graduation, Department of Public Instruction, State of Wisconsin, 9/01, www.dpi.state.wi.us/dpi/oea/pdf/hsgtfact.pdf (accessed 10/26/01). 108 Department of Education & Early Development, 2001 Changes to High School Graduation Qualifying Exam Law, www.eed.state.ak.us/tls/assessment/sb133talkingpoints.doc (accessed 10/26/01).
43
The Department of Education needs to provide more ongoing professional development to schools and systems on interpreting test score data and using it to improve student learning. An elaborate testing program is ineffective unless systems and schools use the test scores to improve teaching and learning. Without the resources to understand the test scores, and without suggestions for changing curriculum and lessons, teachers are left confused about the massive amount of data from test scores they receive. High quality, ongoing professional development should incorporate: 1) changes to the school improvement plans; 2) suggestions for parents; 3) what the test scores indicate that the school needs to focus on; and 4) organization changes based on areas of weakness. The Department of Education should strengthen and enhance its professional development to schools and systems in this area. Ideally, professional development on interpreting test score data would be offered at the school level. The Department of Education should continue to evaluate the format of the school report cards in an effort to improve communication with parents and the public at large. Though the current school report cards improve upon the previous versions, the Department should continue to look at the possibility of including additional information in a more concise way. In particular, definitions of tests and TVAAS, a clear description of what the grades mean, and teacher qualifications information at the school level should all be included. The Department may wish to incorporate sections of its “Report Card Explained” section on the Department’s web site into the hard copies of the report cards to further explain terms. The Department may also want to consider including a “helpful hints” section, similar to the Ohio report cards. (See Appendix E for a copy of the Ohio report card.) The Department of Education should develop a policy regarding the use of TVAAS and other education data for research purposes. Because of the national interest in Tennessee testing data, the Department needs to develop a clear policy that indicates who has access to education data of all kinds, including TVAAS records. Though the working relationship between William Sanders and the Department is good, the Department has a responsibility to ensure that other government entities and other organizations wishing to gain access to TVAAS data can do so without undue problems. This is important in terms of continual evaluation of the TVAAS system and in terms of sharing best practices with other states. The Department of Education needs to review its policies for test security and disseminate clear information to the systems on security procedures. Because teacher fraud cases may increase based on the greater emphasis on testing and accountability, it is important that all teachers are given adequate information on test security procedures, as well as the appropriate test preparation

44
exercises. In addition, the Department should consider developing a more specific and detailed policy for investigating security breaches.

45
Appendix A Response from the Department of Education

46
Appendix B Glossary of Terms Accountability In general, accountability refers to a system of checks and balances to guarantee appropriate outcomes. Various types of accountability may include fiscal, legal, program, and process issues. In education, the term refers to holding three groups accountable for their actions: 1) school accountability; 2) teacher accountability; and 3) student accountability. School accountability refers to a state making the school responsible for student performance. If adequate student performance does not occur, actions by the state in a school accountability system may include ranking the schools, assigning the schools to a low-performing list, or removing administrative staff. Teacher accountability refers to the act by the state, system, or school of making teachers responsible for student performance. If adequate student performance is not achieved, a teacher may be subject to probation or removal. Finally, student accountability refers to an act by a state, system, or school of making the student responsible for his/her achievement. Without adequate student performance, actions in a student accountability program may include grade retention or withholding a high school diploma. Any or all of these components could make up a state’s accountability program. Achievement gap The variation in test scores tied to racial or ethnic differences. The Educational Testing Service explains: “Data over a period of 30 years from the National Assessment of Educational Progress (NAEP) show that achievement among students overall has gradually increased in math and remained about the same in reading and science. But the gap between White and Black students has been widening over the past 10-15 years in mathematics and reading in middle and high school. The gap between Hispanic and non-Hispanic students also persists.”109 Achievement Test In Tennessee, this term refers to the annual assessment given to students in grades 3-8 in the four core subjects: English/language arts, mathematics, science, and social studies. The Achievement Test is part of the Tennessee Comprehensive Assessment Program, and is developed by the testing company CTB/McGraw-Hill. The Tennessee Achievement Test is a norm-referenced off-the-shelf test called TerraNova. The TerraNova Achievement Test includes some questions that are specific to Tennessee and aligned with Tennessee’s standards, according to the testing company.
109 Educational Testing Service, “Using Assessments and Accountability to Raise Student Achievement,” based on the testimony of Kurt M. Landgraff, President and CEO of ETS, to the Education Reform Subcommittee of the House Committee on Education and the Workforce, March 8, 2001.

47
Alignment Alignment between a state’s standards and assessments means that the assessments measure what is contained in the standards. For example, if the math standard is “measurement” and the assessment item shows a ruler and asks the student to indicate where 3.5 inches is, then the two are aligned. Alignment goes beyond just a few items on a test, however. A well-aligned test would include the majority of standards, and would have an equal distribution of standards throughout the test (no single standard is over- or under-represented on the test). Also, it is important to note that well-aligned tests and standards do not mean much unless the standards are high-quality. Basic Education Program (BEP) Tennessee’s formula for funding elementary and secondary education contained in the Education Improvement Act, passed by the General Assembly and signed by Governor McWherter in 1992; consists of several components grouped into two categories – classroom and non-classroom. The state pays 75 percent of the classroom components and 50 percent of the non-classroom components across the state. The local share of the cost of education varies from district to district based on the local fiscal capacity (ability to pay) in each district. Some examples of classroom components include teachers, principals, social workers, nurses, duty-free lunch, textbooks, teacher benefits, and instructional equipment. Examples of non-classroom components include superintendent, school secretaries, pupil transportation, and building costs.110 Criterion-referenced test A criterion-referenced test uses questions that measure a specific standard or criteria. They are based on a set of standards, often a state’s official standards in various subjects. CTB/McGraw-Hill A national company that produces a variety of tests, including Tennessee’s TerraNova Achievement Test. Tennessee contracts with CTB/McGraw-Hill to produce new, non-redundant items for the test each year. CTB/McGraw-Hill also sends the final score reports on the TCAP Achievement Test to the Tennessee Department of Education. Education Improvement Act of 1992 The Education Improvement Act, contained in Public Chapter 535, was passed by the Tennessee General Assembly and signed by Governor Ned McWherter in 1992. The act incorporated many education reforms, the more important of which include the class size requirements, the Basic Education Program funding initiative for public schools, and the exit exams for graduation from high school.
110 Information provided by Tennessee Basic Education Program BEP 1999-2000, State Board of Education; and “Everything You Always Wanted to Know about BEP but Were Afraid to Ask,” Tennessee Department of Education, Division of Finance, Accountability and Technology, and Local Finance.

48
Education Reform Act of 2001 The Education Reform Act was passed by the Tennessee General Assembly and signed by Governor Don Sundquist in 2001. The act, however, was not funded by the General Assembly. The main tenets of the act included a reading initiative, a pre-kindergarten initiative, and a “Catching Up” program aimed at 7th and 8th graders who are likely to fail the Gateway exams. End-of-Course exams An assessment given to students upon completion of a particular subject whose purpose is to measure material taught in a course. In Tennessee, the Gateways are end-of-course exams. English Language Learners (ELL) Students whose first language is not English. English as a Second Language (ESL) The current appropriate term for programs assisting students whose first language is not English. A student would not be ESL, but an ESL program assists ELL students. Exit exam An exam that students are required to take to receive a high school diploma. The exam may have a passing score requirement, as the Gateway exams do in Tennessee, or a state may simply require students to take a test with no passing score requirement, like the ACT/SAT or Work Keys in Tennessee. Also called graduation exams. Four core subjects The four main subjects that all students are expected to learn: English/language arts (including writing), mathematics, science, and history/social studies. Gateway Exams A type of exit exam implemented in Tennessee in fall 2001 in English II, Algebra I, and Biology. Students must pass the Gateways to receive a high school diploma. Students take the exams for the first time upon completion of the corresponding course. Students who fail one or more of the exams will have several more opportunities to retake and pass the exams before graduation. National Assessment of Educational Progress (NAEP) Called “the Nation’s Report Card,” NAEP is a longitudinal assessment program that is made up of two types of assessments – the national NAEP and the state NAEP. The national NAEP is given in various subjects to a representative sample of students across the United States. State NAEP is given to representative students across a given state, and allows individual states to measure progress. NAEP has been testing U.S. students since 1969. See www.nces.ed.gov/nationsreportcard/sitemap.asp.

49
Norming The process in which a sample of representative students in a group (often the nation) take an assessment to determine the average, or norm, score that can then be used to measure other students’ scores in relation to the average or typical score. Norm-referenced test A standardized test in which a group of students is compared to a representative sample of similar students (those with similar ages and characteristics). Tennessee’s TerraNova assessment is a norm-referenced test. Promotion The act of advancing a student to the next grade. Social promotion is the act of advancing a student to the next grade regardless of student achievement to keep the student with similarly-aged peers. States’ student accountability programs often are tied to student promotion, meaning a student will not be able to advance to the next grade unless he/she exhibits specific achievement gains. Retention The act of holding a student back based on achievement or other indicators, such as disposition and maturity level. Retention can be the product of a student accountability system in which the student is held back a grade if he/she does not exhibit specific achievement gains. Standards-based reform An education reform movement based on the creation of high standards for all students. Standards-based reform includes three key components – high standards, assessments that measure those standards, and accountability for students, schools, districts and even in some cases teachers based in part on student performance on those assessments. Tennessee Comprehensive Assessment System (TCAP) Tennessee’s assessment program that includes 1) the Achievement Test given to students in grades 3-8 in English/language arts, mathematics, science, and social studies; 2) the writing test given to students in grades 4, 7, and 11; 3) the Gateway assessments in Algebra I, English II, and Biology; and 4) other end-of-course assessments in high school that are in the piloting stage as of 2001. Tennessee Value-Added Assessment System (TVAAS) A complex statistical analysis of student achievement that uses the TCAP Achievement Test to measure gains in student achievement from year to year. TerraNova A standardized, norm-referenced test distributed by CTB/McGraw-Hill that is used in several states, including Tennessee.

50
Third International Mathematics and Science Study-Repeat (TIMSS-R) An international assessment and survey distributed to students in 38 countries in 1999 that measured student achievement in mathematics and science. Title I A reference to Title I of the Elementary and Secondary Education Act of 1965, which is reauthorized by Congress every five years. Title I, part of Lyndon Johnson’s War on Poverty, targets at-risk students based on free and reduced price lunch to decrease an achievement gap between these students and students who are not deemed to be at risk. States receive Title I funds based on percentages of low-income students and are to use these funds to decrease the achievement gap between students. TRICOR TRICOR stands for the Tennessee Rehabilitative Initiative in Correction. Based on the TRICOR web site, TRICOR monitors work rehabilitation programs in Tennessee that train inmates in a variety of skills. TRICOR’s purpose is to assist inmates to become productive members of society while saving taxpayer money and filling job vacancies. TRICOR runs the part of the assessment system in Tennessee that uses female inmates to sort and prepare assessments. Work Keys An assessment produced by ACT in conjunction with business leaders that measures a student’s ability to be productive in the workforce. Students in Tennessee are required to take either the SAT or ACT if they are planning on attending college or the Work Keys if they are planning on entering the workforce upon graduation from high school. Writing assessment The assessment that measures writing given to Tennessee fourth, seventh, and eleventh graders each year. The writing assessment is part of the Tennessee Comprehensive Assessment Program.

51
Appendix C Persons Interviewed Ben Brown Executive Director Office of Assessment and Evaluation Tennessee Department of Education Fretta Bunch Director, Non-public and Home Schools Tennessee Department of Education Paul Changas Coordinator of Student Assessment Metropolitan Nashville Public Schools Kay Clark Assistant Vice Chancellor for Academic Affairs Tennessee Board of Regents Nancy Duggin Manager Office of Instructional and Professional Development Tennessee Education Association Joseph Fisher Assistant Commissioner of Special Education Division of Special Education Tennessee Department of Education Lu Fogerty Research Assistant Memphis City Schools Terrance Gibson Coordinator Office of Instructional and Professional Development Tennessee Education Association Dave Goetz President Tennessee Association of Business
Christy Gunn State TCAP-ALT Coordinator Division of Special Education Tennessee Department of Education Opal Harris Research Assistant Memphis City Schools Gerry Hausman Student Data Director Williamson County Schools Katie High Vice Chancellor for Student Affairs University of Tennessee at Martin Sherian Huddleston Interim Assistant Vice President for Enrollment Management Middle Tennessee State University Carol Irwin ESL Consultant Tennessee Department of Education Karen Jenkins Director, Testing Services Office of Assessment and Evaluation Tennessee Department of Education Peggy Killough Retired, Former Manager Office of Instructional and Professional Development Tennessee Education Association Vivian Lomax-Garrette Retired, Testing Supervisor Memphis City Schools Larry Martin Testing Coordinator Maryville City Schools

52
Connie Mayo Elementary Testing Coordinator Cheatham County Schools Julie McCargar Director, Federal Programs Office of Accountability and School Improvement Tennessee Department of Education Lee McGarity Testing Coordinator Memphis City Schools Lynn Palmer Director of Admissions Middle Tennessee State University James Pellegrino Frank W. Mayborn Professor of Cognitive Studies Vanderbilt University Margaret Renkl Contributing Editor PARENTING Magazine Lynnisse Roehrich-Patrick Director of Special Projects Tennessee Advisory Commission on Intergovernmental Relations Alvin Rose Secondary Testing Coordinator Cheatham County Schools Robert Sanchez Program Director CTB/McGraw-Hill William Sanders Research Fellow, University of North Carolina and Manager, Value-Added Research and Assessment, SAS inSchool Ann Sanders Assessment Coordinator Division of Special Education Tennessee Department of Education
John Sharp Fiscal Director Office of Budget and Planning Tennessee Department of Education Connie Smith Executive Director Office of Accountability and School Improvement Tennessee Department of Education Jane Walters (Former Commissioner of Education in Tennessee) Executive Director Partners in Public Education Karen Weeks Research Associate Tennessee State Board of Education Claudette Williams Executive Director Office of Curriculum and Instruction Tennessee Department of Education Susan Young Coordinator Office of Instructional and Professional Development Tennessee Education Association George Yowell President Tennessee Tomorrow, Inc.


Dear Parents and Community Members:
Community schools are an exciting new kind of state-funded public school. They are designed tooffer parents new options for meeting the educational needs of their children.
Every community school agrees, through a contract, to be held strictly accountable for the academicperformance of its students. You are probably familiar with the report cards that your childregularly receives from his or her school. This Community School Report Card is a similaraccountability tool that provides information about the school as a whole.
While it cannot tell you everything about your school and its performance, this report card is a goodstarting point for the kind of community discussions that can be so helpful in efforts to improve ourschools. In addition to the results provided in this document, many community schools have specificimprovement goals they are required to achieve. We encourage you to talk with your teachers,school officials, and your school’s local governing authority about the many different ways theymeasure student and school success.
Superintendent of Public Instruction
S t a t e o f O h i o
2001 Communit y School Repor t Card
134221
Hope Academy Brown St. Campus (Grades K-8)Summit CountySponsored by Ohio State Board of Education
Inside you will find
information about how
well your school is doing –
where it is succeeding and
where there may be room
for improvement.
How to use the information in this report card:✔ Visit your school to see how teaching and learning
are taking place.
✔ Ask teachers and school officials how theymeasure success for the school and its students.Use the questions in this report card as a guide for those conversations.
✔ Ask how you can become involved in your school’songoing efforts to improve.
✔ Support your children and encourage them tosucceed.
For more information about Ohio’s Local Report Cards, visit theOhio Department of Education’s web site (www.ode.state.oh.us), orcall toll-free (877) 772-7771 .55
Appendix EExample of an Ohio School Report Card

4th Grade Proficiency Tests
YOUR SCHOOL’S PROGRESS
PERCENTAGE OF STUDENTS WHO PASSED THE TESTS
100%
75%
50%
25%
0%
Reading WritingCitizenship Mathematics Science
Minimum State Standard
QUESTIONS TO DISCUSSWITH YOUR SCHOOL
✔ Does your school have specificimprovement goals it isrequired to meet? Is yourschool achieving those goals?
✔ What efforts are under way toimprove areas where resultsare not satisfactory or wherethe school is not improving?
✔ What do the suspension trendstell you about the learningenvironment at your school?
NR = Not reported by the school. NC = Not calculated for fewer than 10 students.
More Trends
Hope Academy Brown St. Campus (Summit County)
Other Performance Data
YOUR SCHOOL’S RESULTS
6th Grade Proficiency Tests100%
75%
50%
25%
0%
Reading WritingCitizenship Mathematics Science
Minimum State Standard
1997-98 1998-99 1999-00
Student Attendance Rate (%) — 94.1 99.4
Students Suspended (%) — 16.0 27.2
Average Length Suspensions (Days) — 2.1 3.1
4th Graders Promoted to 5th Grade (%) — 100.0 100.0
6th Graders Promoted to 7th Grade (%) — 100.0 100.0
12.0%20.8%
8.0%4.2%
8.0%16.7%
8.0%
33.3%
8.0%4.2%
97-98 98-99 99-00 97-98 98-99 99-00 97-98 98-99 99-00 97-98 98-99 99-00 97-98 98-99 99-00
97-98 98-99 99-00 97-98 98-99 99-00 97-98 97-98 98-99 997-98
28.6%
18.8%
NR 0.0%
10.3%
0.0%
25.0% 25.0%
3.6% 6.3%
98-99 99-00 98-99 99-00 9-00
56

RESULTS FOR STUDENTS WITH DISABILIT IES
Q U E S T I O N S T O D I S C U S S W I T H Y O U R S C H O O L
✔ In some cases an individual student with a disabilitymay be exempted from taking one or more of the OhioProficiency Tests. These exemptions are made by a jointdecision of the student’s parents, teachers and schooladministrators. Are most students in your schoolrequired to take the tests? Are most students actuallytaking the tests? Why or why not?
✔ How does the performance of your school’s studentswith disabilities compare to the local district’s results?
✔ What other tools does your school use to measure theachievement of students with disabilities?
✔ What is your school doing to meet the individual needs of students with disabilities?
Hope Academy Brown St. Campus (Summit County)
To obtain your own child’s individual
performance results, contact your
community school office at (330) 785-0180.
School officials also will be able to provide
you with information about other ways
academic achievement or progress is
measured, as well as information
about the school’s strategies
for improving results.
W A N T M O R E I N F O R M A T I O N ?
For information about the Ohio Proficiency Tests, or to obtain performance results for any other public school or school district in Ohio, or fora specific gender or ethnic group, visit the Ohio Department of Education’s web site (www.ode.state.oh.us), or call toll-free (877) 772-7771.
NR = Not reported by the school. NC = Not calculated for fewer than 10 students.
Students Taking The Tests
1 Includes only students with disabilities required to take and pass the tests.2 “Local District” is the school district from which most of your school’s students are drawn. Your local district is Akron City School District.
All Students Students With Disabilities
% of Students % of Students % of Students % of Students % of Students % of StudentsRequired to Who Actually Required to Take Who Actually Who Passed Who PassedTake Tests Took Tests & Pass Tests Took Tests the Tests1 the Tests2
Citizenship 100.0 100.0 0.0 0.0 0.0 35.3Mathematics 100.0 100.0 0.0 0.0 0.0 17.1Reading 100.0 100.0 0.0 0.0 0.0 27.7Writing 100.0 100.0 0.0 0.0 0.0 48.0Science 100.0 100.0 0.0 0.0 0.0 26.6
Citizenship 100.0 100.0 NC NC NC 22.2Mathematics 100.0 100.0 NC NC NC 9.0Reading 100.0 100.0 NC NC NC 14.9Writing 100.0 100.0 NC NC NC 31.3Science 100.0 100.0 NC NC NC 12.3
4thGrade Tests
6thGrade Tests
YOUR SCHOOL YOUR SCHOOL LOCAL DISTRICT________________________ _________________________________ _______________
57

TEACHERS
ANNUAL SPENDING PER PUPIL3
REVENUE SOURCES PER PUPIL
GENERAL
YOUR SCHOOL’S REVENUE SOURCES YOUR SCHOOL’S SPENDING PER PUPIL
Instruction (34.3%)
Building Oper. (31.3%)
Administration (24.0%)
Pupil Support (8.6%)
Staff Support (1.8%)
Private (0.0%)
State (90.4%)
Federal (9.6%)
Q U E S T I O N S T O D I S C U S S W I T H Y O U R S C H O O L✔ Under state law, community school teachers are required
to be certified, but not necessarily in the subjects theyteach. What qualifications do the teachers in your schoolhave? What impact do teacher qualifications have on stu-dent learning?
✔ Has your school proven to be an effective educationaloption for you and your children?
✔ Are your school’s spending priorities consistent with theschool’s educational goals?
Hope Academy Brown St. Campus (Summit County)
YOUR SCHOOL’S PROFILE (1999-2000 DATA)
* “Local district” is the school district from which most of your students are drawn. Your local district is Akron City School District.
State Your Average For
School Local District* Districts
Average Enrollment1 258 31,259 2,835
Students with Disabilities (%) 4.3 14.6 12.2
Students in the School Less Than Half the Year (%) 9.5 12.0 7.8
Students from Families Receiving Ohio Works First Cash Assistance (%) NA 33.9 13.61Average number of students enrolled during the school year; used to calculate spending per pupil.
Average Number of Students Per Teacher 21.2 16.6 18.1
K-8 Teachers Certified in Their Teaching Area (%) 88.9 99.5 98.1
Teacher Attendance Rate (%) 97.2 96.0 95.5
Private Funds (such as foundation grants or corporate donations) $0 ———— ————
Local Funds 2 ———— $2,740 $3,538
State Funds $5,223 $4,194 $3,069
Federal Funds $559 $727 $406
Total Revenue Sources Per Pupil $5,782 $7,661 $7,0132Community schools cannot raise local revenue through taxes.
Instruction (such as teacher salaries and classroom materials) $2,004 $4,338 $3,942
Building Operations (such as utilities, maintenance, and repairs) $1,833 $1,321 $1,354
Administration (such as administrator and office staff salaries and office supplies) $1,405 $801 $838
Pupil Support (such as librarians, counselors and nurses) $502 $735 $775
Staff Support (such as teacher training and college courses) $103 $347 $148
Total Annual Spending Per Pupil $5,847 $7,542 $7,0573 May include money from start-up grants for community schools.
NR = Not reported by the district. NC = Not calculated for fewer than 10 students. NA = Not available. 58

YO U R S C H O O L’ S 1 9 9 9 - 2 0 0 0 R E S U LT S AT A G L A N C E
Q U E S T I O N S T O D I S C U S S W I T H Y O U R S C H O O L✔ Depending on its contract, your community school may
or may not be required to meet the state’s minimumperformance standards established by the Ohio GeneralAssembly. What performance standards is your schoolrequired to meet? How do they compare to the state’sminimum performance standards? Is your schoolachieving – or close to achieving – its requirements?
✔ How is your school doing compared to your local schooldistrict and to the state as a whole? What reasons mightthere be for any differences that may exist?
✔ How is attendance likely to affect learning and testscores? What is being done to keep students in school?
✔ What impact do suspensions have on your school’slearning environment? How does your school ensure asafe, drug-free environment where students can succeed?
✔ How do promotion rates at grades 4 and 6 compare topassing rates for the 4th and 6th grade proficiency tests?
NS = No standard. NR = Not reported by the school. NC = Not calculated for fewer than 10 students.
Hope Academy Brown St. Campus (Summit County)
Percentage of Students Who Passed the TestsState State Your Local OverallProficiency Performance School’s District StateTests Standard Results Average* Average___________________________________________________________________________________________________
Grade 4 TestsCitizenship 75% 20.8 45.4 61.3Mathematics 75% 4.2 31.5 48.9Reading 75% 16.7 40.7 58.2Writing 75% 33.3 67.5 77.9Science 75% 4.2 29.8 47.7All Tests NS 0.0 16.6 30.8
Grade 6 TestsCitizenship 75% 18.8 45.9 70.1Mathematics 75% 0.0 24.0 54.4Reading 75% 0.0 30.9 53.2Writing 75% 25.0 61.5 79.1Science 75% 6.3 28.2 54.6All Tests NS 0.0 14.1 35.2
Other State Your Local OverallKey Performance School’s District StateResults Standard Results Average Average________________________________________________________________________________________________________
Student 93% 99.4 91.6 93.6Attendance (%)________________________________________________________________________________________________________Students NS 27.2 27.0 9.1Suspended (%)________________________________________________________________________________________________________ Average Length NS 3.1 2.2 2.8Suspensions (Days)________________________________________________________________________________________________________ 4th Graders Promoted NS 100.0 98.8 94.8to 5th Grade (%)
________________________________________________________________________________________________________ 6th Graders Promoted NS 100.0 92.4 94.3 to 7th Grade (%)
* Your Local District is the school district from which most of your school’s students are drawn. Your local district is: Akron City School District.
59
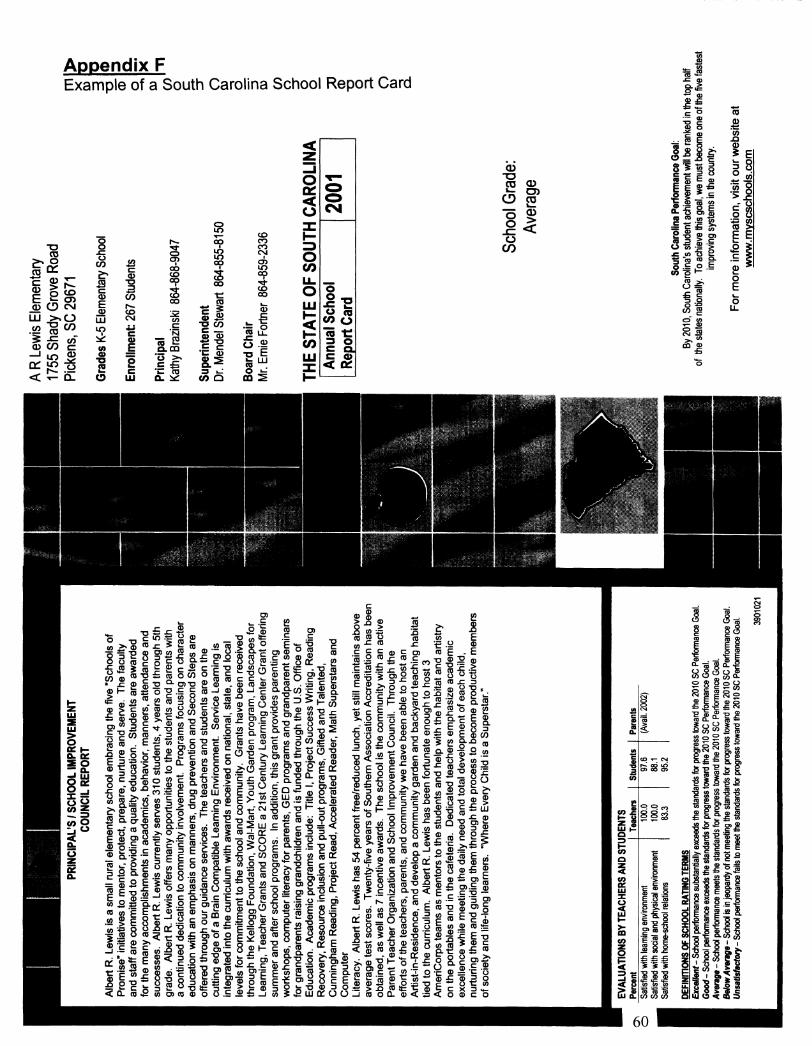


Offices of Research and Education Accountability Staff
Director
◆ Ethel Detch
Assistant Director (Research)
Douglas Wright
Assistant Director (Education Accountability)
◆ Katie Cour
Principal Legislative Research Analyst Dan Cohen-Vogel
◆ Kim Potts
Senior Legislative Research Analysts Denise Denton
Phil Doss Margaret Rose Greg Spradley
Associate Legislative Research Analysts ◆ Bonnie Adamson
Brian Doss ◆ Richard Gurley
Emily Ogden Melissa Jo Smith
Karen Tolbert Emily Wilson
Executive Secretary ◆ Sherrill Murrell
◆ indicates staff who assisted with this project