Embed Size (px)
Citation preview

This article was downloaded by: [University of Groningen]On: 19 December 2011, At: 02:37Publisher: Psychology PressInforma Ltd Registered in England and Wales Registered Number: 1072954Registered office: Mortimer House, 37-41 Mortimer Street, London W1T 3JH,UK
Structural Equation Modeling: AMultidisciplinary JournalPublication details, including instructions forauthors and subscription information:http://www.tandfonline.com/loi/hsem20
Testing for MultigroupInvariance Using AMOSGraphics: A Road Less TraveledBarbara M. Byrne
Available online: 19 Nov 2009
To cite this article: Barbara M. Byrne (2004): Testing for Multigroup InvarianceUsing AMOS Graphics: A Road Less Traveled, Structural Equation Modeling: AMultidisciplinary Journal, 11:2, 272-300
To link to this article: http://dx.doi.org/10.1207/s15328007sem1102_8
PLEASE SCROLL DOWN FOR ARTICLE
Full terms and conditions of use: http://www.tandfonline.com/page/terms-and-conditions
This article may be used for research, teaching, and private study purposes.Any substantial or systematic reproduction, redistribution, reselling, loan,sub-licensing, systematic supply, or distribution in any form to anyone isexpressly forbidden.
The publisher does not give any warranty express or implied or make anyrepresentation that the contents will be complete or accurate or up todate. The accuracy of any instructions, formulae, and drug doses should beindependently verified with primary sources. The publisher shall not be liablefor any loss, actions, claims, proceedings, demand, or costs or damages

whatsoever or howsoever caused arising directly or indirectly in connectionwith or arising out of the use of this material.
Dow
nloa
ded
by [
Uni
vers
ity o
f G
roni
ngen
] at
02:
37 1
9 D
ecem
ber
2011
TEACHER’S CORNER
Testing for Multigroup Invariance UsingAMOS Graphics: A Road Less Traveled
Barbara M. ByrneUniversity of Ottawa
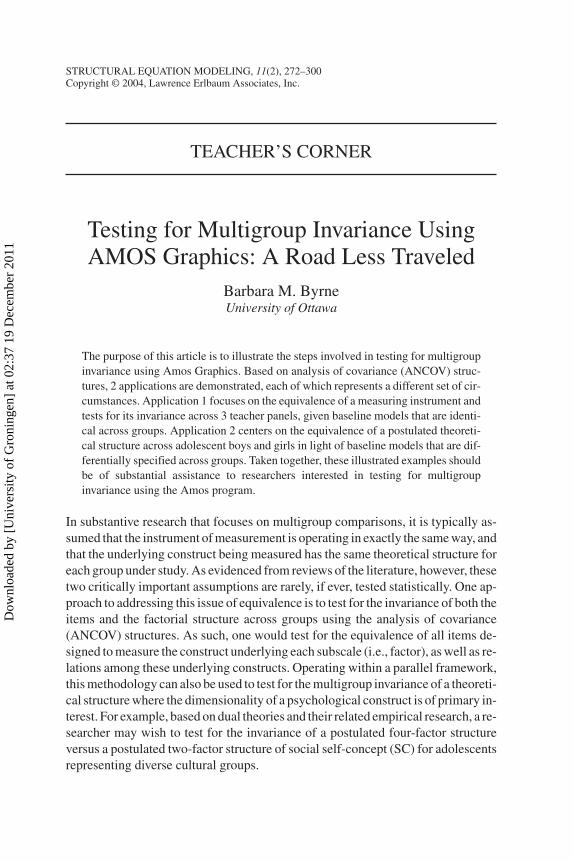
The purpose of this article is to illustrate the steps involved in testing for multigroupinvariance using Amos Graphics. Based on analysis of covariance (ANCOV) struc-tures, 2 applications are demonstrated, each of which represents a different set of cir-cumstances. Application 1 focuses on the equivalence of a measuring instrument andtests for its invariance across 3 teacher panels, given baseline models that are identi-cal across groups. Application 2 centers on the equivalence of a postulated theoreti-cal structure across adolescent boys and girls in light of baseline models that are dif-ferentially specified across groups. Taken together, these illustrated examples shouldbe of substantial assistance to researchers interested in testing for multigroupinvariance using the Amos program.
In substantive research that focuses on multigroup comparisons, it is typically as-sumed that the instrument of measurement is operating in exactly the same way, andthat the underlying construct being measured has the same theoretical structure foreach group under study. As evidenced from reviews of the literature, however, thesetwo critically important assumptions are rarely, if ever, tested statistically. One ap-proach to addressing this issue of equivalence is to test for the invariance of both theitems and the factorial structure across groups using the analysis of covariance(ANCOV) structures. As such, one would test for the equivalence of all items de-signed to measure the construct underlying each subscale (i.e., factor), as well as re-lations among these underlying constructs. Operating within a parallel framework,this methodology can also be used to test for the multigroup invariance of a theoreti-cal structure where the dimensionality of a psychological construct is of primary in-terest. For example, based on dual theories and their related empirical research, a re-searcher may wish to test for the invariance of a postulated four-factor structureversus a postulated two-factor structure of social self-concept (SC) for adolescentsrepresenting diverse cultural groups.
STRUCTURAL EQUATION MODELING, 11(2), 272–300Copyright © 2004, Lawrence Erlbaum Associates, Inc.
Dow
nloa
ded
by [
Uni
vers
ity o
f G
roni
ngen
] at
02:
37 1
9 D
ecem
ber
2011

To date, almost all studies reported in the literature that address multigroupinvariance based on the ANCOV structures have used either the LISREL (Jöreskog& Sörbom, 1996) or EQS (Bentler & Wu, 2002) programs. As a consequence, ithas been customary to use the input file-based strategy associated with these pro-grams. (For a detailed review and illustrated applications of this process for bothLISREL and EQS, readers are referred to Byrne, 1998, 1994, respectively.) Morerecently, however, the less conventional graphical approach to ANCOV structuresused by the Amos program (Arbuckle, 1999) has gained much popularity with re-searchers new to the application of this methodology. Although Amos incorpo-rates a standard text-based interface (termed Amos Basic), its graphical interface(termed Amos Graphics) is the one more commonly used.
Despite this increased use of Amos, however, a review of the literature suggestsits negligible use in testing for multigroup invariance. For example, a search ofthree journals in which multiple group comparisons are often presented yielded noevidence of tests for invariance using Amos; these were as follows: StructuralEquation Modeling (Vol. 1, 1994–Vol. 10, 2003), Journal of Cross-Cultural Psy-chology (Vol. 27, 1996–Vol. 34, 2003), Psychological Methods (Vol. 1–Vol. 7,2002). Given its rather unconventional approach to these analyses, this void likelyderives from a lack of familiarity with the Amos strategy. The purpose of this arti-cle, then, is to provide some assistance in alleviating this difficulty. More specifi-cally, based on ANCOV structures, and using the graphical interface of the Amos4.0 program, the process of testing for equivalence in light of two different scenar-ios is illustrated: (a) The hypothesized multigroup model is identically specifiedacross groups, and (b) the hypothesized multigroup model is differentially speci-fied across groups. Although, conceptually, the analytic approach is similar acrossthese two perspectives, technically, it must necessarily differ when using AmosGraphics. Both situations are addressed in this article. In Application 1, testing forthe invariance of a measuring instrument for which the specified factorial structureof the measure is identical across groups is demonstrated. In Application 2, testingfor the invariance of a theoretical construct for which the pattern of factor loadingsdiffers across groups is demonstrated.
TESTING FOR MULTIGROUP INVARIANCE: THEGENERAL PROCEDURE
In testing for equivalencies across groups, sets of parameters are put to the test in alogically ordered and increasingly restrictive fashion, depending on the model andhypotheses to be tested. In the case of tests for the invariance of a measuring instru-ment and/or the invariance of a theoretical construct, the two applications to be il-lustrated in this article, only the factor-loading regression paths and the factorcovariances are of interest. Except in particular instances when, for example, it
TESTING FOR INVARIANCE VIA AMOS 273
Dow
nloa
ded
by [
Uni
vers
ity o
f G
roni
ngen
] at
02:
37 1
9 D
ecem
ber
2011

might be of interest to test for the equivalent reliability of an assessment measureacross groups (see, e.g., Byrne, 1988), the equality of error variances andcovariances is probably of least importance (Bentler, 2004). Indeed, it is nowwidely accepted that testing for the invariance of these error parameters representsan overly restrictive test of the data.
In the Jöreskog tradition, tests of hypotheses related to group invariance typi-cally begin with scrutiny of the measurement model.1 In particular, the pattern offactor loadings for each observed measure is tested for its equivalence across thegroups. Once it is known which observed measures are group invariant, these pa-rameters are constrained equal while subsequent tests of the structural parametersare conducted. As each new set of parameters is tested, those known to be group in-variant are constrained equal across groups. Given the univariate approach to thetesting of these hypotheses, as implemented in the Amos program—comparedwith, for example, the multivariate approach used in the EQS program (Bentler &Wu, 2002)—this orderly sequence of analytic steps is both necessary and stronglyrecommended.
As a prerequisite to testing for factorial invariance, it is customary to consider abaseline model, which is estimated for each group separately. This baseline modelrepresents one that best fits the data from the perspectives of both parsimony andsubstantive meaningfulness. However, measuring instruments are often group spe-cific in the way they operate, and thus, baseline models are not expected to be com-pletely identical across groups. For example, whereas the baseline model for onegroup might include cross-loadings2 and/or error covariances, this may not be sofor other groups under study. A priori knowledge of such group differences is criti-cal to the application of invariance-testing procedures. Although the bulk of the lit-erature suggests that the number of factors must be equivalent across groups beforefurther tests of invariance can be conducted, this strategy represents a logical start-ing point only, and is not a necessary condition. Indeed, only the similarly speci-fied parameters within the same factor need be equated (see, e.g., Byrne,Shavelson, & Muthén, 1989; Werts, Rock, Linn, & Jöreskog, 1976).
Because the estimation of baseline models involves no between-group con-straints, the data can be analyzed separately for each group. However, in testing forinvariance, equality constraints are imposed on particular parameters, and thus, thedata for all groups must be analyzed simultaneously to obtain efficient estimates(Bentler, 2004; Jöreskog & Sörbom, 1996); the pattern of fixed and free parame-
274 BYRNE
1Although Jöreskog (1971) initially recommended that all tests for invariance begin with a globaltest of the equality of covariance matrices across groups, research has shown that this test often leads tocontradictory findings. As a consequence, it is no longer regarded as a necessary prerequisite to the test-ing of specific hypotheses related to invariance. (For an elaboration of this issue, see Byrne, 2001.)
2A variable’s measurement loading on more than one factor.
Dow
nloa
ded
by [
Uni
vers
ity o
f G
roni
ngen
] at
02:
37 1
9 D
ecem
ber
2011

ters nonetheless remains consistent with the baseline model specification for eachgroup. We turn now to the example applications of interest in this article.
APPLICATION 1
In this first application, hypotheses related to the invariance of a single measuringinstrument are tested across three groups of teachers. Specifically, we test forequivalency of a 20-item adaptation of the Maslach Burnout Inventory (MBI;Maslach & Jackson, 1986) across elementary (n = 1,159), intermediate (n = 388),and secondary (n = 1,384) teachers.
The Hypothesized Model
The model used in this first application is taken from a study by Byrne (1993) inwhich the initial task was to test for the validity of the MBI, a 22-item instrumentdesigned to measure three dimensions of burnout—emotional exhaustion, deper-sonalization, and personal accomplishment. Based on consistent findings that Item12 (designed to measure Personal Accomplishment) and Item 16 (designed tomeasure Emotional Exhaustion) were problematic in fitting the model to the datafor elementary, intermediate, and secondary school teachers, a modified version ofthe instrument that excluded these items was proposed. The hypothesized model tobe tested here is based on this 20-item adaptation of the MBI.3
The Baseline Models
In testing for the validity of the 20-item MBI model for each teacher group, find-ings were consistent in revealing exceptionally large correlated errors betweenItems 1 and 2 and between Items 10 and 11. Scrutiny of the content for each ofthese items revealed evidence of substantial overlap between each of these itempairs, a situation that can trigger error covariances. In light of this substantive justi-fication, these error terms were subsequently specified as free parameters in themodel for each teacher group. A final model that reflected these modifications wasfully cross-validated for independent samples of elementary, intermediate, andsecondary teachers.
This testing for a baseline model, then, yielded one that was identically specifiedfor each of the three teaching panels. However, it is important to emphasize that justbecause the revised model was similarly specified for each teacher group, it in no
TESTING FOR INVARIANCE VIA AMOS 275
3For a more detailed account of analyses leading up to the 20-item model, readers are referred to theoriginal article (Byrne, 1993), or to Byrne (2001).
Dow
nloa
ded
by [
Uni
vers
ity o
f G
roni
ngen
] at
02:
37 1
9 D
ecem
ber
2011

way guarantees the equivalence of item measurements and underlying theoreticalstructure across teacher groups; these hypotheses must be tested statistically.
Thehypothesizedmodelunder test in this example represents the revised20-itemMBI structure, together with the addition of two error covariances, as schematicallydepicted in Figure 1. At issue is the extent to which this modified version of the MBIis equivalent across elementary, intermediate, and secondary school teachers.
276 BYRNE
FIGURE 1 Baseline model of revised 20-item MBI structure for elementary, intermediate,and secondary teachers. From Byrne, 2001. Reprinted with permission.
Dow
nloa
ded
by [
Uni
vers
ity o
f G
roni
ngen
] at
02:
37 1
9 D
ecem
ber
2011

TESTING FOR MULTIGROUP INVARIANCEUSING AMOS GRAPHICS
When working with ANCOV structures that involve multiple groups, the data re-lated to each group must, of course, be made known to the program. Typically, formost structural equation modeling (SEM) programs, the data reside in some exter-nal file, the location of which is specified in an input file. Although no input file isused with Amos Graphics, both the name of each group and the location of its datafile must be conveyed to the program prior to the analyses. This procedure is ac-complished via the Manage Groups dialog box, which is made available either bypulling down the Model-Fit menu and selecting the “Manage Groups” option, orby using the Manage Groups icon . To begin, we click on “New” in the ManageGroups dialog box, which is shown in Figure 2.4 Each click will yield the name“Group,” along with an assigned number. In the case of Figure 2, the group number(3) pertains to secondary teachers; this name change is invoked simply by typingover the former name (see Figure 3).
Once the group names have been established, the next task is to identify adata file for each, which is accomplished through activation of the Data File dia-log box. This information is made available either by clicking on the Data Fileicon , or by pulling down the File menu and selecting the “Data Files” option.The Data File dialog box for this application is shown in Figure 4.
Specification of a multigroup model, using Amos Graphics, is guided by the de-fault rule that, unless explicitly declared otherwise, all groups in the analysis havean identical path diagram structure. As such, a model structure needs only to bedrawn for the first group; all other groups will have the same structure by default.Given that all three groups in this first application have the same baseline model,this default rule poses no problem.
Testing for invariance necessarily entails a multistep process. However, when theanalyses involve more than two groups, and findings reveal evidence of nonin-variance, the number of steps required in identifying the source of such nonin-variance can increase substantially. In the interest of clarity, given that this exampleinvolves three groups, each step of the process has been identified accordingly.
Step 1: Testing for the Validity of the Hypothesized ModelAcross Elementary, Intermediate, and Secondary Teachers
As a preliminary step in testing for invariance across groups, we test for the validityof MBI structure as best represented by the hypothesized three-factor structure
TESTING FOR INVARIANCE VIA AMOS 277
4In the background, to the left of Figure 2, you see the Amos tool palette, which contains the variousdialog box icons; to the right, is the model under study (Figure 1), which must remain activatedthroughout the analytic process.
Dow
nloa
ded
by [
Uni
vers
ity o
f G
roni
ngen
] at
02:
37 1
9 D
ecem
ber
2011

FIGURE 2 The Manage Groups dialog box: Addition of a new group. From Byrne, 2001. Re-printed with permission.
FIGURE 3 The Manage Groups dialog box: Labeling of a new group. From Byrne, 2001. Re-printed with permission.
FIGURE 4 The Data Files dialog box: Identification of data files. From Byrne, 2001. Re-printed with permission.
Dow
nloa
ded
by [
Uni
vers
ity o
f G
roni
ngen
] at
02:
37 1
9 D
ecem
ber
2011
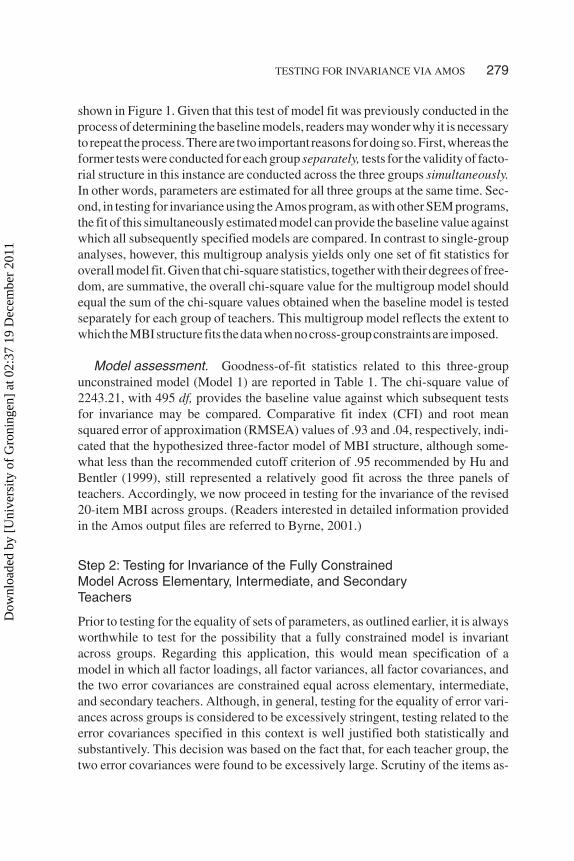
shown in Figure 1. Given that this test of model fit was previously conducted in theprocess of determining the baseline models, readers may wonder why it is necessaryto repeat theprocess.Thereare twoimportant reasons fordoingso.First,whereas theformer tests were conducted for each group separately, tests for the validity of facto-rial structure in this instance are conducted across the three groups simultaneously.In other words, parameters are estimated for all three groups at the same time. Sec-ond, in testing for invariance using the Amos program, as with other SEM programs,the fit of this simultaneously estimated model can provide the baseline value againstwhich all subsequently specified models are compared. In contrast to single-groupanalyses, however, this multigroup analysis yields only one set of fit statistics foroverall model fit. Given that chi-square statistics, together with their degrees of free-dom, are summative, the overall chi-square value for the multigroup model shouldequal the sum of the chi-square values obtained when the baseline model is testedseparately for each group of teachers. This multigroup model reflects the extent towhich theMBIstructure fits thedatawhennocross-groupconstraintsare imposed.
Model assessment. Goodness-of-fit statistics related to this three-groupunconstrained model (Model 1) are reported in Table 1. The chi-square value of2243.21, with 495 df, provides the baseline value against which subsequent testsfor invariance may be compared. Comparative fit index (CFI) and root meansquared error of approximation (RMSEA) values of .93 and .04, respectively, indi-cated that the hypothesized three-factor model of MBI structure, although some-what less than the recommended cutoff criterion of .95 recommended by Hu andBentler (1999), still represented a relatively good fit across the three panels ofteachers. Accordingly, we now proceed in testing for the invariance of the revised20-item MBI across groups. (Readers interested in detailed information providedin the Amos output files are referred to Byrne, 2001.)
Step 2: Testing for Invariance of the Fully ConstrainedModel Across Elementary, Intermediate, and SecondaryTeachers
Prior to testing for the equality of sets of parameters, as outlined earlier, it is alwaysworthwhile to test for the possibility that a fully constrained model is invariantacross groups. Regarding this application, this would mean specification of amodel in which all factor loadings, all factor variances, all factor covariances, andthe two error covariances are constrained equal across elementary, intermediate,and secondary teachers. Although, in general, testing for the equality of error vari-ances across groups is considered to be excessively stringent, testing related to theerror covariances specified in this context is well justified both statistically andsubstantively. This decision was based on the fact that, for each teacher group, thetwo error covariances were found to be excessively large. Scrutiny of the items as-
TESTING FOR INVARIANCE VIA AMOS 279
Dow
nloa
ded
by [
Uni
vers
ity o
f G
roni
ngen
] at
02:
37 1
9 D
ecem
ber
2011

280 TABLE 1Goodness-of-fit Statistics for Tests of Invariance: A Summary
Model Description GroupsComparative
Model χ2 df ∆χ2 ∆dfStatistical
Significance
1. Hypothesized model (Model 1) Elementary, intermediate, secondary 2243.21 495 — — —2. Factor loadings, variances, and
covariances, plus error covariancesconstrained equal
Elementary, intermediate, secondary Model 1 2344.75 545 101.54 50 p < .05
3. Hypothesized model (Model 1a) Elementary, intermediate — 1246.24 330 — — —4. Factor loadings, variances, and
covariances, plus error covariancesconstrained equal
Elementary, intermediate Model 1a 1282.18 355 35.94 25 ns
5. Hypothesized model Elementary, secondary Model 1b 1990.06 330 — — —6. Factor loadings constrained equal Elementary, secondary Model 1b 2023.20 347 33.14 17 p < .057. Factor loadings on EE constrained
equal (Model 2)Elementary, secondary Model 1b 1992.40 337 2.34 7 ns
8. Model 2 with factor loadings on DPconstrained equal
Elementary, secondary Model 2 2005.52 341 13.12 4 p < .01
9. Model 2 with factor loadings of Item10 on DP constrained equal
Elementary, secondary Model 2 1992.60 338 0.20 1 ns
10. Model 2 with factor loadings of Items10 and 11 on DP constrained equal
Elementary, secondary Model 2 2000.56 339 8.16 2 p < .05
11. Model 2 with factor loadings of Items10 and 15 on DP constrained equal
Elementary, secondary Model 2 1994.75 339 2.35 2 ns
12. Model 2 with factor loadings of Items10, 15, and 22 on DP constrainedequal (Model 3)
Elementary, secondary Model 2 1995.02 340 2.62 3 ns
13. Model 3 with factor loadings on PAconstrained equal
Elementary, secondary Model 3 2012.72 346 17.70 6 p < .01
Note. ∆χ2 = difference in chi-square values between models; ∆df = difference in number of degrees of freedom between models; EE = Emotional Exhaus-tion; DP = Depersonalization; PA = Personal Accomplishment.
Dow
nloa
ded
by [
Uni
vers
ity o
f G
roni
ngen
] at
02:
37 1
9 D
ecem
ber
2011

sociated with these error terms revealed highly overlapping content across each ab-errant pair of items. As noted earlier, such redundancy can reflect itself in the formof error covariation. Based on this substantive rationale, then, it seems prudent toascertain whether the two error covariance parameters hold across teaching panels.This fully constrained model is shown in Figure 5.
In SEM, testing for the invariance of parameters across groups is accomplishedby placing constraints on particular parameters or, in other words, specifying par-
TESTING FOR INVARIANCE VIA AMOS 281
FIGURE 5 Baseline model with equality constraints specified for factor loadings, factor vari-ances, factor covariances, and two error covariances. From Byrne, 2001. Reprinted with per-mission. From Byrne, 2001. Reprinted with permission.
Dow
nloa
ded
by [
Uni
vers
ity o
f G
roni
ngen
] at
02:
37 1
9 D
ecem
ber
2011

ticular parameters to be invariant (i.e., equivalent) across groups. In Amos Graph-ics, constraints are specified through a labeling mechanism whereby each parame-ter to be held equal across groups is given a label. Thus, in analyzing multigroupmodels, any parameters that are unlabeled will be freely estimated, thereby takingon different values across groups. To initiate this labeling process, we first activatethe hypothesized model shown in Figure 1, and then, using the Object Propertiesdialog box, begin the task of labeling the parameters of interest. Shown in Figure 6,is the menu yielded through a right-click of the mouse, from which Object Prop-erties is selected. More specifically, the Object Properties dialog box was triggeredby first clicking on the second factor-loading path (which then becomes high-lighted in red), and then clicking on the right mouse button. Figure 7 illustrates the
282 BYRNE
FIGURE 6 Selection of Object Properties menu via a right mouse click. From Byrne, 2001.Reprinted with permission.
FIGURE 7 The Object Properties dialog box: Labeling the parameters. From Byrne, 2001.Reprinted with permission.
Dow
nloa
ded
by [
Uni
vers
ity o
f G
roni
ngen
] at
02:
37 1
9 D
ecem
ber
2011

labeling of the first estimated parameter (p2) which represents the factor loading ofMBI Item 2 on the factor, Emotional Exhaustion.
Lets turn back again to Figure 5, where three aspects of the path diagram areworthy of particular note. First, selected labeling of parameters is purely arbitrary.In this case, the factor-loading regression paths are labeled as p, the factor vari-ances as v_, the factor covariances as c_, and the error covariances as v_err. Thus,for example, v_ee represents the variance of the Emotional Exhaustion factor,c_eepa represents the covariance between the factors of Emotional Exhaustion andPersonal Accomplishment, v_err1011 represents the covariance between the errorterms associated with Items 10 and 11, and so on. Second, you will note that thevalue of 1.00, assigned to the first of each congeneric set of indicator variables (forpurposes of statistical identification), remains as such and has not be relabeledwith a “p”; given that this parameter is already constrained to equal 1.00, its valuewill be constant across the three groups. Finally, the somewhat erratic labeling ofthe factor-loading paths is a function of the automated labeling process providedby the Amos program and would appear to be related to the restricted space allot-ment assigned to each parameter. Although, technically, it is possible to shift labelsto a more appropriate location using the Move Parameters tool , this transitiondoes not seem to work well when there are several labeled parameters located inclose proximity to one another, as is the case here.
Model assessment. Goodness-of-fit statistics related to this constrainedthree-group model are presented as the second entry in Table 1. In testing for theinvariance of this constrained model, we compare its chi-square value of 2344.75(545 df) with that for the initial model (Model 1) in which no equality constraintswere imposed, χ2(495) = 2243.21. As with single-group applications, when modelsare nested, this difference in chi-square values (in large samples) is distributed asχ2, with degrees of freedom equal to the difference in degrees of freedom. Giventhat the constrained model is nested within the initial model, we use this compara-tive procedure here. This comparison yields a chi-square difference (∆χ2) value of101.54 with 50 df, which is statistically significant (p < .05). Provided with this in-formation, we now know that some equality constraints do not hold across thethree teacher groups.
Step 3: Testing for Invariance of Fully Constrained ModelAcross Elementary and Intermediate Teachers
Given that we are working with three groups in this application, one approach tothis series of analyses is to determine, first, if the constrained model is possibly in-variant across two of the three groups of teachers. To this end, the hypothesizedmodel (Model 1; no equality constraints) is once again estimated to establish acomparative base. However, in contrast to the previously estimated model, specifi-
TESTING FOR INVARIANCE VIA AMOS 283
Dow
nloa
ded
by [
Uni
vers
ity o
f G
roni
ngen
] at
02:
37 1
9 D
ecem
ber
2011

cation relates only to elementary and intermediate teachers. This multigroupmodel has been labeled as Model 1a in Table 1 to distinguish it from the originalmultigroup model that included the three teacher groups.
In Amos Graphics, any change in the number of groups to be included in ananalysis is accomplished via the Manage Groups dialog box. Consistent withModel 1a, secondary school teachers were excluded from the analysis by a simplehighlighting and deletion process.
Model assessment. Turning again to Table 1, we focus on the third andfourth table entries. Entry 3 reports goodness-of-fit statistics related to the testingof Model 1a in which no equality constraints were imposed across elementary andintermediate teachers. Entry 4 reports on its comparison with the related con-strained model. As you will readily observe, this comparison of models was notstatistically significant, thereby indicating that all factor loadings, variances, andcovariances, in addition to the two error covariances, are invariant across elemen-tary and intermediate teachers. From these findings we can conclude that any in-equality of parameters across the three groups of teachers must logically lie be-tween secondary teachers and their elementary–intermediate school counterparts.
In this study, the category of intermediate teachers represented teachers work-ing within the framework of an intermediate (or middle) school; all taught studentsin Grades 7 and 8. However, the category of elementary teachers also includedteachers of Grades 7 and 8. Within this context, then, we can consider intermediateteachers under the broader rubric of elementary (as opposed to secondary) schoolteachers. In light of this consideration, together with the findings of equivalent fac-torial structure of the MBI across elementary and intermediate teachers, it wouldseem reasonable to treat these two teacher groups as one. Hence, for the remaininganalyses, data for elementary and intermediate teachers were merged and treatedas a single group. In the interest of simplicity, and to minimize possible confusionin the use of a combined group name, the label for this group is revised from ele-mentary–intermediate teachers to elementary teachers is revised.
Because Amos Graphics provides no internal mechanism for merging data, thisprocess must be accomplished using alternative means. However, once structuredand imported to Amos, the newly merged data set is easily incorporated for use inrunning the remaining analyses. For example, let us say we save the merged data asa text file and label it as elemint.txt (consistent with the other data files shown inFigure 4). In preparation for the analyses to follow, we access the Manage Groupsdialog box (see Figures 2 and 3) and do the following: (a) erase both the elemen-tary and intermediate teacher groups by highlighting and then deleting each; (b)click on the “New” button, which will yield “Group number 2”; (c) replace Groupnumber 2 with “Elemint Teachers.” The final task is to link this newly mergedgroup to a data set. As such, we access the Data Files dialog box (see Figure 4).With Elemint Teachers highlighted, click on the “File Name” button, which in
284 BYRNE
Dow
nloa
ded
by [
Uni
vers
ity o
f G
roni
ngen
] at
02:
37 1
9 D
ecem
ber
2011

turn, will produce a list of the four data sets (elementary, intermediate, secondary,elemint) within the folder in which they reside. In this case, we simply selectelemint.txt.
Step 4: Testing for Invariance of Factor Loadings AcrossElementary and Secondary Teachers
In testing for multigroup invariance, it is best to establish a logically organizedstrategy. The general scheme to be followed here is that we test first for theinvariance of all factor loadings (i.e., all elements of the factor-loading matrix).Given findings of noninvariance at this level, we then proceed to test for theinvariance of all factor loadings in each subscale (i.e., all loadings related to theone particular factor), separately. Given evidence of noninvariance at the subscalelevel, we then test for the invariance of each factor loading (related to the factor inquestion) separately. Of import in this process is that, as factor-loading parametersare found to be invariant across groups, their specified equality constraints aremaintained, cumulatively, throughout the remainder of the invariance-testingprocess.
Turning to our task of testing for the invariance of the MBI across elementaryand secondary teachers, then, we begin first by establishing goodness of fit for amultigroup unconstrained baseline model, which we label as Model 1b to distin-guish it from Model 1 involving elementary, intermediate, and secondary teachers,and Model 1a involving only elementary and intermediate teachers. Nonetheless,it is important to emphasize that, although the groups tested varied, the hypothe-sized three-factor model of MBI structure remained the same across Models 1, 1a,and 1b. As shown in Entry 5 of Table 1, the testing of Model 1b yielded a χ2(330)
value of 1990.06.We turn next to testing for invariant factor loadings related to all three factors —
Emotional Exhaustion, Depersonalization, and Personal Accomplishment. In us-ing Amos Graphics, this change in model specification necessarily requires a mod-ification of the fully constrained model shown in Figure 5. Specifically, all labels,except those representing equality-constrained parameters, must be erased. Assuch, all parameter labels, except those associated with factor loadings, are re-moved. This task is easily accomplished by clicking on each label (to be deleted),right-clicking to trigger the Object Properties dialog box, and then deleting the la-bel listed in the parameter rectangle (of the dialog box).
Model assessment. Turning to Entry 6 in Table 1, we see that testing of thismodel yielded a χ2 value of 2023.20 with 347 df; comparison with Model 1byielded a ∆χ2 value of 33.14 with 17 df, which was statistically significant (p <.05). To pinpoint the nonequivalent factor loadings, the next step entailed testingfor invariance relative to each factor separately. Accordingly, the labels for Factor
TESTING FOR INVARIANCE VIA AMOS 285
Dow
nloa
ded
by [
Uni
vers
ity o
f G
roni
ngen
] at
02:
37 1
9 D
ecem
ber
2011

2 (Depersonalization) and Factor 3 (Personal Accomplishment) were erased, leav-ing only those associated with Factor 1 (Emotional Exhaustion). Results related tothis test of invariance, as indicated in Table 1 (Entry 7), revealed all factor loadingsto be equivalent across elementary and secondary teachers; that is to say, compari-son of this model with Model 1b revealed no significant differences.5
Having established the equivalence of factor loadings related to Emotional Ex-haustion, these constraints were held in place while proceeding next to test for theinvariance of the factor loadings on the Depersonalization factor. As such, modelspecification in the next round of analyses, using Amos Graphics, would have allfactor loadings labeled for both Factors 1 and 2. Turning once again to Table 1 (En-try 8), we see that this test for invariance was statistically significant (p < .01),thereby signaling some discrepancy in the measurement of Depersonalization be-tween elementary teachers and their secondary school peers. In other words, one ormore items in this subscale were found to be noninvariant across the groups; thetask then was to pinpoint these noninvariant items.
This search began by removing all labels associated with Factor 2, except theone associated with the first estimated parameter (Item 10; p10). It is perhaps im-portant to reconfirm that, given the invariance of all items in the Emotional Ex-haustion subscale, the labeling of all factor loadings linked to Factor 1 remainedintact (hence the description as Model 2) with the factor loading of Item 10 onDepersonalization constrained to be equal across groups. For clarification of thislabeling process, specification of this revised model is displayed graphically inFigure 8.
As reported in Table 1 (Entry 9), the test for invariance related to this firstfactor-loading parameter (Item 10) was nonsignificant, thereby indicating itsequality across groups. This orderly process of testing for the invariance of pa-rameters is continued until all targeted parameters have been tested. It is perhapsworthwhile to reemphasize that, as parameters are found to be invariant, equalityconstraints related to these parameters are cumulatively held in place, therebyproviding a very rigorous test of equality across groups. As indicated in Table 1,results from this series of tests bearing on Factor 2 revealed only the factor load-ing associated with Item 11 to be noninvariant across groups. For purposes offurther comparisons involving the Personal Accomplishment factor (as expli-cated earlier for comparisons related to the Depersonalization factor), this modelis labeled as Model 3.
Having now established invariance related to the factor loadings for Factors 1 and2, the next logical step was to test for the invariance of all factor loadings related toPersonal Accomplishment. As such, this model would graphically reveal labels as-
286 BYRNE
5For purposes of simplicity in describing subsequent invariance models to be tested, this model islabeled as Model 2. As such, it eliminates the need to specify these constraints repeatedly for each of themodels that follow.
Dow
nloa
ded
by [
Uni
vers
ity o
f G
roni
ngen
] at
02:
37 1
9 D
ecem
ber
2011

sociated with (a) all factor loadings associated with Emotional Exhaustion (p2–p8);(b) only those associated with Items 10 (p10), 15(p12), and 22 (p13) for Depersonal-ization; and (c) all factor loadings associated with Personal Accomplishment(p15–p20). As indicated by their explicit labeling, factor loadings associated withEmotional Exhaustion and Depersonalization have been found to be group invari-ant; those associated with Personal Accomplishment are yet to be tested.
Results related to testing for the invariance of factor loadings related to PersonalAccomplishment, as can be seen in Table 1 (Entry 13), indicated that certain items
TESTING FOR INVARIANCE VIA AMOS 287
FIGURE 8 Baseline model with equality constraints specified for all loadings on Factor 1and one loading on Factor 2. From Byrne, 2001. Reprinted with permission.D
ownl
oade
d by
[U
nive
rsity
of
Gro
ning
en]
at 0
2:37
19
Dec
embe
r 20
11

in this scale were not invariant across elementary and secondary teachers. Thecourse of action to be followed at this point, then, was to pinpoint these non-invariant items. As previously demonstrated with the testing for invariance of Fac-tor 2 (Depersonalization), this process would be continued until all targeted pa-rameters of interest have been tested. Once all tests for the invariance of factorloadings have been completed, one would next test for the equivalence of the twoerror covariances. Finally, once all tests for invariance related to the measurementmodel have been completed, one would turn next to the structural model in testingfor the equivalence of the three factor covariances across the three panels of teach-ers. Due to the necessary limitation of space in describing these procedures, thelatter tests of invariance are not detailed here. However, hopefully, sufficient mate-rial has been presented in this application to give readers an adequate understand-ing of the ordered process involved.
APPLICATION 2
This second multigroup application tests hypotheses related to the equivalence ofSC measurement and structure across gender for high school adolescents. In par-ticular, it seeks to determine if multidimensional facets of SC (general, academic,English, mathematics), as measured by subscale scores from multiple-assessmentinstruments, are equivalent across male (n = 412) and female (n = 420) adoles-cents.
The Hypothesized Model
The model on which this application is based (Byrne & Shavelson, 1987) derivesfrom an earlier construct validity study of adolescent SC (Byrne & Shavelson,1986) that argued for a four-factor structure composed of general SC (GSC), aca-demic SC (ASC), English SC (ESC), and mathematics SC (MSC), with the fourconstructs assumed to be intercorrelated.
Except for ASC,6 each SC dimension is measured by three independent mea-sures, each of which represents the related subscale score from one of four instru-ments: the Self Description Questionnaire–III (SDQ–III; Marsh, 1992), the Affec-tive Perception Inventory (API; Soares & Soares, 1979), the Self-Concept ofAbility Scale (SCA; Brookover, 1962), and the Self-Esteem Scale (SES;Rosenberg, 1989). At issue in the Byrne and Shavelson (1987) study was whetherthe structure of SC and the instruments used in measuring components of thisstructure were equivalent across adolescent boys and girls.
288 BYRNE
6Because preliminary analyses revealed the ASC subscale of the API to be a weak measure of thisconstruct, it was deleted from all subsequent analyses.
Dow
nloa
ded
by [
Uni
vers
ity o
f G
roni
ngen
] at
02:
37 1
9 D
ecem
ber
2011

The Baseline Models
In fitting the baseline model for each gender, Byrne and Shavelson (1987) reporteda substantial drop in chi-square when the SDQESC of the SDQ–III was free tocross-load onto the GSC factor. Moreover, for boys only, the MSC subscale of theSDQ–III (SDQMSC) was allowed to cross-load onto the ESC factor. Finally,based on their substantial size and substantive reasonableness, three error covari-ances were included in the baseline model for both boys and girls. These baselinemodels were considered optimal in representing the data for adolescent boys, χ2(33)
= 86.07 (CFI = .98; RMSEA = .063) and girls, χ2(34) = 77.30 (CFI = .99; RMSEA =.055), and are shown schematically in Figure 9.
Of primary interest regarding tests for invariance in this example, then, is theextent to which a four-factor structure of SC is equivalent across boys and girlswith respect to (a) the pattern of factor loadings, including the commoncross-loading, is equivalent, and (b) the factor variances of, and covariancesamong, the specified four facets of SC.7
TESTING FOR INVARIANCE VIA AMOS 289
FIGURE 9 Baseline models of self-concept for adolescent males and females. From Byrne,2001. Reprinted with permission.
7In contrast to the example presented in Application 1, the extent to which the error covariances areinvariant across gender, within the context of this application, is of little interest. Whereas the formerparameters were related to important information rooted in the interpretation of item content, the errorcovariance parameters in this example are related to subscale scores within the same measuring instru-ment.
Dow
nloa
ded
by [
Uni
vers
ity o
f G
roni
ngen
] at
02:
37 1
9 D
ecem
ber
2011

Step 1: Testing for Validity of the Hypothesized ModelAcross Adolescent Boys and Girls
As with Application 1, prior to conducting any tests for invariance, we test, first,for the validity of the SC structure as represented by the multigroup model por-trayed in Figure 9. In contrast to the example illustrated in Application 1, however,the multigroup model under test here comprises different hypothesized structuresacross groups. Turning first to specifications for adolescent boys, we see that, overand above the initially hypothesized model, there are two cross-loadings, in addi-tion to three error covariances. By way of contrast, specifications for adolescentgirls include only one cross-loading and three error covariances; these parametersreplicate those for boys. Thus, prior to testing for invariance, we already know thatone parameter is different across the two groups. As such, this parameter is esti-mated freely for boys, and is not constrained equal across boys and girls. With theexception of this parameter, then, all remaining estimated parameters can be testedfor their invariance across groups. This situation serves as an excellent example of“partial measurement invariance” (see Byrne et al., 1989).
Model assessment. Goodness-of-fit statistics related to this two-group un-constrained model of SC revealed an excellent fit to the data as indicated by theCFI (.979) and RMSEA (.043) values, respectively. The chi-square value(163.362, 67 df) provides the baseline value against which all subsequent tests forinvariance are compared.
TESTING FOR MULTIGROUP INVARIANCEUSING AMOS GRAPHICS
As demonstrated in Application 1, prior to testing for the validity of the hypothe-sized multigroup model, the name of each group, together with the related datafiles were identified to the program. Unlike the example presented in Application1, however, this example entails a differential number of estimated parameters forboys and girls, thereby making the testing for invariance less straightforward thanwas the case in the previous application, where the baseline models were identicalacross groups. Because Amos Graphics requires that only one model be submittedfor analysis at any one time, a decision must be made regarding which baselinemodel (boy or girl) will be specified. Given that the baseline model for boys con-tains the additional parameter, this is the model of choice for reasons that will be-come evident as we walk through the process. Accordingly, the fully constrained(i.e., labeled) model to be tested for invariance is displayed in Figure 10.
Within the Amos Graphics framework, two possible strategies may be used inspecifying a constrained multigroup model in which the baseline model differs
290 BYRNE
Dow
nloa
ded
by [
Uni
vers
ity o
f G
roni
ngen
] at
02:
37 1
9 D
ecem
ber
2011

across groups. One strategy works from a specification perspective and calls for (inthis instance) the additional cross-loading to be constrained to 0.00 for girls, albeitfreely estimated for boys. The alternative strategy works from a macrolevel per-spective and requests the program to allow a different path diagram for each group.We turn, first, to the specification approach.
To modify the specification of a multigroup model such that a parameter is con-strained in some way for only one of the groups, we need to identify two pieces ofinformation for the program: (a) the value to which we wish to constrain the pa-rameter, and (b) the group for which the parameter is to be constrained. This infor-
TESTING FOR INVARIANCE VIA AMOS 291
FIGURE 10 Model to be tested for invariance across gender. From Byrne, 2001. Reprintedwith permission.
Dow
nloa
ded
by [
Uni
vers
ity o
f G
roni
ngen
] at
02:
37 1
9 D
ecem
ber
2011

mation is easily transmitted via the Object Properties dialog box noted in Applica-tion 1. Figure 11 shows the Object Properties dialog box that would appear afterhaving right-clicked with the mouse on the cross-loading in question; the regres-sion weight value has been set at 0.0. Observe, also, that the All Groups box has notbeen selected. Turning to the hypothesized model in Figure 12, two observationsare important to note: (a) A value of zero has been assigned to the cross-loading pa-
292 BYRNE
FIGURE 11 Object Properties dialog box: Assignment of “0” to regression path. FromByrne, 2001. Reprinted with permission.
FIGURE 12 List of group names with the female group selected: Assignment of “0” tomale-specified cross-loading. From Byrne, 2001. Reprinted with permission.
Dow
nloa
ded
by [
Uni
vers
ity o
f G
roni
ngen
] at
02:
37 1
9 D
ecem
ber
2011

rameter, and (b) In the list of groups to the left of the screen, Females has beenhighlighted. For clarification, it is emphasized that, in order for the zero value to beassigned to the parameter only for girls, this group must be highlighted prior to fix-ing the value. In contrast, if we were to highlight Males, we would see the samemodel, albeit with no zero value associated with the cross-loading parameter.
We turn now to the second approach to model modification whereby the pro-gram allows the groups to have different path diagrams. To initiate this strategy, wemake use of the Interface Properties dialog box, which is accessed either by click-ing on its icon, , or by pulling down the View/Set menu as shown in Figure 13.Several choices are available within the Interface Properties dialog box as you willreadily observe in Figure 14. The one of interest to us here is the Miscellaneous op-tion. In particular, we wish to select the boxed option listed at the bottom wherebydifferent path diagrams are allowed for different groups. The reason why this boxis not shown with a check mark in Figure 14 is because to do so automatically trig-gers the error message shown in Figure 15, which then blocks the information inthe dialog box illustrated in Figure 14.
One peculiarity associated with the selection of this differential path diagram op-tion is that it automatically triggers the warning message displayed in Figure 15. Al-though you may possibly feel a pang of anxiety about continuing after having beenconfronted with this caveat, you must answer “yes” if you wish to use this option.Having responded in the affirmative, the model displayed, at any point in the analy-sis,willbeconsistentwith thegrouphighlighted to its left.Forexample, inFigure16,the model displayed relates to the female group; note the omission of a path leadingfrom the ESC factor to SDQMSC. On the other hand, if we were to display the modelrelated to the male group, we would observe this path in the diagram.
TESTING FOR INVARIANCE VIA AMOS 293
FIGURE 13 The View/Set menu. From Byrne, 2001. Reprinted with permission.
Dow
nloa
ded
by [
Uni
vers
ity o
f G
roni
ngen
] at
02:
37 1
9 D
ecem
ber
2011

Step 2: Testing for Invariance of the Fully ConstrainedModel Across Adolescent Boys and Girls
Once this differential multigroup model has been established, using either of thetwo strategies outlined previously, testing for invariance across groups may pro-ceed.8 Again, because it is always possible (although highly improbable) that allparameters of interest in both the measurement and structural models may be in-
294 BYRNE
FIGURE 14 The Interface Properties dialog box. From Byrne, 2001. Reprinted with permis-sion.
FIGURE 15 Error message regarding differential model specification across groups. FromByrne, 2001. Reprinted with permission.
8In this example, a value of zero was assigned to the male-specific cross-loading in specifying themodel for girls.
Dow
nloa
ded
by [
Uni
vers
ity o
f G
roni
ngen
] at
02:
37 1
9 D
ecem
ber
2011

variant across boys and girls, we can test, first, for the validity of this omnibus test,which is based on the fully constrained model shown in Figure 10.9
Model assessment. A review of the goodness-of-fit indexes related to thisfully constrained model once again revealed an extremely well-fitting structure,as reflected by CFI and RMSEA values of .979 and .043, respectively. The keystatistic, however, is the chi-square value (224.551, 88 df), as it provides thebasis for determining the extent to which the postulated model is equivalentacross adolescent boys and girls. Accordingly, comparison of this model (Model2) with the original unconstrained model (Model 1) yielded a chi-square differ-ence value of 61.189 with 21 df, which is statistically significant (p < .001).Consistent with Application 1, analyses now proceed in a logical order that testsfirst for the equivalence of the measurement model and then for the equivalenceof the structural model. Results bearing on this series of tests are presented inTable 2.
TESTING FOR INVARIANCE VIA AMOS 295
FIGURE 16 Model specification for females: Absence of male-specified cross-loading.From Byrne, 2001. Reprinted with permission.
9For reasons cited in Footnote 7, testing for the invariance of error covariances is of little interestand, thus, these parameters remain unlabeled.
Dow
nloa
ded
by [
Uni
vers
ity o
f G
roni
ngen
] at
02:
37 1
9 D
ecem
ber
2011

Step 3: Testing for Invariance of Factor Loadings AcrossAdolescent Boys and Girls
The first logical step in the invariance process is to test for the equivalence of allfactor loadings across the two groups. As described and illustrated earlier, in usingAmos Graphics, any reduction in the number of parameters to be tested necessarilyrequires that all parameter labels, except those associated with parameters undertest (in this case, the factor loadings), be deleted from the model.
296 BYRNE
TABLE 2Goodness-of-Fit Statistics for Tests of Invariance Across Males
and Females: A Summary
Model Description χ2 df ∆χ2a ∆dfStatistical
Significance
1. Combined baseline models (males and females) 163.36 67 — — —2. Factor loadings, variances, and covariances
constrained equal224.55 88 61.19 21 p < .001
3. Factor loadings constrained equal 171.17 75 7.81 8 ns4. Model 3 with all variances constrained equal 190.70 79 27.34 12 p < .015. Model 3 with variance of GSC constrained
equal172.36 76 9.00 9 ns
6. Model 3 with variances of GSC and ASCconstrained equal
190.36 77 27.00 10 p < .01
7. Model 3 with variances of GSC and ESCconstrained equal
174.43 77 11.07 10 ns
8. Model 3 with variances of GSC, ESC, andMSC constrained equal
175.36 78 12.00 11 ns
9. Model 8 with all covariances constrained equal 219.22 84 55.86 17 p < .00110. Model 8 with covariance between GSC and
ASC constrained equal180.52 79 17.16 12 ns
11. Model 8 with covariances between GSC/ASCand ASC/ESC constrained equal
180.53 80 17.17 13 ns
12. Model 8 with covariances between GSC/ASC,ASC/ESC, and ESC/MSC constrained equal
195.49 81 32.13 14 p < .01
13. Model 8 with covariances between GSC/ASC,ASC/ESC, and GSC/ESC constrained equal
181.92 81 18.56 14 ns
14. Model 8 with covariances between GSC/ASC,ASC/ESC, GSC/ESC, and ASC/MSCconstrained equal
216.82 82 53.46 15 p < .001
15. Model 8 with covariances between GSC/ASC,ASC/ESC, GSC/ESC, and GSC/MSCconstrained equal
182.87 82 19.51 15 ns
Note. ∆χ2 = difference in chi-square values; ∆df = difference in degrees of freedom. GSC = gen-eral self-concept; ESC = English self-concept; MSC = mathematical self-concept; ASC = academicself-concept. From Byrne, 2001. Reprinted with permission.
aAll models compared with Model 1.Dow
nloa
ded
by [
Uni
vers
ity o
f G
roni
ngen
] at
02:
37 1
9 D
ecem
ber
2011

Model assessment. As indicated in Table 2, findings revealed all factorloadings to be equivalent across boys and girls, as reflected in a chi-square differ-ence between the model tested (Model 3) and Model 1, which was not statisticallysignificant. Given these findings, we can feel confident that all measures of SC areoperating in the same way for both groups, and we proceed in testing for the equal-ity of the structural parameters.
Step 4: Testing for Invariance of Factor Variancesand Covariances Across Adolescent Boys and Girls
We test next for the invariance of factor variances across groups. Given findings ofa fully invariant factor-loading matrix, model specification includes equality con-straints on the factor loadings, as well as on the factor variances. Of course, as il-lustrated earlier, a revised model that reflects the parameters to be constrainedequal (i.e., labeled parameters) must accompany each test for invariance.
In testing for the invariance of factor variances and covariances across gender,interest focuses on the hypothesized underlying factors of SC, as well as on theirinterrelational structure. As noted in Application 1, the testing of invariance hy-potheses involves increasingly restrictive models. Thus, the model to be testedhere (Model 4) is more restrictive than Model 3 because, in addition to equalityconstraints being imposed on the factor variances, they are also maintained for allfactor loadings.
Model assessment. As detailed in Table 2, results from the estimation ofModel 4 yielded a χ2(79) = 190.698. Because the difference in chi-square value be-tween this model and Model 1, ∆χ2(12) = 27.336, was statistically significant (p <.01), the hypothesis of invariant factor variances must be rejected. Faced with theseresults, the next task is to determine which variances are contributing to this in-equality. Thus, we now proceed in testing, independently, for the invariance ofeach factor variance parameter while continuing to hold constrained all parametersfound to be cumulatively invariant across adolescent boys and girls.
For pedagogical purposes, let us briefly review the steps involved in this testingphase. Turning to Table 2, we see that the variance of GSC was found to be invari-ant (Model 5). Thus, this parameter was held invariant, whereas the variance ofASC was tested for its equivalency across groups (Model 6). Results of this test re-vealed the latter to be noninvariant across gender; the equality constraint for thevariance of the ASC factor was therefore released. As a consequence, the modelused in testing for the invariance of ESC (Model 7), included two equality con-straints—one for the variance of GSC, and the other for the variance of ESC. Basedon this general procedure of cumulatively maintaining equality constraints onlyfor invariant elements, all factor covariances were similarly tested. As indicated inTable 2, these tests revealed two covariances to be nonequivalent across gender.
TESTING FOR INVARIANCE VIA AMOS 297
Dow
nloa
ded
by [
Uni
vers
ity o
f G
roni
ngen
] at
02:
37 1
9 D
ecem
ber
2011

Overall, as indicated by the goodness-of-fit statistics, the results summarized inTable 2 reveal SC structure to be well described by a four-factor model coveringthe facets of GSC, ASC, ESC, and MSC for both adolescent boys and girls. How-ever, whereas the observed measures were found to be operating equivalently forboth sexes, there were some differences in structural relations among the SC fac-ets. In particular, significant gender differences were found with respect to thevariance of ASC, and with respect to the covariances between ASC and MSC, andbetween ESC and MSC. A final model of SC structure, with all invariant parame-ters labeled, is displayed in Figure 17; note the absence of labels with respect to the
298 BYRNE
FIGURE 17 Final model of self-concept structure with all invariant parameters labeled.From Byrne, 2001. Reprinted with permission.
Dow
nloa
ded
by [
Uni
vers
ity o
f G
roni
ngen
] at
02:
37 1
9 D
ecem
ber
2011
following parameters: variance of ASC, covariance between ESC and MSC, andcovariance between ASC and MSC. (Readers are referred to Byrne, 2001, for a de-tailed review and explanation of the Amos Graphics output files, and to Byrne &Shavelson, 1987, for an extended discussion of the study results.)
CONCLUSION
Although, historically, issues related to the equivalency of measuring instrumentsand the underlying latent constructs they were designed to measure have beenlargely ignored in research concerned with group comparisons, the past few yearshave witnessed a gradual increase in the number of studies reporting findings fromtests for multigroup invariance based on ANCOV structures. This recent time pe-riod has also witnessed increased interest by researchers in using the graphical in-terface of the Amos program (Amos Graphics), albeit the majority of applicationshave focused on single-group ANCOV structures. Indeed, there has been little tono evidence of its use in the conduct of tests for multigroup invariance. Based ontwo applications, each of which incorporated a different use of the graphical inter-face, this article sought to illustrate the process involved in conducting thesemultigroup analyses using the Amos program. It is hoped that readers interested inadvancing both their knowledge of multigroup analyses and their application skillsin using the Amos program will find this didactic presentation to be helpful in ful-filling their endeavors.
ACKNOWLEDGMENT
All figures and Table 2 from Structural Equation Modeling With AMOS: BasicConcepts, Applications, and Programming, by B. M. Byrne, 2001, Mahwah, NJ:Lawrence Erlbaum Associates, Inc. Copyright 2001 by Lawrence Erlbaum Asso-ciates, Inc. Reprinted with permission.
REFERENCES
Arbuckle, J. L. (1999). Amos (Version 4.0) [Computer software]. Chicago: Smallwaters.Bentler, P. M. (2004). EQS: Structural equations program manual. Encino, CA: Multivariate Software.Bentler, P. M., & Wu, E. J. C. (2002). EQS 6 for Windows guide. Encino, CA: Multivariate Software.Brookover, W. B. (1962). Self-Concept of Ability Scale. East Lansing, MI: Educational Publication Ser-
vices.Byrne, B. M. (1988). The Self Description Questionnaire III: Testing for equivalent factorial validity
across ability. Educational and Psychological Measurement, 48, 397–406.
TESTING FOR INVARIANCE VIA AMOS 299
Dow
nloa
ded
by [
Uni
vers
ity o
f G
roni
ngen
] at
02:
37 1
9 D
ecem
ber
2011

Byrne, B. M. (1993). The Maslach Inventory: Testing for factorial validity and invariance across ele-mentary, intermediate, and secondary teachers. Journal of Occupational and Organizational Psy-chology, 66, 197–212.
Byrne, B. M. (1994). Structural equation modeling with EQS and EQS/Windows: Basic concepts, ap-plications, and programming. Thousand Oaks, CA: Sage.
Byrne, B. M. (1998). Structural equation modeling with LISREL, PRELIS, and SIMPLIS: Basic con-cepts, applications, and programming. Mahwah, NJ: Lawrence Erlbaum Associates, Inc.
Byrne, B. M. (2001). Structural equation modeling with AMOS: Basic concepts, applications, and pro-gramming. Mahwah, NJ: Lawrence Erlbaum Associates, Inc.
Byrne, B. M., & Shavelson, R. J. (1986). On the structure of adolescent self-concept. Journal of Educa-tional Psychology, 78, 474–481.
Byrne, B. M., & Shavelson, R. J. (1987). Adolescent self-concept: Testing the assumption of equivalentstructure across gender. American Educational Research Journal, 24, 365–385.
Byrne, B. M., Shavelson, R. J., & Muthén, B. (1989). Testing for the equivalence of factor covarianceand mean structures: The issue of partial measurement invariance. Psychological Bulletin, 105,456–466.
Hu, L.-T., & Bentler, P. M. (1999). Cutoff criteria for fit indexes in covariance structure analysis: Con-ventional criteria versus new alternatives. Structural Equation Modeling, 6, 1–31.
Jöreskog, K. G. (1971). Simultaneous factor analysis in several populations. Psychometrika, 36,409–426.
Jöreskog, K. G., & Sörbom, D. (1996). LISREL 8: User’s reference guide. Chicago: Scientific SoftwareInternational.
Marsh, H. W. (1992). Self Description Questionnaire (SDQ) III: A theoretical and empirical basis forthe measurement of multiple dimensions of late adolescent self-concept: An interim test manual andresearch monograph. Macarthur, NSW, Australia: Faculty of Education, University of Western Syd-ney.
Maslach, C., & Jackson, S. E. (1986). Maslach Burnout Inventory manual (2nd ed.). Palo Alto, CA:Consulting Psychologists Press.
Rosenberg, M. (1989). Society and the adolescent self-image (rev ed.). Middletown, CT: WesleyanUniversity Press.
Soares, A. T., & Soares, L. M. (1979). The Affective Perception Inventory: Advanced Level. Trumbell,CT: ALSO.
Werts, C. E., Rock, D. A., Linn, R. L., & Jöreskog, K. G. (1976). Comparison of correlations, variances,covariances, and regression weights with or without measurement error. Psychological Bulletin, 83,1007–1013.
300 BYRNE
Dow
nloa
ded
by [
Uni
vers
ity o
f G
roni
ngen
] at
02:
37 1
9 D
ecem
ber
2011
![Reactor Physics: Multigroup Diffusion · Reactor Physics: Multigroup Diffusion 6 This work is detailed in [GARLAND1975] but for the present discussion, the main point to note is the](https://img.dokumen.tips/doc/110x75/5e38d3c86fdaec5c757d1316/reactor-physics-multigroup-reactor-physics-multigroup-diffusion-6-this-work-is.jpg)


![NOTES ON SCALE-INVARIANCE AND BASE-INVARIANCE FOR … · arXiv:1307.3620v1 [math.PR] 13 Jul 2013 NOTES ON SCALE-INVARIANCE AND BASE-INVARIANCE FOR BENFORD’S LAW MICHAŁ RYSZARD](https://img.dokumen.tips/doc/110x75/5aee16367f8b9a45569086fd/notes-on-scale-invariance-and-base-invariance-for-13073620v1-mathpr-13-jul.jpg)