Embed Size (px)
Citation preview
Multigroup Ethnic Identity MeasureScores in a Sample of Adolescents
From Zimbabwe
Frank C. WorrellDepartment of Psychology
University of California, Berkeley
Liza M. Conyers, Elias Mpofu, and Beverly J. VandiverDepartment of Education
The Pennsylvania State University
This study examined the structural validity of scores on the 20-item Multigroup Eth-nic Identity Measure (MEIM; Phinney, 1992) in a group of 196 students attendingsecondary school in Zimbabwe. MEIM scores yielded 2 factors (Ethnic Identity, orEI, and Other Group Orientation, or OGO) as in previous studies, with the EI factorbeing more viable. Factor analysis of the 14 EI items resulted in a single factor, incontrast to findings of previous studies. The authors suggested that the OGO factormay be less viable in majority groups, that the EI items may best be explained by asingle factor, and that the MEIM would benefit from more scale development work.
Erikson’s (1950, 1959, 1968) articulation of the adolescent identity crisis pro-pelled the construct of identity into the forefront of adolescent psychology.Erikson argued that identity was not solely a concept of the individual; rather, hebelieved that identity had a strong social component, as it is essentially developedin a social context. Thus, the identity search results in the question, “Who am I?,”as well as the question, “Who am I in this social context?” Erikson’s notions of thesocial context of identity development have been echoed by other theorists (e.g.,Bourne, 1978; Kelly & Hansen, 1987; Tajfel, 1978, 1981). This two-pronged as-pect of identity resulted in two relatively separate research strands. A number of
IDENTITY: AN INTERNATIONAL JOURNAL OF THEORY AND RESEARCH, 6(1), 35–59Copyright © 2006, Lawrence Erlbaum Associates, Inc.
Correspondence should be addressed to Frank C. Worrell, Cognition and Development, 4511Tolman Hall, Berkeley, CA 94720–1670. E-mail: [email protected]
researchers have focused their attention on ego identity or the individual side ofidentity (e.g., Marcia, 1966, 1980, 1983). Other researchers have focused on thesocial side of the identity, leading to research on a number of social identities, thetwo most prominent being racial identity (Cross, 1971, 1991; Helms, 1990;Parham & Helms, 1981; Sellers, Rowley, Chavous, Shelton, & Smith, 1997;Vandiver & Worrell, 2001) and ethnic identity (EI; e.g., Bernal & Knight, 1993;Phinney, 1990, 1992; Rumbaut, 1994). This article focuses on one of the mostcommonly used EI instruments, the Multigroup Ethnic Identity Measure (MEIM;Phinney, 1992). Specifically, we examined the reliability and structural validity ofMEIM scores in a sample from a cultural context outside of the United States.
EI
EI has been defined in a number of ways. One of the more frequently cited defini-tions is that of Tajfel (1981). He defined EI as an individual’s “knowledge of hismembership [in] a social group” and “the value and emotional significance at-tached to that membership” (p. 255). More recently, Phinney and her colleagues(e.g., Phinney, 1989, 1990, 1992, 1996; Phinney & Alipuria, 1990, 1996; Phinney,Cantu, & Kurtz, 1997; Phinney & Chavira, 1992; Phinney & Devich-Navarro,1997; Phinney & Onwughalu, 1996; Roberts, Phinney, Masse, Chen, Roberts, &Romero, 1999), who have been prolific contributors to the EI literature, defined EIin terms of specific components. In their view, EI consists of “a feeling of belong-ing to one’s group, a clear understanding of the meaning of one’s [group] member-ship, positive attitudes towards the group, familiarity with its history and culture,and involvement in its practices” (Phinney et al., 1994, p. 169).
The social components of both definitions are clear. There is one aspect of EI,however, that is often taken for granted: This construct is only salient in societieswhere multiple ethnic groups are in contact with each other. In an ethnically ho-mogenous society, EI “is a virtually meaningless concept” (Phinney, 1990, p. 501).Thus, EI is typically studied in pluralistic or diverse societies. In the 1960s, in-creasing numbers of ethnic minorities and an increased emphasis on social andethnic consciousness and pride resulted in a greater emphasis on the constructs ofracial and EI in the United States. Phinney described the combination of circum-stances in this way:
Attitudes toward one’s ethnicity are central to the psychological functioning of thosewho live in societies where their group and its culture are at best poorly represented(politically, economically, and in the media) and are at worst discriminated against oreven attacked verbally and physically; the concept of ethnic identity provides a wayof understanding the need to assert oneself in the face of threats to one’s identity.(p. 499)
36 WORRELL, CONYERS, MPOFU, VANDIVER

This description is also in keeping with Erikson’s (1950) contention that identitydevelopment would be particularly difficult for African Americans, given the soci-etal discrimination against the group.
The social context for this study was Zimbabwe, an independent nation in WestAfrica and former British colony. This country was chosen because one of the re-searchers is a national of that country and was interested in exploring the conceptof EI in that cultural context, one in which the structural validity of MEIM scoreshad not previously been examined. Moreover, examination of the structure of theMEIM in the United States has often included multiple racial and ethnic groups(e.g., Phinney, 1992; Roberts et al., 1999; Spencer, Icard, Harachi, Catalano, &Oxford, 2000; Worrell, 2000; Yancey, Aneshensel, & Driscoll, 2001), In Zimba-bwe, however, 98% of the population is of African descent, and all other groupsmake up less than 1%. Thus, this study allowed us to examine MEIM scores in a ra-cially homogenous context.
In addition, the study provided an opportunity to contribute to an ongoing de-bate in the extant literature on the structure of MEIM scores, a debate that is impor-tant to both theorists and empirical researchers. Although scale development re-search can provide support for or suggest revisions to theoretical models (e.g.,Vandiver, Fhagen-Smith, Cokley, Cross, & Worrell, 2001), these types of studiesare often published in measurement journals where they may not be seen by manyresearchers examining the construct that they are based on. To provide the broadercontext for the study, we first discuss the development of the MEIM and psycho-metric studies of MEIM scores both within and outside the United States.
DEVELOPMENT OF THE MEIM
In response to the need for a measure of EI “that can be used with diverse popula-tions” and “to study and compare the role of EI in development,” Phinney (1992, p.158) developed the MEIM. The MEIM is unique in that it uses the same questionsto measure EI within and between ethnic groups. Fourteen questions on the MEIMwere developed to measure three related aspects of EI: Ethnic Affirmation and Be-longing (5 items), Ethnic Identity Achievement (7 items), and Ethnic Behaviors (2items). An additional 6 items were developed to measure Other Group Orientation(OGO), or the general responses that members of one ethnic group have towardgroups other than their own. Phinney noted that “attitudes toward other groups arenot part of ethnic identity, but they may interact with it as a factor in one’s socialidentity in the larger society” (p. 161), and that this interaction was particularly im-portant for minority groups. This contention is in keeping with the notion that EI isa social construction that is framed in response to other social groups. From a theo-retical standpoint, then, Phinney expected MEIM scores to yield a four-factorstructure, with three EI factors and the OGO factor.
MEIM SCORES IN ADOLESCENTS FROM ZIMBABWE 37
Phinney (1992, p. 165) conducted an exploratory factor analysis (EFA) of the20 items in both a high school and a college-aged sample using a principal axis ex-traction procedure and the “proportion criterion” to determine the number of fac-tors to extract. The high school sample consisted of 417 students, 44% of whomwere male, ranging in age from 14 to 19 years old. These students were from di-verse socioeconomic backgrounds and included Asian Americans (32%), AfricanAmericans (31%), Hispanic Americans (21%), Americans from mixed back-grounds (10%), European Americans (3%), and students who chose the “other”category (2%). The college sample consisted of 136 participants (35% male) rang-ing in age from 18 to 34 years old. These students also came from diverse socio-economic backgrounds and were all enrolled in introductory psychology coursesat a large urban university. The college sample was made up of 43% HispanicAmericans, 26% Asian Americans, 17% European Americans, 8% African Amer-icans, and 6% of mixed background.
Phinney (1992) reported that the proportion criterion suggested three factors forthe high school sample and five factors for the college sample. Both the highschool and college samples, however, yielded two interpretable factors: one factormade up of the 14 EI items and a second factor consisting of the 6 items measuringOGO. Internal consistency estimates for scores were in the high range for EI(.81–.90) and in the moderate range for OGO (.71–.74). An examination of thethree hypothesized EI factors indicated intercorrelations ranging from .46 to .79.Phinney commented that “the results from the two samples combined suggest asingle factor for ethnic identity and a distinct factor for other-group orientation” (p.166), and she concluded that “ethnic identity appeared to consist of a single factor,including three intercorrelated components” (p. 169).
Not surprisingly, the publication of the MEIM (Phinney, 1992) resulted in anexplosion of research in this area. A search of the PsycInfo database in early 2004using MEIM as the keyword yielded 48 studies—on average, four studies a year forthe last 12 years—and PsycInfo probably does not retrieve all of the studies thatuse the MEIM—for example, two presentations at the 2002 convention of theAmerican Psychological Association (Kovach & Hillman, 2002; Weber &Castillo, 2002). At this point, the MEIM may be the most frequently used measurein quantitative examinations of EI in the research literature.
WHAT CONSTITUTES THE MEIM ANYWAY?
Tworelateddevelopmentshaveresulted ina lackofclarityaboutwhatconstitutes theMEIM and what it measures. First, factor analytic evidence and conclusions not-withstanding (Phinney, 1992), some studies using the MEIM have reported on thethreeEIcomponentsas separatevariablesand treated themasconstructs in theirownright (e.g., Phinney & Devich-Navarro, 1997). The use of the three EI scores is prob-
38 WORRELL, CONYERS, MPOFU, VANDIVER

ably not surprising in retrospect. Indeed, after reporting the results of the factor anal-ysis in the1992 article, Phinney (p. 167) proceeded to report means and standard de-viations for the three EI subscales, and she compared the college and high schoolstudents on these subscales as well as on the global scale with t tests.
The second development involves the number of items on the MEIM. Again,contradicting the results presented in the original validation article (Phinney,1992), several studies using the MEIM have described it as a 14-item measure(e.g., Phinney & Devich-Navarro, 1997; Phinney et al., 1994; Phinney, Ferguson,& Tate, 1997), even though these researchers cite the 1992 study as their source.Moreover, even within the studies that discuss the MEIM as a 14-item measure,there are differences about the number of factors that should be interpreted. For ex-ample, Phinney et al. (1994) noted that “although the three aspects of ethnic iden-tity measured by the scale are conceptually separate, factor analysis revealed thatthey all load on the same factor. Therefore, they were not analyzed separately” (p.175). Similarly, Phinney et al. (1997) acknowledged the components of the EI, butused the EI factor in their analyses. Phinney and Devich-Navarro, however, re-ported means and standard deviations for the three EI subscales—attitudes, behav-iors, and achievement—but not for the global EI subscale.
What Should We Measure When Studying EI?
These studies raise measurement concerns about the structure of the MEIM thatcan be answered empirically. They also raise questions, however, about studyingthe role of attitudes toward ethnic groups other than one’s own as an aspect of EI. Ifwe accept the contention that EI is only salient in the context of a society with mul-tiple ethnic groups (Phinney, 1990), it follows that an examination of EI attitudesshould include an examination of attitudes toward ethnic groups other than one’sown (Phinney, 1992; Phinney et al., 1997).
From this premise, we can conclude that a full examination of attitudes relatedto EI can lead to at least four major groupings of individuals: high EI and highOGO, high EI and low OGO, low EI and high OGO, and low EI and low OGO.Moreover, it is plausible that individuals falling into different quadrants will en-gage in different behaviors, suggesting that all of the quadrants are worthy of in-vestigation. Research on racial identity has resulted in similar groupings. For ex-ample, studies on the nigrescence model by Cross and his colleagues (e.g.,Schaefer & Worrell, 2003; Vandiver, Cross, Worrell, & Fhagen-Smith, 2002;Worrell, Vandiver, Schaefer, Cross, & Fhagen-Smith, 2003) have delineated atti-tudes that reflect these four quadrants: multicultural attitudes reflective of a strongorientation toward one’s own racial group (high–high); Afrocentric attitudes re-flecting a strong orientation to Black culture and a low orientation toward Whiteculture (high–low); assimilation attitudes, which downplay the importance ofBlack culture but highlight majority culture (low–high); and low race salience atti-
MEIM SCORES IN ADOLESCENTS FROM ZIMBABWE 39

tudes, which downplay the significance of race across the board (low–low). Thus,Phinney’s (1992) inclusion of both EI and OGO attitudes on the MEIM is in keep-ing with theorizing about social identities, in general, and is supported by empiri-cal research examining racial identity.
USING FACTOR ANALYSIS TO ESTABLISHCONSTRUCT VALIDITY
Before recommending an instrument for use in either research or practice, it is im-portant to examine the construct validity of the instrument’s scores—that is, does theinstrument measure what it should be measuring? Construct validity is based on apreponderance of evidence (Benson, 1998), including evidence about the reliabilityand structural validity of the scores with the populations of interest. Most studies us-ing scales provide internal consistency estimates for the scores. Although reliabilityis important, however, high internal consistency estimates only tell us that individu-als’responses to items tend to be similar, but they do not speak to the dimensionalityor structure of those scores (Goodwin & Goodwin, 1999; Schmitt, 1996). To deter-mine the structure of an instrument’s scores, one must use a procedure like factoranalysis (Clark & Watson, 1995; John & Benet-Martinez, 2000).
Factor analysis is a data-reduction procedure that allows a larger number ofitems or operationalized variables to be summarized into some smaller number ofcreated variables or factors by using the covariation among the observed variablesto create latent variables or factors from groups of observed variables that covary(Tabachnick & Fidell, 2001). For example, Phinney (1992) examined participants’responses to 20 items and concluded that these 20 items could be summarized bytwo factors. To the extent that factor analytic results mirror hypotheses generatedby a theory, they provide general construct validity support for the theory andstructural validity support for the items operationalizing the theory. Because factoranalysis uses the correlations among the observed variables or items to create thefactors, changing the wording of items on a scale can potentially change the factorstructure, especially if participants’ responses to items are determined by the con-text of that item, and changing the number of items on the scale changes the corre-lation or covariance matrix from which the factors are created, which can lead to adifferent factor structure emerging.
VALIDITY STUDIES OF THE MEIM
The version of the MEIM that was validated in 1992 consisted of 20 items, andthere is supporting evidence for this contention. First, the theoretical framework
40 WORRELL, CONYERS, MPOFU, VANDIVER

proposed by Phinney (1992) acknowledged the importance of attitudes toward oth-ers in understanding EI, and items were developed to measure these attitudes. Sec-ond, the OGO items (4, 7, 9, 15, 17, and 19) were interspersed among the EI (1, 2,3, 5, 8, 10, 11, 12, 13, 14, 16, 18, and 20) items on the measure. Third, one of thehypothesized EI subscales, Ethnic Behaviors, consisted of only two items—that is,too few to be considered a viable subscale or factor (Floyd & Widaman, 1995).Fourth, the factor analyses that were conducted used the correlation matrix fromall 20 items; thus, the resultant factor structure was based on 20 items and not 14.Finally, Phinney acknowledged the two-factor structure based on 20 items in theresults and discussion of the study, as well as in the scoring for the MEIM pre-sented in Appendix B (pp. 172–173).
More recent factor analytic work on the MEIM has produced mixed evidenceon the structure of the EI construct, in part due to the use of different versions of theinstrument and different factor analytic strategies. To help keep the distinction be-tween the two versions of the instrument clear, in this article, the 20-item versionwill be referred to as the original MEIM (MEIM-O), and the 14-item version willbe referred to as the reduced MEIM (MEIM-R).
Structural Validity of the MEIM-O
In addition to Phinney’s (1992) study, three studies (Lee, Falbo, Doh, & Park,2001; Ponterotto, Gretchen, Utsey, Stracuzzi, & Saya, 2003; Worrell, 2000) haveexamined the factor structure of MEIM-O scores with adolescents or young adults.Worrell examined MEIM-O scores in a sample of 275 academically talented, highschool-aged adolescents (53% Asian American, 21% White, 8% African Ameri-can, 8% Hispanic, and 5% Mixed) using EFA. Based on principal axis extraction(Comrey, 1988; Floyd & Widaman, 1995) and multiple criteria, including parallelanalysis, to determine the number of factors to extract (MacCallum, Widaman,Zhang, & Hong, 1999; Thompson & Daniel, 1996), he reported findings almostidentical to Phinney’s original analyses. Worrell found a 14-item EI factor and a6-item OGO factor, with reliability estimates of .89 and .76, respectively, salientloadings ranging from .35 to .77, and no cross-loadings above .22. Worrell also re-ported that an oblique rotation indicated that “the two factors were not appreciablycorrelated (r = .006)” (p. 442).
Lee et al. (2001) examined the MEIM-O in two independent samples: 120 Ko-rean Americans and 182 Korean Chinese. They used principal component analysis(PCA) with varimax (orthogonal) rotation and restricted the extraction to two fac-tors. Scores from both samples resulted in two factors that could be labeled EI andOGO. EI and OGO, however, consisted of 12 and 8 items, respectively, in the Ko-rean American sample and 13 and 7 items in the Korean Chinese sample. Elimi-nating 5 items for cross-loading in one of the samples or loading differentially
MEIM SCORES IN ADOLESCENTS FROM ZIMBABWE 41

across samples resulted in a revised instrument with a 9-item EI factor and a 6-itemOGO factor. Lee et al. found group differences between the two samples, but noitem bias across the groups.
More recently, Ponterotto et al. (2003) began with confirmatory factor analysis(CFA) procedures to examine MEIM-O scores in a sample of 219 high school ju-niors and seniors (85% White, 6% Pacific Islander/Asian, 5% Hispanic, and lowerpercentages of all other groups). Unlike EFA, CFA procedures allow the re-searcher to specify the model being tested and provide goodness-of-fit statistics toevaluate the fit. These researchers compared the two-factor structure obtained byPhinney in 1992 with a unidimensional model obtained by Reese, Vera, andPaikoff (1998), who used modified MEIM-O items with an elementary schoolsample. Based on the accepted standards for CFAs, neither model fit the data well,although the two-factor model did result in a better fit. A subsequent EFA of thedata using extraction and rotation procedures used by Phinney (1992) did yield atwo-factor structure comparable to Phinney’s, with the loadings on the EI factor(.46–.78, Mdn = .61) being considerably more robust than the loadings on theOGO factor (.21–.61, Mdn = .34).
Structural Validity of the MEIM-R
Three studies have examined the structure of MEIM-R items in relatively large, di-verse adolescent samples in large urban areas (Roberts et al., 1999; Spencer et al.,2000; Yancey et al., 2001), and one study used an ethnically diverse sample ofAsian American college students (Lee & Yoo, 2004). Roberts et al.’s sample con-sisted of 5,423 early adolescents (14% White) attending middle schools in Hous-ton, Spencer et al.’s sample was made up of 2,184 early adolescents (32% White)attending middle schools in Seattle, Yancey et al.’s used 847 adolescents (20%White) in Los Angeles county, and the study by Lee and Yoo combined data setsfrom three studies to yield a sample of 323 participants from universities in Texasand California. The three studies of adolescents yielded similar findings. Robertset al. reported a two-factor structure consisting of 12 of the 14 items, with a 7-itemfactor labeled Affirmation, Belonging, and Commitment and a five-item factor la-beled Exploration and Ethnic Behaviors. Spencer and his colleagues reported find-ing a 7-item factor, which they labeled Identification, and a 6-item factor, whichthey labeled Exploration. Yancey et al.’s findings yielded a two-factor structurebased on 10 items: a 4-item factor labeled Participation and a 6-item factor labeledAffirmation and Belonging.
Eight of the 14 items loaded on the same factors across the three studies that re-ported two-factor structures: The 2 Ethnic Behavior items and 3 of the 7 EthnicAchievement items loaded on one factor, and 3 of the 5 Affirmation items loadedon the other factor. These similarities also apply to two of the three factors in theLee and Yoo (2004) study. Across the four studies, 7 of the 14 EI items loaded on
42 WORRELL, CONYERS, MPOFU, VANDIVER

the same factor (see Table 1), whereas 8 of the items failed to achieve a salient co-efficient in at least one study or did not load on the similar factors across studies. Inaddition, there are also a number of caveats when comparing these findings toPhinney’s (1992) original study. First, as indicated earlier, the correlation matrixwas based on 14 rather than 20 items. Second, both Spencer et al. (2000) andYancey et al. (2001) made changes to the 14 items as well. Spencer et al. changedthe response option from a 4-point Likert scale to a 3-point Likert scale, a proce-dure that can result in a decrease in reliability (Comrey, 1988), and Yancey et al.modified the questions so that the generic phrase, “my ethnic group,” was replacedby the EI that the student claimed. This change may highlight ethnic group mem-bership in a way that the original questions do not.
Third, in the studies yielding two-factor solutions, the structure coefficients re-ported differed substantially. For example, Spencer et al. (2000) obtained twoclean factors by setting the structure coefficient floor for salience at .55, whereasYancey et al.’s (2001) salient items went as low as .39. Using a .40 cutoff, 6 of the13 items in the Spencer et al. study had salient loadings on both factors (see Table1). Fourth, across the four studies, the correlation between the two factors rangedfrom .38 to .75, leading Spencer et al. to speculate that the EI items may represent asingle scale. Fifth, the studies reported accepting differing numbers of items from10 (Yancey et al., 2001) to 14 (Lee & Yoo, 2004). The Lee and Yoo study also used
MEIM SCORES IN ADOLESCENTS FROM ZIMBABWE 43
TABLE 1Hypothesized and Empirical Assignments of MEIM-R Items
ItemHypothesized
Phinney (1992)aRoberts et al.
(1999)Spencer et al.
(2000)Yancey et al.
(2001)Lee & Yoo
(2004)
6 Affirmation Affirmation Identification Affirmation Pride11 Affirmation Affirmation Identificationb Affirmation Clarity14 Affirmation Affirmation Identification Affirmation Pride18 Affirmation Affirmation Identificationb Affirmation Engagementb
20 Affirmation Affirmation Identification Affirmation Pride1 EI Achievement Exploration Exploration Participation Engagement3 EI Achievement Affirmation Identificationb No Loading Clarity5 EI Achievement Exploration Exploration No Loading Engagement8 EI Achievement No Loading No Loading No Loading Clarity
10 EI Achievement No Loading Exploration No Loading Clarity12 EI Achievement Affirmation Identificationb Affirmation Clarity13 EI Achievement Exploration Explorationb Participation Engagement2 Ethnic Behaviors Exploration Exploration Participation Engagement
16 Ethnic Behaviors Exploration Explorationb Participation Engagement
Note. Items in bold had salient loadings on similar factors in all four studies. MEIM-R = reducedmultigroup ethnic identity measure; EI = ethnic identity.
aAll times loaded on one factor in this study. bHad salient loadings (i.e., > .40) on two factors.

principal components analysis rather than common factor analysis, and the resul-tant inclusion of error variance in this study may be one of the reasons that the find-ings diverged from the other three studies. Finally, although three of the studies re-ported on some type of confirmatory analysis, none compared the fit of the itemson a single factor to their two-factor structures; rather, they all reported on theinvariance of the two-factor structure across groups. Similarly, none of the studieshas used scores on the 20 items to compare a one-, two-, three-, and four-factorstructure.
EI AND OGO ATTITUDES IN MAJORITYAND MINORITY GROUPS
Phinney (1990) noted that context is important for understanding EI. For exam-ple, as stated previously, EI is believed to be more salient in societies with multi-ple ethnic groups and of greater importance to minority groups than to membersof the majority group. Although the research on this question is still limited,some of the findings in the literature seem to support this contention. For exam-ple, Phinney and Alipuria (1990) reported significantly higher EI search scoresfor African American, Asian American, and Mexican American college studentsthan for their White counterparts. Ethnic group comparisons based on MEIMscores resulted in similar findings. Asian, Black, Hispanic, and Mixed highschool students obtained significantly higher EI scores than their White counter-parts (Phinney, 1992), and Black students obtained higher EI scores than Whitesand Hispanics in the college sample. The 1992 study had very small samples forsome ethnic groups, however—12 Whites in the high school sample and 11Blacks in the college sample. More recent studies with larger sample sizes (e.g.,Phinney et al., 1994, 1997) resulted in similar findings, with effect sizes in themoderate to high range.
Although EI attitudes seem to be less salient in majority group members, it isprobable that OGO attitudes are even less salient, because members of the ma-jority seldom have to accommodate to the wishes of the minority. Moreover,some majority group members (e.g., Jewish Americans, Irish Americans) mayhave potentially strong ethnic ties. Thus, one can hypothesize that the OGO fac-tor will be less viable in majority samples than in minority samples. Unfortu-nately, most factor analytic studies of the MEIM have used ethnically diversesamples, with majority group members a minority of the samples. Ponterotto etal.’s (2003) study, with an 85% White group, is the only exception, and in thisstudy, the OGO factor was not viable—indeed, three of the six OGO items ob-tained factor loadings of less than .35.
44 WORRELL, CONYERS, MPOFU, VANDIVER

THIS STUDY
In sum, the evidence on the MEIM has been fairly consistent across a number ofstudies. Structural validity analyses of the MEIM-O in four majority ethnic minor-ity samples (Lee et al., 2001; Phinney, 1992; Worrell, 2000) yielded a relatively ro-bust two-factor structure. In contrast, the single study of the MEIM-O’s structurewith a mostly majority sample resulted in a strong EI factor and a substantiallyweaker OGO factor. Studies of MEIM-R scores have provided less consistent sup-port, with three studies yielding slightly different two-factor structures, and onestudy resulting in a three-factor structure. To date, no studies have examined thestructure of both the MEIM-O and the MEIM-R in the same sample. Finally, inmost of the studies that have examined ethnic group differences on the EI score,majority group members have obtained significantly lower scores than their mi-nority counterparts.
Several research questions were addressed in this study. First, we examined thestructural validity and internal consistency of MEIM-O scores in a sample of ado-lescents in Zimbabwe. Second, we examined the structure of scores on theMEIM-R in the same sample, in response to the studies that yielded more than onefactor when only the EI items are analyzed. A third question concerned the viabil-ity of the MEIM-O’s OGO factor in this population. Whereas the majority of thesamples used in previous examinations of MEIM-O scores were ethnic minorities,the sample used in this study were mostly members of the majority group in thatsociety. We expected to find support for the two-factor structure for MEIM-Oscores in keeping with previous research, but we believed that the OGO factormight prove to be less robust in this context. With regard to the MEIM-R, aone-factor structure was hypothesized, with the caveat that if a two-factor structurewas found, the intercorrelation between the two factors would be substantial (i.e.,greater than .50).
METHOD
Participants
The participant pool consisted of 211 students attending four secondary schools inan urban area in Zimbabwe. Fifteen participants were eliminated due to missingdata on demographic variables (e.g., sex, age). Fifty-two percent of the final groupof 196 were boys (n = 102). Ages ranged from 14 to 18, with a mean age of 15.7years (SD = .78). Seventy-six percent of the participants (n = 149) wrote in Blackin response to the question on race, and 24% wrote in African—however, all par-ticipants were of African descent. Although all of the children were being schooled
MEIM SCORES IN ADOLESCENTS FROM ZIMBABWE 45

in English and were fluent in that language, only 2% (n = 4) indicated that Englishwas the language of the home. Participants reported 30 different home languages,with Zezeru (49.9%), Manyika (9.7%), Mananyka (7.7%), and Korekore (6.6%)being the most frequently used home languages. The majority of the participants(96%) were Shona, the largest ethnic group in Zimbabwe, constituting 82% of thepopulation. The average level of education was some high school for both mothersand fathers, with the modal education level being some middle school for fathersand some high school for mothers. Participants reported that 10% of their fathersand 5% of their mothers had college degrees.
Materials
All participants completed a packet of measures, including the 20-item MEIM(Phinney, 1992) and some demographic questionnaire. The MEIM consists of the14 EI items and 6 OGO items. All MEIM items were rated on a 4-point Likert scaleranging 1 (strongly disagree), 2 (somewhat disagree), 3 (somewhat agree), to 4(strongly agree). Four of the 20 items have to be recoded as they are worded nega-tively. Factor analyses conducted on the 20-item scale in three independent sam-ples (Phinney, 1992; Worrell, 2000) have consistently yielded two factors: an EIfactor and an OGO factor, with reliability estimates of scores being higher for EI(.81 ≤ α ≤ .90) than for OGO (.71 ≤ α ≤ .76). The demographic questions related toinformation on home language, gender, race, age, and grade level.
Procedure
MEIM items were included in a larger packet of measures, and students were in-formed that the questionnaires were to be completed anonymously and that com-pleting the packet was optional. Questionnaires were completed in class, and com-pleted questionnaires were placed in an envelope and handed in to one of theresearchers. Students were able to ask questions if they did not understand a ques-tion. The study was approved by the institutional review board of the PennsylvaniaState University.
RESULTS
EFAs were used for a number of reasons. First, the MEIM was being examined inthis population for the first time. Second, the factor analyses involving the MEIMthat have been reported in the literature have produced slightly different results.Third, given 20 items, a sample size of 200 is the minimum recommendation for anEFA (Comrey, 1988; Comrey & Lee, 1992; Gorsuch, 1983; Streiner, 1994), andwith the potential increase in parameters to estimate in CFAs, an even larger sam-
46 WORRELL, CONYERS, MPOFU, VANDIVER
ple size would be needed. Fourth, recent work in this area (e.g., MacCallum et al.,1999) has indicated that communality levels and ratio of variables to factors alsoaffect obtaining a convergent and admissible solution. The communality estimatesof the MEIM items in this study ranged from .24 to .65 (Mdn = .36), putting themin the low range. MacCallum et al. reported that, with low communality estimates(i.e., in the .2–.4 range) and a 20:3 variable to factor ratio, sample sizes of 100 re-sult in acceptable EFA solutions 97.1% of the time, and sample sizes of 200 resultin acceptable solutions 100% of the time, providing support for the EFA of the datain this study.
Structure of the MEIM-O
An initial principal axis factor analysis of the 20 MEIM resulted in a KxxxxMxxxx Oxxxx (KMO) Measure of Sampling Adequacy of .79; a significant Bart-lett’s Test of Sphericity (BTS) = 777.51 (190), p < .001; and seven eigenvaluesgreater than 1.Parallel analysis, however—recommended by Thompson and Dan-iel (1996)—using tables provided by Lautenschlager (1989) and MacParallel(Watkins, 2000) as well as the scree test indicated that two factors should be re-tained. A two-factor solution was extracted (8 iterations required), and bothoblique and orthogonal rotations were examined. The results of the two rotationoptions were very similar, and results of the oblique rotation are presented in Table2. The rotated two-factor solution accounted for 24% of the variance. Factor I con-sisted of 12 items with structure coefficients greater than .30 (Floyd & Widaman,1995) and was labeled Ethnic Identity; the five items making up Factor II withstructure coefficients greater than .30 were labeled Other Group Orientation. Onlythree of the five items loading on Factor II had coefficients greater than .40. Thetwo factors were not correlated (r = –.001). Two EI items and 1 OGO item did notload on any factor, with loadings of less than .30 on both factors. No item was cor-related with the factor with which it was not associated beyond r = .26.
In addition to the structure coefficients for the items, Table 2 contains the meansand standard deviations for the 20 items and reliability estimates for the two fac-tors. Means ranged from 2.35 to 3.68, indicating that participants typically re-sponded with relatively high ratings on the 1–4 rating scale. These means(2.71–3.77) are comparable to those reported by Worrell (2000, p. 442). Reliabilityestimates of scores on the two factors based on Cronbach’s alpha were .81 and .54for EI and OGO, respectively, and construct reliability estimates based on salientloadings were similar. Item intercorrelations are presented in Table 3. Correlationsamong items that were salient with the same factor were generally in the low tomoderate range for Factor I (.09 = r = .51, Mdn r = .25) and Factor II (.02 = r = .31,Mdn r = .23), and correlations among items that were salient with opposite factorswere even lower.
MEIM SCORES IN ADOLESCENTS FROM ZIMBABWE 47

48
TABLE 2Means, Standard Deviations, Reliability, and Structure Coefficients
of the Subscale Scores From Exploratory Factor Analysis
MEIM-O Items Factor I Factor II M SD
20. I feel good about my cultural or ethnic background. .69 –.06 3.17 1.0318. I feel a strong attachment toward my ethnic group. .67 –.12 2.80 1.0411. I have a strong sense of belonging to my own ethnic
group..66 –.09 3.09 1.03
12. I understand pretty well what my ethnic groupmembership means to me, in terms of how to relate tomy own group and other groups.
.64 .05 2.90 1.03
14. I have a lot of pride in my ethnic group and itsaccomplishments.
.54 .00 2.90 1.11
6. I am happy that I am a member of the group I belong to. .53 –.01 3.51 0.8716. I participate in cultural practices of my own group, such
as special food, music, or customs..50 .04 2.44 1.18
13. In order to learn more about my ethnic background, Ihave often talked to other people about my ethnicbackground.
.48 .03 2.64 1.14
1. I have spent time trying to find out more about my ownethnic group, such as its history, traditions, and customs.
.43 .05 2.80 1.06
3. I have a clear sense of my ethnic background and what itmeans to me.
.39 –.20 2.66 1.11
2. I am active in organizations or social groups that includemostly members of my own ethnic group.
.37 .04 2.35 1.10
10. I really have not spent much time trying to learn aboutthe culture and history of my ethnic group.
.36 .03 2.57 1.15
4. I like meeting and getting to know people from ethnicgroups other than my own.
.13 .58 3.02 1.15
9. I often spend time with people from ethnic groups otherthan my own.
–.01 .52 2.43 1.22
8. I am not very clear about the role of my ethnicity in mylife.
.26 –.41 2.44 1.11
17. I am involved in activities with people from other ethnicgroups.
.17 .40 2.63 1.18
19. I enjoy being around people from ethnic groups otherthan my own.
–.11 .34 2.43 1.13
7. I sometimes feel it would be better if different ethnicgroups didn’t try to mix together.
.03 .24 3.15 1.09
15. I don’t try to become friends with people from otherethnic groups.
.15 .18 3.68 0.68
5. I think a lot about how my life will be affected by myethnic group membership.
–.09 .13 2.49 1.20
Reliability coefficient 0.81 0.54Construct reliability (based on salient coefficients) 0.82 0.56
Note. N = 196. MEIM-O = original multigroup ethnic identity measure. Coefficients in excess of.32 and higher are italicized. Oblique rotation, factor intercorrelation = –.01.

49
TABLE 3Intercorrelations of the Original Multigroup Ethnic Identity Measure Items
Item 1 2 3 4 5 6 7 8 9 10 11 12 13 14 15 16 17 18 19 20
1 1.002 0.23 1.003 0.25 0.16 1.004 0.03 –0.11 –0.03 1.005 0.13 0.03 –0.06 –0.06 1.006 0.09 0.22 0.18 0.14 –0.09 1.07 0.04 –.04 –0.01 0.17 –0.05 –.08 1.008 0.03 0.11 0.18 –0.23 –0.07 .23 –0.17 1.009 –0.05 –.02 –0.11 0.31 0.05 –.02 0.09 –0.22 1.00
10 0.15 0.22 0.09 0.08 –0.08 .19 –0.04 0.13 –0.05 1.0011 0.23 0.19 0.26 0.06 0.00 .43 –0.03 0.15 –0.04 0.16 1.0012 0.20 0.19 0.34 0.12 2.13 .37 0.05 0.18 0.11 0.18 0.42 1.0013 0.30 0.27 0.27 0.08 –0.02 .17 0.02 0.04 –0.01 0.20 0.33 0.28 1.0014 0.27 0.11 0.16 0.04 –0.02 .33 0.03 0.13 0.01 0.25 0.35 0.35 0.22 1.0015 0.10 –.01 0.03 0.07 –0.05 .09 0.15 0.09 0.11 0.04 0.04 0.14 –0.02 0.19 1.0016 0.35 0.18 0.20 0.08 0.02 .22 –0.02 0.06 0.04 0.13 0.32 0.34 0.34 0.19 0.02 1.0017 0.16 0.20 –0.18 0.22 0.18 –.04 0.05 –0.02 0.24 0.17 0.04 0.15 0.03 0.07 0.23 0.10 1.0018 0.24 0.25 0.25 0.05 –0.12 .38 –0.12 0.25 –0.05 0.26 0.46 0.46 0.25 0.38 0.11 0.29 –0.09 1.0019 –0.05 –0.15 –0.02 0.27 0.13 –.01 0.04 –0.23 0.14 –0.02 –0.17 –0.07 –0.02 0.05 0.04 –0.06 0.03 –0.10 1.0020 0.30 0.21 0.26 0.03 –0.19 .35 0.04 0.14 –0.04 0.24 0.51 0.36 0.38 0.41 0.10 0.35 0.09 0.46 –0.07 1.00
Note. N = 196.

To examine if the EI factor would split into the meaningful components, as sug-gested by other researchers (e.g., Lee & Yoo, 2004; Phinney, 1992; Roberts et al.,1999), three- and four-factor solutions were also extracted. Factor I in thethree-factor orthogonal solution consisted of 7 EI items and 3 OGO items, Factor IIconsisted of 5 EI items and 1 OGO item, and Factor III was made up of 2 EI itemsand 1 OGO item. One OGO item cross-loaded on Factors I and III, and 1 of eachtype of item did not load on any factor. The results of the oblique rotation were al-most identical. The four-factor oblique and orthogonal solutions also resulted inmixed factors, with one of the four-factors consisting of only 2 items. Neither thethree- nor four-factor solution yielded Phinney’s hypothesized EI factors nor thefactors found by other researchers using the MEIM-R.
Structure of the MEIM-R
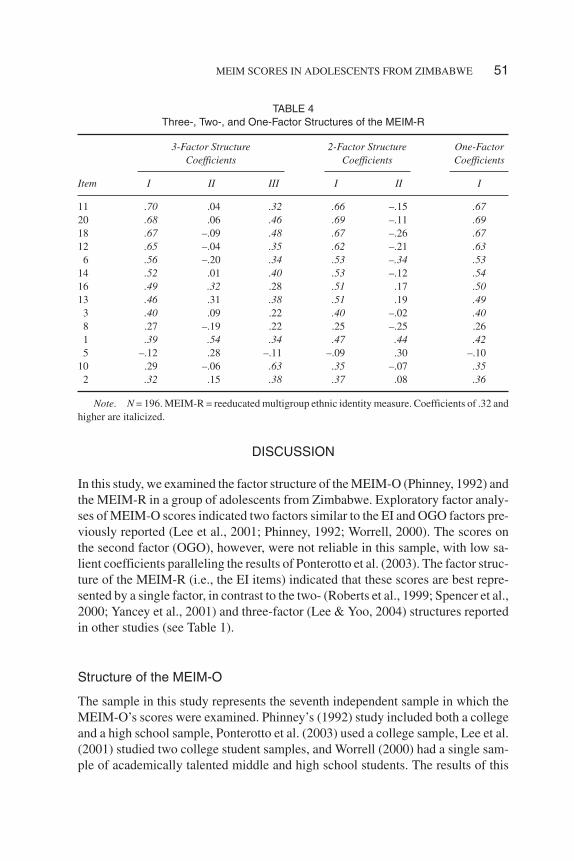
When the 14 EI items were examined, initial analyses revealed a KMO Measure ofSampling Adequacy of .86, a significant BTS = 557.26 (91), p < .001, and foureigenvalues greater than 1. Parallel analysis (Lautenschlager, 1989; Watkins,2000) indicated that one factor should be retained, and the scree test indicated twofactors. Given Phinney’s (1992) hypothesized structure and other recent results(Lee & Yoo, 2004; Roberts et al., 1999; Spencer et al., 2000), three-, two-, andone-factor solutions were examined with both orthogonal and oblique rotations forthe multifactor solutions. In the three-factor orthogonal solution, using .32 as theminimum level for salience, 8 of the 14 items loaded on Factor I, 7 items loaded onFactor II, and 1 item loaded on Factor III, with 5 items having salient coefficientson both Factors I and II. In the three-factor oblique solution presented in Table 4,11 items had salient structure coefficients on Factor I (using a liberal criterion; i.e.,greater than or equal to .32), 2 items on Factor II, and 10 items on Factor III. Bothsalient items on Factor II and 9 of the salient items on Factor III, however, also hadsalient structure coefficients on Factor I (see Table 4), and the Factor 1–Factor IIIintercorrelation was .57. Thus, the three-factor solution only had one viable factoron both the oblique and orthogonal solutions.
In the two-factor orthogonal solution, 10 items loaded on Factor I, and 7 itemsloaded on Factor 2. Five of the items were complex, however—that is, they loadedon both factors—making the solution difficult to interpret. A two-factor obliquesolution yielded one factor with 12 salient items and a second factor with only 2 sa-lient items, both of which also had salient structure coefficients on Factor I (see Ta-ble 4). Thus, the second factor was not viable. Extraction of a one-factor solution,which did not require rotation, yielded12 salient items with coefficients of at least.32. As can be seen in Table 4, Items 5 and 8 did not achieve salient loadings. Theseresults indicated that MEIM-R items are best represented by a single EI factor inthis sample.
50 WORRELL, CONYERS, MPOFU, VANDIVER
DISCUSSION
In this study, we examined the factor structure of the MEIM-O (Phinney, 1992) andthe MEIM-R in a group of adolescents from Zimbabwe. Exploratory factor analy-ses of MEIM-O scores indicated two factors similar to the EI and OGO factors pre-viously reported (Lee et al., 2001; Phinney, 1992; Worrell, 2000). The scores onthe second factor (OGO), however, were not reliable in this sample, with low sa-lient coefficients paralleling the results of Ponterotto et al. (2003). The factor struc-ture of the MEIM-R (i.e., the EI items) indicated that these scores are best repre-sented by a single factor, in contrast to the two- (Roberts et al., 1999; Spencer et al.,2000; Yancey et al., 2001) and three-factor (Lee & Yoo, 2004) structures reportedin other studies (see Table 1).
Structure of the MEIM-O
The sample in this study represents the seventh independent sample in which theMEIM-O’s scores were examined. Phinney’s (1992) study included both a collegeand a high school sample, Ponterotto et al. (2003) used a college sample, Lee et al.(2001) studied two college student samples, and Worrell (2000) had a single sam-ple of academically talented middle and high school students. The results of this
MEIM SCORES IN ADOLESCENTS FROM ZIMBABWE 51
TABLE 4Three-, Two-, and One-Factor Structures of the MEIM-R
Item
3-Factor StructureCoefficients
2-Factor StructureCoefficients
One-FactorCoefficients
I II III I II I
11 .70 .04 .32 .66 –.15 .6720 .68 .06 .46 .69 –.11 .6918 .67 –.09 .48 .67 –.26 .6712 .65 –.04 .35 .62 –.21 .63
6 .56 –.20 .34 .53 –.34 .5314 .52 .01 .40 .53 –.12 .5416 .49 .32 .28 .51 .17 .5013 .46 .31 .38 .51 .19 .493 .40 .09 .22 .40 –.02 .408 .27 –.19 .22 .25 –.25 .261 .39 .54 .34 .47 .44 .425 –.12 .28 –.11 –.09 .30 –.10
10 .29 –.06 .63 .35 –.07 .352 .32 .15 .38 .37 .08 .36
Note. N = 196. MEIM-R = reeducated multigroup ethnic identity measure. Coefficients of .32 andhigher are italicized.
study support the presence of two factors in MEIM scores, and as in the other studywith mostly majority group participants (i.e., Ponterotto et al., 2003), the OGOfactor was not as robust. Thus, the evidence to date strongly suggests that theMEIM-O is made up of a factor representing EI and one representing OGO.
There are two other issues that need to be raised about the two-factor structure.The first is specific to this study and concerns the relative weakness of the OGOfactor. As indicated earlier in this article, EI is a variable that is important in a di-verse social context. Phinney’s (1990) comments suggest that diversity is not theonly contextual factor that makes EI salient; in fact, she suggested that the psycho-logical importance of EI is tied to poor representation of one’s group in the broadersociety or even discrimination against your group by other groups in society. Herremarks, and the results of this study, suggest that attitudes toward one’s own eth-nic group and other ethnic groups in society become salient in response to a failureto achieve a dominant, or at least an equitable, position in society. We suspect,however, that even before discrimination or poor representation become wide-spread, ethnic identification occurs in situations where groups are clearly delin-eated through the development of in-group, out-group bias or other intergroup atti-tudes (Ng & Cram, 1988; Phinney et al., 1997).
In a country like Zimbabwe, where there is a clear and dominant majoritygroup, the EI attitudes of this group may not be salient, and their attitudes towardother groups even less so. This hypothesis explains both the small amount of vari-ance accounted for by the two factors—24% in this study, as opposed to 41% inWorrell (2000)—as well as the low factor loadings for OGO items and the low reli-ability estimates for OGO scores. It is possible that if EI questions were to activategroup membership on the basis of tribal affiliation or home language, one mightget a different response to EI questions. Also, EI may be quite salient for theNdebele who constitute 14% of Zimbabwe’s population or the 2% that constituteZimbabwe’s non-Black population.
The second issue raised by the MEIM-O’s two-factor structure is a broader one.The two factors were uncorrelated in this study, even though an oblique rotationwas used. These findings mirrored Worrell’s (2000)—Phinney (1992) did not re-port what type of rotation she used, and the other studies of the MEIM-O structureused orthogonal rotations. The lack of a relation between EI and OGO supports thecontention in the introduction that individuals can be low on both attitudes, high onboth attitudes, or low on one and high on another. In other words, having pro-EI at-titudes does not preclude you from having pro-OGO attitudes and vice versa.These findings mirror findings on African American racial identity attitudes. Instudies using the Cross Racial Identity Scale (Vandiver et al., 2000; Worrell,Vandiver, & Cross, 2001), researchers reported finding no meaningful relation be-tween Black Nationalist or Afrocentric attitudes and multicultural attitudes(Vandiver et al., 2001; Vandiver et al., 2002). Taken together, these findings sug-gest that being concerned with one’s heritage or cultural background does not pre-
52 WORRELL, CONYERS, MPOFU, VANDIVER
clude taking a meaningful interest in the cultural backgrounds of members of an-other group.
Structure of the MEIM-R
Contrary to the findings of four recent studies on MEIM-R items (i.e., Lee & Yoo,2004; Roberts et al., 1999; Spencer et al., 2000; Yancey et al., 2001), EI scores inthis study were best represented by a single factor. One plausible reason for the dis-crepancy could be the fact that this sample is not American and, furthermore, con-sists of the majority group in that social context. An analysis of MEIM-R scoresfrom Worrell’s (2000) study, however, based on an American sample with a major-ity of ethnic minority participants, were also best explained by a single factor.Twelve of the items in a forced two-factor structure were complex (i.e., loading onboth factors), and the correlation between the factors was .60. Moreover, Worrell’sdata set consisted of 275 participants, and the communality estimates were in themoderate range, suggesting that the solution should be acceptable (MacCallum etal., 1999).
The findings in this study, including the reanalysis of the data from Worrell(2000), raise questions about the multifactor structure of the EI items. The differ-ences in results may be due to differences in methodological approaches. First, allof the other studies used the eigenvalue rule to determine how many factors to ex-tract. There is considerable consensus among methodologists that the eigenvaluerule is the least accurate measure for determining the number of factors to extract(e.g., Bernstein & Teng, 1989; Floyd & Widaman, 1995; Gorsuch, 1997; Thomp-son & Daniel, 1996). Thompson and Daniel further indicated that “the simulta-neous use of multiple decision rules is appropriate and often desirable” (p. 200),and these decision rules should include the theoretical structure underlying the in-strument as well as previous empirical findings.
The second methodological concern focuses on the extraction methods used.Three of the studies (Lee & Yoo, 2004; Roberts et al., 1999; Spencer et al., 2000)used PCA rather than common factor analysis, and the third study (Yancey et al.,2001) used maximum-likelihood common factor analysis. Gorsuch (1983) arguedthat, with greater than 35 variables and communality estimates above .70, the dif-ferences between PCA and common factor analysis were negligible. Neither of thetwo studies that used principal component extraction methods reported theircommunality estimates, and, in any case, there are only 14 EI items. After compar-ing principal component and common factor analysis in a Monte Carlo study,Snook and Gorsuch (1989) made the following assessment: “Contrary to the con-clusions that the procedures give the same results, the present study indicates thatan empirical distinction does exist. Common factor analysis is a more accurateprocedure than component analysis” (p. 153) in studies with 9, 18, and 36 variablesand loadings of .40, .60, and .80 (see also Widaman, 1993). Bernstein and Teng
MEIM SCORES IN ADOLESCENTS FROM ZIMBABWE 53
(1989) also reported that maximum-likelihood procedures “paradoxically becomeeven more sensitive to [categorization] effects when multicategory ratings [i.e.,Likert scales] replace dichotomies” and that “PC [principal component] analysis isalso not immune to this problem” (p. 474).
A third concern is that, although three of the studies indicated that oblique rota-tions were used, the authors did not indicate if the coefficients that they reportedare from the pattern or structure matrix. This information is crucial to interpretwhat the coefficients actually mean. Fourth, although confirmatory analyses wererun in three studies, they were not used to test the relative fit of competing models,perhaps one of the most common (Bryant & Yarnold, 1995) functions of CFA inthe scale development process. Rather, they were used to test the invariance of onemodel across groups, an examination that may be premature given the findings inthis study and the CFA reported by Ponterotto et al. (2003). In sum, the findings onthe MEIM-O indicate that the scale is a promising measure of two factors (EI andOGO), but it will benefit from efforts to enhance it (e.g., more OGO items, itemswith higher loadings on the factors).
Limitations and Future Research
As with all studies, this one had a number of limitations. First, the scale was ad-ministered to the participants in English. Although they were being schooled inEnglish and purportedly fluent in the language, English was not the home languageof the majority of participants, and no measure of English fluency was used. Thus,it is possible that results may have been different if participants had been adminis-tered the MEIM in their home language, as in the Lee et al. (2001) study. A relatedconcern is that of cultural context. Even if the scale had been administered in par-ticipants’ home languages or if they were all fluent in English, language use is of-ten contextual, and there may be American nuances of the MEIM that are not evi-dent to people who live in another country. For example, what does the phrase, “myethnic group,” mean to Zimbabwean adolescents? Second, although 196 is just shyof 200, it would have been ideal to have a larger sample size for the study. Cer-tainly, replication of the study is warranted with supplemental interviews tocontextualize the results.
In addition to replicating this study, there are a number of possibilities for futureresearch in this area. Revisiting the MEIM with the intention of strengthening thepsychometric properties of the scores may be an important first step. The results ofthis study and several others suggest that some EI items are not making meaningfulcontributions to the EI factor, and the OGO factor needs to be strengthened. Thereis also a need to examine MEIM scores in individual ethnic groups to see if the fac-tor structure is invariant across ethnic groups—work that has been started by Rob-erts et al. (1999) and Yancey et al. (2001)—with the 14 EI items. Another struc-tural validity study that must be done is an examination of the competing models of
54 WORRELL, CONYERS, MPOFU, VANDIVER

the MEIM using CFA techniques, presumably after the scale’s properties are en-hanced. These types of studies can end the speculation about the number of factorsthat MEIM-O and MEIM-R scores represent. In fact, reanalysis of the large datasets used in Roberts et al., Spencer et al. (2000), and Yancey et al. using more ro-bust factor analytic procedures may be a first step in this direction.
Another potential study involves comparing the MEIM to measures of racialidentity like the Cxxxx Rxxxx Ixxxx Sxxxxv (Vandiver et al., 2000). Even thoughPhinney (e.g., Marshall, 1995; Phinney & Onwughalu, 1996) and others use ethnicand racial identity as synonyms, there is no empirical evidence indicating thatthese variables are interchangeable. As is, there are differences between two of themore prominent racial identity theories in the literature: nigrescence theory and themultidimensional model of racial identity (see Cross & Vandiver, 2001; Sellers etal., 1997; Vandiver et al., 2002). Moreover, recent work on nigrescence theory(Cross & Vandiver, 2001; Vandiver et al., 2002; Vandiver et al., 2001; Worrell,Cross, & Vandiver, 2001) suggested that the various racial identities are frames ofreference rather than stages and are not developmental, two characteristics that arestill hypothesized about EI constructs (Phinney, 1989, 1990, 1993; Phinney &Alipuria, 1990). As early as 1990, Helms (1990) argued that there are definite dis-tinctions between ethnic and racial identity, despite their apparent similarities, butthis claim has not received much attention in the empirical literature.
One other series of studies that need to be conducted involves examining the re-lations between MEIM scores and other important psychological variables. Al-though there are a number of studies that report correlations between MEIM scoresand a number of other variables, there is no evidence that EI is causative. For exam-ple, do the modest correlations found between EI and self-esteem (Phinney &Chavira, 1992) mean that higher levels of EI result in a more positive sense ofwell-being?
CONCLUSION
This study examined the structural validity of the MEIM-O and MEIM-R. In keep-ing with previous studies of the MEIM-O, the results indicated a two-factor struc-ture best explained MEIM scores. Contrary to previous research on the MEIM-R,however, the results of this study supported a single factor for EI item scores.Whether the differences in this study are the result of using a sample from the ma-jority group, the result of differences in the statistical methodologies that wereused, or some other factor will be best clarified by further research in this area. Thefindings indicate that there is still work to be done on the MEIM before we areclear on how the scores operate. These results add to a growing literature on theMEIM and on EI more generally. They also remind us, as did Cronbach and Meehl
MEIM SCORES IN ADOLESCENTS FROM ZIMBABWE 55

(1955) and Benson (1998), that construct validity is an ongoing process that drawson results from many samples and many types of evidence.
REFERENCES
Benson, J. (1998). Developing a strong program of construct validation: A test anxiety example. Edu-cational Measurement: Issues and Practice, 17(X), 10–22.
Bernal, M. E., & Knight, G. P. (Eds.). (1993). Ethnic identity: Formation and transmission among His-panics and other minorities. Albany, NY: SUNY Press.
Bernstein, I. H., & Teng, G. (1989). Factoring items and factoring scales are different: Spurious evi-dence for multidimensionality due to item categorization. Psychological Bulletin, 105, 467–477.
Bourne, E. (1978). The state of research on ego identity: A review and appraisal. Part I. Journal of Youthand Adolescence, 7(X), 223–251.
Bryant, F. B., & Yarnold, P. R. (1995). Principal-components analysis and exploratory and confirma-tory factor analysis. In L. G. Grimm & P. R. Yarnold (Eds.), Reading and understanding multivariatestatistics (pp. 99–136). Washington, DC: American Psychological Association.
Clark, L. A., & Watson, D. (1995). Constructing validity: Basic issues in objective scale development.Psychological Assessment, 7, 309–319.
Comrey, A. L. (1988). Factor-analytic methods of scale development in personality and clinical psy-chology. Journal of Consulting and Clinical Psychology, 56, 754–781.
Comrey, A. L., & Lee, H. B. (1992). A first course in factor analysis (2nd ed.). Hillsdale, NJ: LawrenceErlbaum Associates, Inc.
Cronbach, L. J., & Meehl, P. E. (1955). Construct validity in psychological tests. Psychological Bulle-tin, 52, 281–302.
Cross, W. E., Jr. (1971). The Negro-to-Black conversion experience. Black World, 20, 13–27.Cross, W. E., Jr. (1991). Shades of black: Diversity in African American identity. Philadelphia: Temple
University Press.Cross, W. E., Jr., & Vandiver, B. J. (2001). Nigrescence theory and measurement: Introducing the
Cross Racial Identity Scale (CRIS). In J. G. Ponterotto, J. M. Casas, L. A. Suzuki, & C. M. Alex-ander (Eds.), Handbook of multicultural counseling (2nd ed., pp. 371–393). Thousand Oaks, CA:Sage.
Erikson, E. H. (1950). Childhood and society (2nd ed.). New York: Norton.Erikson, E. H. (1959). Identity and the life cycle. New York: Norton.Erikson, E. H. (1968). Identity, youth and crisis. New York: Norton.Floyd, F. J., & Widaman, K. F. (1995). Factor analysis in the development and refinement of clinical as-
sessment instruments. Psychological Assessment, 7, 286–299.Goodwin, L. D., & Goodwin, W. L. (1999). Measurement myths and misconceptions. School Psychol-
ogy Quarterly, 14, 408–427.Gorsuch, R. L. (1983). Factor analysis (2nd ed.). Hillsdale, NJ: Lawrence Erlbaum Associates, Inc.Gorsuch, R. L. (1997). Exploratory factor analysis: Its role in item analysis. Journal of Personality As-
sessment, 68, 532–560.Helms, J. (1990). Black and White racial identity: Theory, research & practice. New York: Greenwood.John, O. P., & Benet-Martinez, V. (2000). Measurement: Reliability, construct validation, and scale
construction. In H. T. Reis & C. M. Judd (Eds.), Handbook of research methods in personality andsocial psychology (pp. 339–369). New York: Cambridge University Press.
Kelly, J. A., & Hansen, D. J. (1987). Social interactions and adjustment. In V. B. Van Hasselt & M.Hersen (Eds.), Handbook of adolescent psychology (pp. 131–156). New York: Pergamon.
56 WORRELL, CONYERS, MPOFU, VANDIVER
Kovach, B. S., & Hillman, S. B. (2002, August). African and Arab American achievement motivation:Effects of minority membership. Paper presented at the 110th annual convention of the AmericanPsychological Association, Chicago.
Lautenschlager, G. J. (1989). A comparison of alternatives to conducting Monte Carlo analyses for de-termining parallel analysis criteria. Multivariate Behavioral Research, 24, 365–395.
Lee, R. M., Falbo, T., Doh, H. S., & Park, S. Y. (2001). The Korean diasporic experience: Measuringethnic identity in the United States and China. Cultural Diversity and Ethnic Minority Psychology, 7,207–216.
Lee, R. M., & Yoo, H. C. (2004). Structure and measurement of ethnic identity for Asian American col-lege students. Journal of Counseling Psychology, 51, 263–269.
MacCallum, R. C., Widaman, K. F., Zhang, S., & Hong, S. (1999). Sample size in factor analysis. Psy-chological Methods, 4, 84–99.
Marcia, J. E. (1966). Development and validation of ego-identity status. Journal of Personality and So-cial Psychology, 3, 551–558.
Marcia, J. E. (1980). Identity in adolescence. In J. Adelson (Ed.), Handbook of adolescent psychology(pp. 159–187). New York: Wiley.
Marcia, J. E. (1983). Some directions for the investigation of ego development in early adolescence.Journal of Early Adolescence, 3, 15–223.
Marshall, S. (1995). Ethnic socialization of African American children: Implications for parenting, iden-tity development, and academic achievement. Journal of Youth and Adolescence, 24(X), 377–396.
Ng, S. H., & Cram, F. (1988). Intergroup bias by defensive and offensive groups in majority and minor-ity conditions. Journal of Personality and Social Psychology, 55, 749–757.
Parham, T. A., & Helms, J. E. (1981). The influence of Black students’ racial identity attitudes on pref-erence for counselor’s race. Journal of Counseling Psychology, 28, 250–258.
Phinney, J. S. (1989). Stages of ethnic identity in minority group adolescents. Journal of Early Adoles-cence, 9, 34–49.
Phinney, J. S. (1990). Ethnic identity in adolescents and adults: Review of research. Psychological Bul-letin, 108, 499–514.
Phinney, J. S. (1992). The Multigroup Ethnic Identity Measure: A new scale for use with diversegroups. Journal of Adolescent Research, 7, 156–176.
Phinney, J. S. (1993). A three-stage model of ethnic identity development in adolescence. In M. E.Bernal & G. P. Knight (Eds.), Ethnic identity: Formation and transmission among Hispanics andother minorities (pp. 61–79). Albany, NY: SUNY Press.
Phinney, J. S. (1996). When we talk about American ethnic groups, what do we mean? American Psy-chologist, 51, 918–927.
Phinney, J. S., & Alipuria, L. L. (1990). Ethnic identity in college students from four ethnic groups.Journal of Adolescence, 13, 171–183.
Phinney, J. S., & Alipuria, L. L. (1996). At the interface of cultures: Multiethnic/multiracial high schooland college students. Journal of Social Psychology, 136, 139–158.
Phinney, J. S., Cantu, C. L., & Kurtz, D. A. (1997). Ethnic and American identity as predictors ofself-esteem among African American, Latino, and White adolescents. Journal of Youth and Adoles-cence, 26(X), 165–185.
Phinney, J. S., & Chavira, V. (1992). Ethnic identity and self-esteem: An exploratory study. Journal ofAdolescence, 15, 271–281.
Phinney, J. S., & Devich-Navarro, M. (1997). Variations in bicultural identification among AfricanAmerican and Mexican American adolescents. Journal of Youth and Adolescence, 26(X), 165–184.
Phinney, J. S., DuPont, S., Espinosa, C., Revill, J., & Sanders, K. (1994). Ethnic identity and Americanidentification among ethnic minority youths. In A. Bouvy, F. J. R. van de Vijer, P. Boski, & P.Schmitz (Eds.), Journeys into cross-cultural psychology (pp. 167–183). Berwyn, PA: Swets &Zeitlinger.
MEIM SCORES IN ADOLESCENTS FROM ZIMBABWE 57

Phinney, J. S., Ferguson, D. L., & Tate, J. D. (1997). Intergroup attitudes among ethnic minority adoles-cents: A causal model. Child Development, 68, 955–969.
Phinney, J. S., & Onwughalu, M. (1996). Racial identity and perception of American ideals among Af-rican American and African students in the United States. International Journal of Intercultural Re-lations, 20, 127–140.
Ponterotto, J. G., Gretchen, D., Utsey, S. O., Stracuzzi, T., & Saya, R., Jr. (2003). The Multigroup Eth-nic Identity Measure (MEIM): Psychometric review and further validity testing. Educational andPsychological Measurement, 63, 502–515.
Reese, L. E., Vera, E. M., & Paikoff, R. L. (1998). Ethnic identity assessment among inner-city Afri-can-American children: Evaluating the applicability of the Multigroup Ethnic Identity Measure.Journal of Black Psychology, 24, 289–304.
Roberts, R. E., Phinney, J. S., Masse, L. C., Chen, Y. R., Roberts, C. R., & Romero, A. (1999). Thestructure of ethnic identity of young adolescents from diverse ethnocultural groups. Journal of EarlyAdolescence, 19, 301–322.
Rumbaut, R. G. (1994). The crucible within: Ethnic identity, self-esteem, and segmented assimilationamong children of immigrants. International Migration Review, 28, 748–794.
Schaefer, B. A., & Worrell, F. C. (2003, October). Profiles in racial identity: Empirically derived CRISclusters. In B. J. Vandiver (Chair), The Cross Racial Identity Scale: Examining multiple lines of evi-dence (pp. XX–XX). Paper presented at the 3rd annual Diversity Challenge, Boston.
Schmitt, N. (1996). Uses and abuses of coefficient alpha. Psychological Assessment, 8, 350–353.Sellers, R. M., Rowley, S. A. J., Chavous, T. M., Shelton, J. N., & Smith, M. A. (1997). Multidimen-
sional Inventory of Black Identity: A preliminary investigation of reliability and construct validity.Journal of Personality & Social Psychology, 73, 805–815.
Snook, S. C., & Gorsuch, R. L. (1989). Component analysis versus common factor analysis: A MonteCarlo study. Psychological Bulletin, 106, 148–154.
Spencer, M. S., Icard, L. D., Harachi, T. W., Catalano, R. F., & Oxford, M. (2000). Ethnic identityamong monoracial and multiracial early adolescents. Journal of Early Adolescence, 20, 365–387.
Streiner, D. L. (1994). Figuring out factors: The use and misuse of factor analysis. Canadian Journal ofPsychiatry, 39, 135–140.
Tabachnick, B. G., & Fidell, L. S. (2001). Using multivariate statistics (4th ed.). New York: Allyn &Bacon.
Tajfel, H. (1978). The social psychology of minorities. New York: Minority Rights Group.Tajfel, H. (1981). Human groups and social categories. Cambridge, England: Cambridge University
Press.Thompson, B., & Daniel, L. G. (1996). Factor analytic evidence for the construct validity of scores: A
historical overview and some guidelines. Educational and Psychological Measurement, 56,197–208.
Vandiver, B. J., Cross, W. E., Jr., Fhagen-Smith, P. E., Worrell, F. C., Swim, J., & Caldwell, L. (2000).The Cross Racial Identity Scale. Unpublished scale.
Vandiver, B. J., Cross, W. E., Jr., Worrell, F. C., & Fhagen-Smith, P. E. (2002). Validating the Cross Ra-cial Identity Scale. Journal of Counseling Psychology, 49, 71–85.
Vandiver, B. J., Fhagen-Smith, P. E., Cokley, K., Cross, W. E., Jr., & Worrell, F. C. (2001). Cross’nigrescence model: From theory to scale to theory. Journal of Multicultural Counseling and Devel-opment, 29, 174–200.
Vandiver, B. J., & Worrell, F. C. (Eds.). (2001). Psychological nigrescence revisited [Special issue].Journal of Multicultural Counseling and Development, 29(3).
Watkins, M. W. (2000). Mac Parallel Analysis [Computer software]. State College, PA: Author.Weber, D. A., & Castillo, L. G. (2002, August). The relationship of ethnic identity and university com-
fort on academic persistence. Paper presented at the 110th annual convention of the American Psy-chological Association, Chicago.
58 WORRELL, CONYERS, MPOFU, VANDIVER

Widaman, K. F. (1993). Common factor analysis versus principal component analysis: Differential biasin representing model parameters? Multivariate Behavioral Research, 28, 263–311.
Worrell, F. C. (2000). A validity study of scores on the Multigroup Ethnic Identity Measure based on asample of academically talented adolescents. Educational and Psychological Measurement, 60,439–447.
Worrell, F. C., Cross, W. E., & Vandiver, B. J. (2001). Nigrescence theory: Current status and chal-lenges for the future. Journal of Multicultural Counseling and Development, 29, 201–213.
Worrell, F. C., Vandiver, B. J., & Cross, W. E., Jr. (2000). The Cross Racial Identity Scale: Technicalmanual. Unpublished manual.
Worrell, F. C., Vandiver, B. J., Schaefer, B. A., Cross, W. E., Jr., & Fhagen-Smith, P. E. (2003).Nigrescence profiles: A cluster analysis of Cross Racial Identity Scale (CRIS) scores in three inde-pendent samples. Manuscript submitted for publication.
Yancey, A. K., Aneshensel, C. S., & Driscoll, A. K. (2001). The assessment of ethnic identity in a di-verse urban youth population. Journal of Black Psychology, 27, 190–208.
MEIM SCORES IN ADOLESCENTS FROM ZIMBABWE 59


![Reactor Physics: Multigroup Diffusion · Reactor Physics: Multigroup Diffusion 6 This work is detailed in [GARLAND1975] but for the present discussion, the main point to note is the](https://img.dokumen.tips/doc/110x75/5e38d3c86fdaec5c757d1316/reactor-physics-multigroup-reactor-physics-multigroup-diffusion-6-this-work-is.jpg)