Embed Size (px)
Citation preview
TEST UNCERTAINTY RATIO (TUR) AND TEST UNCERTAINTY
by
Samira Khanam
A dissertation submitted to the faculty of The University of North Carolina at Charlotte
in partial fulfillment of the requirements for the degree of Doctor of Philosophy in
Mechanical Engineering
Charlotte
2009
Approved by:
Dr. Edward Morse
Dr. J. Raja
Dr. You-lan Zhu
Dr. Zhi Zhang

ii
©2009
Samira Khanam ALL RIGHTS RESERVED

iii
ABSTRACT
SAMIRA KHANAM. Test uncertainty ratio (TUR) and test uncertainty. (Under the direction of DR. EDWARD MORSE)
Measurement uncertainty is a natural parameter that can be used to characterize
any measurement process. Continually increasing demands of higher and higher
dimensional accuracy in manufactured components places similar demands on the field
of dimensional measurement, as manufacturers strive for lower uncertainty associated
with the results of measurement. Complete elimination of uncertainty in manufacturing
and measurement is not the intent of this research, as only the reduction of uncertainty is
possible, and the reduction of uncertainty comes at a cost. Given that similar
manufacturing and measurement equipment is available across industries, it is often the
case that the better one can estimate these uncertainties, the greater the competitive
advantage as money to reduce uncertainty – thereby improving quality – can be used in
the most effective way. The objective of this research is to analyze the impact of two
different kinds of uncertainty – the "Test Uncertainty Ratio" and "Test Uncertainty" – for
both manufacturers of measurement equipment and their customers. This impact
influenced both by their understanding of what the uncertainty represents, as well as their
ability to characterize this uncertainty.
Measuring equipment often has a stated 'accuracy' within which it can be
expected to perform. However, some complex measurements performed with this
equipment have additional uncertainty contributors, and the resulting measurement is less
accurate (i.e. has a greater uncertainty) than the instrument's stated performance. The
Test Uncertainty Ratio (TUR) for a measuring process is one of a family of metrics that
iv
relate the tolerance for a measurand to the uncertainty present in performing that
measurement. This ratio is used in industry to describe the measurement capability of a
system or process, but often is not based on a realistic estimation of the uncertainty
present. This research clarifies the uncertainty contributors for the calculation of this
metric, and experimentally validates different estimation techniques. It is common to
perform a test of the instrument on an artifact with known dimensions, when buying and
selling metrology tools. The errors obtained during this test are used to evaluate the
instrument, but the errors will reflect not only instrument deficiencies, but also improper
use of the instrument, and incomplete knowledge of the test artifact. The contributors to
the errors in this type of test that are not associated with the instrument itself have been
lumped into a term called Test Uncertainty. This is a new concept, and is receiving much
attention in both the accreditation of metrology laboratories and in national and
international standards writing bodies. This research in the area of test uncertainty
develops a consistent way of considering test uncertainty and its influence in the
evaluation of measuring instruments. Experimental results support the method of
decomposing uncertainty contributors into those that do and do not affect the test
uncertainty.
v
ACKNOWLEDGEMENT
I would like to express my gratitude to my advisor Dr.Edward Morse for his
support, and guidance with my research and throughout my graduate study at The
University of North Carolina at Charlotte. I would like to thank Dr.Jay Raja, Dr. You-lan
Zhu, and Dr. Zhi Zhang to serve on my dissertation committee.
Thanks to Jonathon Beaman for helping me during my research. Many thanks to
my teachers, and my friends for helping me in my graduate courses. I would extend my
thanks to Osborne Martin who supported this research by giving an opportunity of
internship at INTEL.
Finally, I would like to extend great thank my husband, my parents and my family
for their constant support throughout my study.

vi
TABLE OF CONTENTS
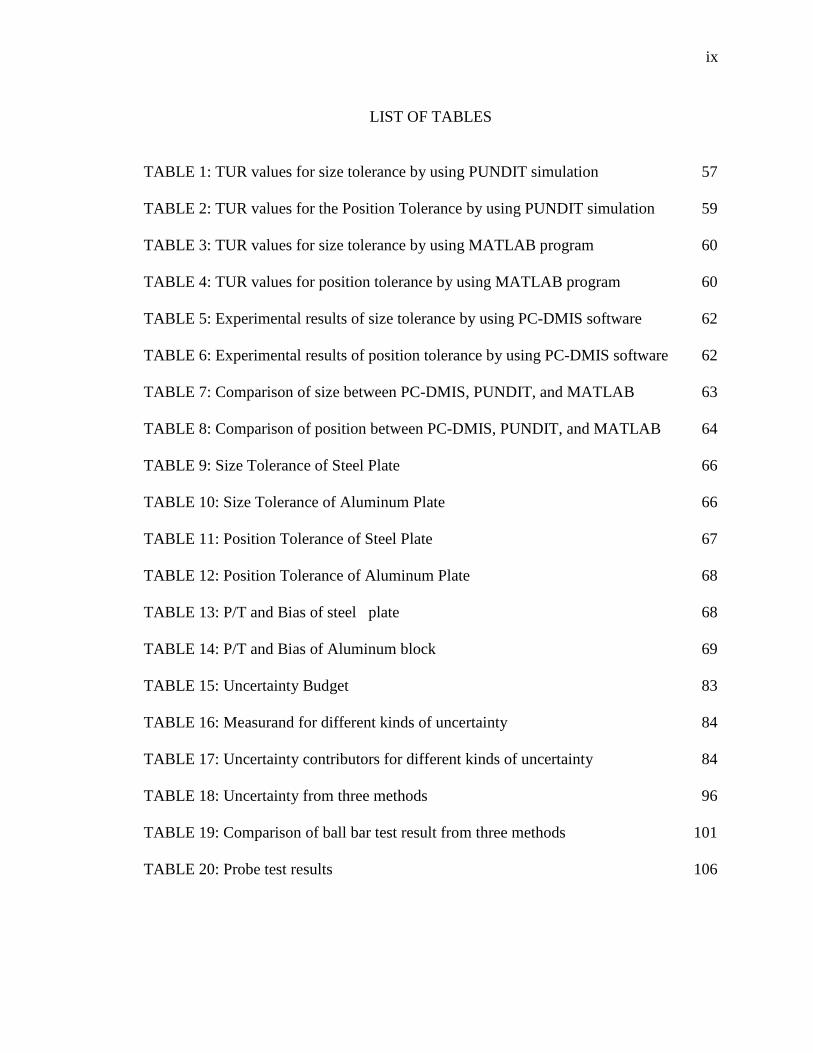
LIST OF TABLES ix
LIST OF FIGURES x
CHAPTER 1: INTRODUCTION 1
1.1 Measurement Uncertainty 2
1.2 Test Uncertainty Ratio (TUR) 3
1.3 Test Uncertainty 4
1.4 Objective of this research 5
CHAPTER 2: MEASUREMENT UNCERTAINTY 7
2.1 Uncertainty Contributors 9
2.2 Definitions 13
2.3 Task Specific Uncertainty 19
CHAPTER 3: TERMS AND DEFINITIONS 21
3.1 Definition of terms 22
CHAPTER 4: CURRENT US AND ISO STANDARDS 33
4.1 ISO14253-1:1998(E) 34
4.2 ASME B89.7.3.1-2001 35
4.3 B 89.7.4.1-2005 38
4.4 ISO/TS 23165 38
4.5 ASME B89.4.1 39
CHAPTER 5: TEST UNCERTAINTY RATIO (TUR) 41
5.1 Test Uncertainty Ratio (TUR) 41
5.2 TUR Contributors 47

vii
5. 3 Other Metrics 50
5.3.1 P/T ((Precision-to- Tolerance) Ratio 50
5.3.2 Gage Repeatability and Reproducibility (Gage R & R) 51
5.4 Calculation of TUR 54
5.4.1 Simulation method (PUNDIT) 56
5.4.2 MATLAB Program 59
5.4.3 Experiment 61
5.5 Comparison results between PC-DMIS, PUNDIT and MATLAB 63
5.6 Experiments for Steel and Aluminum plates 64
5.6.1 Size Tolerance results 66
5.6.2 Position Tolerance Results 67
5.6.3 Conclusions for Steel and Aluminum plates experiments 69
5.7 Measurement capability analysis 70
CHAPTER 6: TEST UNCERTAINTY 71
6.1 Definitions 72
6.2 Contributors of test uncertainty 75
6.2.1 Test uncertainty contributors for CMM 75
6.2.2 Test uncertainty contributor for micrometer and gage block 78
6.3 Comparison between test U, calibration and task specific U 83
6.4 Comparison of CMM testing data 86
6.4.1 Simulation using PUNDIT 87
6.4.2 Experiment results 94
6.4.3 Test Uncertainty Calculation from ISO/TS 23165 95

viii
6.5 Ball bar test 97
6.5.1 Actual testing by following B89.4 97
6.5.2 Ball bar test results with time 102
6.5.3 Probe test 103
6.6 Conclusion 107
CHAPTER 7: CONCLUSIONS AND FUTURE WORK 108
7.1 Future work 109
REFERENCES 111
APPENDIX A: MATLAB CODE 114
APPENDIX B: UNCERTAINTY CALCULATION 118
APPENDIX C: TEST UNCERTAINTY CALCULATION 123
ix
LIST OF TABLES
TABLE 1: TUR values for size tolerance by using PUNDIT simulation 57
TABLE 2: TUR values for the Position Tolerance by using PUNDIT simulation 59
TABLE 3: TUR values for size tolerance by using MATLAB program 60
TABLE 4: TUR values for position tolerance by using MATLAB program 60
TABLE 5: Experimental results of size tolerance by using PC-DMIS software 62
TABLE 6: Experimental results of position tolerance by using PC-DMIS software 62
TABLE 7: Comparison of size between PC-DMIS, PUNDIT, and MATLAB 63
TABLE 8: Comparison of position between PC-DMIS, PUNDIT, and MATLAB 64
TABLE 9: Size Tolerance of Steel Plate 66
TABLE 10: Size Tolerance of Aluminum Plate 66
TABLE 11: Position Tolerance of Steel Plate 67
TABLE 12: Position Tolerance of Aluminum Plate 68
TABLE 13: P/T and Bias of steel plate 68
TABLE 14: P/T and Bias of Aluminum block 69
TABLE 15: Uncertainty Budget 83
TABLE 16: Measurand for different kinds of uncertainty 84
TABLE 17: Uncertainty contributors for different kinds of uncertainty 84
TABLE 18: Uncertainty from three methods 96
TABLE 19: Comparison of ball bar test result from three methods 101
TABLE 20: Probe test results 106
x
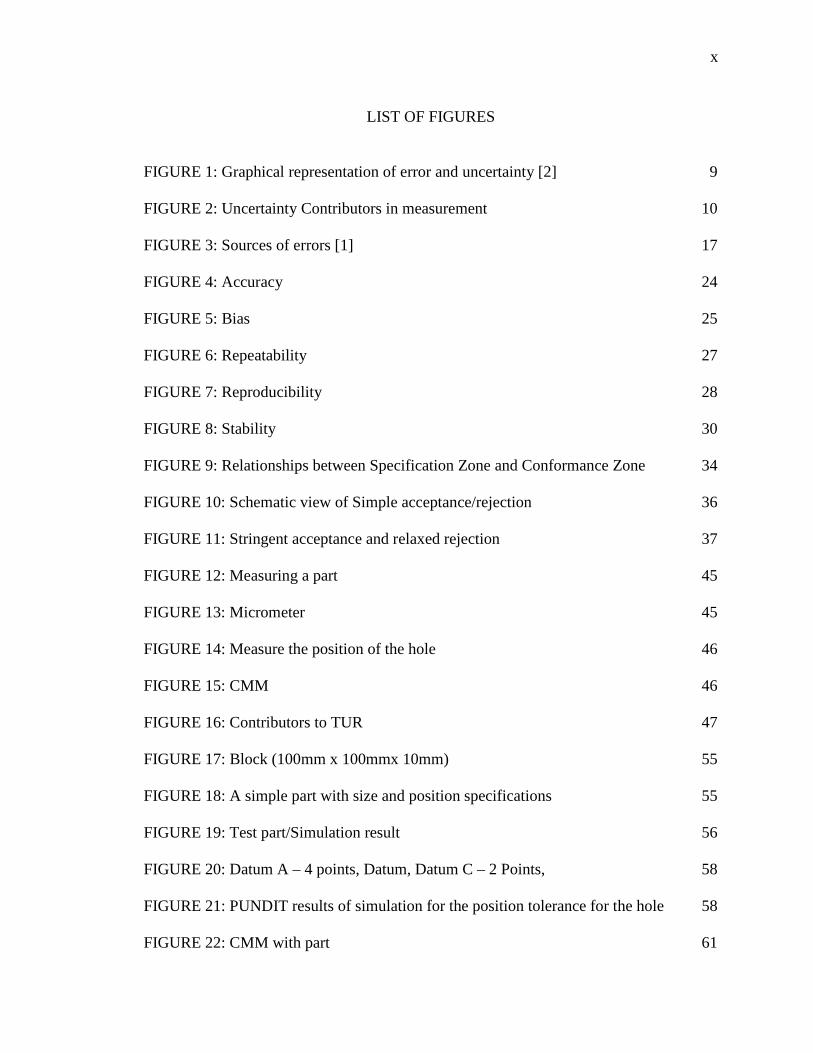
LIST OF FIGURES
FIGURE 1: Graphical representation of error and uncertainty [2] 9
FIGURE 2: Uncertainty Contributors in measurement 10
FIGURE 3: Sources of errors [1] 17
FIGURE 4: Accuracy 24
FIGURE 5: Bias 25
FIGURE 6: Repeatability 27
FIGURE 7: Reproducibility 28
FIGURE 8: Stability 30
FIGURE 9: Relationships between Specification Zone and Conformance Zone 34
FIGURE 10: Schematic view of Simple acceptance/rejection 36
FIGURE 11: Stringent acceptance and relaxed rejection 37
FIGURE 12: Measuring a part 45
FIGURE 13: Micrometer 45
FIGURE 14: Measure the position of the hole 46
FIGURE 15: CMM 46
FIGURE 16: Contributors to TUR 47
FIGURE 17: Block (100mm x 100mmx 10mm) 55
FIGURE 18: A simple part with size and position specifications 55
FIGURE 19: Test part/Simulation result 56
FIGURE 20: Datum A – 4 points, Datum, Datum C – 2 Points, 58
FIGURE 21: PUNDIT results of simulation for the position tolerance for the hole 58
FIGURE 22: CMM with part 61

xi
FIGURE 23: Steel block on CMM 65
FIGURE 24: Aluminum block on CMM 65
FIGURE 25: Measurement capability of metrology tools comparison 70
FIGURE 26: CMM calibration using a step gage 76
FIGURE 27: Sources of U in the calibration of CMM by using step gauge 76
FIGURE 28: Sources of test U.in the calibration of CMM by using step gauge 77
FIGURE 29: Sources of test U in the calibration of CMM by using step gage 78
FIGURE 30: Micrometer 79
FIGURE 31: Gage block 79
FIGURE 32: Sources of U in the calibration of micrometer by using gage block 80
FIGURE 33: Sources of test U in the calibration micrometer by using gage block 81
FIGURE 34: Sources of test uncertainty when calibrating gage block 82
FIGURE 35: E-test [21] 86
FIGURE 36: E-test [10360-2] 87
FIGURE 37: Artifact with 5 test lengths (as used in ISO testing) 87
FIGURE 38: Initial measurement schemes 88
FIGURE 39: Single point probing scheme 88
FIGURE 40: Simulation results (1) 89
FIGURE 41: Simulation results (2) 90
FIGURE 42: different positions [B89.4.] 91
FIGURE 43: Y-linear 92
FIGURE 44: Diagonal position 92
FIGURE 45: Schematic of offset length test 93
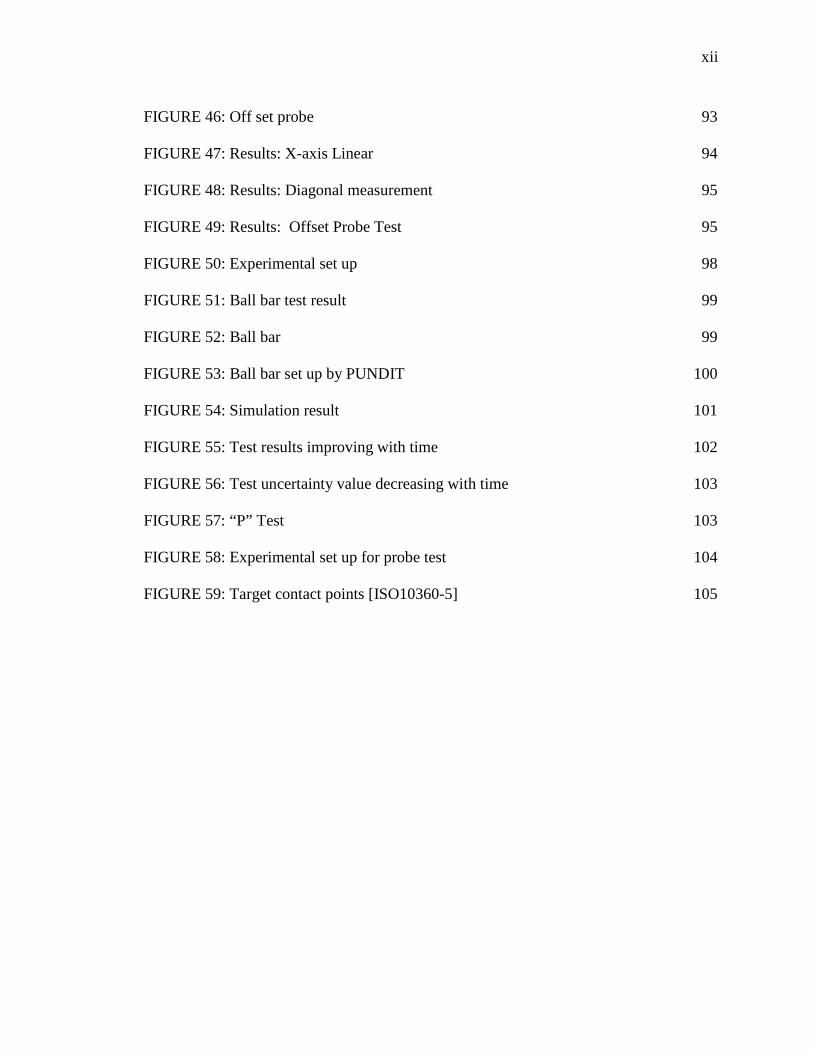
xii
FIGURE 46: Off set probe 93
FIGURE 47: Results: X-axis Linear 94
FIGURE 48: Results: Diagonal measurement 95
FIGURE 49: Results: Offset Probe Test 95
FIGURE 50: Experimental set up 98
FIGURE 51: Ball bar test result 99
FIGURE 52: Ball bar 99
FIGURE 53: Ball bar set up by PUNDIT 100
FIGURE 54: Simulation result 101
FIGURE 55: Test results improving with time 102
FIGURE 56: Test uncertainty value decreasing with time 103
FIGURE 57: “P” Test 103
FIGURE 58: Experimental set up for probe test 104
FIGURE 59: Target contact points [ISO10360-5] 105

CHAPTER 1: INTRODUCTION
The history of measurement processes is comprised of scientific advancements.
To improve the quality of the products, measurements have a significant role in many
business sectors, especially in the manufacturing industries. In the evaluation process of
manufactured products, measurement systems play a key role. The acceptability of the
measurement systems depends on their ability to produce accurate measurement results.
The measurement results need to verify that products meet the expected quality levels for
both for the suppliers and the customers. Each measurement contains errors due to the
limits of instruments and the people using them. Different methods have been developed
to estimate the measurement errors that may occur. One of these methods is the use of
measurement uncertainty. Measurement uncertainty is a description of the collection of
all possible measurement errors [4]. A measurement result can only be complete when it
is expressed with a statement of its uncertainty. The quality of a measurement result is
reflected in its uncertainty with reference to its value and its traceability to the
international systems units through various national and international standards [2].
The uncertainty of measurement results is a key concern to both industries and
their customers. Measurement results can be used in decision making when the data are
analyzed with uncertainty. The uncertainty statement is important in manufacturing
industries, as well as testing and calibration laboratories, not only for acceptability of part
2
and processes but also to reduce the cost. The accuracy of measurements, characterized
by uncertainty, affects all of us in trade.
1.1 Measurement Uncertainty
The measurement process is complicated by the presence of intrinsic variations
which affect the measurement results. Consequently, measurement results will always
contain errors. This error is defined as the difference between the measurement result
and the true value of the quantity being measured. In practice, no one can know the true
value, so a test of a measuring system compares the measured value to a reference value.
The reference value and its uncertainty are accepted as valid to evaluate a measuring
system. If calibrated at NIST (National Institute of Standards and Technology) or
another recognized national metrology institute, the true value is accepted to be that
reference value, within the stated uncertainty. Measurement Uncertainty is defined as
“the parameter, associated with the result of a measurement that characterizes the
dispersion of the values that could reasonably be attributed to the measurand” [3]. The
term measurand is defined as the quantity subject to a measurement. One widely accepted
method to calculate uncertainty is defined in “Guide to expression of Uncertainty in
Measurement” [5], or GUM. The first step is to identify the sources of errors (the
contributors) of uncertainty. These contributors include the environment, the
measurement equipment, the measuring procedure, measurement set-up, and even the
metrologist performing the measurement. After finding all relevant sources of
uncertainty, it is necessary to calculate a standard uncertainty for each individual source.
There are two types of evaluation of standard uncertainty: Type A – which is evaluated
by statistical means and Type B – which is evaluated by methods other than statistics.
3
The next step is to work out combined uncertainty, which – for independent contributors
– is the root sum square of individual uncertainty terms. Finally, the expanded
uncertainty is calculated using an appropriate coverage factor. The expanded uncertainty
can be thought of as a confidence interval within which the true is expected to lie.
Estimating measurement uncertainty is explained in detail in chapter 2. This dissertation
examines the application of measurement uncertainty in two different contexts:
determining the suitability of a measuring process for a given task, and determining the
quality of test method and test method for evaluating a measuring instrument.
1.2 Test Uncertainty Ratio (TUR)
Measurement equipment performs an essential task in the production process.
Presently, the quality of the product is the main concern for manufacturing industries.
The increase in the expectation of the quality of the products drives designers to utilize
tighter tolerances, and as a result the products acceptance criteria become inflexible.
Different powerful methods have been developed in the industry to verify the acceptance
of the product such as Gage R&R and to find the measurement capability of the
measurement equipment such as P/T. One such method analyzed in this research is the
Test Uncertainty Ratio (TUR). It helps to verify that the acceptance of the manufactured
product is reliable, and also to find the measurement capability of measurement
equipment. In its most simple form, TUR is the ratio between the tolerance for a specific
measurand and the uncertainty in determining the measured value for that measurand.
This ratio has the specified tolerance in the numerator, and the uncertainty in the
denominator. Currently, a ratio of 4:1 or even 3:1 is considered acceptable. The higher
value of the ratio indicates the better the performance of the test. To calculate TUR one

4
needs to know tolerance and the uncertainty. Tolerances appear in the manufacturer's
product specification. The other term, uncertainty, is the main concern to calculate TUR.
To provide a meaningful TUR, the uncertainty must be evaluated for each specific task in
a specific measurement plan. There is no single value that is appropriate for every
measuring task performed by a given instrument. The TUR needs to be calculated for
each task separately. This approach to the Test Uncertainty Ratio is explained in detail in
chapter 5.
1.3 Test Uncertainty
Test uncertainty is a new concept in the field of evaluating measurement
processes. When one is testing a piece of equipment, the uncertainty during that test is
known as test uncertainty. When calibrating instruments, some common sources of errors
are the measurement equipment itself, the person who is doing the test (the tester), and
the artifact from which the reference value is obtained. As the instrument is being
calibrated, the error from the instrument itself is not included in test uncertainty. The test
uncertainty captures the ability of the test to evaluate the instrument, so its value is
smaller than the regular measurement uncertainty that occurs when the instrument is used
to measure work pieces. When calibrating the instrument, the uncertainty due to the
artifact and the tester are primary contributors to the test uncertainty. The research in this
dissertation has revealed that the artifact uncertainty is usually does not influence the test
uncertainty on a large scale. Influences that fall under the tester's responsibility, including
the performance of the tester when doing the test, has great influence on the calibration
results. So test uncertainty result varies with the performance of the human operator
(tester). The effectiveness of the test can be increased by increasing the performance of

5
the tester; consequently test uncertainty value will be decreased. Test uncertainty does
not indicate the instrument's performance; it is only the indication of the quality of the
test. Test uncertainty explained in detail in chapter 6.
1.4 Objective of this research
The lack of industrial knowledge and understanding concerning the use of
measurement capability analysis for metrology tools, and also the need for guidance in
classifying the different kinds of uncertainty present in the testing and calibration of
instruments are the main motivation behind this project.
The goals of this project are
• To develop a guideline on how to use TUR in industry, both to find the
measurement capability of measuring instruments and in the inspection of
manufactured products.
• To provide a useful uncertainty model that supports decision rules for instrument
test criteria, facilitating the buying and selling of metrology equipment, and in
equipment calibration.
• To support B89 and ISO Standards activity, and the NCSLI dimensional
committee. New efforts are underway in each group studying test uncertainty.
This thesis develops a method for using TUR which will help industries to
evaluate measurement equipments’ capability, to do comparisons of the capabilities
between measurement equipment, and also to check the acceptability of the end products.
Next, this thesis provides a model to explain test uncertainty in a way that is consistent
with existing view of uncertainty. This work will assist different standard groups, and
give a guideline to better understanding of using specifications in the buying and selling
6
of measurement equipment.
It will provide a consistent vocabulary for terms and definitions related to uncertainty, as
well as computer simulations and experimental measurements on actual measuring
equipment and compare to these estimates to support the goal. It will also assist users of
metrology equipment by giving a clear understanding of the relationship between
precision, accuracy, repeatability, reproducibility and total variability in the
measurements. It will also provide a platform to evaluate the task specific uncertainty not
only for simple measurements, but also for the complex measurements performed using a
coordinate measuring machine (CMM). Different part positions, fitting algorithms,
sampling strategy can be use to evaluate task specific uncertainty. Theoretical methods
that are used include simulation software (PUNDIT, commercial software to evaluate
uncertainty for CMMs) and MATLAB (Mathematics software) programs for this
evaluation. Practical measurement experiments have been done using a CMM with PC-
DMIS software.
CHAPTER 2: MEASUREMENT UNCERTAINTY
Measurement is the process or set of operations to assign the value of particular
quantity. The assigned value is called the measurement result which describe the quantity
which is measured. It is the charactaristics of an object like the size, position, length. In
the Measurement system analysis reference manual, a measurement system defined as
“the collection of operations, procedures, gages, and other equipment, software and
personnel used to assign a number to the characteristics being measured; the complete
process used to obtain a measurement.”
Measurand need to define first for the measurement process. A measurand is a
specific quantity subject to measurement. To define the measurand one should consider
the factors which influence the measurement process and expected accuracy of
measurement result.Some examples:
• The temperature is an important information in defining the measurand
when the length of iron bar is measured in micron level accuracy. The measurand
in this case can be defined as the length of iron bar at 200 C.
• The tension of the rope need to define when measurand is the length of a
rope because it affects the measured length of the rope.
• For the calibration of dial gages and calipers if the measurand is the
length of gage block used as a reference standard the temperature at which the
8
measurement is to be done is important information. The measurand in this case
can be defined as the length of gage block 300 C and 50% relative himidity. [2]
So the measurand is a attribute which need to define and it is important to mention the
environmental condition under which measurement proceeded.
Measurement result is the out put of the measurement process or can be define as
numerical value of the measurand. The output result for an ideal and perfect measurement
system can be define as true value of the measurand. In this case repeat observations will
consistently give exactly same result, so there would be no error. But in reality this does
not exist. So the measurement results are compared with reference value which can be
known from measurement standard. This is not the exactly true value but close to true
value. Many factors influence the result of the process like measurement equipment,
environment, skill of the person who is doing the measurement etc. These factors
influence in the variations in the measurement result and consequently measurement
results always associated with error. Error is the difference between the true value and the
measurment result. True value as mentioned can never be known. So it is a qualatative
concept, can not be quantified . Repeat measurement is also important for the reliability
of the measurement results. One can not make decision only depend on a single
measurement result. So measurement results introduce uncertainty in the measurement
process which can be quantified. The estimated interval, which quatifies the “ how good
or how bad” part of the measurement result , is called measurement uncertainty[2]. It can
be express as an interval between two values within minimum and maximum values. The
true value is expected in this range. For example a measurement result is 20.00 with the
uncertainty interval 19.90 to 20.20. The range of the interval is 0.20. It can be define as

9
20.00 ± 0.20. So measurement results can be characterized by measurement uncertainty.
The uncertainty in measurements should be small enough that the measurements meet the
specifications needs for which they are made[2].
FIGURE 1 is showing the difference between error and uncertainty.
x
x
FIGURE 1: Graphical representation of error and uncertainty [2]
It is essential to analyze the measurement steps to find the resons for variations in
measurement results and taking actions accordingly to lessen the unceratinty value.
Statistical analysis of the measurement results are used to evaluate uncertainty.
2.1 Uncertainty Contributors
Any component that affects the result of a measurement is considered as an
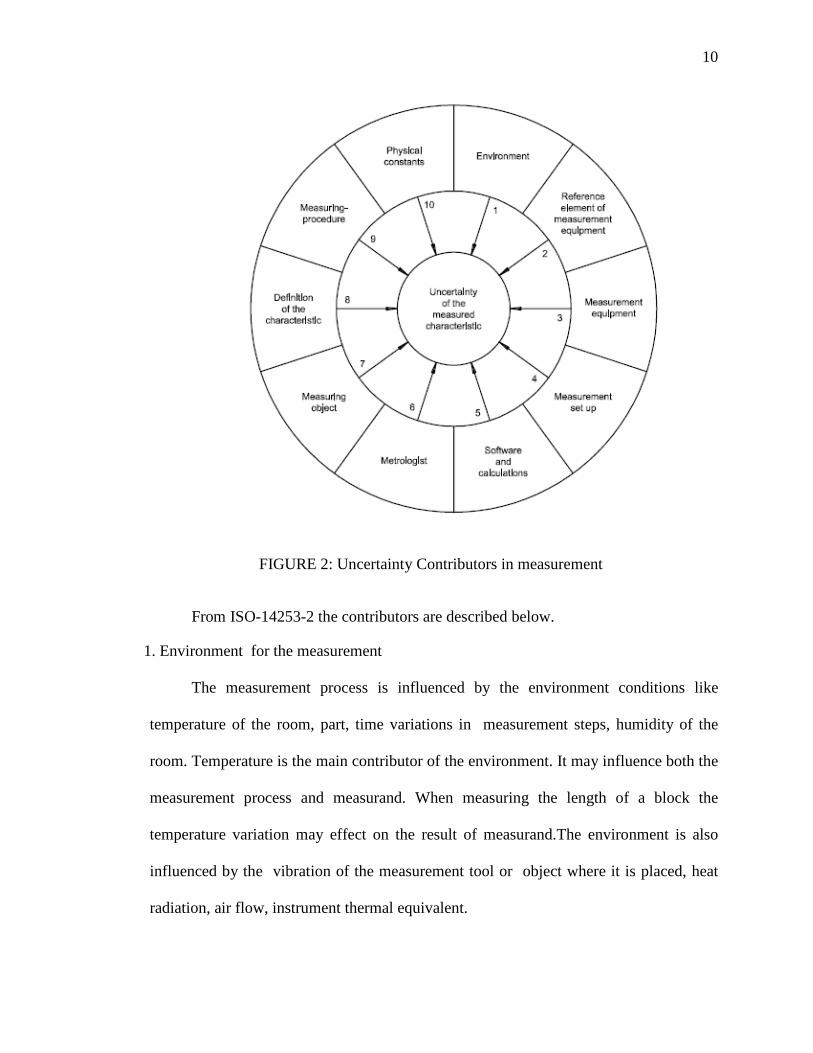
uncertainty contributors. Some of the most common contributors are shown in FIGURE 2
from ISO 14253-2.
µ
Uncertainty
Error
10
FIGURE 2: Uncertainty Contributors in measurement
From ISO-14253-2 the contributors are described below.
1. Environment for the measurement
The measurement process is influenced by the environment conditions like
temperature of the room, part, time variations in measurement steps, humidity of the
room. Temperature is the main contributor of the environment. It may influence both the
measurement process and measurand. When measuring the length of a block the
temperature variation may effect on the result of measurand.The environment is also
influenced by the vibration of the measurement tool or object where it is placed, heat
radiation, air flow, instrument thermal equivalent.
11
2. Reference element of measurement equipment
The measurement process is influenced by the reference element of measuring
equipment like stability, scale mark quality, temperature expansion coefficient,
resolution of the main scale ( analogue or digital). When measuring the diameter of a
cylinder because of the resolution or stablity of measuring equipment it may effect on
the result of measurand. Some other factors like physical principle: line scale, optical
digital scale, spindle, rack and pinoion, interferometer, CCD-techniques,uncertainty of
the calibration, time since calibration may contributors of measurement uncertainty.
3. Measuring Equipment
The measurement process is influenced by measuring equipment like
magnification, electrical or mechanical, error wavelength, zero-point stability, force
stability/ absolute force, probe system, geometrical imperfections, stiffness/rigidity,
temperature stability/sensitivity, parallaxes, time since last calibration, digitization.
4. Measurement Setup (excluding the placement and clamping of the workpiece)
Measurement setup like cosine and sine errors, temperature sensetivity,
stiffness/rigidity, Abbe principle, tip radius, form deviation of tip, interaction between
workpiece and setup influence in the measurement procedure.
5. Software and Calculations
Measurand and measurement process are influenced by rounding/quantification,
algorithms, implementation of algorithms, number of significant digits in the
computation, sampling, filtering.

12
6. Metrologist
The performane of the metrologist one of the important source of uncertainty. The
quality of the metrologist like education, experience, training, physical
disadvantage/ability, knowledge, honesty, dedication all may influence to measurement
result.
7. Measuring Object, workpiece or measuring instrument characteristic
Charateristics of measuring object, workpiece, measuring instrument like surface
roughness, form deviations, temperature expansion coefficient, conductivity, weight, size,
shape, cleanliness, workpiece distrotion due to clamping, orientation may influence in the
measurment procedure. When measuring diameter of a ball if the surface is rough it will
effect on the result of the measurand.
8. Definition of the GPS characteristic, workpiece or measuring instrument characteristics
Datum, reference system, degrees of freedom, toleranced feature, distance, angle
these characteristics are also contributors of uncertainty.
9. Measuring Procedure
Number of measurements, duration of measurements, alignment, choise of
apparatus, choise of metrologist, number of operators, strategy, clamping, fixturing,
numper of points, probing principle and strategy, alignment of probing system, drift
check, reversal measirements, error seperation all the factors may contributor of
uncertainty. For example if number of measurement is more the result may reflect more
reliability.
13
Physical Constants and conversion factors, material properties of the workpiece,
measuring instrument etc. also influence the measurement procedure.
2.2 Definitions
To Understand Measurement Uncertainty, it is necessary to understand some
terms in details. These are explained from the International Vocabulary of Basic and
General Terms in Metrology (VIM) and the Guide to Expression of Uncertainty in
Measurement (GUM).
Measurement
Measurement is a process of experimentally obtaining one or more quantity values that can reasonably be attributed to a quantity. Measurement does not apply to nominal properties. It implies comparison of
quantities and includes counting of entities. It presupposes a description of the quantity
commensurate with the intended use of a measurement result, a measurement procedure,
and a calibrated measuring system operating according to the specified measurement
procedure, including the measurement conditions.
Measurand
Quantity intended to be measured.
The specification of a measurand requires knowledge of the kind of quantity,
description of the state of the phenomenon, body, or substance carrying the quantity,
including any relevant component, and the chemical entities involved.
Measurement method
Measurement method describes generic description of a logical organization of operations used in a measurement.
Measurement methods may be qualified in various ways such as:
14
— Direct measurement method, and
— Indirect measurement method.
Measurement procedure
Detailed description of a measurement according to one or more measurement principles and to a given measurement method, based on a measurement model and including any calculation to obtain a measurement result. A measurement procedure is usually documented in sufficient detail to enable an
operator to perform a measurement.
Measurement result
Result of measurement can be defined as a set of quantity values being attributed to a measurand together with any other available relevant information.
A measurement result generally contains “relevant information” about the set of
quantity values, such that some may be more representative of the measurand than others.
This may be expressed in the form of a probability density function (PDF). A
measurement result is generally expressed as a single measured quantity value and a
measurement uncertainty. If the measurement uncertainty is considered to be negligible
for some purpose, the measurement result may be expressed as a single measured
quantity value. In many fields, this is the common way of expressing a measurement
result.
True quantity value (True value)
True value of a quantity is true value.
It is consistent with the definition of a quantity. In the error approach to
describing measurement, a true quantity value is considered unique and, in practice,
unknowable. The uncertainty approach is to recognize that, owing to the inherently
incomplete amount of detail in the definition of a quantity, there is not a single true
15
quantity value but rather a set of true quantity values consistent with the definition.
However, this set of values is in principle and in practice, unknowable. Other approaches
dispense altogether with the concept of true quantity value and rely on the concept of
metrological compatibility of measurement results for assessing their validity.
Measurement error (Error of measurement)
Error is a measured quantity value minus a reference quantity value.
The concept of ‘measurement error’ can be used both when there is a single
reference quantity value to refer to, which occurs if a calibration is made by means of a
measurement standard with a measured quantity value having a negligible measurement
uncertainty or if a conventional quantity value is given, in which case the measurement
error is known, and if a measurand is supposed to be represented by a unique true
quantity value or a set of true quantity values of negligible range, in which case the
measurement error is not known.
Measurement uncertainty
Uncertainty non-negative parameter characterizing the dispersion of the quantity values being attributed to a measurand, based on the information used. Measurement uncertainty includes components arising from systematic effects,
such as components associated with corrections and the assigned quantity values of
measurement standards, as well as the definitional uncertainty. Sometimes estimated
systematic effects are not corrected for but, instead, associated measurement uncertainty
components are incorporated. The parameter may be, for example, a standard deviation
called standard measurement uncertainty (or a specified multiple of it), or the half-width
of an interval, having a stated coverage probability. In general, for a given set of
information, it is understood that the measurement uncertainty is associated with a stated
16
quantity value attributed to the measurand. A modification of this value results in a
modification of the associated uncertainty.
Standard Uncertainty (ui)
The representation of each component of uncertainty that contributes to the uncertainty of measurement, by an estimated standard deviation is termed as standard uncertainty.
Combined Standard Uncertainty (uc)
The combination of all the standard uncertainties, which represents the standard deviation of the result, is known as combined standard uncertainty. It is usually the square root of the sum of the squares of the individual standard
uncertainties.
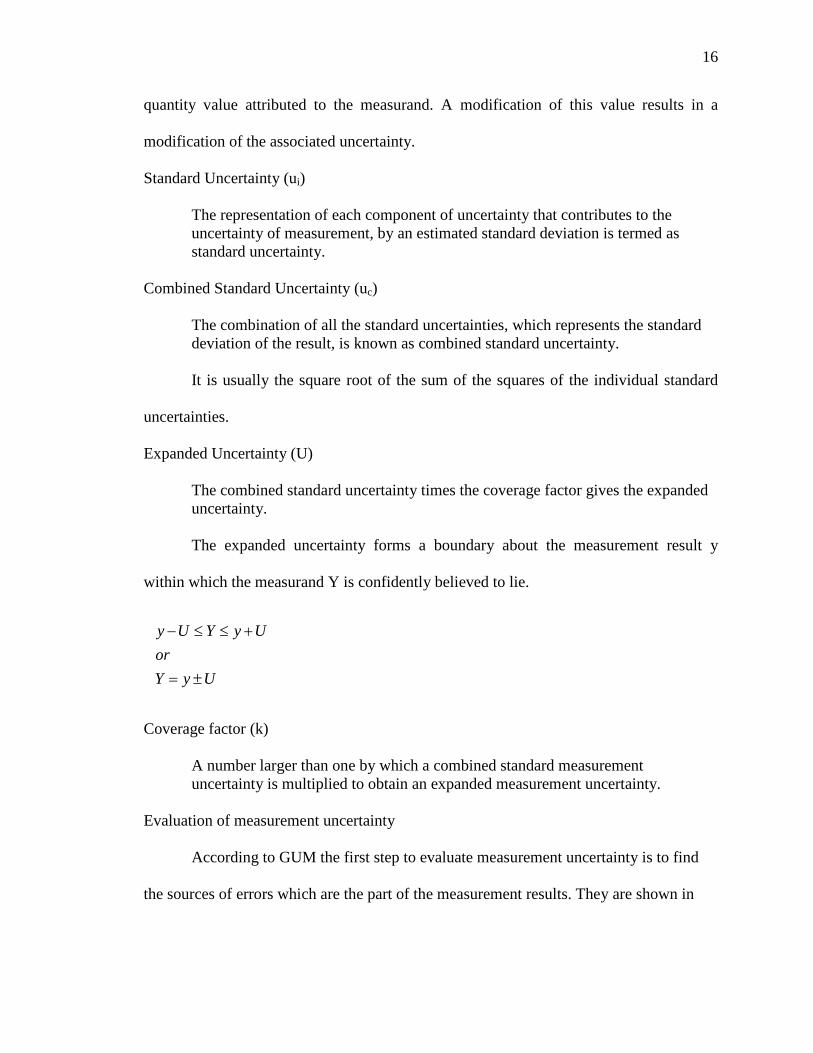
Expanded Uncertainty (U)
The combined standard uncertainty times the coverage factor gives the expanded uncertainty. The expanded uncertainty forms a boundary about the measurement result y
within which the measurand Y is confidently believed to lie.
Coverage factor (k)
A number larger than one by which a combined standard measurement uncertainty is multiplied to obtain an expanded measurement uncertainty.
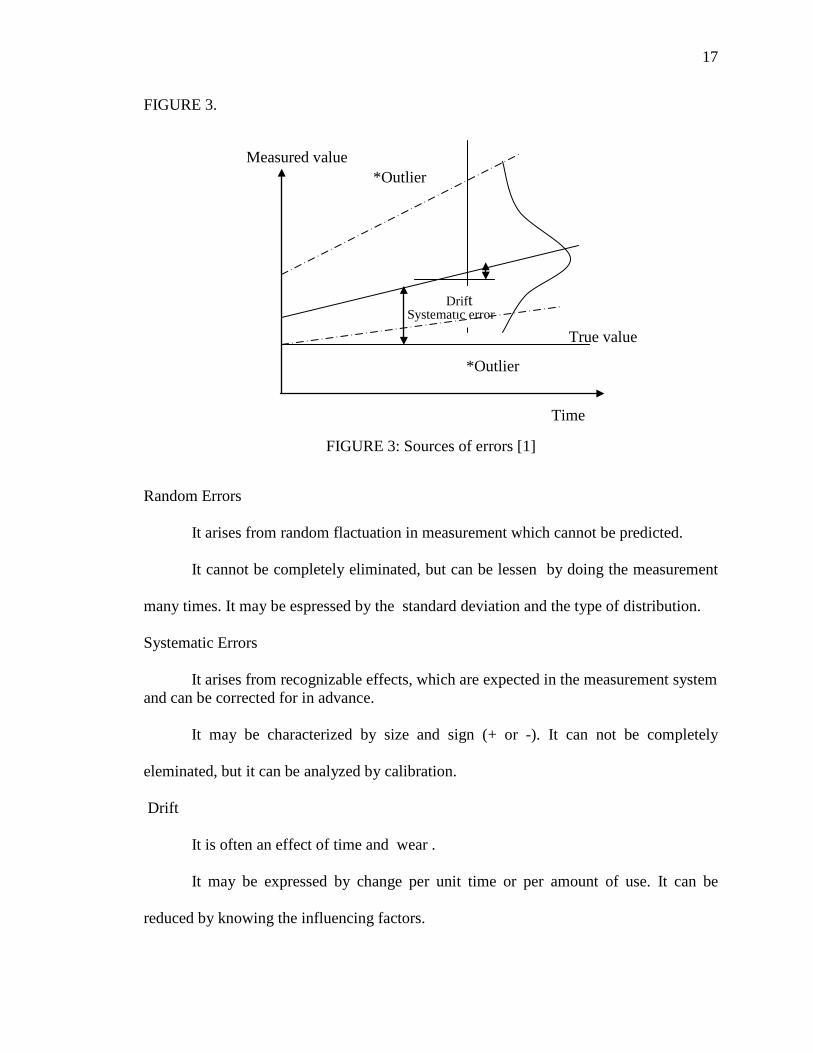
Evaluation of measurement uncertainty
According to GUM the first step to evaluate measurement uncertainty is to find
the sources of errors which are the part of the measurement results. They are shown in
UyYor
UyYUy
±=
+≤≤−
17
FIGURE 3.
FIGURE 3: Sources of errors [1]
Random Errors
It arises from random flactuation in measurement which cannot be predicted.
It cannot be completely eliminated, but can be lessen by doing the measurement
many times. It may be espressed by the standard deviation and the type of distribution.
Systematic Errors
It arises from recognizable effects, which are expected in the measurement system and can be corrected for in advance.
It may be characterized by size and sign (+ or -). It can not be completely
eleminated, but it can be analyzed by calibration.
Drift
It is often an effect of time and wear .
It may be expressed by change per unit time or per amount of use. It can be
reduced by knowing the influencing factors.
Systematic error
True value
Time
*Outlier
*Outlier
Drift
Measured value

18
Outliers
These are caused by non-repeatable incidents in measurement system.
These are very difficult (almost impossible) to characterize in advance. Any non
repeatable causes like electrical disturbaces, mechanical effects, noise all of these can be
the examples of outliers.
Evaluation of standard uncertainty (u(xi))
The measurand can be the result of a single measurement. So it can be measured
directly or it can be determined from other quantities through a functional relationship. It
most cases this relationship is used.
Where X1, X2 are determined either by direct measurement or by evaluating certain
functions. These quantities may be independent of each other or correlated. The f can be
determined from prior knowledge about the nature of behavior of quantities involved, use
of numerical evaluation and experiment [7].
Type A evaluation of measurement uncertainty
Measurement uncertainty comprises, in general, many components. Some of these
may be evaluated by Type A evaluation of measurement uncertainty from the statistical
distribution of the quantity values from series of measurements and can be characterized
by standard deviations.
The estimation of uncertainty through type A can be done in any one of the following
ways.
• Estimating the standard deviation of the data set. • Adopting the method of least squares to fit a curve
representing the data and deriving parameters from the fit.
),......,,( 21 NXXXfY =
19
• Using the analysis of variance (ANOVA) to estimate uncertainty.
Type B evaluation of measurement uncertainty
The other components, which may be evaluated by Type B evaluation of
measurement uncertainty, can also be characterized by standard deviations, evaluated
from probability density functions based on experience or other information, other than a
Type A evaluation of measurement uncertainty. Type B can be determined by
• Techniques other than statistics are used to evaluate standard uncertainty.
• Usually evaluated by scientific judgment based on available information and previous knowledge of the measurand.
The pool of information may include
• previous measurement data; • experience with or general knowledge of the behavior and
properties of relevant materials and instruments; • manufacturer’s specification; • data provided in calibration and other certificates; • Uncertainties assigned to reference data taken from
handbooks. Uncertainty budget
It is the components of the measurement uncertainty and of their calculation and combination. An uncertainty budget should include the measurement model, estimates, and
measurement uncertainties associated with the quantities in the measurement model, co
variances, type of applied probability density functions, degrees of freedom, type of
evaluation of measurement uncertainty, and any coverage factor.
2.3 Task Specific Uncertainty
Task specific uncertainty is the measurement uncertainty associated with the
measurement of a specific feature using a specific measurement plan. This is applicable
to estimate task specific uncertainty for coordinate measuring systems [13]. A coordinate
20
measuring machine (CMM) is a device to measure parts of different sizes and shape. This
machine is both versatile and economical. The task of estimating uncertainty for CMM
measurements is a difficult job as various kind of errors like part errors, machine errors,
and environmental factors to contribute errors, surface sampling strategy, fitting
algorithm etc affecting measurement result. The evaluation of uncertainty for CMM
measurements for specific task is different than the general uncertainty statement that can
be applied to all similar measurement [15]. For a specific measurement of CMM a large
number of sampling strategy, different location of the part with the working volume,
probe style and also various fitting criteria can be applied. Also In CMM-based
measurements, a task-specific uncertainty for each and every geometric dimensioning
and tolerancing (GD&T) parameter is necessary [14].

CHAPTER 3: TERMS AND DEFINITIONS
Everyday a large number of measurements are made in different sectors of life in
the world. Terms and definitions are used in the measurement process in a common
language for all the users over the world to facilitate the achievement of the goal of
measurement process. There are many reasons to have such terms and definitions: to
empower users to understand the measurement system and to make improvement of the
quality of product; to assist in the transaction with other companies for local and global,
consequently it will effect on economy positively. The products need to be made with
greater accuracy in order to achieve quality and exist in the market. It is important to
verify the measurement results and consequently verify the performance of the measuring
equipments. Proper understanding and using common definitions and terms will help to
check the reliability of the products and the measuring equipment. These are also
important to make decision both for the suppliers and customers. Otherwise it will be
very difficult to communicate or do business between each other. This chapter discussed
terms and definitions in details. The definitions and figures are taken from industry, VIM
(International vocabulary of metrology — Basic and general concepts and associated
terms) and Measurement Systems Analysis (Reference Manual).

22
3.1 Definition of terms
Part
A part is an item that is subject to measurement.
Gage
A gage is any device that is used to obtain measurements.
Rated operating condition (Specification)
(From VIM) Operating condition is that which must be fulfilled during measurement in order that a measuring instrument or measuring system performs as designed.
Rated operating conditions generally specify intervals of values for a quantity
being measured and for any influence quantity.
Maximum Permissible Error (MPE)
(From VIM)
Limit of error extreme value of measurement error, with respect to a known reference quantity value, permitted by specifications or regulations for a given measurement, measuring instrument, or measuring system.
Usually, the term “maximum permissible errors” or “limits of error” is used
where there are two extreme values. The term “tolerance” should not be used to
designate ‘maximum permissible error’.
Gage can be referring as artifact or measuring instrument. Gage block usually use
as artifact and CMM, Micrometer usually use as measuring instrument. For the
calibration of CMM, micrometer always mentioned specification and MPE (Maximum
Permissible Error) are mentioned in the manufactured specification or in the reference
manual. The specification and the MPE should not contradict each other or on the other
hand these conditions should go together. CMM’s specification and MPE are mentioned.
CMM (Coordinate measuring machine)
23
Specification [General]
Normal temperature- 200
Temperature variation - ± 3
C
0
1. Test performed with Renishaw PH110M probe head, TP20 Probe and 20mm stylus
C
Maximum permissible error for size measurement MPE
Customer Specification 4.0+L/200 um
E
Maximum permissible probing error MPE
Customer Specification 6.2 um
p
2. Test performed with Tesastar probe and 20mm stylus
Maximum permissible error for size measurement MPE
Customer Specification 6.0+L/200 um
E
Maximum permissible probing error MPE
Customer Specification 8.2 um
p
Accuracy
(From VIM) Accuracy is the closeness of agreement between a measured quantity value and a true quantity value of a measurand.
The measurand is a quantity intended to be measured. The concept ‘measurement
accuracy’ is not quantitative and is not given a numerical quantity value. A measurement
is said to be more accurate when it offers a smaller measurement error.
Accuracy
(From Industry) Accuracy is the extent to which the average of the measurements differs from the true value.
It is the degree of closeness of a measured value to its actual (true) value.
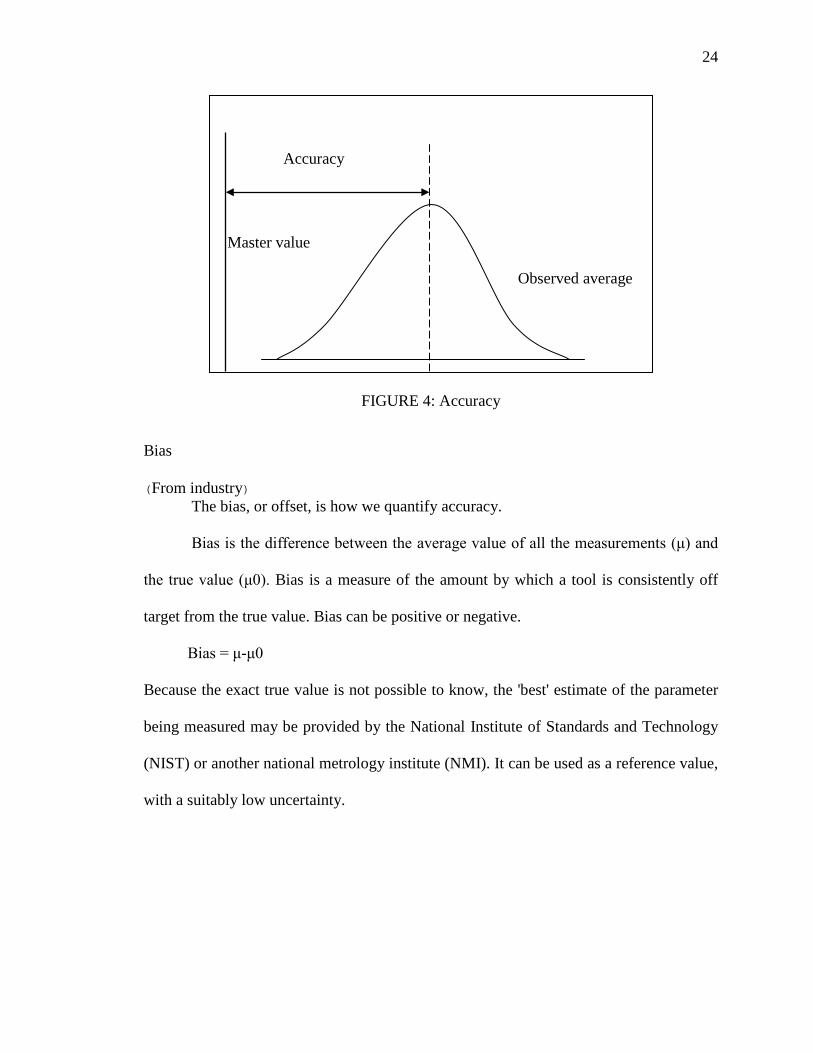
24
FIGURE 4: Accuracy
Bias
(From industry) The bias, or offset, is how we quantify accuracy.
Bias is the difference between the average value of all the measurements (μ) and
the true value (μ0). Bias is a measure of the amount by which a tool is consistently off
target from the true value. Bias can be positive or negative.
Bias = μ-μ0
Because the exact true value is not possible to know, the 'best' estimate of the parameter
being measured may be provided by the National Institute of Standards and Technology
(NIST) or another national metrology institute (NMI). It can be used as a reference value,
with a suitably low uncertainty.
Master value
Observed average
Accuracy

25
FIGURE 5: Bias
Precision
(From Industry) Precision measures the natural variation of repeated measurements.
It is the total variation in the measurement system as quantified by σms
Precision
(Standard
deviation of the measurement distribution). The smaller the standard deviation the better
is the precision. It is the degree of closeness of the measured value with respect to each
other.
(From VIM) Precision is the closeness of agreement between indications or measured quantity values obtained by replicate measurements on the same or similar objects under specified conditions.
Measurement precision is usually expressed numerically by measures of
imprecision, such as standard deviation, variance, or coefficient of variation under the
Reference value Observed average
Bias
26
specified conditions of measurement. The ‘specified conditions’ can be, for example,
repeatability conditions of measurement.
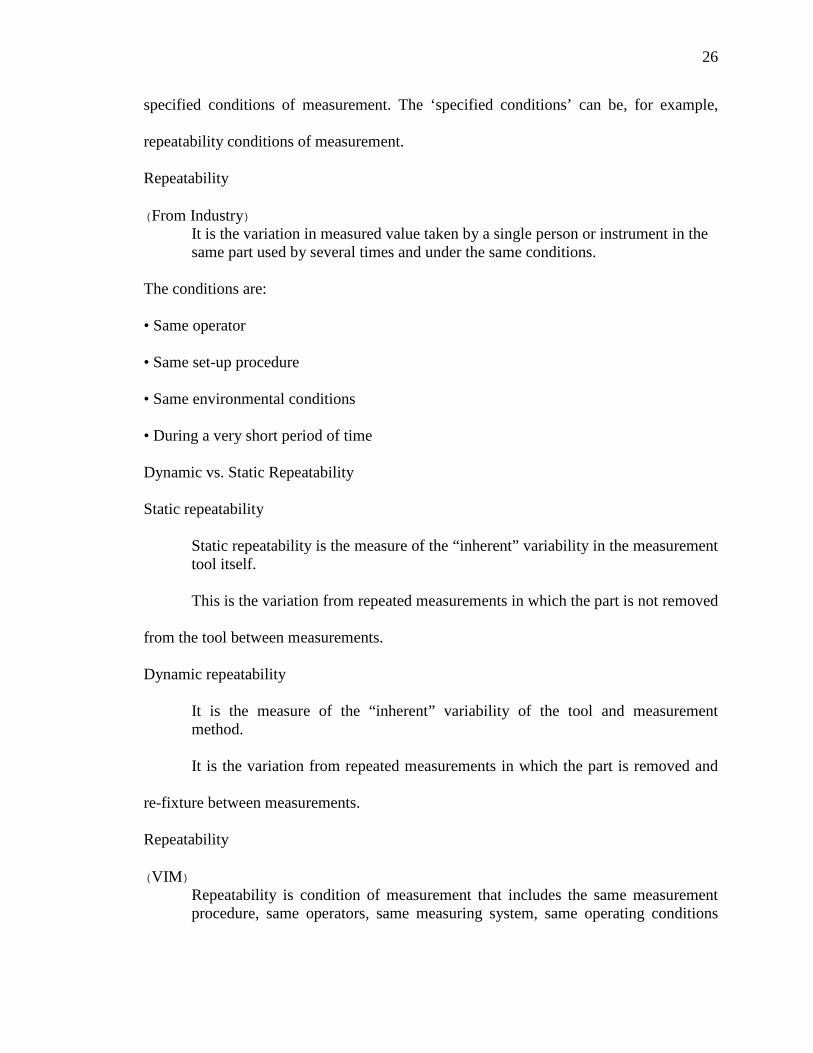
Repeatability
(From Industry) It is the variation in measured value taken by a single person or instrument in the
same part used by several times and under the same conditions. The conditions are:
• Same operator
• Same set-up procedure
• Same environmental conditions
• During a very short period of time
Dynamic vs. Static Repeatability
Static repeatability
Static repeatability is the measure of the “inherent” variability in the measurement tool itself.
This is the variation from repeated measurements in which the part is not removed
from the tool between measurements.
Dynamic repeatability
It is the measure of the “inherent” variability of the tool and measurement method.
It is the variation from repeated measurements in which the part is removed and
re-fixture between measurements.
Repeatability
(VIM) Repeatability is condition of measurement that includes the same measurement procedure, same operators, same measuring system, same operating conditions

27
and same location, and replicate measurements on the same or similar objects over a short period of time.
Repeatability
(General) It is the variation in measured value taken by a single person or instrument in the same part used by several times and under the same conditions. It is also commonly known as equipment variation.
FIGURE 6: Repeatability
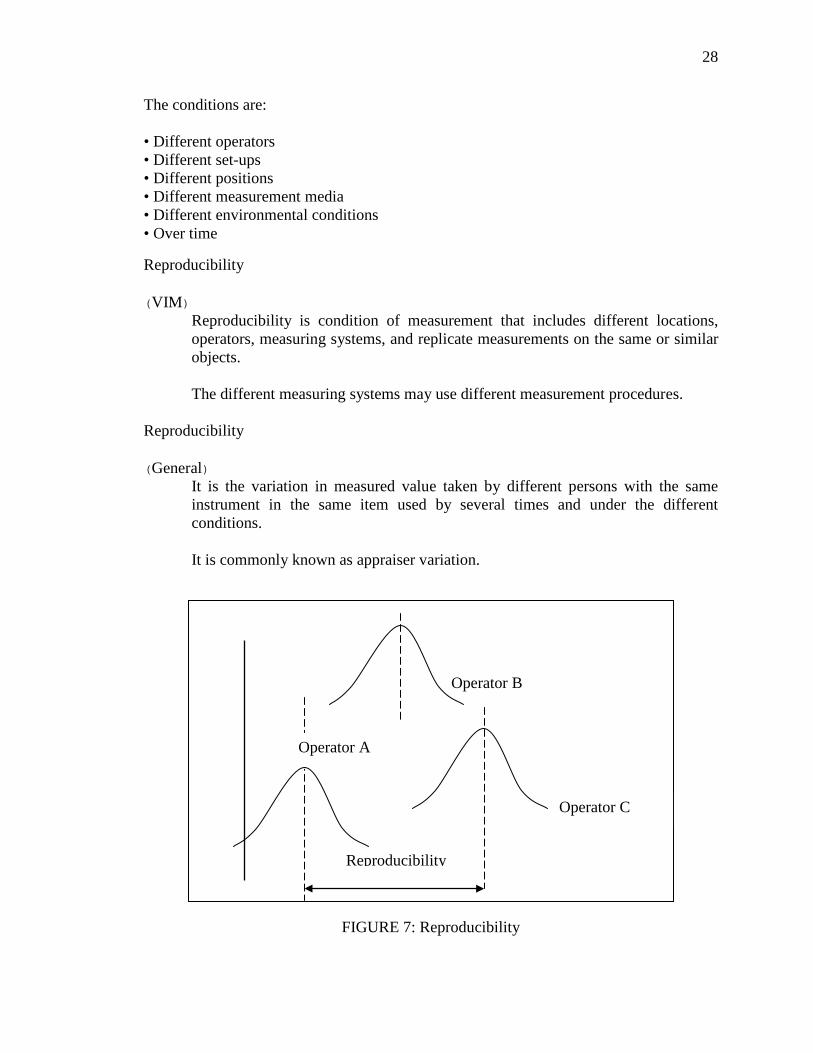
Reproducibility
(From Industry) It is the variation in measured value taken by different persons with the same instrument in the same item used by several times and under the different conditions.
Repeatability
28
The conditions are: • Different operators • Different set-ups • Different positions • Different measurement media • Different environmental conditions • Over time
Reproducibility
(VIM) Reproducibility is condition of measurement that includes different locations, operators, measuring systems, and replicate measurements on the same or similar objects.
The different measuring systems may use different measurement procedures.
Reproducibility
(General) It is the variation in measured value taken by different persons with the same instrument in the same item used by several times and under the different conditions. It is commonly known as appraiser variation.
FIGURE 7: Reproducibility
Reproducibility
Operator A
Operator C
Operator B
29
Linearity
(From Industry) Linearity is the consistency of the measurement system over a wide range of measurements.
Linearity
Linearity is the difference in the bias values through the expected operating range of the gage.
Stability
(From Industry) A stable measurement system is one where the distribution of measurement errors remains constant and predictable over time, with respect to:
• Mean (Accuracy)
• Standard Deviation (Precision). A stable measurement system has measurement error with:
• No drifts
• No sudden shifts
• No outliers
Stability is evaluated using a control chart -- a plot of the data in time sequence, with
control limits.
Stability
(General) Stability is the total variation in the measurements obtained with a measurement system on the same master or parts when measuring a single characteristic over an extended time period. Stability is sometimes referred to as drift.

30
FIGURE 8: Stability
Part Variation
The Part Variation is a measure of the variation of the process.
If a large number of parts made by a process are measured, 99% (5.15 s) of the
parts would be within the variation limits. The Part Variation is always less than or equal
to the total variation. In most industrial processes the part variation is large compared to
the gage variation and so the assumption that the observed standard deviation is
approximately equal to the total population standard deviation holds good.
Capability
(From Industry) The capability of a measurement system is the amount of the spec window that is lost to measurement error.
The capability of a manufacturing process is its ability to meet its specifications.
Stability
Time1
Time 2
31
Metrology Tool Correlation and Matching
(From Industry) Correlation
If two measurement systems are correlated, there is a reliable way to associate the measurements from the two sites.
Two systems can be correlated without being matched.
Matching
If two measurement systems are matched, their measurements are equivalent. Matched systems are also correlated.
Task specific uncertainty
This is the uncertainty explicitly for a specific task. Usually it refers the measurement with the coordinate measuring machine for a definite measurement plan.
Sources of uncertainty for this are various as it has many different approaches of
sampling strategy, fitting and evaluation algorithms, hardware etc. So the estimation of
total uncertainty for a specific task with CMM is difficult. Some well known simulation
methods to estimate uncertainty for a specific task is simulation by constrain (SBC),
“Virtual CMM”.
No Relationship
If two measurement systems are not correlated and not matched, there is no
reliable way to associate the measurements from the two measurement systems, so the
metrology cannot be transferred. Corrective action for one or both of the measurement
systems would be necessary to improve the equivalence of the two systems.
From all the definitions which are discussed above for Test Uncertainty Ratio,
understanding of task specific uncertainty is very important and for Test Uncertainty it is

32
important to know the specification and MPE for any instrument. If the instrument is
specified in the temperature range 19 to 21 degrees, a temperature of 20.5 is not a part of
test uncertainty. But a temperature of 21.5 degree means the temperature is no longer in
specification. If it is considered that the temperature should be control by tester (Who is
performing test) then the uncertainty due to this temperature should be part of test
uncertainty. Manufacturing companies’ achievement and collapse depend on the
production of high-quality products. Proper understanding and implementation of the
definitions and terms is the core for companies’ success.
CHAPTER 4: CURRENT US AND ISO STANDARDS
The term “Standardization” can be defined as a method to support technical
standards. A technical standard is usually a document that establishes consistent
industrial methods or technological processes. The International Organization for
Standardization is one of the primary organizations whose main activities are developing
and maintaining standards for specifying the basic SI quantities such as length (the
meter), time (the second), and mass (the kilogram). Standards also guide the evaluation of
different measurement methods around the world. As it is important to maintain the
interchangeability of components that are manufactured with different machines and
inspected with different measurement processes, standards provide assurance of part
quality through the calibration and traceability of measurement process. International
standards play a crucially important role in all industries for rational production,
international terminologies, safety and health protection, measurement, analysis, quality
control and environmental protection [16].
The VIM defines that there are different terms and definitions in a hierarchical
system and these can be classified as primary, secondary etc. Calibration is one of the
process by which national standards of measurement are disseminated to end users in
trade, industry, and scientific laboratories [2] and traceability is the ability to verify the
history, location, or application of an item by means of documented recorded
identification [17]. The term traceability is also used to refer to an unbroken chain of
34
comparisons relating an instrument's measurements to a known standard and calibration
to a traceable standard can be used to determine an instrument's bias, precision, and
accuracy [18]. This chapter explains current international (ISO) and national (ASME)
standards that apply to the application of decision rules between customers and suppliers,
the estimation of uncertainty for different measurement situations, and the calculation of
test uncertainty for different CMM performance tests.
4.1 ISO14253-1:1998(E)
(Geometrical Product Specifications (GPS)—Inspection by measurement of work piece and measuring equipment)
One function of industrial measurement is to determine whether a particular part
measurand (length, form, location, etc.) conforms to the specification given on the part
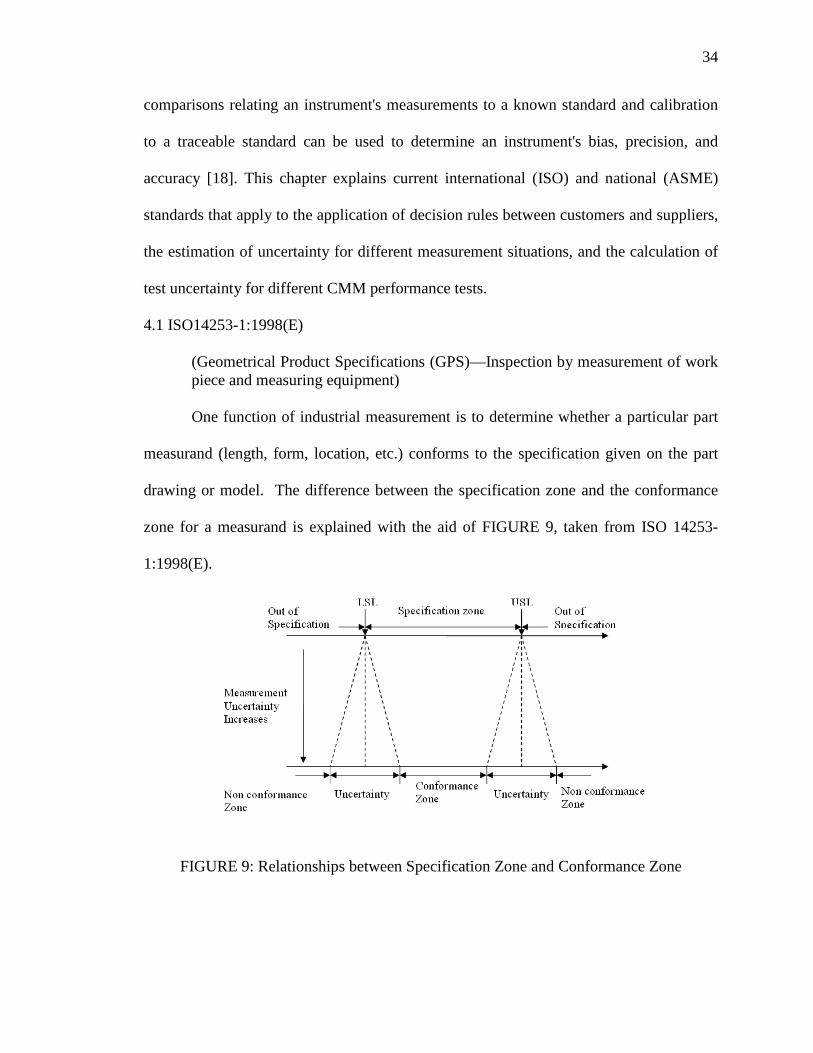
drawing or model. The difference between the specification zone and the conformance
zone for a measurand is explained with the aid of FIGURE 9, taken from ISO 14253-
1:1998(E).
FIGURE 9: Relationships between Specification Zone and Conformance Zone
35
The upper horizontal line of the figure shows the specification zone, which is
bounded by the lower specification limit (LSL) and the upper specification limit (USL).
If the "true value" of the measurand is within the specification zone, then the
specification is satisfied, otherwise the measurand is out of specification. However, we
can never know the "true value" of the measurand. In order to state whether we believe
that the measurand is in or out of specification, we have to acknowledge the existence of
uncertainty in the measurement process. This is shown in the lower horizontal line in
FIGURE 9. If the measurand is in conformance zone, we are suitably confident that the
true value is in specification. Similarly, if the measurand is in the non-conformance zone,
we are confident that the true value is out of specification. For the uncertainty region
shown between conformance and non-conformance, we need to apply the "Decision
rules." A decision rule is a method – agreed on by two parties – to decide whether to
accept or reject a part when the measurement value lies in this uncertainty region.
Estimation of uncertainty is very vital because if the uncertainty is too low which implies
the size of conformance zone will be larger so there is possibility to accept some parts
which are out of specification. At the same time if the uncertainty is too large which
implies the size of the conformance zone is smaller so there is a possibility to reject some
parts which are in specification. The contributors of the uncertainty which are mentioned
in ISO/TR 14253-2 should be considered carefully to estimate the uncertainty more
accurately and consequently it will help to apply decision rule more precisely.
4.2 ASME B89.7.3.1-2001
(Guidelines for decision rules: Considering measurement uncertainty in determining conformance to specifications)
36
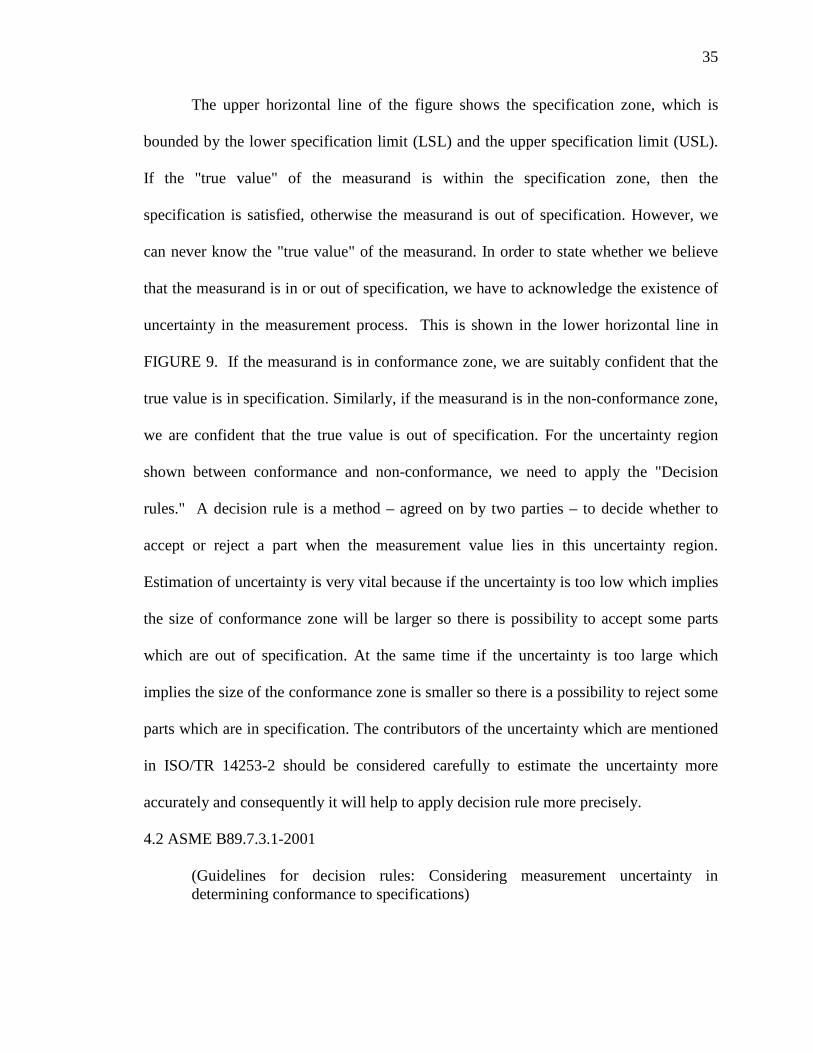
One common decision rule used in industry is "Simple Acceptance and Rejection
Using an N: 1 Decision Rule" as defined in ASME B89.7.3.1-2001. Using this decision
rule, the measured value is compared directly to the specification zone (i.e. the
conformance zone and the specification zone are identical). This rule has the effect of
dividing the risk for accepting bad parts and rejecting good parts between the supplier
and customer. In order to limit this risk, the requirement of N:1 is placed on the decision
rule (N is often 4). In FIGURE 10 below, taken from the B89.7.3.1 document, the
acceptance and rejection zones are shown to be identical to the specification zones.
FIGURE 10: Schematic view of Simple acceptance/rejection
The measurement uncertainty interval is of width 2U, where U is expanded
uncertainty, and the uncertainty interval is no larger than one-fourth the product’s
specification zone for N = 4. [B 89.7.3.1-2001] For the simple acceptance rule with a 4:1
ratio means that the tolerance range is at least 4 times the uncertainty interval. The part
will be accepted if the measurand lies in the specification zone as long as it accomplishes
the uncertainty constraint. Otherwise the part will be rejected. Another term maximum
permissible error (MPE) is sometimes defined by the manufacturer for some instruments.

37
It is refer as ±MPE, so specification zone is twice the MPE value. In this case the
decision rule is MPE is 4 time than the expanded uncertainty. If the measurand lies close
the specification limits to avoid any part in out of specification an alternative decision
rule based on “guard banding” is used. Guard band (defined in B 89.7.3.1-2001) is the
magnitude of the offset from the specification limit to the acceptance or rejection zone. In
this case new terms stringent acceptance zone and relaxed rejection zone are introduced
which are shown in FIGURE 11 taken from this standard.
FIGURE 11: Stringent acceptance and relaxed rejection
For the special case when customer requested for stringent acceptance then the
supplier go for this. In this case acceptance zone is reduced by the amount of guard band
which is called stringent acceptance. On the other hand relaxed rejection zone reject the
parts with the measurand lies in the specification zone by the amount of guard band.

38
4.3 B 89.7.4.1-2005
(Measurement uncertainty and conformance testing: Risk analysis)
This standard is the combination of some statistical definitions. One of them is
Measurement capability index, Cm which is the ratio between tolerance to uncertainty.
For two-sided tolerance zone of width T, Cm=T/4um=T/2U where um is the standard
uncertainty associated with the estimate of the characteristic. One sided tolerance zone of
width T, Cm=T/2um = =T/2U. In the case of calibration or verification of a measuring
instrument with specified, maximum permissible error ±MPE, Cm=T/2ue = 2MPE/2U=
MPE/ U; [Here T= 2MPE] where ue is the standard uncertainty associated with the
instrument error. One can know the quality of the measurement system from
measurement capability index. It has some similarity with Test Uncertainty Ratio (TUR),
Test accuracy ratio (TAR), gauge maker’s rule.
4.4 ISO/TS 23165
(Geometrical product specifications (GPS) -- Guidelines for the evaluation of coordinate measuring machine (CMM) test uncertainty)
This standard describes the specific application of test uncertainty for coordinate
measuring machine (CMM). This is the first standard for test uncertainty. Test
Uncertainty is defined in this document as the expanded uncertainty U, associated solely
with the testing instrument and its use in the test. This describes how to find the
measurement quality of the test. Test uncertainty is the uncertainty for which the "tester"
is responsible when evaluating an instrument. Contributors to the test uncertainty may
include the uncertainty of the reference artifact used by the tester and details of the
tester's measurement procedure that result in errors and uncertainty. For example when
CMM is calibrating by using an artifact, the error contribution from CMM should not be

39
included in test uncertainty budget. So the instrument error is not the part of test
uncertainty. The error contribution from the artifact and the tester (who is doing the test)
should be included in test uncertainty budget. So the uncertainty contributors of test
uncertainty is small than the contributors of measurement uncertainty. So this standard
modifies the conformance and non-conformance zones, according to the decision rule in
ISO 14253-1.
4.5 ASME B89.4.1
(1997 Methods for performance evaluation of coordinate measuring machines)
To verify the CMM performance being accepted or re-verified when it is tested
based on the ISO 14253-1 to prove conformance or non-conformance, ISO 10360-2 helps
to take decision rule. It explains the performance of the CMM used for measuring size is
verified if the error of indication of a CMM for size measurements, E, is not greater than
the maximum permissible error of indication of a CMM for size measurements, MPEE, as
specified by the manufacturer and taking into account the uncertainty of measurement
according to ISO 14253-1. This standard also defines the measurement capability index
Cm ≥ 4 which describes that expanded test uncertainty is not greater than one fourth of
the maximum permissible error (MPE). In any case if Cm < 4, it should be declare in data
sheet. To test the CMM by using the artifact in this case it must need to fulfill the
requirement of Cm. CMM conformance test results are acceptable if they are inside the
MPE value and also satisfies 4:1 rule.
4.6 ISO/TS 15530-3
(Geometrical product Specifications (GPS) - Coordinate measuring machines (CMM): Technique for determining the uncertainty of measurement - Part3: use of calibrated work pieces or standards)

40
This standard explains the experimental technique how to calculate the
uncertainty for the measured feature by using CMM for different physical quantity like
size, distance, position, form, location, datum, orientation. For each task one
measurement plan is important – how one will handle the work piece and how many
times need to do measurement and where to place the work piece. Any place within the
range the work piece can be keep with good fixturing; at least 10 measurement cycles
should be carried out. The uncertainty contributors should be handling carefully like
temperature, cleaning, fixturing, other environmental factors etc. CMM need to be
calibrated first and then start measurement. From measurement data one need to find
standard deviation. Another important part of the calculation is bias estimation. We know
bias is the difference between the average of the measurement data and the reference
value. The reference value should be close to true value which can be taken from NIST
that will give more accurate result otherwise it needed to be taken in a very good
environmental condition. The equation for uncertainty measurement is.
U=|b|+ 2σ
This equation is the combination of both the standard deviation of the
measurement process and also the bias which is the difference between the average
measurement value and reference value. So this expanded uncertainty result is very
useful as it indicates both the standard deviation of repeat measurements and the accuracy
of the measurement results. Precision and accuracy both are essential for the reliability of
measurement results. The measurement results how precise and accurate both are
checked by this equation as a result quality of the products are estimated properly.

CHAPTER 5: TEST UNCERTAINTY RATIO (TUR)
Manufacturing companies' success depends on the production of good quality
products. Precise measurement systems are essential to verify the quality of the product.
Every measurement process contains variations, just as each manufacturing process does.
Manufacturing variations need to be checked by the measurement tools. Measurement
tools need to be verified also to insure the best quality of the products. If the variations of
the measurement system are high enough, it may affect the whole manufacturing
company, as the cost of poor product quality affects the entire manufacturing enterprise.
It is essential for a manufacturing company to have a powerful method to analyze
measurement systems. One such measurement analysis tool is the Test Uncertainty Ratio
(TUR). Other analysis tools which are currently used in industries are Precision over
Tolerance (P/T) and Gage Repeatability and Reproducibility (gage R&R).
5.1 Test Uncertainty Ratio (TUR)
The Test Uncertainty Ratio (TUR) is a measure of the ability of a particular
measurement instrument and/or process to evaluate conformance to specification. TUR is
the ratio between the tolerance or specification and the uncertainty present in the test of
this tolerance or specification. Historically, the rule of thumb for an appropriate ratio was
that the TUR must be at least 10:1.The higher the ratio, the better the performance of the
test. In other words, the instrument can evaluate good vs. bad (conforming vs. non-
conforming) parts with a high degree of confidence. Currently, a ratio of 4:1 or even 3:1

42
is considered acceptable. This is due mostly to the better performance of manufacturing
equipment, and the tighter and tighter specifications on manufactured components. In
many cases, test equipment with an uncertainty small enough for a 10:1 TUR does not
exist, or is prohibitively expensive for the application.
There are two main applications of the TUR: the first is in the measurement
capability of measuring instruments, the second is in the inspection of manufactured
components. Only one metrology tool is available for this experiment, so it was not
possible to compare the measurement capability of metrology tools. One example is used
to explain how to use TUR to find the measurement capability of different tools. The
second application is the main focus – how do we determine the Test Uncertainty Ratio
for a part that we need to measure using a particular gage? The list below gives some of
the important things to consider. Each of these topics will be covered in more depth in
this chapter.
1. The uncertainty statement in the gage's product literature might not be the
uncertainty needed to calculate TUR.
2. The result of the gage's most recent calibration is almost certainly not the
uncertainty needed to calculate TUR.
3. The tolerance value on the part drawing is – if interpreted correctly – going to
be needed to calculate TUR.
4. There will be more than one TUR calculation for a part if there is more than one
tolerance that must be inspected.
For TUR the task-specific measurement uncertainty must be estimated for the
measurand in question for each tolerance. This is the "1" value in the denominator. The

43
range of allowable values for the measurand in question (this is usually the tolerance)
must be known, and is the numerator of the ratio, which is compared to the "4" value. To
determine the TUR, the ratio shown below is evaluated.
TUR
As is easily inferred from the equation above, the TUR ratio compares the
allowable variation for the measurand (the numerator) with the variability associated with
finding the measurand (the denominator).Test Uncertainty Ratio (TUR) will provide the
information about the accuracy and precision of the system, which include repeatability,
reproducibility. One method of evaluating the expanded measurement uncertainty for a
task is to combine the short-term variability of the system with a bias of the system, as
shown below. U= |bias| + 2σmeas
The above equation for expanded uncertainty is taken from ISO 15530 which is
described in Chapter 4. This equation is very useful for checking both the precision and
accuracy at a time.
In calculating TUR, the tolerance is in the numerator, but the question is how to
find the appropriate value for the denominator which may be task specific uncertainty,
the maximum permissible error value of the CMM or the actual result of the CMM
calibration. So, to apply the 4:1 rule one could consider:
1) The CMM specification vs. tolerance
2) The CMM calibration value vs. tolerance
3) The task specific uncertainty vs. tolerance
Let’s take part tolerance 25μm.
1) In the case of CMM specifications (the MPE value) which are mentioned,

44
usually in the manufacturer’s specification.
Let’s consider MPEE = 6μm. In this case, TUR= 25μm / 6 μm ≈ 4:1
2) In the case CMM calibration value, let’s consider the CMM was calibrated
recently and the E value turned out to be 5μm.
In this case, TUR=25μm / 5 μm ≈ 5:1
Both of these experiments were done with the artifact. Neither of these calculations takes
into account the sampling strategy of the part like number of measurements, number of
points, alignment, fixturing, clamping. From the above discussion, it is found that the
TUR can be used to find the end product’s quality. To calculate TUR one should
emphasize how the part is measured. We therefore recommend that the third method be
used.
3) The task specific uncertainty should be calculated for each tolerance, and
this value used when calculating the TUR.
Let’s consider when measuring a part, task specific uncertainty for the first
measuring tool is 4 μm and for the second measuring tool is 5 μm.
In the first case, TUR= 25μm / 4 μm ≈ 6:1 and in the second case, TUR= 25μm /
5 μm ≈ 5:1
The first measurement tool’s measurement capability is better than the second as
the value of TUR in the first case is larger than in the second.
One can easily estimate the measurement uncertainty for a simple measurement
like the length of a block using instruments like the micrometer or slide caliper. In this
case the results will give a direct reflection of the instrument error, so the measurement
process for this is very simple. FIGURE 12 and FIGURE 13 show the measuring task and

45
the micrometer. But for more complicated measurements like the true position of a hole,
shown in FIGURE 14, the results will not give a direct reflection of the instrument error.
For these types of measurements, complex metrology systems such as Coordinate
Measuring Machines (CMMs) (FIGURE 15) are required.
FIGURE 12: Measuring a part
FIGURE 13: Micrometer
TSU Function Uncertainty (single point)

46
FIGURE 14: Measure the position of the hole
FIGURE 15: CMM
There are many simulation methods that help to estimate the task specific
uncertainty in coordinate measurement. Various names are given to these simulation
methods like Virtual CMM, Simulation by constraints, Monte Carlo simulation [13].

47
5.2 TUR Contributors
It is important to know the contributors that affect the TUR, which will help to
calculate TUR. FIGURE 16 shows the contributors to the task specific uncertainty, which
is necessary to find the TUR.
FIGURE 16: Contributors to TUR
The different contributors to the TUR shown in FIGURE 16 are described below.
Definition of task
The task needs to be determined first. It may be size, true position, or any other
characteristic of interest. For every task one needs to calculate TUR individually and
tolerance needs to be determined separately. For example if one needs to calculate TUR
for both size and true position, then the tolerance values for each should be known
separately and used in the appropriate TUR calculation.
Part Tolerance
The tolerance for every task needs to known to calculate TUR. In the case where
one is trying to determine the limiting tolerance value that can be inspected, this can be
Definition of task
Part
Measurement
Measurement
Measurement
Software
Reference for bias calculation
Tester
Environment
TUR

48
obtained by using the lowest acceptable value of TUR and the task-specific uncertainty
for that measurand.
Reference value
The reference value may be needed to calculate the bias for a particular
measurement. The uncertainty of this value will be lowest if it is obtained from an NMI,
but a reference value with a suitably low uncertainty from another reliable source is
acceptable.
Environment
Temperature, vibration, dust, etc may influence the value of Uncertainty. So these
factors need to be taken into consideration when measuring the part.
Measurement Tool
The ability of the measurement tool to measure the part accurately has the greatest
influence on the value of TUR. The long term stability and short term stability of the
measurement tool should be checked to track the performance of the measurement
equipment. However, it is a mistake to think that this is the only source of uncertainty.
Measurement set up
If the set up of both the part and the tool is not perfect, the measurement result can
vary. The position of the part needs to be perfect and clean enough to get the expected
result. Measurement set up should be checked properly so that everything stays stable
when the measurement process continues.
Measurement procedure
One needs to use the measurement procedure as defined for each measurement
tool. If the measurement procedure like number of measurements, duration of

49
measurements, strategy, number of points, order of measurement are not followed
properly the measurement result may not outcome as expected.
Software
The measurement results depend on the software which is used for acquiring
measurements and analyzing measurement data. The quality of the analysis tools also
plays an important role in getting expected results. Even for the same measuring
instrument different analysis tools may give varying results.
Tester
Test results depend on how expert the tester is. Testers’ experience, education,
training, knowledge, performance influences measurement results significantly.
All the contributors described above except tolerance have influence on task
specific uncertainty and consequently TUR.
“PUNDIT” is commercial software for CMMs that simulates task specific
uncertainty. This software was used for this project to estimate task specific uncertainty
by simulation. This allows data input like part tolerance, CMM specifications,
environmental conditions, sampling strategy, manufacturing information that accordingly
gives a very good reflection of actual experiment results. MATLAB program is also used
in this project to estimate task specific uncertainty. MATLAB program is widely used
both for academic purpose and in industry. This method can use data files for the
sampling strategy of the part but it did not include input for environmental conditions. As
environment is a main contributor of uncertainty, these results could not be as close to the
experimental results. PUNDIT and MATLAB were used to get theoretical results. PC-
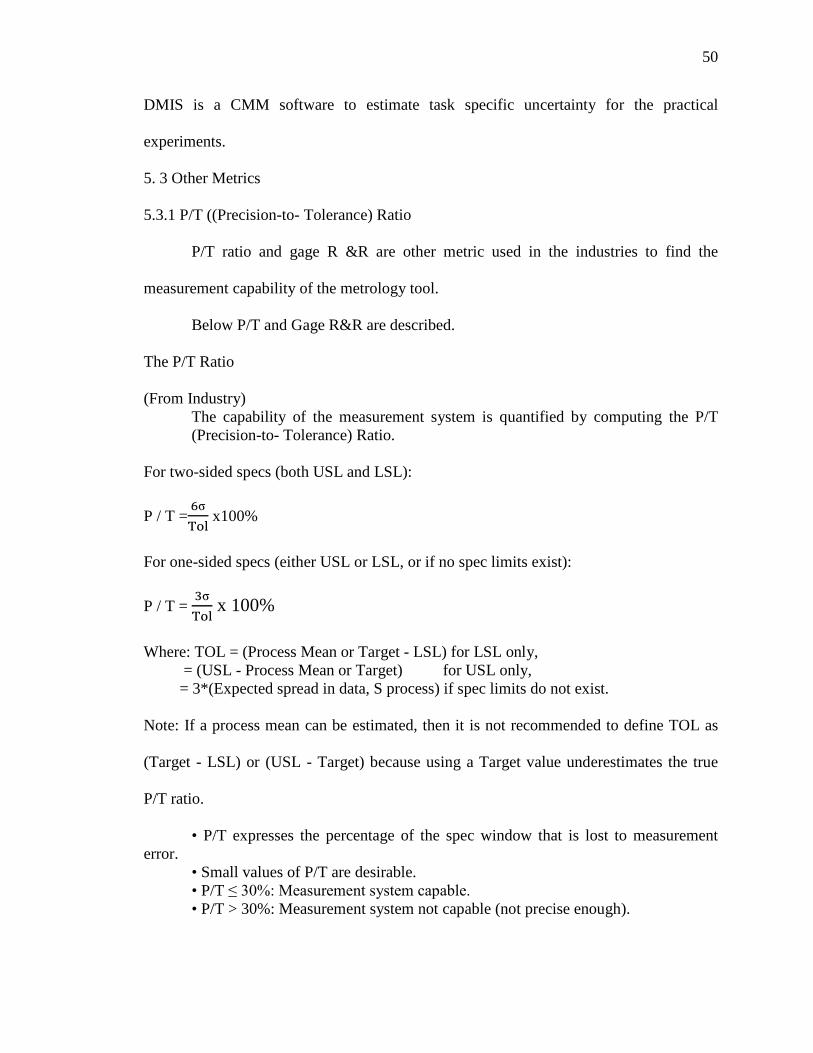
50
DMIS is a CMM software to estimate task specific uncertainty for the practical
experiments.
5. 3 Other Metrics
5.3.1 P/T ((Precision-to- Tolerance) Ratio
P/T ratio and gage R &R are other metric used in the industries to find the
measurement capability of the metrology tool.
Below P/T and Gage R&R are described.
The P/T Ratio
(From Industry) The capability of the measurement system is quantified by computing the P/T (Precision-to- Tolerance) Ratio.
For two-sided specs (both USL and LSL):
P / T = x100%
For one-sided specs (either USL or LSL, or if no spec limits exist): P / T = x 100%
Where: TOL = (Process Mean or Target - LSL) for LSL only, = (USL - Process Mean or Target) for USL only, = 3*(Expected spread in data, S process) if spec limits do not exist. Note: If a process mean can be estimated, then it is not recommended to define TOL as
(Target - LSL) or (USL - Target) because using a Target value underestimates the true
P/T ratio.
• P/T expresses the percentage of the spec window that is lost to measurement error.
• Small values of P/T are desirable. • P/T ≤ 30%: Measurement system capable. • P/T > 30%: Measurement system not capable (not precise enough).

51
5.3.2 Gage Repeatability and Reproducibility (Gage R & R)
There are three basic and widely used methods for determining the Gage R&R.
They are:
• Range method
• Average and Range method
• Analysis of Variance method (ANOVA)
The Average and Range method is discussed in detail.
The Average and Range method is a statistical method that provides an estimate
of the following components-Part Variation, Repeatability, Reproducibility, R&R, Total
Variation.
This method computes the total measurement system variability, which can be
separated into components like repeatability, reproducibility and part variation. This
method involves multiple parts, appraisers and trials to quantify the total variations of
the system.
Consider a measurement system which involves 10 parts, 3 operators and 3 trials.
For each operator, it is necessary to compute the average of the part and trial readings.
As an example consider,
For operator A total average of the measurements is a
For operator B total average of the measurements is b
For operator C total average of the measurements is c
The average range of the measurement made by operators A, B and C are a, b and c
The average of a, b and c is . The average of a, b and c is .
With the above definitions,
52
Upper control limit (UCL) for range chart = D4 X
Lower control limit (LCL) for range chart = D3 X
Where D4 and D3 are control chart constants and can be obtained Appendix C in [1].
With the above data we can calculate following terms.
Repeatability
Repeatability is commonly referred to as Equipment Variation (EV)
Where K1 is constant.
K1 = 5.15/d2 where d2 depends on the number of trials (m) and the number of parts times
the number of appraisers (g). The value of d2 is obtained from Appendix D. All
calculations are based upon predicting 5.15s (99% area under the normal curve).
Reproducibility
Reproducibility is commonly referred to as Appraiser Variation (AV)
K2 = 5.15/d2 where d2 depends on the number of appraisers (m) and g is 1, since there is
only one range calculation. n = number of parts and r = number of Trials
If a negative value is calculated under the square root sign, the value AV defaults to zero.
Repeatability and Reproducibility (R&R)
The variation for repeatability and reproducibility is obtained by taking the root of
the sum of the squares of the appraiser variation and equipment variation.
1* KREV =
)/()*( 222 nrEVKXAV DIFF −=
22& AVEVRR +=
53
Part Variation (PV)
The part variation is determined by multiplying the range of part averages by a
constant.
Here R p is the range of the part average p.
K3 = 5.15/d2 where d2 is dependent on the number of parts and number of appraisers.
Total Variation (TV)
The total variation is the square root of the sum of the squares of the variation for
repeatability and reproducibility (R&R) and the part variation.
Percent of Total Variation
The variability of each factor determined above can be compared with the Total
Variation (TV). The percent of equipment variation of the total variation is computed as
%EV = 100(EV/TV)
The percent of other factors can be calculated as follows.
%AV = 100(AV/TV)
%R&R = 100(R&R/TV)
%PV = 100(PV/TV)
The sum of percentages of the each of the above factors will not equal 100%. The
results could also be given as a percentage of the tolerance specification depending on
the requirements. In that case, the total variation in the denominator is replaced by the
tolerance specification.
The metrics P/T and gage R&R both are reflecting how precise measurement
results are. These do not give any impression of accuracy of measurement results or how
3* KRPV p=
22 )()&( PVRRTV +=

54
close the measurement results to the reference value. Accuracy is also very important for
part measurement. To get the best result, measurement results need to be both precise and
accurate. For the metric P/T, in industry, accuracy is calculated separately. But for gage
R&R it may give a wrong impression of the measurement result as accuracy is not
checked. TUR is giving the reflection of both precision and accuracy. So this is a very
power method comparing to other two methods.
5.4 Calculation of TUR
The block shown in FIGURE 17 is the model for simulation by the PUNDIT
software, MATLAB, and practical experiment by using PC-DMIS software for CMM.
The dimensions and tolerances for the part are shown in FIGURE 18. Task specific
uncertainty was estimated by all these methods. They are described below accordingly.
Two tolerances are evaluated: a size tolerance (the width of the block) and a position
tolerance for the circular feature. In both cases the tolerance value on the drawing is
0.025mm. It will be shown that for the different features, and different measurement
strategies, the TUR value will be different.
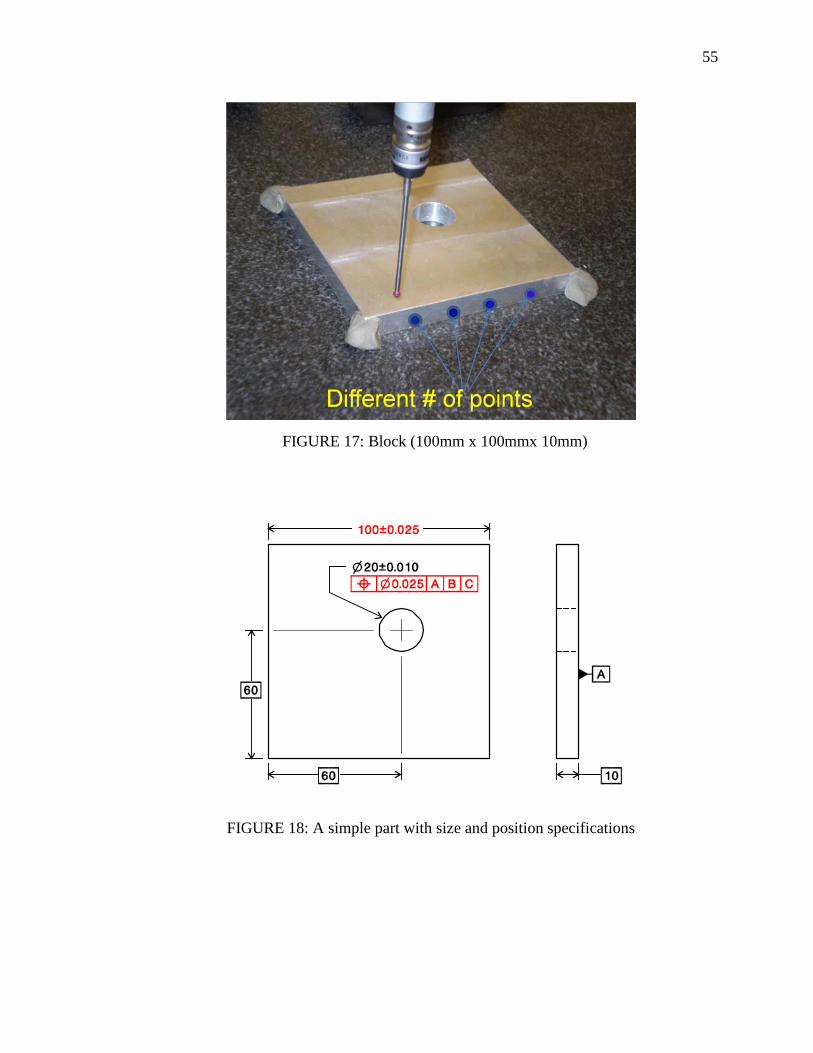
55
FIGURE 17: Block (100mm x 100mmx 10mm)
FIGURE 18: A simple part with size and position specifications
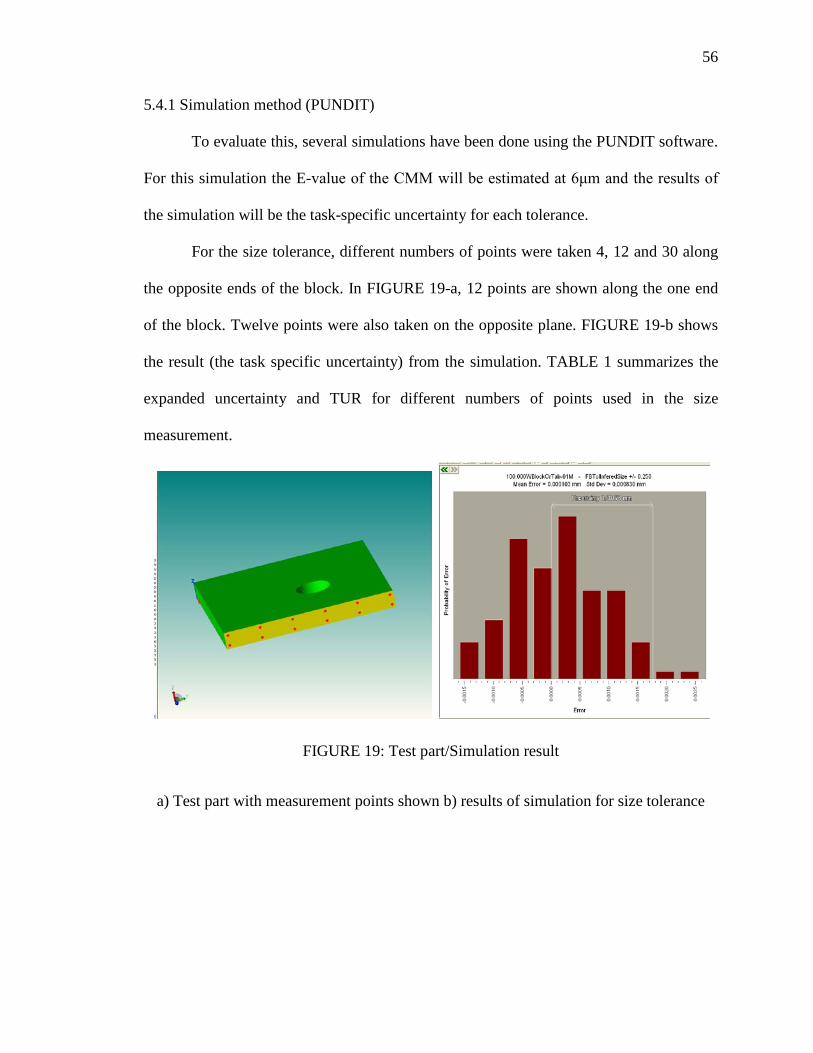
56
5.4.1 Simulation method (PUNDIT)
To evaluate this, several simulations have been done using the PUNDIT software.
For this simulation the E-value of the CMM will be estimated at 6μm and the results of
the simulation will be the task-specific uncertainty for each tolerance.
For the size tolerance, different numbers of points were taken 4, 12 and 30 along
the opposite ends of the block. In FIGURE 19-a, 12 points are shown along the one end
of the block. Twelve points were also taken on the opposite plane. FIGURE 19-b shows
the result (the task specific uncertainty) from the simulation. TABLE 1 summarizes the
expanded uncertainty and TUR for different numbers of points used in the size
measurement.
FIGURE 19: Test part/Simulation result
a) Test part with measurement points shown b) results of simulation for size tolerance
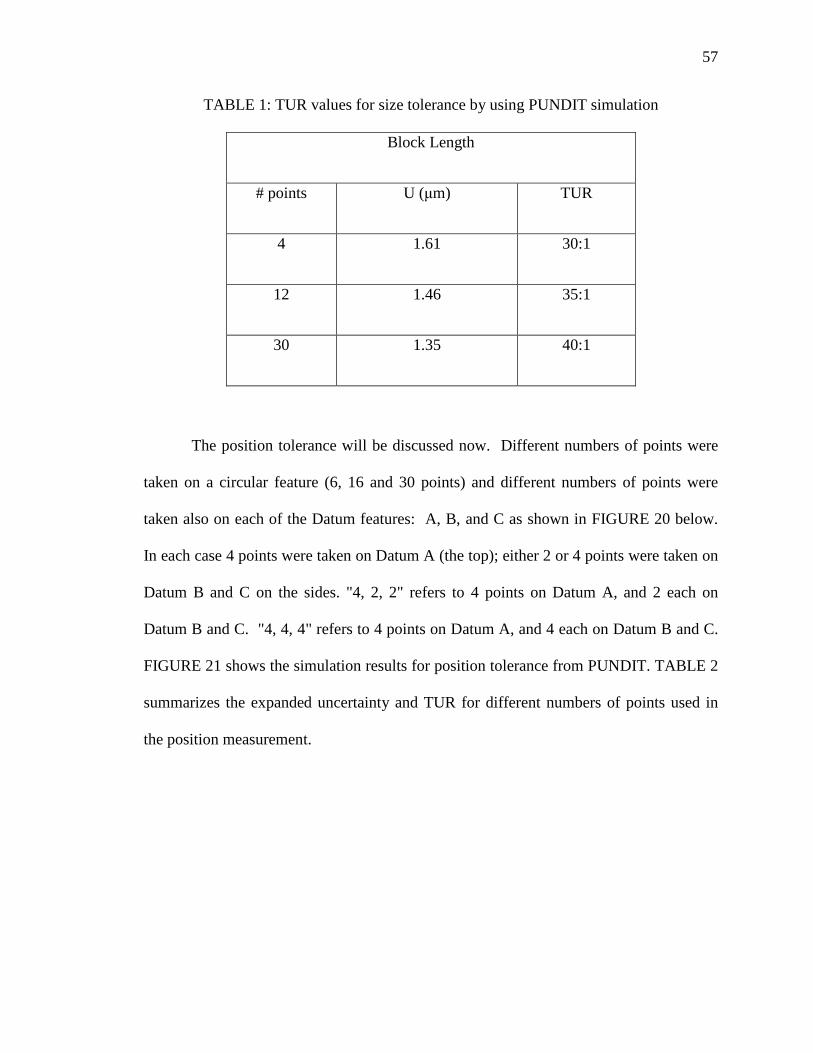
57
TABLE 1: TUR values for size tolerance by using PUNDIT simulation
Block Length
# points U (μm) TUR
4 1.61 30:1
12 1.46 35:1
30 1.35 40:1
The position tolerance will be discussed now. Different numbers of points were
taken on a circular feature (6, 16 and 30 points) and different numbers of points were
taken also on each of the Datum features: A, B, and C as shown in FIGURE 20 below.
In each case 4 points were taken on Datum A (the top); either 2 or 4 points were taken on
Datum B and C on the sides. "4, 2, 2" refers to 4 points on Datum A, and 2 each on
Datum B and C. "4, 4, 4" refers to 4 points on Datum A, and 4 each on Datum B and C.
FIGURE 21 shows the simulation results for position tolerance from PUNDIT. TABLE 2
summarizes the expanded uncertainty and TUR for different numbers of points used in
the position measurement.

58
FIGURE 20: Datum A – 4 points, Datum, Datum C – 2 Points,
FIGURE 21: PUNDIT results of simulation for the position tolerance for the hole
Datum A
Datum C
Datum B

59
TABLE 2: TUR values for the Position Tolerance by using PUNDIT simulation
Circle # of points
Uncertainty and TUR with datum points 4, 2, 2
Uncertainty and TUR with datum points 4, 4, 4
U (μm) TUR U(μm) TUR
6 6.94 4:1 4.19 6:1
16 6.61 4:1 4.01 6:1
30 6.03 4:1 3.74 6:1
Both TABLE 1 and TABLE 2 show that for the same tolerance the TUR values are
different for size, position, and in some case also depending on the number of points
measured. In both cases, by increasing the number of points, task specific uncertainty
decreased. In the size case, by increasing the number of points, TUR value increases,
which is expected. In the position case, there is more dependence on the datum
measurement than the circle sampling strategy.
5.4.2 MATLAB Program
MATLAB programs were used to find task specific uncertainty and consequently
the TUR. These programs used “Monte-Carlo” simulation of random errors. In the case
of size, it was possible to generate lines, different numbers of points, and find the
distance between two lines. For the case of position, it was possible to generate datums,
datum points, circle points, and estimate true positions of the hole. The number of points
in MATLAB was taken in one row, but in PUNDIT and practical experiment they were
taken in two rows, however the number of points was the same. In the MATLAB
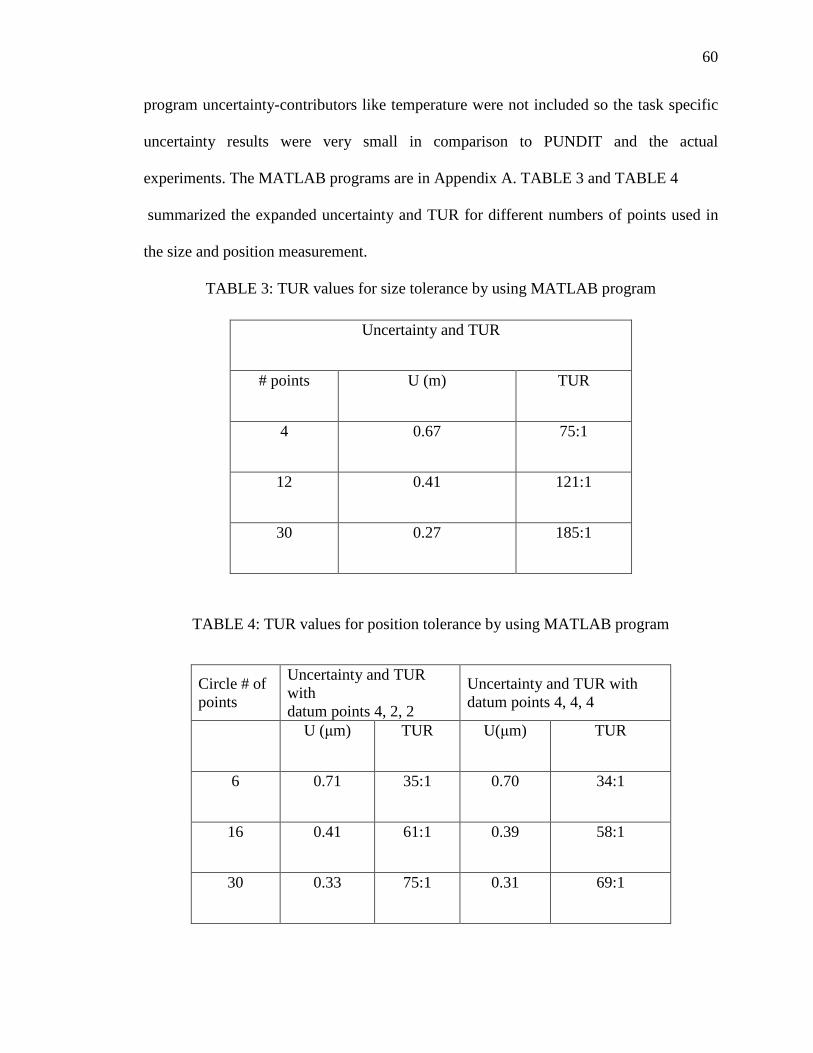
60
program uncertainty-contributors like temperature were not included so the task specific
uncertainty results were very small in comparison to PUNDIT and the actual
experiments. The MATLAB programs are in Appendix A. TABLE 3 and TABLE 4
summarized the expanded uncertainty and TUR for different numbers of points used in
the size and position measurement.
TABLE 3: TUR values for size tolerance by using MATLAB program
Uncertainty and TUR
# points U (m) TUR
4 0.67 75:1
12 0.41 121:1
30 0.27 185:1
TABLE 4: TUR values for position tolerance by using MATLAB program
Circle # of points
Uncertainty and TUR with datum points 4, 2, 2
Uncertainty and TUR with datum points 4, 4, 4
U (μm) TUR U(μm) TUR
6 0.71 35:1 0.70 34:1
16 0.41 61:1 0.39 58:1
30 0.33 75:1 0.31 69:1
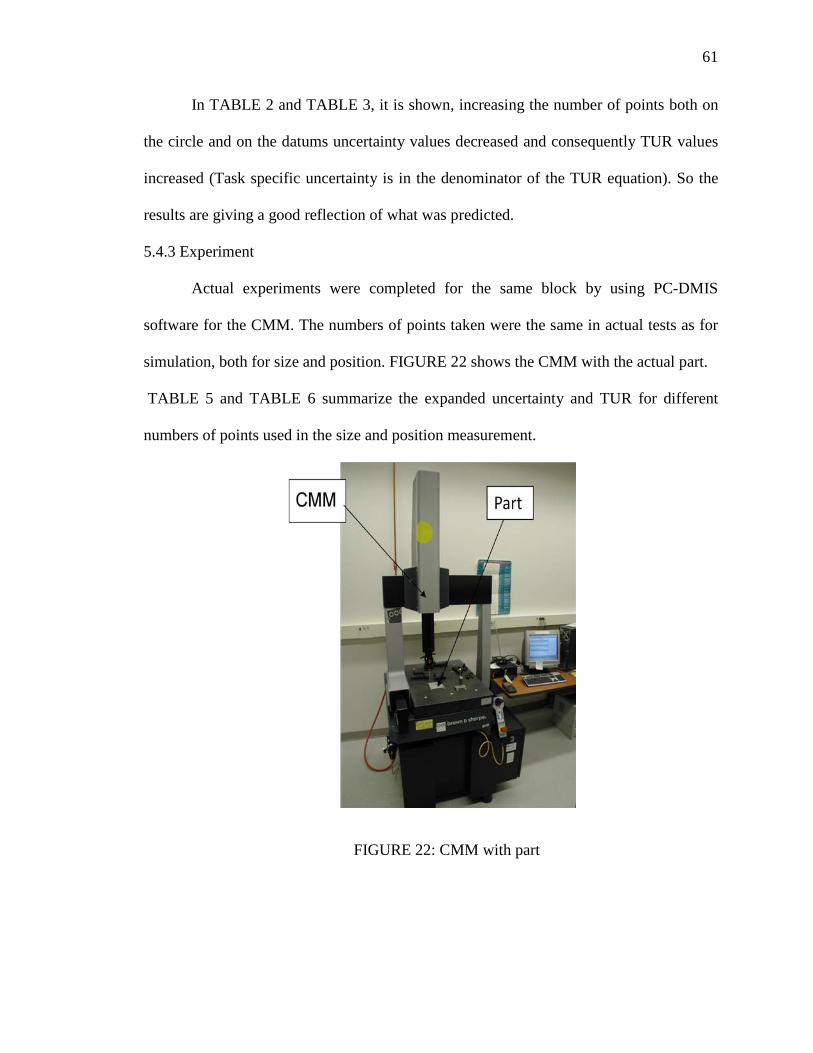
61
In TABLE 2 and TABLE 3, it is shown, increasing the number of points both on
the circle and on the datums uncertainty values decreased and consequently TUR values
increased (Task specific uncertainty is in the denominator of the TUR equation). So the
results are giving a good reflection of what was predicted.
5.4.3 Experiment
Actual experiments were completed for the same block by using PC-DMIS
software for the CMM. The numbers of points taken were the same in actual tests as for
simulation, both for size and position. FIGURE 22 shows the CMM with the actual part.
TABLE 5 and TABLE 6 summarize the expanded uncertainty and TUR for different
numbers of points used in the size and position measurement.
FIGURE 22: CMM with part

62
TABLE 5: Experimental results of size tolerance by using PC-DMIS software
Uncertainty and TUR
# of points 2σ (μm) U(μm) TUR
4 0.97 16.45 4:1
12 0.84 15.04 4:1
30 0.63 14.38 4:1
TABLE 6: Experimental results of position tolerance by using PC-DMIS software
TABLE 5 and TABLE 6 show that by increasing the numbers of points, standard
deviation and uncertainty values decreased as predicted. TUR value did not change since
bias dominated the results.
# of points
Uncertainty and TUR with datum points 4,2,2
Uncertainty and TUR with datum points 4,4,4
2σ (μm) U(μm) TUR 2σ (μm) U(μm) TUR
6 1.29 10.29 2:1 1.78 9.57 3:1
16 1.62 9.38 3:1 1.36 8.03 3:1
30 1.56 9.01 3:1 1.21 7.98 4:1
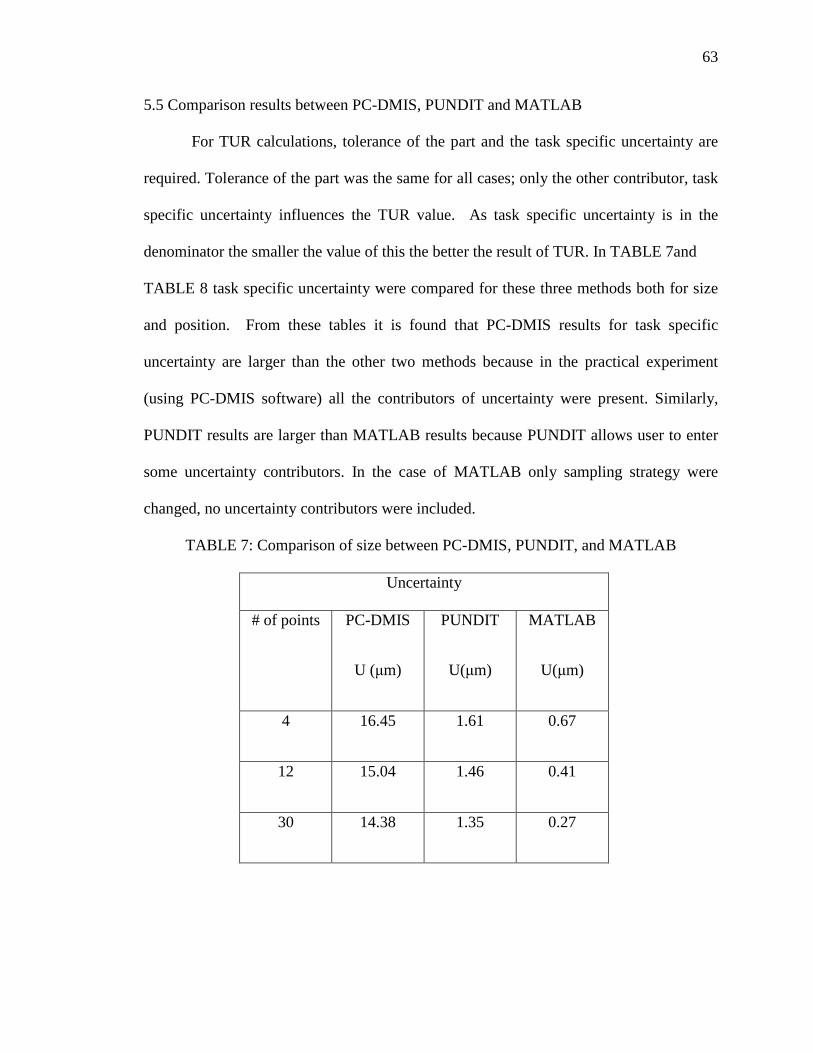
63
5.5 Comparison results between PC-DMIS, PUNDIT and MATLAB
For TUR calculations, tolerance of the part and the task specific uncertainty are
required. Tolerance of the part was the same for all cases; only the other contributor, task
specific uncertainty influences the TUR value. As task specific uncertainty is in the
denominator the smaller the value of this the better the result of TUR. In TABLE 7and
TABLE 8 task specific uncertainty were compared for these three methods both for size
and position. From these tables it is found that PC-DMIS results for task specific
uncertainty are larger than the other two methods because in the practical experiment
(using PC-DMIS software) all the contributors of uncertainty were present. Similarly,
PUNDIT results are larger than MATLAB results because PUNDIT allows user to enter
some uncertainty contributors. In the case of MATLAB only sampling strategy were
changed, no uncertainty contributors were included.
TABLE 7: Comparison of size between PC-DMIS, PUNDIT, and MATLAB
Uncertainty
# of points PC-DMIS
U (μm)
PUNDIT
U(μm)
MATLAB
U(μm)
4 16.45 1.61 0.67
12 15.04 1.46 0.41
30 14.38 1.35 0.27

64
TABLE 8: Comparison of position between PC-DMIS, PUNDIT, and MATLAB
5.6 Experiments for Steel and Aluminum plates
Experiments have been done to compare the TUR and P/T ratio for different
measurement tasks. It is found P/T is the metric which is already being used in the
industry. So TUR is compared with P/T though both are not the indication of the same
parameters. P/T is only indicating precision, so bias is added separately in the tables to
get an idea of the accuracy of the measurement results. It is expected that where P/T
smaller the TUR value will be larger. This is reflected in some of the results but in some
results it is not reflected properly as bias was dominating. As the task specific uncertainty
for TUR was calculated by using the equation U= |bias| + 2σmeas, bias influenced the
TUR values.
# of points
Uncertainty and TUR with datum points 4,2,2
Uncertainty and TUR with datum points 4,4,4
PC-
DMIS
U (μm)
PUNDIT
U(μm)
MATLAB
U(μm)
PC-
DMIS
U (μm)
PUNDIT
U(μm)
MATLAB
U(μm)
6 10.29 6.94 0.71 9.57 4.19 0.70
16 9.38 6.61 0.41 8.03 4.01 0.39
30 9.01 6.03 0.33 7.98 3.74 0.31
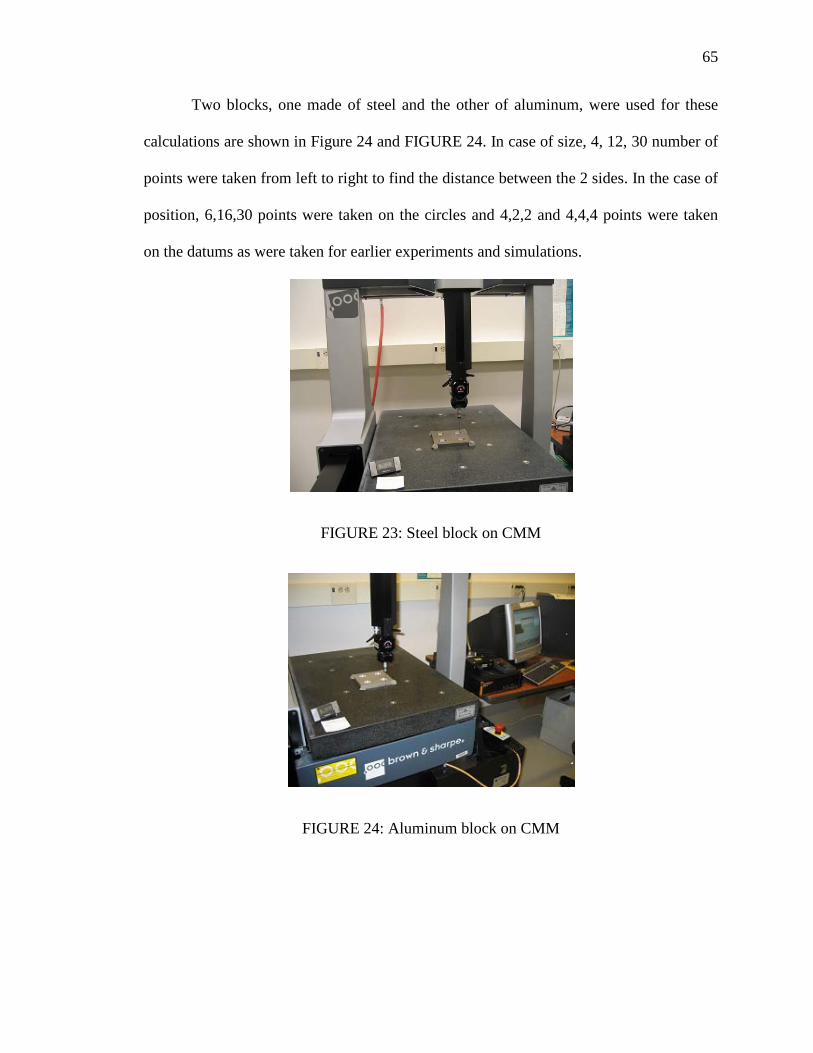
65
Two blocks, one made of steel and the other of aluminum, were used for these
calculations are shown in Figure 24 and FIGURE 24. In case of size, 4, 12, 30 number of
points were taken from left to right to find the distance between the 2 sides. In the case of
position, 6,16,30 points were taken on the circles and 4,2,2 and 4,4,4 points were taken
on the datums as were taken for earlier experiments and simulations.
FIGURE 23: Steel block on CMM
FIGURE 24: Aluminum block on CMM

66
5.6.1 Size Tolerance results
The experimental results for the size tolerance of steel block are shown in TABLE
9 and TABLE 10
TABLE 9: Size Tolerance of Steel Plate
U, TUR, P/T, Bias for Steel plate by using PC-DMIS software
#of
points
2σ (μm) U (μm) TUR P/T
(%)
Bias
(μm)
4 1.03 26.98 2:1 6.18 26.88
12 1.03 7.05 7:1 6.18 6.02
30 0.632 2.27 30:1 3.79 1.64
TABLE 10: Size Tolerance of Aluminum Plate
U, TUR, P/T, Bias for Aluminum plate by using PC-DMIS software
#of
points
2σ (μm) U (μm) TUR P/T Bias
4 0.843 41.80 1:1 5.05 41.37
12 0.632 9.65 5:1 3.79 9.02
30 0.500 9.44 5:1 3.0 8.94
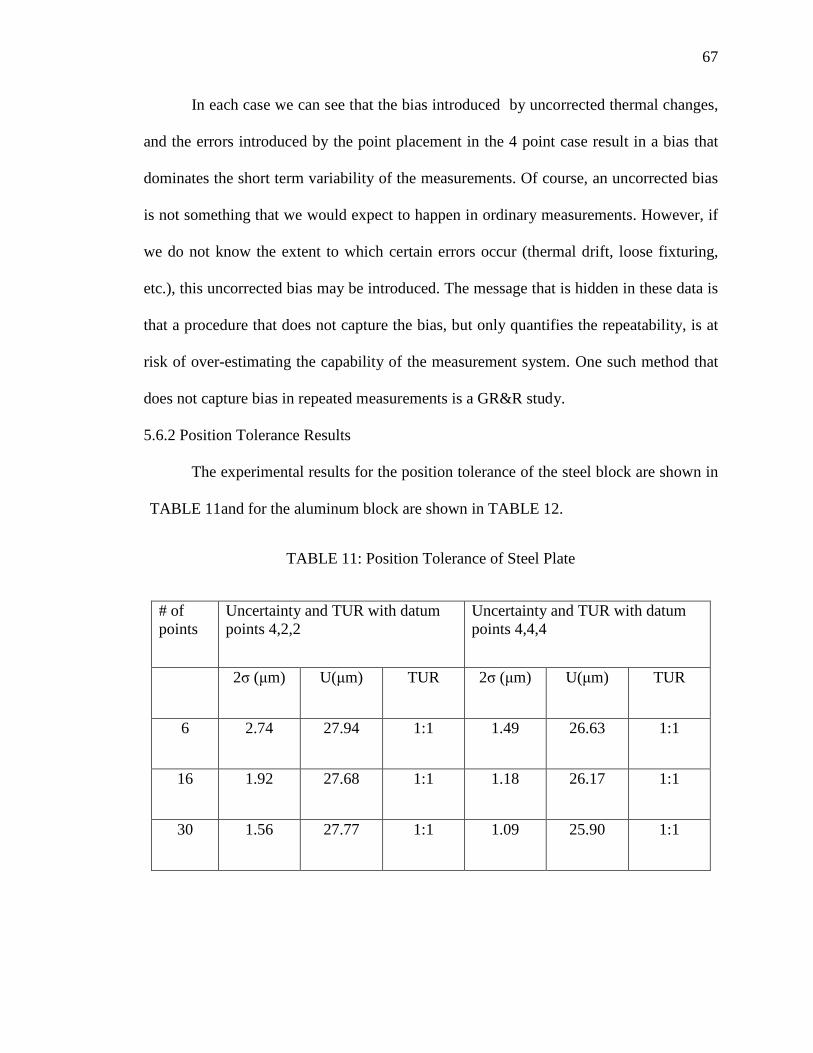
67
In each case we can see that the bias introduced by uncorrected thermal changes,
and the errors introduced by the point placement in the 4 point case result in a bias that
dominates the short term variability of the measurements. Of course, an uncorrected bias
is not something that we would expect to happen in ordinary measurements. However, if
we do not know the extent to which certain errors occur (thermal drift, loose fixturing,
etc.), this uncorrected bias may be introduced. The message that is hidden in these data is
that a procedure that does not capture the bias, but only quantifies the repeatability, is at
risk of over-estimating the capability of the measurement system. One such method that
does not capture bias in repeated measurements is a GR&R study.
5.6.2 Position Tolerance Results
The experimental results for the position tolerance of the steel block are shown in
TABLE 11and for the aluminum block are shown in TABLE 12.
TABLE 11: Position Tolerance of Steel Plate
# of points
Uncertainty and TUR with datum points 4,2,2
Uncertainty and TUR with datum points 4,4,4
2σ (μm) U(μm) TUR 2σ (μm) U(μm) TUR
6 2.74 27.94 1:1 1.49 26.63 1:1
16 1.92 27.68 1:1 1.18 26.17 1:1
30 1.56 27.77 1:1 1.09 25.90 1:1

68
TABLE 12: Position Tolerance of Aluminum Plate
It is found in the tables above that the 2σ spread of data from multiple
measurements is improved by taking more points on the datum features, but because the
bias in the results is so large, by comparison, this improvement is not reflected in the
TUR values. TABLE 13 shows the P/T ratio for these measurements for steel block and
TABLE 14 for aluminum block along with the bias in both X and Y.
TABLE 13: P/T and Bias of steel plate
# of points
Uncertainty and TUR with datum points 4,2,2
Uncertainty and TUR with datum points 4,4,4
2σ (μm) U(μm) TUR 2σ (μm) U(μm) TUR
6 2.69 70.48 0.354:1 1.63 67.57 0.369:1
16 1.24 68.48 0.365:1 1.25 66.72 0.374:1
30 0.526 67.20 0.372:1 0.34 64.79 0.385:1
# of points
Uncertainty and TUR with datum points 4,2,2
Uncertainty and TUR with datum points 4,4,4
P/T (%)
Bias(X and Y) (μm) 2σ (μm) Bias(X and Y) (μm)
6 10.93 20.9 8.2 5.96 21.6 9.6
16 7.68 23.1 8.6 4.725 22.2 8.7
30 6.24 23.2 8.1 4.36 22.0 8.0
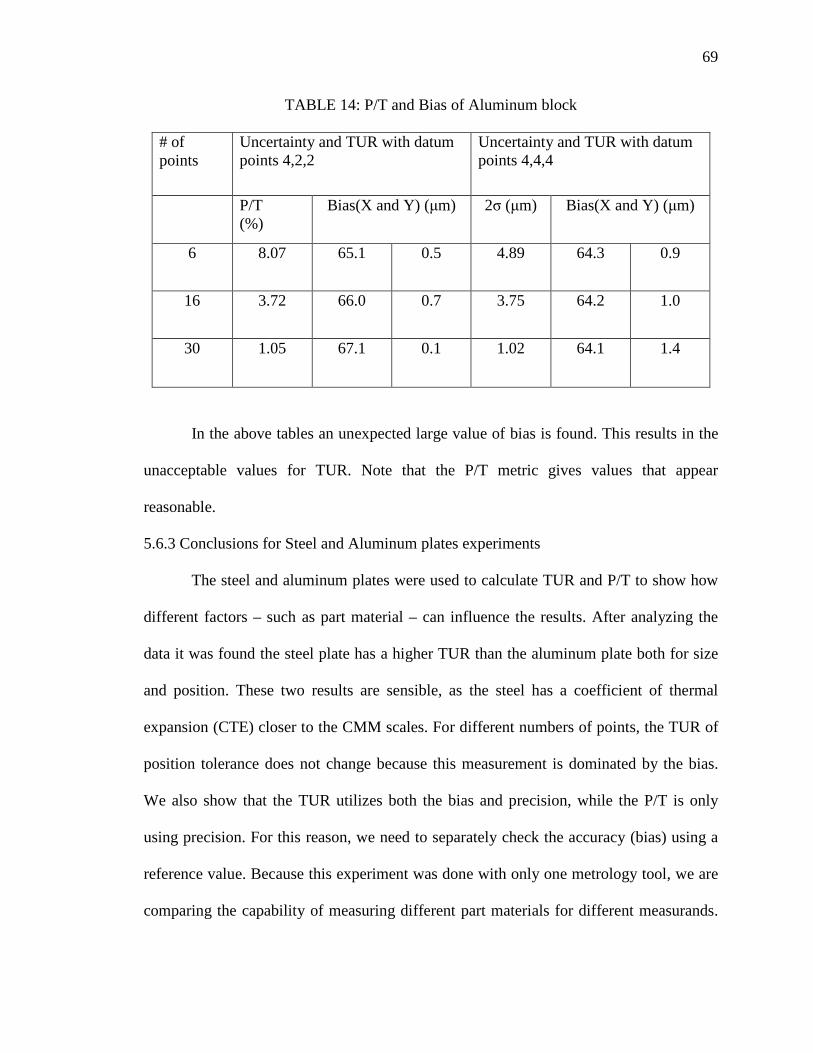
69
TABLE 14: P/T and Bias of Aluminum block
In the above tables an unexpected large value of bias is found. This results in the
unacceptable values for TUR. Note that the P/T metric gives values that appear
reasonable.
5.6.3 Conclusions for Steel and Aluminum plates experiments
The steel and aluminum plates were used to calculate TUR and P/T to show how
different factors – such as part material – can influence the results. After analyzing the
data it was found the steel plate has a higher TUR than the aluminum plate both for size
and position. These two results are sensible, as the steel has a coefficient of thermal
expansion (CTE) closer to the CMM scales. For different numbers of points, the TUR of
position tolerance does not change because this measurement is dominated by the bias.
We also show that the TUR utilizes both the bias and precision, while the P/T is only
using precision. For this reason, we need to separately check the accuracy (bias) using a
reference value. Because this experiment was done with only one metrology tool, we are
comparing the capability of measuring different part materials for different measurands.
# of points
Uncertainty and TUR with datum points 4,2,2
Uncertainty and TUR with datum points 4,4,4
P/T (%)
Bias(X and Y) (μm) 2σ (μm) Bias(X and Y) (μm)
6 8.07 65.1 0.5 4.89 64.3 0.9
16 3.72 66.0 0.7 3.75 64.2 1.0
30 1.05 67.1 0.1 1.02 64.1 1.4
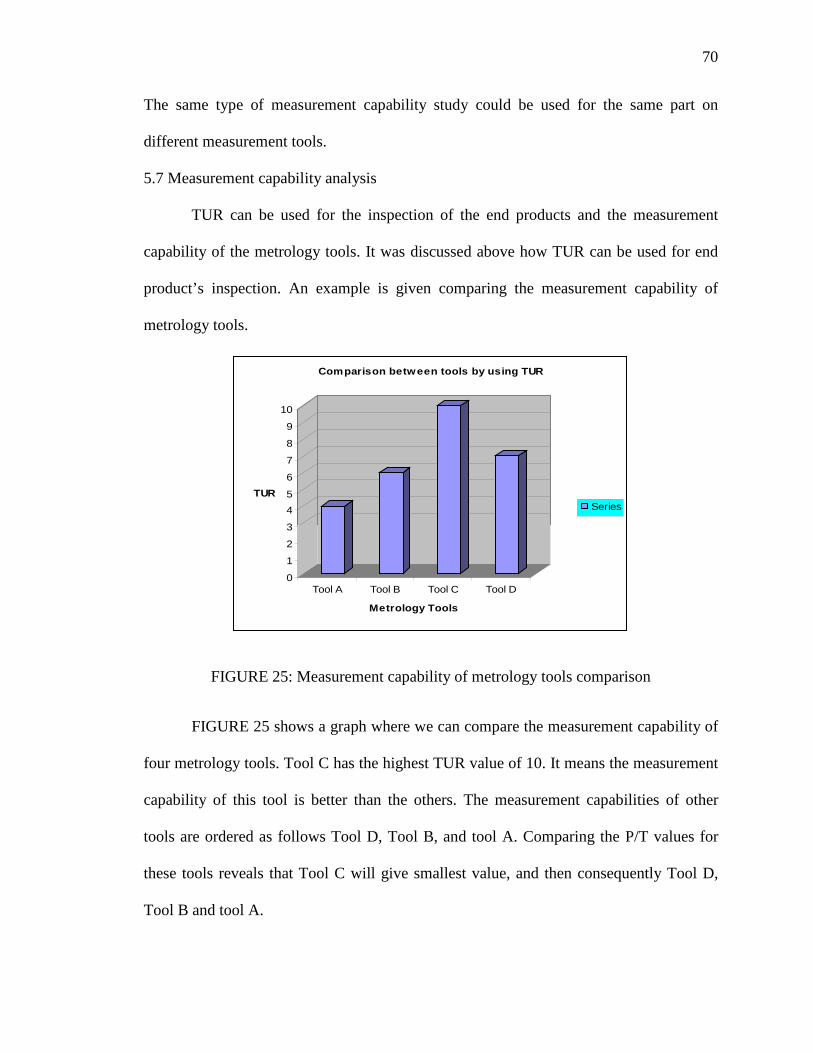
70
The same type of measurement capability study could be used for the same part on
different measurement tools.
5.7 Measurement capability analysis
TUR can be used for the inspection of the end products and the measurement
capability of the metrology tools. It was discussed above how TUR can be used for end
product’s inspection. An example is given comparing the measurement capability of
metrology tools.
FIGURE 25: Measurement capability of metrology tools comparison
FIGURE 25 shows a graph where we can compare the measurement capability of
four metrology tools. Tool C has the highest TUR value of 10. It means the measurement
capability of this tool is better than the others. The measurement capabilities of other
tools are ordered as follows Tool D, Tool B, and tool A. Comparing the P/T values for
these tools reveals that Tool C will give smallest value, and then consequently Tool D,
Tool B and tool A.
0
1
2
3
45
6
7
8
9
10
TUR
Tool A Tool B Tool C Tool D
Metrology Tools
Comparison between tools by using TUR
Series1
CHAPTER 6: TEST UNCERTAINTY Measurements and measurement results have significant influence in many
industrial sectors like trade, manufacturing companies, health services, safety,
environmental protection, and others. In commercial transactions, the uncertainty of
measurement results is important to decisions made between suppliers and customers.
The uncertainty contributors need to be considered carefully to obtain a good estimate of
the product quality. One of the uncertainty contributors is the measurement equipment,
which naturally plays a key role in the measurement process. The uncertainty of
calibrating the measuring instrument can be described as "test uncertainty." This
uncertainty value is intended to capture “how well” the instrument errors are known, and
thus the actual instrument errors are excluded. Contributors to the test uncertainty may
include the uncertainty of the reference artifact used by the tester and details of the
tester's measurement procedure that result in errors and uncertainty. It is often the case
that the uncertainty from the artifact is small enough that it does not affect the test very
much. For test uncertainty the "tester" is responsible when evaluating an instrument.
Tester performance has a great influence on the test uncertainty results. Better
performance by the tester can result in a smaller test uncertainty.
So the test uncertainty significantly depends on the influence of the human
operator, test procedure (which should be well recognized) and reference artifact. When
calculating the test uncertainty all these factors should be reasonably estimated to ensure

72
that the result does not give any wrong impression of uncertainty. Most notably absent
from the test uncertainty is the repeatability and resolution of the instrument under test.
Test uncertainty is only the indication of the quality of the test; it is not the machine
performance. By defining the test, how well the test is performed, the influence of the
operator, selection and placement of test instrument; test uncertainty can be decreased
and consequently, precision and usefulness of the test can be increased. Measurement
uncertainty is a familiar topic in industry and discussed in chapter 2. In this chapter test
uncertainty is discussed in detail.
6.1 Definitions
Some related terms of test uncertainty are defined from VIM.
Calibration
Set of operations that establish, under specified conditions, the relationship between values of quantities indicated by a measuring system, or values represented by a material measure or a reference material, and the corresponding values realized by standards.
A calibration may be expressed by a statement, calibration function, calibration
diagram, calibration curve, or calibration table. In some cases, it may consist of an
additive or multiplicative correction of the indication with associated measurement
uncertainty.
It is necessary to verify the measuring instruments’ performance through the
calibration process which is a reliable source both for the suppliers and the clients. Many
disputes occurred due to the lack of proper understanding of the calibration process.
Sometimes products are accepted by the supplier but rejected from the customers. So the
problem is usually solved by a third party, calibration service. Artifacts and reference

73
standards can be considered as reliable reference values when certified by a calibration
laboratory.
For test uncertainty, measurement instruments need to be calibrated by using the
reference artifact. These calibrations can be done by the supplier, client, and calibration
lab. Consequently, the different test uncertainty results can indicate comparisons between
the testers’ performance and the artifacts quality.
Calibration hierarchy
It is the sequence of calibrations from a reference to the final measuring system, where the outcome of each calibration depends on the outcome of the previous calibration.
The elements of a calibration hierarchy are one or more measurement standards
and measuring systems operated according to measurement procedures. For this
definition, the ‘reference’ can be a definition of a measurement unit through its practical
realization, or a measurement procedure, or a measurement standard. A comparison
between two measurement standards may be viewed as a calibration if the comparison is
used to check and, if necessary, correct the quantity value and measurement uncertainty
attributed to one of the measurement standards.
All measuring instruments which are using in the different sectors of human life
are connected with the national standard through a continuous chain of the calibration
process. Calibration hierarchy is important for more reliability for the acceptance of a
product.
As test uncertainty is a new concept, it is essential for its reliability to fulfill the criteria of
the unbroken chain of the calibration process.
74
Metrological traceability
It is the property of a measurement result whereby the result can be related to a reference through a documented unbroken chain of calibrations, each contributing to the measurement uncertainty.
For this definition, a ‘reference’ can be a definition of a measurement unit through
its practical realization, or a measurement procedure including the measurement unit for a
non-ordinal quantity, or a measurement standard. Metrological traceability requires an
established calibration hierarchy. Specification of the reference must include the time at
which this reference was used in establishing the calibration hierarchy, along with any
other relevant metrological information about the reference, such as when the first
calibration in the calibration hierarchy was performed. For measurements with more than
one input quantity in the measurement model, each of the input quantity values should
itself be metrological traceable and the calibration hierarchy involved may form a
branched structure or a network. The effort involved in establishing metrological
traceability for each input quantity value should be commensurate with its relative
contribution to the measurement result. Metrological traceability of a measurement
result does not ensure that the measurement uncertainty is adequate for a given purpose
or that there is an absence of mistakes. A comparison between two measurement
standards may be viewed as a calibration if the comparison is used to check and, if
necessary, correct the quantity value and measurement uncertainty attributed to one of the
measurement standards. The abbreviated term “traceability” is sometimes used to mean
‘metrological traceability’ as well as other concepts, such as ‘sample traceability’ or
‘document traceability’ or ‘instrument traceability’ or ‘material traceability’, where the
75
history (“trace”) of an item is meant. Therefore, the full term of “metrological
traceability” is preferred if there is any risk of confusion.
Each contributor of test uncertainty needs to fulfill the criteria of metrological
traceability for acceptability.
Metrological traceability chain
Traceability chain is a sequence of measurement standards and calibrations that is used to relate a measurement result to a reference.
A metrological traceability chain is defined through a calibration hierarchy. A
metrological traceability chain is used to establish metrological traceability of a
measurement result. A comparison between two measurement standards may be viewed
as a calibration if the comparison is used to check and, if necessary, correct the quantity
value and measurement uncertainty attributed to one of the measurement standards.
Test uncertainty of any instrument needs to fulfill the criteria of the unbroken
chain of metrological traceability.
6.2 Contributors of test uncertainty
The contributors of test uncertainty are those which are associated when testing an
instrument. Test uncertainty included the uncertainty contribution from both the person
who is doing the test (the tester) and the reference artifact (test equipment) which the
person is using to do the test. ISO/TS 23165 describes any error introduced by the
instrument should not be included in test uncertainty, so the uncertainty from instrument
is not included in test uncertainty. Two examples of estimating test uncertainty are
explained; the calibration of a CMM and the calibration of a micrometer.
6.2.1 Test uncertainty contributors for CMM
The CMM is calibrated by using a step gage. This is shown in FIGURE 26.
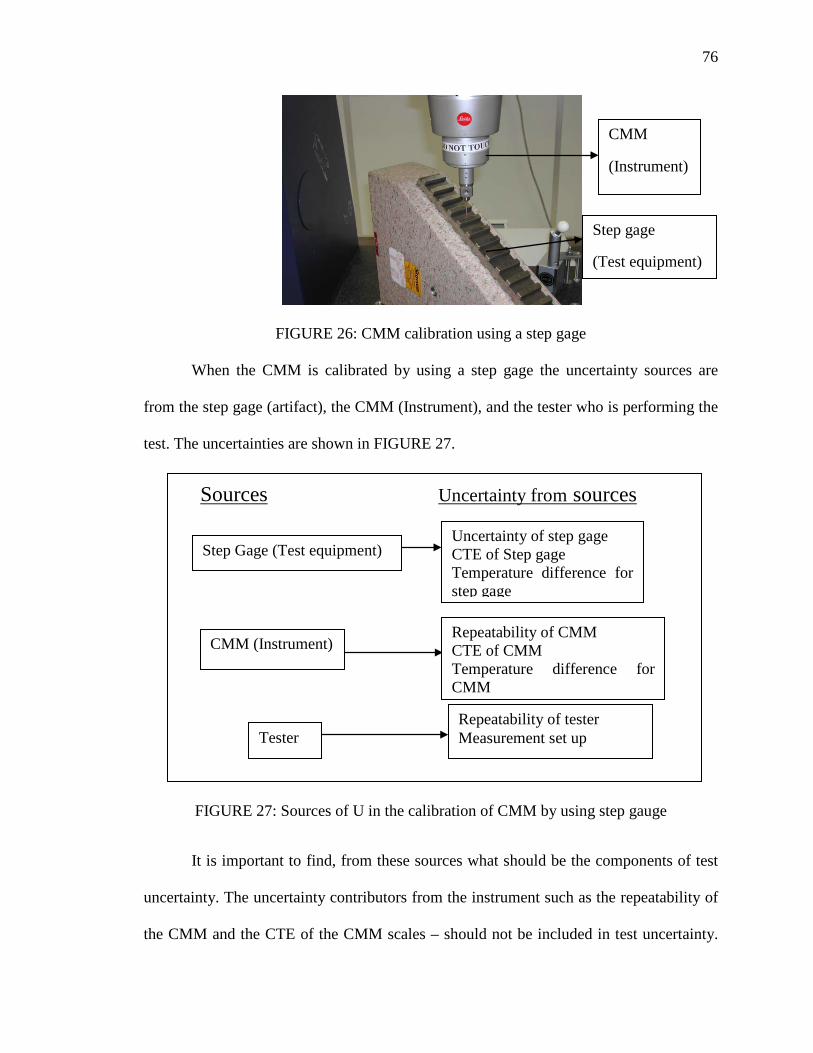
76
FIGURE 26: CMM calibration using a step gage
When the CMM is calibrated by using a step gage the uncertainty sources are
from the step gage (artifact), the CMM (Instrument), and the tester who is performing the
test. The uncertainties are shown in FIGURE 27.
FIGURE 27: Sources of U in the calibration of CMM by using step gauge
It is important to find, from these sources what should be the components of test
uncertainty. The uncertainty contributors from the instrument such as the repeatability of
the CMM and the CTE of the CMM scales – should not be included in test uncertainty.
CMM
(Instrument)
Step gage
(Test equipment)
Sources Uncertainty from sources
Step Gage (Test equipment) Uncertainty of step gage CTE of Step gage Temperature difference for step gage
CMM (Instrument)
Repeatability of CMM CTE of CMM Temperature difference for CMM
Tester Repeatability of tester Measurement set up

77
These are attributes of the instrument that is being tested, not the quality of the test. It is
important to check the specification of the instrument in the case of uncertainty due to
temperature. When temperature is maintained within the specification, it should not be
included in test uncertainty. In the above example temperature was within the limit, the
uncertainty due to the temperature of CMM and the step gage should not be included in
test uncertainty. If temperature is not maintained within the specification uncertainty
from temperature should be included in test uncertainty. Other sources of uncertainty
from the step gage and tester like repeatability, fixturing, and cleaning which are the
tester’s responsibilities should be included in test uncertainty. The contributors of test
uncertainty are shown in FIGURE 28.
.
FIGURE 28: Sources of test U.in the calibration of CMM by using step gauge
Test uncertainty when calibrating the CMM by using step gage is shown in
FIGURE 29.
Tester Repeatability of tester
Measurement set up
CMM (Instrument)
Repeatability of CMM X CTE of CMM X Temperature difference for CMM X
Step Gage Uncertainty of step gage CTE of Step gage Temperature difference for step gage X

78
FIGURE 29: Sources of test U in the calibration of CMM by using step gage
The value of test uncertainty is smaller than the measurement uncertainty (some
sources of uncertainty are not included in test uncertainty) and is not any fixed value. The
performance of the tester during the test may be the main source of error and it may vary
in different tests.
6.2.2 Test uncertainty contributor for micrometer and gage block
Test uncertainty is explained for calibrating a micrometer using the gage block
and calibrating the gage block by using a micrometer. The same environmental condition
was maintained and the same data will be analyzed both for the micrometer and gage
block. The micrometer and gage blocks are shown in FIGURE 30 and FIGURE 31.
Step Gage
Tester Repeatability of tester
Measurement set up
Uncertainty of step gage
CTE of Step gage

79
FIGURE 30: Micrometer
FIGURE 31: Gage block
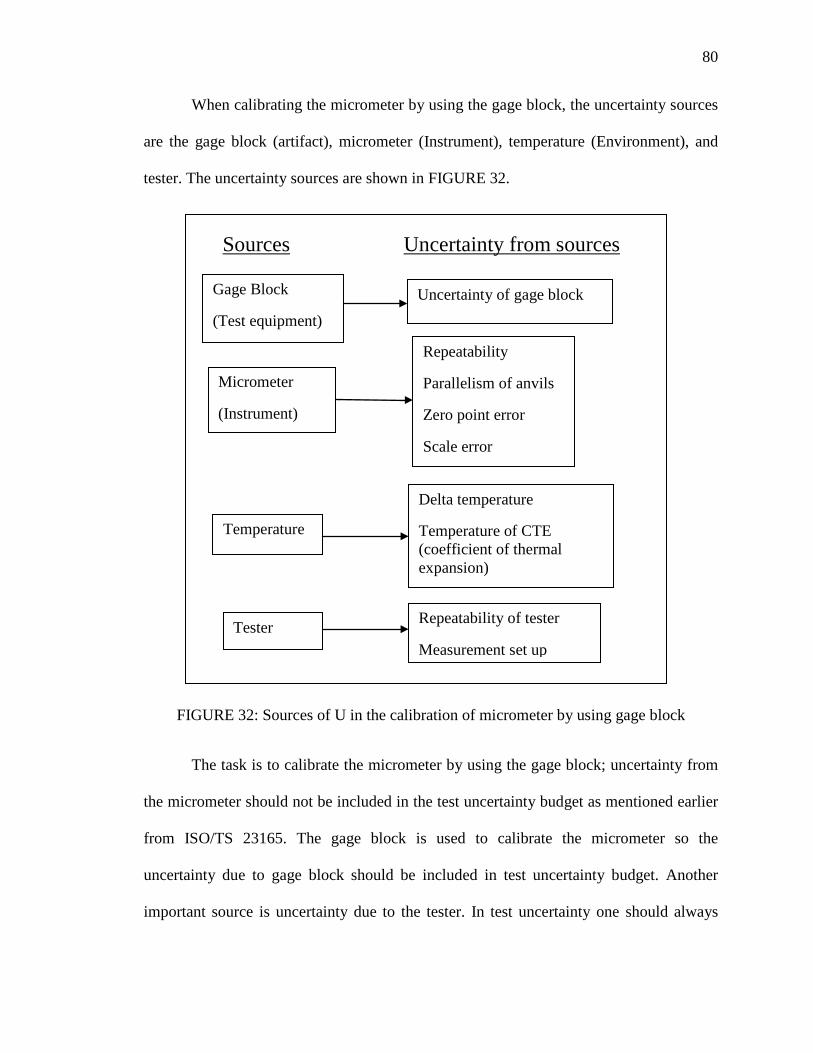
80
When calibrating the micrometer by using the gage block, the uncertainty sources
are the gage block (artifact), micrometer (Instrument), temperature (Environment), and
tester. The uncertainty sources are shown in FIGURE 32.
FIGURE 32: Sources of U in the calibration of micrometer by using gage block
The task is to calibrate the micrometer by using the gage block; uncertainty from
the micrometer should not be included in the test uncertainty budget as mentioned earlier
from ISO/TS 23165. The gage block is used to calibrate the micrometer so the
uncertainty due to gage block should be included in test uncertainty budget. Another
important source is uncertainty due to the tester. In test uncertainty one should always
Temperature
Delta temperature
Temperature of CTE (coefficient of thermal expansion)
Sources Uncertainty from sources
Tester Repeatability of tester
Measurement set up
Gage Block
(Test equipment)
Uncertainty of gage block
Micrometer
(Instrument)
Repeatability
Parallelism of anvils
Zero point error
Scale error
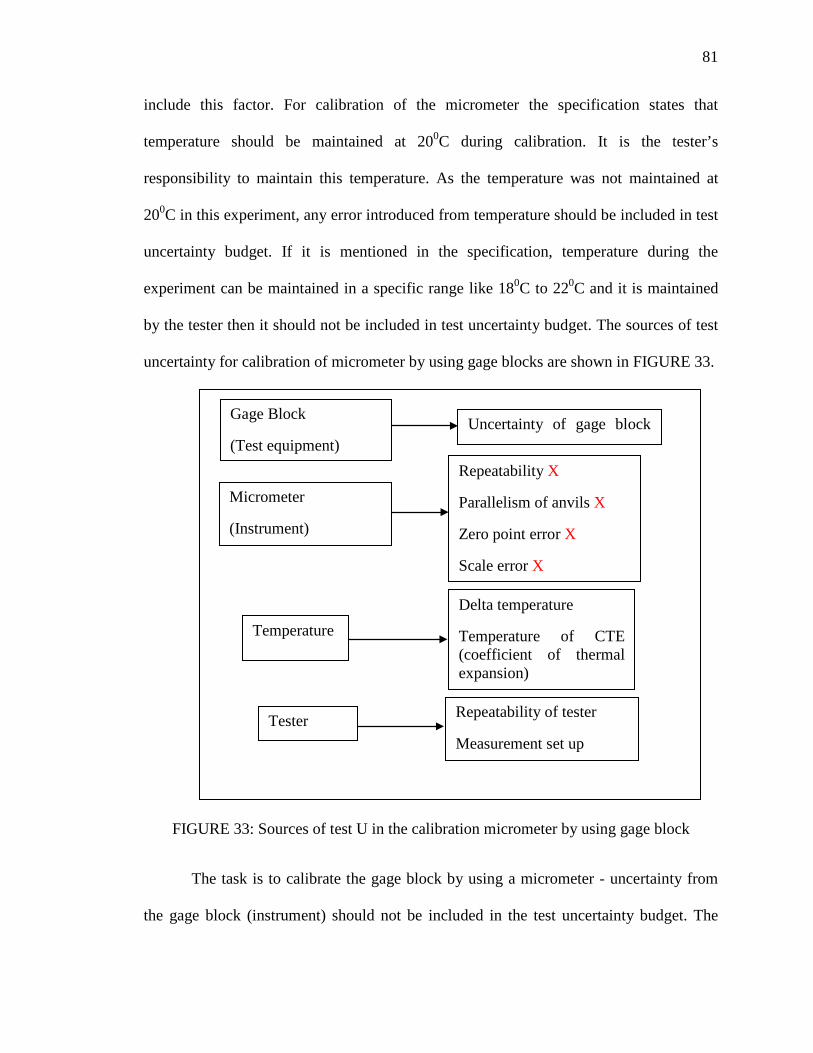
81
include this factor. For calibration of the micrometer the specification states that
temperature should be maintained at 200C during calibration. It is the tester’s
responsibility to maintain this temperature. As the temperature was not maintained at
200C in this experiment, any error introduced from temperature should be included in test
uncertainty budget. If it is mentioned in the specification, temperature during the
experiment can be maintained in a specific range like 180C to 220C and it is maintained
by the tester then it should not be included in test uncertainty budget. The sources of test
uncertainty for calibration of micrometer by using gage blocks are shown in FIGURE 33.
FIGURE 33: Sources of test U in the calibration micrometer by using gage block
The task is to calibrate the gage block by using a micrometer - uncertainty from
the gage block (instrument) should not be included in the test uncertainty budget. The
Temperature Delta temperature
Temperature of CTE (coefficient of thermal expansion)
Tester Repeatability of tester
Measurement set up
Micrometer
(Instrument)
Repeatability X
Parallelism of anvils X
Zero point error X
Scale error X
Gage Block
(Test equipment)
Uncertainty of gage block

82
micrometer is used to calibrate the gage block so the uncertainty due to micrometer
should be included in the test uncertainty budget. The temperature was not maintained at
200C during calibration so it should be included in test uncertainty budget here. The
sources of test uncertainty when calibrating a gage block by using the micrometer are
shown in FIGURE 34.
FIGURE 34: Sources of test uncertainty when calibrating gage block
From the above discussion it is found for the same experiment the test uncertainty
value may be different depending on the type of calibration. In TABLE 15 is shown the
test uncertainty budget both for micrometer and gage block. The test uncertainty for
micrometer calibration is 12.21 µin and gage block calibration is 11.85 µin. These values
Gage Block (Instrument)
Uncertainty of gage block X
Micrometer
(Test equipment)
Repeatability Parallelism of anvils Zero point error Scale error
Temperature Delta temperature Temperature of CTE (coefficient of thermal expansion)
Tester Repeatability of tester Measurement set up

83
are different because the calibration type was different though it was for same
experiment.
TABLE 15: Uncertainty Budget
Source Evaluation type
Distribution type
Standard U (uin)
Test Uof micrometer (uin)
Test U of gage block (uin)
Gage block B Rectangular 2.32 2.32 Repeatability A Normal 0.29 0.29 Scale error B Rectangular 1.16 1.16 Zero point error B Rectangular 1.16 1.16 Parallelism of anvil B Rectangular 2.9 2.9 Delta Temp B U-shape 4.08 4.08 4.08 U due to CTE B U-shape 3.91 3.91 3.91
Combined Uncertainty,Uc 6.96 6.10 5.92
Expanded Uncertainty, 13.93 12.21 11.85
6.3 Comparison between test U, calibration and task specific U
To understand test uncertainty clearly, it is compared with the calibration and task
specific uncertainty from two points of view. The first aspect is the measurand. It is
known, there are different kinds of measurands for different kinds of measurement
processes. Consequently the Uncertainty will be different also. A clear description of
different kinds of Uncertainty associated with different kinds of measurands is explained
in TABLE 16. Here one new term, calibration uncertainty, is introduced. It can be
explained from S.D Phillips et al paper where it states, “The relationship between the
measured or indicated values and those of the reference values is a key issue with regards
to calibration…all calibration must include the statement about the accuracy of the
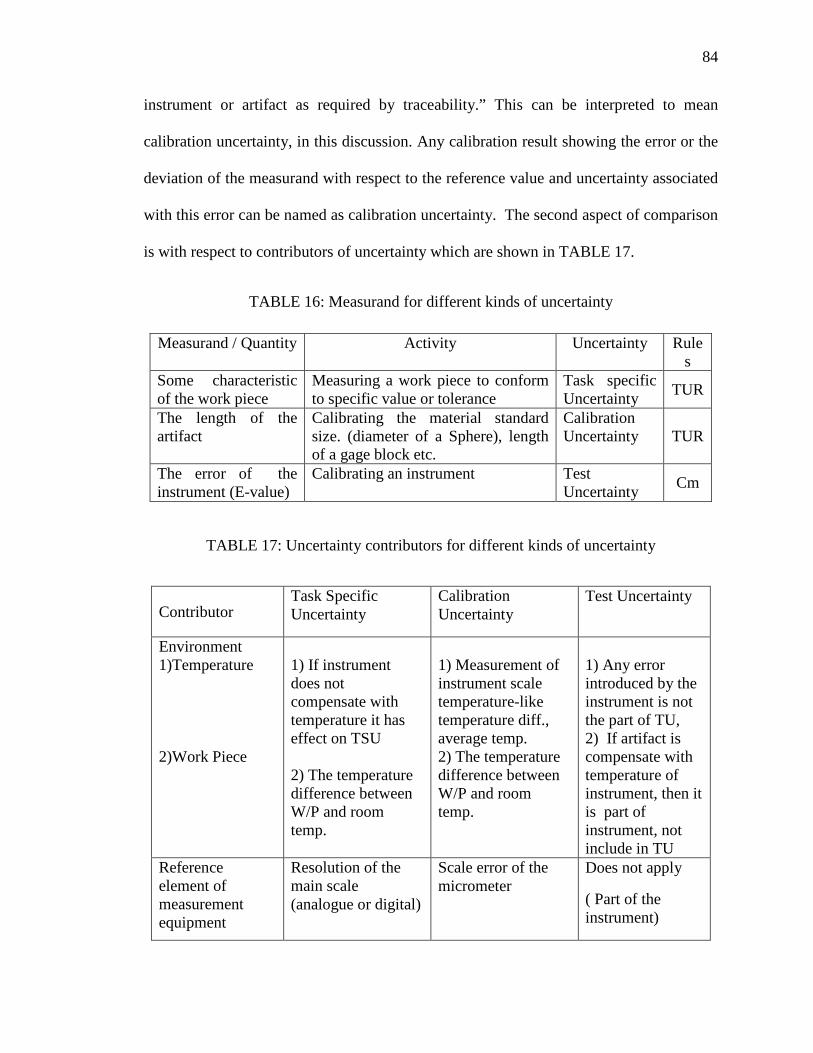
84
instrument or artifact as required by traceability.” This can be interpreted to mean
calibration uncertainty, in this discussion. Any calibration result showing the error or the
deviation of the measurand with respect to the reference value and uncertainty associated
with this error can be named as calibration uncertainty. The second aspect of comparison
is with respect to contributors of uncertainty which are shown in TABLE 17.
TABLE 16: Measurand for different kinds of uncertainty
Measurand / Quantity Activity Uncertainty Rules
Some characteristic of the work piece
Measuring a work piece to conform to specific value or tolerance
Task specific Uncertainty TUR
The length of the artifact
Calibrating the material standard size. (diameter of a Sphere), length of a gage block etc.
Calibration Uncertainty TUR
The error of the instrument (E-value)
Calibrating an instrument Test Uncertainty Cm
TABLE 17: Uncertainty contributors for different kinds of uncertainty
Contributor Task Specific Uncertainty
Calibration Uncertainty
Test Uncertainty
Environment 1)Temperature 2)Work Piece
1) If instrument does not compensate with temperature it has effect on TSU 2) The temperature difference between W/P and room temp.
1) Measurement of instrument scale temperature-like temperature diff., average temp. 2) The temperature difference between W/P and room temp.
1) Any error introduced by the instrument is not the part of TU, 2) If artifact is compensate with temperature of instrument, then it is part of instrument, not include in TU
Reference element of measurement equipment
Resolution of the main scale (analogue or digital)
Scale error of the micrometer
Does not apply
( Part of the instrument)

85
TABLE 17 (continued)
Measurement equipment
Zero-point stability Parallaxes
Zero point error, Parallelism of anvils
Does not apply ( Part of the instrument)
Measurement setup (Probe selection, tip size etc.)
Form deviation of tip, offset, extension
Usually optimized or specified
Usually specified by std. Poor setup may influence TU.
Software and calculations
Rounding, SamplingAlgorithms, Quantification
Well defined in the standard, may be eliminated
Well defined in the standard, may be eliminated
Metrologist Experience, training, knowledge
Reproducibility Reproducibility
Measurement object , work piece or measuring instrument characteristics
Surface roughness, form deviation of the w/p
Form error of gage block,
uncertainty of the length of gage block
Form error of artifact,
uncertainty for the length of artifact
Definition of the GPS Characteristic, w/p or measuring instrument characteristic
Datum, reference system
Datum, reference system
Datum, Coordinate system
Measuring procedure
Alignment, Clamping fixturing, Number of measurement etc. example: Due to the measurement process of w/p like repeatability
Physical and software alignment, Clamping fixturing, number of measurement etc. example: Due to the measurement process of gauge block like repeatability
Alignment, Clamping fixturing, number of measurement etc. example: Instrument repeatability error is not the part of TU, but the repeatability error for tester is the part of TU.

86
6.4 Comparison of CMM testing data
Three different methods have been used to compare the results for CMM testing. These
are
1. Simulation using PUNDITTM
2. Actual testing to ISO 10360-2
3. Calculation using ISO TS 23165
These experiments were done by the instruction of ISO10360-2. It is mentioned, in
this standard for CMM testing, which is necessary to find the error of indication for size
measurement (E- value). This value should not exceed the maximum permissible error,
MPEE, as stated by the manufacturer. FIGURE 35 and FIGURE 36 are shown the
experimental set up for this test.
FIGURE 35: E-test [21]

87
FIGURE 36: E-test [10360-2]
6.4.1 Simulation using PUNDIT
To evaluate uncertainty of the CMM, different simulations have been done by
using PUNDIT. It is useful because it gives an estimation of the uncertainty before the
actual testing. The blocks (as defined in the ISO standard) were modeled in PUNDIT
which is shown in FIGURE 37.
FIGURE 37: Artifact with 5 test lengths (as used in ISO testing)
There were two sampling methods used in the simulation which are shown in
FIGURE 38 and FIGURE 39. Initially four numbers of points were taken on each side

88
shown in FIGURE 38 . In the second measurement plan one point was taken on each side
in the middle of the plane shown in FIGURE 39.
FIGURE 38: Initial measurement schemes
FIGURE 39: Single point probing scheme

89
Test Length = 50mm
4 points/end: U = .00106mm 1 point/end: U = .00228mm FIGURE 40: Simulation results (1)
Test results for the top block with test length 50 mm are shown in FIGURE 40. It
is found from the results that the uncertainty for 4 points is giving lower uncertainty than
the 1 point case. Test results for the longest block with test length 550 mm are shown in
FIGURE 41. It is found from the results that the uncertainty for the 4 point and the 1
point data do not differ significantly. This may be due to the long length of the block. For
the comparison with other methods the largest value of the uncertainty was taken from all
of these results.
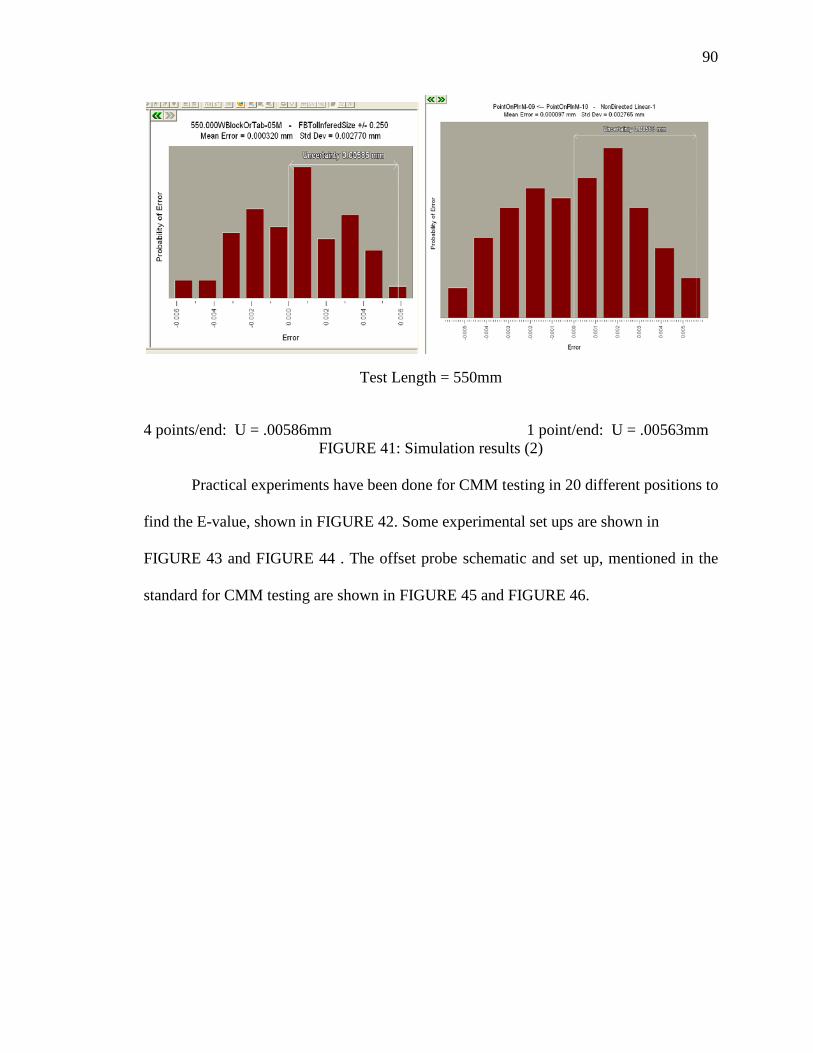
90
Test Length = 550mm
4 points/end: U = .00586mm 1 point/end: U = .00563mm FIGURE 41: Simulation results (2)
Practical experiments have been done for CMM testing in 20 different positions to
find the E-value, shown in FIGURE 42. Some experimental set ups are shown in
FIGURE 43 and FIGURE 44 . The offset probe schematic and set up, mentioned in the
standard for CMM testing are shown in FIGURE 45 and FIGURE 46.
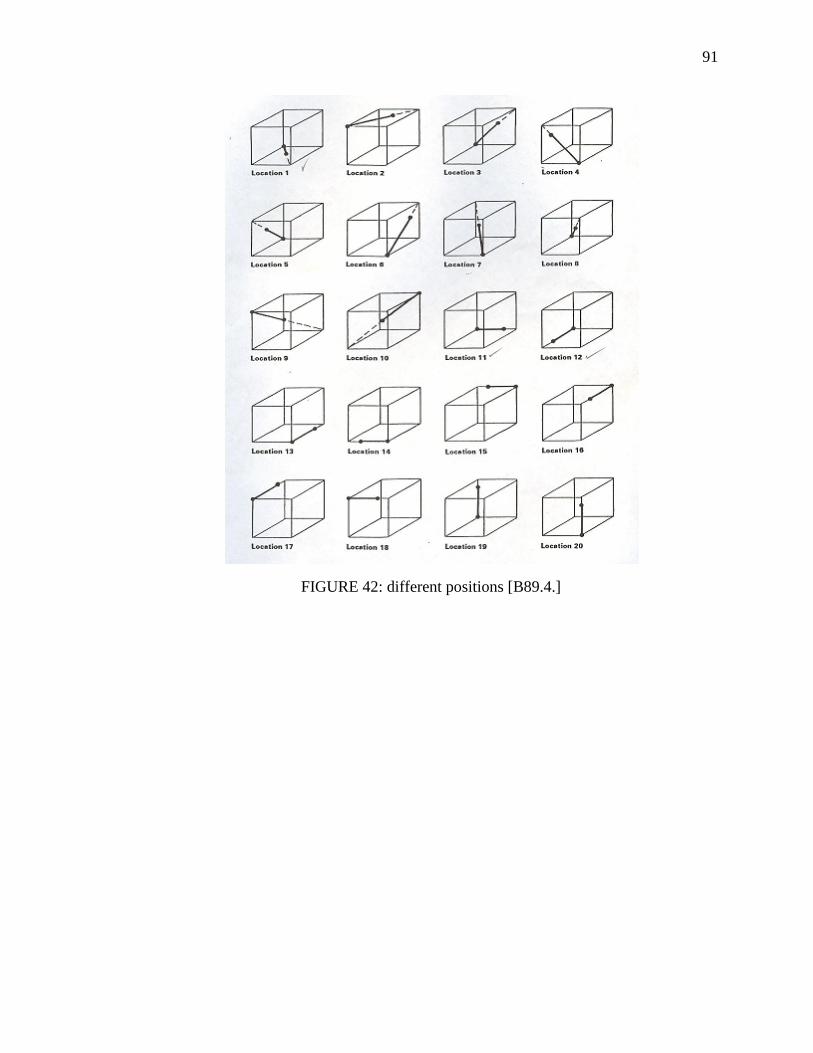
91
FIGURE 42: different positions [B89.4.]

92
FIGURE 43: Y-linear
FIGURE 44: Diagonal position
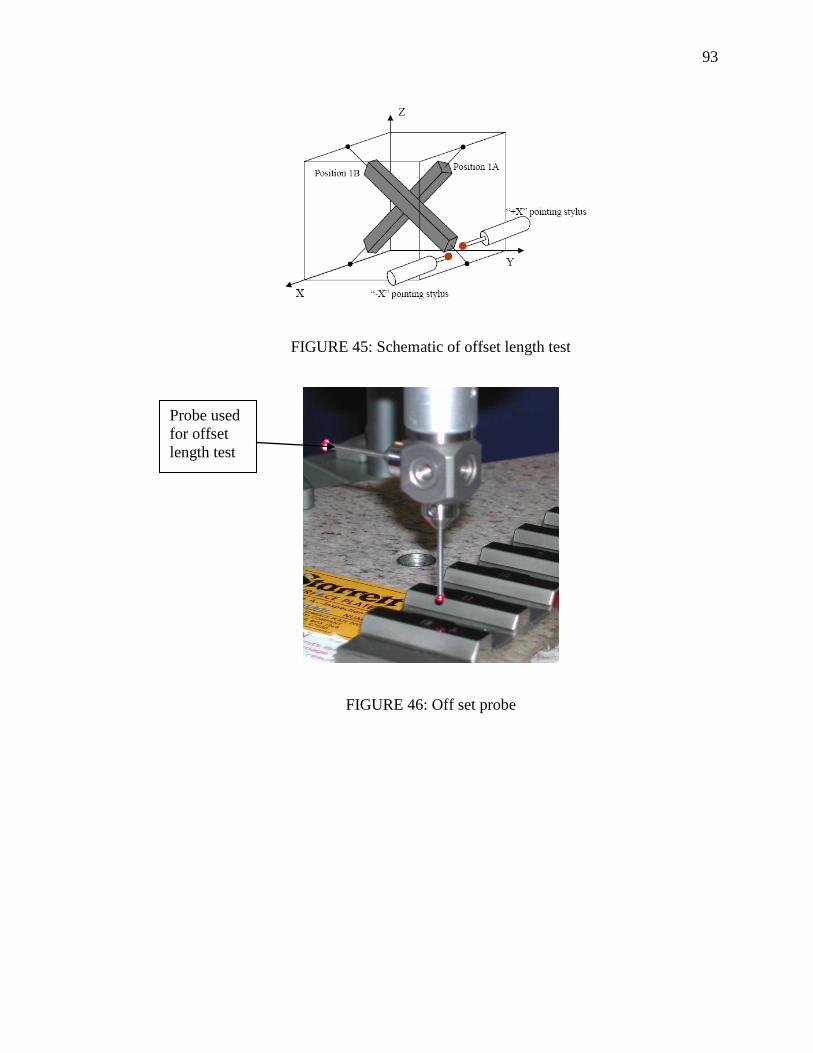
93
FIGURE 45: Schematic of offset length test
FIGURE 46: Off set probe
Probe used for offset length test
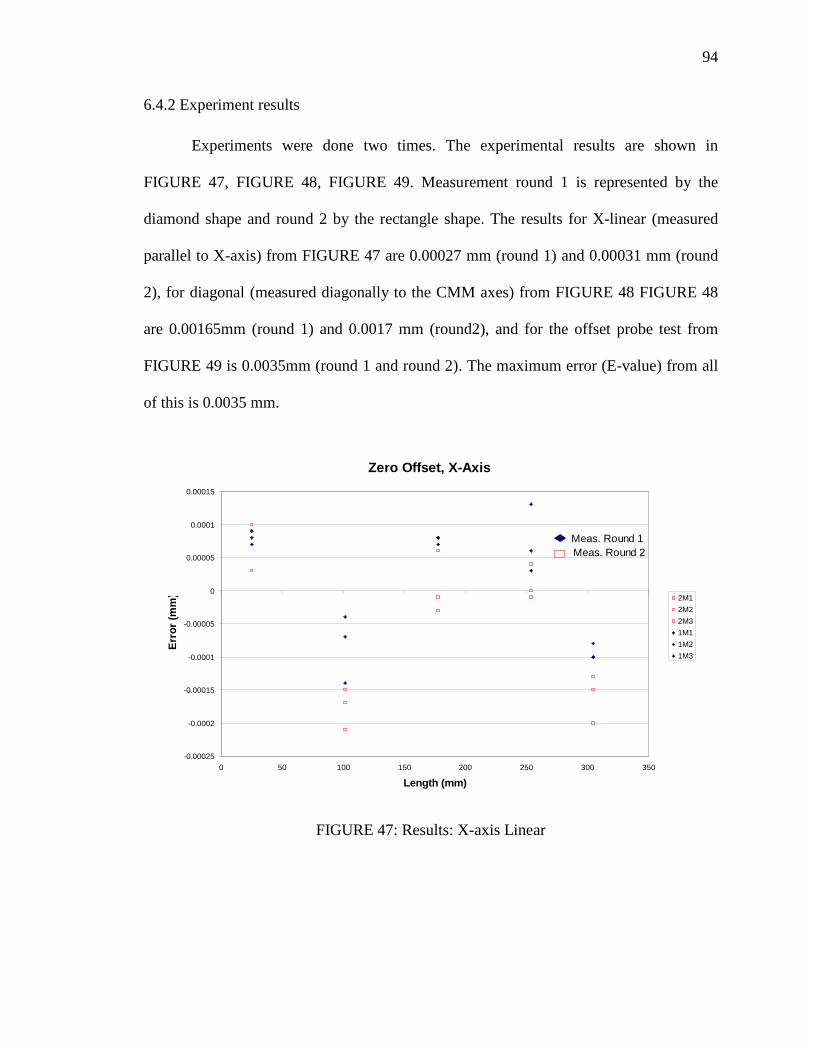
94
6.4.2 Experiment results
Experiments were done two times. The experimental results are shown in
FIGURE 47, FIGURE 48, FIGURE 49. Measurement round 1 is represented by the
diamond shape and round 2 by the rectangle shape. The results for X-linear (measured
parallel to X-axis) from FIGURE 47 are 0.00027 mm (round 1) and 0.00031 mm (round
2), for diagonal (measured diagonally to the CMM axes) from FIGURE 48 FIGURE 48
are 0.00165mm (round 1) and 0.0017 mm (round2), and for the offset probe test from
FIGURE 49 is 0.0035mm (round 1 and round 2). The maximum error (E-value) from all
of this is 0.0035 mm.
FIGURE 47: Results: X-axis Linear
Zero Offset, X-Axis
-0.00025
-0.0002
-0.00015
-0.0001
-0.00005
0
0.00005
0.0001
0.00015
0 50 100 150 200 250 300 350
Length (mm)
Erro
r (m
m) 2M1
2M22M31M11M21M3
Meas. Round 1 Meas. Round 2
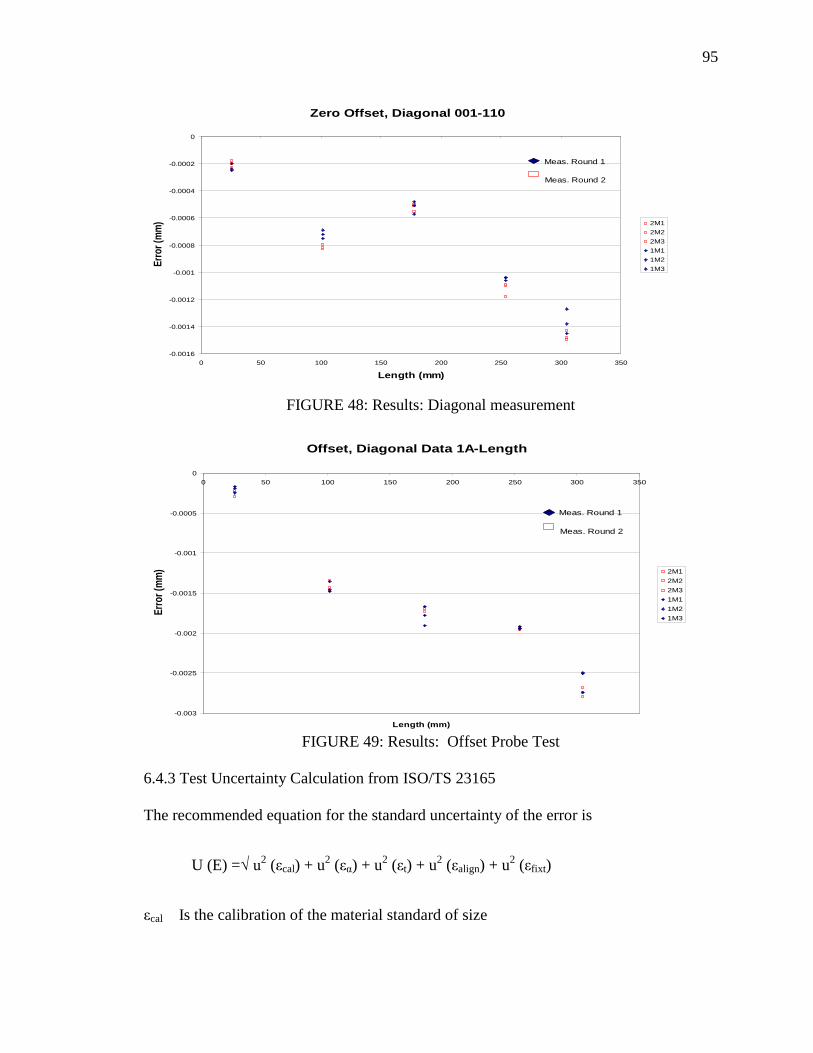
95
FIGURE 48: Results: Diagonal measurement
FIGURE 49: Results: Offset Probe Test
6.4.3 Test Uncertainty Calculation from ISO/TS 23165
The recommended equation for the standard uncertainty of the error is
U (E) =√ u2 (εcal) + u2 (εα) + u2 (εt) + u2 (εalign) + u2 (εfixt)
εcal Is the calibration of the material standard of size
Zero Offset, Diagonal 001-110
-0.0016
-0.0014
-0.0012
-0.001
-0.0008
-0.0006
-0.0004
-0.0002
0
0 50 100 150 200 250 300 350
Length (mm)
Erro
r (m
m) 2M1
2M22M31M11M21M3
Meas. Round 1 Meas. Round 2
Offset, Diagonal Data 1A-Length
-0.003
-0.0025
-0.002
-0.0015
-0.001
-0.0005
00 50 100 150 200 250 300 350
Length (mm)
Erro
r (mm
) 2M12M22M31M11M21M3
Meas. Round 1 Meas. Round 2

96
εα Is the error due to in the input value of the CTE α of the material standard of size
εt Is the errors due to in the input value of the temperature of the material standard of
size
εalign Is the errors due to misalignment of the material standard of size
εfixt Is errors due to fixturing the material standard of size
Assuming some realistic values which are for all these parameters given in
APPENDIX C and using in the above equation the value of uncertainty,
U (E) =.000112mm.
Results from three methods are shown in TABLE 18.
TABLE 18: Uncertainty from three methods
From the results, it is found that the uncertainty value when calculating by using
the ISO/TS 23165 equation is smaller than the actual (ISO 10360-2) and the PUNDIT
result. It is expected that the theoretical results should be smaller than the practical results
because many uncertainty contributors are not present there. In actual testing, the
environment was carefully maintained as specified by the manufacturer, but in the case of
PUNDIT, some error may have been introduced which influenced the result. The test
uncertainty value could not be found directly from these results. These results are the
standard uncertainty which includes all the sources of uncertainty like tester, instrument,
and artifact.
Simulation using PUNDITTM
Actual testing to ISO 10360-2
Calculation using ISO TS 23165
.00563mm .0035mm .000539mm

97
6.5 Ball bar test
Two different methods have been used to find the volumetric performance of
CMM.
1. Actual testing to B89.4
2. Simulation using PUNDITTM
3. Calculation using ISO TS 23165
6.5.1 Actual testing by following B89.4
Actual tests have been done to find the volumetric performance of the CMM
followed by standard B89.4. Four positions of experimental setups out of 20 total
different positions (FIGURE 42) are shown in FIGURE 50.
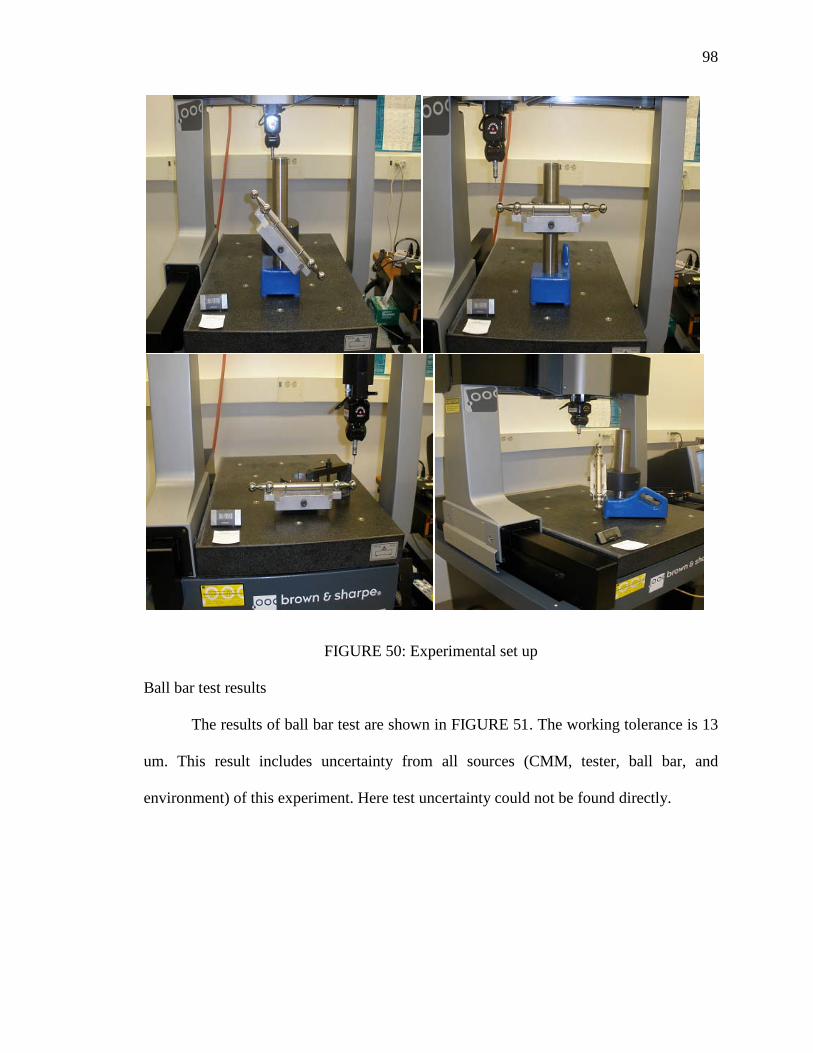
98
FIGURE 50: Experimental set up
Ball bar test results
The results of ball bar test are shown in FIGURE 51. The working tolerance is 13
um. This result includes uncertainty from all sources (CMM, tester, ball bar, and
environment) of this experiment. Here test uncertainty could not be found directly.

99
FIGURE 51: Ball bar test result
Ball bar test by using PUNDIT software
Simulations have been done by using the software PUNDIT to find the volumetric
performance of the CMM. All of the inputs like environmental condition, CMM
specification, ball bar’s specification, and other factors reflected the actual experiment.
The ball bar model and four positions from the 20 different positions of the volumetric
performance test are shown in FIGURE 52 and FIGURE 53.
FIGURE 52: Ball bar
-0.008
-0.006
-0.004
-0.002
0
0.002
0.004
0.006
0.008
0 5 10 15 20 25
Dev
iatio
n fr
om a
vera
ge le
ngth
(um
)
Position number ( In this example working tolerance approx.13um)
Working tolerance
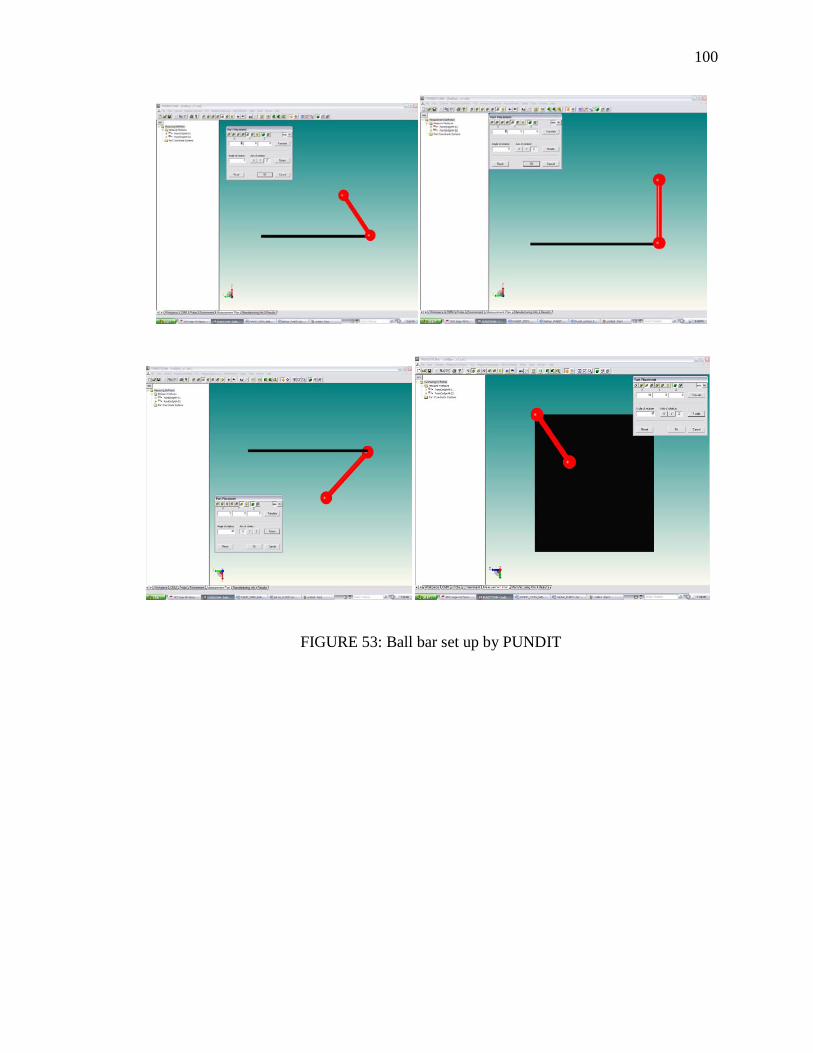
100
FIGURE 53: Ball bar set up by PUNDIT

101
One simulation result is shown in FIGURE 54. The standard deviation and mean can be
found from these results.
FIGURE 54: Simulation result
The maximum working tolerance was calculated using PUNDIT results in
MATLAB. In MATLAB random numbers were added to the standard deviations found
from PUNDIT. These data were added with the mean found from PUNDIT and the range
was calculated. The result for the range was 7.856 were µm. Calculation using ISO TS
23165 are discussed in APPENDIX C.
TABLE 19: Comparison of ball bar test result from three methods
Simulation using PUNDITTM
Actual testing to B89.4 Calculation using ISO TS 23165
7.856um 13um 0.202 um

102
The simulation result is giving a smaller value than the actual test as expected. In
the simulation, the 20 positions of the ball bar were theoretically perfect, whereas in the
actual test they were not. Practical experiment involves more uncertainty contributors
than simulation. Consequently actual test results were larger than PUNDIT results.
6.5.2 Ball bar test results with time
The ball bar test results are shown in FIGURE 55. The tester’s performance with
respect to time is improved; consequently it influences the test result. So the test
uncertainty result in every test may be changed depending on the tester’s capacity to
perform the test. It is shown in FIGURE 56.
FIGURE 55: Test results improving with time
0
5
10
15
20
25
2/11/2009 2/16/2009 2/21/2009 2/26/2009 3/3/2009
Erro
r(um
)
Time Range
e…
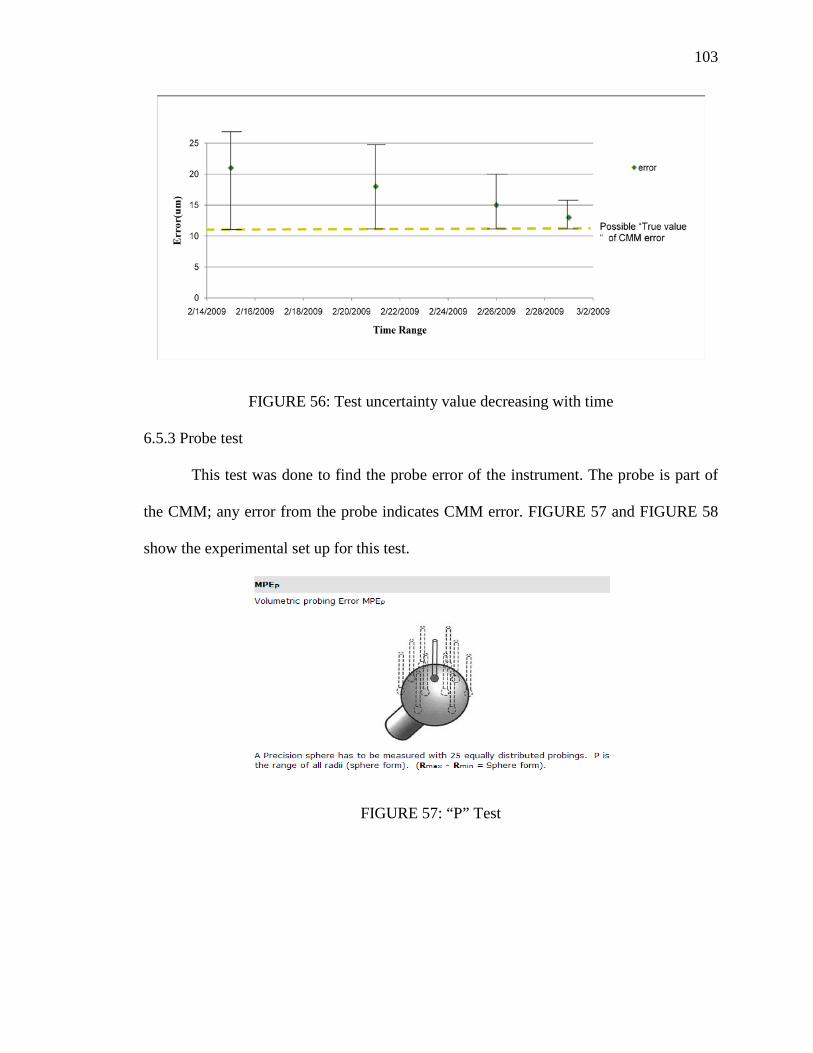
103
FIGURE 56: Test uncertainty value decreasing with time
6.5.3 Probe test
This test was done to find the probe error of the instrument. The probe is part of
the CMM; any error from the probe indicates CMM error. FIGURE 57 and FIGURE 58
show the experimental set up for this test.
FIGURE 57: “P” Test

104
FIGURE 58: Experimental set up for probe test

105
FIGURE 59: Target contact points [ISO10360-5]
The probe tests have been done for five different locations, shown in FIGURE 58.
The probe test results for two different probes lengths, 20mm and 50 mm are shown in
TABLE 20.

106
TABLE 20: Probe test results
Location Probe with 20mm. length (μm)
Probe with 50mm. length (μm)
1 3 5
2 3 5
3 3 5
4 3 6
5 4 6
From the above results, it is found for the probe with 20mm length (which probe
was using in this experiment) the maximum error value is 4 um. The probe is part of the
CMM; error from the probe should not be included in the contributors of test uncertainty.
The working tolerance from the ball bar test was 13 um, which includes the probe error
of 4µm. From the above table it is found, that the probe error for the 50mm length probe
is 6 µm. Result may vary using different probes. The probe test was done to give a
demonstration of what error may be introduced from the instrument itself.
107
6.6 Conclusion
To calibrate measuring equipment like the CMM, certainly the tester's proficiency
will have a large influence on the results. Different operators will yield different test
results. If the tester is experienced or well trained, the test uncertainty result will be better
(smaller) compared to that of an inexperienced tester. When doing experimental
determination and verification, test uncertainty exist in the test, it is difficult to remove
test uncertainty from the test.

CHAPTER 7: CONCLUSIONS AND FUTURE WORK This chapter reviews the objectives, summarizes the conclusions, and looks at
extensions for future work. One of the goals of this project was to develop a guideline
on how to use TUR in industry to find the measurement capability of measuring tools
and end products. This work was supported by an opportunity to do internship at
INTEL. During this internship, one main task was to implement TUR and compare
their own metrics to find the measurement capability of the measuring tools. These were
first compared with the three reference tools: Wyko (Scanning White Light
Interferometer, or SWLI), Zygo (SWLI) & Keyence (Confocal). For this comparisons
was necessary to create a "pseudo-bump" standard, as no standards exist for that
measurement. Second comparison was between the high volume measurement (HVM)
tools Solvision (Moiré fringe projection), Nikon (Confocal), ICOS (Confocal) which are
used for the measurement of the end products. It is found that both for the reference and
HVM tools, TUR and INTEL metric gave the same results for the measurement
capability of the metrology tools individually and also the capability between them. So
TUR was successfully implemented to find the measurement capability of metrology
tools. For TUR used in measuring end products different dimensions like length, true
position of the hole, and diameter, could also be implemented as different experiments,
simulations were done in this research by using different sampling and it could
successfully find theses arrtibutes. So TUR is ready for use in the industry; they only

109
need the measurement tool and the software or expertise to find the task specific
uncertainty.
Test uncertainty is a new concept in the field of dimensional measurement. It is
helpful in understanding instrument test criteria, for determining the confidence in
machine conformance in the buying and selling measurement equipment, and in the
calibration of this equipment. This research developed concepts to explain how it is
different than the other uncertainty, and how one can calculate it. For this purpose many
experiments have been done with micrometer and CMM. These experimental results
were used to clarify when one instrument is tested, which factors influence the results.
The tester who is performing the test was shown to often have the greatest influence on
the test, and next the artifact or equipment that is using for this testing. The
specification is also very important for this testing. It should be testers’ responsibility to
maintain the conditions of the test. The development of these concepts was found from
this research.
7.1 Future work
There are two additional subject areas open to further work, and hopefully there
will be progress in these areas, with the help of the experts in the standards community.
The first project is to find meaningful and consistent language to describe this quantity
(referred to here as test uncertainty) and to standardize a consistent vocabulary relating
to uncertainty in the instrument testing and calibration process. This is not an easy task,
because a scan of literature in testing and metrology will reveal that all of the words
related to testing, calibration, and uncertainty have been used more than once, and often
in conflicting ways. The second area, to extend the current research is in overcoming

110
barriers to the experimental evaluation of test uncertainty. It initially seems that simply
running some of the classic CMM acceptance tests (ball bar, step gage, etc.) would
reveal different errors when measured at different times, perhaps by different operators.
The problem with this method is that the actual CMM performance and repeatability is
always folded into the result, which can easily mask the actual effects of test
uncertainty. It may be that the best (or only) method to perform this analysis of test
uncertainty is through software simulation, where one contributor at a time can be
varied.

111
REFERENCES
1. ISO/TS 14253-2, Inspection by measurement of workpieces and measuring instrument- Part2: Guide to the estimation of uncertainty in GPS measurement, in calibration of measuring equipment and in product specification.
2. S.K. Kimothi, “The Uncertainty of Measurement Physical and Chemical
Metrology impact and Analysis.” ISBN 0-87389-535-5.
3. ISO, “International Vocabulary of Basic and General Terms in Metrology, 2nd ed.,” (International Organization for Standardization, Geneva, Switzerland, 1993).
4. S.D Phillips et al, “A careful consideration of the Calibration Concept.”, J. Res. Natl. Inst. Stand. Technol. 106, 371–379 (2001).
5. B. N. Taylor and C. E. Kuyatt, “Guidelines for the Evaluating and Expressing the Uncertainty of NIST Measurement Results,” NIST TN-1297, 1994.
6. ISO/TS 14253-2 1999 GPS - CMMs (CMM): Techniques for evaluation of uncertainty of measurement - Part 2: Guide to the estimation of uncertainty in GPS measurement, 1999.
7. 14253-1:1998, GPS — Inspection by measurement of work pieces and measuring equipment — Part 1: Decision rules for proving conformance or non-conformance with specification.
8. ANSI/ASME B89.7.3.1.Methods for performance evaluation of coordinate measuring machines. New York: American Society of Mechanical Engineers; 2001.
9. ISO-Guide to the Expression of Uncertainty in Measurement (GUM), International Organization for Standardization, Geneva, Switzerland, 1993.
10. ISO 10360-2 2001 GPS – Acceptance test and re-verification test for coordinate measuring machines (CMM) - Part 2: CMMs used for measuring size, 2001.
11. Philips, S.D., 1995, Performance evaluations, in Coordinate Measuring Machines and Systems, J.Bosch, ed., Marcel Dekker, New York.
12. DTS 23165, 2004, GPS — Guide to the evaluation of CMM test uncertainty, Comm. Draft.
13. Wilhelm, R. Hocken and H. Schwenke, “Task specific uncertainty in coordinate measurement.” Annals of the CIRP, 50(2), 553-563(2001).
14. Sivaramakrishnan, V, “An internet based software system for gage R & R and measurement uncertainty analysis.” Master’s Thesis, University of North Carolina at Charlotte, 2003.

112
15. Balsamo, M. Di Ciommo, R. Mugno and S. Sartori, Towards Instrument-Oriented Calibration of CMMs, Annals of the CIRP 45 (1) (1996), pp. 479–482
16. Babu, U., “A Method to estimate task specific uncertainty for coordinate measuring machine (CMM) measurements” Doctoral dissertation, Dept of Mechanical Engineering, University of North Carolina at Charlotte, NC, 2001.
17. Gustav R. Grob, “Importance of ISO and IEC international energy standards and a new total approach to energy statistics and forecasting” Volume 76, Issues 1-3, September-November 2003, Pages 39-54.
18. Glossary, “ASME Boiler and Pressure Vessel Code, Section III, Article NCA-9000.”
19. B89.7.5 Metrological Traceability of Dimensional Measurements to the SI Unit of Length (An ASME Technical Report), 2006.
20. Thomas M. Adams, “G103 - A2LA Guide for Estimation of Uncertainty of Dimensional Calibration and Testing Results”, December 2008.
21. General Requirements for the Competence of Testing and Calibration Laboratories, ISO/IEC 17025, 1999.
22. Measurement Systems Analysis Reference Manual, AIAG, Michigan, 1995.
23. Balsamo, A., et al, “Evaluation of CMM uncertainty through Monte carlo simulation, Annals of the CIRP, 48/1:425-428, 1999.
24. Kunzmann, H., Trapet, E., Wäldele, F., 1993, Concept for the Traceability of Measurements with Coordinate Measuring Machines, Proc. 7th IPES, Kobe, Japan, 41-52.
25. R. Hocken, J. Simpson, B. Borchardt, J. Lazar and P. Stein, Three dimensional metrology, Annals of the CIRP 26 (2) (1977), pp. 403–408.
26. Flake David, “CMM Measurement Strategy”, 2001.
27. Test uncertainty, ASME PTC 19.1-2005 (Revision of ASME PTC 19.1-1998).
28. ISO/TS15530-3-Geometrical Product Specifications-Coordinate measuring machines (CMM): Technique for determining the uncertainty of mrasurement-Part3: Use of calibrated workpieces or standards.
29. ASME B89.7.3.3. Guidelines for assessing the reliability of dimensional measurement uncertainty statements; 2002.
30. ASME B89.7.4.1, Measurement uncertainty and conformance testing risk analysis; 2005.
31. Kaufman Robert, Warner Kent, “Measurement capability and Correlation”, March, 2001.

113
32. H.SChwenke,et al, “Geometric error measurement and compensation of machines an update” - CIRP Annals-Manufacturing Technology, 1995.
33. R. Willink, I.Lira, “A united interpretation of different uncertainty intervals”, Measurement 38, 2005, 61-66.
34. Samara Ayman, “Enhanced dynamic fringe projection for micro-structure characterization” Doctoral dissertation, Dept of Mechanical Engineering, University of North Carolina at Charlotte, NC, 2005.
35. Husain Zaki, “Theoretical uncertainty of orifice flow measurement”, Houston, Texas, 1995.
36. ISO/DIS 10360-5, “Geometrical product specifications (GPS)- Acceptance and reverification tests for coordinate measuring machines(CMM)”- Part 5: CMMs using single and multiple contacting probing systems.
37. Kim D. Summerhays,“A tool determining task-specific measurement uncertainties in GD&T parameters obtained from coordinate measuring machines.”
38. Thomas Susan, “The importance of being earnest about definitions.”
39. ASME B89.4.1-1997 9 Revision of ASME B89.1.12 m-1990) - Methods for performance evaluation of coordinate measuring machines.
40. Averitt Graham, “Comparison of three methods of estimating task specific measurement uncertainty for a coordinate measuring machine” Masters dissertation, Dept of Mechanical Engineering, University of North Carolina at Charlotte, NC, 2005.
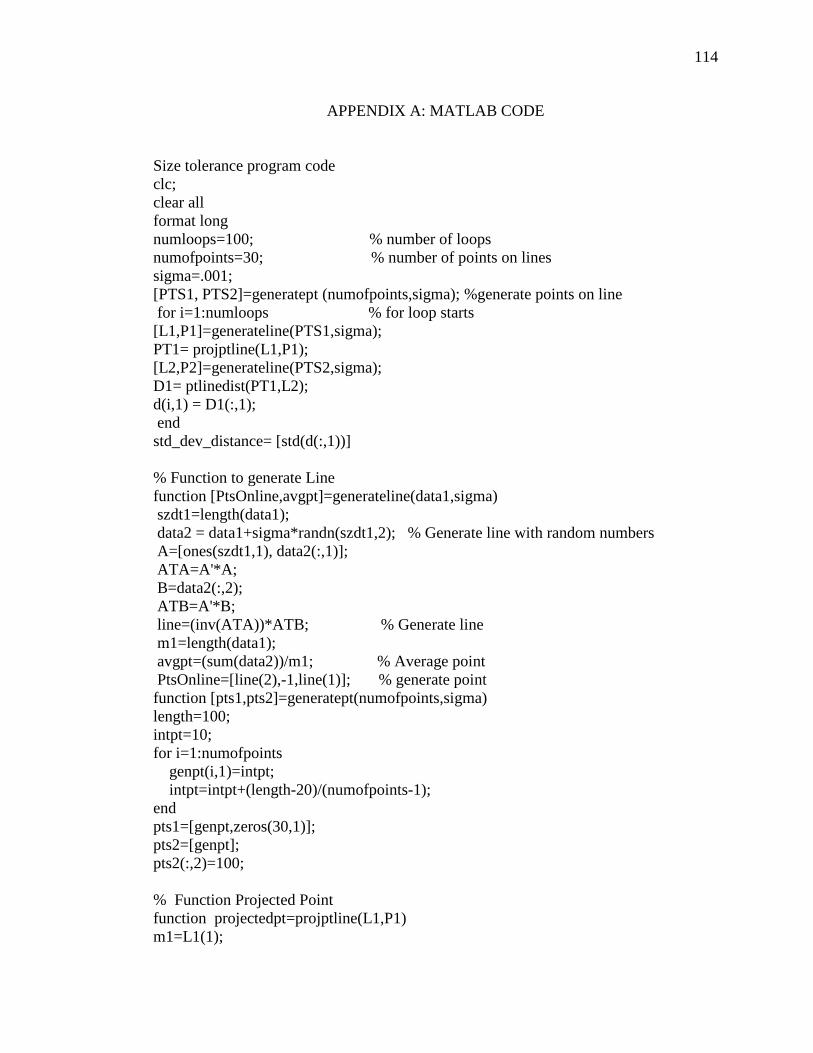
114
APPENDIX A: MATLAB CODE Size tolerance program code clc; clear all format long numloops=100; % number of loops numofpoints=30; % number of points on lines sigma=.001; [PTS1, PTS2]=generatept (numofpoints,sigma); %generate points on line for i=1:numloops % for loop starts [L1,P1]=generateline(PTS1,sigma); PT1= projptline(L1,P1); [L2,P2]=generateline(PTS2,sigma); D1= ptlinedist(PT1,L2); d(i,1) = D1(:,1); end std_dev_distance= [std(d(:,1))] % Function to generate Line function [PtsOnline,avgpt]=generateline(data1,sigma) szdt1=length(data1); data2 = data1+sigma*randn(szdt1,2); % Generate line with random numbers A=[ones(szdt1,1), data2(:,1)]; ATA=A'*A; B=data2(:,2); ATB=A'*B; line=(inv(ATA))*ATB; % Generate line m1=length(data1); avgpt=(sum(data2))/m1; % Average point PtsOnline=[line(2),-1,line(1)]; % generate point function [pts1,pts2]=generatept(numofpoints,sigma) length=100; intpt=10; for i=1:numofpoints genpt(i,1)=intpt; intpt=intpt+(length-20)/(numofpoints-1); end pts1=[genpt,zeros(30,1)]; pts2=[genpt]; pts2(:,2)=100; % Function Projected Point function projectedpt=projptline(L1,P1) m1=L1(1);

115
a=m1; b=L1(2); c1=L1(3); if (a==0) c2=avgpt(1); projpt=[c2;c1]; elseif (b==0) c1=-c1/m1; c2=avgpt(2); projpt=[c1;c2]; else m2=-1/m1; c2=-m2*P1(1)+P1(2); M=[-m1,1;-m2,1]; Intersecpt=[c1;c2]; projpt=(inv(M))*(Intersecpt); end projectedpt=[projpt(1),projpt(2)]; % Line to point distance function distance=ptlinedist(PT1,L2) a=L2(1); b=L2(2); c=L2(3); x=PT1(1); y=PT1(2); q=sqrt((power(a,2))+(power(b,2))); distance=(abs(a*x+b*y+c))/q; Position tolerance program clear all format long numloops=2; numofpoints=6; sigma=.001; ptsdatumA=[10,0;90,0]; ptsdatumB=[0,10;0,90]; for k=1:numloops [CM1]=Generate_datum(ptsdatumA,sigma); [CM2]=Generate_datum(ptsdatumB,sigma); [Er]=Deviationpoints(CM1,CM2); [XY]=Generate_circle_points(numofpoints,sigma); [RT]= Translaterotate(CM1,XY,Er); P1= circle_for_TUR(XY); p(k,1)=P1(:,1); end

116
std_dev_position=[std(p(:,1))] % Generate Datums function datum = Generate_datum(data1,sigma) szdt1=length(data1); data2 = data1+sigma*randn(szdt1,2); A=[ones(szdt1,1), data2(:,1)]; ATA=A'*A; B=data2(:,2); ATB=A'*B; % Generate circle points function data2 = generate_circle_point(pnts,sigma) angle=0; for i=1:pnts theta(i,1)=angle; angle=angle+(360/pnts); end r=10; szpt=length(theta); Int_X=60+r*cosd(theta); Int_Y=60+r*sind(theta); data1=[Int_X,Int_Y]; data2=data1+sigma*randn(szpt,2); % Deviation function deviation=Deviationpoints(CM1,CM2) c1=CM1(1); % Intersection point of datumB m1=CM1(2); %slope of datumB c2= CM2(1); %inresection point of datumC m2= CM2(2); %slope of datumC E=[-m1,1;-m2,1]; %matrix with the slope F=[c1;c2]; %matrix with intersection points deviation=(inv(E))*(F); %find the X coordinate and Y coordinate of error %Translate rotate the datums function rot_trans=Translaterotate(CM1,XY,Er) m1=CM1(2); ang=atand(m1); %angle of datum B rot_theta=ang; %make it theta Position_Old=[XY(:,1),XY(:,2)]; % make matrix with the old points error=Er'; %transpose the position oferror translation(:,1)=Position_Old(:,1)+error(:,1); %making translation of x points translation(:,2)=Position_Old(:,2)+error(:,2); %making translation of y points translation'; %transpose of translation rotation=[cosd(rot_theta),sind(rot_theta); -sind(rot_theta) cosd(rot_theta)]; %Rotation matrix
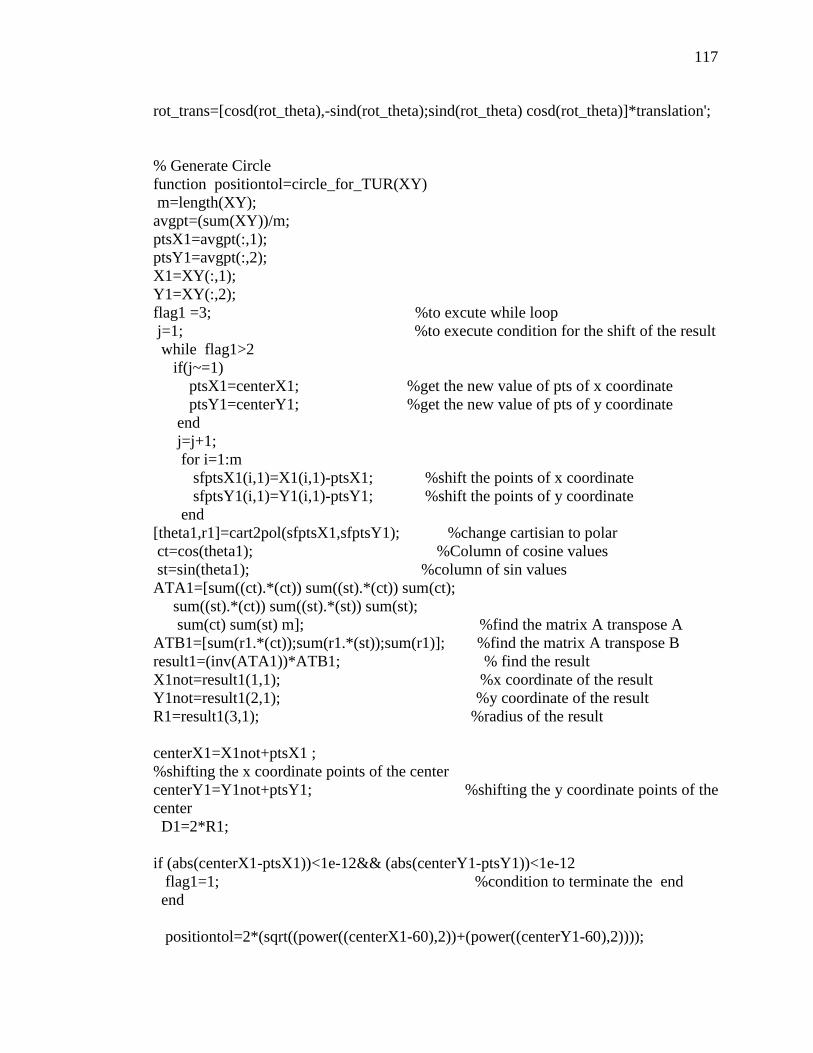
117
rot_trans=[cosd(rot_theta),-sind(rot_theta);sind(rot_theta) cosd(rot_theta)]*translation'; % Generate Circle function positiontol=circle_for_TUR(XY) m=length(XY); avgpt=(sum(XY))/m; ptsX1=avgpt(:,1); ptsY1=avgpt(:,2); X1=XY(:,1); Y1=XY(:,2); flag1 =3; %to excute while loop j=1; %to execute condition for the shift of the result while flag1>2 if(j~=1) ptsX1=centerX1; %get the new value of pts of x coordinate ptsY1=centerY1; %get the new value of pts of y coordinate end j=j+1; for i=1:m sfptsX1(i,1)=X1(i,1)-ptsX1; %shift the points of x coordinate sfptsY1(i,1)=Y1(i,1)-ptsY1; %shift the points of y coordinate end [theta1,r1]=cart2pol(sfptsX1,sfptsY1); %change cartisian to polar ct=cos(theta1); %Column of cosine values st=sin(theta1); %column of sin values ATA1=[sum((ct).*(ct)) sum((st).*(ct)) sum(ct); sum((st).*(ct)) sum((st).*(st)) sum(st); sum(ct) sum(st) m]; %find the matrix A transpose A ATB1=[sum(r1.*(ct));sum(r1.*(st));sum(r1)]; %find the matrix A transpose B result1=(inv(ATA1))*ATB1; % find the result X1not=result1(1,1); %x coordinate of the result Y1not=result1(2,1); %y coordinate of the result R1=result1(3,1); %radius of the result centerX1=X1not+ptsX1 ; %shifting the x coordinate points of the center centerY1=Y1not+ptsY1; %shifting the y coordinate points of the center D1=2*R1; if (abs(centerX1-ptsX1))<1e-12&& (abs(centerY1-ptsY1))<1e-12 flag1=1; %condition to terminate the end end positiontol=2*(sqrt((power((centerX1-60),2))+(power((centerY1-60),2))));

118
APPENDIX B: UNCERTAINTY CALCULATION Methods of evaluating the sources of uncertainty
The sources of uncertainty are evaluated through two methods:
Type A - Those evaluated by statistical methods.
Gage Repeatability & Reproducibility.
Type B - those evaluated by other means:
Manufactures specs, previous measurement data, general knowledge, calibration
uncertainties, and “Engineering Judgments”.
Type A:
Repeatability
Surface finish, form
Operator skill
Type B:
Gage Block Uncertainty
Scale error of the micrometer
Zero point error of the micrometer
Parallelism of micrometer anvils
Delta temperature
Temperature of CTE (coefficient of thermal expansion)
Standard Uncertainty Distribution Type
Normal Distribution
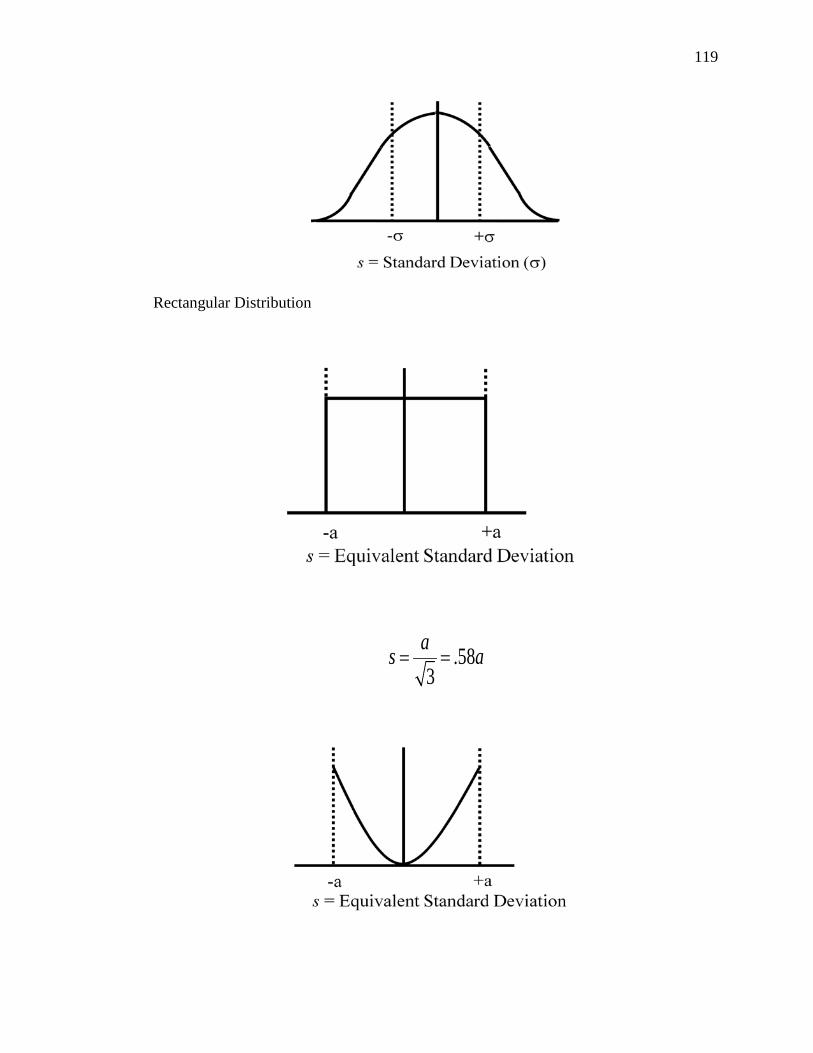
119
Rectangular Distribution
.583
as a= =
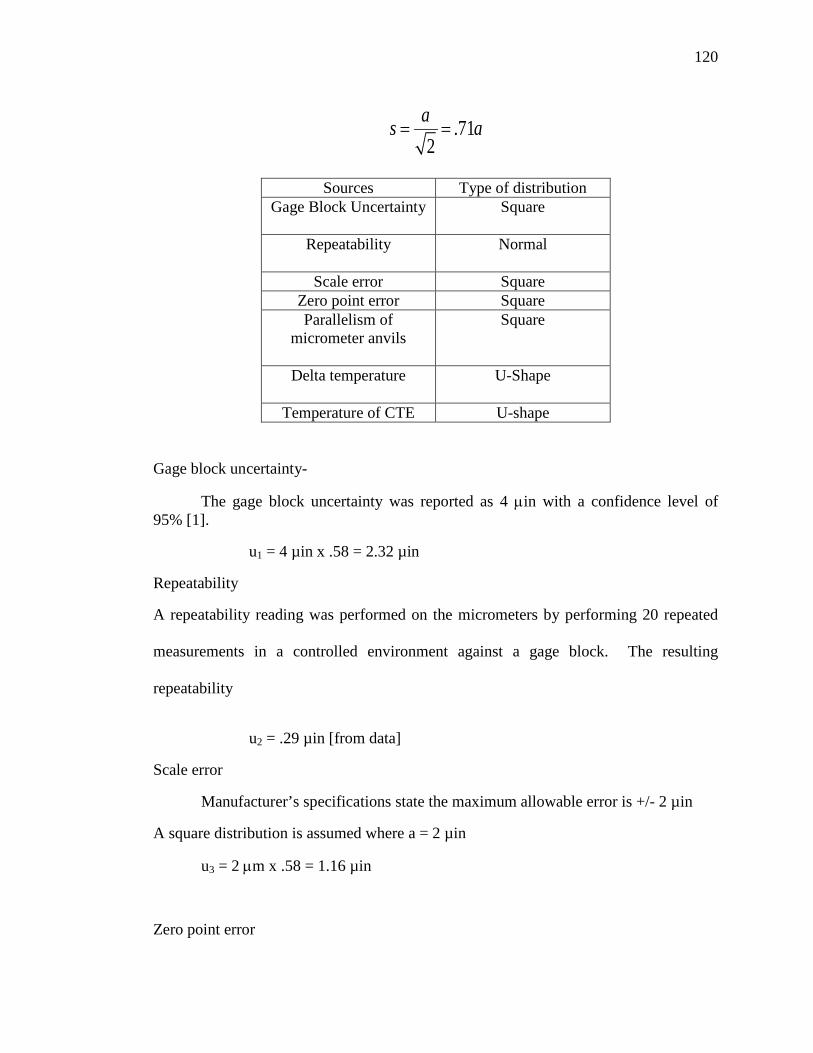
120
Sources Type of distribution Gage Block Uncertainty
Square
Repeatability
Normal
Scale error Square Zero point error Square Parallelism of
micrometer anvils
Square
Delta temperature
U-Shape
Temperature of CTE U-shape
Gage block uncertainty-
The gage block uncertainty was reported as 4 µin with a confidence level of 95% [1].
u1 = 4 µin x .58 = 2.32 µin
Repeatability
A repeatability reading was performed on the micrometers by performing 20 repeated
measurements in a controlled environment against a gage block. The resulting
repeatability
u2 = .29 µin [from data]
Scale error
Manufacturer’s specifications state the maximum allowable error is +/- 2 µin
A square distribution is assumed where a = 2 µin
u3 = 2 µm x .58 = 1.16 µin
Zero point error
.712
as a= =

121
Assuming manufacturer’s specifications state the maximum allowable zero point
error is +/- 2 µin. A square distribution is assumed where a = 2 µin
u4 = 2 µin x .58 = 1.16 µin
Parallelism of micrometer anvil
Manufacturer’s specifications state the maximum allowable parallelism error is 10µin
A square distribution of the influence of the parallelism error is assumed where a = 5 µin
u5 = 5 µin x .58 =2.9 µin
Expansion due to temperature difference between gage block and micrometer
Δ L = ∝ x Δ T x L
Assume, Δ T=0.5 oC, ∝=11.5ppm/ oC
Δ L=11.5ppm/ oC *0.5 oC*1in
= 5.75 µin
u6 = 5.75 µin x .71 = 4.0825 µin
Uncertainty due to CTE
Δ L = Δ ∝ x Δ T x L
Assume, Δ ∝ =15%∝
=15%*11.5ppm/ oC
=1.725 ppm/oC
Troom=73.8 oF = 23.2 oC
Δ L = 1.725 ppm/oC*(23.2-20) oC*1in
= 5.52 µin
u7 = 5.52 µin x .71 = 3.91 µin
Combined Uncertainty
uc= √ u12+ u2
2 + u32 + u4
2 +………
uc = 6.96
Standard Uncertainty, U=K uc

122
Assume, coverage factor K=2,
U=2*6.96
=13.93

123
APPENDIX C: TEST UNCERTAINTY CALCULATION Test Uncertainty Calculation from ISO/TS 23165
The recommended equation for the standard uncertainty of the error is
U (E) =√ u2 (εcal) + u2 (εα) + u2 (εt) + u2 (εalign) + u2 (εfixt)
Calculation for ISO 10360-2
Assuming,
u (εcal) = 0.5 µm.
u (εα) = 1ppm/oC x .1 oC x.3m = .03 µm
u (εt)= .1 x (10-8) ppm/oC x1= .2 µm
u (εalign)=0
u (εfixt)=0
U (E)= 0.539 µm
Calculation for ISO 10360-2
Assuming,
u (εcal) = 0µm.
u (εα) = 1ppm/oC x .1 oC x.3m = .03 µm
u (εt)= .1 x (10-8) ppm/oC x1= .2 µm
u (εalign)=May present, here assuming 0.
u (εfixt)=0
U (E)= 0.202 µm