Embed Size (px)
Citation preview
Contract No. TREN/04/FP6AE/SI2.374991/503192
Project Funded by European Commission, DG TREN The Sixth Framework Programme Strengthening the competitiveness
Contract No. TREN/04/FP6AE/SI2.374991/503192
Project Manager M. Röder
Deutsches Zentrum für Luft und Raumfahrt Lilienthalplatz 7, D-38108 Braunschweig, Germany
Phone: +49 (0) 531 295 3026, Fax: +49 (0) 531 295 2180 email: [email protected]
Web page: http://www.dlr.de/emma
© 2006, - All rights reserved - EMMA Project Partners The reproduction, distribution and utilization of this document as well as the communication of its contents to other without explicit authorization is prohibited. This document and the information contained herein is the property of Deutsches Zentrum für Luft- und Raumfahrt and the EMMA project partners. Offenders will be held liable for the payment of damages. All rights reserved in the event of the grant of a patent, utility model or design. The results and findings described in this document have been elaborated under a contract awarded by the European Commission.
Test Results PRAGUE
J. Jakobi, F. Morlang, A. Gilbert
DLR, PAS
Document No: D6.3.1 Version No. 1.0
Classification: Public Number of pages: 120
EMMA
Test Results PRAGUE DLR
Save date: 2006-06-02 Public Page 2 File Name: D631_Results-PRG_V1.0.doc Version: 1.0
Distribution List
Member Type No. Name POC Distributed
Internet http://www.dlr.de/emma X Web
Intranet http://www.dlr.de/emma/members X 1 DLR Joern Jakobi X 2 AENA Mario Parra Martínez X 3 AI Marianne Moller X 4 AMS Giuliano D'Auria X 5 ANS_CR Miroslav Tykal X 6 BAES Stephen Broatch X 7 STAR Max Koerte X 8 DNA Nicolas Marcou X 9 ENAV Antonio Nuzzo X 10 NLR Luc de Nijs X 11 PAS Alan Gilbert X 12 TATM Stephane Paul X 13 THAV Alain Tabard X 14 15 AUEB Konstantinos G.Zografos X 16 CSL Libor Kurzweil X 17 DAV Rolf Schroeder X 18 DFS Klaus-Ruediger Täglich X 19 EEC Stephane Dubuisson X 20 ERA Jan Hrabanek X 21 ETG Thomas Wittig X 22 MD Phil Mccarthy X 23 SICTA Claudio Vaccaro X
Contractor
24 TUD Christoph Vernaleken X CSA Karel Muendel X
Sub-Contractor
Customer EC Morten Jensen X
Additional EUROCONTROL Paul Adamson X

EMMA
Test Results PRAGUE DLR
Save date: 2006-06-02 Public Page 3 File Name: D631_Results-PRG_V1.0.doc Version: 1.0
Document Control Sheet Project Manager M. Roeder Responsible Author J. Jakobi, F. Morlang, A. Gilbert DLR, PAS
E. Firing PAS M. Biella DLR M. Helms DLR S. Loth DLR
Additional Authors
Subject / Title of Document: Test Results PRAGUE Related Task('s): WP6.3 Deliverable No. D6.3.1 Save Date of File: 2006-06-02 Document Version: 1.0 Reference / File Name D631_Results-PRG_V1.0.doc Number of Pages 120 Dissemination Level Public Target Date 2006-03-31
Change Control List (Change Log)
Date Release Changed Items/Chapters Comment 2005-12-07 0.01 Initial Draft by DLR 2005-12-22 0.02 Questionnaires results added/chapter 5 by DLR 2005-12-23 0.03 First recorded results added/chapter 3 by DLR 2006-02-07 0.04 Op. Field trial results included by DLR 2006-03-06 0.05 Techn. verification results included by PAS 2006-03-29 0.06 - MOGADOR results included (2.3 &
2.4) by DLR
2006-04-03 0.07 - Additions to techn. verification section - Editorial changes throughout
by PAS
2006-04-06 0.08 Further results and conclusions added by DLR 2006-04-07 0.09 PAS and ANS comments included and
final refinement by DLR
2006-05-10 0.10 Update of Table 2-1 by DLR and PAS 2006-05-30 0.11 Considerations of comments made by
the European Commission by DLR

EMMA
Test Results PRAGUE DLR
Save date: 2006-06-02 Public Page 4 File Name: D631_Results-PRG_V1.0.doc Version: 1.0
Table of Contents Distribution List ...................................................................................................................................... 2 Document Control Sheet ......................................................................................................................... 3 Change Control List (Change Log) ......................................................................................................... 3 Table of Contents .................................................................................................................................... 4 1 Introduction .......................................................................................................................................... 6
1.1 EMMA Project Background.......................................................................................................... 6 1.2 EMMA SP6 Background............................................................................................................... 6 1.3 EMMA WP6.3 Context ................................................................................................................. 7 1.4 Scope of the Verification and Validation Exercises...................................................................... 7 1.5 Scope of Document ....................................................................................................................... 9
2 Technical Tests Results ...................................................................................................................... 10 2.1 Introduction ................................................................................................................................. 10
2.1.1 EMMA Test-Bed at Prague Ruzyne Tower ......................................................................... 10 2.1.2 Indicators and Measurement Instruments............................................................................. 11
2.2 Raw Data ..................................................................................................................................... 13 2.3 Results ......................................................................................................................................... 13
2.3.1 Coverage Volume (VE-1) .................................................................................................... 14 2.3.2 Probability of Detection (VE-2) ........................................................................................... 18 2.3.3 Probability of False Detection (VE-3).................................................................................. 22 2.3.4 Reference Point (VE-4) ........................................................................................................ 24 2.3.5 Reported Position Accuracy (VE-5)..................................................................................... 26 2.3.6 Reported Position Resolution (VE-6)................................................................................... 30 2.3.7 Reported Position Discrimination (VE-7) ............................................................................ 31 2.3.8 Reported Velocity Accuracy (VE-8) .................................................................................... 31 2.3.9 Probability of Identification (VE-9) ..................................................................................... 32 2.3.10 Probability of False Identification (VE-10)........................................................................ 35 2.3.11 Target Report Update Rate (VE-11)................................................................................... 38 2.3.12 Probability of Detection of an Alert Situation (VE-12) ..................................................... 39 2.3.13 Probability of False Alert (VE-13) ..................................................................................... 40 2.3.14 Alert Response Time (VE-14)............................................................................................ 41 2.3.15 Routing Process Time (VE-15) .......................................................................................... 41 2.3.16 Probability of Continuous Track (VE-16).......................................................................... 41 2.3.17 Matrix of Detection (VE17) ............................................................................................... 42 2.3.18 Matrix of Identification (VE-18) ........................................................................................ 43
2.4 Summary of Technical Results.................................................................................................... 45 3 Real Time Simulation Results ............................................................................................................ 46
3.1 Introduction ................................................................................................................................. 46 3.1.1 Participants ........................................................................................................................... 46 3.1.2 Experimental Design ............................................................................................................ 46 3.1.3 Experimental Course ............................................................................................................ 49 3.1.4 Technical and Operational approval of the RTS .................................................................. 49
3.2 Operational Feasibility (RTS) ..................................................................................................... 50 3.2.1 Acceptance questionnaire results ......................................................................................... 50 3.2.2 Debriefing Comments .......................................................................................................... 53
3.3 Operational Improvements (RTS) ............................................................................................... 54 3.3.1 Safety.................................................................................................................................... 54 3.3.2 Efficiency/Capacity .............................................................................................................. 57 3.3.3 Human Factors ..................................................................................................................... 66
3.4 Departure Manager (DMAN) Demonstration Results................................................................. 72 3.4.1 Course of the Demonstration................................................................................................ 72 3.4.2 Results .................................................................................................................................. 73
EMMA
Test Results PRAGUE DLR
Save date: 2006-06-02 Public Page 5 File Name: D631_Results-PRG_V1.0.doc Version: 1.0
4 Operational Field Trials Results......................................................................................................... 75 4.1 Introduction ................................................................................................................................. 75 4.2 Operational Feasibility (Field Trials) .......................................................................................... 75
4.2.1 Debriefing Questionnaire (operational feasibility)............................................................... 75 4.2.2 Long Term Alerting Performance Assessment .................................................................... 88 4.2.3 Flight Tests - Case Studies for Testing the Alert Performance of “Crossing Runway Alerts”....................................................................................................................................................... 89
4.3 Operational Improvements (Field Trials) .................................................................................. 101 4.3.1 Debriefing Questionnaire (operational improvements) ...................................................... 101
4.4 Daily Observations .................................................................................................................... 105 5 Conclusions ...................................................................................................................................... 110
5.1 Prague V&V Approach ............................................................................................................. 110 5.2 Prague V&V Results ................................................................................................................. 110
6 Annex ............................................................................................................................................... 112 6.1 Flight Tests Scenarios ............................................................................................................... 112 6.2 References ................................................................................................................................. 115 6.3 Abbreviations ............................................................................................................................ 116 6.4 List of Figures ........................................................................................................................... 118 6.5 List of Tables............................................................................................................................. 118

EMMA
Test Results PRAGUE DLR
Save date: 2006-06-02 Public Page 6 File Name: D631_Results-PRG_V1.0.doc Version: 1.0
1 Introduction The first section of this document contains a description of the project context. The document thereby is positioned within the framework of activities for the ‘European Airport Movement Management by A-SMGCS’ (EMMA) project [1].
1.1 EMMA Project Background The ‘European Airport Movement Management by A-SMGCS’ (EMMA) integrated project is set within the Sixth Framework Program of the European Commission (Directorate General for Energy and Transport) and looks at A-SMGCS as a holistic approach for changes in airport operations. It builds on the experiences of earlier projects such as ‘Operational Benefit Evaluation by Testing A-SMGCS’ (BETA) [4]. With BETA new technologies for data extraction, digitising, data fusion, data link and multilateration became available. Although A-SMGCS progressed from a demonstration status to a fully operational system, the complete proof of benefit of A-SMGCS was missing. Therefore, EMMA is supposed to set the standards for A-SMGCS systems and their operational usage, safety and interoperability while also focussing on the benefit expectation in Europe.
In EMMA an implementation of A-SMGCS Levels I and II will be looked at as an initial step. While the Level I implementation merely seeks to enhance safety and efficiency on the ground by means of additional surveillance services, the Level II implementation already looks at an automated control service which helps controllers to detect potentially dangerous conflicts on runways and restricted areas. In EMMA2 project the focus will be extended to more automated services of A-SMGCS [8]. The new services allow for the sharing of traffic situational awareness among pilots and drivers on the airport and the introduction of an automated routing function. The system will be enhanced with additional functions such as conflict resolution advisories for controllers and the up-link of a validated route planning to pilots and drivers.
1.2 EMMA SP6 Background Validation in the EMMA framework refers to all activities during the development of A-SMCGS concepts, systems, and procedures aiming at implementing the right concept, procedure, or system. The concept development itself is carried out in EMMA SP1 and thus is not a part of the work in this SP. Developing and implementing the right concepts, procedures and systems (in terms of safety, efficiency, usability etc.) is of utmost importance at a time where advances in ATM are urgently required.
Before successful validation takes place, verification, i.e. testing against system specifications should take place. This Sub-project (SP6) also covers the description of the verification phase. Only if verification results in an A-SMGCS performing at the required level, successful validation of the concept can be started. Therefore, the verification and validation effort (called V&V) also includes the definition of minimum required performance criteria for verification, to allow for successful validation.
In summary (see also Ref. [6]):
Verification is testing against predefined technical specifications, technical functional testing (‘did we build the system right?’).
Validation is testing against operational requirements (as defined by stakeholders and written down in the ORD document of EMMA SP1 [10]), man-in-the-loop, ATM procedure testing, case studies (‘did we build the right system?’).
During the proposal phase of EMMA Phase 1, it was decided to use the ‘Master European Validation Plan (MAEVA)’ project approach to validation as the basis for EMMA Validation and Verification (V&V). The MAEVA approach is well accepted throughout the European ATM community and has

EMMA
Test Results PRAGUE DLR
Save date: 2006-06-02 Public Page 7 File Name: D631_Results-PRG_V1.0.doc Version: 1.0
been described in abundant detail in the MAEVA Validation Guideline Handbook, or VGH for short (see Ref. [5]). Nevertheless, several adaptations of MAEVA were proposed in Europe concentrating on the initial approach to validation activities and the related life cycle of the concept or technology to be validated. The “Co-operative Approach to Air Traffic Services” (CAATS) project teams summarised this proposal in their “European Operational Concept Validation Methodology” document, E-OCVM for short (see Ref. [15]), which is European wide accepted now.
EMMA liaised closely with both the MAEVA and the CAATS project teams. The European Commission installed the CAATS project with the objective to co-ordinate safety, Human Factors and validation processes, and methodologies across ATM projects in the Sixth Framework. CAATS identified best practices from these areas and brought the implied knowledge to all projects of the framework. The aim is to provide a co-ordinated approach to bring about the paradigm shift described in the ATM2000+ strategy (Ref. [3]).
1.3 EMMA WP6.3 Context The work package 6.3 is called “Prague V&V” and includes all test activities linked to simulation and on-site trials related to the Prague controllers and Prague Ruzyne Airport itself. These include:
• Preparation of the Prague V&V infrastructure • Technical tests (Verification) of A-SMGCS installed in Prague
o Assess long term surveillance performance data to promote the certification process o Assess the alert performance data
• Promote the certification process • Real Time simulation set-up and integration of the Prague A-SMGCS
o Controller Training for Prague o On-site Benefit Assessment of level I&II use
• Operational Field Trials at Prague airport o Controller Training for Prague using the test bed implementation o Validate procedures using surveillance information o Validate system alert algorithm and procedures
1.4 Scope of the Verification and Validation Exercises The basic aim of the EMMA Project is the V&V of A-SMGCS Level II functionality as described in the ICAO Manual and further refined in the ORD. EMMA Level II technical and operational functionality is identical to the definition outlined in the official documents of the EUROCONTROL A-SMGCS project. EMMA WP6.3 aims to validate the A-SMGCS Level II concept at Prague-Ruzynĕ airport.
Four stages of V&V activities have been considered. These are illustrated in the figure below.

EMMA
Test Results PRAGUE DLR
Save date: 2006-06-02 Public Page 8 File Name: D631_Results-PRG_V1.0.doc Version: 1.0
Operational Improvements
Operational Feasibility
Technical Tests
Operational Benefits
Verification
Validation
Table 1-1 Stages of V&V Activities
The Technical Tests Stage refers to the tests that should be conducted in order to assess the technical performance of A-SMGCS equipment. It answers the question: “What are the performances of the equipment?”
The Operational Feasibility Stage refers to the definition of the operational use of equipment and procedures, in accordance with the performances assessed in the previous stage. It answers the question: “Given the performances of the equipment, is it usable and acceptable?”
The Operational Improvements Stage refers to the evaluation of the operational improvements, in terms of Safety, Capacity, Efficiency, and Human Factors, using the equipment and the procedures defined in the previous stage. It answers the question: “Given the accepted A-SMGCS equipment and procedures, how is ATM improved?”
The Operational Benefits Stage refers to the translation of the operational improvements assessed during the previous stage into terms of economical benefits. It answers the question: “What are the economic benefits for the purchasers and users of A-SMGCS products?”
To summarise, the V&V aims for Prague-Ruzynĕ airport are as follows:
Verification Aims: To demonstrate that the A-SMGCS (Surveillance and Control functions), provided to the controllers, are implemented in accordance with the technical specifications listed in D3.1.1, Ground System Requirements for Prague-Ruzynĕ Airport [11] and the D1.4.2a, Technical Requirements Document Part a – Ground [17]. The D142a Technical Requirements have been deduced from the operational requirements listed in D135 ORD [10]. Validation Aims: The overall aim is to assess the operational feasibility and operational improvements of the Prague-Ruzynĕ A-SMGCS in achieving its intended operational goals as defined in the D131 OSED document [16] and the D135 ORD document [10].
In general, it can be expected that the validation exercises will demonstrate the Operational Feasibility of the ATM operational concept and that the concept provides a solution to the specific ATM problem and leads to Operational Improvements when comparing it to current SMGCS, both for airports and
EMMA
Test Results PRAGUE DLR
Save date: 2006-06-02 Public Page 9 File Name: D631_Results-PRG_V1.0.doc Version: 1.0
for the airborne side, and for different airport operating conditions.
RT-Simulations will focus on the operational feasibility of the monitoring and alert function. The RT-Simulation platform serves as a perfect V&V platform to evoke safety critical events and to tune the system alerts to the needs of the ATCOs. In addition to this main goal operational improvements in terms of safety and efficiency gains shall be proved. Also for this purpose the RTS is a well-suited means.
On-site, V&V activities will concentrate on the measurement of the technical performance and showing the operational feasibility of the whole system. Measuring “operational improvements” in the field are very difficult or even impossible. Frequently, users and the system are not certified for it to be used fully operationally. Furthermore, a valid baseline with ceteris paribus condition compared to the experimental condition (with A-SMGCS) does not exist at all. Weather, traffic mix, traffic amount, runway in use, ATCOs, etc., change frequently and any improvement effects of the A-SMGCS are then overshadowed. However, in the field it has to be shown that the overall system meets the technical performance and operational requirements. When this can be proven, operational improvements, which are measured in the RTS, can be transferred to the real environment.
1.5 Scope of Document The document is divided into six chapters:
Chapter 1 is this introduction. It describes the background, purpose and scope of the document, the document structure and context, and the methodology used.
Chapter 2 provides the verification results in terms of short and long term Technical Tests
Chapter 3 provides all raw data and results of the two Real Time Simulation trials
Chapter 4 provides all raw data and results of the Operational Field Trials
Chapter 5 provides conclusions drawn from the test results
Chapter 6 is an Annex with the flight test scenario description, lists of references, abbreviations, tables and figures.
EMMA
Test Results PRAGUE DLR
Save date: 2006-06-02 Public Page 10 File Name: D631_Results-PRG_V1.0.doc Version: 1.0
2 Technical Tests Results This chapter describes the technical tests performed and the results obtained.
2.1 Introduction
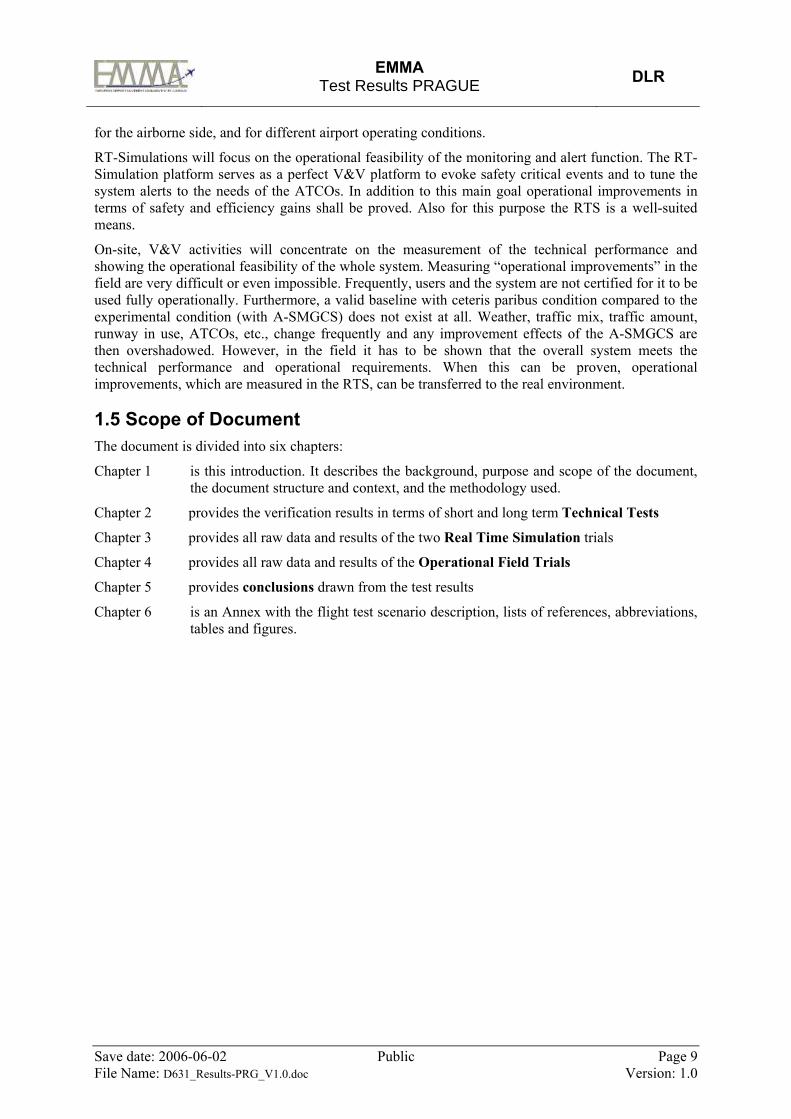
2.1.1 EMMA Test-Bed at Prague Ruzyne Tower The following figure shows the architecture of the EMMA test-bed system used for the technical tests at Prague.
LAN Switch/RouterRANC
SDS RPS
AUX
CWP-1
CWP-1
CWP-2
CWP-2
CWP-3
CWP-3
CWP-4
CWP-4SDS/RPS
KVM Switch
TECAMS
TECAMS
CDD GEC TEC TPC
MLATRCMS
VSDFLocal Area Networkof
ANS CRIP-RS &
Companel
SMR
MLAT/ADS-B
ASR - E2000
MVP (Gap-Filler)
AGL - AMS.2
FDPS/ESUP
TIME - NTP
Companels& RS-IP
Sensors andInformation Sources
Figure 2-1: EMMA Test-Bed Set-up at Prague
The EMMA test-bed system at Prague-Ruzynĕ airport consists of a combination of hardware and software components provided specifically for the EMMA project together with the pre-existing infrastructure. This infrastructure includes the surveillance sensors (SMR, MLAT, and ASR-E2000), the Flight Data Processing System (FDPS-ESUP), the Aerodrome Ground Lighting (AGL) system, and the local area network (LAN). Components provided specifically for the EMMA test-bed comprise the following items: • Surveillance Data Server (SDS) • Technical Control and Monitoring System (TECAMS) • Recording and Playback System (RPS) with Auxiliary Mass Storage Unit (AUX) • Keyboard/Video/Mouse (KVM) switch

EMMA
Test Results PRAGUE DLR
Save date: 2006-06-02 Public Page 11 File Name: D631_Results-PRG_V1.0.doc Version: 1.0
• Controller Working Positions (CWP) denoted CDD, GEC, TEC and TPC • SMR Extractor (RANC) • Gap-Filler System, including Machine Vision Processor (MVP) sensors, communication panels
(Companels) and RS-485 to Internet converters, and Video Sensor Data Fusion (VSDF) • MLAT/ADS-B Processing System, including Remote Control and Monitoring System (RCMS)
In addition, forty vehicles belonging to ANS CR and Prague Airport Company were equipped with Mode S squitter beacons (SQB).
Document D3.1.1 Ground System Requirements - Prague [11] describes the EMMA test-bed system and lists the technical requirements.
2.1.2 Indicators and Measurement Instruments The definition of indicators that were to be measured can be found in the document D6.1.2 Test Plan - Prague [13]. Only the key words and abbreviations are repeated here.
The most important technical performance requirements were to be assessed by 18 verification indicators. Their relation to the TRD, ORD, ICAO, and EUROCAE (MASPS) technical requirements can be seen in the table below.
The verification tests aim primarily at assessing the long-term quality of the surveillance and conflict detection performance. These long-term measurements were to be performed by the recording and analysis tool MOGADOR, which is described in Document D1.1.2 CDG A-SMGCS Data Analysis [14]. Other measurement instruments were Matrices of Detection and Identification, described in the data analysis section below. In addition, short-term tests were to be performed prior to the long-term technical and operational test period in order to assess the readiness of the test-bed system and to verify by visual observation the system’s compliance with the technical requirements in D3.1.1 [11].
The following table summarises the indicators and measurement instruments associated with the verification of the technical performance requirements.
ID Indicator Acronym Requirement Reference Measurement Instruments
VE-1 Coverage Volume
CV Approaches Manoeuvring Area Apron taxi lines
TRD: Tech_Surv_01; 02 ORD: Op_Serv-07 ICAO: 4.1.1.4 MASPS: 3.1.3
Recording Observations MOGADOR
VE-2 Probability of Detection
PD ≥ 99.9% TRD: Tech_Surv_35 ORD: Op_Perf-01 ICAO: 3.4.1.4.a MASPS: 3.2.3
Recording Observations MOGADOR Matrix of Detection
VE-3 Probability of False Detection
PFD < 10E-3 per Reported Target
TRD: Tech_Surv_36 ORD: Op_Perf-02 ICAO: 3.4.1.4.b MASPS: 3.2.3
Recording Observations MOGADOR Matrix of Detection
VE-4 Reference Point RP Not defined TRD: Tech_Gen_45 ORD: None ICAO: 3.5.7; 4.2.2 MASPS: 3.2.1.2
Recording Observations
VE-5 Reported Position Accuracy
RPA ≤ 7.5 m at a confidence level of 95%
TRD: Tech_Surv_26 ORD: Op_Perf-05; 15 ICAO: 4.2.3 MASPS: 3.2.3
Recording Observations

EMMA
Test Results PRAGUE DLR
Save date: 2006-06-02 Public Page 12 File Name: D631_Results-PRG_V1.0.doc Version: 1.0
ID Indicator Acronym Requirement Reference Measurement Instruments
VE-6 Reported Position Resolution
RPR ≤ 1 m TRD: Tech_Surv_27 ORD: Op_Perf-06 ICAO: None MASPS: 3.2.3
Recording Observations
VE-7 Reported Position Discrimination
RPD Not defined TRD: None ORD: None ICAO: None MASPS: None
Recording Observations
VE-8 Reported Velocity Accuracy
RVA Speed: ≤ 5 m/s Direction: ≤ 10° at a confidence level of 95%
TRD: Tech_Surv_28; 29 ORD: Op_Perf-16 ICAO: 4.1.1.8, 4.1.1.10 MASPS: 3.2.3
Recording Observations
VE-9 Probability of Identification
PID ≥ 99.9% for identifiable Targets
TRD: Tech_Surv_37 ORD: Op_Perf-03 ICAO: 3.4.1.4.c MASPS: 3.2.3
Recording Observations MOGADOR
VE-10 Probability of False Identification
PFID < 10E-3 per Reported Target
TRD: Tech_Surv_38 ORD: Op_Perf-04 ICAO: 3.4.1.4.d MASPS: 3.2.3
Recording Observations MOGADOR
VE-11 Target Report Update Rate
TRUR ≤ 1 s
TRD: Tech_Surv_34 ORD: Op_Perf-08 ICAO: 4.2.4 MASPS: 3.2.3
Recording Observations
VE-12 Probability of Detection of an Alert Situation
PDAS ≥ 99.9% TRD: Tech_Cont_11 ORD: None ICAO: 4.5.1 MASPS: 3.3.3
Recording Observations
VE-13 Probability of False Alert
PFA < 10E-3 per Alert TRD: Tech_ Cont_12 ORD: Op_Perf-20 ICAO: 4.5.1 MASPS: 3.3.3
Recording Observations
VE-14 Alert Response Time
ART ≤ 0.5 s
TRD: Tech_ Cont_13 ORD: None ICAO: 4.5.2 MASPS: 3.3.3
Observations
VE-15 Routing Process Time
RPT < 10 s TRD: None ORD: None ICAO: 4.3.2
Not applicable for Prague
VE-16 Probability of Continuous Track
PCT Not specified TRD: None ORD: None ICAO: None MASPS: None
Recording MOGADOR
VE-17 Matrix of Detection
MOD Not specified TRD: None ORD: None ICAO: None MASPS: None
Recording MOGADOR

EMMA
Test Results PRAGUE DLR
Save date: 2006-06-02 Public Page 13 File Name: D631_Results-PRG_V1.0.doc Version: 1.0
ID Indicator Acronym Requirement Reference Measurement Instruments
VE-18 Matrix of Identification
MOI Not specified TRD: None ORD: None ICAO: None MASPS: None
Recording MOGADOR
Table 2-1: Technical Verification Indicators
2.2 Raw Data Raw data was gathered during Site Acceptance Testing (SAT) of the EMMA test-bed system carried out at Prague Ruzynĕ airport in the period 14-18 March 2005.
Site acceptance testing concentrated mainly on the specific items provided for the EMMA Test-Bed. However, to prepare the way for the operational verification and validation exercises in SP6, the SAT also included basic technical performance verification tests of the overall A-SMGCS including the existing surveillance sensors. These technical verification tests and the results obtained are described in this section.
The objectives of the SAT were to verify the correct function of the EMMA test-bed system and to demonstrate that the technical requirements defined in deliverable document D3.1.1 Ground System Requirements - Prague [11] had been fulfilled.
The SAT was performed by Park Air Systems personnel with the assistance of ANS CR and witnessed by ANS CR.
Supplementary tests were performed in the period 8-11 November 2005.
Testing consisted mainly of visual observation of the traffic situation displays at the controller working positions in the EMMA test room (old TWR) while observing the live traffic through the window. In addition, a follow-me vehicle equipped with a 1090ES squitter beacon (SQB) was directed to perform various manoeuvres in order to gather data for the measurement of specific verification indicators.
All relevant data was continuously recorded throughout the trial period for later analysis.
The data collected consisted of recordings in Park Air proprietary format and included: - Target reports from all surveillance sensor systems - Flight plan data - Target reports from the surveillance data fusion process of the SDS - Operator actions at the CWPs - Alerts - Airport context data
During a replay session, this recorded information is sufficient to permit the full reconstruction of all information displayed at any CWP.
The archive media is Advanced Intelligent Tape ™ (™ Sony AIT).
2.3 Results Except for the performance indicator results derived in this section, the full list of technical requirements for the Prague test-bed, with the related acceptance tests and the results obtained, is given in document D3.6.1 Site Acceptance Test Report - Prague [12]. The main objective of the site acceptance tests was to ensure that the performance of the EMMA test-bed system was adequate to permit the system to be used for operational tests.

EMMA
Test Results PRAGUE DLR
Save date: 2006-06-02 Public Page 14 File Name: D631_Results-PRG_V1.0.doc Version: 1.0
Some requirements were verified by visual observation, others by analysing recorded data to obtain quantitative results. These tests and the results obtained are described below.
The MOGADOR tool was used to perform automatic long-term observations of the system surveillance performance. Data were compiled and analysed over a period of 4 weeks. The tool can locate blind spots and output maps with blind spots for the different conditions.
The data are analysed by taking into account different independent variables: • Different traffic objects that operate on the airport (aircraft, vehicles, unknown) • Different weather conditions (no snow and precipitation vs. snow or and precipitation) • Different zones of the aerodrome (Runway, Obstacles Free Zone [OFZ], Taxiways)
In the test descriptions that follow, each indicator is presented under a separate heading in the following format: - Indicator ID - a unique, unambiguous identifier for each indicator. - Hypothesis - the specification of the requirement or definition of the indicator to be
tested - Test Procedure - the description of the test method, or a statement of how the requirement
has been fulfilled without the need for a specific test. In some cases, the test procedure is split into short-term and long-term tests.
- Result - the result of the test, including analysis of the test data where applicable
2.3.1 Coverage Volume (VE-1) Hypothesis
VE-1 The A-SMGCS equipment should provide surveillance coverage throughout the Movement Area up to a height of at least 200 feet above the Aerodrome surface, and on the approaches to each runway out to a distance of 10 NM.
Test Procedure
a) Short-Term Test (performed at SAT)
The Coverage Volume (CV) was tested by visual observation transiting the Movement Area of interest with a test vehicle and recording the target report position and identification data. Coverage was also confirmed by observing the HMI.
All aircraft and vehicle movements, non-cooperative as well as cooperative, were recorded over a period of one hour with heavy traffic. The recordings included airborne aircraft on the approaches to the airport.
Weather conditions at the time of the test were noted.
Result
a) Short-Term Test
The following figure shows the Prague Ruzynĕ airport layout at the date of the test.

EMMA
Test Results PRAGUE DLR
Save date: 2006-06-02 Public Page 15 File Name: D631_Results-PRG_V1.0.doc Version: 1.0
Figure 2-2: Prague Ruzynĕ Airport Layout
Aerodrome Status: Taxiways C and D and northern end of RWY 31 were closed throughout the test period due to construction of new rapid exits. Pier C was under construction.
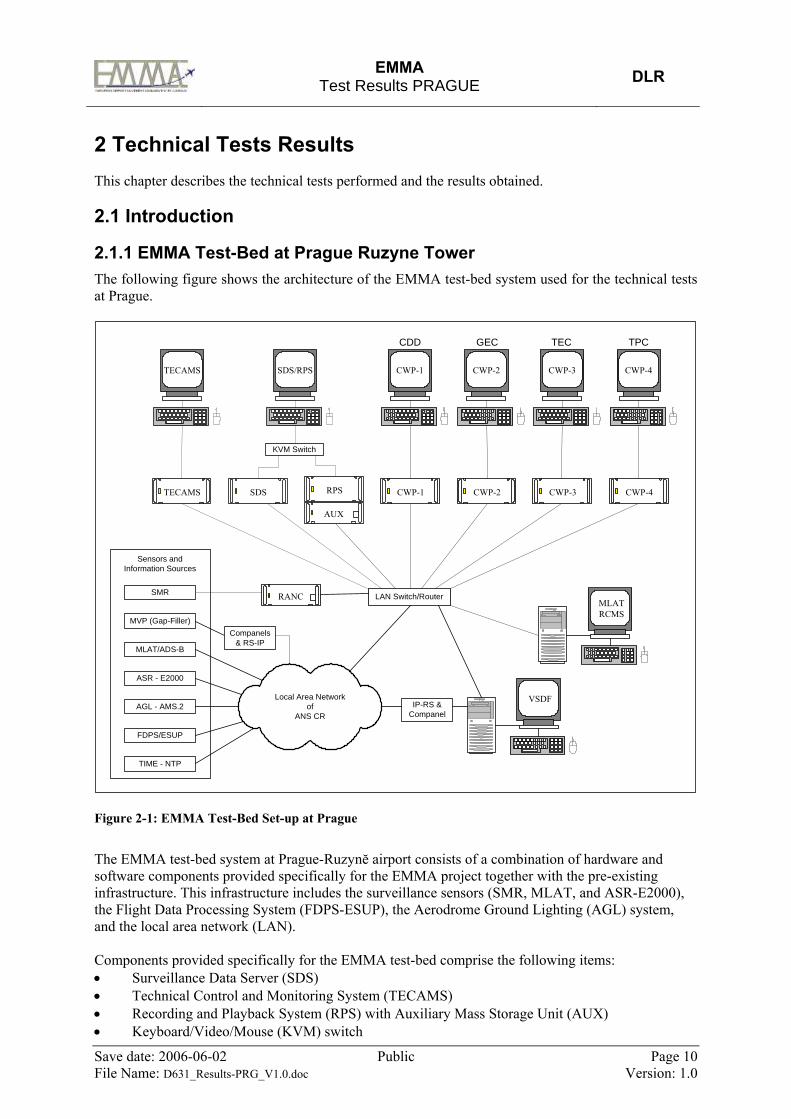
The following figure shows the trajectories of all traffic within 10NM of the airport during the hour of recording. The trajectories are the position reports recorded at the output of the surveillance data server (SDS).
Weather condition: Fine and clear, no precipitation. File: “alltracks.txt” recorded 16 March 2005, 10:40 to 11:40 UTC.
During the period of the recording, runways 06 and 31 were in use, both in mixed mode.
EMMA
Test Results PRAGUE DLR
Save date: 2006-06-02 Public Page 16 File Name: D631_Results-PRG_V1.0.doc Version: 1.0
Figure 2-3: Plot Showing Coverage out to 10NM during CV Test
Note that the target report update rate for airborne traffic is higher close to the airport where the traffic is within range of the MLAT system. Farther out, the only sensor contributing to the track is the approach radar (with a 6 second update rate).
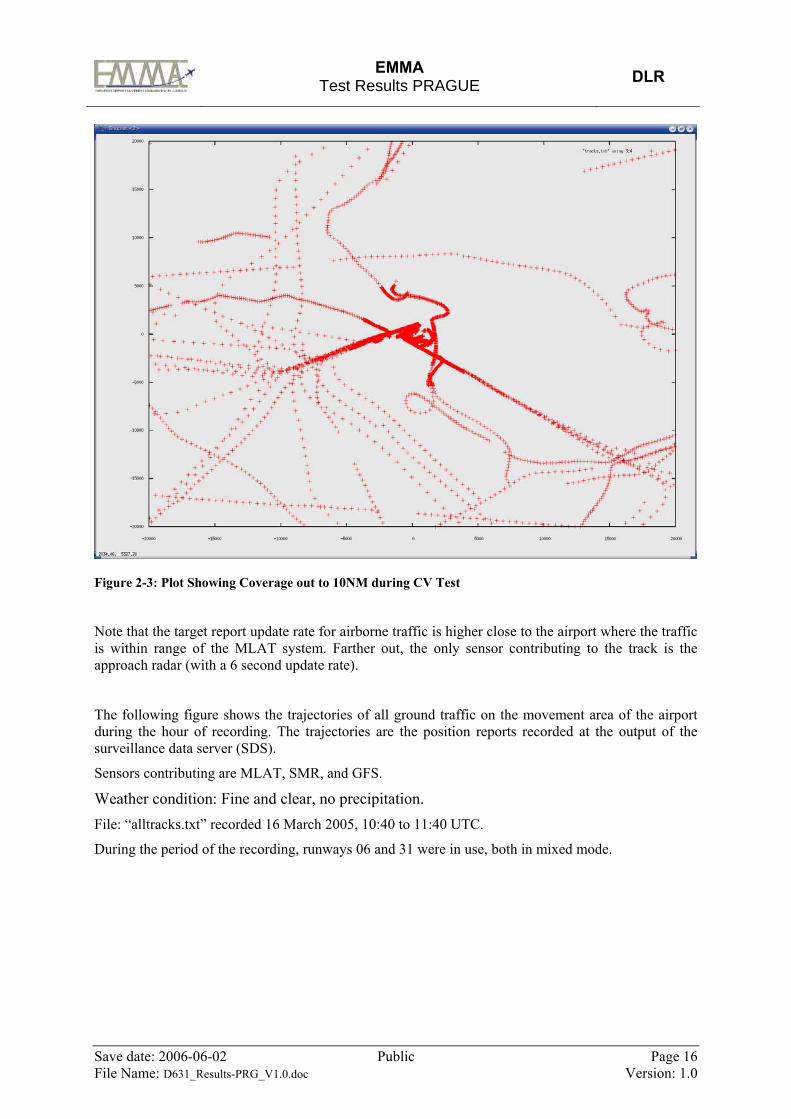
The following figure shows the trajectories of all ground traffic on the movement area of the airport during the hour of recording. The trajectories are the position reports recorded at the output of the surveillance data server (SDS).
Sensors contributing are MLAT, SMR, and GFS.
Weather condition: Fine and clear, no precipitation. File: “alltracks.txt” recorded 16 March 2005, 10:40 to 11:40 UTC.
During the period of the recording, runways 06 and 31 were in use, both in mixed mode.
EMMA
Test Results PRAGUE DLR
Save date: 2006-06-02 Public Page 17 File Name: D631_Results-PRG_V1.0.doc Version: 1.0
Figure 2-4: Plot Showing Ground Traffic Trajectories during CV Test
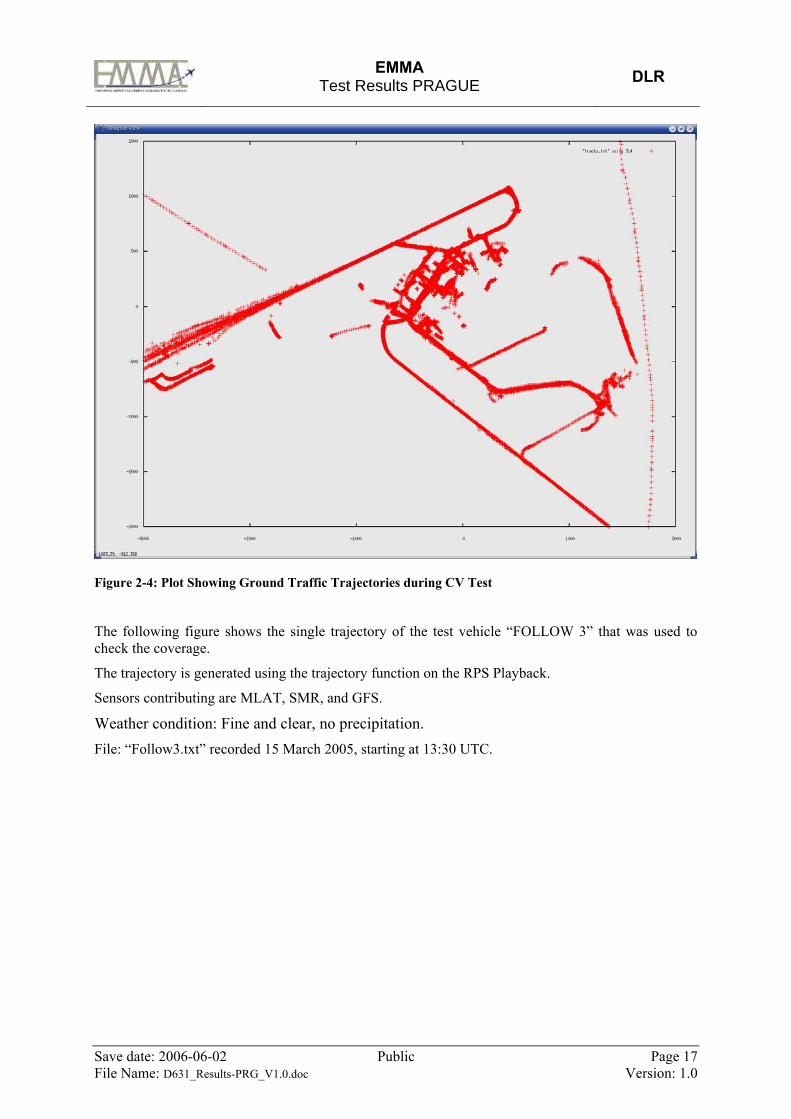
The following figure shows the single trajectory of the test vehicle “FOLLOW 3” that was used to check the coverage.
The trajectory is generated using the trajectory function on the RPS Playback.
Sensors contributing are MLAT, SMR, and GFS.
Weather condition: Fine and clear, no precipitation. File: “Follow3.txt” recorded 15 March 2005, starting at 13:30 UTC.
EMMA
Test Results PRAGUE DLR
Save date: 2006-06-02 Public Page 18 File Name: D631_Results-PRG_V1.0.doc Version: 1.0
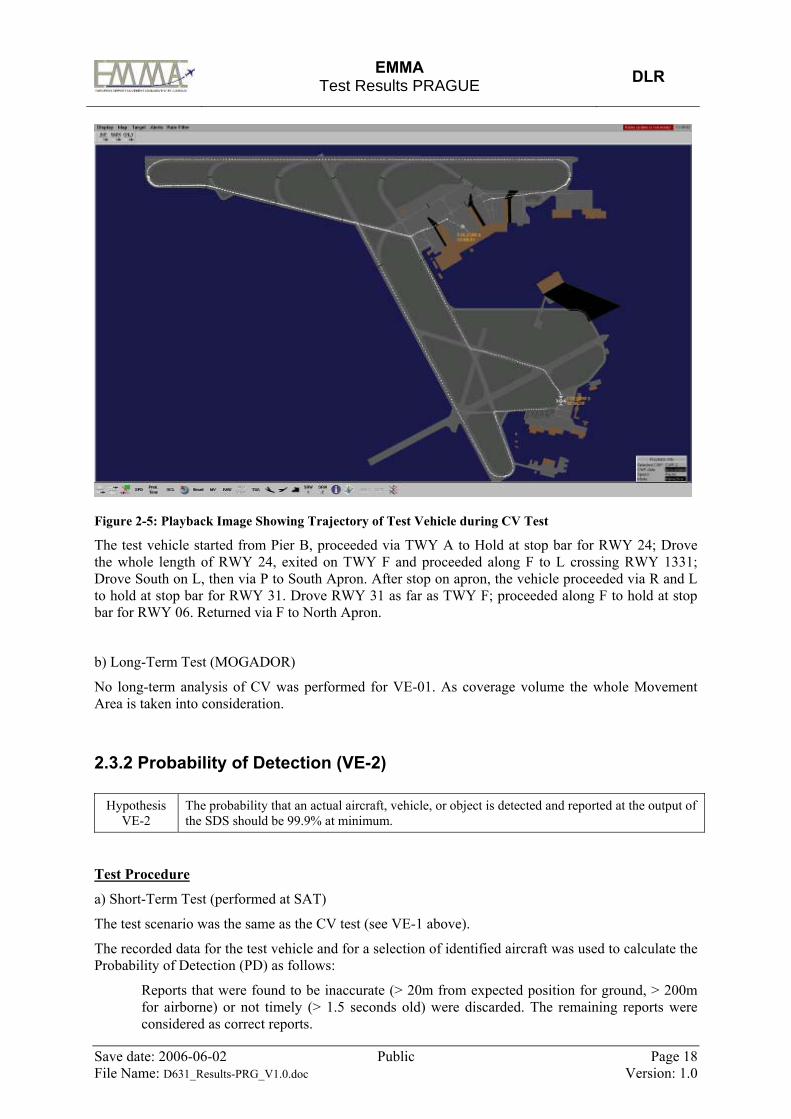
Figure 2-5: Playback Image Showing Trajectory of Test Vehicle during CV Test
The test vehicle started from Pier B, proceeded via TWY A to Hold at stop bar for RWY 24; Drove the whole length of RWY 24, exited on TWY F and proceeded along F to L crossing RWY 1331; Drove South on L, then via P to South Apron. After stop on apron, the vehicle proceeded via R and L to hold at stop bar for RWY 31. Drove RWY 31 as far as TWY F; proceeded along F to hold at stop bar for RWY 06. Returned via F to North Apron.
b) Long-Term Test (MOGADOR)
No long-term analysis of CV was performed for VE-01. As coverage volume the whole Movement Area is taken into consideration.
2.3.2 Probability of Detection (VE-2)
Hypothesis VE-2
The probability that an actual aircraft, vehicle, or object is detected and reported at the output of the SDS should be 99.9% at minimum.
Test Procedure
a) Short-Term Test (performed at SAT)
The test scenario was the same as the CV test (see VE-1 above).
The recorded data for the test vehicle and for a selection of identified aircraft was used to calculate the Probability of Detection (PD) as follows:
Reports that were found to be inaccurate (> 20m from expected position for ground, > 200m for airborne) or not timely (> 1.5 seconds old) were discarded. The remaining reports were considered as correct reports.
EMMA
Test Results PRAGUE DLR
Save date: 2006-06-02 Public Page 19 File Name: D631_Results-PRG_V1.0.doc Version: 1.0
The expected number of reports is: Time of the last report - Time of the first report + 1
TRUR
Then, %100.reportsofnumberExpected
reportscorrectofNumberPD =
b) Long-Term Test (MOGADOR)
The test scenario was the same as for the CV test (see VE-1 above).
First, the MOGADOR tool was used to calculate the PD for the same data as for the short-term tests. This MOGADOR result was compared with the calculated value to confirm that the MOGADOR was correctly calibrated.
MOGADOR was then used to assess the PD for the longer period (4 weeks).
Results
a) Short-Term Test
Weather condition: Fine and clear, no precipitation. File: “Follow3.txt” recorded 15 March 2005, starting at 13:30 UTC.
File: “alltracks.txt” recorded 16 March 2005, 10:40 to 11:40 UTC.
Area Mobile Type Expected No.
of Reports No. of Correct
Reports PD
Aircraft 1472 1471 99.93% RWY
Test vehicle 251 251 100%
Aircraft 2830 2820 99.65% TWY
Test vehicle 1730 1730 100%
Approach Aircraft 1167 1165 99.83%
Table 2-2: Results of Probability of Detection Test
b) Long-Term Test (MOGADOR)
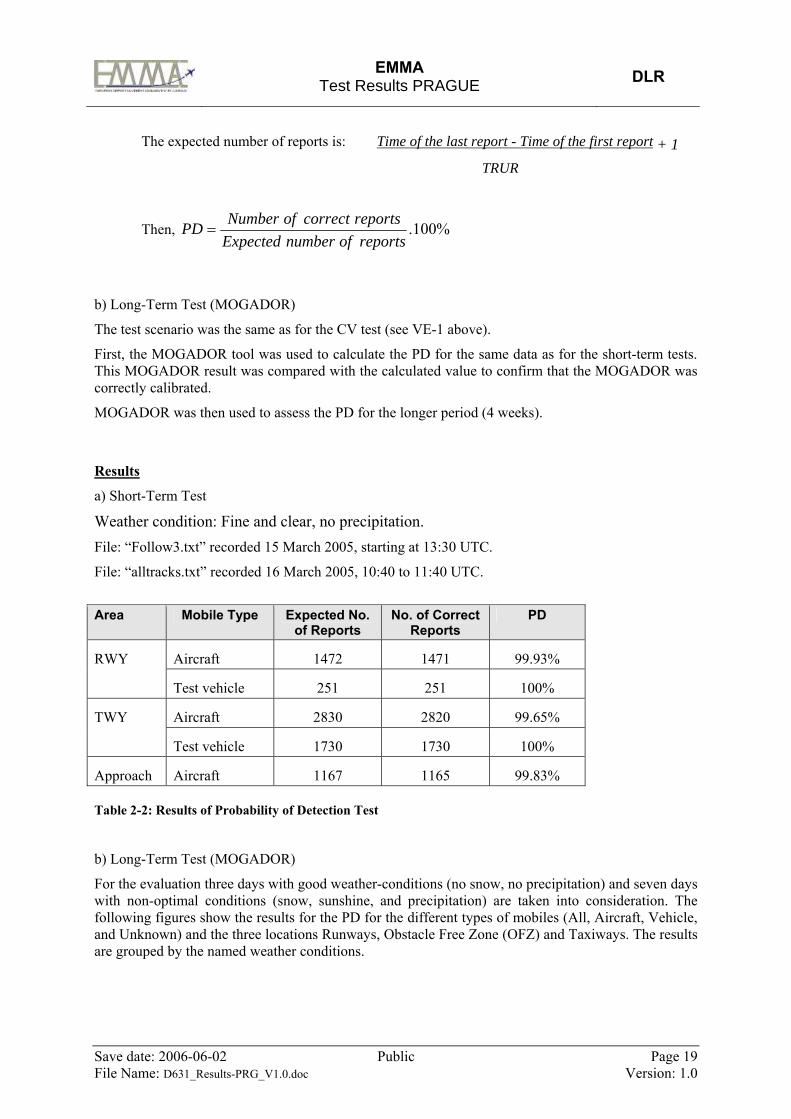
For the evaluation three days with good weather-conditions (no snow, no precipitation) and seven days with non-optimal conditions (snow, sunshine, and precipitation) are taken into consideration. The following figures show the results for the PD for the different types of mobiles (All, Aircraft, Vehicle, and Unknown) and the three locations Runways, Obstacle Free Zone (OFZ) and Taxiways. The results are grouped by the named weather conditions.
EMMA
Test Results PRAGUE DLR
Save date: 2006-06-02 Public Page 20 File Name: D631_Results-PRG_V1.0.doc Version: 1.0
A ll
80
82
84
86
88
90
92
94
96
98
100
18.2.2006 19.2.2006 20.2.2006 21.2.2006 22.2.2006
Date
A irc ra f t
80
82
84
86
88
90
92
94
96
98
100
18.2.2006 19.2.2006 20.2.2006 21.2.2006 22.2.2006Date
V e hic le
80
82
84
86
88
90
92
94
96
98
100
18.2.2006 19.2.2006 20.2.2006 21.2.2006 22.2.2006Date
Unk no wn
80
82
84
86
88
90
92
94
96
98
100
18.2.2006 19.2.2006 20.2.2006 21.2.2006 22.2.2006Date
Runways OFZ Taxiways
Figure 2-6: PD Long Term Observation (excellent weather conditions (no snow, no precipitation))
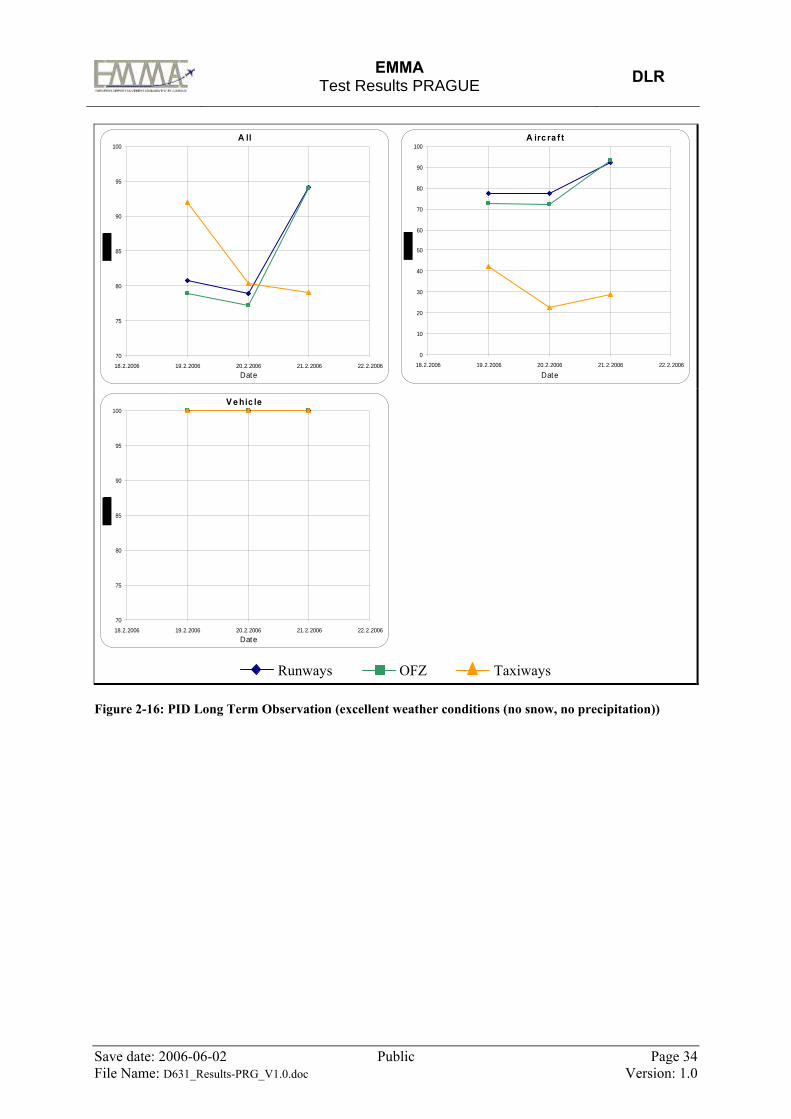
While the PD for Aircraft and Vehicle on Runways and Taxiways in good weather stays on a high level (AC 99.2-99.8%, Vehicle 97.5-99.7%), the PD for Unknown mobiles varies from 83.7-98.3%. The values for the Taxiways are significantly lower.

EMMA
Test Results PRAGUE DLR
Save date: 2006-06-02 Public Page 21 File Name: D631_Results-PRG_V1.0.doc Version: 1.0
A ll
80
82
84
86
88
90
92
94
96
98
100
29.1.2006 30.1.2006 31.1.2006 1.2.2006 2.2.2006 3.2.2006 4.2.2006
Date
A irc ra f t
80
82
84
86
88
90
92
94
96
98
100
29.1.2006 30.1.2006 31.1.2006 1.2.2006 2.2.2006 3.2.2006 4.2.2006
Date
V e hic le
80
82
84
86
88
90
92
94
96
98
100
29.1.2006 30.1.2006 31.1.2006 1.2.2006 2.2.2006 3.2.2006 4.2.2006Date
Unk no wn
80
82
84
86
88
90
92
94
96
98
100
29.1.2006 30.1.2006 31.1.2006 1.2.2006 2.2.2006 3.2.2006 4.2.2006
Date
Runways OFZ Taxiways
Figure 2-7: PD Long Term Observation (no optimal weather conditions (snow)
In non-optimal weather conditions, a reduction of the PD can be seen. For “All” the PD has a minimum of 92% (Runway and Taxiways) and a maximum of 98% (Runways and OFZ).
During the analysis with MOGADOR, it has been discovered that reports of tracks are rejected by the tool. This happens if tracks are crossing the apron area (which has been masked out by MOGADOR) or running besides the RWY after take-off. The path reconstruction function is used to combine isolated reports and track-parts with other tracks. For Prague airport, reports have been added to tracks which do not belong to them. It has been identified that the tuning of the parameters of MOGADOR has a big influence on the results. It needs a lot of time to get this function working properly. Furthermore, a correct, highly accurate, and a current topology for the airport is necessary. All the mentioned facts lead to the result, that the PD is very different from day to day.
EMMA
Test Results PRAGUE DLR
Save date: 2006-06-02 Public Page 22 File Name: D631_Results-PRG_V1.0.doc Version: 1.0
2.3.3 Probability of False Detection (VE-3)
Hypothesis VE-3
The probability that anything other than an actual aircraft, vehicle, or object is detected and reported at the output of the SDS should not exceed 10E-3 per reported target.
Test Procedure
a) Short-Term Test (performed at SAT)
The test scenario was the same as for the CV test (see VE-1 above).
The recorded data was used to calculate the Probability of False Detection (PFD) as follows:
The number of erroneous reports was found by summing reports not corresponding to known obstacles (considering the required accuracy) with the discarded reports from known mobiles that do not meet accuracy and timeliness requirements (see PD test for values).
Then, %100⋅=reportsofnumberTotal
reportserroneousofNumberPFD
b) Long-Term Test (MOGADOR)
First, the MOGADOR tool was used to calculate the PFD for the same data as for the short-term tests. This MOGADOR result was compared with the calculated value to confirm that the MOGADOR was correctly calibrated. MOGADOR was then used to assess the PFD for the longer period (4 weeks).
Result
a) Short-Term Test
Weather condition: Fine and clear, no precipitation. File: “Follow3.txt” recorded 15 March 2005, starting at 13:30 UTC.
File: “alltracks.txt” recorded 16 March 2005, 10:40 to 11:40 UTC.
Area Mobile Type Expected No.
of Reports No. of
Erroneous Reports
PFD
Aircraft 1472 1 0.07% RWY
Test vehicle 251 0 0.00%
Aircraft 2830 2 0.07% TWY
Test vehicle 1730 0 0.00%
Approach Aircraft 1167 2 0.17%
Table 2-3: Results of Probability of False Detection Test
b) Long-Term Test (MOGADOR)
For the evaluation, three days with good weather-conditions (no snow, no precipitation) and seven days with non-optimal conditions (snow, precipitation) are taken into consideration. The following

EMMA
Test Results PRAGUE DLR
Save date: 2006-06-02 Public Page 23 File Name: D631_Results-PRG_V1.0.doc Version: 1.0
figures show the results for the PFD for the different types of mobiles (All, Aircraft, Vehicle, and Unknown) and the three locations Runways, Obstacle Free Zone (OFZ), and Taxiways. The results are grouped by the named weather conditions.
A ll
0
0,05
0,1
0,15
0,2
0,25
18.2.2006 19.2.2006 20.2.2006 21.2.2006 22.2.2006Date
A irc ra f t
0
0,04
0,08
0,12
0,16
0,2
18.2.2006 19.2.2006 20.2.2006 21.2.2006 22.2.2006Date
V e hic le
0
0,05
0,1
0,15
0,2
0,25
0,3
18.2.2006 19.2.2006 20.2.2006 21.2.2006 22.2.2006Date
Unk no wn
0
0,2
0,4
0,6
0,8
1
1,2
1,4
18.2.2006 19.2.2006 20.2.2006 21.2.2006 22.2.2006Date
Runways OFZ Taxiways
Figure 2-8: PFD Long Term Observation (excellent weather conditions (no snow, no precipitation))

EMMA
Test Results PRAGUE DLR
Save date: 2006-06-02 Public Page 24 File Name: D631_Results-PRG_V1.0.doc Version: 1.0
A ll
0
1
2
3
4
5
6
7
29.1.2006 30.1.2006 31.1.2006 1.2.2006 2.2.2006 3.2.2006 4.2.2006Date
A irc ra f t
0
1
2
3
4
5
6
7
8
9
29.1.2006 30.1.2006 31.1.2006 1.2.2006 2.2.2006 3.2.2006 4.2.2006
Date
V e hic le
0
0,1
0,2
0,3
0,4
0,5
0,6
29.1.2006 30.1.2006 31.1.2006 1.2.2006 2.2.2006 3.2.2006 4.2.2006Date
Unk no wn
0
0,5
1
1,5
2
2,5
3
3,5
29.1.2006 30.1.2006 31.1.2006 1.2.2006 2.2.2006 3.2.2006 4.2.2006Date
Runways OFZ Taxiways
Figure 2-9: PFD Long Term Observation (no optimal weather conditions (snow))
The analysis of the PFD with MOGADOR has shown that the differences of the PFD-value are big during bad weather. This also indicates that the result do not depend only on the weather, but are probably caused by inadequate tuning of the MOGADOR tool to the Prague airport conditions.
2.3.4 Reference Point (VE-4)
Hypothesis VE-4
A reference point on aircraft and vehicles is required to enable the A-SMGCS to determine their positions.
Test Procedure
The recommended common reference point is the geometric centre of the aircraft or vehicle. The aim of this test was to measure the bias between the reported position of the target and the target reference point, especially for medium and large aircraft.
The test scenario was the same as for CV (see VE-1 above).

EMMA
Test Results PRAGUE DLR
Save date: 2006-06-02 Public Page 25 File Name: D631_Results-PRG_V1.0.doc Version: 1.0
The recorded data was played back and used to observe stationary aircraft on the Controller HMI and to estimate the reported position compared with the actual position of the centre of the aircraft as shown by the SMR video image. Measurements were made for aircraft on different parts of the airport, with different headings with respect to the SMR,
Result
File: “alltracks.txt” recorded 16 March 2005, 10:40 to 11:40 UTC.
Mobile Type RP (m)
Small Vehicle < 2 m
Small Aircraft (Cessna) < 3 m
Medium Aircraft (ATR) < 7 m
Large Aircraft (B737) < 12 m
Very Large Aircraft (B747) < 20 m
Table 2-4: Results of RP Test
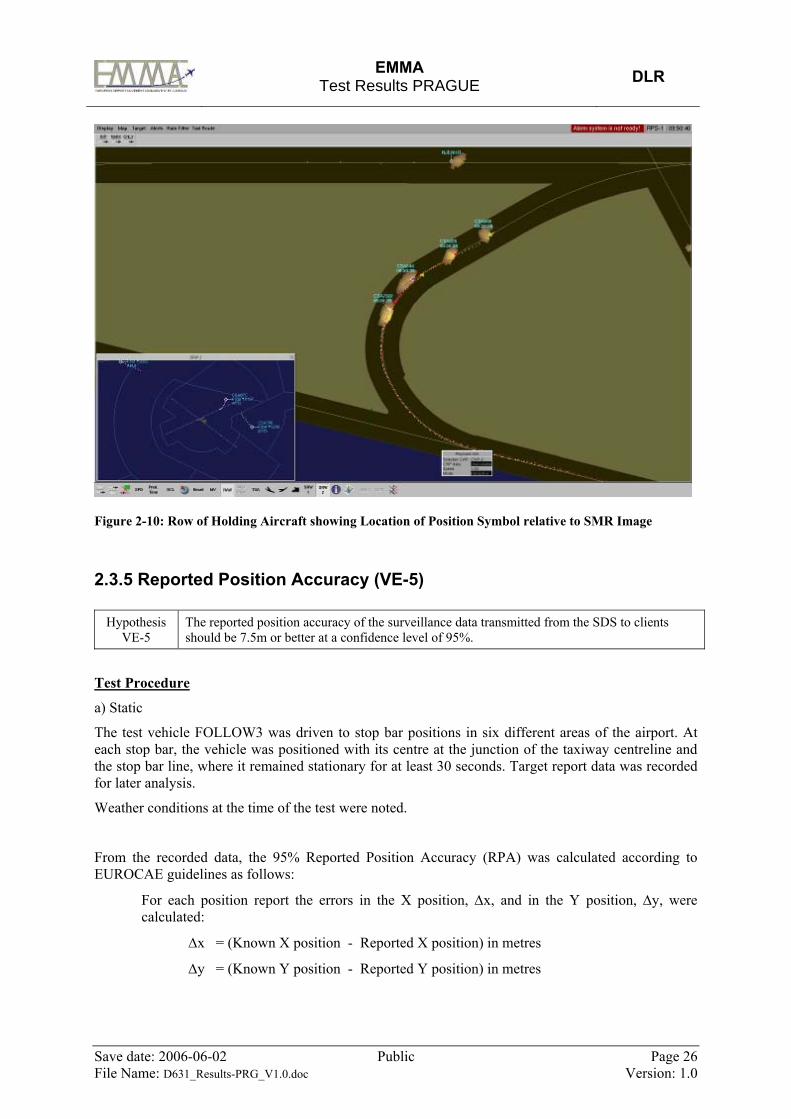
In all cases, the value of RP represents the displacement of the position symbol of the mobile on the CWP traffic situation display with respect to the centre of its SMR image. The position symbol is displaced because the data fusion gives most weight to the MLAT position reports, locate the position of the aircraft’s Mode S transmitting antenna. In the case of an aircraft, the direction of the displacement is always towards the nose; for a vehicle, it may be in any direction, depending on where the antenna has been mounted.
In the longer term, the data fusion algorithm could be improved to take account of this displacement if the system knows the aircraft type and the direction in which the aircraft is heading. The following picture shows a queue of medium and large aircraft holding at a runway entry point. The displacement of the target position symbol towards the front of the aircraft can be clearly seen.
EMMA
Test Results PRAGUE DLR
Save date: 2006-06-02 Public Page 26 File Name: D631_Results-PRG_V1.0.doc Version: 1.0
Figure 2-10: Row of Holding Aircraft showing Location of Position Symbol relative to SMR Image
2.3.5 Reported Position Accuracy (VE-5)
Hypothesis VE-5
The reported position accuracy of the surveillance data transmitted from the SDS to clients should be 7.5m or better at a confidence level of 95%.
Test Procedure
a) Static
The test vehicle FOLLOW3 was driven to stop bar positions in six different areas of the airport. At each stop bar, the vehicle was positioned with its centre at the junction of the taxiway centreline and the stop bar line, where it remained stationary for at least 30 seconds. Target report data was recorded for later analysis.
Weather conditions at the time of the test were noted.
From the recorded data, the 95% Reported Position Accuracy (RPA) was calculated according to EUROCAE guidelines as follows:
For each position report the errors in the X position, ∆x, and in the Y position, ∆y, were calculated:
∆x = (Known X position - Reported X position) in metres
∆y = (Known Y position - Reported Y position) in metres

EMMA
Test Results PRAGUE DLR
Save date: 2006-06-02 Public Page 27 File Name: D631_Results-PRG_V1.0.doc Version: 1.0
Known Position
∆x
∆y
Reported Position
Figure 2-11: X and Y Components of Position Error
The resulting data was used to calculate the mean X and Y errors according to the following formulae, where i = 1,2,3,…n and n is the number of reports:
Mean deviation in X, mx = ∑ ∆xi/n
Mean deviation in Y, my = ∑ ∆yi/n
Then, the RPA was calculated using the following formulae:
Rx = C*√(∑ (∆xi - mx)2/n) + mx
Ry = C*√(∑ (∆yi – my)2/n) + my
RPA = √(Rx2 + Ry
2)
Where the coefficient C is set to 1.960 for the required 95% confidence level.
b) Dynamic
The test vehicle made a series of manoeuvres as it drove around the Movement Area. These are the following manoeuvres: • Straight-line acceleration and deceleration on the runway • Driving at constant speeds along a runway and straight stretches of taxiway • Turning corners • Deceleration from high speed to stop at a stopbar
Observation of the target reports on the Controller HMI when compared with the actual position of the vehicle was used to estimate the deviation.
Result
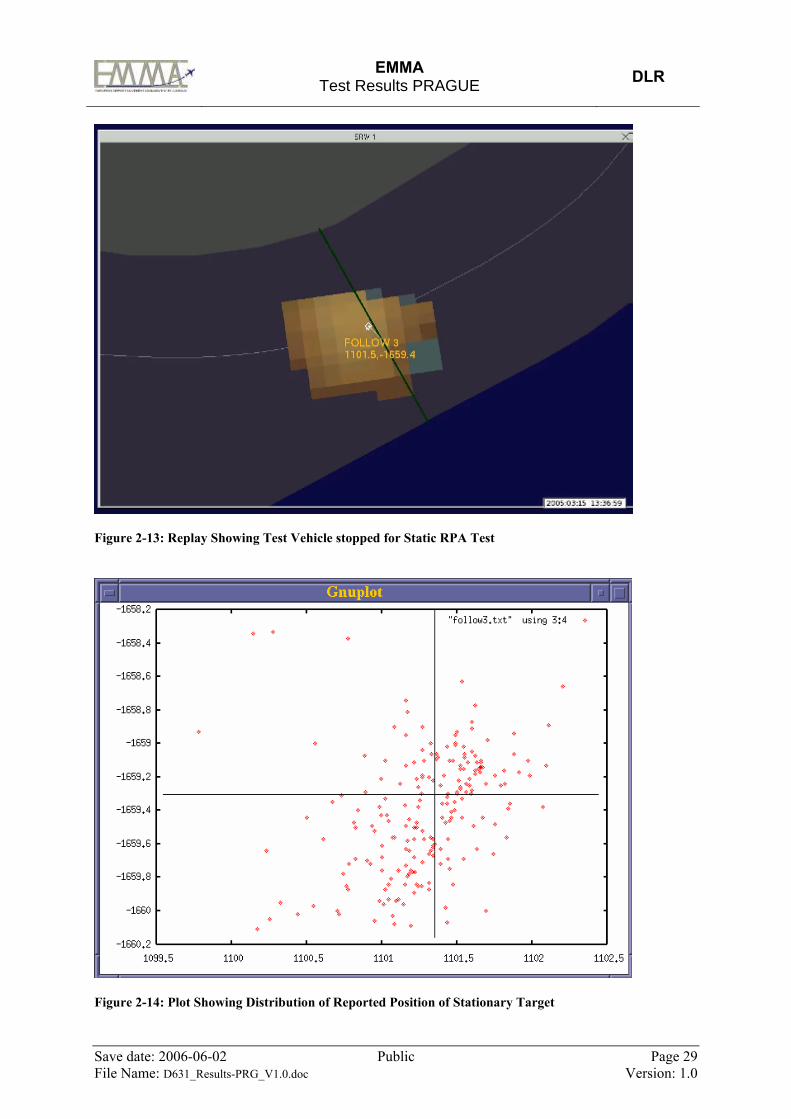
a) Static
Weather condition: Fine and clear, no precipitation.

EMMA
Test Results PRAGUE DLR
Save date: 2006-06-02 Public Page 28 File Name: D631_Results-PRG_V1.0.doc Version: 1.0
Location Coordinates n mx Rx my Ry RPA
Stopbar A 497.2, 865.4 83 -0.67 1.99 -1.43 1.12 2.29
Stopbar F -2823.2, -615.5 52 -2.77 -1.60 0.70 2.73 3.16
Stopbar L 1101.7, -1658.4 395 -0.42 0.35 -1.01 -0.30 0.46
Table 2-5: Static RPA Test Results
Worst-case static RPA: 3.16 m
Figure 2-12: Replay Showing part of Test Vehicle Trajectory during Test
The picture shows the trajectory of the test vehicle during part of the test.
The test vehicle started from Pier B, proceeded via TWY A to Hold at stop bar for RWY 24; Drove the whole length of RWY 24, exited on TWY F and proceeded along F to L crossing RWY 1331; Drove South on L, then via P to South Apron. After stop on apron, the vehicle proceeded via R and L to hold at stop bar for RWY 31. Drove RWY 31 as far as TWY F; proceeded along F to hold at stop bar for RWY 06. Returned via F to North Apron.
EMMA
Test Results PRAGUE DLR
Save date: 2006-06-02 Public Page 29 File Name: D631_Results-PRG_V1.0.doc Version: 1.0
Figure 2-13: Replay Showing Test Vehicle stopped for Static RPA Test
Figure 2-14: Plot Showing Distribution of Reported Position of Stationary Target

EMMA
Test Results PRAGUE DLR
Save date: 2006-06-02 Public Page 30 File Name: D631_Results-PRG_V1.0.doc Version: 1.0
b) Dynamic
It was not possible from the recorded data to obtain an objective measurement of the dynamic RPA. As can be seen from the figure below, the target tracks exhibit an overshoot when the target makes a rapid change of direction or speed. The degree of overshoot is proportional to the change of velocity. In order to make a meaningful objective measurement it is necessary to define a standard benchmark test and a desired result. This has not been done in EMMA.
Figure 2-15: Test Vehicle Track showing Overshoot when Cornering
2.3.6 Reported Position Resolution (VE-6)
Hypothesis VE-6
The resolution of the position data in a target report should be better than 1 m.
Test Procedure
The test scenario was the same as for the static RPA test (see VE-5 above).
Playback of the recorded data was used to verify that the smallest change in reported position was less than the specified value.
The target reports from the stationary test vehicle were observed with the CWP set to the lowest range scale, which is 50 m (corresponding to approximately 0.1 m per pixel on the screen). The smallest change in reported position was measured.
Result
The smallest observable change was 1 pixel, corresponding to 0.1m on the 50m-range scale.
EMMA
Test Results PRAGUE DLR
Save date: 2006-06-02 Public Page 31 File Name: D631_Results-PRG_V1.0.doc Version: 1.0
2.3.7 Reported Position Discrimination (VE-7)
Hypothesis VE-7
It should be possible to discriminate closely spaced targets, if they are separated by more than the specified performance value. NOTE: 1) Only relevant when one of the targets is non-cooperative. 2) The value has not been specified
Test Procedure
Position a non-cooperative vehicle or obstacle at a known position. Move another non-cooperative vehicle from a distance greater than 100m towards the stationary object. Record the distance at which the Surveillance provides only one Target Report. Move the vehicle away from stationary object and record the distance at which the Surveillance again provides two reports. Conduct the test at least five times. Repeat the test procedure with the following conditions: • Non-cooperative with cooperative mobile • Different areas of the aerodrome
The Reported Position Discrimination (RPD) is the worst-case result from all areas per mobile combination.
Result
This test was not carried out at Prague, since the indicator was defined after the SAT. There was not sufficient data recorded during the SAT test period to infer a result.
2.3.8 Reported Velocity Accuracy (VE-8)
Hypothesis VE-8
The accuracy of the target speed data transmitted from the SDS to clients should be better than 5m/s at a confidence level of 95%. The accuracy of the direction of movement data transmitted from the SDS to clients should be better than 10° at a confidence level of 95%.
Test Procedure
The test vehicle FOLLOW3 was driven at a constant speed along the runway and straight stretches of taxiway and the target reports were recorded for at least 50 updates. This test was done in three different areas of the airport and at three different speeds.
Weather conditions at the time of the test were noted.
During playback, the HMI was configured to show the velocity vector and a label with speed and heading for each update.
From the recorded data, the 95% Reported Velocity Accuracy (RVA) was calculated according to EUROCAE guidelines as follows:
For each target report the errors in the speed, ∆s, and in the heading, ∆φ, were calculated:
∆s = (Known speed - Reported speed) in m/s
∆φ = (Known heading - Reported heading) in degrees

EMMA
Test Results PRAGUE DLR
Save date: 2006-06-02 Public Page 32 File Name: D631_Results-PRG_V1.0.doc Version: 1.0
The resulting data was used to calculate the mean speed and heading errors according to the following formulae, where i = 1,2,3,…n and n is the number of reports:
Mean deviation in speed, ms = ∑ ∆si/n
Mean deviation in heading, mφ = ∑ ∆ φ i/n
Then, the RVA was calculated using the following formulae:
RVAs = C*√(∑ (∆si – ms)2/n) + ms
RVAφ = C*√(∑ (∆φI – mφ)2/n) + mφ
where the coefficient C is set to 1.960 for the required 95% confidence level.
Result
Weather condition: Fine and clear, no precipitation.
Known Speed
m/s n ms RVAs
m/s mφ RVAφ
degrees
4.2 40 -0.003 0.6 0.351 7.9
9.7 71 0.04 0.8 -1.18 4.9
25.8 240 -0.002 1.2 1.12 2.4
Table 2-6: RVA Test Result
2.3.9 Probability of Identification (VE-9)
Hypothesis VE-9
The probability that the correct identity of an aircraft, vehicle or object1 is reported at the output of the SDF should be 99.9% at minimum.
Test Procedure
a) Short-Term Test (performed at SAT)
The test scenario was the same as for the CV test (see VE-1 above).
More than six thousand target reports were analysed from the recorded data. The targets used for the analysis were the test vehicle and identifiable aircraft moving on the aerodrome Movement Area. The criterion for determining that an aircraft was an identifiable target was that target reports were received from the MLAT system. The criteria for correct identification were that:
• The target report for the test vehicle contained the identifier FOLLOW3; and
• The target report for an aircraft contained the ICAO Aircraft Identification (Callsign) as entered in the flight plan.
From the recorded data, the Probability of Identification (PID) was calculated according to EUROCAE guidelines as follows:
1 Assuming that the object is identifiable, i.e. suitably equipped and cooperating.

EMMA
Test Results PRAGUE DLR
Save date: 2006-06-02 Public Page 33 File Name: D631_Results-PRG_V1.0.doc Version: 1.0
%100⋅=getstarleidentifiabfromreportsofnumberTotal
tionidentificacorrectwithreportsgetartofNumberPID
b) Long-Term Test (MOGADOR)
First, the MOGADOR tool was used to calculate the PID for the same data as for the short-term tests. This MOGADOR result was compared with the calculated value to confirm that the MOGADOR was correctly calibrated.
MOGADOR was then used to assess the PID for the longer period (4 weeks).
Result
a) Short-Term Test
Weather condition: Fine and clear, no precipitation.
File: “Follow3.txt” recorded 15 March 2005, starting at 13:30 UTC.
File: “alltracks.txt” recorded 16 March 2005, 10:40 to 11:40 UTC.
Area Mobile Type Total No. of
Reports No. of Correctly
Identified Reports PID
Aircraft 1472 1472 100% RWY
Test vehicle 251 251 100%
Aircraft 2830 2822 99.72% TWY
Test vehicle 1730 1730 100%
Table 2-7: Results of Probability of Identification Test
b) Long-Term Test (MOGADOR)
For the evaluation, three days with good weather-conditions (no snow, no precipitation) and seven days with non-optimal conditions (snow and precipitation) are taken into consideration. The following figures show the results for the PID for the different types of mobiles (All, Aircraft, Vehicle and Unknown) and the three locations Runways, Obstacle Free Zone (OFZ) and Taxiways. The results are grouped by the named weather conditions.
NOTE: There is no identification for Unknown targets, because if a target is identified it is either the identification of an Aircraft or a Vehicle.
EMMA
Test Results PRAGUE DLR
Save date: 2006-06-02 Public Page 34 File Name: D631_Results-PRG_V1.0.doc Version: 1.0
A ll
70
75
80
85
90
95
100
18.2.2006 19.2.2006 20.2.2006 21.2.2006 22.2.2006Date
A irc ra f t
0
10
20
30
40
50
60
70
80
90
100
18.2.2006 19.2.2006 20.2.2006 21.2.2006 22.2.2006
Date
V e hic le
70
75
80
85
90
95
100
18.2.2006 19.2.2006 20.2.2006 21.2.2006 22.2.2006Date
Runways OFZ Taxiways
Figure 2-16: PID Long Term Observation (excellent weather conditions (no snow, no precipitation))
EMMA
Test Results PRAGUE DLR
Save date: 2006-06-02 Public Page 35 File Name: D631_Results-PRG_V1.0.doc Version: 1.0
A ll
70
75
80
85
90
95
100
29.1.2006 30.1.2006 31.1.2006 1.2.2006 2.2.2006 3.2.2006 4.2.2006Date
A irc ra f t
70
75
80
85
90
95
100
29.1.2006 30.1.2006 31.1.2006 1.2.2006 2.2.2006 3.2.2006 4.2.2006Date
V e hic le
70
75
80
85
90
95
100
29.1.2006 30.1.2006 31.1.2006 1.2.2006 2.2.2006 3.2.2006 4.2.2006
Date
Runways OFZ Taxiways
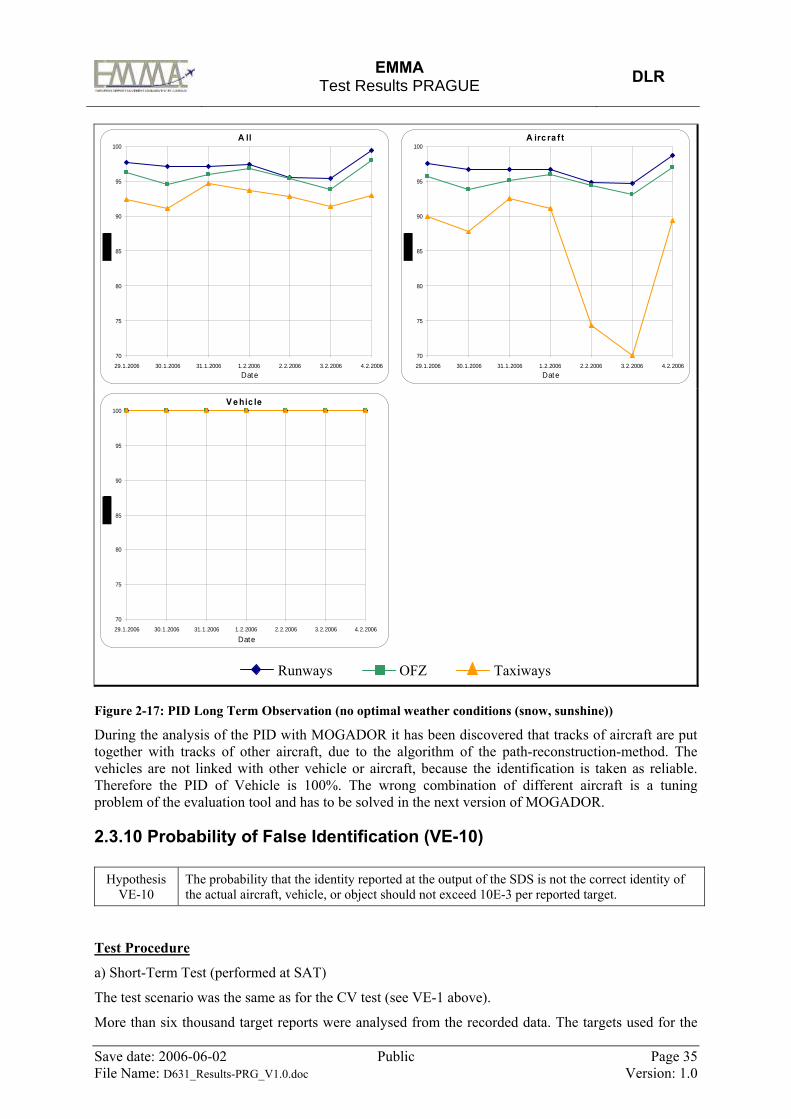
Figure 2-17: PID Long Term Observation (no optimal weather conditions (snow, sunshine))
During the analysis of the PID with MOGADOR it has been discovered that tracks of aircraft are put together with tracks of other aircraft, due to the algorithm of the path-reconstruction-method. The vehicles are not linked with other vehicle or aircraft, because the identification is taken as reliable. Therefore the PID of Vehicle is 100%. The wrong combination of different aircraft is a tuning problem of the evaluation tool and has to be solved in the next version of MOGADOR.
2.3.10 Probability of False Identification (VE-10)
Hypothesis VE-10
The probability that the identity reported at the output of the SDS is not the correct identity of the actual aircraft, vehicle, or object should not exceed 10E-3 per reported target.
Test Procedure
a) Short-Term Test (performed at SAT)
The test scenario was the same as for the CV test (see VE-1 above).
More than six thousand target reports were analysed from the recorded data. The targets used for the

EMMA
Test Results PRAGUE DLR
Save date: 2006-06-02 Public Page 36 File Name: D631_Results-PRG_V1.0.doc Version: 1.0
analysis were the test vehicle and identifiable aircraft moving on the aerodrome Movement Area. The criteria for correct identification were that:
• The target report for the test vehicle contained an identifier other than the correct identifier FOLLOW3; and
• The target report for an aircraft contained an identifier other than the ICAO Aircraft Identification (Callsign) as entered in the flight plan.
From the recorded data, the Probability of False Identification (PFID) was calculated according to EUROCAE guidelines as follows:
%100⋅=reportsgettarofnumberTotal
tionidentificaerroneouswithreportsgettarofNumberPFID
b) Long-Term Test (MOGADOR)
The test scenario was the same as for the CV test (see VE-1 above).
First, the MOGADOR tool was used to calculate the PFID for the same data as for the short-term tests. This MOGADOR result was compared with the calculated value to confirm that the MOGADOR was correctly calibrated.
MOGADOR was then used to assess the PFID for the longer period (4 weeks).
Result
a) Short-Term Test
Weather condition: Fine and clear, no precipitation.
File: “Follow3.txt” recorded 15 March 2005, starting at 13:30 UTC.
File: “alltracks.txt” recorded 16 March 2005, 10:40 to 11:40 UTC.
Area Mobile Type Total No. of
Reports No. of Wrongly
Identified Reports PFID
Aircraft 1472 0 0.00% RWY
Test vehicle 251 0 0.00%
Aircraft 2830 0 0.00% TWY
Test vehicle 1730 0 0.00%
Table 2-8: Results of Probability of False Identification Test
b) Long-Term Test (MOGADOR)
For the evaluation, three days with good weather-conditions (no snow, no precipitation) and seven days with non-optimal conditions (snow and precipitation) are taken into consideration. The following figures show the results for the PFD for the different types of mobiles (All, Aircraft, Vehicle and Unknown) and the three locations Runways, Obstacle Free Zone (OFZ) and Taxiways. The results are

EMMA
Test Results PRAGUE DLR
Save date: 2006-06-02 Public Page 37 File Name: D631_Results-PRG_V1.0.doc Version: 1.0
grouped by the named weather conditions.
NOTE: There is no false identification for Unknown targets, because if a target is identified, it is either the identification of an Aircraft or a Vehicle.
A ll
0
5
10
15
20
25
18.2.2006 19.2.2006 20.2.2006 21.2.2006 22.2.2006
Date
A irc ra f t
0
5
10
15
20
25
30
18.2.2006 19.2.2006 20.2.2006 21.2.2006 22.2.2006
Date
V e hic le
0
0,1
0,2
0,3
0,4
0,5
0,6
0,7
0,8
0,9
1
18.2.2006 19.2.2006 20.2.2006 21.2.2006 22.2.2006Date
Runways OFZ Taxiways
Figure 2-18: PFID Long Term Observation (excellent weather conditions (no snow, no precipitation))

EMMA
Test Results PRAGUE DLR
Save date: 2006-06-02 Public Page 38 File Name: D631_Results-PRG_V1.0.doc Version: 1.0
A ll
0
1
2
3
4
5
29.1.2006 30.1.2006 31.1.2006 1.2.2006 2.2.2006 3.2.2006 4.2.2006
Date
A irc ra f t
0
1
2
3
4
5
6
7
29.1.2006 30.1.2006 31.1.2006 1.2.2006 2.2.2006 3.2.2006 4.2.2006
Date
V e hic le
0
0,1
0,2
0,3
0,4
0,5
0,6
0,7
0,8
0,9
1
29.1.2006 30.1.2006 31.1.2006 1.2.2006 2.2.2006 3.2.2006 4.2.2006Date
Runways OFZ Taxiways
Figure 2-19: PFID Long Term Observation (no optimal weather conditions (snow, sunshine))
During the analysis of PFID with MOGADOR it has been discovered that tracks of aircraft are put together with tracks of other aircraft, due to the algorithm of the path-reconstruction-method. The vehicles are not linked with other vehicle or aircraft, because the identification is taken as reliable. Therefore the PFID of Vehicles is 0%.
The wrong combination of different aircraft is a tuning problem of the evaluation tool and has to be solved in the next version of MOGADOR.
2.3.11 Target Report Update Rate (VE-11)
Hypothesis VE-11
An updated target report should be transmitted from the SDS to the clients at least once per second for each target.
Test Procedure
The test scenario was the same as for the CV test (see VE-1 above).

EMMA
Test Results PRAGUE DLR
Save date: 2006-06-02 Public Page 39 File Name: D631_Results-PRG_V1.0.doc Version: 1.0
The traffic situation display on the CWP was observed during a period of heavy traffic to confirm that each target is updated at least once per second.
More than six thousand target reports from the test vehicle and identified aircraft were analysed from the recorded data. These data were used to calculate the average Target Report Update Rate (TRUR) and the distribution.
Result
File: “Follow3.txt” recorded 15 March 2005, starting at 13:30 UTC.
File: “alltracks.txt” recorded 16 March 2005, 10:40 to 11:40 UTC.
No. of Reports Average
TRUR Variance
6283 0.47 s 0.22 s
Table 2-9: TRUR Test Result
2.3.12 Probability of Detection of an Alert Situation (VE-12)
Hypothesis VE-12
The probability of detection of an alert situation should be greater than 99.9%
Test Procedure
The RIMCAS tool at the CWP-3 (Tower Executive Controller) position was set manually for low visibility conditions. This means that the tool shall generate an alert for the following scenarios:
• An aircraft approaching a runway to land shall generate an alert if another target is detected within the Runway Protected Area and the time to threshold (TTT) is calculated to be less than a pre-defined parameter value. For the Prague tests, this value was set to 45s for Stage 1 (Prediction) and 30s for Stage 2 (Alert) in LVC.
• A landing aircraft shall generate a Stage 2 alert if there is another target detected ahead of it within the Runway Protected Area.
• A departing aircraft that has entered a runway shall generate a Stage 1 alert if there is another target detected within the ground boundary defined by the Runway Protected Area.
• A departing aircraft on a runway shall generate a Stage 2 alert if its speed exceeds a pre-defined parameter value and there is another target detected ahead of it within the Runway Protected Area. For Prague in LVC, the parameter value is set to 20m/s.
The Runway Protected Area was configured as the ground boundary defined by the Cat II / III holding positions for the runway.
This test was conducted during good visibility conditions and during a period of the day with medium to heavy traffic. Two hours of visual observation were used to confirm that the correct alerts were given at the CWP-3 Controller HMI.
For each scenario, it was noted whether the RIMCAS tool gave the correct alert according to the configured rules.
EMMA
Test Results PRAGUE DLR
Save date: 2006-06-02 Public Page 40 File Name: D631_Results-PRG_V1.0.doc Version: 1.0
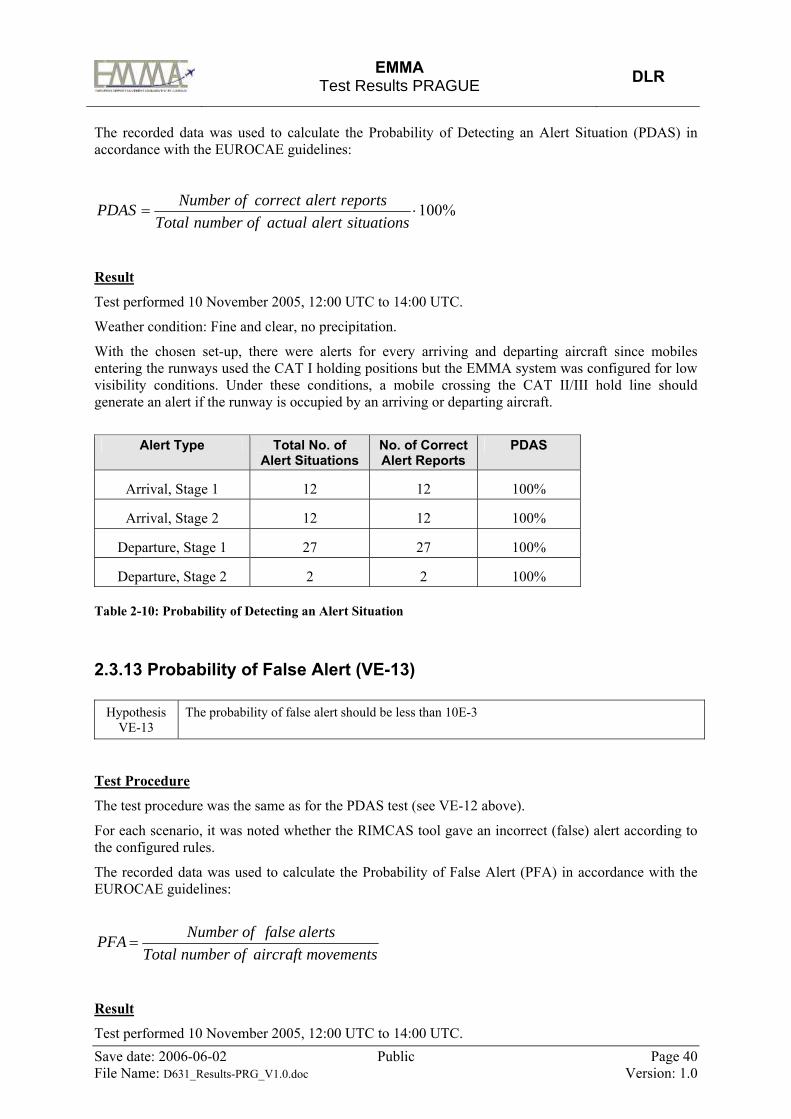
The recorded data was used to calculate the Probability of Detecting an Alert Situation (PDAS) in accordance with the EUROCAE guidelines:
%100⋅=situationsalertactualofnumberTotal
reportsalertcorrectofNumberPDAS
Result
Test performed 10 November 2005, 12:00 UTC to 14:00 UTC.
Weather condition: Fine and clear, no precipitation.
With the chosen set-up, there were alerts for every arriving and departing aircraft since mobiles entering the runways used the CAT I holding positions but the EMMA system was configured for low visibility conditions. Under these conditions, a mobile crossing the CAT II/III hold line should generate an alert if the runway is occupied by an arriving or departing aircraft.
Alert Type Total No. of
Alert Situations No. of Correct Alert Reports
PDAS
Arrival, Stage 1 12 12 100%
Arrival, Stage 2 12 12 100%
Departure, Stage 1 27 27 100%
Departure, Stage 2 2 2 100%
Table 2-10: Probability of Detecting an Alert Situation
2.3.13 Probability of False Alert (VE-13)
Hypothesis VE-13
The probability of false alert should be less than 10E-3
Test Procedure
The test procedure was the same as for the PDAS test (see VE-12 above).
For each scenario, it was noted whether the RIMCAS tool gave an incorrect (false) alert according to the configured rules.
The recorded data was used to calculate the Probability of False Alert (PFA) in accordance with the EUROCAE guidelines:
movementsaircraftofnumberTotalalertsfalseofNumberPFA =
Result
Test performed 10 November 2005, 12:00 UTC to 14:00 UTC.

EMMA
Test Results PRAGUE DLR
Save date: 2006-06-02 Public Page 41 File Name: D631_Results-PRG_V1.0.doc Version: 1.0
Weather condition: Fine and clear, no precipitation.
There were no false alerts during the period of the test. However, the test period was not sufficiently long for this to be meaningful result for the value of the PFA indicator. Therefore, this indicator was evaluated during the operational on-site trials. Refer to Chapter 6 for the results of the operational tests.
2.3.14 Alert Response Time (VE-14)
Hypothesis VE-14
Having received the target report from the surveillance element, the time taken for the Control function to detect and report any alert situation should be not more than 0.5 s.
Test Procedure
The test procedure was the same as for the PDAS test (see VE-12 above).
Whenever an alert situation occurred, the time (t1) at which the conflict situation was created by a mobile crossing the ground boundary and the time (t2) at which the alert report was given at the CWP was estimated and noted. Since no special tools were available, only a rough estimation was possible.
The Alert Response Time (ART) was calculated in accordance with the EUROCAE guidelines:
∑−
−=
n
ii
nttART
1
)12(
Result
Test performed 10 November 2005, 12:00 UTC to 14:00 UTC.
Weather condition: Fine and clear, no precipitation. Twelve alert situations were used for the analysis.
No. of Alert Situations
ART
12 < 0,5 s
Table 2-11: Result of ART Test
2.3.15 Routing Process Time (VE-15) Not applicable for Prague.
2.3.16 Probability of Continuous Track (VE-16) VE-16 Each target track should be continuously updated with a new position report at the nominal
update rate of the system throughout the Movement.
EMMA
Test Results PRAGUE DLR
Save date: 2006-06-02 Public Page 42 File Name: D631_Results-PRG_V1.0.doc Version: 1.0
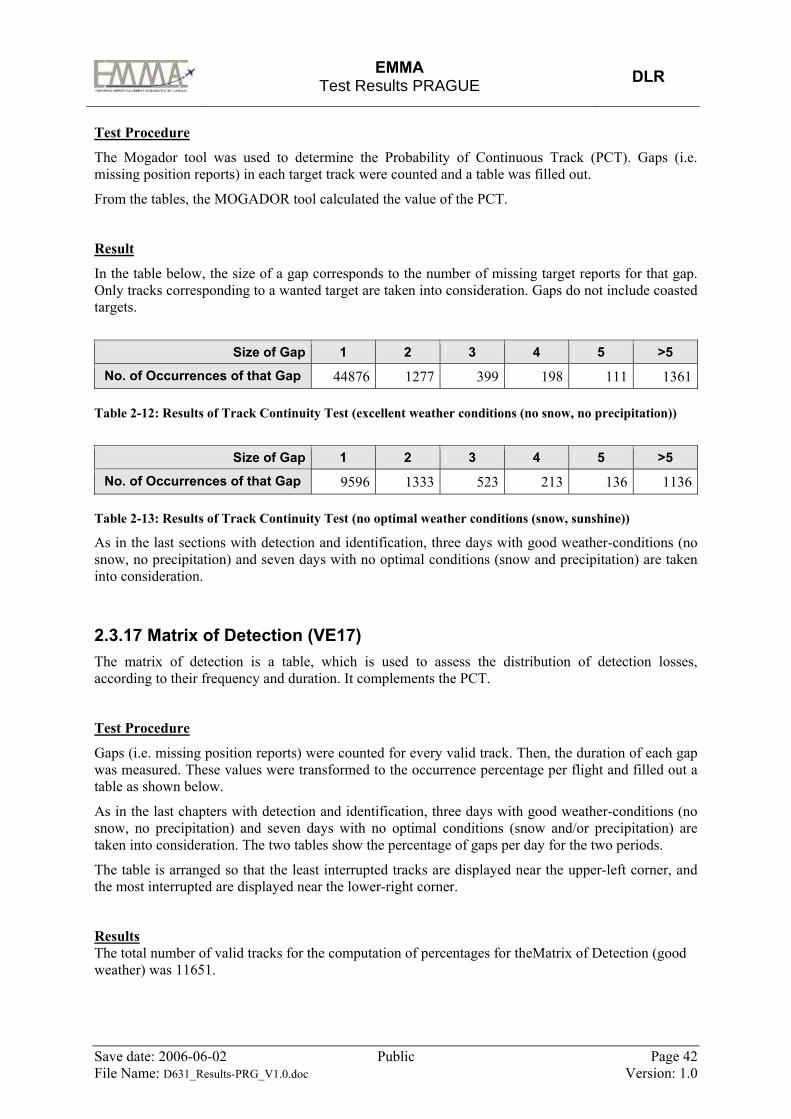
Test Procedure
The Mogador tool was used to determine the Probability of Continuous Track (PCT). Gaps (i.e. missing position reports) in each target track were counted and a table was filled out.
From the tables, the MOGADOR tool calculated the value of the PCT.
Result
In the table below, the size of a gap corresponds to the number of missing target reports for that gap. Only tracks corresponding to a wanted target are taken into consideration. Gaps do not include coasted targets.
Size of Gap 1 2 3 4 5 >5
No. of Occurrences of that Gap 44876 1277 399 198 111 1361
Table 2-12: Results of Track Continuity Test (excellent weather conditions (no snow, no precipitation))
Size of Gap 1 2 3 4 5 >5
No. of Occurrences of that Gap 9596 1333 523 213 136 1136
Table 2-13: Results of Track Continuity Test (no optimal weather conditions (snow, sunshine))
As in the last sections with detection and identification, three days with good weather-conditions (no snow, no precipitation) and seven days with no optimal conditions (snow and precipitation) are taken into consideration.
2.3.17 Matrix of Detection (VE17) The matrix of detection is a table, which is used to assess the distribution of detection losses, according to their frequency and duration. It complements the PCT.
Test Procedure
Gaps (i.e. missing position reports) were counted for every valid track. Then, the duration of each gap was measured. These values were transformed to the occurrence percentage per flight and filled out a table as shown below.
As in the last chapters with detection and identification, three days with good weather-conditions (no snow, no precipitation) and seven days with no optimal conditions (snow and/or precipitation) are taken into consideration. The two tables show the percentage of gaps per day for the two periods.
The table is arranged so that the least interrupted tracks are displayed near the upper-left corner, and the most interrupted are displayed near the lower-right corner.
Results The total number of valid tracks for the computation of percentages for theMatrix of Detection (good weather) was 11651.

EMMA
Test Results PRAGUE DLR
Save date: 2006-06-02 Public Page 43 File Name: D631_Results-PRG_V1.0.doc Version: 1.0
Duration of Gaps (number of missing reports) All movements (%) 1s 2s 3s 4s 5s >5s Total
0 47,06 47,06 1 5,57 1,27 0,51 0,54 0,27 8,18 16,34 2 1,87 0,50 0,25 0,32 0,18 4,21 7,32 3 1,14 0,30 0,17 0,17 0,11 2,94 4,84 4 0,80 0,22 0,09 0,07 0,04 2,02 3,24 5 0,51 0,17 0,07 0,04 0,04 1,15 1,99
>5 7,75 3,31 1,58 0,53 0,26 5,78 19,21
Number of gaps
of a valid track
Total 17,65 5,78 2,67 1,67 0,90 24,27 100,00
Table 2-14: Matrix of Detection for all Movements with Good Weather Conditions (no snow, no precipitation) [%]
The total number of valid tracks for the computation of percentages for theMatrix of Detection (adverse weather) was 21263.
Duration of Gaps (number of missing reports)
All movements (%) 1s 2s 3s 4s 5s >5s Total 0 40,73 40,73 1 8,18 2,69 1,08 0,43 0,14 4,65 17,18 2 3,55 1,71 0,91 0,40 0,16 3,11 9,83 3 2,02 1,36 0,60 0,33 0,10 2,45 6,87 4 1,02 0,94 0,53 0,27 0,09 2,02 4,87 5 0,73 0,69 0,37 0,26 0,06 1,69 3,80
>5 1,97 2,59 2,22 1,30 0,37 8,28 16,72
Number of gaps
of a valid track
Total 17,48 9,99 5,70 2,99 0,91 22,21 100,00
Table 2-15: Matrix of Detection for all Movements with Adverse Weather Conditions (snow or/and precipitation) [%]
2.3.18 Matrix of Identification (VE-18) The matrix of identification is a table, which is used to assess the distribution of identification losses and erroneous identifications, according to their frequency and duration. This metric is not related to a performance requirement but has a describing character.
Test Procedure
Gaps in correct identification were counted for every valid track. Then, the duration of each gap was measured. These values were transformed to the occurrence percentage per flight and used to fill out a table as shown below.
Two types of matrix were created, in order to assess the probability of the occurrence of: • Missing identification • Wrong identification
In addition to that, it can also be distinguished between the following:

EMMA
Test Results PRAGUE DLR
Save date: 2006-06-02 Public Page 44 File Name: D631_Results-PRG_V1.0.doc Version: 1.0
• Missing identification with valid mode A codes • Missing identification with erroneous mode A codes • Missing identification with missing mode A codes
However, these data are not reported here because they are mainly used to investigate the reasons for missing or wrong identification and are of less operational significance.
Result
The complete number of valid tracks for the computation of the Matrices of Identification was 11651.
There are only three days with good weather-conditions (no snow, no precipitation) taken into consideration. The reason for that was that the Identification is only depending on the MLAT and the Flight –Plan Data, which are independent from the weather. The two tables show the occurrence of gaps for Missing identification and False identification.
Long-Term Test (MOGADOR):
Duration of Gaps (number of missing identifiers) All (%) 1s 2s 3s 4s 5s >5s Total
0 72,90 72,90 1 1,24 0,50 1,44 1,42 1,18 8,70 14,47 2 0,15 0,29 0,58 0,48 0,29 4,22 6,01 3 0,03 0,07 0,08 0,18 0,14 1,90 2,39 4 0,02 0,01 0,03 0,05 0,10 0,88 1,10 5 0,01 0,01 0,02 0,02 0,03 0,67 0,75
>5 0,00 0,01 0,03 0,05 0,05 2,24 2,38
Number of gaps
of a valid track
Total 1,44 0,88 2,17 2,20 1,79 18,62 100,00
Table 2-16: Missing Identification Gap Distribution (Missing label)
Duration of Gaps (number of false identifiers) All (%) 1s 2s 3s 4s 5s >5s Total
0 97,45 97,45 1 0,15 0,01 0,01 0,02 0,02 0,62 0,82 2 0,03 0,01 0,04 0,03 0,01 0,41 0,52 3 0,00 0,00 0,00 0,00 0,01 0,21 0,21 4 0,00 0,00 0,00 0,01 0,00 0,22 0,23 5 0,00 0,00 0,00 0,00 0,00 0,09 0,09
>5 0,00 0,01 0,03 0,00 0,02 0,62 0,68
Number of gaps
of a valid track
Total 0,17 0,03 0,09 0,05 0,05 2,16 100,00
Table 2-17: Wrong Identification Gap Distribution (Wrong label)
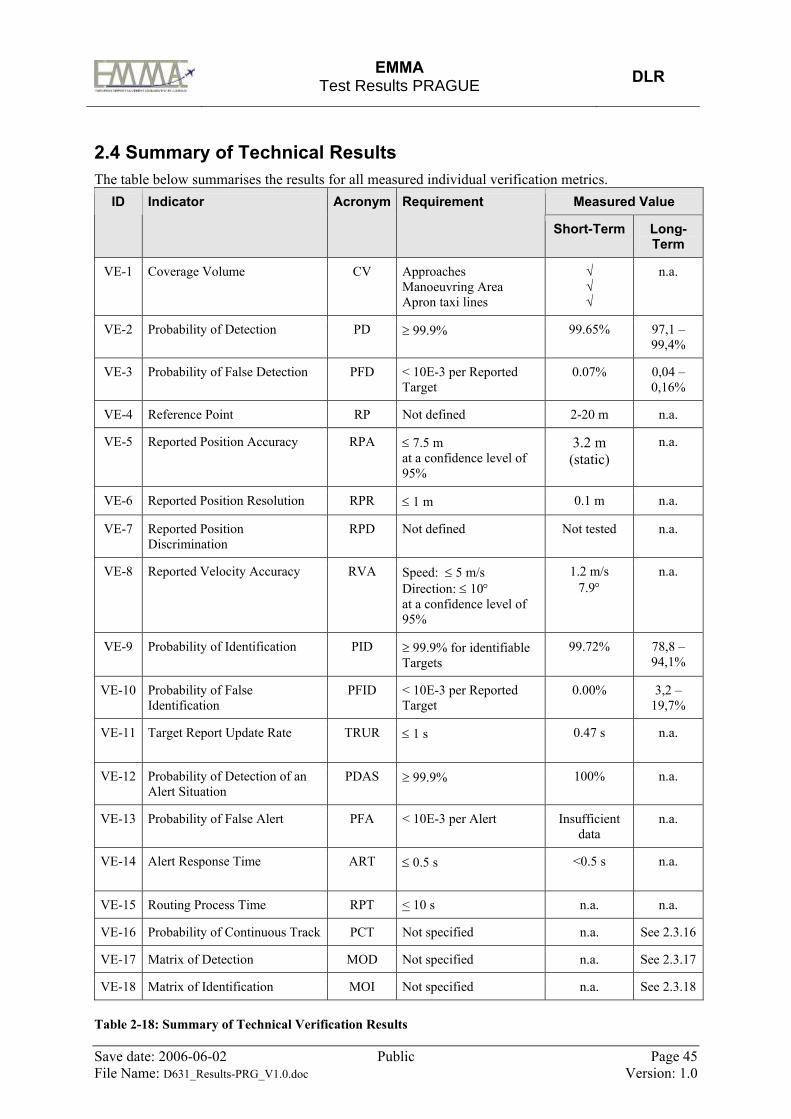
EMMA
Test Results PRAGUE DLR
Save date: 2006-06-02 Public Page 45 File Name: D631_Results-PRG_V1.0.doc Version: 1.0
2.4 Summary of Technical Results The table below summarises the results for all measured individual verification metrics.
Measured Value ID Indicator Acronym Requirement
Short-Term Long-Term
VE-1 Coverage Volume CV Approaches Manoeuvring Area Apron taxi lines
√ √ √
n.a.
VE-2 Probability of Detection PD ≥ 99.9% 99.65% 97,1 – 99,4%
VE-3 Probability of False Detection PFD < 10E-3 per Reported Target
0.07% 0,04 – 0,16%
VE-4 Reference Point RP Not defined 2-20 m n.a.
VE-5 Reported Position Accuracy RPA ≤ 7.5 m at a confidence level of 95%
3.2 m (static)
n.a.
VE-6 Reported Position Resolution RPR ≤ 1 m 0.1 m n.a.
VE-7 Reported Position Discrimination
RPD Not defined Not tested n.a.
VE-8 Reported Velocity Accuracy RVA Speed: ≤ 5 m/s Direction: ≤ 10° at a confidence level of 95%
1.2 m/s 7.9°
n.a.
VE-9 Probability of Identification PID ≥ 99.9% for identifiable Targets
99.72% 78,8 – 94,1%
VE-10 Probability of False Identification
PFID < 10E-3 per Reported Target
0.00% 3,2 – 19,7%
VE-11 Target Report Update Rate TRUR ≤ 1 s
0.47 s n.a.
VE-12 Probability of Detection of an Alert Situation
PDAS ≥ 99.9% 100% n.a.
VE-13 Probability of False Alert PFA < 10E-3 per Alert Insufficient data
n.a.
VE-14 Alert Response Time ART ≤ 0.5 s
<0.5 s n.a.
VE-15 Routing Process Time RPT < 10 s n.a. n.a.
VE-16 Probability of Continuous Track PCT Not specified n.a. See 2.3.16
VE-17 Matrix of Detection MOD Not specified n.a. See 2.3.17
VE-18 Matrix of Identification MOI Not specified n.a. See 2.3.18
Table 2-18: Summary of Technical Verification Results

EMMA
Test Results PRAGUE DLR
Save date: 2006-06-02 Public Page 46 File Name: D631_Results-PRG_V1.0.doc Version: 1.0
3 Real Time Simulation Results
3.1 Introduction 3.1.1 Participants A total of 11 ANS-CR controllers in four groups participated in the two phases of the EMMA real time simulations. There were five controllers with the 1st phase and six with the 2nd RTS phase. Controllers of the first phase were confronted with conflict scenarios to test operational feasibility and operational improvements of the A-SMGCS conflict alert service. Controllers of the second RTS phase did also use the conflict alert service but the traffic scenarios went without evoked conflicts. Separated from the experimental RTS 2 exercises controllers of the 3rd and 4th group (RTS2) were requested to perform a test run using electronic flight stripes and a departure manager and to give their comments to this new A-SMGCS service (cf. 3.4). All participants were male. The table below outlines the distribution of the controllers to the RTS phases. Subject Sex RTS phase Conflict scenarios Groups
C1 M 1 X C2 M 1 X C3 M 1 X
1st group
C4 M 1 X C5 M 1 X
2nd group
C6 M 2 C7 M 2 C8 M 2
3rd group
C9 M 2 C10 M 2 C11 M 2
4th group
Table 3-1: Allocation of Controllers to the Groups and RTS Phases
3.1.2 Experimental Design The experimental design is based on the use of real experiments. In real experiments, the same scenarios are used for the Baseline System and the A-SMGCS set-up in order to achieve ceteris paribus conditions. In this way, results from the Baseline system can be directly compared with the A-SMGCS within a traffic scenario. However, a comparison of traffic characteristics between the traffic scenarios is lacking the different amount of traffic and runway configurations because Prague regulations do allow only low or medium traffic and runway 24 operations with CATII/III conditions in low visibility. Scenario A and B uses other runway configurations and more traffic volume because the operate with VIS2 and VIS1 conditions respectively. In conclusion, the following matrix shows the experiment set-up in terms of experimental factors:

EMMA
Test Results PRAGUE DLR
Save date: 2006-06-02 Public Page 47 File Name: D631_Results-PRG_V1.0.doc Version: 1.0
SYS 1 SMGCS (Baseline)
SYS 2 A-SMGCS Level II
VIS 1 (scenario B) X X
VIS 2 (scenario A) X X
VIS 3 (scenario C) X X
Table 3-2: Combination of Experimental Factors
As already mentioned above, emphasis has been put on realistic traffic scenarios to measure the potential influence of using an A-SMGCS at Prague Airport. Realistic scenarios go with realistic traffic amounts in accordance to the visibility conditions, which comply with the local CAT II/III regulation. This mixture of traffic amount and visibility prevents an objective comparison of operational improvements between visibility conditions. However, comparison between A-SMGCS and Baseline are the most wanted and reveal significant operational improvements. The following table shows the details of the traffic used scenarios.

EMMA
Test Results PRAGUE DLR
Save date: 2006-06-02 Public Page 48 File Name: D631_Results-PRG_V1.0.doc Version: 1.0
Scenario A Scenario B Scenario C QFU ↑24 ↓31 ↑06 ↓13 ↑24 ↓24 APP ILS CAT I VOR/DME ILS CAT II/III
Weather conditions Day (night?) 350/10 2km visibility (VIS2)
Day 130/15 5km visibility (VIS1)
Day VRB/2 RVR 400m visibility (VIS3)
Timing ~ 60’ ~ 60’ ~ 60’ Movements ~ 35 ~ 41 ~ 25 Constraints TWY RR U/S RWY 04/22 U/S
TWY A, B U/S ILS 06 U/S ALS 06 U/S
NIL
Allowed TFC ↑24 ↓31 (↓24 + ↑31 on request)
↑06 ↓13 (↑13 on request) ↑24 ↓24
Possible conflicts or malfunctions2
↓31 x ↑24 ↓31 x ↓24 ↑31 x ↓24 ↓24 x ↑31 ↑31 x ↑24 ↑31 x ↓31 ↑24 x ↓24 ↑31 x ↑31 ↑24 x ↑24 Wrong label Label lost Wrong direction
↑06 x ↑06 ↓13 x ↓13 ↓13 x ↑06 ↓13 x ↑06 ↓13 x ↑13 ↓13 x ↑13 ↑06 x ↑06 ↑13 x ↑13 Wrong label Label lost Wrong direction
↓24 x ↓24 ↓24 x ↑24 ↑24 x ↑24 Wrong label Label lost Wrong direction
Conflicts or malfunctions of
interest3
↓31 x ↑24 ↓31 x ↓24 ↓24 x ↑31 ↑31 x ↑24 Wrong direction
↑06 x ↑06 ↓13 x ↓13 ↓13 x ↑06 ↓13 x ↑06 ↓13 x ↑13
↓24 x ↓24 ↓24 x ↑24 ↑24 x ↑24 Wrong label Label lost
Symbol convention: ↓ Conflicting aircraft during approach, landing or landing roll ↓ Conflicting aircraft after landing during taxiing (e.g. RWY crossing) ↑ Conflicting aircraft during take-off run, take-off or initial climb out ↑ Conflicting aircraft before take-off during taxiing (e.g. holding point for same or crossing
RWY crossed etc.) ↓24 Conflicting aircraft for RWY 24 x Versus (e.g. ↓24 x ↑24)
Table 3-3: RTS Traffic Scenario Description
2 only with RTS 1 3 only with RTS 1
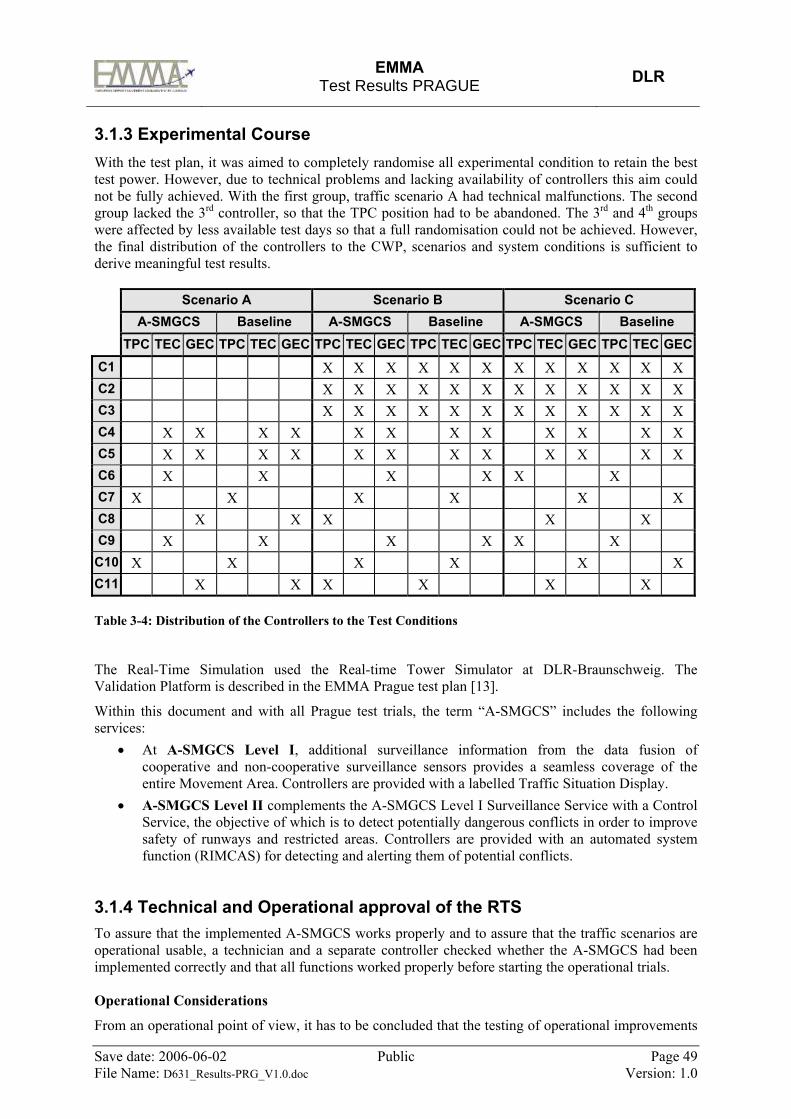
EMMA
Test Results PRAGUE DLR
Save date: 2006-06-02 Public Page 49 File Name: D631_Results-PRG_V1.0.doc Version: 1.0
3.1.3 Experimental Course With the test plan, it was aimed to completely randomise all experimental condition to retain the best test power. However, due to technical problems and lacking availability of controllers this aim could not be fully achieved. With the first group, traffic scenario A had technical malfunctions. The second group lacked the 3rd controller, so that the TPC position had to be abandoned. The 3rd and 4th groups were affected by less available test days so that a full randomisation could not be achieved. However, the final distribution of the controllers to the CWP, scenarios and system conditions is sufficient to derive meaningful test results.
Scenario A Scenario B Scenario C A-SMGCS Baseline A-SMGCS Baseline A-SMGCS Baseline
TPC TEC GEC TPC TEC GEC TPC TEC GEC TPC TEC GEC TPC TEC GEC TPC TEC GECC1 X X X X X X X X X X X X C2 X X X X X X X X X X X X C3 X X X X X X X X X X X X C4 X X X X X X X X X X X X C5 X X X X X X X X X X X X C6 X X X X X X C7 X X X X X X C8 X X X X X C9 X X X X X X C10 X X X X X X C11 X X X X X X
Table 3-4: Distribution of the Controllers to the Test Conditions
The Real-Time Simulation used the Real-time Tower Simulator at DLR-Braunschweig. The Validation Platform is described in the EMMA Prague test plan [13].
Within this document and with all Prague test trials, the term “A-SMGCS” includes the following services:
• At A-SMGCS Level I, additional surveillance information from the data fusion of cooperative and non-cooperative surveillance sensors provides a seamless coverage of the entire Movement Area. Controllers are provided with a labelled Traffic Situation Display.
• A-SMGCS Level II complements the A-SMGCS Level I Surveillance Service with a Control Service, the objective of which is to detect potentially dangerous conflicts in order to improve safety of runways and restricted areas. Controllers are provided with an automated system function (RIMCAS) for detecting and alerting them of potential conflicts.
3.1.4 Technical and Operational approval of the RTS To assure that the implemented A-SMGCS works properly and to assure that the traffic scenarios are operational usable, a technician and a separate controller checked whether the A-SMGCS had been implemented correctly and that all functions worked properly before starting the operational trials. Operational Considerations
From an operational point of view, it has to be concluded that the testing of operational improvements

EMMA
Test Results PRAGUE DLR
Save date: 2006-06-02 Public Page 50 File Name: D631_Results-PRG_V1.0.doc Version: 1.0
(safety, efficiency, etc.) was influenced by testing of the operational feasibility of the monitoring and alerting service with the 1st phase of RTS trials. Several conflict situations had been revealed by the pseudo-pilot that were needed to test the controllers’ reaction time and their acceptance, but also influenced the normal controllers’ behaviour. With the 2nd RTS, conflict situations were not further induced in order to measure operational improvements without impact of non-nominal events. Technical Drawbacks that could not be solved for RTS I:
• RWY Stop bar alert in CATII/III did not work • Restricted area alert did not work • “Wrong direction take off” was not established • No extended label – only call-sign in it • Vis2 and Vis3 outside view could be lower • No manual labelling possible • Label colour of cars was not brown (as desired) but white (same as departure, as cars had to be
defined as aircraft in the simulation scenario) • Pseudo-pilots could not stop the aircraft in time when needed • T2 alerts with RWY13 arrivals and stopped traffic on TWY F • Permanent T1 (amber) alert on TWY F between TWY D and RWY31/13 • Sensitive area is too long on TWY F between TWY D and RWY31/13 with Crossing traffic
on RWY31/13 • No text in label – several times • Missing label with arrivals on RWY13 between threshold and intersection to TWY F • With setting the “Suppression” Area 2, labels on Apron North disappear (as wanted) but also
with vacating traffic from RWY13 • No editing possible • Sometimes orange T1 alert with acoustic warnings, which is wrong • Car alone on TWY F and orange T1 alert, which is wrong.
3.2 Operational Feasibility (RTS)
3.2.1 Acceptance questionnaire results Each of the 11 ANS_CR Controllers was given a 30 items acceptance questionnaire after finishing all test runs. They were asked to give their opinion to the use of A-SMGCS. The answering scale reached from 1 “Strongly disagree” to 10 “Strongly agree”. The following general hypothesis was set up to describe the expectation with the controllers’ answers: Identifier Hypothesis
OF-H0 The controllers’ opinion does not agree to the “operational feasibility” aspects of a specific item.
OF-H1 The controllers’ opinion agrees to the “operational feasibility” aspects of a specific item.
11 x 30 answers were achieved that are summed up with the following table:

EMMA
Test Results PRAGUE DLR
Save date: 2006-06-02 Public Page 51 File Name: D631_Results-PRG_V1.0.doc Version: 1.0
Item No. 1 2 3 4 5 6 7 8 9 10 11 12 13 14 15 16 17 18 19 20 21 22 23 24 25 26 27 28 29 30
C1 8 4 10 8 1 1 8 3 9 10 5 8 9 3 8 8 9 9 8 8 9 7 8 8 3 9 8 8 6 7
C2 9 3 9 8 3 1 9 2 8 9 5 9 9 2 9 8 8 9 6 10 8 7 8 9 6 9 9 7 3 8 C3 8 2 8 9 2 1 10 3 9 8 6 7 8 3 7 8 9 9 8 7 7 7 9 8 6 9 7 6 6 7 C4 8 4 8 7 2 1 10 3 9 9 6 8 9 3 7 8 8 8 7 8 8 9 8 8 4 9 8 7 5 7 C5 8 2 10 7 3 1 9 1 8 9 6 8 8 3 9 8 7 9 8 7 6 9 10 9 3 8 6 9 4 8 C6 9 3 10 8 1 1 8 3 8 9 6 8 9 3 9 7 8 9 8 8 7 9 9 9 3 8 9 6 4 9 C7 9 4 6 9 1 1 9 1 9 9 8 7 8 3 8 9 7 8 8 10 8 8 8 8 3 9 8 6 6 9 C8 8 3 9 9 1 2 8 4 9 10 5 8 9 4 8 9 7 8 8 10 9 7 8 9 4 9 7 7 4 9 C9 9 4 6 7 1 2 8 4 9 8 8 7 8 2 9 7 9 8 7 7 8 9 9 9 4 9 7 7 4 8 C10 7 3 6 8 3 2 10 1 9 8 7 7 8 3 7 9 8 8 8 7 7 7 8 8 6 8 7 8 5 9 C11 9 3 6 9 3 1 8 2 8 10 6 8 8 3 9 9 9 8 8 8 6 7 8 9 3 8 7 7 6 8 C = Controller
Table 3-5: Raw Data of the RTS Acceptance Questionnaire
By use of a t-test for a single sample size, each item was proved for its statistical significance. Table 3-6 shows the respective results. P-value with a star* indicate its statistical significance.
Test Value = 5.5 Item T df p (1-sided)
ITEM01 14,087 10 ,000* ITEM02 -10,241 10 ,000* ITEM03 4,787 10 ,001* ITEM04 10,338 10 ,000* ITEM05 -12,618 10 ,000* ITEM06 -30,016 10 ,000* ITEM07 12,594 10 ,000* ITEM08 -8,953 10 ,000 ITEM09 20,618 10 ,000* ITEM10 14,986 10 ,000* ITEM11 2,096 10 ,031* ITEM12 11,423 10 ,000* ITEM13 18,764 10 ,000* ITEM14 -15,932 10 ,000* ITEM15 10,178 10 ,000* ITEM16 11,847 10 ,000* ITEM17 10,338 10 ,000* ITEM18 18,764 10 ,000* ITEM19 10,510 10 ,000* ITEM20 7,113 10 ,000* ITEM21 6,550 10 ,000* ITEM22 7,832 10 ,000* ITEM23 14,252 10 ,000* ITEM24 19,341 10 ,000* ITEM25 -3,594 10 ,003* ITEM26 20,618 10 ,000* ITEM27 7,262 10 ,000* ITEM28 5,590 10 ,000* ITEM29 -2,096 10 ,031 ITEM30 10,338 10 ,000*
Table 3-6: T-Test for 30 items of the Acceptance questionnaire

EMMA
Test Results PRAGUE DLR
Save date: 2006-06-02 Public Page 52 File Name: D631_Results-PRG_V1.0.doc Version: 1.0
8,36
3,18
8
8,09
8,81
2,45
8,63
9
6,18
7,72
8,45
2,9
8,18
8,18
8,09
8,45
7,63
8,18
7,54
7,81
8,45
8,54
4,09
8,63
7,54
7,09
4,81
8,09
1,9
1,27
1 2 3 4 5 6 7 8 9 10
A01 - I experienced the level of safety by using the A-SMGCS as veryhigh.
A02 - EMMA enabled you to handle more traffic
A03 - EMMA enabled you to provide the pilots a better level of service
A04 - EMMA enabled you to execute your tasks more efficiently
A05 - The introduction of EMMA will increase the potential of humanerror
A06 - The types of human error associated with EMMA are different thanthose associated with normal work
A07 - The A-SMGCS DISPLAY is easy to handle
A08 - The A-SMGCS DISPLAY provides an active, involved role for me
A09 - The A-SMGCS DISPLAY gives me support I miss with the currentsystems
A10 - The use of the different windows is clear to me
A11 - Called windows appear at the expected place and size
A12 - The layout of the windows on the screen is good, i.e. the windowsare conveniently arranged
A13 - I experienced textual representation as appropriate
A14 - In general, automated features within the A-SMGCS DISPLAYbehave in ways that are consistent with my expectations
A15 - I experienced the mouse and the keyboard for an A-SMGCSDISPLAY input device as well-suitable
A16 - All information I need to accomplish a ATC instructions isavailable
A17 - The display colours chosen in the A-SMGCS DISPLAY aresatisfying
A18 - The contrast between the windows and their background issufficient
A19 - The layout of the A-SMGCS DISPLAY is good, i.e. the informationis conveniently arranged and the amount of information in is not to
large
A20 - The different information is easy to find
A21 - Visual coding techniques help me maintain productive scanning
A22 - Different colour codes are easy to interpret
A23 - The used symbols are easy to interpret
A24 - Symbols can easily be read under different angle of view
A25 - Labels, terms and abbreviations chosen in the A-SMGCSDISPLAY are easy to interpret
A26 - The height and width of characters are sufficient
A27 - The A-SMGCS DISPLAY provides me with the right information inthe right time
A28 - Sometimes information was displayed, which I did not need
A29 - The number of keystrokes (or other control actions) necessary tointeract with the system is kept to a minimum
A30 - I experienced the level of safety by using the A-SMGCS DISPLAYas high
0,00 0,05 0,10 0,15 0,20 0,25 0,30 0,35 0,40 0,45 0,50 0,55
Figure 3-1: Bar Chart for Means, SD, and p-values for 30 items from the RTS Acceptance Questionnaire

EMMA
Test Results PRAGUE DLR
Save date: 2006-06-02 Public Page 53 File Name: D631_Results-PRG_V1.0.doc Version: 1.0
The bar chart with Figure 3-1 gives a good overview about the answers to each item. The mean value is 5.54, which is represented by the blue line. Except for item 08 and item 29 all statements have been answered towards the expected end of the scale. The p-values are represented by the scale of the lower horizontal axis, the 0.05 yellow line and the yellow bars on top of the red bars. No yellow bar exceeds the critical 0.05% line, which expresses the statistical significance of all items5.
Concluding Results 28 of 30 acceptance items have been significantly answered by 11 controllers in the expected direction. Therefore, it can be stated that the use of the A-SMGCS in the two RTS phases was of high operational feasibility.
3.2.2 Debriefing Comments After finishing all test runs, each controller was given the chance to express his general comments, suggestions, and criticisms about the A-SMGCS. The following comments have been highlighted here:
• Immediate T2 alerts with crossing departing or landing aircraft are not desirable for the controllers – amber would be better - or red, when better tuned
• Controllers could imagine a big and separate “resolution button” to tell the automation that the conflict situation is under control or resolved
• One acoustic alert peep would be sufficient to make the controller aware of a conflict • With the “Time-to-threshold” window, the line 15sec is missing
o Would also prefer distance instead of time because of the ATC separation rules o Time is also advantageous, but more with a smaller scale (perhaps 3 or 5 sec.) o Controller 2 prefers to see the timing with “15sec and more”, instead of “15sec and
less” • When more than one target on the RWY an orange alert is given, which has been estimated as
potentially useful, but: o not with diverging targets o not with RWY31/13 crossing with TWY F and RWY24/06 (arrivals and departures) o not with RWY31/13 crossing with TWY F and RWY13 arrived aircraft that are
already behind this crossing area.
4 The figure’s mean line is not exactly 5,5, which resulted from a MS Excel drawback that does not support such a mean line in a proper way. 5 Except for item 08 and 29 that are answered in the non-expected direction.

EMMA
Test Results PRAGUE DLR
Save date: 2006-06-02 Public Page 54 File Name: D631_Results-PRG_V1.0.doc Version: 1.0
3.3 Operational Improvements (RTS) With the Prague Test Plan [13] high-level and low-level V&V objectives were translated into measurable indicators and measurement instruments. The following table gives an overview about the operational improvements that were intended to be measured with the real-time simulation exercises.
High-level Objective
Low-level Objective Indicator Measurement Instruments
Obj./ Sub.
Reduced number of incidents and accidents
1. Number of incidents and accidents
Observations Obj. Safety
Faster identification and mitigation of safety hazards
2. Time for conflict detection, identification, and resolution
Observations
Obj.
Higher maximum number of aircraft handled
1. Number of aircraft handled6
Recordings Obj.
Lower holding time per aircraft
2. Holding Time7 Recordings Obj.
Lower Taxi Time for in and outbound traffic
3. Taxi Time Recordings Obj.
Lower duration of radio communications
4. Duration of radio communications (R/T load)
Recordings Obj.
Efficiency/ Capacity
Lower number of requests to the pilot to report her/his position
5. Number of requests to the pilot to report her/his position8
Observations Obj.
Higher Situation Awareness 1. Situational Awareness SASHA_Q SASHA_ on-Line
Sub. Human Factors
Convenient level of workload
2. Workload I.S.A Sub.
Table 3-7: Low-level Objectives, Indicators, and Measurement Instruments for Measuring operational improvements in the RTS
3.3.1 Safety
3.3.1.1 Number of incidents and accidents Identifier Hypothesis
OI-SAF1-H0 There is no difference in terms of number of incidents between the Baseline and the A-SMGCS Level II.
OI-SAF1-H1 The number of incidents decreases as an effect of introducing the A-SMGCS application and the related procedures.
6 The “number of aircraft handled by the controllers” was given by the traffic scenario itself. Differences in terms of efficiency can be seen with the “taxi time” 7 The “holding time” of aircraft during taxiing could not be recorded. 8 As the surveillance service worked with a 100% performance there was no need for the controller to request a pilot to report her/his position. In the baseline condition in VIS3 procedural control was applied. Differences in terms of efficiency can be seen in the “R/T load”.
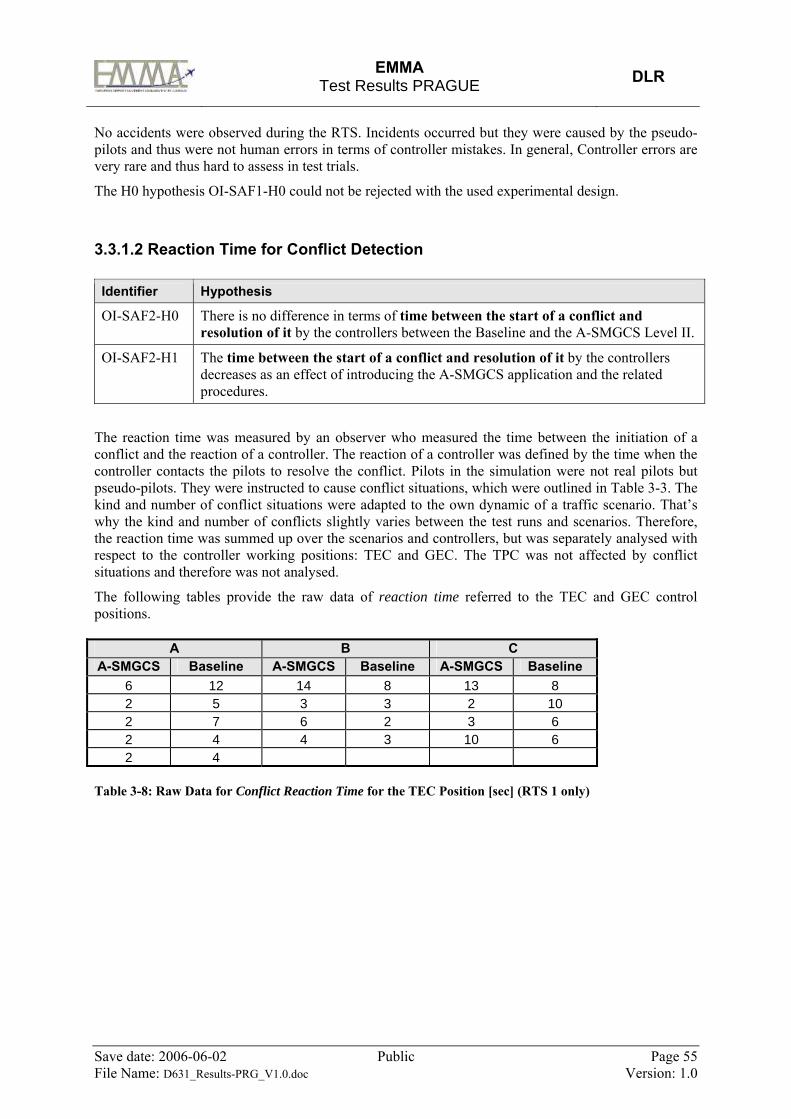
EMMA
Test Results PRAGUE DLR
Save date: 2006-06-02 Public Page 55 File Name: D631_Results-PRG_V1.0.doc Version: 1.0
No accidents were observed during the RTS. Incidents occurred but they were caused by the pseudo-pilots and thus were not human errors in terms of controller mistakes. In general, Controller errors are very rare and thus hard to assess in test trials.
The H0 hypothesis OI-SAF1-H0 could not be rejected with the used experimental design.
3.3.1.2 Reaction Time for Conflict Detection Identifier Hypothesis
OI-SAF2-H0 There is no difference in terms of time between the start of a conflict and resolution of it by the controllers between the Baseline and the A-SMGCS Level II.
OI-SAF2-H1 The time between the start of a conflict and resolution of it by the controllers decreases as an effect of introducing the A-SMGCS application and the related procedures.
The reaction time was measured by an observer who measured the time between the initiation of a conflict and the reaction of a controller. The reaction of a controller was defined by the time when the controller contacts the pilots to resolve the conflict. Pilots in the simulation were not real pilots but pseudo-pilots. They were instructed to cause conflict situations, which were outlined in Table 3-3. The kind and number of conflict situations were adapted to the own dynamic of a traffic scenario. That’s why the kind and number of conflicts slightly varies between the test runs and scenarios. Therefore, the reaction time was summed up over the scenarios and controllers, but was separately analysed with respect to the controller working positions: TEC and GEC. The TPC was not affected by conflict situations and therefore was not analysed.
The following tables provide the raw data of reaction time referred to the TEC and GEC control positions.
A B C A-SMGCS Baseline A-SMGCS Baseline A-SMGCS Baseline
6 12 14 8 13 8 2 5 3 3 2 10 2 7 6 2 3 6 2 4 4 3 10 6 2 4
Table 3-8: Raw Data for Conflict Reaction Time for the TEC Position [sec] (RTS 1 only)

EMMA
Test Results PRAGUE DLR
Save date: 2006-06-02 Public Page 56 File Name: D631_Results-PRG_V1.0.doc Version: 1.0
A B C A-SMGCS Baseline A-SMGCS Baseline A-SMGCS Baseline
3 3 2 6 6 4 3 4 7 7 2 2 2 2 3 3 2 3 15 4 2 4 2 3 3 4 2 5
Table 3-9: Raw Data for Conflict Reaction Time for the GEC Position [sec] (RTS 1 only)
The following tables outline the statistical values and the statistical test results. A t-test for paired differences was conducted to prove the data for their statistical significance:
Mean N SD SE A-SMGCS 5,3077 13 4,32791 1,20035 TEC Baseline 6,0000 13 2,94392 ,81650
Table 3-10: Means, SD, and SE for the TEC’s Reaction Time (RTS 1 only)
Mean N SD SE
A-SMGCS 3,8571 14 3,57033 ,95421 GEC Baseline 3,8571 14 1,40642 ,37588
Table 3-11: Means, SD, and SE for the GEC’s Reaction Time (RTS 1 only)
65,37
12345678
Reaction Time TEC [sec]
Baseline
EMMA A-SMGCS
3,86 3,86
12345678
Reaction Time GEC [sec]
Baseline
EMMA A-SMGCS
Figure 3-2: Bar Charts of the Mean Reaction Time for TEC and GEC Position (RTS 1 only)
M SD SE T df p-value
TEC A-SMGCS -Baseline
-0,69231 4,46065 1,23716 -0,560 12 0,30
GEC A-SMGCS -Baseline 0,00000 3,48624 0,93174 0,00 13 1,000
Table 3-12: T-tests for paired differences: Reaction Time of TEC and GEC position (RTS 1 only)

EMMA
Test Results PRAGUE DLR
Save date: 2006-06-02 Public Page 57 File Name: D631_Results-PRG_V1.0.doc Version: 1.0
Concluding Results
The results show no significant differences in the “reaction time” between A-SMGCS and the baseline condition neither for the TEC (M = -0,69 seconds, T(12) = -0,560, p > .05) nor for the GEC position (M = 0,00 seconds, T(13) = 0,00, p > .05). For the TEC position, there is a trend that shows that controllers react faster in the A-SMGCS condition but the effect seems not that high to be proven with only 13 pairs of conflict situation. For the GEC position there was no difference measured.
In addition to that, the test observer reported that reaction times are hard to measure. Particularly, assessing the time when a conflict is initiated or when it can be identified as a potential conflict situation is a rather subjective estimation by the observer. Additional error variance can be assumed with the fact that conflict situations are always slightly different even when they happen at the same time in the same traffic scenario. By so far, the sample size of conflict situations in RTS must be very high to randomise these side effects and to show significant differences. However, the greater the amount of conflict situations the less the naturalness of the traffic scenario.
The H0 hypothesis OI-SAF2-H0 can not be rejected.
3.3.2 Efficiency/Capacity
3.3.2.1 Taxi Time Identifier Hypothesis
OI-EFF1-H0
There is no difference in terms of global taxiing time between the Baseline and the A-SMGCS Level II.
OI-EFF1-H1
The global taxiing time is reduced as an effect of introducing the A-SMGCS Level II application and related procedures.
The taxi time was measured automatically for each aircraft starting from the gate (velocity > 0 kts) until the wheels left the ground (take-off) for outbound movements. For inbound movements the time measurement started when the wheels touched the ground (touch down) until the velocity was 0 at the gate or stand.
Since identical traffic scenarios were used for A-SMGCS and Baseline trials (except of that the callsigns were changed to alleviate recall effects with controllers), pairs of identical taxiing aircraft within identical traffic scenarios could be gained. This guaranteed that measured differences could be claimed for better efficiency of A-SMGCS to reduce the average duration of taxi times.
3.3.2.1.1 Raw Data Pairs of “taxi times” were summed up for each scenario A, B, and C dependent on in- and outbound traffic, and A-SMGCS vs. Baseline condition. The following raw data were recorded:

EMMA
Test Results PRAGUE DLR
Save date: 2006-06-02 Public Page 58 File Name: D631_Results-PRG_V1.0.doc Version: 1.0
Scenario A Scenario B Scenario C Inbound Outbound9 Inbound Outbound Inbound Outbound
A-SMGCS Base A-SMGCS Base A-SMGCS Base A-SMGCS Base A-SMGCS Base A-SMGCS Base
179 181 74 454 87 85 334 319 139 172 249 242 111 272 106 89 369 384 256 542 259 251 277 280 230 801 379 271 331 408 300 262 368 370 493 884 385 402 520 812 310 490 380 526 710 743 440 470 564 615 316 163 575 484 748 948 448 490 571 693 332 542 602 507 778 980 522 521 583 583 350 309 606 145 901 778 523 492 583 579 403 367 608 683 979 1090 534 535 649 664 512 501 614 892 987 1103 622 591 679 675 519 549 637 585 1022 1107 155 320 723 848 537 451 684 595 1044 1006 186 134 775 602 575 766 33 629 1089 777 365 386 878 494 621 616 154 665 1102 1237 367 368 83 96 800 796 225 81 1198 1164 398 649 216 399 191 181 492 649 85 113 426 443 323 310 191 509 496 556 96 97 451 708 384 573 260 255 551 504 681 1016 454 492 516 732 280 257 552 129 685 736 579 408 531 571 317 348 561 634 699 838 228 373 572 542 321 375 143 244 821 832 296 321 583 716 327 355 242 350 891 953 342 361 629 829 366 366 274 395 967 1004 414 432 654 700 487 573 288 278 81 90 431 404 691 939 494 470 348 364 100 84 440 553 140 127 509 610 364 234 461 508 499 396 264 240 563 301 369 367 475 921 521 411 348 789 629 719 395 468 624 844 541 691 545 934 692 847 435 622 635 943 619 498 562 443 794 70 457 500 654 732 646 604 586 826 159 160 464 575 727 830 270 245 664 835 179 270 475 516 736 907 370 320 676 1165184 524 511 562 741 868 381 405 734 736 233 349 513 469 794 796 385 426 772 959 250 279 518 593 847 846 445 466 784 1215259 401 544 580 847 964 522 546 850 839 306 322 594 603 883 1167 637 522 85 366
9 Data seemed to be corrupted and did not used for the analysis. Baseline taxi times were much more longer than usual, which were properly caused by a systematic recording failure.

EMMA
Test Results PRAGUE DLR
Save date: 2006-06-02 Public Page 59 File Name: D631_Results-PRG_V1.0.doc Version: 1.0
Scenario A Scenario B Scenario C Inbound Outbound9 Inbound Outbound Inbound Outbound
A-SMGCS Base A-SMGCS Base A-SMGCS Base A-SMGCS Base A-SMGCS Base A-SMGCS Base
351 334 726 597 959 1107 251 450 228 271 366 94 215 268 991 1135 339 320 314 340 378 569 277 323 1012 1212 381 356 395 366 432 431 369 369 1044 1239 390 385 506 838 488 522 386 369 102 86 398 711 546 615 592 651 417 417 145 96 411 386 561 515 654 744 455 372 211 358 433 462 570 753
476 594 405 862 438 439 632 640 476 421 575 1094 501 531 636 666 476 498 587 970 553 500 658 503 480 406 601 819 573 591 695 683 492 102 703 1089 625 745 127 136 495 438 717 739 636 460 242 583 510 557 717 754 119 398 331 801 511 560 827 1174 229 530 507 819 514 509 847 966 319 331 516 814 554 555 862 1068 386 386 548 1291 674 263 871 1620 399 598 573 957 74 89 897 887 438 465 595 836 89 584 910 894 504 774 617 757 92 278 934 1095 514 514 635 852 129 516 85 110 521 521 790 1159 217 105 91 97 579 384 1104 1180 376 571 713 903 119 128 403 537 727 803 228 487 433 411 799 984 385 918 495 603 870 871 525 803 585 611 882 1068 578 830 969 1148 609 802 636 809 679 754 763 828 928 889
Table 3-13: Taxi Time Raw Data [sec] (RTS 1)

EMMA
Test Results PRAGUE DLR
Save date: 2006-06-02 Public Page 60 File Name: D631_Results-PRG_V1.0.doc Version: 1.0
Scenario A Scenario B Scenario C Inbound Outbound Inbound Outbound Inbound Outbound
A-SMGCS Base A-SMGCS Base A-SMGCS Base A-
SMGCS Base A-SMGCS Base A-
SMGCS Base
486 686 793 673 457 399 726 797 540 412 607 607496 471 862 658 460 463 742 1215 568 540 116 112499 514 879 594 475 478 744 1073 604 470 352 316523 476 905 975 483 84 763 867 72 340 406 293525 641 1026 903 495 480 822 891 170 339 440 527649 717 1127 1092 525 1317 859 856 336 328 462 659716 727 129 156 570 595 866 1022 351 391 480 324833 73 295 73 577 569 999 810 374 524 565 441934 908 309 528 605 586 67 64 469 455 629 48394 37 480 427 82 214 82 138 470 410 653 381168 503 481 482 215 339 392 601 474 1329 709 403187 192 499 856 234 234 510 581 480 555 714 890195 180 502 569 247 215 588 781 514 554 728 618212 158 525 500 397 475 596 807 551 401 274 307 564 725 403 523 639 1000 561 514 306 307 610 746 442 407 690 852 408 288 631 778 445 524 722 967 413 383 672 430 451 445 768 938 416 383 689 559 468 470 795 900 499 493 734 777 495 1401 849 1011 503 487 964 511 511 492 919 1066 506 451 1072 625 516 558 1107 782 530 652 524 541 554 519 575 593 626 621 621 595 841 635 681 710 841 627
Table 3-14: Taxi Time Raw Data (RTS 2)

EMMA
Test Results PRAGUE DLR
Save date: 2006-06-02 Public Page 61 File Name: D631_Results-PRG_V1.0.doc Version: 1.0
3.3.2.1.2 Results
Scenario In-or Outbound
A-SMGCS / Baseline
Average Taxi Time (sec)
Difference(sec) df t p-
value10 A-SMGCS 398 In BASELINE 417
-19 43 -0.786 0.22
A-SMGCS No valid data A
Out BASELINE No valid data
A-SMGCS 414 In BASELINE 451
-37 64 -1.541 0.07
A-SMGCS 683 B
Out BASELINE 820
-137 65 -6.370 0.00*
A-SMGCS 431 In BASELINE 460
-29 59 -1.941 0.03*
A-SMGCS 532 C
Out BASELINE 674
-142 69 -6.351 0.00*
A-SMGCS 500 Total BASELINE 579
-79 304 -7.728 0.00*
Table 3-15: Taxi Time Results (RTS 1)
Scenario In-or Outbound
A-SMGCS / Baseline
Average Taxi Time (sec)
Difference (sec) df t p-
value11
A-SMGCS 444 In BASELINE 423
21 35 0.820 0.21
A-SMGCS 659 A
Out BASELINE 629
30 30 0.795 0.22
A-SMGCS 422 In BASELINE 497
-75 34 -1.883 0.03*
A-SMGCS 625 B
Out BASELINE 778
-153 30 -4.782 0.00*
A-SMGCS 426 In BASELINE 457
-31 23 -0.734 0.24
A-SMGCS 478 C
Out BASELINE 430
48 21 1.732 0.05
A-SMGCS 510 Total BASELINE 540
-30 178 -1.973 0.03*
Table 3-16: Taxi Time Results (RTS 2)
10 The star with a p-value shows its significance with an α = 0.05. 11 The star with a p-value shows its significance with an α = 0.05.

EMMA
Test Results PRAGUE DLR
Save date: 2006-06-02 Public Page 62 File Name: D631_Results-PRG_V1.0.doc Version: 1.0
579500
540 510
0
100
200
300
400
500
600
700
RTS 1 RTS 2
BaselineA-SMGCS
Figure 3-3: Total average Taxi Times for RTS 1 and RTS 2 [sec]
Concluding Results The results show significant differences in the taxi times between A-SMGCS and the Baseline condition for both RTS phases: For the RTS 1 (MTotal = -79 seconds, T(304) = -7,728, p < .05) and for the RTS 2 (MTotal = -30 seconds, T(178) = 1,973, p < .05). It has to be considered that pseudo-pilots are not affected by reduced visibility conditions and the speed of their controlled aircraft has always a constant level. Measured differences can only be interpreted as a more efficient control by the controllers using A-SMGCS.
As the patterns of Table 3-15 and Table 3-16 show: The differences are particularly high with scenario B where the visibility is good but the amount of traffic is the biggest.
Furthermore, the results of RTS 2 should be more reliable than the RTS 1 results, because lots of movements in RTS 1 are affected by evoked conflict situations that were not applied with RTS 2. However, even with RTS 1, taxi times are significantly lower with A-SMGCS compared with the baseline condition.
The H0 hypothesis OI-EFF1-H0 can be rejected and the alternative hypothesis OI-EFF1-H1 can be assumed to be valid. This means, A-SMGCS reduces taxi times.
3.3.2.2 Radio Communication Load Identifier Hypothesis
OI-EFF4-H0 There is no difference in terms of duration of radio communications between the Baseline and the A-SMGCS Level II.
OI-EFF4-H1 The total duration of radio communications is reduced as an effect of introducing the A-SMGCS Level II application and related procedures.
With both phases of the RT-Simulations, the duration of radio communication has been measured for each controller working position. The duration of a test run was one hour (3600 sec). However, if a test run lasted longer than the 3600 seconds, the recording file was cut after 3600 seconds. Therefore, all present R/T durations refer to 3600 seconds overall test time.

EMMA
Test Results PRAGUE DLR
Save date: 2006-06-02 Public Page 63 File Name: D631_Results-PRG_V1.0.doc Version: 1.0
3.3.2.2.1 Raw Data
TPC TEC GEC Baseline A-SMGCS Baseline A-SMGCS Baseline A-SMGCS
504 576 1980 1368 1548 1260 540 468 1872 1476 1008 1476 648 576 1656 1332 1800 1332 612 432 1764 1188 2124 1044 612 468 1908 1512 1476 1656 540 612 1800 1620 2412 1512
miss. data miss. data 1728 1548 1620 1548 miss. data miss. data 1620 1368 1368 1584 miss. data miss. data 1764 1512 1800 1440 miss. data miss. data 1764 1152 1800 1548 miss. data miss. data 1836 1404 1224 900 miss. data miss. data 1584 1332 1044 1260 miss. data miss. data 1728 1692 1404 1296 miss. data miss. data 1764 1440 1548 1476 miss. data miss. data 1692 1260 1224 1116
576 522 1764 1413 1481 1244
Table 3-17: Radio Communication Load Raw Data [sec per hour] (RTS 1)
TPC TEC GEC
Baseline A-SMGCS Baseline A-SMGCS Baseline A-SMGCS
684 468 1836 1800 1944 1764 648 540 1908 1836 2268 1980 864 576 1440 1296 1620 1476 720 684 1980 1944 2088 1836 576 576 1296 1152 2304 1440 828 648 1800 1728 1368 1512
720 582 1710 1626 1932 1668
Table 3-18: Radio Communication Load [sec per hour] (RTS 2)

EMMA
Test Results PRAGUE DLR
Save date: 2006-06-02 Public Page 64 File Name: D631_Results-PRG_V1.0.doc Version: 1.0
3.3.2.2.2 Results CWP A-SMGCS Mean
M Standard Deviation
SD Sample Size
N ASMGCS 522,0 74,6 6
TPC BASE 576,0 55,7 6
ASMGCS 1413,6 151,8 15 TEC
BASE 1764,0 106,2 15 ASMGCS 1363,2 217,2 15
GEC BASE 1560,0 385,9 15
ASMGCS 1244,0 369,6 36 Total
BASE 1481,0 491,8 36
Table 3-19: R/T Load Means, SD, and Sample Size (RTS 1)
576 522
17641413 1560 1363
0
600
1200
1800
2400
3000
3600
TPC TEC GEC
BaselineA-SMGCS
Figure 3-4: Means of R/T Load between A-SMGCS and Baseline for each CWP [sec per hour] (RTS1)
CWP A-SMGCS Mean
M Standard Deviation
SD Sample Size
N ASMGCS 582 76,9 6
TPC BASE 720 109,1 6
ASMGCS 1626 322,3 6 TEC
BASE 1710 275,8 6
ASMGCS 1668 222,6 6 GEC
BASE 1932 371,8 6
ASMGCS 1292 560,4 18 Total
BASE 1454 600,3 18
Table 3-20: R/T Load Means, SD, and Sample Size (RTS2)

EMMA
Test Results PRAGUE DLR
Save date: 2006-06-02 Public Page 65 File Name: D631_Results-PRG_V1.0.doc Version: 1.0
720 582
1710 16261932
1668
0
600
1200
1800
2400
3000
3600
TPC TEC GEC
BaselineA-SMGCS
Figure 3-5: Means of R/T Load between A-SMGCS and Baseline for each CWP [sec per hour] (RTS2)
UV QS df F p-
value12
CWP 9772362 2 98,606 0,000* ASMGCS 602402 1 12,157 0,001*
CWP x ASMGCS 209034 2 2,109 0,129 Error 3270456 66 Total 147924144 72
Table 3-21: R/T Load Test for Significance (two-way ANOVA [F-Test]) (RTS 1)
UV QS df F p-
value13
CWP 9487656,000 2 73,806 0,000* ASMGCS 236196,000 1 3,675 0,065
CWP x ASMGCS 51192,000 2 ,398 0,675 Error 1928232,000 30 Total 79567920,000 36
Table 3-22: R/T Load Test for Significance (two-way ANOVA [F-Test]) (RTS2)
Concluding Results
The two-way 2x3 ANOVA shows a significant result for A-SMGCS with RTS 1 with a significant mean difference of 237 seconds per hour less R/T load (F(1,30) = 12.2, p < .05). With RTS 2, a 162 second difference between A-SMGCS and baseline was measured, which shows a positive trend to
12 The star with a p-value shows its significance with an α = 0.05. 13 The star with a p-value shows its significance with an α = 0.05.

EMMA
Test Results PRAGUE DLR
Save date: 2006-06-02 Public Page 66 File Name: D631_Results-PRG_V1.0.doc Version: 1.0
assume the H1 hypothesis, but became not significant (F(1,30) = 3.6, p > .05). However a p-value of 0.065 is rather close to significance and with a greater sample size the effect could also be proved.
With the interpretation of the results, it has to be regarded that with RTS 1 the controllers were very much interrupted by evoked conflict situations that did not happen with RTS 2. However, as the impact of conflicts is equal to both conditions (A-SMGCS and Baseline) a systematic effect of a variance can be excluded.
OI-EFF4-H0 can be rejected and the alternative H1 can be assumed: A-SMGCS reduces the load of R/T communication.
3.3.3 Human Factors
3.3.3.1 Situation Awareness Identifier Hypothesis
OI-HF1-H0 The ATCOs’ situational awareness in the Baseline condition is higher or at least equal compared to the A-SMGCS Level II test condition.
OI-HF1-H1 The ATCOs’ situational awareness is improved as an effect of introducing the A-SMGCS Level II application and the related procedures.
3.3.3.1.1 SASHA Questionnaire Results After each test run the controllers’ situation awareness was measured with the SASHA Questionnaire. This questionnaire was developed within the project “Solutions for Human-Automation Partnerships in European ATM” (SHAPE) conducted by EUROCONTROL (2003)14. The questionnaire uses a five-point scale and contains 12 questions, of which eight questions address generic subjective aspects of SA referring to the work of an ATCO, three questions addressing aspects of specific tools, and one question addressing SA globally. Each ATCO completes the questionnaire at the end of a test run. These ratings have been merged to two scores per controller, one for the EMMA A-SMGCS and one for the baseline condition.
Following raw data have been measured:
14 http://www.eurocontrol.int/humanfactors/gallery/content/public/docs/DELIVERABLES/HF35-HRS-HSP-005-REP-01withsig.pdf

EMMA
Test Results PRAGUE DLR
Save date: 2006-06-02 Public Page 67 File Name: D631_Results-PRG_V1.0.doc Version: 1.0
item1 item2 item3 item4 item5 item6 item7 item8 item9 item10 item11 item12 em1 ba1 em2 ba2 em3 ba3 em4 ba4 em5 ba5 em6 ba6 em7 ba7 em8 ba8 em9 ba9 em10 ba10 em11 ba11 em12 ba12
4,84 4,84 4,67 4,67 4,67 4,67 1,17 1,50 1,50 1,00 1,00 1,50 4,50 3,83 2,17 1,67 4,33 4,00 3,20 n.a. 3,80 n.a. 4,67 4,67
5,00 5,00 4,83 5,00 4,83 5,00 1,17 1,33 1,00 1,50 1,67 1,67 4,83 5,00 2,33 2,50 4,67 4,83 4,33 n.a. 4,33 n.a. 4,67 5,00
4,84 4,66 4,50 4,83 4,50 4,83 1,20 1,00 1,25 1,50 1,17 2,00 4,17 4,50 1,67 1,83 4,67 4,00 3,67 n.a. 4,17 n.a. 4,50 4,50
5,00 4,50 4,83 4,83 4,83 4,83 1,00 1,00 1,00 1,00 1,00 1,33 4,50 3,67 2,33 2,50 4,67 4,17 3,25 n.a. 2,33 n.a. 4,50 4,00
4,50 4,66 4,83 4,83 4,83 4,83 1,00 1,00 1,00 1,33 1,33 1,00 4,67 4,67 3,67 1,50 5,00 4,33 3,20 n.a. 3,25 n.a. 4,75 4,60
5,00 4,00 5,00 4,33 5,00 4,33 1,33 1,67 1,33 1,33 1,33 2,67 4,33 2,67 2,67 2,67 4,67 3,00 4,33 n.a. 3,67 n.a. 5,00 4,00
5,00 4,33 5,00 4,33 5,00 4,33 1,33 1,33 1,00 2,00 1,67 2,00 3,67 3,67 3,33 2,33 4,33 3,00 3,33 n.a. 3,00 n.a. 4,67 3,33
5,00 5,00 5,00 4,33 5,00 4,00 2,00 1,50 1,33 1,00 2,67 2,00 4,00 3,00 2,33 2,00 3,67 3,00 3,33 n.a. 3,00 n.a. 3,67 3,50
5,00 5,00 5,00 5,00 5,00 5,00 1,00 2,00 1,50 1,33 1,00 2,00 4,00 4,33 2,33 2,67 4,67 5,00 3,00 n.a. 3,00 n.a. 4,67 4,00
5,00 4,33 5,00 4,67 5,00 4,67 1,33 2,67 1,00 1,33 1,00 2,00 4,67 2,67 3,33 3,00 4,33 2,67 4,00 n.a. 4,00 n.a. 4,67 3,33
4,67 5,00 4,67 5,00 4,67 5,00 1,00 1,67 1,33 1,00 1,33 1,33 4,67 4,00 2,33 3,33 5,00 3,00 5,00 n.a. 4,00 n.a. 4,67 4,00
em ba
EMMA A-SMGCS test condition Baseline test condition
Table 3-23: Raw Data SASHA Questionnaire
The following bar charts show the mean values for each of the 12 SASHA questionnaire items. The star with a p-value shows the significance of an item, which means the controller commonly saw differences between the A-SMGCS and baseline conditions with respect to the assumption of the alternative hypothesis (H1).
4,664,99
1
2
3
4
5
Item 1*
Baseline
EMMA A-SMGCS
4,72 4,85
1
2
3
4
5
Item 2
Baseline
EMMA A-SMGCS
2. Did you have the feeling that you were able to plan and organise your work as you wanted?
p = 0.133
1. Did you have the feeling that you were ahead of the traffic, able to predict the evolution of the traffic?
p = 0.04*
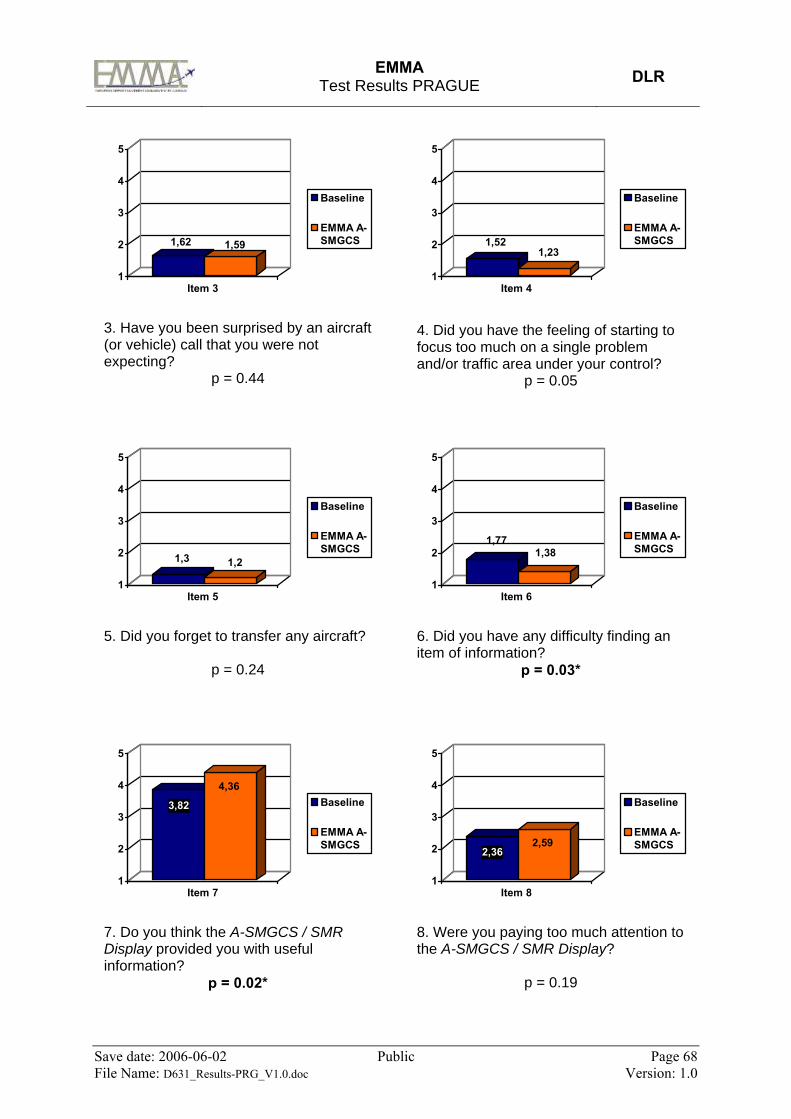
EMMA
Test Results PRAGUE DLR
Save date: 2006-06-02 Public Page 68 File Name: D631_Results-PRG_V1.0.doc Version: 1.0
1,62 1,59
1
2
3
4
5
Item 3
Baseline
EMMA A-SMGCS
1,521,23
1
2
3
4
5
Item 4
Baseline
EMMA A-SMGCS
1,3 1,2
1
2
3
4
5
Item 5
Baseline
EMMA A-SMGCS
1,771,38
1
2
3
4
5
Item 6
Baseline
EMMA A-SMGCS
3,82
4,36
1
2
3
4
5
Item 7
Baseline
EMMA A-SMGCS
2,362,59
1
2
3
4
5
Item 8
Baseline
EMMA A-SMGCS
8. Were you paying too much attention to the A-SMGCS / SMR Display?
p = 0.19
7. Do you think the A-SMGCS / SMR Display provided you with useful information?
p = 0.02*
6. Did you have any difficulty finding an item of information?
p = 0.03*
5. Did you forget to transfer any aircraft?
p = 0.24
4. Did you have the feeling of starting to focus too much on a single problem and/or traffic area under your control?
p = 0.05
3. Have you been surprised by an aircraft (or vehicle) call that you were not expecting?
p = 0.44

EMMA
Test Results PRAGUE DLR
Save date: 2006-06-02 Public Page 69 File Name: D631_Results-PRG_V1.0.doc Version: 1.0
3,73
4,55
1
2
3
4
5
Item 9
Baseline
EMMA A-SMGCS
3,62
1
2
3
4
5
Item 10
EMMA A-SMGCS
2,67
1
2
3
4
5
Item 11
EMMA A-SMGCS
4,084,59
1
2
3
4
5
Item 12
Baseline
EMMA A-SMGCS
Concluding Results Six of the 12 questionnaire items have been significantly answered in the expected direction, five showed the right trend but without significance, and item 11 was answered in the non-expected direction. However, the main situation awareness item 12 has been answered significantly, supporting the hypothesis OI-HF1-H1, which expects a higher SA with A-SMGCS use. With this result, the OI-HF1-H0 can be rejected and the H1 can be assumed as valid alternative that means A-SMGCS increases the Controller’s Situation Awareness.
3.3.3.1.2 SASHA on-line Questionnaire Results This technique is based on the Situation Present Assessment Method (SPAM). Five ATCOs of the RTS 1 were asked three questions by a subject matter expert (SME) via their intercom within each test run. This was done while the simulation was still running, i.e. the simulation was not frozen like in the classical SAGAT query technique. The following questions were asked:
12. How would you rate your overall Situation Awareness during this exercise?
p = 0.01*
11. Did the RWY incursion alert function help you to have a better understanding of the situation? (only with A-SMGCS test run)
Mean is lower than 3
10. Do you think the RWY incursion alert function provided you with useful information? (only with A-SMGCS test run)
p = 0.00*
9. Did the A-SMGCS / SMR Display help you to have a better understanding of the situation?
p = 0.03*

EMMA
Test Results PRAGUE DLR
Save date: 2006-06-02 Public Page 70 File Name: D631_Results-PRG_V1.0.doc Version: 1.0
1. Where is flight x? 2. Is flight y under your control? 3. Which flight has to be transferred next?
The SA of the ATCOs is usually that high that they do not give wrong answers. The following table shows the small cases where they gave wrong answers:
Scenario A Scenario B Scenario C A-SMGCS Baseline A-SMGCS Baseline A-SMGCS Baseline TPC TEC GEC TPC TEC GEC TPC TEC GEC TPC TEC GEC TPC TEC GEC TPC TEC GEC
C1 0 0 0 0 0 0 0 0 0 0 0 1 C2 0 0 1 0 0 0 0 0 0 0 0 0 C3 0 0 0 0 1 0 0 0 0 0 0 0 C4 0 0 1 0 0 0 0 2 0 0 0 0 C5 0 1 0 0 0 0 0 0 0 0 0 0
0 1 0 1 0 0 0 1 0 1 2 0 0 0 0 0 1 Total 1 1 1 3 0 1
Table 3-24: Raw Data of Wrong Answers with the SAHA on-line Query (RTS 1 only)
Concluding Results
In total 180 (3 times per test run and CWP) questions have been asked to the controllers, but only 7 wrong answers have been given. Among these 7 wrong answers, 5 have been given when A-SMGCS was not used. This result is far from statistically significance but it further supports the hypothesis OI-HF1-H1, which expects a higher SA with A-SMGCS use.
3.3.3.2 Workload Identifier Hypothesis
OI-HF3-H0 When workload is on a non-convenient level, the controllers’ workload with the A-SMGCS Level II test condition is not lower compared to Baseline test condition.
OI-HF3-H1 When workload is on a non-convenient level in the baseline condition, the workload with use of an A-SMGCS would be reduced with the same scenario.
With every test run every controller was asked to give his perceived workload rating every 10 minutes. The controller could choose one of five I.S.A. workload categories:
1 = underutilised 2 = relaxed 3 = comfortable 4 = high 5 = excessive
For the analysis, the I.S.A. mid-run workload scores were summed up over each Controller for each test run and respective mean scores were calculated (cf. Table 3-25).
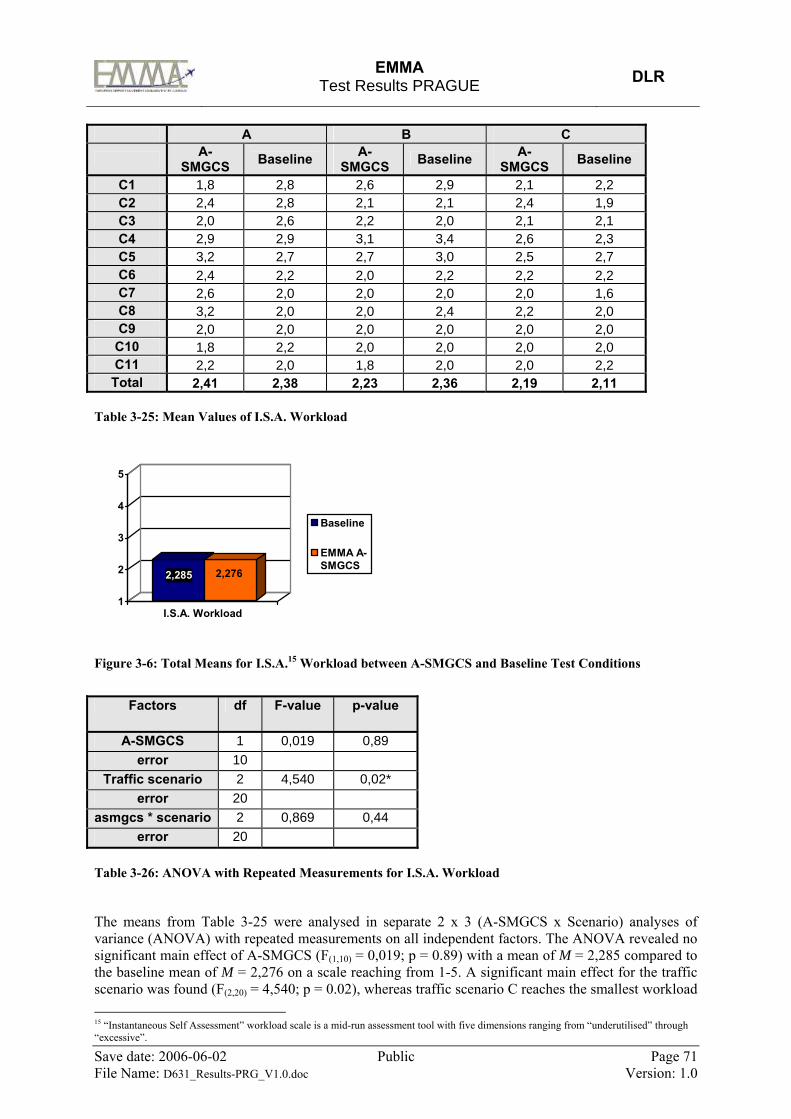
EMMA
Test Results PRAGUE DLR
Save date: 2006-06-02 Public Page 71 File Name: D631_Results-PRG_V1.0.doc Version: 1.0
A B C
A-SMGCS Baseline A-
SMGCS Baseline A-SMGCS Baseline
C1 1,8 2,8 2,6 2,9 2,1 2,2 C2 2,4 2,8 2,1 2,1 2,4 1,9 C3 2,0 2,6 2,2 2,0 2,1 2,1 C4 2,9 2,9 3,1 3,4 2,6 2,3 C5 3,2 2,7 2,7 3,0 2,5 2,7 C6 2,4 2,2 2,0 2,2 2,2 2,2 C7 2,6 2,0 2,0 2,0 2,0 1,6 C8 3,2 2,0 2,0 2,4 2,2 2,0 C9 2,0 2,0 2,0 2,0 2,0 2,0
C10 1,8 2,2 2,0 2,0 2,0 2,0 C11 2,2 2,0 1,8 2,0 2,0 2,2 Total 2,41 2,38 2,23 2,36 2,19 2,11
Table 3-25: Mean Values of I.S.A. Workload
2,285 2,276
1
2
3
4
5
I.S.A. Workload
Baseline
EMMA A-SMGCS
Figure 3-6: Total Means for I.S.A.15 Workload between A-SMGCS and Baseline Test Conditions
Factors df F-value p-value
A-SMGCS 1 0,019 0,89 error 10
Traffic scenario 2 4,540 0,02* error 20
asmgcs * scenario 2 0,869 0,44 error 20
Table 3-26: ANOVA with Repeated Measurements for I.S.A. Workload
The means from Table 3-25 were analysed in separate 2 x 3 (A-SMGCS x Scenario) analyses of variance (ANOVA) with repeated measurements on all independent factors. The ANOVA revealed no significant main effect of A-SMGCS (F(1,10) = 0,019; p = 0.89) with a mean of M = 2,285 compared to the baseline mean of M = 2,276 on a scale reaching from 1-5. A significant main effect for the traffic scenario was found (F(2,20) = 4,540; p = 0.02), whereas traffic scenario C reaches the smallest workload 15 “Instantaneous Self Assessment” workload scale is a mid-run assessment tool with five dimensions ranging from “underutilised” through “excessive”.

EMMA
Test Results PRAGUE DLR
Save date: 2006-06-02 Public Page 72 File Name: D631_Results-PRG_V1.0.doc Version: 1.0
mean (MA = 2,40; MB = 2,30; and MC = 2,15), where the visibility is the lowest but also the traffic amount is only the half of scenario A or B.
Concluding Results
Most of the time the controllers felt relaxed and comfortable in the simulation runs, independent of the test condition A-SMGCS or Baseline. Traffic scenarios were not demanding enough to stress the controllers. Therefore, A-SMGCS had no chance to show a workload improvement compared to a high or even excessive workload in the baseline condition.
Since a “non-convenient workload level” as stated by OI-HF3-H0 could not be reached, A-SMGCS could not show its benefits in terms of workload reduction. Therefore, OI-HF3-H0 cannot be rejected with the used experimental design.
3.4 Departure Manager (DMAN) Demonstration Results During the second EMMA RTS phase in the Tower Simulator in Braunschweig, the DMAN was demonstrated to the two controller teams from the Prague Tower, who participated in the RTS trials. For each team, consisting of three controllers, one day had been allocated, with the possibility to run different simulation scenarios several times and with different controllers at the working positions.
The goals of the simulation exercises were mainly to show the technical feasibility of departure planning, to make the controllers familiar with using a planning tool and to demonstrate what information can be provided to the controller concerning the anticipated ground traffic operations.
At the present state of development, it was not intended to perform tests concerning the operational usability of the DMAN or possible operational improvements, since there was a technical HMI to be used, and the controllers had no training in operating the DMAN.
3.4.1 Course of the Demonstration For both demonstration days, the following schedule had been arranged:
• Briefing • Familiarisation with the DMAN in the small technical scenario EMMA_T1, optionally to be
repeated • Demonstration of the DMAN in the complex operational scenario EMMA_A1 • Debriefing • Break • Second demonstration of the DMAN in the complex operational scenario EMMA_A1 • Final debriefing
For all simulation runs, the following human roles at the working positions had been scheduled: • TEC: 1 Prague controller and 1 DLR assistant for explanations and support in
operating the DMAN HMI. • CEC + GND: 1 Prague controller and 1 DLR assistant for explanations and support in
operating the DMAN HMI. • E2000: 1 Prague controller as an observer
The aircraft in the simulation were again individually controlled by DLR pseudo-pilots, using R/T voice communication between pilots and controllers.
The simulation exercises were managed by a DLR supervisor and a DMAN specialist.
Both days the session started with a briefing, where a presentation on the DMAN was given to the
EMMA
Test Results PRAGUE DLR
Save date: 2006-06-02 Public Page 73 File Name: D631_Results-PRG_V1.0.doc Version: 1.0
controllers, and the intentions and the course of the simulation exercises were explained. In the subsequent discussion, the controllers expressed concerns with respect to additional workload possibly caused be the use of a planning tool.
The simulation exercises started with the small technical scenario EMMA_T1 for familiarization. First, the HMIs were explained in detail by the assistants. During the simulation run, the controllers managed the traffic and observed the DMAN, and the assistants performed the clearance and hand-over entries at the DMAN, and gave explanations. Very soon, some of the controllers started to make the entries by themselves, and also to check, how diverse flight plan items could be changed. It had to be explained that arbitrary changing vital flight plan data would disturb the planning process, which in one case led to repeating the scenario. Nevertheless, it was useful to show the diverse capabilities of the DMAN HMIs, and how diverse flight plan items can be adjusted in accordance to the controller’s intentions.
The complex operational scenario EMMA_A1 was performed twice and the controllers changed the working positions at each run. In the beginning, the assistants had to support the operation of the DMAN, but the more the controllers got used to it, the more they operated the DMAN by themselves. The controllers observed closely the information provided by the DMAN displays, and how the planning results performed. With progress of the simulation exercise, they handled more sophisticated procedures like changes of the assigned runway and intersection take-offs.
3.4.2 Results There were two sources during the DMAN trials to gain the qualitative/subjective results:
• Observations made during the simulation runs. • Comments made by the controllers during the briefings, simulation runs and debriefings.
For each category a short summary shall be given.
Observations: • During all simulation runs the DMAN performed well. The planning results were timely and
in accordance with the respective traffic situation, even when flight plan data had been manually changed by the controllers due to changed procedures.
• The simulation scenarios were well-suited for the demonstration purposes. The small technical scenario with its low traffic density gives enough time for the assistants to explain how the DMAN HMIs have to be operated, and allows the controllers to familiarise themselves with the information provided at the displays and the required entries, without being under pressure by managing a complex traffic scenario. The complex operational scenario has been evaluated and approved throughout the first EMMA RTS phase, and provides a traffic flow and traffic operations to which the controllers are used from their daily work in Prague.
• The simulation runs went smoothly, with the traffic professionally managed by the controllers, and by the pseudo-pilots.
• The controllers soon became acquainted with the DMAN displays, and correlated the actual and upcoming traffic situation with the information provided by the flight strips generally well.
• Though the controllers had to operate the DMAN via technical HMIs, which are not meant for operational use, they were relatively soon able to perform clearance and handover entries by themselves, without being distracted too much from managing the traffic.
• The controllers were generally interested in the information provided by a planning tool, and tried to check out the capabilities of the DMAN. They handled intersection take-offs with change of runway entry point and also changes of the assigned runway.
Comments by the Controllers:

EMMA
Test Results PRAGUE DLR
Save date: 2006-06-02 Public Page 74 File Name: D631_Results-PRG_V1.0.doc Version: 1.0
Most of the comments given by the controllers were related to the HMI subject and the resulting workload, though it was made clear beforehand, that the presented technical HMI is not intended for operational use in the tower.
The respective concerns of the controllers will be taken into account in EMMA2, when as planned an integrated A-SMGCS HMI comprising DMAN HMI functionality will be developed.
• The present HMIs require too much head-down time. • Traffic control, coordination with other authorities at the airport and additionally operating the
DMAN will overload the controller. • An A-SMGCS display together with a separate DMAN display is no suitable solution, since
the controller has to look out of the tower windows and also to check two displays and operate the system. This leads to too much head-down time, increases the workload and distracts the controller from his primary task.
• The solution should be an integrated A-SMGCS display, where the traffic information together with the planning information is shown.
• The information given by the planning function should be reduced to the amount really necessary for the controller.
• Entries at the HMI require too many mouse clicks at different locations in the display. For instance, the confirm button could be replaced by a double-click.
• The number of required HMI entries should be reduced by more automation. • The HMI column, which notes the next clearance, is misleading, since controllers are used to
note given clearances. • Entries at the DMAN, which change flight plan data, must feed back to other systems; e.g.
information also shown in the labels on the traffic situation display must change in accordance.
• Several times it was stated, that apart from the HMI issues the DMAN works well and stable, ant that the planning function provides reasonable results.
Altogether it was acknowledged, that with an integrated, easy to handle A-SMGCS HMI the DMAN would be a valuable tool.

EMMA
Test Results PRAGUE DLR
Save date: 2006-06-02 Public Page 75 File Name: D631_Results-PRG_V1.0.doc Version: 1.0
4 Operational Field Trials Results
4.1 Introduction Operational Field trials in the operational Tower at Prague Ruzyne Airport were conducted on the 3rd of November 2005, 16th through 18th and 23rd through 25th of January 2006.
The operational field trial exercises used the A-SMGCS test-bed components at Prague-Ruzyne airport, established under SP3 of the EMMA Project, and the commercial A-SMGCS that was already used fully operationally from mid of 2005. The Validation Platform is described in the EMMA Prague Test Plan [13].
4.2 Operational Feasibility (Field Trials) The operational feasibility tests aim at assessing the user’s acceptance of the EMMA ORD [10] operational procedures and requirements. It was expected that the operational feasibility of the system would be confirmed, for each set of visibility conditions, using defined procedures derived from EMMA Operational Requirements Document (ORD). The following general hypothesis has been used to decide upon the test results:
High-level Objective 1
EMMA A-SMGCS shows the operational feasibility of the operational procedures and requirements expressed in the initial EMMA ORD [10] for each set of conditions.
To prove the operational feasibility of the installed A-SMGCS three main exercises were conducted: 1. Debriefing Questionnaires and Interviews 2. Long Term Alert Performance Assessment 3. Flight Tests with test aircraft and test vehicles
The following sections give details and results to each exercise.
4.2.1 Debriefing Questionnaire (operational feasibility) A total of 15 ANS-CR controllers filled out the debriefing questionnaire during the EMMA operational field trials. All 15 ANS_CR had worked with the A-SMGCS for 7 months at the time of the investigation. The table below shows the distribution of age, gender, and ATC experiences:
Category N Age 20-29 2 30-39 8 40-49 3 >50 2Gender male 12 female 3ATCO Experience (years) <5 3 6-10 3 11-15 7 16-20 0 21-25 1 > 26 1
Table 4-1: Social-Demographic Data of the Sample Size

EMMA
Test Results PRAGUE DLR
Save date: 2006-06-02 Public Page 76 File Name: D631_Results-PRG_V1.0.doc Version: 1.0
A 144 item debriefing questionnaire were given to 15 ANS_CR controllers after their regular shift. The items that refer to the“operational feasibility” questions/statements loaded to five areas:
• General usability, • Surveillance service, • Control service, • HMI design, and • New or potential procedures.
The following general hypothesis was set up to describe the expectation with the controllers’ answers:
Identifier Hypothesis
OF-H0 The controllers’ opinion does not agree to the “operational feasibility” aspects of a specific item.
OF-H1 The controllers’ opinion agrees to the “operational feasibility” aspects of a specific item.
Ratings to a statement could be given from 1 (strongly disagree) up to 6 (strongly agree). The following table shows the raw data of the complete Debriefing Questionnaire (including operational improvement items). The VA-Id. number identifies the items, C1 through C15 identifies the index of the 15 ANS_CR controllers, a bold number shows that a comment has been given, and a star (*) indicates that a comment was given but without a rating.
VA-Id. C1 C2 C3 C4 C5 C6 C7 C8 C9 C10 C11 C12 C13 C14 C15
1 5 5 5 6 5 5 5 6 5 5 5 4 5 5 5 2 5 5 5 6 5 5 4 6 5 5 5 3 3 5 4 3 5 5 5 6 6 5 6 6 5 6 5 5 6 5 5 4 1 4 2 2 3 4 4 4 2 2 2 3 3 5 3 5 2 5 1 2 3 3 5 3 3 5 5 3 * 5 3 6 1 3 1 2 2 1 1 1 2 1 1 2 3 5 2 7 5 4 2 5 5 2 2 2 4 3 2 3 4 4 4 8 4 4 2 4 4 5 5 5 4 6 5 4 4 5 4 9 5 5 6 5 1 6 6 6 6 6 5 5 6 5 5 10 5 5 6 4 5 5 6 5 5 6 5 5 6 5 5 11 5 5 6 5 6 2 6 5 6 6 4 5 4 5 5 12 5 5 6 6 5 5 6 5 6 6 5 6 5 5 5 13 5 5 4 6 5 5 5 5 6 6 6 5 5 5 6 14 2 2 1 1 1 2 2 2 2 1 2 1 6 4 2 15 4 3 5 4 5 5 5 * 5 5 4 5 6 5 2 16 5 5 6 5 6 5 5 5 5 6 5 5 6 5 5 17 5 4 6 5 6 4 5 5 2 6 3 5 2 5 5 18 4 3 2 5 3 4 4 5 3 2 3 4 * 19 4 4 5 5 5 5 4 4 4 5 3 4 5 * 20 5 5 5 2 2 2 2 2 4 1 3 3 2 3 1 21 4 5 2 4 2 4 6 5 3 4 4 4 2 5 4 22 3 4 4 5 4 4 6 5 5 6 5 5 5 4 6 23 5 4 5 5 6 6 6 5 6 6 5 5 6 5 6 24 3 4 4 4 5 4 6 5 5 5 5 5 6 4 6 25 5 5 6 6 5 5 6 5 5 6 5 5 5 5 2 26 5 5 6 5 5 5 6 5 6 6 5 5 5 6 3 27 5 5 5 5 5 5 4 5 5 6 5 5 5 5 4 28 5 5 6 6 5 5 5 5 6 6 5 6 5 6 5 29 5 5 6 6 4 4 5 5 6 6 4 5 6 6 5

EMMA
Test Results PRAGUE DLR
Save date: 2006-06-02 Public Page 77 File Name: D631_Results-PRG_V1.0.doc Version: 1.0
VA-Id. C1 C2 C3 C4 C5 C6 C7 C8 C9 C10 C11 C12 C13 C14 C15
30 2 3 2 2 2 3 * 1 2 4 2 4 4 6 2 31 2 3 2 2 2 3 * 1 3 4 2 4 4 5 2 32 2 3 2 2 2 3 * 1 4 5 2 4 5 5 2 33 5 4 5 4 4 5 4 5 4 4 4 4 2 5 4 34 5 4 5 4 3 5 4 4 3 5 4 3 4 5 3 35 2 4 5 5 5 4 3 2 2 5 5 4 2 5 4 36 5 5 5 5 4 5 5 5 5 6 3 5 6 5 5 37 5 5 5 5 5 5 5 5 5 6 3 5 5 5 4 38 5 3 6 5 4 4 4 5 6 6 1 6 5 5 5 39 3 3 4 5 2 4 5 5 1 5 4 3 4 4 5 40 3 4 5 5 4 5 5 3 5 5 2 4 6 4 2 41 3 4 5 5 3 5 5 5 2 5 4 5 5 6 5 42 3 4 6 2 * 5 * 5 6 5 6 4 43 5 5 6 4 4 5 5 5 3 6 5 5 5 5 5 44 3 5 5 6 2 5 6 5 4 5 5 1 5 5 5 45 4 5 5 6 2 5 5 5 3 5 5 5 6 5 5 46 5 5 6 6 5 5 5 5 5 6 5 5 6 5 5 47 4 5 5 5 1 5 5 5 3 6 5 5 6 6 5 48 5 5 5 5 5 5 5 5 4 6 5 5 6 5 5 49 1 5 6 5 1 5 1 3 5 5 4 5 6 4 4 50 5 5 6 5 1 5 5 4 5 6 5 6 6 6 5 51 5 4 6 5 3 5 5 5 4 4 4 4 6 4 52 4 4 6 5 2 5 4 5 4 5 4 4 6 6 4 53 5 5 6 5 5 5 4 5 5 6 5 4 6 5 5 54 3 5 3 5 2 5 5 5 4 6 5 5 6 6 2 55 5 5 6 6 6 5 5 5 4 6 5 5 6 6 5 56 2 5 6 5 1 4 1 5 4 5 3 5 5 5 4 57 2 5 6 5 2 4 1 5 5 6 3 4 5 5 4 58 5 5 6 5 4 5 5 5 3 6 5 3 6 5 5 59 5 5 6 5 5 5 5 5 5 6 4 5 6 6 5 60 2 3 4 1 2 1 2 2 2 3 3 2 61 6 5 5 * * 5 5 5 4 5 2 5 6 6 5 62 6 5 5 * 5 5 5 4 5 3 5 6 6 5 63 5 4 4 6 5 5 5 4 6 5 5 4 5 5
63a 5 5 5 6 5 64 3 4 * * * * 3 2 * 2 5 2 65 2 4 * * * 3 6 * 2 3 4 66 4 4 * * * 4 2 * 6 5 4 67 4 4 * * * 4 5 2 * 6 6 4 68 3 4 * * 2 2 4 * 3 3 4 69 4 5 * * 2 3 2 * 1 4 2 70 5 5 3 5 4 5 5 5 4 5 5 5 5 5 71 2 3 4 4 5 2 2 2 5 2 2 2 2 2 72 3 5 6 5 6 5 6 5 5 6 4 5 6 5 5 73 2 2 2 2 1 2 1 2 2 1 2 1 2 1 2 74 5 4 5 4 1 2 5 4 2 6 3 4 6 4 3 75 5 5 5 5 5 4 5 5 4 6 5 5 6 6 5 76 1 2 2 2 1 1 1 2 1 2 2 1 1 1 2 77 5 4 5 4 2 5 5 5 4 5 5 4 6 5 3 78 5 4 5 5 6 5 6 5 5 6 5 6 6 5 5 79 5 5 5 5 5 5 6 5 5 6 5 5 6 6 3 80 5 4 5 5 6 5 5 5 4 6 6 5 5 5 4 81 4 3 4 5 2 4 5 3 4 4 4 4 3 5 2 82 5 3 5 5 5 5 5 5 5 5 4 5 5 6 5 83 2 3 4 2 5 3 5 * 3 2 * 4 5 5 4

EMMA
Test Results PRAGUE DLR
Save date: 2006-06-02 Public Page 78 File Name: D631_Results-PRG_V1.0.doc Version: 1.0
VA-Id. C1 C2 C3 C4 C5 C6 C7 C8 C9 C10 C11 C12 C13 C14 C15
84 5 4 5 4 6 4 5 5 4 5 5 5 3 5 5 85 5 3 3 4 4 3 2 2 3 2 3 1 2 5 2 86 5 4 5 5 3 5 5 5 5 6 6 5 6 5 6 87 2 2 2 1 2 2 2 2 3 2 4 1 4 5 2 88 5 5 5 5 6 5 5 5 5 6 4 5 3 5 5 89 2 2 2 5 2 2 2 2 2 2 2 2 4 4 2 90 2 2 2 1 1 2 1 2 2 2 2 5 1 2 2 91 5 5 5 4 6 5 5 5 4 5 5 5 4 4 5 92 2 3 4 4 4 3 2 2 2 2 2 3 4 3 3 93 5 5 5 5 6 5 5 5 5 5 4 5 5 5 5 94 5 5 4 4 4 5 4 5 5 6 5 5 4 5 4 95 5 4 6 4 4 5 6 5 6 6 6 5 6 2 5 96 5 4 5 4 5 5 5 5 4 5 4 5 5 5 5 97 5 4 5 3 1 5 5 5 5 3 5 5 5 5 5 98 5 4 5 4 6 5 5 5 6 5 5 5 6 6 5 99 5 4 5 4 6 5 5 5 5 5 5 5 6 5 5
100 5 4 5 4 6 5 5 5 4 5 5 5 6 6 5 101 5 2 5 3 6 5 5 5 5 4 4 5 3 5 5 102 5 5 5 5 6 5 5 5 5 4 5 6 6 5 5 103 5 4 4 4 3 5 3 5 5 4 5 6 6 6 5 104 2 3 2 2 2 2 2 2 4 2 3 2 4 3 2 105 2 2 2 5 1 2 5 2 2 2 5 4 2 2 2 106 5 4 5 5 6 5 5 5 4 5 5 5 5 4 5 107 5 4 5 4 6 4 5 5 3 5 2 5 1 5 2 108 5 4 5 5 6 4 5 5 3 5 4 5 5 4 109 3 4 4 4 4 2 2 4 6 3 2 3 4 3 5 110 5 5 5 5 5 5 5 5 4 5 5 5 6 5 5 111 4 5 3 5 5 5 5 5 4 4 5 5 2 6 4 112 5 5 5 5 2 5 5 5 6 6 4 5 6 5 4 113 5 5 5 6 1 5 5 5 4 6 5 5 6 6 5 114 5 5 5 6 1 * 4 5 4 6 5 5 5 6 5 115 5 5 5 6 1 * * 5 4 6 5 5 5 6 5 116 5 4 5 4 1 4 4 5 5 6 5 4 5 5 5 117 5 4 5 5 5 5 5 5 5 6 5 4 5 6 3 118 2 2 2 2 2 2 2 2 2 1 5 5 5 4 119 2 2 2 4 2 3 2 2 4 4 * 4 5 4 120 5 2 3 2 1 2 1 2 2 1 121 5 2 3 4 3 5 5 4 5 121a 2 2 5 5 3 122 5 2 2 5 5 3 5 5 5 5 4 5 5 5 4 123 6 2 2 5 2 5 5 5 5 6 4 5 6 5 3 124 5 2 2 5 5 5 5 5 5 6 4 5 5 5 4 125 5 5 5 5 5 5 5 5 5 6 6 5 5 6 5 126 5 4 5 5 4 5 5 5 5 6 5 5 5 5 4 127 5 2 3 5 5 5 4 5 4 6 4 5 5 4 4 128 2 4 3 4 2 4 2 5 2 5 3 5 5 2 129 3 2 3 3 1 4 3 2 3 5 130 3 2 5 3 1 3 4 2 3 2 2 2 1 3 4 131 5 5 6 5 4 131 5 5 5 5 6 5 5 5 5 5 5 5 6 6 5 132 2 2 2 2 2 2 2 2 2 3 2 2 2 4 3 133 3 4 3 4 3 4 4 2 3 4 2 3 2 3 2 134 5 5 5 5 6 5 5 5 4 5 5 5 5 5 5 135 5 5 5 5 * 5 5 5 5 5 5 6 6 6 2 136 5 5 5 5 4 4 4 5 4 6 4 5 5 6 5

EMMA
Test Results PRAGUE DLR
Save date: 2006-06-02 Public Page 79 File Name: D631_Results-PRG_V1.0.doc Version: 1.0
VA-Id. C1 C2 C3 C4 C5 C6 C7 C8 C9 C10 C11 C12 C13 C14 C15
137 5 4 5 5 5 5 * 4 5 4 5 5 3 138 2 2 2 5 2 2 2 2 3 2 2 2 4 2 139 5 4 5 5 4 5 4 5 4 6 4 5 5 4 5 140 5 5 5 5 6 5 5 5 5 6 3 5 3 5 5 141 5 5 5 5 6 5 5 5 5 6 3 5 3 5 5 142 2 2 2 2 2 2 2 2 2 2 3 2 5 5 2 143 5 4 4 4 5 4 5 5 5 5 3 5 5 5 5 144 5 4 3 4 5 4 * 5 5 5 1 5 5 5 5
Table 4-2: Debriefing Questionnaire Raw Data (Field Trials)
A one-sample t-test has been applied to prove the data for their statistical significance for all 144items. • One-Sample T-Test • Expected mean value = 3,5 • Answers from 1 (disagreement) through 6 (agreement) • N = 15 • α = 0.05 • p-value is single-sided because of the use of a directed hypothesis
Results referring the “operational feasibility” items are reported with sections 4.2.1.1 “General”, 4.2.1.2 “Surveillance”, 4.2.1.3 “Control”, 4.2.1.4 “HMI”, and 4.2.1.5 “Procedures”. Results to the “operational improvement” items can be found in section 4.3.1.
A star (*) with the p-value means that a item has been answered significantly because the p-value is equal or less than the critical error probability α, which is 0.05. Additionally, such items are coloured green.
When the controllers significantly express their acceptance to a single service or procedure item, it can be assumed that the operational feasibility is proven for this area of interest.
Items written in italics could not be answered meaningfully because the controllers had limited or no operational experience with the topic (e.g. except in the case of lit stop bar crossing, no system alerts have been used operationally by the ATCOs). When controller comments were given to an item, they are reported directly below the statement.
In addition to that, the sources of each item are reported. Sources are requirements or procedures reported in the ORD [10] and TRD [17].
4.2.1.1 General VA-Id. Questionnaire Item N Mean SD p
78 I used the A-SMGCS frequently. 15 5,3 0,6 0,00* Comment by ATCO E: During LVP operated
80 The A-SMGCS is highly relevant for my work. 15 5,0 0,7 0,00*82 I feel very confident using the A-SMGCS. 15 4,9 0,6 0,00*85 Under visibility 1 / good visibility conditions A-SMGCS provides no
additional information. 15 2,9 1,2 0,08
Comment by ATCO C: … but I still use it.

EMMA
Test Results PRAGUE DLR
Save date: 2006-06-02 Public Page 80 File Name: D631_Results-PRG_V1.0.doc Version: 1.0
86 It is helpful to use A-SMGCS when visual reference is impaired 15 5,1 0,8 0,00*87 I find the A-SMGCS unnecessarily complex. 15 2,4 1,1 0,00*95 The A-SMGCS display gives me information which I missed before. 15 5,0 1,1 0,00*117 I experienced the level of safety by using the A-SMGCS as very high. 15 4,9 0,7 0,00* Comment by ATCO O: Slightly disagree. I am especially referring to the indication of blocked RWY. The mouse is
not always at hand’s reach and, especially in busy hours, it is difficult to operate this function. It’s happened often that we executed DEP/ARR without switching off the indication.
135 The A-SMGCS display makes it easier to detect potentially problematic situations.
14 5,0 1,0 0,00*
140 It is easy to learn to work with A-SMGCS. 15 4,9 0,8 0,00*141 I would imagine that most operational personnel would learn to use A-
SMGCS very quickly. 15 4,9 0,8 0,00*
142 I needed to learn a lot of things before I could get going with the A-SMGCS.
15 2,5 1,1 0,00*
143 There was enough training on the display, its rules, and its mechanisms. 15 4,6 0,6 0,00*144 There was enough training on how to control traffic with the use of the
A-SMGCS. 14 4,4 1,2 0,02*
Comment by ATCO C: It was really easy for me; I needn’t any special training on. Comment by ATCO G: There was none, do we need any?
Table 4-3: Debriefing Questionnaire – Means, SD, and P-Value for “General” operational feasibility items
4.2.1.2 Surveillance VA-Id. Questionnaire Item ORD / HMI TRD N Mean SD p
1 When visual reference is not possible, the displayed position of the aircraft in the runway sensitive area is accurate enough to exercise control in a safe and efficient way.
OP_Perf-05 OP_Serv-11
Tech_Surv_26
15 5,1 0,5 0,00*
2 When visual reference is not possible, the displayed position of vehicles in the runway sensitive area is accurate enough to exercise control in a safe and efficient way.
OP_Perf-05 OP_Serv-11
Tech_Surv_26
15 4,7 0,9 0,00*
3 When visual reference is not possible, the displayed position of the aircraft on the taxiways is accurate enough to exercise control in a safe and efficient way.
OP_Perf-05 OP_Serv-11
Tech_Surv_26
15 5,4 0,5 0,00*
4 When visual reference is not possible, a missing label is not a problem to exercise control in a safe and efficient way.
OP_Serv-04 OP_Perf-12 OP_Perf-11
Tech_Gen_28 Tech_Surv_03
15 2,9 1,1 0,07
5 When visual reference is not OP_Serv-11 Tech_Gen_28 14 3,4 1,3 0,85
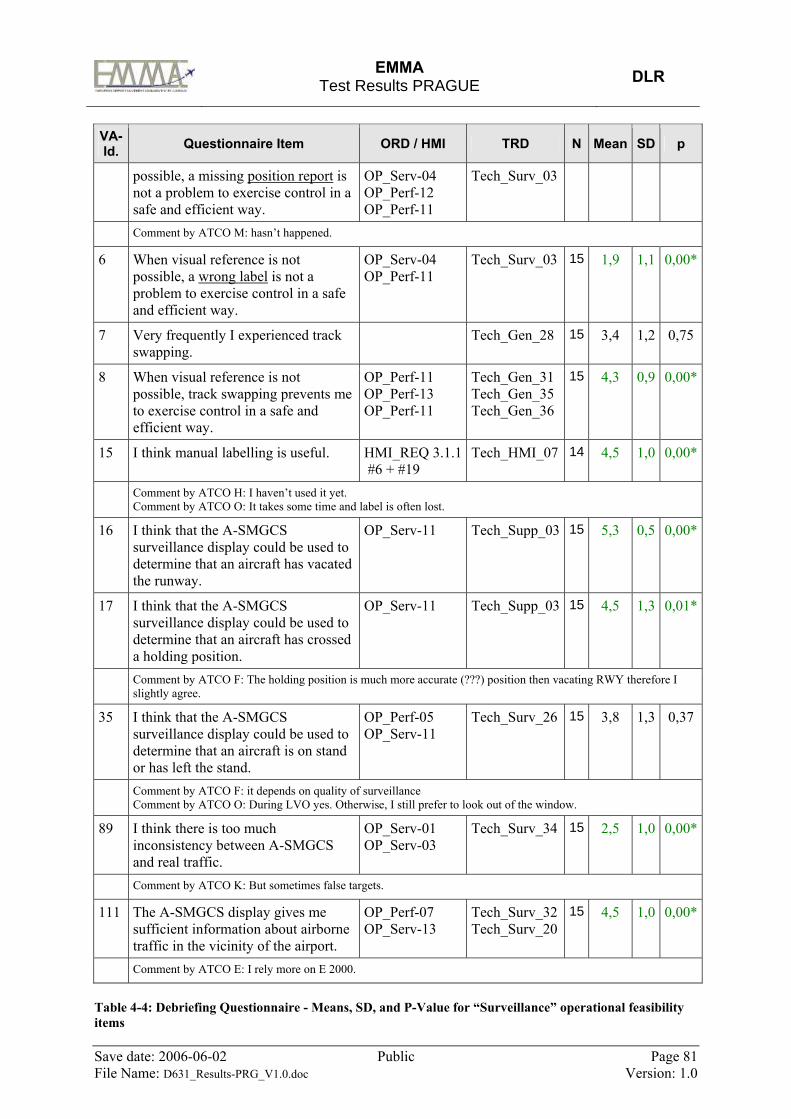
EMMA
Test Results PRAGUE DLR
Save date: 2006-06-02 Public Page 81 File Name: D631_Results-PRG_V1.0.doc Version: 1.0
VA-Id. Questionnaire Item ORD / HMI TRD N Mean SD p
possible, a missing position report is not a problem to exercise control in a safe and efficient way.
OP_Serv-04 OP_Perf-12 OP_Perf-11
Tech_Surv_03
Comment by ATCO M: hasn’t happened.
6 When visual reference is not possible, a wrong label is not a problem to exercise control in a safe and efficient way.
OP_Serv-04 OP_Perf-11
Tech_Surv_03 15 1,9 1,1 0,00*
7 Very frequently I experienced track swapping.
Tech_Gen_28 15 3,4 1,2 0,75
8 When visual reference is not possible, track swapping prevents me to exercise control in a safe and efficient way.
OP_Perf-11 OP_Perf-13 OP_Perf-11
Tech_Gen_31 Tech_Gen_35 Tech_Gen_36
15 4,3 0,9 0,00*
15 I think manual labelling is useful. HMI_REQ 3.1.1 #6 + #19
Tech_HMI_07 14 4,5 1,0 0,00*
Comment by ATCO H: I haven’t used it yet. Comment by ATCO O: It takes some time and label is often lost.
16 I think that the A-SMGCS surveillance display could be used to determine that an aircraft has vacated the runway.
OP_Serv-11 Tech_Supp_03
15 5,3 0,5 0,00*
17 I think that the A-SMGCS surveillance display could be used to determine that an aircraft has crossed a holding position.
OP_Serv-11 Tech_Supp_03
15 4,5 1,3 0,01*
Comment by ATCO F: The holding position is much more accurate (???) position then vacating RWY therefore I slightly agree.
35 I think that the A-SMGCS surveillance display could be used to determine that an aircraft is on stand or has left the stand.
OP_Perf-05 OP_Serv-11
Tech_Surv_26
15 3,8 1,3 0,37
Comment by ATCO F: it depends on quality of surveillance Comment by ATCO O: During LVO yes. Otherwise, I still prefer to look out of the window.
89 I think there is too much inconsistency between A-SMGCS and real traffic.
OP_Serv-01 OP_Serv-03
Tech_Surv_34 15 2,5 1,0 0,00*
Comment by ATCO K: But sometimes false targets.
111 The A-SMGCS display gives me sufficient information about airborne traffic in the vicinity of the airport.
OP_Perf-07 OP_Serv-13
Tech_Surv_32 Tech_Surv_20
15 4,5 1,0 0,00*
Comment by ATCO E: I rely more on E 2000.
Table 4-4: Debriefing Questionnaire - Means, SD, and P-Value for “Surveillance” operational feasibility items

EMMA
Test Results PRAGUE DLR
Save date: 2006-06-02 Public Page 82 File Name: D631_Results-PRG_V1.0.doc Version: 1.0
4.2.1.3 Control VA-Id. Questionnaire Item ORD TRD N Mean SD p
25 A-SMGCS helps to issue traffic information.
Tech_Surv_05 Tech_Gen_02
15 5,1 1,0 0,00*
26 A-SMGCS makes it easier to detect pilot errors.
Tech_Surv_05
15 5,2 0,8 0,00*
27 When visual reference is not possible, A-SMGCS facilitates to give traffic information to pilots so that they can avoid other traffic.
OP_Perf-5
Tech_Surv_26 Tech_Gen_02
15 4,9 0,5 0,00*
40 A-SMGCS display gives me better means to expedite or slow down an aircraft’s taxi speed.
Tech_Surv_28 15 4,1 1,2 0,06
Comment by ATCO D: I don’t do it very often without (with) A-SMGCS.
64 Information alerts are often popping up too late to solve the situation before an alarm comes up.
Tech_Cont_13
7 3,0 1,2 0,30
Comment by ATCO L: In test – not used in real traffic.
65 Too many unnecessary information alerts were popping up.
Op_Perf-20 Tech_Cont_08 Tech_HMI_15
7 3,4 1,4 0,90
Comment by ATCO L: In test – not used in real traffic. Comment by ATCO O: in case of false targets.
66 I think that all Runway Incursion Alerts are triggered at the right moment.
Op_Perf-20 Tech_Cont_13 7 4,1 1,2 0,21
Comment by ATCO L: In test – not used in real traffic.
67 I think that a Runway Incursion monitoring alert function helps me to react in an expeditious and safe manner.
OP_Serv-16 Tech_Cont_13 Tech_Cont_03
8 4,4 1,3 0,10
Comment by ATCO K: The problem is that A-SMGCS display is not the ATCO’s primary display. Comment by ATCO L: In test – not used in real traffic.
68 I experienced too many false alerts to work in a safe and efficient way.
OP_Perf-20OP_Perf-21
Tech_Cont_12
8 3,1 0,8 0,24
Comment by ATCO L: In test – not used in real traffic.
69 There were cases where an alarm was missing.
Tech_Cont_02
8 2,9 1,4 0,23
Comment by ATCO L: In test – not used in real traffic.
77 Issuing clearances to aircraft is supported well by the A-SMGCS.
OP_Serv-14 Tech_Gen_02 15 4,5 1,0 0,00*
79 The information displayed in the A-SMGCS is helpful for avoiding conflicts.
OP_Serv-21OP_Serv-30OP_DS-6
Tech_Surv_05 15 5,1 0,7 0,00*
123 The A-SMGCS enables me to provide the OP_Serv-14 Tech_Gen_02 15 4,4 1,5 0,03*

EMMA
Test Results PRAGUE DLR
Save date: 2006-06-02 Public Page 83 File Name: D631_Results-PRG_V1.0.doc Version: 1.0
VA-Id. Questionnaire Item ORD TRD N Mean SD p
pilots a better level of service.
Comment by ATCO E: Not in normal condition. Within LVP traffic information are given.
Table 4-5: Debriefing Questionnaire - Means, SD, and P-Value for “Control” operational feasibility items
4.2.1.4 HMI
VA-Id. Questionnaire Item D135_ORD
D136_HMI N Mean SD p
75 The A-SMGCS provides the right information at the right time.
Op_Serv-30 15 5,1 0,6 0,00*
81 Improvements in the A-SMGCS display would be desirable.
15 3,7 1,0 0,36
83 The display enables to recognize a degrading accuracy of surveillance.
13 3,6 1,2 0,73
84 The display layout is easy to customize to my own preferences.
REQ 3.1.1 #2 + #18
15 4,7 0,7 0,00*
88 I think the A-SMGCS is easy to use. Op_If-1 15 4,9 0,7 0,00*90 I find the A-SMGCS very difficult to use. Op_If-1 15 1,9 1,0 0,00*91 The use of the different windows on the A-SMGCS
display is clear to me. Op_If-1 15 4,8 0,6 0,00*
92 Too much interaction with the A-SMGCS is needed. Op_If-1 15 2,9 0,8 0,01*93 The A-SMGCS display is easy to understand. Op_If-1 15 5,0 0,4 0,00*94 The A-SMGCS display provides an active, involved
role for me. Op_If-1 15 4,7 0,6 0,00*
96 Information is conveniently arranged in the A-SMGCS display.
Op_If-1 15 4,7 0,5 0,00*
97 The amount of information in the A-SMGCS display is not too large.
Op_If-1 15 4,4 1,2 0,01*
98 Symbols can easily be read under different angles of view in the A-SMGCS display.
Op_If-1 15 5,1 0,6 0,00*
99 Labels, signs, and symbols in the A-SMGCS display are easy to interpret.
REQ 3.1.1 #15 + #16 + #17 REQ 3.2.4# 4 Op_If-1
15 5,0 0,5 0,00*
100 The height and width of characters in the A-SMGCS display is sufficient.
Op_If-1 15 5,0 0,7 0,00*
101 The A-SMGCS display layout in general should not be changed.
Op_If-1 15 4,5 1,1 0,00*

EMMA
Test Results PRAGUE DLR
Save date: 2006-06-02 Public Page 84 File Name: D631_Results-PRG_V1.0.doc Version: 1.0
VA-Id. Questionnaire Item D135_ORD
D136_HMI N Mean SD p
102 The A-SMGCS display size is appropriate for daily work.
Op_If-1 15 5,1 0,5 0,00*
103 All text in the display is easy to read. Op_If-1 15 4,7 1,0 0,00* Comment by ATCO E: ARR + DEP windows are difficult to read (not often used in real traffic).
Comment by ATCO G: When yellow (?) alert is on the colour of box and text inside the box is not very well combined,
104 There is too much information in the A-SMGCS display which is not needed.
Op_If-1 15 2,5 0,7 0,00*
Comment by ATCO E: Can be set up at personal feelings.
105 Some relevant information is frequently missing in the A-SMGCS display.
Op_If-1 15 2,7 1,3 0,03*
Comment by ATCO D: Labels on the end of screen. Comment by ATCO G: Designation of temporary maps window, when you open the window you don’t know which of the maps is used. Comment by ATCO K: Departing aircraft in DEP window Comment by ATCO L: Some missing aircraft in departure list while aircraft is ready to go -> manual labelling impossible.
106 The display colours chosen in the A-SMGCS display are appropriate.
REQ 3.1.1#13 Op_If-1
15 4,9 0,5 0,00*
107 Pop-up windows appear at the expected place and size. Op_If-1 15 4,1 1,4 0,15 Comment by ATCO K: Pop-up window referring to time to threshold is not visible in certain situations (THD (?) is
close to window edge). Comment by ATCO O: When RWY 13 is in use (not often) -> when a pop-up window (arrival) appears, it hides a label of departure that holds short of RWY 13 on RWY 24. It is necessary to open secondary window to get the information.
108 The windows on the A-SMGCS display are conveniently arranged.
Op_If-1 14 4,6 0,7 0,00*
Comment by ATCO O: (except for the pop-up window of arrival on RWY 13 – see item 107)
109 Aircraft that should have been visible are sometimes obscured by pop-up windows.
REQ 3.1.1 #14
15 3,5 1,1 0,91
Comment by ATCO O: (except for the pop-up window of arrival on RWY 13 – see item 107)
110 The contrast between the windows and their background is sufficient.
15 5,0 0,4 0,00*
130 The A-SMGCS display is detracting too much attention.
Op_If-1 15 2,7 1,1 0,01*
Comment by ATCO O: not the display itself; it is sometimes forgotten to operate the function of blocked RWY, especially in heavy traffic (we are used to a different indication) and it can lead to a situation when reality is different from what is indicated on display.
131 The A-SMGCS display helps to have a better understanding of the situation.
REQ 3.1.1 #9 + #15
5 5,0 0,7 0,01*
132 Important events on the A-SMGCS were difficult to recognize.
REQ 3.1.1 #13 + #14 + #17 + #23 + #27 Op_If-1
15 2,3 0,6 0,00*
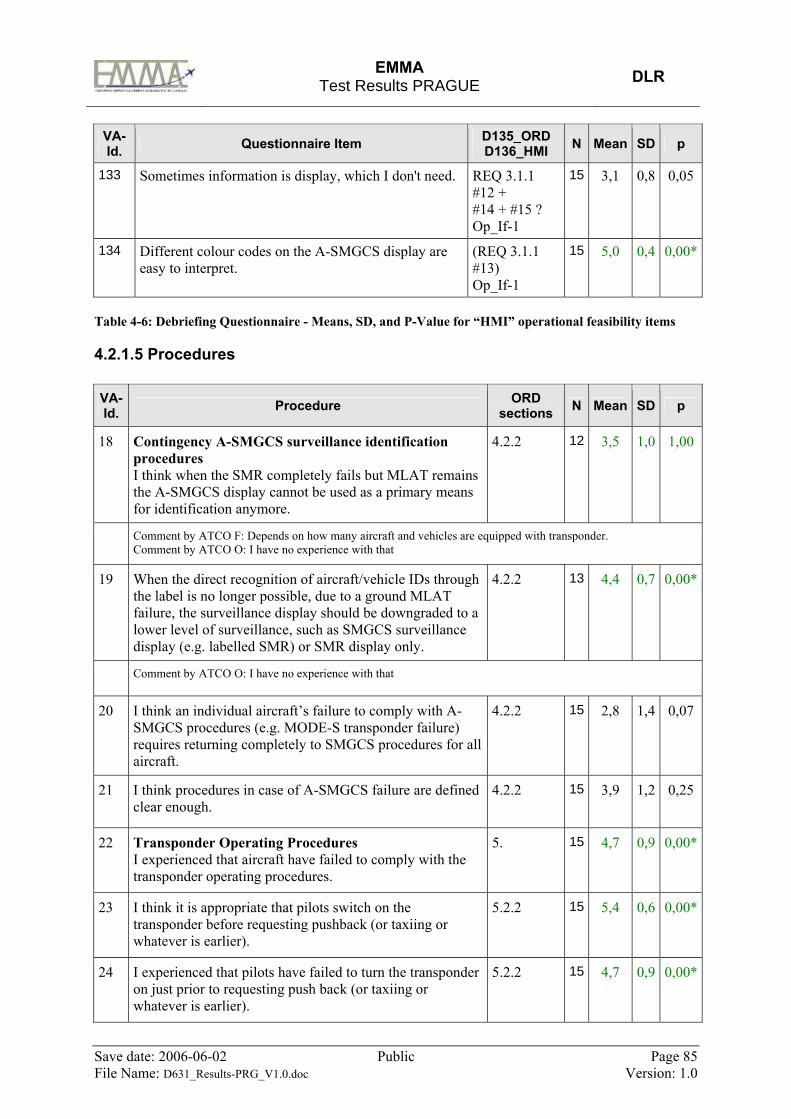
EMMA
Test Results PRAGUE DLR
Save date: 2006-06-02 Public Page 85 File Name: D631_Results-PRG_V1.0.doc Version: 1.0
VA-Id. Questionnaire Item D135_ORD
D136_HMI N Mean SD p
133 Sometimes information is display, which I don't need. REQ 3.1.1 #12 + #14 + #15 ? Op_If-1
15 3,1 0,8 0,05
134 Different colour codes on the A-SMGCS display are easy to interpret.
(REQ 3.1.1 #13) Op_If-1
15 5,0 0,4 0,00*
Table 4-6: Debriefing Questionnaire - Means, SD, and P-Value for “HMI” operational feasibility items
4.2.1.5 Procedures VA-Id. Procedure ORD
sections N Mean SD p
18 Contingency A-SMGCS surveillance identification procedures I think when the SMR completely fails but MLAT remains the A-SMGCS display cannot be used as a primary means for identification anymore.
4.2.2 12 3,5 1,0 1,00
Comment by ATCO F: Depends on how many aircraft and vehicles are equipped with transponder. Comment by ATCO O: I have no experience with that
19 When the direct recognition of aircraft/vehicle IDs through the label is no longer possible, due to a ground MLAT failure, the surveillance display should be downgraded to a lower level of surveillance, such as SMGCS surveillance display (e.g. labelled SMR) or SMR display only.
4.2.2 13 4,4 0,7 0,00*
Comment by ATCO O: I have no experience with that
20 I think an individual aircraft’s failure to comply with A-SMGCS procedures (e.g. MODE-S transponder failure) requires returning completely to SMGCS procedures for all aircraft.
4.2.2 15 2,8 1,4 0,07
21 I think procedures in case of A-SMGCS failure are defined clear enough.
4.2.2 15 3,9 1,2 0,25
22 Transponder Operating Procedures I experienced that aircraft have failed to comply with the transponder operating procedures.
5. 15 4,7 0,9 0,00*
23 I think it is appropriate that pilots switch on the transponder before requesting pushback (or taxiing or whatever is earlier).
5.2.2 15 5,4 0,6 0,00*
24 I experienced that pilots have failed to turn the transponder on just prior to requesting push back (or taxiing or whatever is earlier).
5.2.2 15 4,7 0,9 0,00*

EMMA
Test Results PRAGUE DLR
Save date: 2006-06-02 Public Page 86 File Name: D631_Results-PRG_V1.0.doc Version: 1.0
30 Start-Up clearance delivery The A-SMGCS surveillance display enables me to establish a more efficient start-up sequence in visibility 1 conditions.
8.1.2
14 2,8 1,3 0,06
Comment by ATCO G: There is no such description in the system.
31 The A-SMGCS surveillance display enables me to establish a more efficient start-up sequence in visibility 2 conditions.
8.1.2
14 2,8 1,1 0,03*
Comment by ATCO G: There is no such description in the system.
32 The A-SMGCS surveillance display enables me to establish a more efficient start-up sequence in visibility 3 conditions.
8.1.2
14 3,0 1,4 0,19
Comment by ATCO G: There is no such description in the system.
33 Push-back clearances When gates are not visible push-back clearances based on A-SMGCS traffic information can be given in a safe way.
8.1.3.2 15 4,2 0,8 0,00*
34 I think that traffic information on the A-SMGCS surveillance display helps me to decide whether a push-back clearance should be delayed.
8.1.3 15 4,1 0,8 0,02*
36 Taxi clearances I can rely on A-SMGCS when giving taxi clearances even when visual reference is not possible.
8.1.4.2 15 4,9 0,7 0,00*
Comment by ATCO K: slightly disagree due to false targets
37 Longitudinal spacing on taxiways is easier to survey with A-SMGCS even when visual reference is not possible.
15 4,9 0,6 0,00*
38 When visual reference is not possible I think longitudinal spacing on taxiways can be reduced with A-SMGCS.
15 4,7 1,3 0,00*
Comment by ATCO L: … if approved by our authority, it would be great.
44 Taxiing on the runway ICAO doc 4444 states that for the purpose of expediting air traffic, aircraft may be permitted to taxi on the runway-in-use. I think the use of A-SMGCS could allow this even when visual reference is not possible.
8.1.7.2 15 4,5 1,4 0,02*
48 Line-up procedures When an intersection is not visible, line-up from this intersection could be applied in a safe way when using A-SMGCS.
8.1.8.2.2 15 5,1 0,5 0,00*
49 I think it could practicable to make multiple line-ups using A-SMGCS when visual reference is not possible.
8.1.8.3.1.2 15 4,0 1,7 0,28

EMMA
Test Results PRAGUE DLR
Save date: 2006-06-02 Public Page 87 File Name: D631_Results-PRG_V1.0.doc Version: 1.0
Comment by ATCO G: Multiple line-ups when no visual are nonsense. Comment by ATCO L: … if approved by our authority, it would be great.
54 Take-off clearance I think that the A-SMGCS surveillance display could be used to determine when to issue a take-off clearance.
8.1.9 15 4,5 1,4 0,02*
55 Landing clearances When visual reference is not possible I think the A-SMGCS surveillance display can be used to determine if the runway is cleared to issue a landing clearance.
8.1.10.2 15 5,3 0,6 0,00*
56 Conditional clearances Under good visibility conditions I think A-SMGCS surveillance data helps me to give conditional clearances in a safe and efficient way.
8.1.11 15 4,0 1,6 0,23
Comment by ATCO O: Not only the A-SMGCS.
57 When visual reference is not possible, I think A-SMGCS surveillance data helps me to give conditional clearances in a safe and efficient way.
8.1.11 8.1.11.2
15 4,1 1,5 0,13
Comment by ATCO G: When no visual reference = no conditional clearances Comment by ATCO O: Not only the A-SMGCS.
60 Visibility Transition With A-SMGCS, it would make sense to redefine the visibility limits for the transition to low visibility operations. (if yes, please indicate your suggestions)
6. 12 2,3 0,9 0,00*
Comment by ATCO C: The time between arrivals and departures would be shorter, we shouldn’t wait for “runway vacated” report, and the distance between two arrivals could be shorter. Comment by ATCO F: In a process to redefine visibility limits is A-SMGCS ok only one part. Comment by ATCO G: Visibility limits are for pilots.
63 A-SMGCS level 2 procedures I think A-SMGCS can help me to detect lit stop bar crossings.
8.2 14 4,9 0,7 0,00*
63a I think A-SMGCS can help me to detect runway incursions.
70 A-SMGCS level I & II phraseology Existing phraseology can be maintained without change while using A-SMGCS.
7. 7.1.3
14 4,7 0,6 0,00*
71 I have experienced situations where existing phraseology should have been changed while using A-SMGCS.
7.1.3 12.1.
14 2,8 1,2 0,04*
Comment by ATCO F: e.g. squawk assigned code – some pilots do not understand
Table 4-7: Debriefing Questionnaire - Means, SD, and P-Value for “Procedure” operational feasibility items

EMMA
Test Results PRAGUE DLR
Save date: 2006-06-02 Public Page 88 File Name: D631_Results-PRG_V1.0.doc Version: 1.0
4.2.2 Long Term Alerting Performance Assessment The objective of this test was to assess the operational feasibility of the alerting function. Technically the function’s performance has been verified (cf. 2.3.12, 2.3.13, and 2.3.14) but the controllers’ acceptance has not been assessed in the field. For this purpose the monitoring and alerting function was switched on at the active CWP for more than two weeks in January 2006. But, the service was not used fully operational16 but only used to be monitored by controllers in case of a conflict situation. To assess the operational performance the controllers were requested to report each conflict situation and to compare it with the alerts shown on the A-SMGCS display. They were requested to report the date and UTC and to assess whether the alert was right (wanted), false (due to a false target), unwanted, or missed. Information (stage 1) alerts was not assessed to reduce the additional workload of the controller. The reporting sheet was developed with support of an ANS_CR controller and translated to Czech language to get easier the controllers’ acceptance to perform this additional work. Following template has been given to the controller:
Date UTC Stage 2 alert (red) false unwanted missed too early right too late
Instructions: The objective of this sheet of paper is to assess the performance of the A-SMGCS alerting function and to adapt it to your needs. For this purpose, we need your operational feedback. Therefore, it is very important that you monitor all alerts on your A-SMGCS display the whole time you are working with it. There are two stages of alerts. The stage 1 alert (amber) intends to attract your attention on a traffic situation that is potentially dangerous, e.g. two aircraft on the runway, one is lining up while another one is just vacating. The stage two alert (red) would require an immediate reaction by you to solve a actual conflict situation. You are questioned to red alerts only. If you see such red stage 2 alerts on your A-SMGCS display you are kindly requested to give your personal assessment to it. If the alert is wanted by you, you should assess if the alert was too early, right in time, or too late to help you in the best way. If an alert is raised due to a false surveillance target, please make a cross with false. If an alert is raised although there is no conflict situation that would need your special attention, make a cross with unwanted. Last, if you are confronted with a real conflict situation but the system did not raise an alert or information, make a cross with missed. Do not forget to note the Date and UTC time. If you find time we would really appreciated if you write some explanations to the experienced conflict situation, e.g. CSA456 landed on RWY24 but missed exit C and was still at the runway when following
16 With visibility conditions lower than 3000m, the service had to be switched off.

EMMA
Test Results PRAGUE DLR
Save date: 2006-06-02 Public Page 89 File Name: D631_Results-PRG_V1.0.doc Version: 1.0
landing CSA3267 was 30 seconds from threshold. This will help us additionally to tune the system alerts to your operational needs. Thank You for your collaboration. Concluding Results
As it happened, the template could not been filled out by the controllers. This was caused by several reasons: First, the controller did not accept the additional workload or simply forgot to report an observed conflict situation. Secondly, the A-SMGCS display is not the primary display that is observed by the TEC but the E2000. Alerts that are displayed on the A-SMGCS display are not supported by an audible signal and thus could easily miss the controller’s attention.
Concluding, no results were gained with this test.
4.2.3 Flight Tests - Case Studies for Testing the Alert Performance of “Crossing Runway Alerts” These trials were performed on five days during the field trials (cf. the protocols with section 4.2.3). Each trial lasted approximately one hour with five to 12 conflict situations.
Case studies mean that during the regular traffic (at times of very less traffic amount) test vehicle or test aircraft cause safety critical scenarios to issue system alerts. The controllers who actively controlled the traffic were presented with these alerts and were asked afterwards for their views on the operational feasibility. The detailed conflict scenarios can be seen in the annex 6.1.
Four different runway crossing scenarios have been tested: • departure – departure, • departure – arrival, • departure – crossing, and • approach – approach conflicts
The first three departure conflicts could be tested by using a test car and the regular approaching or departing traffic. For the tests of the approach – approach conflicts, test aircraft had to be used. There were two CAA aircraft, a BE 400 and an L 410.
The following test protocols (4.2.3.1) give a complete report of these case studies, whereas section 4.2.3.2 summarises the results.
4.2.3.1 Raw Data – Flight Tests Protocols Date: 2006-01-17 Test Run Number: 1 Name: Tykal / Jakobi Active vs. Shadow Mode Shadow Mode
General Comments / Conditions: • Test car and regular traffic were used • Alerts were observed at the test bed Tower platform on the EMMA A-SMGCS by a former
ANS_CR controller
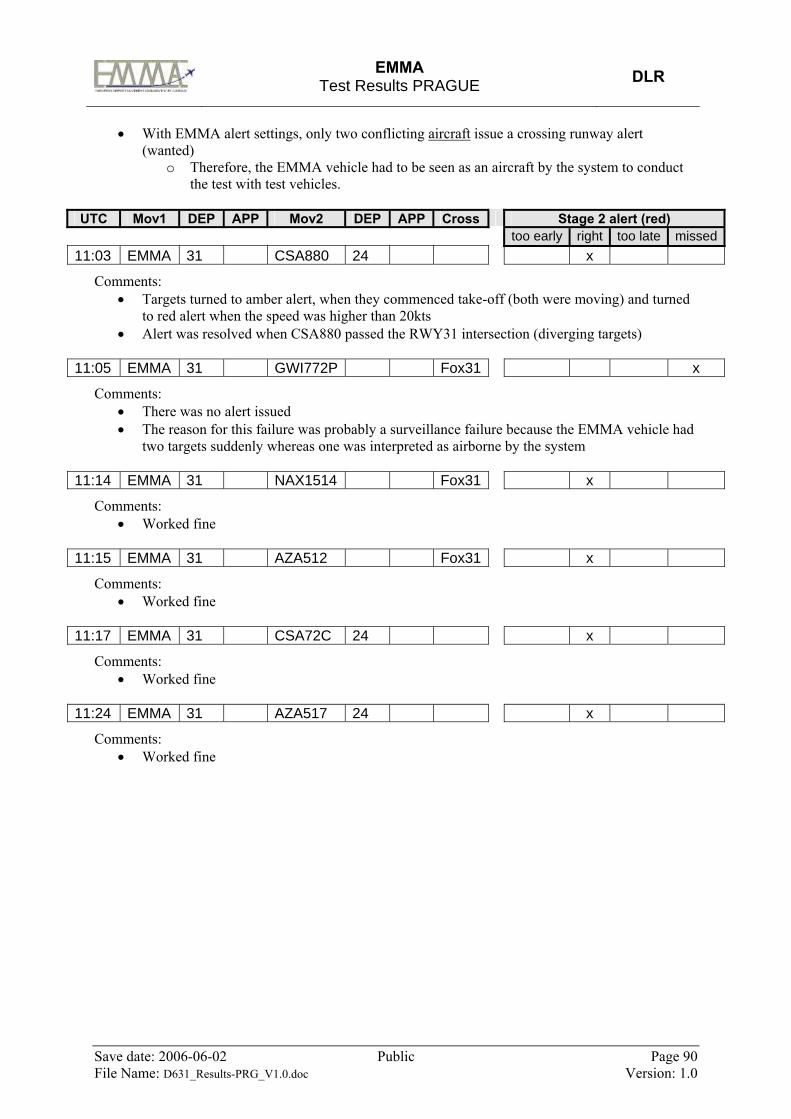
EMMA
Test Results PRAGUE DLR
Save date: 2006-06-02 Public Page 90 File Name: D631_Results-PRG_V1.0.doc Version: 1.0
• With EMMA alert settings, only two conflicting aircraft issue a crossing runway alert (wanted)
o Therefore, the EMMA vehicle had to be seen as an aircraft by the system to conduct the test with test vehicles.
UTC Mov1 DEP APP Mov2 DEP APP Cross Stage 2 alert (red)
too early right too late missed11:03 EMMA 31 CSA880 24 x
Comments: • Targets turned to amber alert, when they commenced take-off (both were moving) and turned
to red alert when the speed was higher than 20kts • Alert was resolved when CSA880 passed the RWY31 intersection (diverging targets)
11:05 EMMA 31 GWI772P Fox31 x
Comments: • There was no alert issued • The reason for this failure was probably a surveillance failure because the EMMA vehicle had
two targets suddenly whereas one was interpreted as airborne by the system
11:14 EMMA 31 NAX1514 Fox31 x
Comments: • Worked fine
11:15 EMMA 31 AZA512 Fox31 x
Comments: • Worked fine
11:17 EMMA 31 CSA72C 24 x
Comments: • Worked fine
11:24 EMMA 31 AZA517 24 x
Comments: • Worked fine

EMMA
Test Results PRAGUE DLR
Save date: 2006-06-02 Public Page 91 File Name: D631_Results-PRG_V1.0.doc Version: 1.0
Date: 2006-01-18 Test Run Number: 2 Name: Tykal / Jakobi Active vs. Shadow Mode Active
General Comments / Conditions: • EMMA A-SMGCS was running now on the real TPC CWP – other CWP run with the
commercial A-SMGCS • EMMA vehicle had a permanent speed between 40 and 55 kts • EMMA vehicle was defined again as a departure aircraft within the system.
UTC Mov1 DEP APP Mov2 DEP APP Cross Stage 2 alert (red)
too early right too late missed11:09 EMMA 31 CSA2KL 24 B x
Comments: • When EMMA started and speed was higher than 20kts amber stage 1 alert arose for 2 second
that was substituted by a stage 2 alert
11:13 EMMA 31 AZA517 24 x
Comments: • When EMMA started and speed was higher than 20kts amber stage 1 alert arose for 2 second
that was substituted by a stage 2 alert
11:17 EMMA 31 CSA72C 24 x
Comments: • Worked fine
11:21 EMMA 31 CSA28W 24 B x
Comments: • Worked fine
11:27 EMMA 31 DLH94X 24
Comments: • Invalid: problems with snow ploughs on RWY 22 that worked within the sensitivity area of
RWY31 and caused a stage 2 alert with the “EMMA” vehicle
11:32 EMMA 31 NJE983Q 24 x
Comments: • EMMA started moving when NJE983Q was 75 sec away from threshold • Stage 1 alert – off –stage 1 alert – stage 2 alert when aircraft was less than 30 seconds away
from threshold • Probably, flight test with real aircraft that have higher speeds and a constant deceleration and
not a constant speed as the test car
11:34 EMMA 31 AZA512 24 x
Comments: • Worked fine, even when alert varied from stage 1 to off and to stage 2 again

EMMA
Test Results PRAGUE DLR
Save date: 2006-06-02 Public Page 92 File Name: D631_Results-PRG_V1.0.doc Version: 1.0
11:43 EMMA 31 CSA961 24 x
Comments: • Stage 1 until CSA 961 was less than 30sec away from threshold when it stage 1 switched to
stage 2 • When speed of the car was lower than 20kts alert was cancelled
11:48 EMMA 31 EXS195 Fox31 x 11:48 EMMA 31 CSA790 24 x
Comments: • EMMA vehicle departure + Crossing + Departure 24 at the same time • Both alerts worked well – all 3 labels were red (stage 2 alert)
11:52 EMMA 31 SAS1767 24 x
Comments: • Worked fine, even when alert varied from stage 1 to stage 2 when SAS1767 was 45 sec away
from threshold

EMMA
Test Results PRAGUE DLR
Save date: 2006-06-02 Public Page 93 File Name: D631_Results-PRG_V1.0.doc Version: 1.0
Date: 2006-01-23 Test Run Number: 3 Name: Tykal / Jakobi Active vs. Shadow Mode Active
General Comments / Conditions: • Flight tests with two CAA test aircraft CBA40 (BE40) and CBA41 (L410) concentrated on
Approach – Approach conflicts exclusively, because this conflict could not be tested with test cars the week before
• CPA has been reduced by ANS_CR from 900 to 700 meter but TCPA increased from 75 to 80 seconds that stage alert arises appr. 45 seconds before threshold
• Alerts worked fine, but probably still to early – TCPA will be switched back to 75 sec for the next day
UTC Mov1 DEP APP Mov2 DEP APP Cross Stage 2 alert (red) too early right too late missed12:30 CBA40 24 CBA41 31 x
Comments: • Stage one alert with 60sec from threshold, stage 2 with 45 sec • CBA41 did a left turn, CBA40 an overshoot
12:43 CBA40 06 CBA41 31 x
Comments: • Stage 1 alert with 60sec but disappeared with 45 sec • Speed probably too low to meet TCPA
12:54 CBA40 24 CBA41 13 x
Comments: • Neither stage 1 nor stage 2 alert • CBA41 passed the crossing area when CBA41 was more than 700 meters away from this
crossing area
13:05 CBA40 24 CBA41 31 x
Comments: • Stage 1 with 75 to 60 sec, stage 2 from 60, 45, and 30 sec
13:12 OKLMR 31 PTACNIK 31 x
Comments: • Not planned but crossing stage 2 alert worked fine
13:16 CBA40 06 CBA41 31 x
Comments: • No stage 1 alert • Stage 2 alert after 60, 45, and 30 sec

EMMA
Test Results PRAGUE DLR
Save date: 2006-06-02 Public Page 94 File Name: D631_Results-PRG_V1.0.doc Version: 1.0
13:29 CBA40 24 CBA41 13 x
Comments: • Stage 1 and stage 2 alert started after 75 sec and changed several times from stage 1 to stage 2
and back • CBA40 landed and CBA41 flew a go-around by a right turn.

EMMA
Test Results PRAGUE DLR
Save date: 2006-06-02 Public Page 95 File Name: D631_Results-PRG_V1.0.doc Version: 1.0
Date: 2006-01-24 Test Run Number: 4 Observer: Tykal / Jakobi TPC –TEC: IS / ZH Active vs. Shadow Mode Active
General Comments / Conditions: o Same test scenario as the day before o TCPA has been tuned again:
o stage 1: 90 sec o Stage 2: 75 sec
UTC Mov1 DEP APP Mov2 DEP APP Cross Stage 2 alert (red)
too early right too late missed08:32 Squawk
3311 OKWDC 31 x
Comments: • Target – most probably a helicopter – turned around the north of RWY 24 • Alert recordings detected an “opposite traffic on the runway” conflict
12:17 CBA40 24 CBA41 31 x
Comments: • Neither stage 1 nor stage 2 alert • System calculates no point of closest approach closer than 700 m within 90 sec or that CBA41
achieves the crossing area within 120 sec (TTX = 120 sec) • Speed of CBA41 was very low (130kts) and too far away from threshold to initialize an alert
with the current alert settings • But alert or at least information is wanted.
12:29 CBA40 06 CBA41 31 x
Comments: • Stage 1 alert with 60 sec for CBA40 and 45 sec for CBA41 • After 2 seconds stage 2 alert with 60 sec for CBA40 and 45 sec for CBA41 away from
threshold.
12:39 CBA40 24 CBA41 13 x
Comments: • Stage 1 alert with 90 sec for CBA40 and 75 sec for CBA41 • Disappeared for 2 seconds but reappeared immediately • Stage 2 alert with 60 sec for CBA40 and 45 sec for CBA41 away from threshold.
12:48 CBA40 24 CBA41 31 x
Comments: • Stage 1 alert with 75 sec for CBA40 and 45 sec for CBA41 • Disappeared for 2 seconds but reappeared as stage 2 alert with 60 sec for CBA40 and 45 sec
for CBA41 away from threshold.

EMMA
Test Results PRAGUE DLR
Save date: 2006-06-02 Public Page 96 File Name: D631_Results-PRG_V1.0.doc Version: 1.0
UTC Mov1 DEP APP Mov2 DEP APP Cross Stage 2 alert (red)
too early right too late missed12:57 CBA40 06 CBA41 31 x
Comments: • 3315 helicopter has flown in the north of RWY24 and caused stage 2 alert with CBA41 when
CBA41 was >90 seconds away from threshold • Stage 1 alert with 75 sec for CBA40 and 60 sec for CBA41 • Switched back to stage2 alert with helicopter meanwhile CBA40 remained amber coloured
(stage 1) • Stage 2 alert with 60 sec for CBA40 and 45 sec for CBA41 away from threshold.
13:11 CBA40 24 CBA41 13 X
Comments: • Stage 1 alert with 45 sec for CBA40 and 60 sec for CBA41 • Stage 2 alert with 30 sec for CBA40 and 45 sec for CBA41 away from threshold.

EMMA
Test Results PRAGUE DLR
Save date: 2006-06-02 Public Page 97 File Name: D631_Results-PRG_V1.0.doc Version: 1.0
Date: 2006-01-25 Test Run Number: 5 Observer: Tykal / Jakobi TPC –TEC: Non- EMMA controller Active vs. Shadow Mode Active
General Comments / Conditions: • TCPA has seen tuned for stage 1 alert to get it earlier
o Stage1 TCPA is now 100 sec (yesterday 90 sec) • DEP – APP Conflicts are tested with a test vehicle to investigate the new settings from 10:00
to 11:00 • from 12:00 to 13:00 APP-APP conflicts are tested with the two CAA test aircraft
UTC Mov1 DEP APP Mov2 DEP APP Cross Stage 2 alert (red)
too early right too late missed10:06 EMMA 31 CSA505 31 x
Comments: • Stage 1 followed by a stage 2 alert
10:08 EMMA 31 CSA617 24 x
Comments: • 24 EMMA stated when arriving was very close to the 24 threshold • Stage 2 alert arose immediately when aircraft was 30 sec away from threshold.
10:13 EMMA 31 BAW 854 24 x
Comments: • Stage 2 alert but when speed Sid already braked on RWY24 • Vehicle went with constant 60kts which was too slow to meet CPA within TCPA.
10:15 EMMA 31 BAW854 31 X
Comments: • Stage 1 followed by a stage 2 alert.
10:19 EMMA 31 CLW9019 24 x
Comments: • EMMA vehicle now starts from RWY22 intersection • Stage 2 alert when CLW 45 seconds away.
10:21 EMMA 31 LOT523 24 x
Comments:
10:23 EMMA 31 CSA961 24 x
Comments: • Stage 1 alert with 45 sec away from threshold, followed by a stage 2 alert when CSA961 was
less than 45 seconds away from threshold.

EMMA
Test Results PRAGUE DLR
Save date: 2006-06-02 Public Page 98 File Name: D631_Results-PRG_V1.0.doc Version: 1.0
10:24 EMMA 31 LOT523 31 x 10:27 EMMA 31 DAT67F 24 x
Comments:
10:31 EZY5494 24 CSA842 13 UNWANTED
Comments: • Both aircraft started take-off at the same time but in different directions where they never
would meet • Stage 1 and stage 2 alert were popping up, even when the EZY5494 has passed RWY 31/13 • UNWANTED alert • Probably there is no CPA criteria but only speed (to be checked)
10:43 EMMA 31 KLM1352 24B x
Comments: • EMMA started late (after KLM has commenced its take-off) • But worked well – with 20kts stage 1 alert, with 40kts car speed stage 2 alert popped up.
10:45 EMMA 31 CSA916 24 x
Comments: • Departure alerts seems to be working fine and reliable • 20kts – stage 1; 40kts – stage 2
10:49 EMMA 31 CSA977 24 x
Comments: • Stage 1 with 45 sec and stage 2 below 45 sec
12:01 CSA962 13 CSA050 24B UNWANTED
Comments: • Simultaneous take-off but with diverging directions • UNWANTED alert
12:22 CBA40 24 CBA41 31 x
Comments: • Stage 1: CBA40 75 – CBA41 75 sec • Stage 2: CBA40 45 – CBA41 45 sec • This timing is absolutely wanted
12:24 EMMA 31 BMI88X 31 x
Comments: • EMMA vehicle, which is still seen as an aircraft by the system, taxied on RWY31 and caused
an alert (stage 2) with the crossing BMI88X.
12:33 CBA40 06 CBA41 31 x
Comments: • Stage 1: 90-60 sec • Stage 2: 75-30 sec
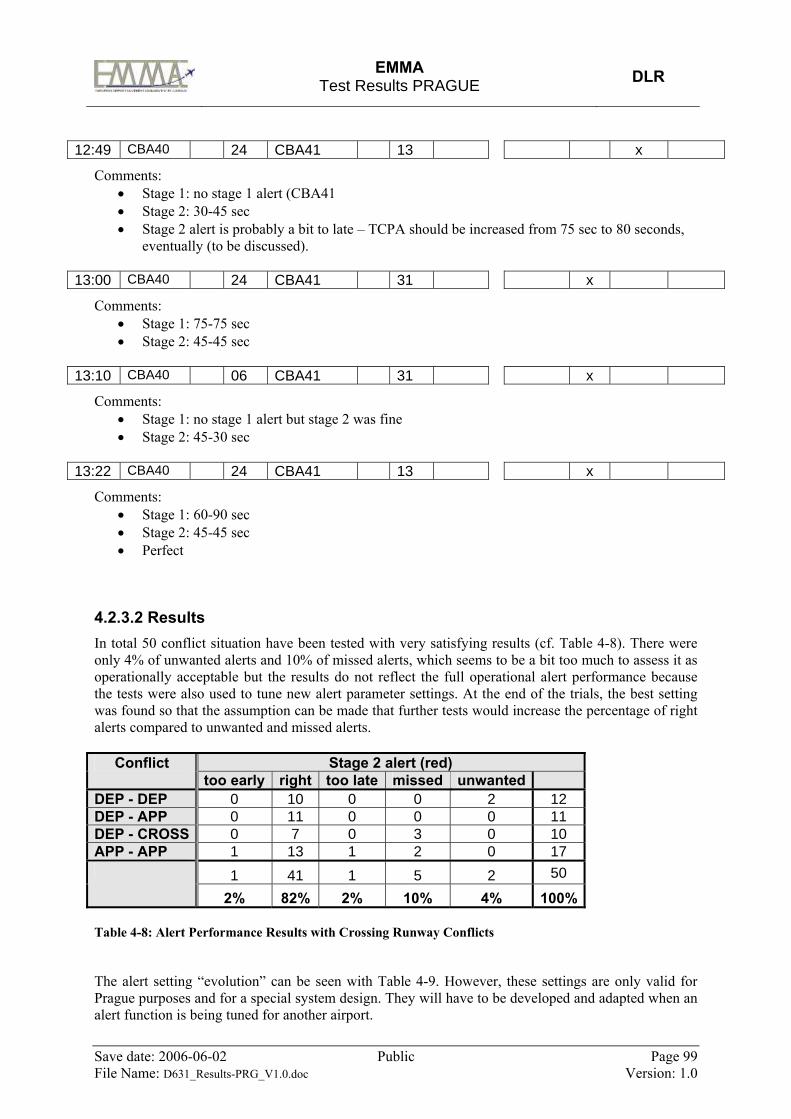
EMMA
Test Results PRAGUE DLR
Save date: 2006-06-02 Public Page 99 File Name: D631_Results-PRG_V1.0.doc Version: 1.0
12:49 CBA40 24 CBA41 13 x
Comments: • Stage 1: no stage 1 alert (CBA41 • Stage 2: 30-45 sec • Stage 2 alert is probably a bit to late – TCPA should be increased from 75 sec to 80 seconds,
eventually (to be discussed).
13:00 CBA40 24 CBA41 31 x
Comments: • Stage 1: 75-75 sec • Stage 2: 45-45 sec
13:10 CBA40 06 CBA41 31 x
Comments: • Stage 1: no stage 1 alert but stage 2 was fine • Stage 2: 45-30 sec
13:22 CBA40 24 CBA41 13 x
Comments: • Stage 1: 60-90 sec • Stage 2: 45-45 sec • Perfect
4.2.3.2 Results In total 50 conflict situation have been tested with very satisfying results (cf. Table 4-8). There were only 4% of unwanted alerts and 10% of missed alerts, which seems to be a bit too much to assess it as operationally acceptable but the results do not reflect the full operational alert performance because the tests were also used to tune new alert parameter settings. At the end of the trials, the best setting was found so that the assumption can be made that further tests would increase the percentage of right alerts compared to unwanted and missed alerts.
Stage 2 alert (red) Conflict too early right too late missed unwanted
DEP - DEP 0 10 0 0 2 12 DEP - APP 0 11 0 0 0 11 DEP - CROSS 0 7 0 3 0 10 APP - APP 1 13 1 2 0 17
1 41 1 5 2 50
2% 82% 2% 10% 4% 100%
Table 4-8: Alert Performance Results with Crossing Runway Conflicts
The alert setting “evolution” can be seen with Table 4-9. However, these settings are only valid for Prague purposes and for a special system design. They will have to be developed and adapted when an alert function is being tuned for another airport.

EMMA
Test Results PRAGUE DLR
Save date: 2006-06-02 Public Page 100 File Name: D631_Results-PRG_V1.0.doc Version: 1.0
30.11.05 16.1.06 20.1.06 24.1.06 25.1.06
TTX sec 100 100 120 120 120 Min. speed m/s 10 10 10 10 10 TCPA Stage1 sec 90 90 95 90 100 CPA Stage1 m 1200 950 700 700 700 TCPA Stage2 sec 75 75 80 75 75 CPA Stage2 m 1200 950 700 700 700 Abbreviations: TTX = Time for arrival aircraft to crossing area TCPA = Time to Closest Point of Approach) CPA = Closest Point of Approach
Table 4-9: Alert Parameter Setting for the Runway Crossing Alerts for different days of the Flight Tests
EMMA
Test Results PRAGUE DLR
Save date: 2006-06-02 Public Page 101 File Name: D631_Results-PRG_V1.0.doc Version: 1.0
4.3 Operational Improvements (Field Trials) With the operational feasibility tests (4.2), full sets of performance/operational requirements and procedures have been tested for their operational feasibility. To fully validate a system it must also show that new services and procedures contribute to an operational improvement. There are four areas of interest to measure these operational improvements:
• Safety • Capacity (in terms of throughput) • Efficiency • Human Factors aspects
The following general hypotheses had been set up to describe the expectation with the controllers’ answers with respect to the “operational improvement”: Identifier Hypothesis
OI-SAF3-H0 The controllers’ opinion does not agree to the “safety” aspects expressed by a specific safety item.
OI-SAF3-H1 The controllers’ opinion agrees to the “safety” aspects expressed by a specific safety item.
OI-EFF6-H0 The controllers’ opinion does not agree to the “efficiency/capacity” aspects
expressed by a specific safety item.
OI-EFF6-H1 The controllers’ opinion agrees to the “efficiency/capacity” aspects expressed by a specific safety item.
OI-HF5-H0 The controllers’ opinion does not agree to the “Human Factors” aspects expressed
by a specific safety item.
OI-HF5-H1 The controllers’ opinion agrees to the “Human Factors” aspects expressed by a specific safety item.
4.3.1 Debriefing Questionnaire (operational improvements) As already outlined with section 4.2.1, the a 144 items questionnaire and a t-test for the statistical analyses has been used:
• One-Sample T-Test • Expected mean value = 3,5 • Answers from 1 (disagreement) through 6 (agreement) • N = 15 • α = 0.05 • p-value is on single sided because of the use of directed hypothesis
The items referring the “operational improvement” and their results are reported in the following sections 4.3.1.1 “Safety”, 4.3.1.2 “Efficiency/Capacity, and in section 4.3.1.3 “Human Factors”.
A star (*) attached to the p-value means that a questionnaire item has been answered significantly because the p-value is equal or less than the critical error probability α, which is 0.05. Additionally, such items are coloured green.

EMMA
Test Results PRAGUE DLR
Save date: 2006-06-02 Public Page 102 File Name: D631_Results-PRG_V1.0.doc Version: 1.0
When the controllers significantly express their acceptance to a single service or procedure item, it can be assumed that the operational feasibility is proven.
Items written in italics could not be answered meaningfully because the controllers had limited or no operational experience with the topic (e.g. except in the case of lit stop bar crossing, no system alerts have been used operationally by the ATCOs). When controller comments were given to an item, they are reported directly below the statement.
4.3.1.1 Safety VA-Id. Questionnaire Item N Mean SD p
28 When procedures for LVO are put into action, A-SMGCS helps me to operate safer.
15 5,4 0,5 0,00*
50 A-SMGCS is helpful for better monitoring aircraft commencing it’s take off roll.
15 5,0 1,3 0,00*
61 I think A-SMGCS can help me to detect or prevent runway incursions. 13 4,9 1,0 0,00*
62 I think A-SMGCS can help me to detect or prevent incursions into restricted areas.
13 5,0 0,8 0,00*
120 The use of A-SMGCS endangers safety at the airport. 10 2,1 1,2 0,00*
129 There is a risk of focusing too much on a single problem when using A-SMGCS.
10 2,9 1,1 0,12
Table 4-10: Debriefing Questionnaire - Means, SD, and P-Value for “Safety” operational improvement items
4.3.1.2 Efficiency/Capacity
VA-Id. Questionnaire Item N Mean SD p
9 When visual reference is not possible, I think identifying an aircraft or vehicle is more efficient when using the surveillance display.
15 5,2 1,3 0,00*
10 I think, also in good visibility conditions, identifying an aircraft or vehicle is even more efficient when using the surveillance display.
15 5,2 0,6 0,00*
11 Recognition of the aircraft type is more efficient with A-SMGCS. 15 5,0 1,1 0,00*
Comment by ATCO F: depends on information in a label. When I have a type in a label then I agree. Comment by ATCO K: If real type is identified with flight plan one.
29 When procedures for LVO are put into action, A-SMGCS helps me to operate more efficiently.
15 5,2 0,8 0,00*
38 When visual reference is not possible I think longitudinal spacing on taxiways can be reduced with A-SMGCS.
15 4,7 1,3 0,00*
39 Without visual reference but using A-SMGCS, it would no longer be necessary to make records of vehicles on the manoeuvring area.
15 3,8 1,2 0,35

EMMA
Test Results PRAGUE DLR
Save date: 2006-06-02 Public Page 103 File Name: D631_Results-PRG_V1.0.doc Version: 1.0
41 Coordination between involved control positions is more efficient with A-SMGCS.
10 4,5 1,1 0,00*
42 With A-SMGCS hand over processes between different control positions are more efficient.
15 4,6 1,3 0,03*
Comment by ATCO F: We have not hand over procedures so? Comment by ATCO H: hand over procedures not applicable
43 The number of position reports will be reduced when using A-SMGCS (e.g. aircraft vacating runway-in-use).
15 4,9 0,7 0,00*
45 In good visibility line-up at the runway threshold is easier to control with A-SMGCS.
15 4,7 1,0 0,00*
46 When the runway threshold is not visible line-up is easier to control with A-SMGCS.
15 5,3 0,5 0,00*
47 In good visibility line-up from intersection is easier to control with A-SMGCS.
14 4,7 1,3 0,00*
51 With A-SMGCS, a clearance for a rolled take-off can be issued more frequently.
15 4,6 0,9 0,00*
52 In good visibility take-offs from intersection are easier to control with A-SMGCS.
15 4,5 1,1 0,00*
53 When an intersection is not visible take-offs from the intersection are easier to control with A-SMGCS.
15 5,1 0,6 0,00*
58 The transition from normal operations to low visibility operations is easier with A-SMGCS.
15 4,9 0,9 0,00*
72 The control of aircraft with the A-SMGCS is very efficient. 15 5,1 0,8 0,00*
74 A-SMGCS reduces waiting times for aircraft at the airport. 15 3,9 1,5 0,35
112 With A-SMGCS, it is easier to separate aircraft safely. 15 4,9 1,0 0,00*
Comment by ATCO E: Not in the air
113 With A-SMGCS, it is easier to detect runway incursions. 14 4,9 1,2 0,00*
Comment by ATCO E: Not if warnings are not on. (not used in Prague)
114 With A-SMGCS, it is easier to detect incursions into closed taxiways. 13 4,8 1,3 0,00*
Comment by ATCO E: Not if warnings are not on. (not used in Prague) Comment by ATCO F: Not applicable
115 With A-SMGCS, it is easier to detect incursions into protected areas. 15 4,8 1,3 0,00*
Comment by ATCO E: Not if warnings are not on. (not used in Prague)
116 With A-SMGCS, it is easier to detect aircraft on the apron. 15 4,5 1,1 0,00*
Comment by ATCO E: Apron in common settings is suppressed.

EMMA
Test Results PRAGUE DLR
Save date: 2006-06-02 Public Page 104 File Name: D631_Results-PRG_V1.0.doc Version: 1.0
121 I think that the A-SMGCS increases traffic throughput at the airport. 15 4,0 1,1 0,22
121a When the traffic demand is higher than the current capacity I think with A-SMGCS the traffic throughput can be increase.
5 3,4 1,5 0,89
122 The A-SMGCS enables me to handle more traffic when visual reference is not possible.
15 4,3 1,1 0,01*
124 The A-SMGCS enables me to execute my tasks more efficiently. 14 4,5 1,1 0,00*
128 There are less frequent unexpected calls of A/C and vehicles with A-SMGCS.
12 3,4 1,3 0,84
137 The use of A-SMGCS facilitates information gathering and interpretation.
15 4,6 0,7 0,00*
Table 4-11: Debriefing Questionnaire - Means, SD, and P-Value for “Efficiency/Capacity” operational improvement items
4.3.1.3 Human Factors
4.3.1.3.1 Situation Awareness VA-Id. Questionnaire Item N Mean SD p
12 The A-SMGCS display gives me a better position situational awareness (where is the traffic).
15 5,4 0,5 0,00*
13 The A-SMGCS display gives me a better identification situational awareness (who is who).
15 5,3 0,6 0,00*
125 The A-SMGCS helps me to maintain good situation awareness. 15 5,2 0,4 0,00*
126 “Maintaining the Picture” is supported well by the A-SMGCS. 15 4,9 0,5 0,00*
127 I feel that A-SMGCS enables me to predict better the evolution of the traffic (to be ahead of the traffic).
15 4,4 1,0 0,00*
131 The A-SMGCS display helps to have a better understanding of the situation.
15 5,2 0,4 0,00*
Table 4-12: Debriefing Questionnaire - Means, SD, and P-Value for “Situation Awareness” operational improvement items
4.3.1.3.2 Workload VA-Id. Questionnaire Item N Mean SD p
14 I think identifying the traffic using A-SMGCS increases workload. 15 2,1 1,3 0,00*
59 When procedures for LVO are put into action, A-SMGCS helps me to reduce my workload.
15 5,2 0,6 0,00*

EMMA
Test Results PRAGUE DLR
Save date: 2006-06-02 Public Page 105 File Name: D631_Results-PRG_V1.0.doc Version: 1.0
73 The use of A-SMGCS makes the controller’s job more difficult. 15 1,7 0,5 0,00*
76 The use of A-SMGCS has a negative effect on job satisfaction. 15 1,5 0,5 0,00*
138 The use of A-SMGCS increases mental effort for checking information sources.
14 2,4 0,9 0,00*
139 The use of A-SMGCS decreases workload for anticipating future traffic situations.
15 4,7 0,6 0,00*
Table 4-13: Debriefing Questionnaire - Means, SD, and P-Value for “Workload” operational improvement items
4.3.1.3.3 Human Error
VA-Id. Questionnaire Item N Mean SD p
118 The introduction of the A-SMGCS decreases the potential of human error.
14 2,7 1,4 0,05
119 The introduction of the A-SMGCS is associated with new types of human error.
13 3,1 1,1 0,20
Comment by ATCO M: Aircraft at holding point with mixed up labels can lead to calling wrong aircraft. Comment by ATCO O: see item 107
136 The A-SMGCS is useful for reducing mental workload. 15 4,8 0,7 0,00*
Table 4-14: Debriefing Questionnaire - Means, SD, and P-Value for “Human Error” operational improvement items
4.4 Daily Observations At each day of the operational field trials, protocols were created to gather all observations and comments given by the controllers and technicians. The following sections, which are sorted by the date, outline these results.
3rd November 2005
• At the old Tower there are 4 EMMA A-SMGCS CWPs now (incl. Gap Filler and updated HMI)
• Information (yellow) when two movements are within the runway sensitivity area – is wanted and happens when arriving aircraft is still on the runway and another one is lining up behind
• Time Arrival Windows is still “less than 30 seconds” and not “at least 30 seconds” – will be corrected with the new software update
• ATCO C said: the system is very useful for him, and as the system was not useable due to maintenance, he said he recognised that he was used to work head down only
• Labels sometimes overlap, but the controller can manually move them • GA on intersection take off Bravo without label (no transponder) • ATCO E and F said: In LVP they ask aircraft number 2 if it can see number 1. If yes, they
allow two aircraft in one taxiway segment. If not, no clearance. But, with A-SMGCS this rule

EMMA
Test Results PRAGUE DLR
Save date: 2006-06-02 Public Page 106 File Name: D631_Results-PRG_V1.0.doc Version: 1.0
could be softened. Probably, a safety net around the aircraft to warn the controller of movements that approach each other.
16th of January 2006 Weather conditions
• Snow but • Runways and taxiways are cleared from snow • LVO in the morning but good visibility in the afternoon
Alerts
• All alerts (except of the runway crossing alerts) are switched on the regular CWP for one week now
• Ciurrent procedures require that the alerts be switched off when the visibility drops below 3000m
• Long-term alert performance questionnaire that was distributed to the TEC CWP is not regarded by the controllers
o No audible alert and TEC use E2000 as primary display o Red alerts are very rare and if they are unwanted they are not recognised by the TEC o TEC does not take the time the note the alert performance
• Audible alert has not been installed because it is very distracting due to its high volume and permanent signal (peep). As yet, the controllers have not specified what is required.
EMMA System
• The EMMA system was unreliable during the this day due to a hardware fault which was corrected.
Flight Tests
• No flight test today, because the EMMA system is needed to test the runway crossing alerts that are not part of the commercial A-SMGCS
• The day after planned DEP-DEP; DEP-APP; and DEP-CROSSING conflict shall be tested with vehicles and normal traffic to save costs and time.
DMAN
• DMAN was not running in the morning but has been rebooted from Braunschweig remotely • Flight plans were there and planning and real traffic matched together (passive mode).
17th of January 2006 Weather conditions
• Snow but • runways and taxiways are cleared from snow • Good visibility the whole day
Alerts
• Audible alerts have been tested to install them on the Tower, but were estimated as too loud and too permanent until the conflict is solved – this is not acceptable to the controller because it could distract the communication of other CWP
• However one single „peep“ would be acceptable and even wanted by the controllers, however this could not be implemented during the field trials.
EMMA System
EMMA
Test Results PRAGUE DLR
Save date: 2006-06-02 Public Page 107 File Name: D631_Results-PRG_V1.0.doc Version: 1.0
• EMMA System is running again and will additionally be installed at the TEC CWP for the time of the flight tests (this is needed because the commercial A-SMGCS does not include runway crossing alerts)
Flight Tests
• Crossing runway alerts case studies were performed from 1200 to 1230 with an EMMA vehicle and normal traffic (cf. Test Observer sheet 4.2.3)
• DEP-DEP and DEP-CROSSING have been tested • DEP-APP could not be tested because no regular arrival was expected in the near future but
will be done the day after. DMAN
• DMAN was running but not continuously • DEP RWY13 is not indicated with DMAN because the DMAN is only outlined for the more
usual runway configuration with the beginning - columns are occupied by RWY24 and RWY31
18th of January 2006 Weather conditions
• 8000m visibility • RWY24 and RWY31 in use
EMMA System • Runs perfectly • Alitalia did not switch on the transponder, which seems to be quite normal the ATCOs said • Controllers said “Time to threshold” window shall be updated to “time and more” instead of
the current “time and less” • Alert and Visibility settings shall be permanently displayed
Flight Tests - Case Studies Crossing runway alerts • DEP31 – DEP24, DEP31 – APP24, DEP31 – Crossing RWY31 via Foxtrot have been tested
(see observer sheet and pictures) • DEP31 were simulated by a test vehicle “EMMA” • APP24 and Crossing were performed by normal traffic • EMMA A-SMGCS was switched on at the TPC CWP – other CWP were commercial A-
SMGCS • 5 DEP-DEP; 5 DEP-APP, and one crossing were tested within 45 min • Nearly all alerts worked fine
DMAN • Running continuously
23rd of January 2006 Weather conditions
• 8000m visibility • RWY06 and RWY31/13 in use • Wind calm • -16°C • Snow

EMMA
Test Results PRAGUE DLR
Save date: 2006-06-02 Public Page 108 File Name: D631_Results-PRG_V1.0.doc Version: 1.0
EMMA System
• False Targets o There was snow and operations were interrupted by snow-clearing o Snow and ice has to be cleared from the movement area otherwise it will cause
unwanted radar targets • Missing departure flight plans
o A controller reported that he has the feeling that when aircraft go off-block very early or very late compared to its EOBT the flight plan is missing in the departure list on the A-SMGCS surveillance display, (the reason for this needs further investigation)
Actual OBT very far away from EOBT happen very often in winter time when de-icing procedures have to be used
Flight Tests - Case Studies Crossing runway alerts
• Flight tests with two CAA test aircraft CBA40 (BE40) and CBA41 (L410) concentrated on Approach – Approach conflicts exclusively, because this conflict could not be tested with test cars the week before
• The alert parameters have been changed by ANS_CR so that stage1 alert arises appr. 45 seconds before threshold
• Alerts worked fine but probably still to early – alert parameters were tuned again for the next day
DMAN
• No activity (no flight plans are indicated) because DMAN is only tuned for RWY 24 and RWY31
24th of January 2006 Weather conditions
• 8000m visibility, no clouds • RWY24 and RWY31/13 in use • Wind calm • -10°C • Snow
EMMA System
• Worked fine again • MT (ANS_CR) proposed to switch off primary targets when LVP is in force:
o This would solve the problems with false targets and false alerts due to snow and heavy rain
o During LVP, all movements (aircraft and vehicles) must be equipped with Mode-S o Snow Ploughs in convoy where mostly only one vehicle is equipped are not used
during LVP or the runway will be closed o AG (PAS) said that this is technically possible to arrange but he warned of non-
equipped targets that cannot then be seen anymore o JJ (DLR) asked if the controller could be given the possibility to delete false targets
on the display (when s/he has verified 100% that the target is false) o No decision on this
Flight Tests - Case Studies “Crossing runway conflicts”
• With new alert algorithm settings, the information and alerts popped up later • The decision on which settings are better could not be taken but must be discussed later • Generally, all alerts worked fine today

EMMA
Test Results PRAGUE DLR
Save date: 2006-06-02 Public Page 109 File Name: D631_Results-PRG_V1.0.doc Version: 1.0
• After the case studies ANS_CR decided that they want to get the information earlier
DMAN • Worked fine
25th of January 2006 Weather conditions
• 7000m visibility • RWY24 and RWY31/13 in use • Wind calm • -10°C • Snow
EMMA System
• Worked fine again • When LVP, then:
o Stop bars are switched on o Intersections or stop bars are used as visual reference points for pilots to hold when
needed o The controller has never experienced that pilots have not been able to see each other o The controller estimates: to follow an aircraft by looking out of the cockpit should be
possible down to 100m visibility but those sight conditions are very unlikely Flight Tests - Case Studies “Crossing runway conflicts” • Unwanted DEP-DEP alerts
o DEP13 – DEP24 alerts have been observed, which are absolutely unwanted because aircraft are diverging and would never meet with those speed vectors
• Results of the day were fine but probably stage 2 alert was a bit late sometimes, but this has to be discussed with other operational people
• Single Arrival alerts o They are currently set with 30 sec for stage 1 and 15 sec for stage 2 o But, these settings are probably too low because T2 = 15 sec is sometimes below the
decision height o A better setting could be stage 1 alert (T1) = 40 sec and stage 2 alert (T2) = 20 sec
DMAN • Worked fine

EMMA
Test Results PRAGUE DLR
Save date: 2006-06-02 Public Page 110 File Name: D631_Results-PRG_V1.0.doc Version: 1.0
5 Conclusions
5.1 Prague V&V Approach The A-SMGCS V&V activities with Prague Ruzyne Airport were done on two validation platforms:
• Real Time Simulation (RTS) and
• On-site at the Prague Ruzyne Airport.
Three levels of V&V activities have been performed on both platforms:
• Technical Tests (Verification),
• Operational Feasibility (Validation), and
• Operational Improvements (Validation).
Different objectives were aimed for with the different test platforms and levels of testing. The technical tests checked whether the installed A-SMGCS in the simulation or in the Tower environment fulfilled all technical requirements to enable the operational use of the system and to perform the validation activities. The technical systems answered the question: “Did we set up the system right?”.
RTS and On-site trials focussed on validation activities but with two different levels of testing. Real Time simulations usually offer a good opportunity to measure operational improvements in terms of objective traffic data (e.g. taxi times, R/T load, etc.). They were also used to investigate safety critical situations like low visibility conditions or conflict situations without any danger. On-site trials were mainly needed to test the system in the real environment in terms of its technical performance and of its operational feasibility. The controllers who worked with the A-SMGCS fully operational (within all visibility conditions) were asked if they accept the A-SMGCS design, performance, and the new operational procedures. All platforms and levels of testing were needed to fully validate the A-SMGCS.
5.2 Prague V&V Results The A-SMGCS, which was installed at Prague Ruzyne Airport, has been validated. All technical and operational results affirm the overall main question: “Did we build the right system?”.
All main technical and operational requirements could be verified (cf. 2.4 and [11]). For this purpose, technical short- and long-term measurements have been conducted. With some requirements the system performance could not fully meet the standards (e.g. “Op_Perf-01-Probability of Detection” should be 99,9% but only 99,65% was measured) but the controllers’ acceptance of this slightly lower performance showed that even a lower PID could be valid to work with it safely and efficiently.
For the long-term system performance measurements, the MOGADOR tool was used. MOGADOR is a tool, developed in EMMA, that analyses fully automatically specific performance parameters from a long-term recorded data pool of the regular airport traffic. This tool revealed interesting results that can also be used to tune and adapt the A-SMGCS to meet the operational needs. However, the Prague long-term results, analysed with MOGADOR, still lack maturity because the time was not sufficient to fully adapt the MOGADOR algorithm to the specific Prague airport characteristics, which is always needed to measure the real system performance automatically.
The operational on-site trials (field tests) revealed that the controllers, who have worked with the A-SMGCS fully operationally for 7 months now, accepted the A-SMGCS and thus approved its “operational feasibility”. Statements like:
EMMA
Test Results PRAGUE DLR
Save date: 2006-06-02 Public Page 111 File Name: D631_Results-PRG_V1.0.doc Version: 1.0
• “When visual reference is not possible, the displayed position of the aircraft on the taxiways is accurate enough to exercise control in a safe and efficient way.”, or
• “I think that the A-SMGCS surveillance display could be used to determine that an aircraft has vacated the runway.”, or
• “The information displayed in the A-SMGCS is helpful for avoiding conflicts.”, or • “The A-SMGCS provides the right information at the right time.”, or • “When visual reference is not possible I think the A-SMGCS surveillance display can be used
to determine if the runway is cleared to issue a landing clearance.” have been significantly confirmed by 15 ANS_CR controllers. The statements mainly refer to the surveillance service of the A-SMGCS, because the ANS_CR controllers have not used the full scope of the monitoring and alerting function yet but only the “stop bar crossing” alerts as a first step. However, flight tests, which were used to evoke additional conflict situations at crossing runways, showed that also the performance of other monitoring alerts was accepted by the controllers. To fully validate a system it must also show its operational improvements. This was mainly done in real time simulations because RTSs can provide real experimental conditions. The most important result of the RTS was that A-SMGCS is able to reduce the average taxi time. In both simulation phases, the average taxi time was reduced by 13,6% and 7,1% respectively. Both results are highly significant with 968 total movements. Furthermore, A-SMGCS reduces the load of the R/T communication. With RTS1 a reduction of 16,0% and with RTS2 a reduction of 11,1% was measured, whereas only the RTS1 results showed statistical significance. A further operational improvement can be assumed with the “controller’s reaction time in case of a conflict situation”: 5,3 seconds instead of 6,0 seconds without A-SMGCS showed an interesting trend but became not significant. However, with a bigger sample size it can be assumed that this small effect could also become significant. These objective operational improvements, which were measured on the real-time simulation test platform, could also be confirmed with controllers’ subjective statements in the field. Controllers were asked to estimate their perceived safety and efficiency when they work with A-SMGCS compared to earlier times when they did not use an A-SMGCS. The following main results were gained:
• “When procedures for LVO are put into action, A-SMGCS helps me to operate safer.”, or • “I think A-SMGCS can help me to detect or prevent runway incursions.”, or • “When visual reference is not possible, I think identifying an aircraft or vehicle is more
efficient when using the surveillance display.”, or • “I think, also in good visibility conditions, identifying an aircraft or vehicle is even more
efficient when using the surveillance display.”, or • “The A-SMGCS enables me to execute my tasks more efficiently.”, or • “The number of position reports will be reduced when using A-SMGCS (e.g. aircraft vacating
runway-in-use).”, or • “The A-SMGCS enables me to handle more traffic when visual reference is not possible.”, or • “The A-SMGCS display gives me a better situational awareness.”, or • “When procedures for LVO are put into action, A-SMGCS helps me to reduce my workload.”
These examples, which were all positively answered by the controllers, further support the hypothesis that A-SMGCS provides significant operational improvements that will result in operational benefits for all stakeholders of an A-SMGCS.

EMMA
Test Results PRAGUE DLR
Save date: 2006-06-02 Public Page 112 File Name: D631_Results-PRG_V1.0.doc Version: 1.0
6 Annex
6.1 Flight Tests Scenarios

EMMA
Test Results PRAGUE DLR
Save date: 2006-06-02 Public Page 113 File Name: D631_Results-PRG_V1.0.doc Version: 1.0
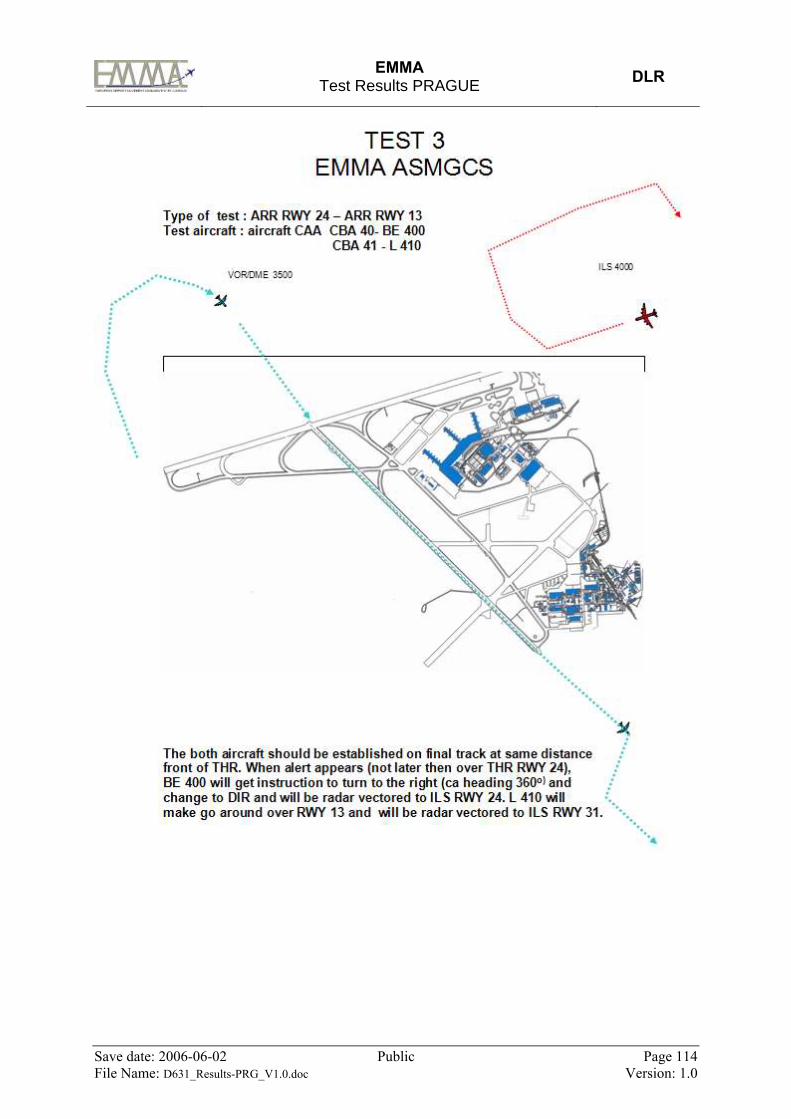
EMMA
Test Results PRAGUE DLR
Save date: 2006-06-02 Public Page 114 File Name: D631_Results-PRG_V1.0.doc Version: 1.0

EMMA
Test Results PRAGUE DLR
Save date: 2006-06-02 Public Page 115 File Name: D631_Results-PRG_V1.0.doc Version: 1.0
6.2 References [1] European Airport Movement Management by A-SMGCS (EMMA),
EMMA Proposal Description Part B, Version 3.0, EMMA Consortium, 20-Mar-2003. [2] Air Traffic Statistics and Forecast Service (STATFOR), Forecast of Annual Number of IFR
Flights (2004 - 2010) Vol. 1, EATMP Information Centre, Brussels, February 2004, pp. 4-6. [3] Eurocontrol ATM 2000+, Eurocontrol Air Traffic Management Strategy for the Years 2000+
Vol. 2, 2003 Edition, EATMP Information Centre, Brussels, July 2003. [4] Operational Benefit Evaluation by Testing an A-SMGCS (BETA), BETA Recommendations
Report, Issue 1.0, DLR, Braunschweig, July 2003. [5] A Master ATM European Validation Plan (MAEVA), Validation Guideline Handbook
(VGH), Issue 3.0, Isdefe, Madrid, April 2004. [6] FAA/Eurocontrol Co-operative R&D: Action Plan 5, Operational Concept Validation
Strategy Document (OCVSD), Edition 1.3, Eurocontrol, Brussels, December 2003. [7] B.W. Boehm, Verifying and Validating Software Requirements and Design Specifications,
IEEE Software, January 1984, pp. 75-88. [8] Eurocontrol DAP/APT, Definition of A-SMGCS Implementation Levels, Edition 1.0, EATMP
Information Centre, September 2003. [9] ICAO Doc. 9830: Advanced Surface Movement Guidance and Control Systems (A-SMGCS)
Manual, Montreal, First Edition, 2004. [10] EMMA, D1.3.5u Operational Requirements Document, Version 1.0, 2006, www.dlr.de/emma. [11] EMMA, D3.1.1 Ground System Requirements - Prague, Version 1.0, 2005, www.dlr.de/emma. [12] EMMA, D3.6.1 Site Acceptance Test Report - Prague Level II, Version 1.0, 2005,
www.dlr.de/emma. [13] EMMA, D6.1.2 Test Plan - Prague, Version 1.0, 2006, www.dlr.de/emma. [14] EMMA, D1.1.2u CDG A-SMGCS Data Analysis, Version 1.0, 2006, www.dlr.de/emma. [15] EATMP, European Operational Concept Validation Methodology (E-OCVM),
SD/ESC/RCV/vl/03-009, Brussels, April 2005, www.eurocontrol.int/valug. [16] EMMA, D1.3.1u, Operational Services and Environment Definition (OSED) , Version 1.0,
2006, www.dlr.de/emma. [17] EMMA, D1.4.2au, Technical Requirements Document (TRD) Part A – GROUND, Version 1.0,
2006, www.dlr.de/emma. [18] EMMA, D1.3.6, HMI Requirments, Version 0.11, 2005, www.dlr.de/emma. [19] Jürgen Bortz, Statistik für Sozialwissenschaftler, Springer Verlag Berlin Heidelberg, 1993
EMMA
Test Results PRAGUE DLR
Save date: 2006-06-02 Public Page 116 File Name: D631_Results-PRG_V1.0.doc Version: 1.0
6.3 Abbreviations Acronym Meaning ADS-B Automatic Dependent Surveillance - Broadcast AGL Aerodrome Ground Lighting ANS CR Air Navigation Services of the Czech Republic ARP Aerodrome Reference Point A-SMGCS Advanced Surface Movement Guidance and Control System ASR Airport Surveillance Radar ASTERIX All-Purpose Structured Eurocontrol Surveillance Information Exchange ATC Air Traffic Control ATM Air Traffic Management AUX Auxiliary Mass Storage Unit BITE Built-In Test Equipment BRM Bearing and Range Marker CDD Clearance Delivery Dispatch COTS Commercial-Off-The-Shelf CWP Controller Working Position df Degrees of freedom DSNA Direction des Services de la Navigation Aérienne EC European Commission EMC Electromagnetic Compatibility EMI Electromagnetic Interference ESUP Eurocat Support system EU European Union EUROCAE European Organisation for Civil Aviation Equipment EUROCONTROL European Organisation for the Safety of Air Navigation F F value in the F statistics FAT Factory Acceptance Test FDPS Flight Data Processing System FHA Functional Hazard Analysis GEC Ground Executive Controller GFS Gap Filler System GSR Ground System Requirements HMI Human-Machine Interaction HW Hardware ICAO International Civil Aviation Organisation ID Identifier IP Internet Protocol KVM Keyboard/Video/Mouse LAN Local Area Network LAT Latitude LCD Liquid Crystal Display LON Longitude LVP Low Visibility Procedures M Mean MET Meteorological MLAT Multi-Lateration MVP Machine Vision Processor

EMMA
Test Results PRAGUE DLR
Save date: 2006-06-02 Public Page 117 File Name: D631_Results-PRG_V1.0.doc Version: 1.0
Acronym Meaning NTP Network Time Protocol p p-value (error probability that the measured mean belongs to the H0 hypothesis) PAS Park Air Systems AS PDAS Probability of Detecting an Alert Situation PFD Probability of False Detection PRG Prague PTL Predicted Track Line PU Processing Unit RANC Radar Analyser and Compressor RCMS Remote Control and Monitoring System RDPS Radar Data Processing System RPA Reported Position Accuracy RPS Recording and Playback System RS Recommended Standard RVA Reported Velocity Accuracy RWY Runway SAT Site Acceptance Test SD Standard Deviation SDF Sensor Data Fusion SDS Surveillance Data Server SID Standard Instrument Departure SMR Surface Movement Radar SP Sub-Project SQB Squitter Beacon SSA System Safety Assessment STAR Standard Terminal Arrival Route SW Software TCP Transport Control Protocol TEC Tower Executive Controller TECAMS Technical Control and Monitoring System TPC Tower Planning Controller TRUR Target Report Update Rate TWY Taxiway V&V Verification and Validation VSDF Video Sensor Data Fusion WGS World Geodetic System WP Work-Package

EMMA
Test Results PRAGUE DLR
Save date: 2006-06-02 Public Page 118 File Name: D631_Results-PRG_V1.0.doc Version: 1.0
6.4 List of Figures Figure 2-1: EMMA Test-Bed Set-up at Prague..................................................................................... 10 Figure 2-2: Prague Ruzynĕ Airport Layout........................................................................................... 15 Figure 2-3: Plot Showing Coverage out to 10NM during CV Test....................................................... 16 Figure 2-4: Plot Showing Ground Traffic Trajectories during CV Test ............................................... 17 Figure 2-5: Playback Image Showing Trajectory of Test Vehicle during CV Test .............................. 18 Figure 2-6: PD Long Term Observation (excellent weather conditions (no snow, no precipitation)) .. 20 Figure 2-7: PD Long Term Observation (no optimal weather conditions (snow)................................. 21 Figure 2-8: PFD Long Term Observation (excellent weather conditions (no snow, no precipitation)) 23 Figure 2-9: PFD Long Term Observation (no optimal weather conditions (snow)) ............................. 24 Figure 2-10: Row of Holding Aircraft showing Location of Position Symbol relative to SMR Image 26 Figure 2-11: X and Y Components of Position Error............................................................................ 27 Figure 2-12: Replay Showing part of Test Vehicle Trajectory during Test .......................................... 28 Figure 2-13: Replay Showing Test Vehicle stopped for Static RPA Test............................................. 29 Figure 2-14: Plot Showing Distribution of Reported Position of Stationary Target ............................. 29 Figure 2-15: Test Vehicle Track showing Overshoot when Cornering................................................. 30 Figure 2-16: PID Long Term Observation (excellent weather conditions (no snow, no precipitation))34 Figure 2-17: PID Long Term Observation (no optimal weather conditions (snow, sunshine)) ............ 35 Figure 2-18: PFID Long Term Observation (excellent weather conditions (no snow, no precipitation))
....................................................................................................................................................... 37 Figure 2-19: PFID Long Term Observation (no optimal weather conditions (snow, sunshine)).......... 38 Figure 3-1: Bar Chart for Means, SD, and p-values for 30 items from the RTS Acceptance
Questionnaire ................................................................................................................................ 52 Figure 3-2: Bar Charts of the Mean Reaction Time for TEC and GEC Position (RTS 1 only) ............ 56 Figure 3-3: Total average Taxi Times for RTS 1 and RTS 2 [sec] ....................................................... 62 Figure 3-4: Means of R/T Load between A-SMGCS and Baseline for each CWP [sec per hour] (RTS1)
....................................................................................................................................................... 64 Figure 3-5: Means of R/T Load between A-SMGCS and Baseline for each CWP [sec per hour] (RTS2)
....................................................................................................................................................... 65 Figure 3-6: Total Means for I.S.A. Workload between A-SMGCS and Baseline Test Conditions ...... 71
6.5 List of Tables Table 1-1 Stages of V&V Activities................................................................................................ 8 Table 2-1: Technical Verification Indicators ........................................................................................ 13 Table 2-2: Results of Probability of Detection Test .............................................................................. 19 Table 2-3: Results of Probability of False Detection Test..................................................................... 22 Table 2-4: Results of RP Test................................................................................................................ 25 Table 2-5: Static RPA Test Results ....................................................................................................... 28 Table 2-6: RVA Test Result .................................................................................................................. 32 Table 2-7: Results of Probability of Identification Test ........................................................................ 33 Table 2-8: Results of Probability of False Identification Test............................................................... 36 Table 2-9: TRUR Test Result................................................................................................................ 39 Table 2-10: Probability of Detecting an Alert Situation ....................................................................... 40 Table 2-11: Result of ART Test ............................................................................................................ 41 Table 2-12: Results of Track Continuity Test (excellent weather conditions (no snow, no
precipitation)) ................................................................................................................................ 42 Table 2-13: Results of Track Continuity Test (no optimal weather conditions (snow, sunshine)) ....... 42 Table 2-14: Matrix of Detection for all Movements with Good Weather Conditions (no snow, no
precipitation) [%] .......................................................................................................................... 43 Table 2-15: Matrix of Detection for all Movements with Adverse Weather Conditions (snow or/and
precipitation) [%] .......................................................................................................................... 43

EMMA
Test Results PRAGUE DLR
Save date: 2006-06-02 Public Page 119 File Name: D631_Results-PRG_V1.0.doc Version: 1.0
Table 2-16: Missing Identification Gap Distribution (Missing label) ................................................... 44 Table 2-17: Wrong Identification Gap Distribution (Wrong label) ...................................................... 44 Table 2-18: Summary of Technical Verification Results...................................................................... 45 Table 3-1: Allocation of Controllers to the Groups and RTS Phases.................................................... 46 Table 3-2: Combination of Experimental Factors ................................................................................. 47 Table 3-3: RTS Traffic Scenario Description ....................................................................................... 48 Table 3-4: Distribution of the Controllers to the Test Conditions......................................................... 49 Table 3-5: Raw Data of the RTS Acceptance Questionnaire ................................................................ 51 Table 3-6: T-Test for 30 items of the Acceptance questionnaire .......................................................... 51 Table 3-7: Low-level Objectives, Indicators, and Measurement Instruments for Measuring operational
improvements in the RTS.............................................................................................................. 54 Table 3-8: Raw Data for Conflict Reaction Time for the TEC Position [sec] (RTS 1 only) ................. 55 Table 3-9: Raw Data for Conflict Reaction Time for the GEC Position [sec] (RTS 1 only)................. 56 Table 3-10: Means, SD, and SE for the TEC’s Reaction Time (RTS 1 only)....................................... 56 Table 3-11: Means, SD, and SE for the GEC’s Reaction Time (RTS 1 only) ...................................... 56 Table 3-12: T-tests for paired differences: Reaction Time of TEC and GEC position (RTS 1 only) ... 56 Table 3-13: Taxi Time Raw Data [sec] (RTS 1) ................................................................................... 59 Table 3-14: Taxi Time Raw Data (RTS 2)............................................................................................ 60 Table 3-15: Taxi Time Results (RTS 1) ................................................................................................ 61 Table 3-16: Taxi Time Results (RTS 2) ................................................................................................ 61 Table 3-17: Radio Communication Load Raw Data [sec per hour] (RTS 1) ........................................ 63 Table 3-18: Radio Communication Load [sec per hour] (RTS 2) ......................................................... 63 Table 3-19: R/T Load Means, SD, and Sample Size (RTS 1)............................................................... 64 Table 3-20: R/T Load Means, SD, and Sample Size (RTS2)................................................................ 64 Table 3-21: R/T Load Test for Significance (two-way ANOVA [F-Test]) (RTS 1)............................. 65 Table 3-22: R/T Load Test for Significance (two-way ANOVA [F-Test]) (RTS2).............................. 65 Table 3-23: Raw Data SASHA Questionnaire ...................................................................................... 67 Table 3-24: Raw Data of Wrong Answers with the SAHA on-line Query (RTS 1 only) ..................... 70 Table 3-25: Mean Values of I.S.A. Workload....................................................................................... 71 Table 3-26: ANOVA with Repeated Measurements for I.S.A. Workload............................................ 71 Table 4-1: Social-Demographic Data of the Sample Size..................................................................... 75 Table 4-2: Debriefing Questionnaire Raw Data (Field Trials).............................................................. 79 Table 4-3: Debriefing Questionnaire – Means, SD, and P-Value for “General” operational feasibility
items .............................................................................................................................................. 80 Table 4-4: Debriefing Questionnaire - Means, SD, and P-Value for “Surveillance” operational
feasibility items ............................................................................................................................. 81 Table 4-5: Debriefing Questionnaire - Means, SD, and P-Value for “Control” operational feasibility
items .............................................................................................................................................. 83 Table 4-6: Debriefing Questionnaire - Means, SD, and P-Value for “HMI” operational feasibility
items .............................................................................................................................................. 85 Table 4-7: Debriefing Questionnaire - Means, SD, and P-Value for “Procedure” operational feasibility
items .............................................................................................................................................. 87 Table 4-8: Alert Performance Results with Crossing Runway Conflicts .............................................. 99 Table 4-9: Alert Parameter Setting for the Runway Crossing Alerts for different days of the Flight
Tests ............................................................................................................................................ 100 Table 4-10: Debriefing Questionnaire - Means, SD, and P-Value for “Safety” operational
improvement items ...................................................................................................................... 102 Table 4-11: Debriefing Questionnaire - Means, SD, and P-Value for “Efficiency/Capacity” operational
improvement items ...................................................................................................................... 104 Table 4-12: Debriefing Questionnaire - Means, SD, and P-Value for “Situation Awareness”
operational improvement items ................................................................................................... 104 Table 4-13: Debriefing Questionnaire - Means, SD, and P-Value for “Workload” operational
improvement items ...................................................................................................................... 105
EMMA
Test Results PRAGUE DLR
Save date: 2006-06-02 Public Page 120 File Name: D631_Results-PRG_V1.0.doc Version: 1.0
Table 4-14: Debriefing Questionnaire - Means, SD, and P-Value for “Human Error” operational improvement items ...................................................................................................................... 105
END OF DOCUMENT