Embed Size (px)
Citation preview

ACI WEB SESSIONS
Field Measurements of Form Pressure Exerted by Self-Consolidating Concrete
ACI Spring 2013 ConventionApril 14 - 16, Minneapolis, MN
ACI WEB SESSIONS
Kamal H. Khayat, Ph. D., received his B.S., M.Eng., and M.S. in civil engineering with emphasis in structural engineering, construction engineering and management and a Ph.D. in civil engineering with emphasis in civil engineering
materials, all from the University of California at Berkeley. This was followed by a post-doctoral fellowship at the same institute.
Dr. Khayat is active on several technical and code committees, including Chair of ACI (American Concrete Institute) 237 SCC and RILEM (International Union of Testing and Research Laboratories for Materials and Structures) Technical Committee 228 Mechanical Properties of SCC. He served as member of the Canadian Standards Association Committee A23.1/A23.2 Concrete Materials and Methods of Concrete Construction/Methods of Test for Concrete A23.1 and a number of TRB Committees.
ACI Spring Convention – Minneapolis April 14, 20133 3
Test Methods to Evaluate Structural Build-up of SCC and Influence on
Form Pressure
Kamal Khayat, Missouri University of Science & Technology
Ahmed Omran, Université de Sherbrooke, Canada
ACI Spring Convention
Minneapolis - April 14, 2013
RMC Research & Education Foundation
Strategic Development Council of ACI
SDC Members (2007 – 2009)ACI Spring Convention – Minneapolis April 14, 2013
Various Models to Evaluate Lateral Pressure
R T HForm width Time ρ Thixotropy Slump
Set time
Waiting period
1- ACI 347-04 x x x x
2- U.K. (CIRIA Report 108) x x x x
3- Japan - Standard Specifications for Concrete Structures (2002)
x x x x
4- Sweden (Design of Vertical Concrete Formwork)
x x x
5- Khayat & Assaad [2005] x x x x
6- Roussel and Ovarlez [2005] x x x x x
7- Lange et al., [2005] x x x x
8- Khayat & Omran [2009] x x x x x x x
9- DIN 18 218 :2010-01 (2010) x x x x
10- Gardner et al., 2011 x x xS‐
flow loss
R = Rate of castingT = TemperatureH = Casting depth
ACI Spring Convention – Minneapolis April 14, 2013
Positive Aspects of Thixotropy
Reduction in formwork pressure after casting due to structural build-up at rest
Improved static stability
50%
ACI Spring Convention – Minneapolis April 14, 2013
Factors Affecting Thixotropy of Concrete
Rodin, 1952
• w/cm• Coarse agg. characteristics• S/A• Vp (paste volume)• Binder type and content• SCMs and fillers• Admixtures
Mix design
Consistency level
Thixotropyor
Structural build-up at rest
Temperature

ACI Spring Convention – Minneapolis April 14, 2013
Outline
• Thixotropy determination:
• structural breakdown
• structural build-up at rest
• Thixotropy vs. form pressure exerted by SCC
ACI Spring Convention – Minneapolis April 14, 2013
0
40
80
120
160
0 200 400 600 800 1000 1200
Time (s)
= fixed
= 0.03 s-1sample at rest
Sh
ear
stre
ss (
Pa)
Structural build-up
(flocculation, coagulation)
Thixotropy – variation of viscosity (or shear stress) with time under constant shear rate - structural build-up when left at rest (reversible)
Modified MK-III rheometer
ACI Spring Convention – Minneapolis April 14, 2013
4 minutes resting time
Importance of Restructuring !
0 5 10 15 20 25
Time (sec)
Vis
cosi
tyo
f co
ncr
ete
(Pa.
s)
2 minutes resting time
N = 0.9 rps
Formwork pressure = f (restructuring of the concrete)
Slump = 200 mm450 kg/m³ of binderw/cm = 0.42 VMA
ACI Spring Convention – Minneapolis April 14, 2013
R ~ 6-10 m/hr
ACI Spring Convention – Minneapolis April 14, 2013
Typical Formwork Pressure Envelops
0
1
2
3
4
5
6
0 20 40 60 80 100 120
Pressure developed on formwork (kPa)
Hea
d o
f co
ncr
ete
(m)
Hydrostatic pressure
Slump flow = 720 mm S/A = 0.50Ternary cement = 475 kg/m³ w/cm = 0.40
R = 6.5 m/h
right after casting
1 h3 h
P(max)
ACI Spring Convention – Minneapolis April 14, 2013
Time after casting (min)
P(m
axim
um
) / P
(hyd
rost
atic
)
0.0
0.2
0.4
0.6
0 200 400 600 800 1000 1200
Pressure Variations with Thixotropy
BIN-0.50-Nap (Ab1 = 260 J/m³.s)
TER-0.44-Nap(405 J/m³.s)
S / A
PNS
R = 6 m/h
R = 6.5 m/h

ACI Spring Convention – Minneapolis April 14, 2013
Time Intervals for Assessing Thixotropy
1
Time (min)
Ro
tati
on
alsp
eed
(rp
s)
0.3 rps
0.5 rps
0.7 rps
0.9 rps
Rest of 5 min
Testing & rehomogizing = 2.5 min
T = 0 - 30 min
ACI Spring Convention – Minneapolis April 14, 2013
1
Sh
ear
stre
ss (
Pa
)
0
200
400
600
800
0 5 10 15 20 25
Time (sec)
0
200
400
600
800
0.2 0.4 0.6 0.8
Rotational speed (rps)
Ab1 (J/m³.s)
N = 0.3 rps
N = 0.9 rpsN = 0.5 rps
N = 0.7 rps
1. Structural breakdown: structural breakdown area (Ab1)
τ τ0.9
31 i e
0.3
Lapasin et al. [1983] Ab = ︵N ︶- ︵N ︶dN J/m .s
ACI Spring Convention – Minneapolis April 14, 2013
0
40
80
120
160
0 200 400 600 800 1000 1200Time (s)
= fixed
= 0.03 s-1
sample at rest
Shea
r str
ess
(Pa)
Structural build-up
(flocculation, coagulation)
Structural build-up: increase in shear stress (or viscosity) when the material is left at rest
Structural build-up at rest: Re-structuring
ACI Spring Convention – Minneapolis April 14, 2013
0
500
1000
1500
2000
2500
0 15 30 45 60
Rhe
omet
er-τ
0 re
st (P
a)
Rest time (min)
Static Shear Stress at Rest (τ0rest)
R(t) (Pa/min)
Ri (Pa)
Typical SCC mixturesw/p 0.37-0.47
Slump flow 600-720 mmN = 0.03 rps
0.00
0.05
0.10
0.15
0.20
0 5 10 15 20
Torq
ue (N
.m)
Tmax
Time (sec)
RixR(t), (Pa2/min)
ACI Spring Convention – Minneapolis April 14, 2013
Field-Oriented Tests to Evaluate Thixotropy of Flowable Mortar and SCC
Inclined plane
Cone penetration
K-Slump Undisturbed slump spread
Portable vane
Falling ballACI Spring Convention – Minneapolis April 14, 2013
Mortar
Concrete
0 sinrestIP gh
Inclined Plane (IP) Test Free Surface Flow of Thixotropic Fluid
0
200
400
600
800
1000
0 10 20 30 40 50Rest time (min)
IP 0
rest
(Pa)
RixR(t), (Pa2/min)
Typical SCC mixturesw/p 0.37-0.47Slump flow 600-720 mm
R(t) (Pa/min)
Ri (Pa)
60 mm
120 mm
a

ACI Spring Convention – Minneapolis April 14, 2013
Portable Vane (PV) Test
Ri (Pa) R(t), (Pa/min) RixR(t), (Pa2/min)
Typical SCC mixturesw/p 0.37-0.47Slump flow 600-720 mm
0
2000
4000
6000
8000
10000
0 15 30 45 60 75
PV τ
0res
t(P
a)
Rest time (min)
τ0rest = Tmax /G
ACI Spring Convention – Minneapolis April 14, 2013
Portable Vane (PV) TestTypical SCC mixturesw/p 0.37-0.47Slump flow 600-720 mm
0
2000
4000
6000
8000
10000
0 15 30 45 60 75
PV τ
0res
t(P
a)
Rest time (min)
τ0rest = Tmax /G
ACI Spring Convention – Minneapolis April 14, 2013
Portable Vane (PV) Test
ACI Spring Convention – Minneapolis April 14, 2013
Undisturbed Slump Spread (USS) Test
USS = (D1+D2)/2
D1
D2
0
100
200
300
400
0 20 40 60 80Rest time (min)
Und
istu
rbed
slum
psp
read
(mm
) Spread below 100 mm is neglected
Typical SCC mixturesw/p 0.37-0.47Slump flow 600-720 mm
R(t): (mm/min)
ACI Spring Convention – Minneapolis April 14, 2013
Relative Errors (%) of Tests using SCC Mixtures
Rest time (min) PV test
Thixotropic SCC
15 19
30 12
45 9
Rest time (min) IP test
15 8
20 8
25 8
30 5
ACI Spring Convention – Minneapolis April 14, 2013
y = 4.59x + 95.79R² = 0.90
y = 1.05x + 34.99R² = 0.77
0
300
600
900
1200
1500
0 50 100 150 200 250
τ 0re
st(P
a)
∆SS (mm)
PV test
IP test
Correlations using CEM Mixtures

ACI Spring Convention – Minneapolis April 14, 2013
y = 0.95 xR² = 0.82
0
300
600
900
1200
0 300 600 900 1200 1500
IP τ
0res
t(P
a)
Rheometer τ0rest (Pa)
Yield Stress at Rest: PV and IP Tests vs. Rheometer
y = 1.00 xR² = 0.82
0
500
1000
1500
2000
2500
0 1000 2000 3000
PVτ 0
res
t(P
a)
Rheometer τ0rest (Pa)
Good relationships between static yield stress from PV and IP vs. rheometer
Data at 15 min rest timeSCC
ACI Spring Convention – Minneapolis April 14, 2013
Good relationship between evolution of PV and IP static yield stress with time and the evolution of static yield stress from concrete rheometer
y = 2.52 xR² = 0.96
0
20
40
60
80
100
120
140
0 20 40 60
PVτ 0
rest
(t) (P
a/m
in)
Rheometerτ0rest (t) (Pa/min)
y = 0.60xR² = 0.93
0
5
10
15
20
25
30
35
0 20 40 60
IPτ 0
rest
(t) (P
a/m
in)
Rheometerτ0rest(t) (Pa/min)
Validation using SCC Mixtures
0 15 30 45 60
τ 0re
st(P
a)
minute
ACI Spring Convention – Minneapolis April 14, 2013
• ρ: unit weight of SCC• H: casting depth in the form• R: casting rate• T: concrete temperature• Dmin: formwork width
• TI: thixotropy index:TI@fixed temperature (22ºC) or TI@various temperature (ti).
Thixotropy as Input to Evaluate FormworkPressure
P
Pmax = ρgH [a1H + a2R + a3T + a4Dmin + a5TI@fixed Temp.]
Pmax = ρgH [a1H + a2R + a3T + a4Dmin + a5TI@various Temp.]
ACI Spring Convention – Minneapolis April 14, 2013
Pressure Device to Determine Lateral Pressure
Digital manometer to control overhead air pressure (up to 13 m high)
190 mm
63 mm
577 mm
700 mm
63 mm
Fresh concrete
500 mm
19 mm
19 mmPressure sensor
Pressure sensor
Honeywell pressure sensor
(1400-kPa capacity)
ACI Spring Convention – Minneapolis April 14, 2013
Pressure Variations
0
40
80
120
160
200
240
280
320
0 20 40 60 80 100 120 140
Pre
ssu
re (
kPa)
Time (min)
Hydrostatic pressure
H = 0.5 m
H = 0.35 m
SCC4Ф= 560 mmR = 10 m/hrVMA = 2.8 L/m3
Sudden increase in pressure reflects "blow-up" of overhead pressure at sensor locationdecrease in pressure
reflects material restructuring
Reach to hydrostatic
0
40
80
120
160
200
240
280
320
0 20 40 60 80 100 120 140
Late
ral p
ress
ure
(kPa
)
Time (min)
= 560 mmR = 10 m/hr
Eq. hydrostatic pressure H = 13 m @ 72 min
ACI Spring Convention – Minneapolis April 14, 2013
Validation: Pressure Response vs. 3-m Standing Column
0
10
20
30
40
50
60
70
20 40 60 80 100
Late
ral p
ress
ure
(kPa
)
Time (min)
SCC2 = 660 mmR = 10 m/hr
Pressure column
3-m PVC column
Hydrostatic pressure
ACI Spring Convention – Minneapolis April 14, 2013
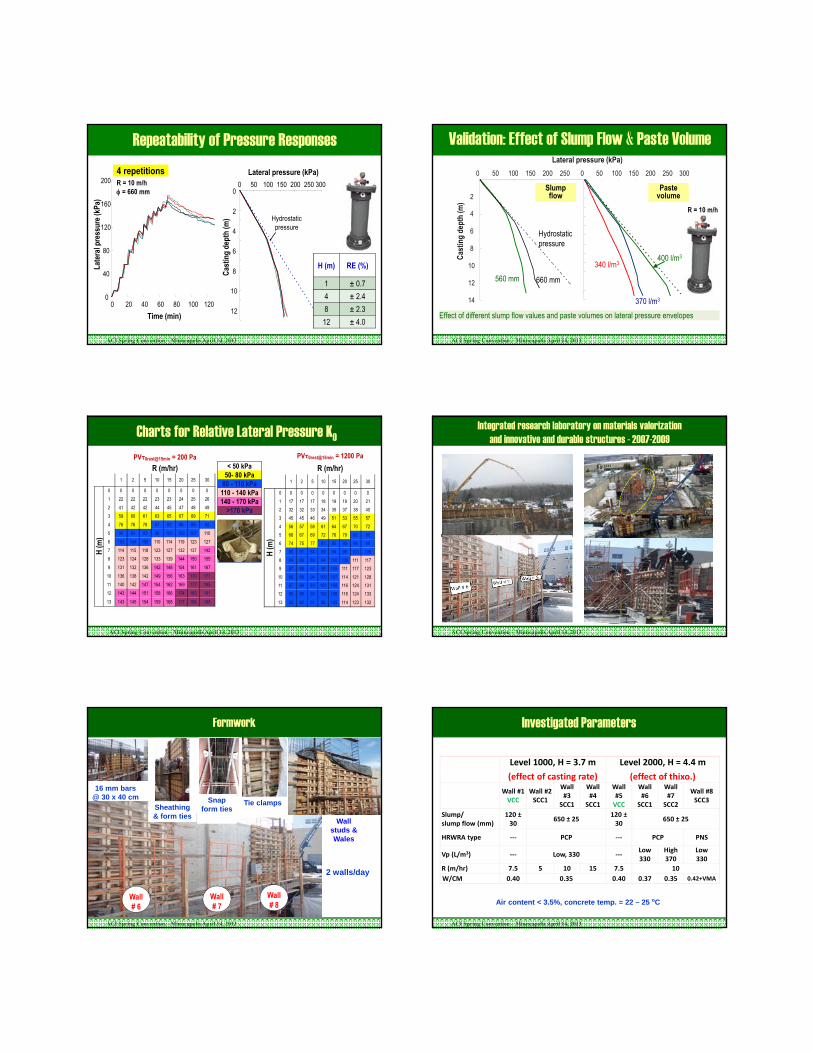
Repeatability of Pressure Responses
4 repetitions
0
40
80
120
160
200
0 20 40 60 80 100 120 140 160
Time (min)
Late
ral p
ress
ure
(kPa
)
R = 10 m/h = 660 mm 0
2
4
6
8
10
12
0 50 100 150 200 250 300
Lateral pressure (kPa)
Cas
ting
dept
h (m
) Hydrostatic pressure
H (m) RE (%)
1 ± 0.7
4 ± 2.4
8 ± 2.3
12 ± 4.0
ACI Spring Convention – Minneapolis April 14, 2013
2
4
6
8
10
12
14
0 50 100 150 200 250
Lateral pressure (kPa)
Cas
ting
dept
h (m
)
560 mm 660 mm
Slump flow
0 50 100 150 200 250 300
400 l/m3
370 l/m3
340 l/m3
Paste volume
Validation: Effect of Slump Flow & Paste Volume
Effect of different slump flow values and paste volumes on lateral pressure envelopes
R = 10 m/h
Hydrostatic pressure
ACI Spring Convention – Minneapolis April 14, 2013
PVτ0rest@15min = 1200 Pa
R (m/hr)
1 2 5 10 15 20 25 30
H (m
)
0 0 0 0 0 0 0 0 0
1 17 17 17 18 19 19 20 21
2 32 32 33 34 35 37 38 40
3 45 45 46 49 51 53 55 57
4 56 57 58 61 64 67 70 72
5 66 67 69 72 76 79 82 86
6 74 75 77 81 85 90 94 98
7 80 81 84 89 94 98 103 108
8 84 86 89 94 100 105 111 117
9 87 88 92 98 105 111 117 123
10 88 89 94 100 107 114 121 128
11 87 89 93 101 108 116 124 131
12 85 86 93 100 108 116 124 133
13 80 82 91 96 105 114 123 132
< 50 kPa50- 80 kPa
80 - 110 kPa110 - 140 kPa140 - 170 kPa
>170 kPa
PVτ0rest@15min = 200 Pa
R (m/hr)1 2 5 10 15 20 25 30
H (m
)
0 0 0 0 0 0 0 0 0
1 22 22 22 23 23 24 25 26
2 41 42 42 44 45 47 48 49
3 59 60 61 63 65 67 69 71
4 76 76 78 81 83 86 89 92
5 90 91 93 96 100 103 107 110
6 103 104 106 110 114 119 123 127
7 114 115 118 123 127 132 137 142
8 123 124 128 133 139 144 150 155
9 131 132 136 142 148 154 161 167
10 136 138 142 149 156 163 170 177
11 140 142 147 154 162 169 177 185
12 143 144 151 158 166 174 183 191
13 143 145 154 159 168 177 186 195
Charts for Relative Lateral Pressure K0
ACI Spring Convention – Minneapolis April 14, 2013
Integrated research laboratory on materials valorization and innovative and durable structures - 2007-2009
ACI Spring Convention – Minneapolis April 14, 2013
Snap form ties
Tie clamps
16 mm bars @ 30 x 40 cm
Formwork
Wall # 7
Wall # 8
Wall # 6
2 walls/day
Sheathing & form ties
Wall studs & Wales
ACI Spring Convention – Minneapolis April 14, 2013
Level 1000, H = 3.7 m
(effect of casting rate)
Level 2000, H = 4.4 m
(effect of thixo.)
Wall #1VCC
Wall #2SCC1
Wall #3
SCC1
Wall #4
SCC1
Wall #5VCC
Wall #6
SCC1
Wall #7
SCC2
Wall #8SCC3
Slump/slump flow (mm)
120 ±30
650 ± 25120 ±30
650 ± 25
HRWRA type ‐‐‐ PCP ‐‐‐ PCP PNS
Vp (L/m3) ‐‐‐ Low, 330 ‐‐‐Low330
High 370
Low330
R (m/hr) 7.5 5 10 15 7.5 10
W/CM 0.40 0.35 0.40 0.37 0.35 0.42+VMA
Air content < 3.5%, concrete temp. = 22 – 25 oC
Investigated Parameters

ACI Spring Convention – Minneapolis April 14, 2013
Full Material Characterization
10 persons to carry out > 17 tests
H2
H1
h2 = 150 - H2
h1 = 600 - H1
H2
H1
h2 = 150 - H2
h1 = 600 - H1
Strength
Shrinkage
ACI Spring Convention – Minneapolis April 14, 2013
Lateral pressure [wall # 6, SCC1, R = 10 m/h]
0
10
20
30
40
50
60
70
0 200 400 600 800 1000 1200
Time (min)
Pmax (kPa)
1.2 m PVC column
@ 1.82 m @ 2.33 m
@ 3.85 m from top
@ 3.34 m
0.0
0.5
1.0
1.5
2.0
2.5
3.0
3.5
4.0
4.5
0 20 40 60 80 100
Form
wor
k he
ight
(m)
Pmax (kPa)
Hydrostatic pressure
@2 hr
@6 hr Pmax
formwork base
@4 hr
ACI Spring Convention – Minneapolis April 14, 2013
8 Full-Scale R/C Columns
MixtureRelative
thixotropy
Casting rate (m/h)
2 55 +
20’ WP10 13 15 22
SCC-L Low -- -- -- -- Col.#1 -- Col.#2SCC-M Medium -- Col.#7 Col.#8 --SCC-H High Col.#5 Col.#3 -- Col.#4 -- Col.#6 --
ACI Spring Convention – Minneapolis April 14, 2013
Predicted vs. Field Measurements
y = 1.01 xR² = 0.97
0
20
40
60
80
100
0 20 40 60 80 100
Mea
sure
d P m
axin
fiel
d (k
Pa)
Predicted Pmax (kPa)
C…C…
8 column elements6 wall elements cast with SCC
ACI Spring Convention – Minneapolis April 14, 2013
Conclusions
• Thixotropy can be assessed by structural breakdown and structural build-up at rest
• Structural breakdown area is determined using rheometer
• Structural build-up at rest can be determined using the structural growth approach - variations of static yield stress at rest - using:
• rheometer
• empirical tests: inclined plane / portable vane test methods
Static yield stress of inclined plane / portable vane tests correlatewell to that of concrete rheometer
Increase of thixotropy leads to reduction in lateral formworkpressure exerted by SCC
Field validation results are encouraging
ACI Spring Convention – Minneapolis April 14, 201342
Thank you !
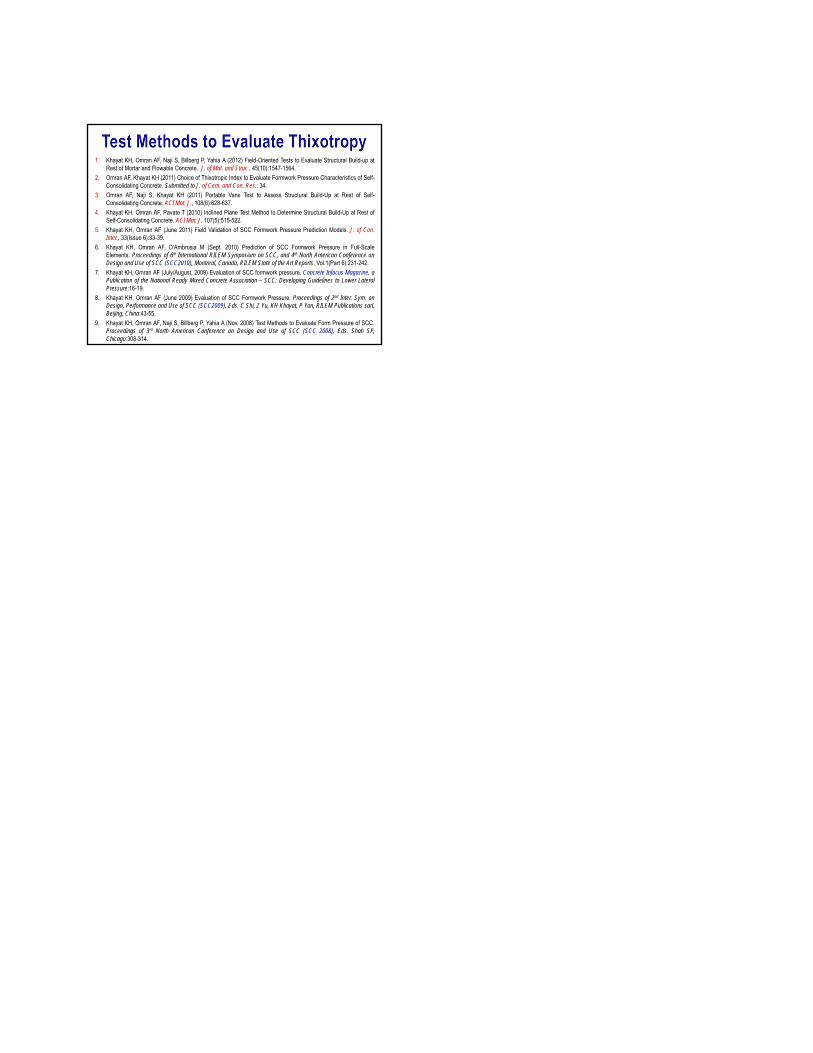
1. Khayat KH, Omran AF, Naji S, Billberg P, Yahia A (2012) Field-Oriented Tests to Evaluate Structural Build-up atRest of Mortar and Flowable Concrete. J. of Mat. and Struc., 45(10):1547-1564.
2. Omran AF, Khayat KH (2011) Choice of Thixotropic Index to Evaluate Formwork Pressure Characteristics of Self-Consolidating Concrete. Submitted to J. of Cem. and Con. Res.: 34.
3. Omran AF, Naji S, Khayat KH (2011) Portable Vane Test to Assess Structural Build-Up at Rest of Self-Consolidating Concrete. ACI Mat. J., 108(6):628-637.
4. Khayat KH, Omran AF, Pavate T (2010) Inclined Plane Test Method to Determine Structural Build-Up at Rest ofSelf-Consolidating Concrete. ACI Mat. J. 107(5):515-522.
5. Khayat KH, Omran AF (June 2011) Field Validation of SCC Formwork Pressure Prediction Models. J. of Con.Inter., 33(Issue 6):33-39.
6. Khayat KH, Omran AF, D'Ambrosia M (Sept. 2010) Prediction of SCC Formwork Pressure in Full-ScaleElements. Proceedings of 6th International RILEM Symposium on SCC, and 4th North American Conference onDesign and Use of SCC (SCC2010), Montreal, Canada, RILEM State of the Art Reports, Vol.1(Part 6):231-242.
7. Khayat KH, Omran AF (July/August, 2009) Evaluation of SCC formwork pressure. Concrete Infocus Magazine, aPublication of the National Ready Mixed Concrete Association – SCC: Developing Guidelines to Lower LateralPressure:16-19.
8. Khayat KH, Omran AF (June 2009) Evaluation of SCC Formwork Pressure. Proceedings of 2nd Inter. Sym. onDesign, Performance and Use of SCC (SCC2009), Eds. C Shi, Z Yu, KH Khayat, P Yan, RILEM Publications sarl,Beijing, China:43-55.
9. Khayat KH, Omran AF, Naji S, Billberg P, Yahia A (Nov. 2008) Test Methods to Evaluate Form Pressure of SCC.Proceedings of 3rd North American Conference on Design and Use of SCC (SCC 2008), Eds. Shah SP,Chicago:308-314.