Embed Size (px)
Citation preview

Termination Rate Debate Dr. Christoph Stork
Tuesday, 21 August 12

Termination = MonopolyMonopolies require price regulation Termination rates at cost of efficient operator
Provide incentive to invest in new technologies to reduce costsPromote competition and economic efficiencyPromote universal service through low retail prices
Tuesday, 21 August 12

Dominant operators will argue that if MTRs are lowered
Retail prices will increaseThere will be less subscribersOperators will invest lessHowever, the opposite is the case - Increased competition leads to:
lower retail pricesmore subscribers and operators have to invest more to stay competitive
Tuesday, 21 August 12

Waterbed Effects
Tuesday, 21 August 12

Readers Newspaper Advertisers
Two sided market Interdependent prices No cost causationNewspapers: lower price per newspaper = more readers= higher advertising revenue per page
Tuesday, 21 August 12

Two-sided market would predict
MTR OFF-Net
Fixed
Down
Up
On-net
Up
Up Less Subscribers
Tuesday, 21 August 12

Argument 1Wholesale Price: contractually fixedRetail Prices: Many prices varying product by product and change frequently
MTR On-NetPeak
On-Net Off Peak
On-Net Off Off Peak
OFF-Net
Peak
OFF-Net Off Peak
OFF-Net Off Off Peak
Fixed Peak
Fixed Off Peak
Fixed Off Off PeakOn-Net
SMS
OFF-Net SMS
Product 2
Product 1
Introduction of new cheaper products do not lead to MTR increases
Tuesday, 21 August 12

Argument 2Termination rates are mostly symmetrical ... contradicts the two-sided market argument
If Asymmetry then smaller has higher MTRMTR cannot be increased because of higher market share (newspaper example)
Operator 1
Operator 2
Tuesday, 21 August 12

p=x+a Off-Net Price
Operator 1Revenue=p*qMTR x
q=f(p) subject to price elasticity of
subscribers of operator 2Quantity of call
terminated
Argument 3Operators can only set their own retail prices but not those of other operators...Cannot control q and p
Operator 2
Tuesday, 21 August 12

High MTR = subsidisation within the sector
No funds from outside the sectorWhy should subscribers of one network subsidise subscribers from other networks?Why should one operator be given a subsidy to role out network infrastructure at the expense of another operators?
Tuesday, 21 August 12

Two-sided market & Waterbed Effect
Fail to predict market outcomes correctly Cannot be empirically observed following termination rate cutsRetail and wholesale prices are not interdependent
Tuesday, 21 August 12

0
1000
2000
3000
4000
0 5 10 15 20 25Cost
of O
ECD
bas
ket i
n US
cen
ts
Mobile Termination Rates 2009 in US cents
OECD countries (TMG2010)
Tuesday, 21 August 12

0
125
250
375
500
0 5 10 15 20 25
Min
utes
of u
se
Mobile Termination Rates 2009 in US cents
OECD countries (TMG2010)
Tuesday, 21 August 12

Pro Waterbed EffectsWaterbed effect is masked by other developments such as increased competition and decreasing unit costs Questionable evidence from panel data studies:
1) Constructing data sets with enough data points is impossible2) Omitted variables may render models invalid3) Retail prices used for modelling only prices of dominant operators
Tuesday, 21 August 12

No of operators
sequence of market entry
market shares
user profiles
lock-ins and club effects
technologies
price elasticity
income elasticity
business models used by
operatorsBrand loyalty
past regulatory
interventions
substitute technologies
regulatory strategies
communication laws and policies and many other social and economic factors
Mobile penetration rates and mobile retail prices in a country depend on many factors
Tuesday, 21 August 12

GhanaTanzania
KenyaNigeria
Ethiopia*Rwanda
BeninBotswana
TunisiaNamibiaSenegalUgandaZambia
Côte d’IvoireMozambiqueSouth Africa
CameroonBurkina Faso 11.04
8.59
7.64
7.45
7
6.57
6.33
6.12
5.06
5.06
5.04
4.92
3.74
3.74
3.63
3.35
2.93
2.29 GhanaTanzania
KenyaNigeria
Ethiopia*Rwanda
BeninBotswana
TunisiaNamibiaSenegalUgandaZambia
Côte d’IvoireMozambiqueSouth Africa
CameroonBurkina Faso 12.54
9.3
7.64
7.45
8.15
6.6
6.95
6.12
8.96
5.06
5.04
7.5
6.87
3.74
7.76
5.93
7.26
3.04
Cheapest operator Dominant operatorGhana
TanzaniaKenya
NigeriaEthiopia*
RwandaBenin
BotswanaTunisia
NamibiaSenegalUgandaZambia
Côte d’IvoireMozambiqueSouth Africa
CameroonBurkina Faso 12.54
9.3
10.36
8.32
9.54
8.18
7.04
7.52
8.96
5.36
6.66
8.81
6.87
3.74
7.76
5.93
7.26
3.15
Most expensive operator
Cheapest Prepaid product in country in US$Feb 2010
Tuesday, 21 August 12

Alternative 1: Panel data model based on operators not countries
Incorporate all operators of a countryIncrease the data available by a factor of 3 or 4allows to include significant explanatory variables such as market share and year of market entry The waterbed effect is a hypothesis about the pricing strategies of operators and as such need to be tested at the operator level
Tuesday, 21 August 12

Alternative 2: Case StudiesA less econometrically sophisticated but more plausible: Did Vodafone UK increase its retail prices after any MTR reduction in the UK? And how did the smaller operators or the net-interconnect-payers react?
Tuesday, 21 August 12

Case Study Kenya
Tuesday, 21 August 12

MTR US cents
Mar 2007 Mar 2009 July 2011 July 2013
1.201.401.752.70
5.376.40
7.60
Tuesday, 21 August 12

Retail Prices
Jan-10 Sep-10 Jan-11
1.962.24
0
1.901.91
4.12
1.142.09
6.15
2.46
6.70
7.75Safaricom* Airtel Orange Yu
Tuesday, 21 August 12

Safaricom’s key performance indicators for financial years ending in March
2007 2008 2009 2010
Revenue billion KES 47.45 61.37 70.48 83.96
Subscribers in million 6.10 10.23 13.36 15.79
EBITDA Margin 51.7% 45.9% 39.6% 43.6%After-tax profit in billion KES
12 13.85 10.54 15.15Dividend paid in billion KES
3 2 4 8
Tuesday, 21 August 12
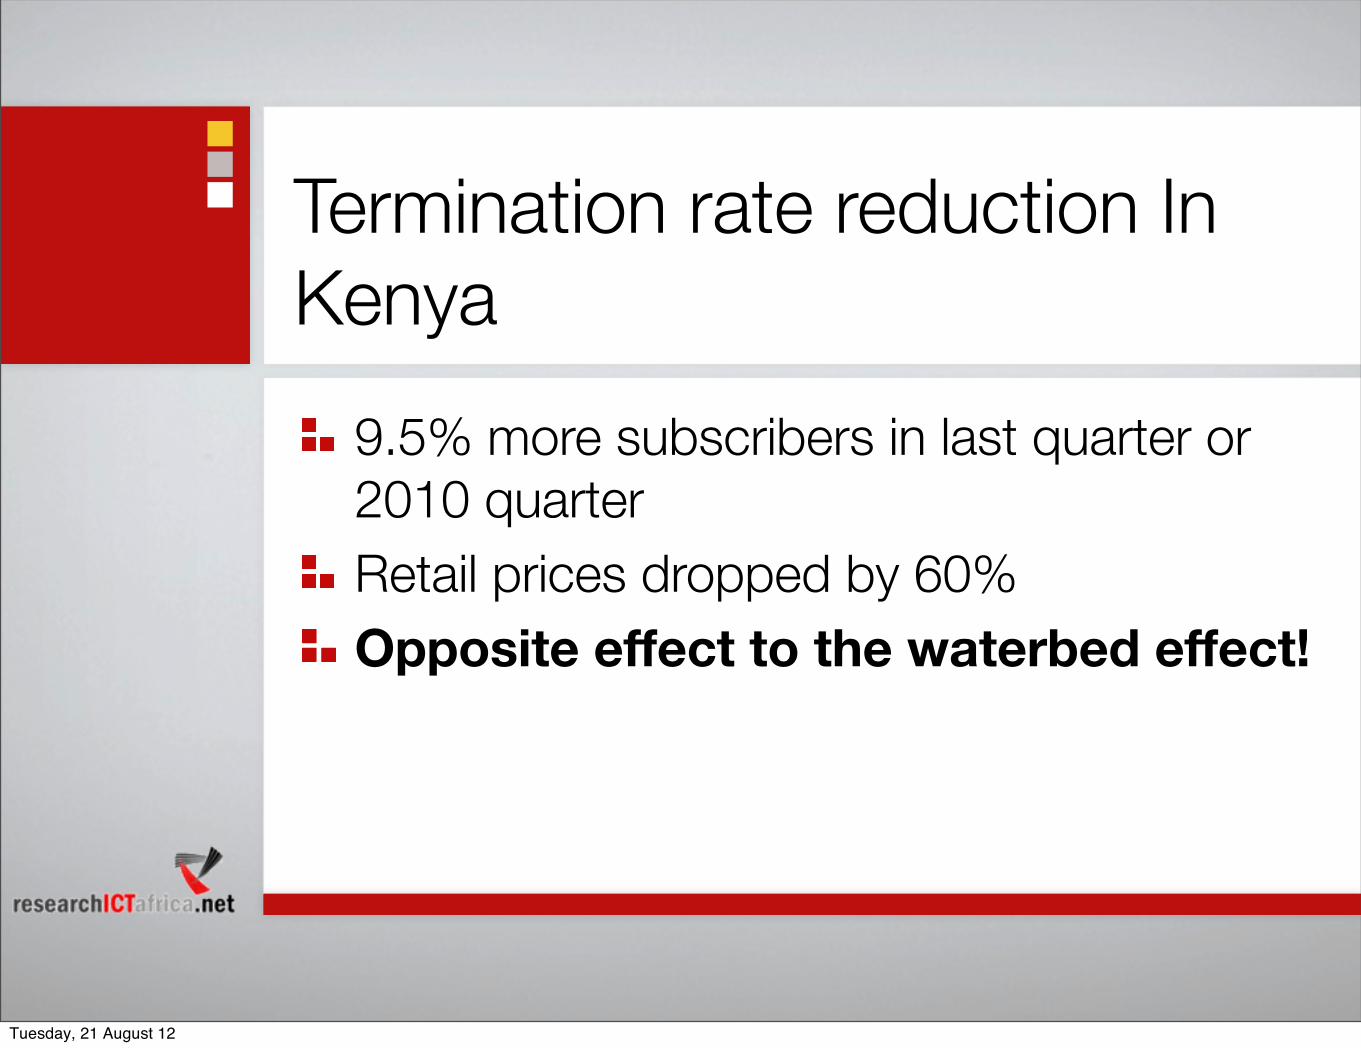
Termination rate reduction In Kenya
9.5% more subscribers in last quarter or 2010 quarterRetail prices dropped by 60%Opposite effect to the waterbed effect!
Tuesday, 21 August 12

Case Study Namibia
Tuesday, 21 August 12

In 2009 MTC stated that if termination rates are reduced to cost it’s
EBITDA margin would drop to 36.8%Would investment less and not be able to fund WACSPay less dividends to Government
Tuesday, 21 August 12

Termination Rates US cents
Jan 2009 July 2009 Jan 2010 July 2010 Jan 2011
4.105.50
6.808.20
9.00
4.105.50
6.808.20
14.40
MTRFTR
Tuesday, 21 August 12
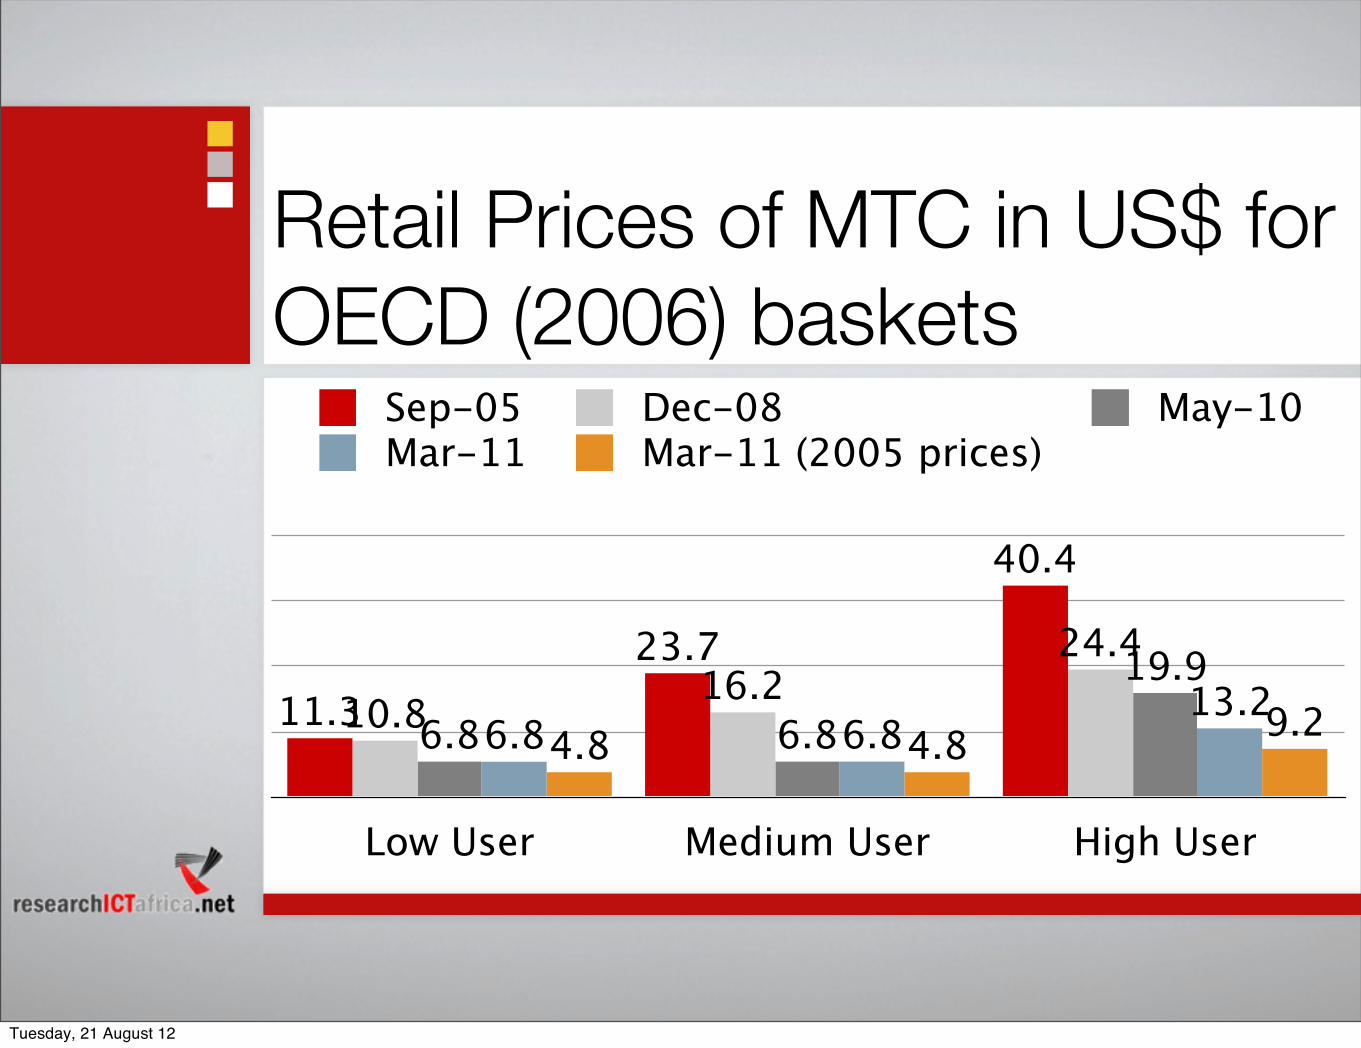
Retail Prices of MTC in US$ for OECD (2006) baskets
Low User Medium User High User
9.24.84.813.2
6.86.819.9
6.86.8
24.416.2
10.8
40.4
23.711.3
Sep-05 Dec-08 May-10Mar-11 Mar-11 (2005 prices)
Tuesday, 21 August 12

MTC key performance indicators
2005 2006 2007 2008 2009 2010
Subscribers in million 0.40 0.56 0.74 1.00 1.28 1.53
EBITDA Margin 61% 60.2% 52.2% 50.9% 53.8% 55.8%After-tax profit millionUS$
39.90 45.94 46.27 48.53 52.79 54.10Dividend paid in million US$
14.99 10.90 33.38 30.11 50.41 52.26Capital Expenditure in million US$ 35.4 55.9
Tax payments in million US$
19.96 23.35 24.11 24.62 27.10 25.5
Tuesday, 21 August 12

Case Study MTN
Nigeria, South Africa, Botswana
Tuesday, 21 August 12

Tuesday, 21 August 12

InterconnectLarge reduction in MTR in Nigeria and RSA
• MTR changes in Nigeria and RSA
• RSA peak rate dropped from ZAR 1.25 to
Large reduction in MTR in Nigeria and RSA
Group interconnect(ZAR bn)
p ppZAR 0.89
• Nigeria peak rate dropped from 11.4 Naira to 8.2 Naira
2009 19.5
Cost Revenue
-14.1• Interconnect revenue decreased 13%
• RSA revenue decreased 10%
• Nigeria revenue decreased 25% in local currency5 4 Margin % currency
• Net interconnect margin increased from 28% to 32%
• Higher on net traffic offset some of the
5.4 Margin %
28%
• Higher on-net traffic offset some of the interconnect rate decline
• RSA prepaid on-net improved 7pts to 61%
• Nigeria total on-net increased by 4pts to 83%
2010 17.0-11.5
• Nigeria total on net increased by 4pts to 83%
5.5 Margin %
32%32%
Tuesday, 21 August 12

High User OECD usage baskets in US$
MTN South Africa Mascom MTN Nigeria
36.544.4
68.4
36.544.4
68.457.9
44.4
68.460.7
46.6
68.4
US c
ents
Feb 2010 Jan 2011 Feb 2011 Mar 2011
Tuesday, 21 August 12

ConclusionNo Waterbed Effect in Namibia, Kenya, Botswana, South Africa or NigeriaTwo-sided market argument can clearly be rejectedRetail prices decrease after termination rate cutsOperators pursue different pricing strategiesCost based termination rates lead to more competition:
more subscribersmore trafficmore investmentbigger pie of revenues to share among operators
Tuesday, 21 August 12

More recent evidence
Tuesday, 21 August 12

Vodacom - Impact of mobile termination rates in South Africa
FY 2011 ending March 2011
FY2012 ending March 2012
Difference
Interconnection Revenue 6,755 6,062 -693
Interconnection Expenditure 5,682 4,923 -759
Net Interconnect Profit 1,073 1,139 66
Tuesday, 21 August 12

Telkom Fixed-line operating revenues and expenses in ZAR million (Telkom 2011, Telkom 2012)
Telkom Fixed-line operating revenues and expenses in ZAR million (Telkom 2011, Telkom 2012)
Telkom Fixed-line operating revenues and expenses in ZAR million (Telkom 2011, Telkom 2012)
Telkom Fixed-line operating revenues and expenses in ZAR million (Telkom 2011, Telkom 2012)
FY 2011 ending March 2011
FY2012 ending March 2012
Interconnection Revenues
Total Revenues 1,679 1,757
Interconnection Revenues
Mobile Domestic 498 375Interconnection Revenues Mobile International 186 630Interconnection Revenues
Fixed 328 262
Interconnection Revenues
International 667 490
Interconnection Expenses
Total Expenditure 5,193 4,839
Interconnection Expenses
Mobile network operators 3,704 3,218Interconnection Expenses Fixed 404 306Interconnection Expenses
International network operators 792 1,029
Interconnection Loss TotalInterconnection Loss Total -3,514 -3,082Interconnection Loss Mobile onlyInterconnection Loss Mobile only -3,206 -2,843Tuesday, 21 August 12

MTNMTN South Africa is a net-receiverNet profit (revenues - expenses) from call termination decreased from ZAR 1,481 million in 2010 to ZAR 1,182 million in 2011 However MTN is still a net-receiverhttp://www.mtn.com/Investors/Financials/Documents/booklet.pdf, accessed 19 June 2012
Tuesday, 21 August 12

Table 6 Mobile Termination glide PathTable 6 Mobile Termination glide PathTable 6 Mobile Termination glide PathProduct Peak Off Peak
March 2011 73c 65cMarch 2012 56c 52cMarch 2013 40c 40cSource: Government Gazette No. 33698, 29 October 2010. Call Termination RegulationsSource: Government Gazette No. 33698, 29 October 2010. Call Termination RegulationsSource: Government Gazette No. 33698, 29 October 2010. Call Termination Regulations
Tuesday, 21 August 12

January 2012 OECD Low User Basket costs in USD (FX= average 2010)January 2012 OECD Low User Basket costs in USD (FX= average 2010)January 2012 OECD Low User Basket costs in USD (FX= average 2010)January 2012 OECD Low User Basket costs in USD (FX= average 2010)January 2012 OECD Low User Basket costs in USD (FX= average 2010)January 2012 OECD Low User Basket costs in USD (FX= average 2010)
Country Name Cheapest product from Dominant OperatorCheapest product from Dominant Operator Cheapest product in countryCheapest product in country % cheaper than dominant Country Name Rank US$ Rank US$ % cheaper than dominant
Mauritius 1 2.39 5 2.39 Dominant is cheapestEthiopia 2 2.61 7 2.61 naNamibia 3 2.74 8 2.74 Dominant is cheapestKenya 4 2.85 1 1.90 33.4%Egypt 5 2.91 9 2.91 Dominant is cheapestSudan 6 3.53 6 2.46 30.5%Ghana 7 3.87 11 3.28 15.1%Libya 8 3.90 14 3.90 Dominant is cheapestRwanda 9 4.28 3 2.16 49.4%Guinea 10 4.62 2 1.93 58.1%Sierra Leone 11 5.04 13 3.88 23.1%Uganda 12 5.51 10 2.94 46.6%Congo Brazaville 13 5.63 17 5.63 Dominant is cheapestTanzania 14 5.82 12 3.75 35.7%Algeria 15 6.21 4 2.28 63.3%Tunisia 16 7.24 18 6.46 10.9%Senegal 17 8.11 24 8.11 Dominant is cheapestBotswana 18 8.16 20 7.66 6.0%Sao Tome &Principe 19 8.21 25 8.21 Dominant is cheapestNigeria 20 8.40 16 5.22 37.8%Madagascar 21 8.45 27 8.45 Dominant is cheapestMali 22 8.78 29 8.78 Dominant is cheapestBurkina Faso 23 8.88 28 8.53 4.0%Benin 24 9.10 22 7.92 13.0%Mozambique 25 10.00 33 10.00 Dominant is cheapestChad 26 10.14 34 10.14 Dominant is cheapestD.R. Congo 27 10.37 19 7.62 26.5%Côte d’Ivoire 28 10.41 36 10.41 Dominant is cheapestCameroon 29 10.44 35 10.28 1.5%South Africa 30 11.07 32 9.83 11.2%Togo 31 11.18 38 11.18 Dominant is cheapestZambia 32 12.05 26 8.22 31.8%Niger 33 12.30 31 9.77 20.6%Central African Republic 34 12.33 39 12.33 Dominant is cheapestAngola 35 12.50 41 12.50 Dominant is cheapestSwaziland 36 12.87 44 12.87 naMalawi 37 13.01 45 13.01 Dominant is cheapestZimbabwe 38 13.48 43 12.67 6.0%Morocco 39 13.56 42 12.53 7.6%Gabon 40 16.11 30 9.09 43.5%Lesotho 41 16.51 40 12.43 24.7%Cape Verde 42 18.15 46 18.15 Dominant is cheapestGambia 43 na 15 4.33 naMauritania 44 na 21 7.77 naLiberia 45 na 23 8.09 naSeychelles 46 na 37 11.04 naSource: Research ICT Africa Mobile Pricing Report 2012Source: Research ICT Africa Mobile Pricing Report 2012Source: Research ICT Africa Mobile Pricing Report 2012Source: Research ICT Africa Mobile Pricing Report 2012Source: Research ICT Africa Mobile Pricing Report 2012Source: Research ICT Africa Mobile Pricing Report 2012
Tuesday, 21 August 12

January 2012 May 2012
27
32
24
30
Cheapest prepaid product from Dominant OperatorCheapest prepaid product in country
Tuesday, 21 August 12

40
55
70
85
100
Jan 11 Mar 11 May 11 Jul 11 Sept 11 Nov 11 Jan 12 Mar 12 May 12
8ta Cell C MTN South AfricaVodacom South Africa Virgin Mobile
Tuesday, 21 August 12

On-net / Off-net differentialOn-net / Off-net differentialOn-net / Off-net differentialOn-net / Off-net differentialOn-net / Off-net differentialOperator Product Jan-12 May 2012 Price Change
8taPrepaid Voice 0 0 0.00
Cell C
99 for real NA 0.00 NA
Cell CEasychat 99c 0.51 0.51 0.00
Cell CEasychat allday 0 0 0.00Cell CEasychat per second 0 0 0.00
Cell C
Easychat standard 0 0 0.00
MTN
Call Per Second 0.17 0.17 0.00
MTNCall Per Second Peak 0.00 0.00 0.00
MTNMuziq 0.50 0.50 0.00MTNOne Rate 0 0 0.00
MTN
Zone 0.35 0.35 0.00Virgin MobilePrepay 0.74 0.74 0.00
Vodacom
Freedom 99 NA 0.00 NA
Vodacom
4U Prepaid 0.18 0.18 0.00
VodacomBig Bonus Voucher 0.26 0.26 0.00
VodacomPrepaid All Day per minute 0 0 0.00VodacomPrepaid All Day per second 0.10 0.10 0.00
Vodacom
Vodacom 4 less 0.29 0.29 0.00
Vodacom
Day saver 0.33 0.33 0.00
Tuesday, 21 August 12