Embed Size (px)
Citation preview
General rights Copyright and moral rights for the publications made accessible in the public portal are retained by the authors and/or other copyright owners and it is a condition of accessing publications that users recognise and abide by the legal requirements associated with these rights.
Users may download and print one copy of any publication from the public portal for the purpose of private study or research.
You may not further distribute the material or use it for any profit-making activity or commercial gain
You may freely distribute the URL identifying the publication in the public portal If you believe that this document breaches copyright please contact us providing details, and we will remove access to the work immediately and investigate your claim.
Downloaded from orbit.dtu.dk on: Dec 13, 2020
Terahertz Technology for Defense and Security-Related Applications
Iwaszczuk, Krzysztof
Publication date:2012
Document VersionPublisher's PDF, also known as Version of record
Link back to DTU Orbit
Citation (APA):Iwaszczuk, K. (2012). Terahertz Technology for Defense and Security-Related Applications. Technical Universityof Denmark.

Technical University of Denmark
Terahertz Technology for
Defense and Security-Related
Applications
by
Krzysztof Iwaszczuk
A thesis submitted in partial fulfillment for the
degree of Doctor of Philosophy
in the
DTU Fotonik
Department of Photonics Engineering
August 2012


Abstract
This thesis deals with chosen aspects of terahertz (THz) technology that
have potential in defense and security-related applications.
A novel method for simultaneous data acquisition in time-resolved THz
spectroscopy experiments is developed. This technique is demonstrated
by extracting the sheet conductivity of photoexcited charge carriers in
semi-insulating gallium arsenide. Comparison with results obtained us-
ing a standard data acquisition scheme shows that the new method
minimizes errors originating from fluctuations in the laser system out-
put and timing errors in the THz pulse detection. Furthermore, a new
organic material, BNA, is proved to be a strong and broadband THz
emitter which enables spectroscopy with a bandwidth twice as large as
conventional spectroscopy in the field.
To access electric fields allowing exploration of THz nonlinear phenom-
ena, field enhancement properties of tapered parallel plate waveguides
are investigated. A new method for imaging of the electric field distribu-
tion inside a parallel plate waveguide is developed and used to measure
frequency-resolved field reflection coefficients. Field enhancement fac-
tors higher than 20 are demonstrated and record-high field strengths of
> 1.4 MV/cm are reached. A good agreement between two independent
methods of field measurement and a numerical time-domain simulation
is shown.
Finally, and extensive study of THz radar cross sections (RCS) of scale
models of airplanes is carried out. Angle- and frequency-resolved RCS
of aircraft fighters F-16 and F-35 are measured. The scaling law allows
for translating THz RCS results to the microwave regime. 2D cross
section images of the airplanes are reconstructed. Range resolution of
0.27 mm and cross range resolution of 0.19 mm is reached. Properties
of flexible absorbing metamaterials for the THz stealth technology are
investigated and significant reduction of the RCS is shown.
iii


Resume
Denne afhandling omhandler udvalgte aspekter af terahertz (THz) teknologi
med potentiale i forsvars- og sikkerheds-relaterede applikationer.
En ny metode til samtidig dataopsamling i tidsopløst THz spektroskopi
eksperimenter er blevet udviklet. Denne teknik demonstreres ved bestem-
melse af fladekonduktiviteten af fotogenererede ladningsbrere i semi-
isolerende gallium arsenid. En sammenligning med resultater opnaet ved
hjælp af en standard dataopsamlingsprocedure viser at den nye metode
minimerer fejl stammende fra fluktuationer i laser systemet og timing
fejl i THz puls detektionen. Ydermere er det vist at et nyt organisk
materiale, BNA, virker som en kraftig og bredbandet THz kilde, som
muliggør spektroskopi med en bandbredde der er dobbelt sa stor som i
konventionel spektroskopi indenfor dette felt.
For at fa adgang til elektriske feltstyrker som tillader udforskning af
ikke-linere THz fnomener, undersøges feltforstrkningsegenskaberne for
tilspidsede parallel-plade-bølgeledere. En ny metode til visualisering
af det elektriske felt inde i en parallel-plade-bølgeleder er udvikles, og
anvendes til at male frekvensopløste feltreflektionskoefficienter. Felt-
forstrkningsfaktorer større end 20 demonstreres og rekordhøje feltstyrker
> 1.4 MV/cm opnaas. En god overensstemmelse findes mellem to
uafhængige metoder til bestemmelse af feltstyrke og en numeriske tids-
domne simulation.
Til sidst gennemføres en omfattende undersøgelse af THz radar cross
sections (RCS) for modelfly. Vinkel- og frekvens-opløste RCS males
for F-16 og F-35 model jagerfly. Skaleringsloven tillader at THz RCS
kan omsttes til mikrobølgeomradet. 2D tværsnitsbilleder rekonstrueres
for flyene. En Range-opløsning pa 0.27 mm opnas og en cross-range-
opløsning pa 0.19 mm opnas. Egenskaberne for fleksible absorberende
metamaterialer til THz-stealth-teknologi undersøges og en signifikant
reduktion af RCS pavises.
v


Preface
This Ph.D. thesis is the summary of the work conducted during my
employment as Ph.D. student at the Technical University of Denmark
(DTU) in the period September 2008 until September 2011, under su-
pervision of Professor Peter Uhd Jepsen from DTU and Senior Scientist
Henning Heiselberg from Danish Defense Acquisition and Logistics Or-
ganization.
Most of the results presented in this thesis are obtained at DTU Fotonik -
Department of Photonics Engineering, Technical University of Denmark.
During the 3 year-long Ph.D. project I spent 4.5 months at the external
stay at the Rensselear Polytechnic Institute (RPI) in Troy, USA, where
I visited Prof. Xi-Cheng Zhang. All the experimental results presented
in the chapter 4 were obtained in the laboratories in the Center for
THz Research at RPI. Numerical simulations from that chapter were
performed by Andrei Andryieuski from DTU Fotonik.
The near-perfect metamaterial absorbers, investigated in the chapter 5,
were designed and manufactured at Boston University by Xin Zhang,
Kebin Fan, Andrew C. Strikwerda and Prof. Richard D. Averitt.
This Ph.D. project was partially financed by DTU Fotonik, Techni-
cal University of Denmark (1/3), Forsvarets Materieltjeneste - Danish
Defense Acquisition and Logistics Organization (1/3) and Photonics
Academy Denmark (1/3). My external scientific stay at the Rensse-
lear Polytechnic Institute received external financial support from Idella
Foundation. Expenses connected to travels for international conferences
were co-financed by Otto Mønsted Fond.
Krzysztof Iwaszczuk
Kgs. Lyngby, September 14th, 2011
vii


Contents
Abstract iii
Resume v
Preface vii
List of Figures xi
1 Introduction 1
1.1 Brief introduction to THz . . . . . . . . . . . . . . . . . . 1
1.2 Organization of thesis . . . . . . . . . . . . . . . . . . . . 7
2 Terahertz pulses 11
2.1 Laser system . . . . . . . . . . . . . . . . . . . . . . . . . 11
2.2 Generation of terahertz radiation . . . . . . . . . . . . . . 14
2.2.1 Optical rectification . . . . . . . . . . . . . . . . . 16
2.2.2 Generation of high-power terahertz pulses by tilted-pulse-front excitation . . . . . . . . . . . . . . . . . 20
2.3 Detection of terahertz radiation . . . . . . . . . . . . . . . 23
3 Simultaneous reference and differential waveform acqui-sition in time-resolved terahertz spectroscopy 29
3.1 Time-domain terahertz spectroscopy . . . . . . . . . . . . 30
3.2 Time-resolved terahertz spectroscopy . . . . . . . . . . . . 34
3.3 Drude conductivity . . . . . . . . . . . . . . . . . . . . . . 38
ix

Contents x
3.4 Experimental Setup . . . . . . . . . . . . . . . . . . . . . 39
3.5 Results . . . . . . . . . . . . . . . . . . . . . . . . . . . . . 45
3.6 Conclusions . . . . . . . . . . . . . . . . . . . . . . . . . . 51
4 Imaging THz field insidea parallel plate waveguide 53
4.1 Terahertz waveguides . . . . . . . . . . . . . . . . . . . . . 54
4.2 Parallel plate waveguides . . . . . . . . . . . . . . . . . . 55
4.3 Air bias coherent detection . . . . . . . . . . . . . . . . . 58
4.4 Imaging terahertz field inside parallel plate waveguide . . 60
4.5 Field enhancement inside tapered parallel plate waveguide 67
4.6 Conclusions . . . . . . . . . . . . . . . . . . . . . . . . . . 82
5 Terahertz radar cross sections 85
5.1 Radar Cross Sections (RCS) . . . . . . . . . . . . . . . . . 87
5.1.1 Synthetic aperture and inverse synthetic apertureradar imaging . . . . . . . . . . . . . . . . . . . . . 94
5.2 Terahertz Computed Tomography . . . . . . . . . . . . . 95
5.3 Experimental Setup . . . . . . . . . . . . . . . . . . . . . 97
5.4 Terahertz radar cross section on scale models of aircrafts . 101
5.5 Stealth metamaterial objects characterized in the far fieldby Radar Cross Section measurements . . . . . . . . . . . 111
5.6 Conclusions . . . . . . . . . . . . . . . . . . . . . . . . . . 118
6 Conclusions and outlook 121
A Acknowledgements 127
B Ph.D. Publications 129
B.1 Peer Reviewed Journal . . . . . . . . . . . . . . . . . . . . 129
B.2 Conference Contributions . . . . . . . . . . . . . . . . . . 130
B.3 Book chapters . . . . . . . . . . . . . . . . . . . . . . . . . 132
Bibliography 133

List of Figures
1.1 The electromagnetic spectrum . . . . . . . . . . . . . . . . 2
1.2 Number of publications in the THz field . . . . . . . . . . 3
2.1 Laser system in the DTU TERAWATT LAB. . . . . . . . 12
2.2 Output spectra and autocorrelation traces of the laserpulse. . . . . . . . . . . . . . . . . . . . . . . . . . . . . . 14
2.3 Photon picture of DFG . . . . . . . . . . . . . . . . . . . 16
2.4 Molecular formula of BNA crystal . . . . . . . . . . . . . 18
2.5 Properties of THz generation in BNA . . . . . . . . . . . 20
2.6 Red shift in BNA . . . . . . . . . . . . . . . . . . . . . . . 21
2.7 THz generation in LiNbO3 in a tilted wavefront configu-ration. . . . . . . . . . . . . . . . . . . . . . . . . . . . . . 22
2.8 THz pulse energy generated in LiNbO3. . . . . . . . . . . 24
2.9 Electrooptic detection . . . . . . . . . . . . . . . . . . . . 25
3.1 THz absorption spectra of explosives . . . . . . . . . . . . 31
3.2 THz trasmission through a sample . . . . . . . . . . . . . 32
3.3 THz transmission through unexcited and photoexcitedsample . . . . . . . . . . . . . . . . . . . . . . . . . . . . 35
3.4 THz waveform for time-resolved spectroscopy . . . . . . . 37
3.5 Complex conductivity according to the Drude model . . . 39
3.6 Schematic of the simultaneous reference and differentialwaveform acquisition TRTS setup . . . . . . . . . . . . . . 40
3.7 Waveform and spectrum of THz radiation generated inBNA crystal . . . . . . . . . . . . . . . . . . . . . . . . . . 42
3.8 Time sequence of incoming pulses . . . . . . . . . . . . . . 43
xi

List of Figures xii
3.9 Bias photodetector time response . . . . . . . . . . . . . . 45
3.10 Test of simultaneous reference and differential waveformacquisition . . . . . . . . . . . . . . . . . . . . . . . . . . . 46
3.11 Comparison of independently and simultaneously acquiredcomplex sheet conductivities . . . . . . . . . . . . . . . . . 48
3.12 Complex sheet conductivity of photoexcited conjugatedpolymer/CdSe nanorod composites . . . . . . . . . . . . . 50
4.1 Schematic of the parallel plate waveguide. . . . . . . . . . 56
4.2 Schematic diagram of ABCD detection. . . . . . . . . . . 58
4.3 Schematic of THz generation and coupling to the taperedparallel plate waveguide. . . . . . . . . . . . . . . . . . . . 60
4.4 Schematic of the air photonic setup for non-invasive fieldimaging inside a tapered parallel plate waveguide. . . . . 61
4.5 Normalized maximum second harmonic intensity as a func-tion of interaction length . . . . . . . . . . . . . . . . . . . 64
4.6 2D map of THz induced second harmonic. . . . . . . . . . 66
4.7 Frequency dependent amplitude reflection coefficient ofthe waveguide end. . . . . . . . . . . . . . . . . . . . . . . 68
4.8 Output intensity distributions. . . . . . . . . . . . . . . . 69
4.9 Field reduction at the output the the PPWG . . . . . . . 70
4.10 Field enhancement at the output the the PPWG . . . . . 71
4.11 THz field along the TPPWG . . . . . . . . . . . . . . . . 74
4.12 Field distributions along the TPPWG . . . . . . . . . . . 75
4.13 Diffraction losses in TPPWG . . . . . . . . . . . . . . . . 77
4.14 Schematic of the electro-optic detection for tapered par-allel plate waveguide. . . . . . . . . . . . . . . . . . . . . . 77
4.15 THz induced SH. . . . . . . . . . . . . . . . . . . . . . . . 79
4.16 Test of linearity THz-induced SH. . . . . . . . . . . . . . . 80
4.17 Peak electric field at the TPPWG output. . . . . . . . . . 81
4.18 Waveforms and normalized spectra of THz transmittedthrough TPPWG . . . . . . . . . . . . . . . . . . . . . . . 82
5.1 Monostatic and bistatic radar configuration . . . . . . . . 87
5.2 Typical values of RCS . . . . . . . . . . . . . . . . . . . . 88
5.3 RCS of a conducting sphere . . . . . . . . . . . . . . . . . 91

List of Figures xiii
5.4 RCS of sphere cylinder and flat plate . . . . . . . . . . . 91
5.5 Wave scattering by a flat plate . . . . . . . . . . . . . . . 92
5.6 RCS of a flat disc . . . . . . . . . . . . . . . . . . . . . . 93
5.7 Schematic of the Radon transform . . . . . . . . . . . . . 96
5.8 Schematic radar cross section setup . . . . . . . . . . . . . 98
5.9 THz waveform and spectrum for RCS measurements . . . 100
5.10 Schematic radar cross section setup . . . . . . . . . . . . . 102
5.11 Instantaneous amplitude of a THz transient . . . . . . . 103
5.12 Sinograms and RCS for scale model of F-16 aircraft . . . 106
5.13 RCS of scale model of F-35 aircraft . . . . . . . . . . . . 107
5.14 Frequency-resolved azimuthal RCS of a F-16 scale model 107
5.15 Cross section of the metal test target . . . . . . . . . . . . 108
5.16 Cross section of the scale model of the F-16 aircraft . . . 110
5.17 Metamaterial unit cell layout . . . . . . . . . . . . . . . . 113
5.18 Measured reflection coefficient at normal incidence of thesamples . . . . . . . . . . . . . . . . . . . . . . . . . . . . 114
5.19 Position-dependent reflection spectrum of the sample . . . 116
5.20 RCS measurements of the MM-covered cylinder . . . . . 117

Chapter 1
Introduction
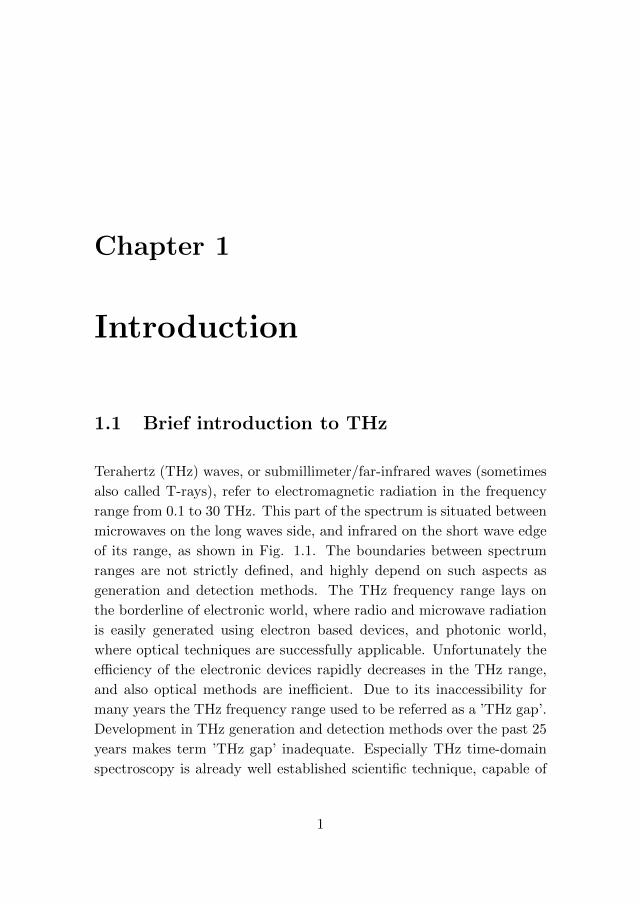
1.1 Brief introduction to THz
Terahertz (THz) waves, or submillimeter/far-infrared waves (sometimes
also called T-rays), refer to electromagnetic radiation in the frequency
range from 0.1 to 30 THz. This part of the spectrum is situated between
microwaves on the long waves side, and infrared on the short wave edge
of its range, as shown in Fig. 1.1. The boundaries between spectrum
ranges are not strictly defined, and highly depend on such aspects as
generation and detection methods. The THz frequency range lays on
the borderline of electronic world, where radio and microwave radiation
is easily generated using electron based devices, and photonic world,
where optical techniques are successfully applicable. Unfortunately the
efficiency of the electronic devices rapidly decreases in the THz range,
and also optical methods are inefficient. Due to its inaccessibility for
many years the THz frequency range used to be referred as a ’THz gap’.
Development in THz generation and detection methods over the past 25
years makes term ’THz gap’ inadequate. Especially THz time-domain
spectroscopy is already well established scientific technique, capable of
1

Chapter 1. Introduction 2
providing information about investigated objects unobtainable by other
methods [1, 2].
100 103 106 109 1012 1015 1018 1021 Frequency [Hz]
microwaves IR X-ray
THzRadio waves UV
electronics photonics
-ray
kilo mega giga tera peta exa zetta
Figure 1.1: The electromagnetic spectrum. The terahertz region issituated between microwaves and infrared (IR). The visible part of thespectrum is shown between the infrared and ultraviolet (UV) regions.
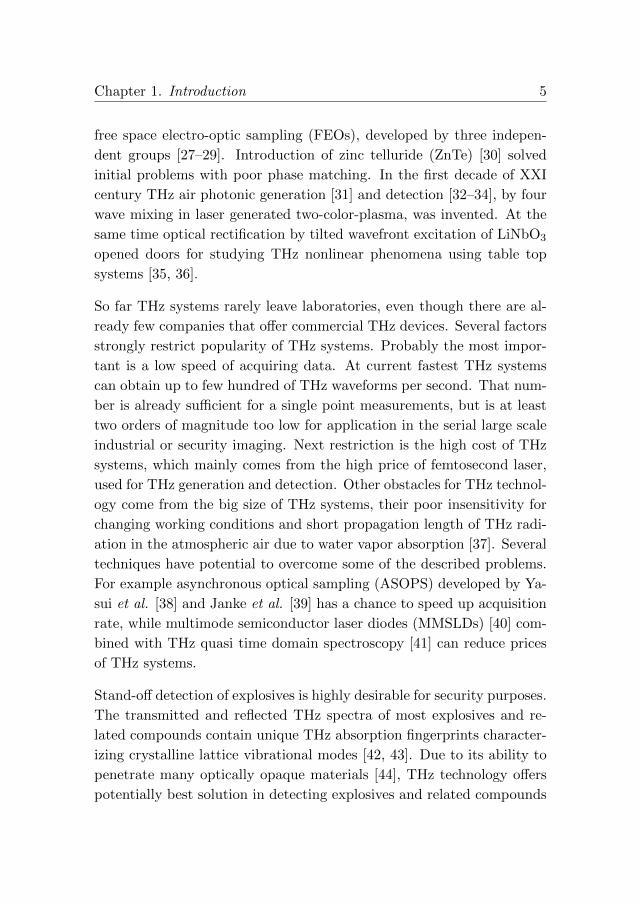
Terahertz technology is an extremely active field of science with the
number of publications increasing rapidly. Fig. 1.2 shows result of the
search on Web of Science for journal articles with ’terahertz’ or ’THz’
in the title. In the last 20 years the number of publications in this field
has increased nearly by a factor of 100 and judging by the exponential
growth it is going to continue increasing for at least next couple of years.
This high interest in the THz science has its origins in unique proper-
ties of the THz radiation. The frequency of 1 THz corresponds to one
trillion oscillation per second, or one oscillation per picosecond. In the
equivalent units 1 THz is:
1 THz ≡ 300µm ≡ 4.14 meV ≡ 33.3 cm−1 ≡ 47.6 K.
THz waves have low photon energies (4.14 meV for 1 THz, which is 1 mil-
lion times weaker than X-ray) and do not cause harmful photoinoization
in biological tissues [3, 4]. For that reason THz radiation is considered
completely safe for potential sensing and imaging techniques. THz waves
can penetrate through many optically opaque nonpolar dielectrics, such

Chapter 1. Introduction 3
1 9 9 0 1 9 9 5 2 0 0 0 2 0 0 5 2 0 1 01 0
1 0 0
1 0 0 0
N u m b e r o f j o u r n a l a r t i c l e s # b e f o r e 1 9 8 9 # i n 2 0 1 1 o n S e p t 1 0 t h
E x p o n e n t i a l f i t
Numb
er of
journa
l artic
les pe
r yea
r
Y e a r
Figure 1.2: Number of journal publications per year in the THz field.Data obtained as a search result on Web of Science for ’terahertz’ or
’THz’ in the publication title.
as paper, textile, plastic or ceramic with low attenuation. The THz fre-
quency range hosts low frequency crystalline lattice vibrations - phonon
modes, hydrogen-bonding stretches and other intermolecular vibrations
and rotational transitions of molecules in many chemical and biological
materials, including many explosives and drugs. The wealth of unique
spectroscopic signatures in the THz energy range for all states of mat-
ter (gasses, liquids, solid-state and even plasma), makes THz ideal for
spectroscopic purposes. Because of its spectroscopic properties com-
bined with ability to image under covers or containers and non-ionising
photon energies, THz waves are considered highly competitive for non-
destructive and noninvasive sensing.
The electromagnetic radiation at THz frequencies interacts strongly with
systems that have characteristic lifetimes in the picosecond range and
energy transitions in the meV range. To the long list of such systems one
can account bound electrical charges [5], free charge plasma [6], excitons
[7], phonons [8], molecular crystals [9], and relaxations in liquids [10].

Chapter 1. Introduction 4
Subpicosecond broadband THz transients are an excellent tool to study
dynamics of ultrafast processes in semiconductors [11–14], which under-
standing is crucial for development of new electronic devices. Except of
purely scientific applications of THz technology, numerous practical ap-
plications start to emerge. THz techniques have high potential in such
opto-electronic areas as industrial control, pharmaceutics, medical di-
agnostics, security applications, high-speed wireless communication and
art conservation [1, 15–17].
There are several milestones that have made THz spectroscopy well es-
tablished scientific technique. As the first one, Fourier transform in-
frared (FTIR) spectroscopy developed in 1950’s should be mentioned
[18, 19]. FTIR combines interferometry and broadband infrared detec-
tors to achieve frequency resolution. Together with implementation of
fast Fourier transform (FFT) algorithm and first computers, FTIR be-
came a standard analytical method in the far- and mid-infrared range.
The next important development in the THz range started in 1960’s
with invention of maser and laser, which led to the invention of various
THz gas lasers (e.g. CO2 pumped methanol laser at 2.5 THz [20]).
A major development, which is also based on a fundamentally different
approach to the THz spectroscopy, came with the discovery of ultrafast
mode-locked lasers. The pioneering work was done in 1970s by D. H.
Auston at Bell Laboratories [21], who used photoconductive dipole an-
tennas to generate far-infrared radiation. The first THz time domain
spectroscopy setup (THz-TDS) based on optical excitation of photo-
conductive dipole antennas was developed in 1989 by D. Grischkowsky
et al. [22]. The development of photoconductive switches was closely
connected to the invention of Ti:saphire laser in 1991 [23, 24]. The devel-
opment of ultrafast laser amplifiers initiated nonlinear THz generation
and detection techniques. The difference frequency generation (DFG)
between two ruby lasers was fist demonstrated by Faries et al. [25], and
then DFG from a single laser pulse in lithium niobate LiNbO3 [26], span-
ning frequency range from 0.05 to 0.5 THz was shown. 1995 brought
Chapter 1. Introduction 5
free space electro-optic sampling (FEOs), developed by three indepen-
dent groups [27–29]. Introduction of zinc telluride (ZnTe) [30] solved
initial problems with poor phase matching. In the first decade of XXI
century THz air photonic generation [31] and detection [32–34], by four
wave mixing in laser generated two-color-plasma, was invented. At the
same time optical rectification by tilted wavefront excitation of LiNbO3
opened doors for studying THz nonlinear phenomena using table top
systems [35, 36].
So far THz systems rarely leave laboratories, even though there are al-
ready few companies that offer commercial THz devices. Several factors
strongly restrict popularity of THz systems. Probably the most impor-
tant is a low speed of acquiring data. At current fastest THz systems
can obtain up to few hundred of THz waveforms per second. That num-
ber is already sufficient for a single point measurements, but is at least
two orders of magnitude too low for application in the serial large scale
industrial or security imaging. Next restriction is the high cost of THz
systems, which mainly comes from the high price of femtosecond laser,
used for THz generation and detection. Other obstacles for THz technol-
ogy come from the big size of THz systems, their poor insensitivity for
changing working conditions and short propagation length of THz radi-
ation in the atmospheric air due to water vapor absorption [37]. Several
techniques have potential to overcome some of the described problems.
For example asynchronous optical sampling (ASOPS) developed by Ya-
sui et al. [38] and Janke et al. [39] has a chance to speed up acquisition
rate, while multimode semiconductor laser diodes (MMSLDs) [40] com-
bined with THz quasi time domain spectroscopy [41] can reduce prices
of THz systems.
Stand-off detection of explosives is highly desirable for security purposes.
The transmitted and reflected THz spectra of most explosives and re-
lated compounds contain unique THz absorption fingerprints character-
izing crystalline lattice vibrational modes [42, 43]. Due to its ability to
penetrate many optically opaque materials [44], THz technology offers
potentially best solution in detecting explosives and related compounds

Chapter 1. Introduction 6
(ERCs). But the task is so complex and difficult that so far there is
none commercial system in use in real life situation, as for example se-
curity scanning at airports. The list of issues that has to be addressed
before such system will be built is long. It is enough just to mention:
low speed of obtaining spectra, short range of detection, influence of sur-
face quality of a real-life explosive and influence of the package material.
It also seems that building a library of the THz absorption spectra of
different ERCs is a step needed before THz techniques will become pop-
ular. In this thesis we have not investigated directly THz properties of
explosives nor methods of their detection. Instead we’ve focused on two
other issues: improving the acquisition scheme for time resolved THz
spectroscopy and field enhancement by tapered parallel plate waveg-
uides.
THz time-domain spectroscopy is undoubtedly powerful technique, but
all the spectra obtained by THz-TDS are static and no information
about sample dynamics is present. At the same time subpicosecond
THz transients, which are synchronized to optical femtosecond pulse
trains, open possibility for studying dynamical properties of picosecond
nonequilibrium processes in the THz frequency range. In the first part of
this thesis we focus on obtaining more accurate time resolved THz spec-
troscopy data, which is done by introducing new simultaneous reference
and differential waveform acquisition. It is shown that the application
of the new method minimizes errors in spectrally resolved photocon-
ductivity originating in laser instabilities and pulse timing jitter. In
recent years high power-table top THz sources became available [36].
THz electric fields with amplitude over 1 MV/cm will allow for investi-
gation of yet poorly-understood anharmonic interactions between differ-
ent phonon modes in molecular crystals including explosives and related
compounds. Nonlinear interactions and energetic coupling between lat-
tice vibrations will not only open a new big block of fundamental science,
but will also provide additional information about the investigated sam-
ple and its environment. In this perspective new simultaneous reference
and differential waveform acquisition method presented in this thesis is

Chapter 1. Introduction 7
a step towards time-resolved high field THz-pump THz-probe interac-
tions and particularly THz 2D spectroscopy [45]. To access the range of
nonlinear THz interactions, THz electric fields exceeding 1 MV/cm are
needed. In this thesis we investigate properties of tapered parallel plate
for enhancing THz field strength to reach required levels. For that pur-
pose we developed a novel non-invasive broadband method of imaging
the THz electric field inside parallel plate waveguide. We experimentally
demonstrate field enhancement factors over 20 and peak electric fields
exceeding 1.4 MV/cm. Measured values agree well with numerical time
domain simulations.
In the last part of this thesis we consider another topic, highly relevant
for defence applications, namely the measurement of the radar cross sec-
tion (RCS). RCS measurements is a standard technique, particularly
important for military purposes, including detection and identification
of aircrafts, ships and other targets. In case of large size massive objects,
such as full-size airplanes or ships, RCS measurements are complicated,
time consuming, and expensive. In this analysis we apply the scaling
law and basing on values measured in the low THz range (0.1-2 THz)
we obtain values that would be measured at typical radar frequencies.
Scaling factor between THz waves and radar microwaves results in sizes
of scale models on the order of centimeters, which are easy to manu-
facture by a rapid prototyping systems such as computer numerically
controlled 3D milling machines or a 3D printers. Furthermore, we in-
vestigate properties of flexible metamaterials for reduction of RCS and
potential use in THz stealth measurements.
1.2 Organization of thesis
This thesis is organized as follows:
Chapter 2 starts with basic description of the ultrafast laser amplifier
systems that have been used while performing experiments reported in

Chapter 1. Introduction 8
this thesis. Next a brief review of THz generation techniques is presented
with emphasis on optical rectification in nonlinear organic crystal BNA
and the generation of milijoule terahertz pulses by tilted-pulse-front ex-
citation in LiNbO3. The following part gives a short summary of dif-
ferent methods of detecting THz radiation. The free-space electro-optic
sampling is discussed in detail.
In chapter 3 we describe THz time domain spectroscopy techniques.
Basic concepts in time resolved THz spectroscopy are presented. Drude
model of conductivity is introduced, which is the most simple but also
best understood model of conductivity in semiconductor sample. As
a next part of the chapter we present in detail experimental setup for
simultaneous reference and differential waveform acquisition in time-
resolved terahertz spectroscopy. Subsequently setup calibration methods
are described. The chapter ends with results obtained for GaAs sample,
which is chosen as a test sample.
Chapter 4 begins with a short review of existing structures for guiding
THz waves. Particular attention is placed upon parallel plate waveguide
and its properties for dispersionless propagation of TEM mode. Next
we discuss air biased coherent detection of THz radiation and give a
detailed presentation of the experimental setup for non-invasive method
for characterization of the propagating electric field inside a tapered
parallel-plate waveguide. Frequency resolved reflection coefficients for
the waveguide tip are extracted. Field enhancement properties of a TP-
PWG are discussed. Analytical and numerical approaches are compared
and based on differences diffraction losses are estimated. We show that
THz electric fields exceeding 1.4 MV/cm with 20 µm waveguide output
gap are possible to be achieved. Results are verified using two different
methods and agree well with numerical predictions.
Chapter 5 deals with terahertz radar cross section measurements. Chap-
ter starts with an introduction to radar techniques. A definition of radar
cross section is given and scattering properties of simple scatterers like
conducting sphere, cylinder and plate are discussed. Thereafter a short
Chapter 1. Introduction 9
review of terahertz computed tomography is given. Following we present
in detail the experimental setup that was used for performing radar
cross section measurements with a setup calibration discussion. Next
we present polar and azimuthal time- and frequency resolved RCS plots
of F-16 and F-35 fighter aircraft models rotated on a pedestal. The
time domain sub-ps resolution allows for sub-mm range resolution and
also allows for identification of scattering points. The shape of the mod-
els and positions of scattering parts are retrieved by the filtered back
projection algorithm.
In chapter 6 a summary of the work presented in this thesis is given.
Conclusions are drawn and the outlook for future is presented.


Chapter 2
Terahertz pulses
This chapter starts with a basic description of the laser systems that
have been used to obtain experimental results presented in this thesis.
Thereafter different sources of THz radiation are discussed, with partic-
ular attention to optical rectification in nonlinear organic crystal BNA
and generation of high-power terahertz pulses by tilted-pulse-front ex-
citation in LiNbO3. Such interesting phenomena as a strong redshift
of near-infrared spectrum transmitted through BNA or saturation of
efficiency of generation in LiNbO3 are reported. Different methods of
detecting THz radiation are also presented, with focus on free-space
electro-optic sampling, which has been used intensively through out this
thesis.
2.1 Laser system
The work presented in this thesis would not have been possible if not for
the development of ultrafast laser systems and particulary high power ul-
trafast laser amplifiers. Experiments performed in this thesis have been
done using two regenerative laser amplifier systems: Spectra-Physics
11

Chapter 2. Terahertz pulses 12
Spitfire and Hurricane also from Spectra-Physics. The first one will be
described in more detail below. A regenerative amplifier is a device
which is used for strong amplification of optical pulses, where multi-
ple passes through the gain medium are achieved by placing the gain
medium in an optical resonator [46]. An optical switch, in most cases
realized as an electro-optic modulator and a polarizer, is used to control
the number of round trips in the resonator. Number of passes through
the gain medium can be very high, which results in a very high gain (sev-
eral tens of decibels). The achieved optical peak intensities can become
very high, so to avoid nonlinear pulse distortion and even destruction
of the gain medium, chirped-pulse amplification (CPA) [47] has become
a standard technique. In CPA a femtosecond-long pulse from the oscil-
lator is chirped and temporally stretched to a much longer duration by
the use of a grating pair (stretchers based on a long fibers and prisms
are also used) before passing through the amplifier medium. This re-
duces the peak power to a level where the unwanted phenomena are
avoided. After the gain medium, a dispersive compressor (typically a
grating pair) removes the chirp and temporally compresses the pulses
to a duration comparable to the input pulse duration. CPA has allowed
for the construction of table-top amplifiers, which can generate pulses
with mJ energies and femtosecond durations, leading to terawatt peak
powers.
SpitfireRegenerative Ti:Al2O3 Amplifier
TsunamiTi:Al2O3 Oscillator
Millenniapump
Em
pow
erpu
mp
4.2 W532 nm
< 25 fs, 800nm, FWHM ~ 60 nmPav ~ 380 mW, 76 MHz
~20 W527 nm1 kHz
< 35 fs, 800nm Pav ~3.5 W1 kHz
To
expe
rimen
ts
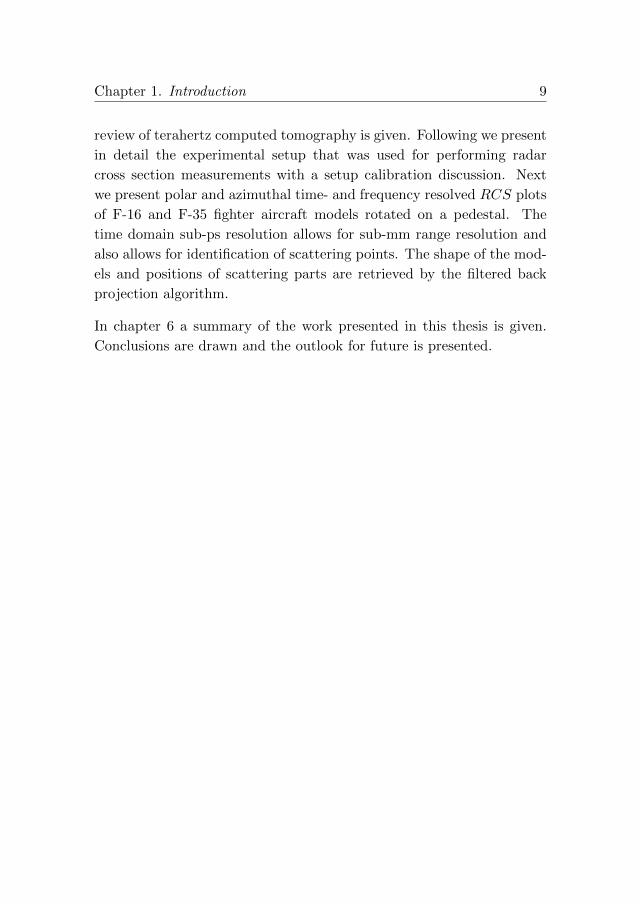
Figure 2.1: Ultrafast amplifier laser system in the DTU TER-AWATT LAB.
Chapter 2. Terahertz pulses 13
Spectra-Physics Spitfire laser system, presented in the Fig. 2.1, combines
four essential parts: ”Millennia Pro” pump, ”Tsunami” Ti:sapphire os-
cillator, ”Empower” pump and ”Spitfire” regenerative Ti:sapphire am-
plifier. Millennia Pro is a high-power CW green diode-pumped solid
state laser working at 1064 nm. The Millenia itself is pumped by two
808 nm diode lasers located in the power supplier. Lasing at 1064 nm
is achieved in a neodymium yttrium vanadate (Nd:YVO4) crystal. The
4.2 W output beam at 532nm from Millenia pro is generated by fre-
quency doubling in nonlinear crystal Lithium triborate (LBO) and is
used to pump Ti:sapphire crystal in the Tsunami oscillator laser [24].
Tsunami delivers sub-25 fs pulses at the central wavelength of 800 nm.
The central wavelength and the spectral bandwidth are adjusted by a
use of a slit-prism pair. For optimal operation a bandwidth of 60 nm in
FWHM is used (depicted in the Fig. 2.2(a)). Tsunami delivers pulses
at a repetition rate of 76 MHz with average power of 380 mW. This
ultrafast oscillator is used as a seed for Spitfire regenerative Ti:saphire
amplifier. The Ti:Al2O3 crystal in Spitfire is pumped using Empower
pump, which is a Q-switched Neodymium-doped yttrium lithium fluo-
ride (Nd:YLF) laser. The output wavelength of 527 nm is achieved by
frequency doubling in nonlinear LBO crystal of 1053 nm light from a
Nd:YLF solid state laser, which is pumped by a series of 808 nm diode
lasers. Strong ns-long pulses are generated by Q-switching [48], giving
average optical powers up to 20W at the repetition rate of 1kHz. In
the Spitfire incoming ∼ 5 nJ femtosecond pulses from Tsunami are first
stretched up to ns duration, then amplified to 3.8 mJ energy and in
the end compressed to sub 35 fs duration. A very high pulse energy
of 3.5 mJ combined with sub 35 fs pulse duration results in ultra high
peak power intensity of approximately 100 GW (what is already con-
sidered as a terawatt range). Figure 2.2(a) shows a typical spectrum of
pulses from Spitfire. The 34nm-in-FWHM-broad spectrum translated
into an ultra short pulses in time domain. Fig. 2.2(b) shows autocorre-
lation of Spitfire laser pulse measured using Spectra-Physics PulseScout
autocorrelator. Autocorrelation is a standard technique for measuring
temporal duration of short laser pulses [49, 50]. In the autocorrelator

Chapter 2. Terahertz pulses 14
incident pulses are split into two equal portions. One of the pulses is
sent to a variable delay and then mixed in a non-collinear configuration
with the other pulse in a nonlinear crystal. By changing time delay be-
tween pulses the intensity of generated second harmonic can be mapped
out. Basing on the width of the autocorrelation, temporal duration of
the pulse itself can be calculated. Assuming that the incoming pulse has
a Gaussian shape, 60.5 fs in FWHM of autocorrelation corresponds to
43 fs-long pulse (factor of 1.414 [51]).
720 740 760 780 800 820 840 860 8800.00
0.25
0.50
0.75
1.00
Inte
nsity
[arb
. uni
ts]
Wavelength [nm]
TsunamiSpitfire
FWHMAutocol = 60.5 fsFWHM = 60 nmFWHM = 34 nm
Frequency [THz](a) (b)410 400 390 380 370 360 350
Figure 2.2: (a) Output spectra from Tsunami and Spitfire. (b)Autocorrelation of the generated 3.5 mJ laser pulse. Large pedestal isan indication of a significant third and forth order phase dispersion.
2.2 Generation of terahertz radiation
Various ways of generating THz radiation have been developed through
the years. One could risk a statement by saying that everything can
be used to generate THz waves (probably one of the most surprising
processes that lead to THz emission is peeling adhesive tape [52]).
Historically, the oldest sources of THz radiation are thermal sources.
Invention of maser and laser in 1960’s brought important development
for THz generation. Namely powerful CO2 lasers were used for pumping

Chapter 2. Terahertz pulses 15
THz molecular lasers, which for THz emission were using transitions
between different rotational energy levels. CO2 pumped methanol laser,
which gives emission at 119 µm is still in use in some laboratories [20,
53]. The main disadvantage of those THz emitters is that the THz
detection is based on the detection of the intensity instead of direct
electric field, which will be discussed in the chapter 3.1. More recent
development in continuous wave THz sources are the quantum cascade
lasers (QCLs) [54]. From the microwave side of spectrum THz radiation
can be generated using backward-wave oscillators (BWO), gyrotrons and
sum-frequency mixed Schottky [55] and Gunn [56] diodes. The main
problem with sources based on the electronic approach is that their
efficiency quickly rolls off with increasing frequency.
Free electron laser (FEL) with energy-recovering linear accelerators is
the most powerful source in the THz range [57, 58] and until recently it
was the only one that was able to generate terahertz pulses that have
at least 1 µJ of energy. Free-electron lasers as the lasing medium use
relativistic electron beam, which propagates through spatially varying
magnetic field [59]. The magnetic field causes the electrons to oscillate
and emit photons, whose wavelength can be tuned from microwave to X-
ray area by adjusting the energy of the electron beam or the magnetic
field strength. Extremely high costs and big sizes of FELs facilities
severely restrict their application.
If all the THz systems were counted, photoconductive switches would
probably emerge as the most popular type. THz generation by optical
excitation of photoconductive dipole antennas was pioneered in 1970s
by D. H. Auston [21] and further developed in the 1980s [60–62]. In
a semiconductor material of a photoconductive switch, photons from
a femtosecond laser pulse with sufficiently high energy can excite elec-
trons into the conduction band. The metallic electrodes supply external
bias electric field to the semiconductor in the photoconductive gap be-
tween electrodes. Bias field accelerates generated free carriers, creating
microscopic current transient. Due to different channels of recombina-
tion, free carriers finally recombine, causing currents to vanish. In this

Chapter 2. Terahertz pulses 16
way current impulses, lasting on the order of few hundred femtosec-
onds, are generated. Dynamics of those ultrashort transient currents is
a source of the THz radiation. The short carrier lifetime (∼ 100 fs) of
the emitter semiconductor material is beneficial for the high bandwidth
of generated radiation. For that reason materials with high number of
recombination centers and a fast capture time, as radiation-damaged
silicon-on-sapphire [63], low-temperature grown GaAs [64, 65] or ion-
implanted InGaAs [66, 67] can be used.
2.2.1 Optical rectification
intensity
DFG
intensity
DFG SFG
(a)
(b)
Figure 2.3: Photon picture of (a) difference-frequency generation(DFG) of THz frequencies and (b) DFG and sum-frequency generation
(SFG) of sidebands to the pump frequencies.
One of frequently used table-top methods of generating relatively high-
power THz sources is optical rectification (OR) in nonlinear materials

Chapter 2. Terahertz pulses 17
[68]. Below we will present it in more detail on example of N-benzyl-2-
methyl-4-nitroaniline (BNA) crystal. Optical rectification is a difference
frequency mixing process and occurs in media with large second order
susceptibility χ2. For ultrashort laser pulses (typically fs pulses from
Ti:sapphire laser) that have large bandwidth, as shown in Fig. 2.2(a),
the frequency components are differentiated with each other to produce
bandwidth from ideally 0 to several THz. The photon picture of the
difference-frequency generation (DFG) is shown in the Fig. 2.3(a). A
femtosecond laser pulse with a spectrum centered at ωc contains a comb
of frequencies, spaced by ∆ω due to the constant repetition rate of the
laser. Two NIR photons ω1 and ω2 (ω2 < ω1) interact with each other in
the nonlinear crystal. As the result photon ω1 is annihilated and two new
photons are created: second ω2 and a new Ω with energy ~ (ω1 − ω2).
Frequency of the Ω photon lays in the THz range. Due to the interaction
the spectrum on the NIR pump beam shifts in the direction of longer
wavelength (so called redshift). When the population of THz photons
gets big enough, a different DFG process can take also place - Fig. 2.3(b).
This time one NIR photon ω2 interacts with the THz photon Ω′. As a
result ω2 is annihilated and its energy is used for creation of a second Ω′
photon and a NIR photon of energy ~ (ω2 − Ω′). This process also leads
to the increase of THz energy and a redshift of NIR pump. An opposite
process called sum frequency generation (SFG) can also take place, in
which energy is transferred from THz wave to the NIR pulse.
The efficiency of described processes of DFG and SFG is govern by
several factors. The most important one is the value of the second order
susceptibility χ2. Phase matching between the optical and terahertz
beams also plays a crucial role for efficient optical rectification. Collinear
matching between group velocity and the terahertz phase velocity in such
crystals as ZnTe and GaP is achievable for pump wavelengths of around
800nm and 1µm, respectively. Energies of up to 1.5µJ in single-cycle
terahertz pulses have been obtained from large aperture ZnTe crystal
[69].

Chapter 2. Terahertz pulses 18
(a) (b) (c)
Figure 2.4: (a) Molecular formula of BNA crystal. (b) Photo offreshly cleaved BNA 1.3 mm-thick (010) crystal (c) BNA crystal withvisible signs of optical degradation due to 800-nm pump irradiation.
Recently, strong interest is placed upon new organic nonlinear crys-
tals (NLO), such as 4-dimethyl-mino-N-methyl-4-stilbazolium tosylate
(DAST) [70], 2-methyl-4-nitroaniline (MNA) [71], 2-(α-methylbenzyl-
amino)-5-nitropyridine (MBANP) [72] and N-benzyl-2- methyl-4 -nitroaniline
(BNA) [73, 74]. Those crystals posses very high second order nonlinear-
ities with lower dielectric constants, than their inorganic counterparts.
Except for high nonlinearities, NLO are required to have sufficient size
to be subjected to mechanical processing, such as cutting and polishing.
Those two characteristics are in opposition: large optical nonlinearities
can be easily achieved in a lower-symetry structures, which usually result
in small and fragile crystals. On other hand centrosymmetric structure
is energetically more stable, and organic molecules are likely to condense
in that structures. BNA crystal, which molecular formula is shown in
Fig. 2.4(a), was developed to overcome these difficulties. Large BNA
crystals, shown in Fig. 2.4(b), were grown with a vertical Bridgman
method. The second order nonlinear coefficients of BNA (d333 = 234
pm/V and d322 = 16 pm/V [75, 76]) are high and allow for more effi-
cient THz generation than the most commonly used ZnTe. The values
of the refractive indices of BNA allow for generation of THz radiation
in the collinear phase matching configuration for pump wavelength of
Chapter 2. Terahertz pulses 19
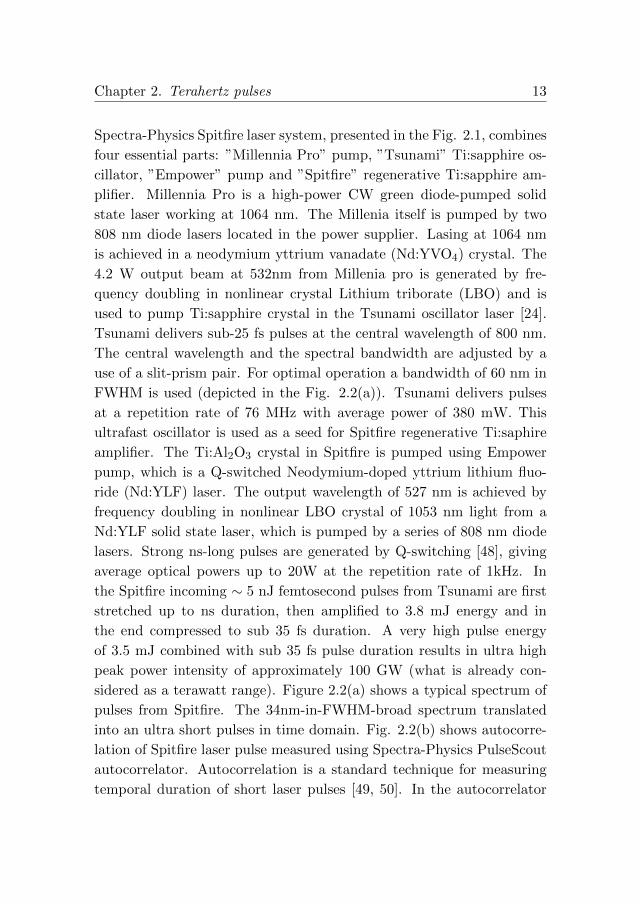
around 800nm [77, 78]. BNA exhibits a linear dependence (Fig. 2.5(a))
of generated electric field versus pump power up to the point when signs
of damage are apparent at a fluence of ∼ 1 mJ/cm2 (Fig. 2.4(c)). BNA
has a orthorhombic lattice structure, space group symmetry Pna21 and
point symmetry mm2. Because second order nonlinearity d is a tensor,
related to the crystallographical symmetry of BNA crystal, the crystal
must be oriented correctly to the laboratory reference frame to maxi-
mize THz conversion efficiency. Figure 2.5(b) shows the dependence of
the generated THz field on the BNA crystal angle orientation, which
is measured in the setup presented in the Fig. 2.5(c). Electric field
components parallel and perpendicular to the generation beam polariza-
tion are detected. Pair λ/2-polarizer changes polarization of the pump
beam between parallel and perpendicular with respect to the direction
of THz detection. The lines in the Fig. 2.5(b) are a best fit to the-
oretically predicted dependencies ETHz ∝ cos3 x for the parallel and
ETHz ∝ cosx sin2 x for the perpendicular field components.
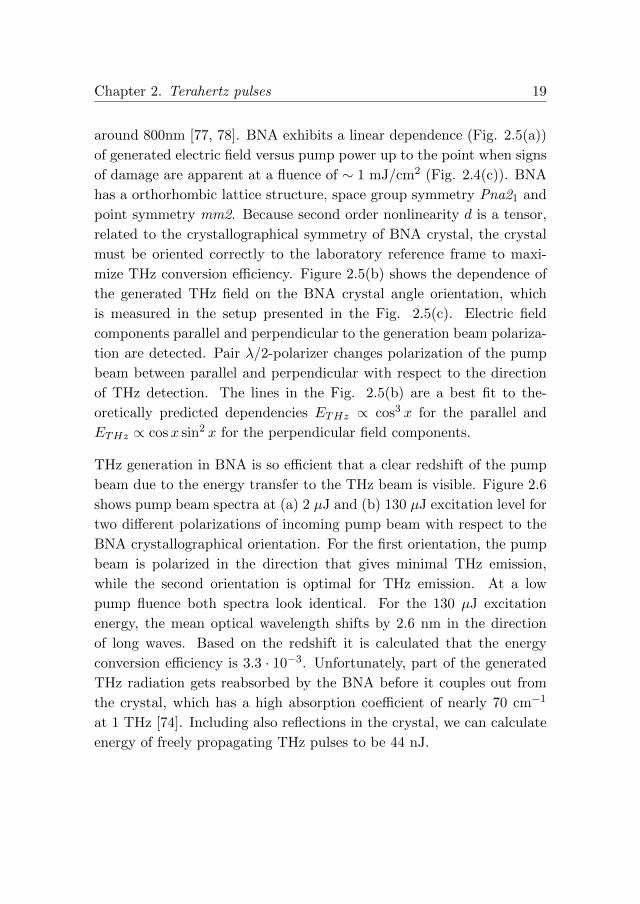
THz generation in BNA is so efficient that a clear redshift of the pump
beam due to the energy transfer to the THz beam is visible. Figure 2.6
shows pump beam spectra at (a) 2 µJ and (b) 130 µJ excitation level for
two different polarizations of incoming pump beam with respect to the
BNA crystallographical orientation. For the first orientation, the pump
beam is polarized in the direction that gives minimal THz emission,
while the second orientation is optimal for THz emission. At a low
pump fluence both spectra look identical. For the 130 µJ excitation
energy, the mean optical wavelength shifts by 2.6 nm in the direction
of long waves. Based on the redshift it is calculated that the energy
conversion efficiency is 3.3 · 10−3. Unfortunately, part of the generated
THz radiation gets reabsorbed by the BNA before it couples out from
the crystal, which has a high absorption coefficient of nearly 70 cm−1
at 1 THz [74]. Including also reflections in the crystal, we can calculate
energy of freely propagating THz pulses to be 44 nJ.

Chapter 2. Terahertz pulses 20
pump pulse <010>
BNA (010)
<001>
<100>wire-gridpolarizer
THz wave
ZnTe (110)
probe pulse
angle
800 nm to balancedetection
polarization of pump beam
polarization ofprobe beam
2
polarizer
0 90 180 270 360
-4
-2
0
2
4
6
TH
z el
ectr
ic fi
eld
[arb
. uni
ts]
BNA crystal orientation [deg]
parallelperpendicular
(a) (b)
(c)
2 4 6 8 10 12 14-1.0
-0.5
0.0
0.5
1.0
1.5
Ele
ctric
fiel
d [a
rb. u
nits
]
Time [ps]
Figure 2.5: (a) The peak of THz electric field as a function of NIRpump power. The inset shows the time waveform of the generated THzelectric field.(b)Detected parallel and perpendicular THz electric fieldcomponents as a function of the azimuthal angle of the 1.3 mm BNAsource crystal. The lines are a fit to ETHz ∝ cos3 x for the paralleland ETHz ∝ cosx sin2 x for the perpendicular field components.(c)Simplified schematic of BNA orientation used to obtain the angledependent data. Pair λ/2-polarizer changes polarization of the pumpbeam between parallel and perpendicular with respect to the direction
of THz detection.
2.2.2 Generation of high-power terahertz pulses by tilted-
pulse-front excitation
As it has been mentioned before, the efficiency of the THz generation in
optical rectification critically depends on matching between the group
velocity vgrNIR of the ultrashort light pulse and the phase velocity vphTHz
of the THz radiation. Velocity matching is obtained if the condition
vgrNIR = vphTHz (2.1)

Chapter 2. Terahertz pulses 21
(a) (b)2.6 nm
Figure 2.6: Redshift in BNA. Spectra of NIR probe transmittedthrough BNA crystal for (a) 2 µJ (b) 130 µJ incident 800 nm pumppulses. Pair λ/2-polarizer is used to change energy of the incidentpump beam and to switch between polarizations of the pump beam,that give highest and lowest THz generation. The mean value of the
wavelength shifts by 2.6 nm into red.
is fulfilled. For such materials as ZnTe, GaP, DAST or BNA, velocity
matching of the terahertz phonon-polariton wave can be achieved in
a collinear configuration. The nonlinear coefficients of such materials
as ZnTe or GaP are significantly smaller than nonlinear coefficients of
nonlinear organic crystals as DAST or BNA. Unfortunately, nonlinear
organic crystals have a low damage threshold and optical pumping with
very intense laser pulses is not recommended. A solution to this problem
is to use high dielectric ferroelectrics such as lithium niobate (LiNbO3) or
lithium tantalate (LiTaO3), which have nonlinearities comparable with
NLO and can sustain higher pump fluences. Unfortunately for those
materials, the difference between group refractive index ngrNIR of the NIR
pump and the phase refractive index nphTHz of the THz radiation is big
(correspondingly 2.23 and 5.16 for LiNbO3 [79]), which does not allow for
efficient THz generation in a collinear configuration. Velocity matching
in those materials is possible by tilting the optical pulse front [35, 36,
79, 80]. Proper choice of the tilt angle γ, shown in Fig. 2.7(b), allows to
equalize phase velocity of the THz pulse with a projection of the NIR
Chapter 2. Terahertz pulses 22
vgrvis
vphTHz
THz
LiNbO3
tilted pulse front pump
Grating
THz
LiNbO3
Ti:Saphire fs laser
2
Lens
(a) (b)
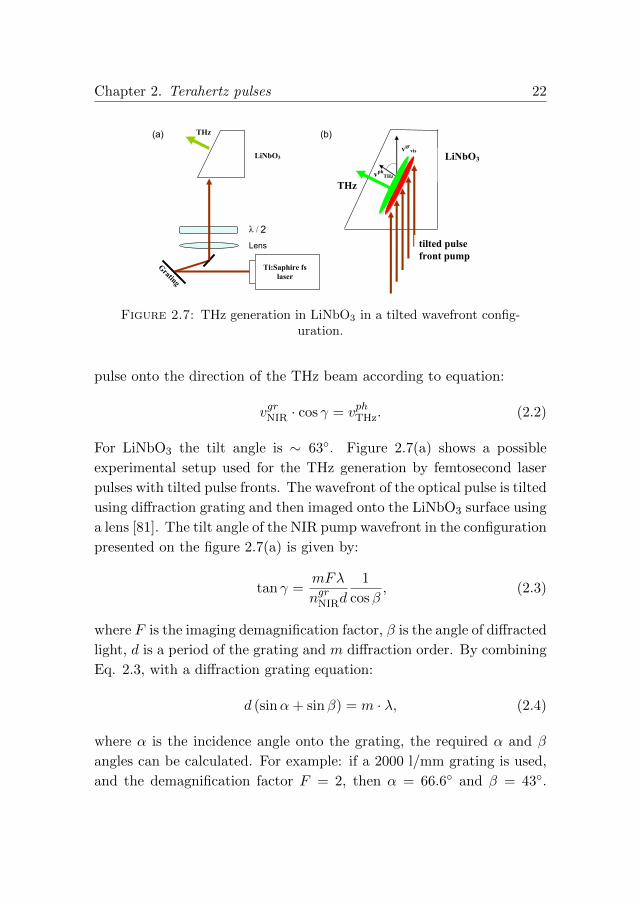
Figure 2.7: THz generation in LiNbO3 in a tilted wavefront config-uration.
pulse onto the direction of the THz beam according to equation:
vgrNIR · cos γ = vphTHz. (2.2)
For LiNbO3 the tilt angle is ∼ 63. Figure 2.7(a) shows a possible
experimental setup used for the THz generation by femtosecond laser
pulses with tilted pulse fronts. The wavefront of the optical pulse is tilted
using diffraction grating and then imaged onto the LiNbO3 surface using
a lens [81]. The tilt angle of the NIR pump wavefront in the configuration
presented on the figure 2.7(a) is given by:
tan γ =mFλ
ngrNIRd
1
cosβ, (2.3)
where F is the imaging demagnification factor, β is the angle of diffracted
light, d is a period of the grating and m diffraction order. By combining
Eq. 2.3, with a diffraction grating equation:
d (sinα+ sinβ) = m · λ, (2.4)
where α is the incidence angle onto the grating, the required α and β
angles can be calculated. For example: if a 2000 l/mm grating is used,
and the demagnification factor F = 2, then α = 66.6 and β = 43.

Chapter 2. Terahertz pulses 23
Particular tilted wavefront setups used in this thesis, will be discussed
in more detail in chapters 5.3 and 4.4. Highest ever reported THz pulse
energies obtained using this method were 10µJ and corresponding tera-
hertz electric field at the focus of a parabolic mirror was calculated to
be 250kV/cm [80]. In those experiments Ti:sapphire amplifier system
delivering 10mJ pulses at a 10Hz repetition rate was used. Figure 2.8(a)
shows the energy of the THz pulses generated in LiNbO3 in a tilted wave-
front configuration as a function of incident pump pulse energy. Unlike
optical rectification in BNA which shows perfect quadratic dependence
of the generated THz power vs. excitation pulse power (what corre-
sponds to a linear dependence of the peak electric field and has been
presented in the Fig. 2.5(a)), THz generation in LiNbO3 shows linear
dependence above saturation threshold. This change from quadratic to
linear increase of the generated THz energy has its origins in the free
carrier absorption inside LiNbO3 caused by multiphoton absorption at
the pump wavelength [82] and results in a saturation of THz generation
efficiency, as depicted in Fig. 2.8(b).
It has been theoretically predicted and observed [82] that the shortest
pump pulses do not necessarily give highest THz conversion efficiency.
High material and angular dispersion inside LiNbO3, makes NIR pulses
of 350 fs duration in their time-bandwidth limited form most favor-
able for high power THz efficiency. Unfortunately, NIR pulses from the
Spectra-Physics Spitfire laser system, that has been mostly used in this
thesis, are 35 fs long, which yields nearly 8 times lower power conversion
efficiency than for 350 fs pulses.
2.3 Detection of terahertz radiation
There are several ways to detect THz radiation. Historically the oldest
detection methods are based on thermal effects. THz light is absorbed in
the material and lead to the increase of temperature, which can be sensed
by such devices as bolometers [83], Golay cells [84] and pyrodetectors[85]

Chapter 2. Terahertz pulses 24
0 . 00 . 51 . 01 . 52 . 02 . 5
0 . 0 0 . 2 0 . 4 0 . 6 0 . 8 1 . 0 1 . 2 1 . 4 1 . 60 . 0
0 . 4
0 . 8
1 . 2
1 . 6
M e a s u r e m e n t L i n e a r f i t Q u a d r a t i c f i tTH
z puls
e ene
rgy [µ
J] ( a )
( b )
E f f i c i e n c y D i f f e r e n t i a l E f f i c i e n c y
Efficie
ncy [
µJ/ m
J]
P u m p P u l s e E n e r g y [ m J ]Figure 2.8: (a) The energy of the THz pulses generated in LiNbO3 ina tilted wavefront configuration as a function of incident pump pulseenergy. Dashed lines shows best linear and quadratic fits to experi-mental data. (b) Absolute PTHz/PNIR and differential dPTHz/dPNIR
efficiency of THz generation in LiNbO3.
and related to the intensity of the THz wave. Because being dependent
on heating processes, response times of those devices are slow, sensitiv-
ity is low and they often require cryogenic cooling. A newer class of
detectors comes from electronic approach and include Schottky diode
mixers [86], high electron mobility transistors and many other.
The very commonly used way of detecting THz transients is using pho-
toconductive switches [87–89]. THz detection in this scheme is a reverse
Chapter 2. Terahertz pulses 25
process to the THz generation using photoconductive antennas. Por-
tion of the laser beam that is used for THz generation is split off and
sent to the detector. The femtosecond laser pulse excites free carriers in
the photoconductive gap of the detector semiconductor material. This
time, instead of connecting electrodes to the bias circuit, they are con-
nected to a current preamplifier. The electric field of the THz pulse
drives photocurrent which is measured by the preamplifier. The pho-
tocurrent in the antenna is a convolution of the electric field and the
transient photoconductivity excited by the gating pulse. If the tran-
sient photoconductivity is much faster than the dynamics of the electric
field, then the measured current is directly proportional to the THz
electric field. The bandwidth of detection is mainly limited by the trap-
ping and recombination time of photoconductivity, and for that rea-
son radiation-damaged silicon-on-sapphire [63], low-temperature grown
GaAs [64, 65]or ion-implanted InGaAs [66, 67] are used.
optical probe pulse
THz pulse
t
EOcrystal
Wollaston prism
PD A
PD B
without THz field
with THz field
Ix = I0/2
Iy = I0/2
Ix = (1- ) I0/2
Iy = (1+ ) I0/2
(a)
(b)
(c)
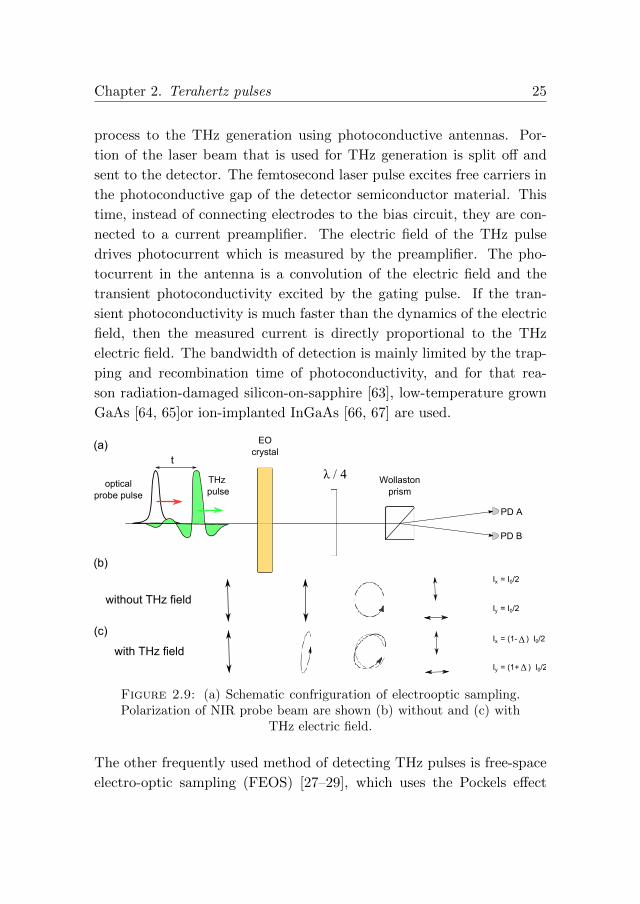
Figure 2.9: (a) Schematic confriguration of electrooptic sampling.Polarization of NIR probe beam are shown (b) without and (c) with
THz electric field.
The other frequently used method of detecting THz pulses is free-space
electro-optic sampling (FEOS) [27–29], which uses the Pockels effect
Chapter 2. Terahertz pulses 26
in an electro-optic (EO) crystal. Because FEOS is the method used
through this thesis, it will be described in more detail. A schematic
setup of the FEOS is presented in Fig. 2.9. In the absence of THz field,
a linearly polarized NIR gating pulse travels through EO crystal unaf-
fected, then it passes through a λ/4 plate where its linear polarization is
changed into circular. The orthogonal polarization components are split
by a Wollaston prism and sent to photodiodes (PD) A and B. Signal
from photodiodes is sent to the lock-in amplifier, which subtracts the
incoming signals. Because the probe beam after the λ/4 plate has cir-
cular polarization, the signal (current, which can be also converted into
voltage) is identical and lock-in amplifier returns zero-reading. When
the THz transient overlaps in time with the NIR gating pulse, the gat-
ing pulse experience phase retardation and its polarization is changed
into elliptical. The phase retardation Γ between different components
of the gating pulse is proportional to the strength of the THz pulse and
can be expressed by
Γ =ωn3
0r41L
cETHz (2.5)
where n0 is the refractive index at the optical frequency, r41 is the elec-
trooptic coefficient (∼4 pm/V for ZnTe [90] and ∼ 0.88 pm/V for GaP
[91]), L is the thickness of the EO crystal, ω frequency of NIR probe and
ETHz is the value of the THz electric field. This time the polarization of
the gating beam after the λ/4 plate is not exactly circular and the pho-
todiodes A and B do not show the same signal any more. Photocurrents
at photodiodes A and B are
IA =I0
2(1− sin Γ) , (2.6)
IB =I0
2(1 + sin Γ) . (2.7)
The modulation depth of photocurrents is directly proportional to the
THz electric field:
∆I
I0=IB − IAI0
= sin Γ = sin
(ωn3
0r41L
cETHz
), (2.8)

Chapter 2. Terahertz pulses 27
which gives the expression for the THz electric field:
ETHz = arcsin
(∆I
I0
)c
ωn30r41L
≈ ∆I
I0
c
ωn30r41L
. (2.9)
For weak THz fields (i.e. ∆II0
< 0.5), measured THz electric field is
directly proportional to the photocurrent modulation. The phase retar-
dation Γ also depends on the orientation of the crystal and directions
of polarization of the THz radiation and the NIR laser pulse. For 43m
zincblende structure crystals, such as ZnTe, the optimum angles between
the THz and the probe beam polarizations are 0 or 90 [92, 93]. By
varying time difference t between THz beam and NIR gate the entire
THz waveform can be mapped in time. To improve signal-to-noise ratio
the lock-in amplifier is locked to the frequency of optical chopper, which
modulates the THz generation beam at a first subharmonic frequency
(500Hz) of the laser system (1kHz). This detection scheme is charac-
terized by excellent S/N ratios, which in most cases exceed 1000. Two
reasons behind high S/N ratio are the coherent detection that rejects
incoherent background radiation and a very short sampling time given
by ultrashort gating pulse duration. ZnTe and GaP are the two most
commonly use EO crystals. Other crystals, such as GaSe, InP, GaAs,
DAST, BNA as well as some polymers and liquids have also been used.
The detection bandwidth is limited by the phase matching between the
THz transient and the NIR gating pulse. Other type of limitation comes
from absorptive phonons in the crystals (such as T0 phonon in ZnTe at
5.3 THz and phonon at ∼11 THz in GaP [94]). By application of very
thin EO crystals (e.g. ∼ 10µm ZnTe), which minimizes influence of
phase mismatch, the detection bandwidth can be increase even to over
100 THz [95–97]. Note that the detection of the magnetic field of the
THz pulse is also possible in similar method [98, 99].
In recent years several detection methods based on air photonics have
been developed [33, 100]. Due to its extreme broadband responsivity air
biased coherent detection (ABCD) [34, 101] is gaining big popularity.

Chapter 2. Terahertz pulses 28
ABCD method will be described in detail in chapter 4.3. THz radiation-
enhanced emission of fluorescence (REEF) [102] and terahertz enhanced
acoustics (TEA) [103] are interesting examples of other methods based
on interaction of intense femtosecond pulses with THz transients inside
laser-induced plasma.

Chapter 3
Simultaneous reference and
differential waveform
acquisition in time-resolved
terahertz spectroscopy
Time-resolved terahertz spectroscopy (TRTS) is a relatively new and
powerful experimental technique for studying subpicosecond dynamics
of photoexcited charge carriers in semiconductors [13, 14, 104] and other
materials [11, 105]. To extract the frequency-resolved conductivity of a
photoexcited sample, two THz transients are necessary: a reference scan,
Eref (t), of the unexcited sample and a scan of the pumped sample,
Epump (t). The most common data acquisition scheme is to separately
measure Eref (t) with a blocked pump beam or at negative pump-probe
delay times. Next step is to measure a differential THz scan, ∆E (t)
and calculate Epump (t) = Eref (t)+∆E (t). In this procedure two scans
are taken separately and some false spectral features can be introduced
if in between scans the output (power, pulse shape) of the laser system
changes. In this chapter we present a new method of data acquisition in
29
Chapter 3. Simultaneous reference and differential waveformacquisition in time-resolved terahertz spectroscopy 30
which both scans are taken simultaneously. This approach is not only
twice as fast, but also eliminates spurious errors in the spectroscopy
arising from experimental conditions changing during data acquisition.
The chapter will begin with a brief introduction to time-domain tera-
hertz spectroscopy and time-resolved terahertz spectroscopy. Then we
will present and discuss the Drude model for conductivity, which is the
most simple but also best understood model of conductivity in semicon-
ductor sample. In the next part of the chapter we will in detail present
the experimental setup and write about calibration methods. The chap-
ter will end with results obtained for GaAs sample, which was chosen as
a test sample.
3.1 Time-domain terahertz spectroscopy
Terahertz time-domain spectroscopy (THz-TDS) is a method of deter-
mining optical properties of investigated sample. High signal to noise ra-
tio of photoconductive switches and THz emitters and detectors based on
nonlinear phenomena makes those devices well suited for spectroscopic
purposes. More over, since the electric field of THz transient is directly
mapped in time (instead of intensity), both amplitude and phase infor-
mation are coherently measured. This field information allows for direct
determination of the complex refractive index (or equivalently complex
dielectric function or complex conductivity) without a necessity to use
Kramers-Kronig relations.
The real beauty of THz spectroscopy lays in the wealth of spectroscopic
signatures in the THz energy range for all states of matter: gasses, liq-
uids, solid-state and even plasma [2, 106]. Rotational excitations of small
gas molecules have energies in the THz range and thus TDS-THz spec-
troscopy can be used to identify various gases [107, 108]. In liquids the
THz spectrum is dominated by relaxation of either permanent dipoles
in polar liquids or collision-induced dipole moments in nonpolar liquids.
Chapter 3. Simultaneous reference and differential waveformacquisition in time-resolved terahertz spectroscopy 31
So far water and its mixtures is probably the most extensively studied
liquid in the THz range [109–111]. In the case of simple dielectrics THz
spectroscopy allows for simple and accurate determination of the refrac-
tive index and absorption coefficient [87]. THz-TDS techniques have also
been used for investigating such systems as insulators [112], inorganic
and organic semiconductors [87], metals [113], doped semiconductors
[114], quantum wells [115] and many others.
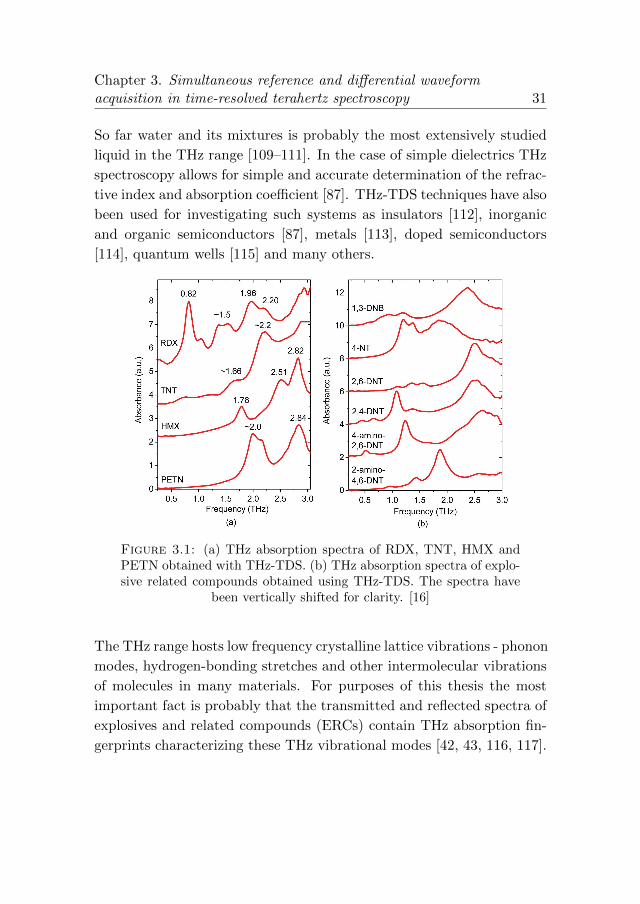
Figure 3.1: (a) THz absorption spectra of RDX, TNT, HMX andPETN obtained with THz-TDS. (b) THz absorption spectra of explo-sive related compounds obtained using THz-TDS. The spectra have
been vertically shifted for clarity. [16]
The THz range hosts low frequency crystalline lattice vibrations - phonon
modes, hydrogen-bonding stretches and other intermolecular vibrations
of molecules in many materials. For purposes of this thesis the most
important fact is probably that the transmitted and reflected spectra of
explosives and related compounds (ERCs) contain THz absorption fin-
gerprints characterizing these THz vibrational modes [42, 43, 116, 117].

Chapter 3. Simultaneous reference and differential waveformacquisition in time-resolved terahertz spectroscopy 32
Fig. 3.1 shows measured THz absorption spectra of hexahydro-1,3,5-
trinitro-1,3,5-triazine (RDX), 2,4,6-trinitrotoluene (TNT), tetramethy-
lene tetranitramine (HMX), pentaerythritol tetranitrate (PETN) and
explosive related compounds: 1,3-dinitro-benzene (1,3-DNB), 4-nitro-
toluene (4-NT), 2,6-dinitro-toluene (2,6-DNT), 2,4-DNT, 4-amino-2,6-
DNT and 2-amino-2,6-DNT. Most of these THz absorption fingerprints
are from the lattice vibrational modes of solid-state explosive materials.
Absorption fingerprint in a broad range from 0.05 - 0.6 THz of such
explosive as DNT has been also measured in its gas-phase [118].
d
(N, ) NairNair
Ei Eo
ki ko
incidentTHz
pulse
transmitted THz
pulse
Figure 3.2: THz transmission through a sample of a thickness d anda real refractive index N and an absorption coefficient α.
Below we will show how to determine the frequency dependent refrac-
tive index N (ω) and the absorption coefficient of a sample α (ω) in a
transmission configuration of a THz-TDS system. For simplicity we as-
sume that the THz radiation is incident at a normal angle to the sample
surface - Fig. 3.2.
Two measurements are necessary to extract the refractive index and the
absorption coefficient of a sample. The first one is a reference pulse Eref ,
which is taken without the sample in the spectrometer.
Eref (ω) = Ei (ω) · e−αair(ω)d/2 · e−iωNair(ω)d/c, (3.1)
where Ei (ω) is the incident THz transient, Nair (ω) is the real part of
the refractive index of air and αair (ω) is the absorption coefficient of
air (here Nair (ω) is here is assumed to be 1 and αair (ω) is assumed to
be 0). The second measurement Esamp (ω) is done when the sample is

Chapter 3. Simultaneous reference and differential waveformacquisition in time-resolved terahertz spectroscopy 33
placed in the THz path inside the spectrometer.
Esamp (ω) = t12t21Ei (ω) · e−α(ω)d/2 · e−iωN(ω)d/c, (3.2)
where t12 and t21 are the Fresnel transmission coefficients. In the case
of an air-sample interface, t12 = 21+n , where n is the complex refractive
index of the sample ( n (ω) = N (ω)−iκ (ω) = N (ω)−ic/2ω ·α (ω)). For
the sample-air interface t21 = 2nn+1 . Taking the ratio between Esamp (ω)
and Eref (ω) one gets the complex transmission function T (ω)
T =Esamp
Eref=
4n (ω)
[1 + n (ω)]2· e−α(ω)d/2 · e−iω[N(ω)−1]d/c =
∣∣∣T (ω)∣∣∣ · e−iΦ(ω).
(3.3)
In the case when the sample thickness is comparable to or larger than the
THz wavelength, the phase shift arising from the Fresnel coefficient is
much smaller than the phase shift originating from the wave propagation
through the sample and the real part of the sample refractive index can
be expressed by:
N (ω) ' 1 +c
ωdΦ (ω) . (3.4)
Once the refractive index N (ω) is determined, one can calculate the
absorption coefficient of the sample using
α (ω) = −2
d· ln
[∣∣∣T (ω)∣∣∣ [1 +N (ω)]2
4N (ω)
]. (3.5)
The amplitude∣∣∣T (ω)
∣∣∣ =|Esamp(ω)||Eref (ω)| and phase Φ (ω) = θsamp − θref of
the complex transmission function are obtained from the ratio of the
Fourier transforms of Esamp (t) and Eref (t).

Chapter 3. Simultaneous reference and differential waveformacquisition in time-resolved terahertz spectroscopy 34
3.2 Time-resolved terahertz spectroscopy
Time-domain THz spectroscopy allows only for measurement of static
optical functions. But already in the mid 1980’s people realized that sub-
picosecond THz transients, which are synchronized to optical femtosec-
ond pulse trains, open possibility for pump-probe experiments that could
provide a way to study dynamical properties of picosecond nonequilib-
rium processes in the THz frequency range [119]. This technique is
know as time-resolved terahertz spectroscopy (TRTS) or transient THz
spectroscopy. It is a non-contact method capable of determining the
evolution of the frequency-dependent photoconductivity with a tempo-
ral resolution better than 200 fs. TRTS is a time-domain technique,
where the spectral information is obtained by Fourier transform of near-
single-cycle transients following interaction with a sample, usually by
transmission. TRTS has a huge impact on our understanding of ultra-
fast phenomena in systems such as: inorganic [12, 13, 104, 120, 121] and
organic [122] bulk semiconductors and insulators [112], liquids [123], su-
perconductors [124–126]. In recent years the research focus in ultrafast
phenomena studied with TRTS methods has been placed on nanostruc-
tures, such as nanocrystals [14, 127], quantum wells [128], quantum dots
[129–131], carbon nanotubes [127, 132], conjugated polymer/nanorod
composites [133] and many other [11, 105].
The physical picture of TRTS spectroscopy on photoexcited semiconduc-
tors is based on interaction between THz wave and excited free carriers
in the conduction (electrons) and valence (holes) band. The THz electric
field accelerates carriers, which next scatter and dissipate energy gained
from the THz wave. This energy transfer from THz transient to the free
carriers causes decrease in the THz field strength. Absorption of THz
radiation depends both on the carrier density n and on the mobility µ
of carriers through conductivity of the sample σ = enµ. The mobility µ
of the carrier, describes how quickly a given carrier can move through
a metal or semiconductor, when pulled by an electric field. In many

Chapter 3. Simultaneous reference and differential waveformacquisition in time-resolved terahertz spectroscopy 35
sample
Eref(t)
Epump(t)
tPhotoexcited
layer
Einc(t)
Einc(t)
d
excitationpulse
THz probe
(a)
(b)
Figure 3.3: THz transmission through (a) unexcited and (b) pho-toexcited sample.
materials the mobility of holes is much lower then the mobility of elec-
trons (400 cm2/ (V s) for holes and 8500 cm2/ (V s) for electrons in GaAs
at room temperature [134]), so the THz absorption will be dominated
by absorption by electrons in the conduction band. In those materials
TRTS will probe mostly dynamics of photoexcited electrons.
The complex transmission function t through a thin conducting film
placed between two media with real refractive indices is know as the
Tinkham equation [135]:
t =2Y1
Y1 + Y2 + dσ, (3.6)
where d is the thickness of the film, σ is its complex conductivity, Y1 and
Y2 are admittances of the surrounding materials. Substituting Y1 = 1/Z0
for free space or air and Y2 = N/Z0 for the dielectric substrate with
refractive index N we find
t (ω) =2
N + 1 + Z0dσ (ω)(3.7)

Chapter 3. Simultaneous reference and differential waveformacquisition in time-resolved terahertz spectroscopy 36
where Z0 = 377Ω is free space impedance. This equation is valid as long
as d λ/n, that is as long the wavelength inside the conducting film
(with refrative index n) is longer than the film thickness and all internal
reflections and interferences can be neglected. Values of n high enough
to make the expression invalid can be obtained in metallic thin films
but for semiconductors investigated in this thesis Eq. 3.7 is valid. The
next limitation for applicability of Eq. 3.7 is that the temporal changes
of conductivity σ have to be slower than the THz pulse duration. If
the transmission function of the unexcited dielectric slab (substrate)
tsubs = 2N+1 is treated as a reference, then a transmission T (ω) through
the photoexcited slab (thin film with pump induced photoconductivity
∆σ (ω)) is in the form:
T (ω) =Epump (ω)
Eref (ω)=
N + 1
N + 1 + Z0d∆σ (ω). (3.8)
In case the thickness d of the photoexcited film cannot be determined,
it may be convenient to use sheet photoconductivity ∆σs defined as
∆σs (ω) = d ·∆σ (ω).
Two scans are needed to extract the frequency dependent photocon-
ductivity: a reference scan Eref (t) and a pumped scan Epump (t). The
reference scan is taken with blocked pump beam or at the negative
pump-probe delay time, when the THz probe pulse does not experience
pump pulse. The pumped scan Epump (t) carries the information about
the photoexcitation - Fig. 3.3. However in most TRTS systems the dif-
ferential ∆E (t) waveform is mapped and then Epump (t) is calculated by
Epump (t) = Eref (t) + ∆E (t) (Fig. 3.4), instead of measuring directly
Epump (t), . The measurement of ∆E (t) is done by moving the optical
chopper from the THz generation beam to the optical pump beam to
improve signal to noise ratio of the analyzed data. In Chap. 3.4 we
present a novel method that allows for simultaneous reference Eref (t)
and differential waveform ∆E (t) acquisition.
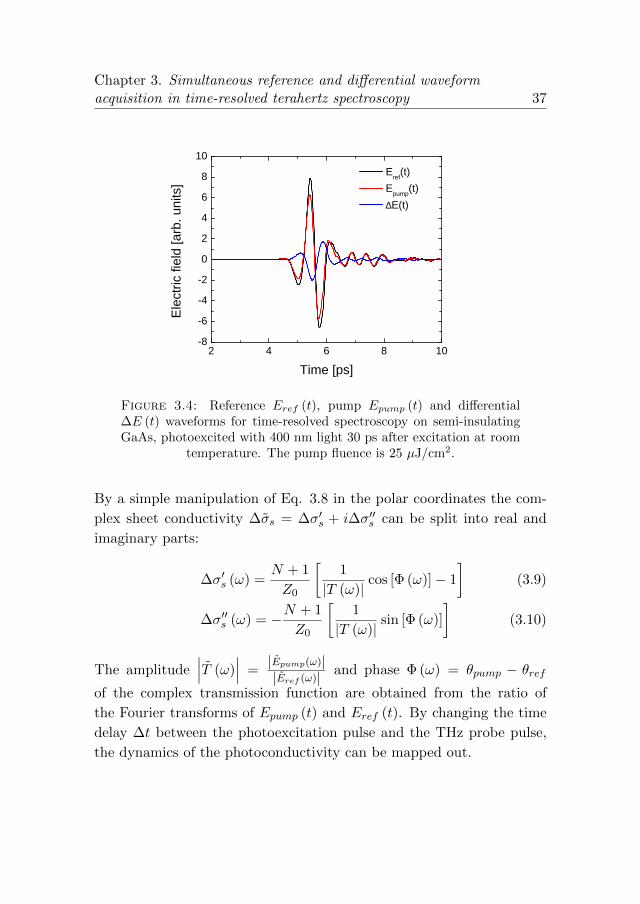
Chapter 3. Simultaneous reference and differential waveformacquisition in time-resolved terahertz spectroscopy 37
2 4 6 8 1 0- 8- 6- 4- 202468
1 0
Electr
ic field
[arb.
units]
T i m e [ p s ]
E r e f ( t ) E p u m p ( t ) ∆E ( t )
Figure 3.4: Reference Eref (t), pump Epump (t) and differential∆E (t) waveforms for time-resolved spectroscopy on semi-insulatingGaAs, photoexcited with 400 nm light 30 ps after excitation at room
temperature. The pump fluence is 25 µJ/cm2.
By a simple manipulation of Eq. 3.8 in the polar coordinates the com-
plex sheet conductivity ∆σs = ∆σ′s + i∆σ′′s can be split into real and
imaginary parts:
∆σ′s (ω) =N + 1
Z0
[1
|T (ω)|cos [Φ (ω)]− 1
](3.9)
∆σ′′s (ω) = −N + 1
Z0
[1
|T (ω)|sin [Φ (ω)]
](3.10)
The amplitude∣∣∣T (ω)
∣∣∣ =|Epump(ω)||Eref (ω)| and phase Φ (ω) = θpump − θref
of the complex transmission function are obtained from the ratio of
the Fourier transforms of Epump (t) and Eref (t). By changing the time
delay ∆t between the photoexcitation pulse and the THz probe pulse,
the dynamics of the photoconductivity can be mapped out.

Chapter 3. Simultaneous reference and differential waveformacquisition in time-resolved terahertz spectroscopy 38
3.3 Drude conductivity
Linear response of charge carriers to an applied electric field can be
fully described by a complex conductivity function σ (ω) = σ′ (ω) + i ·σ′′ (ω). Several models have been developed to describe conductivity in
semiconductors. Even though many of those models have been created
before quantum mechanics, they are still able to describe complicated
problems in a rather accurate way. The simplest and the most commonly
used is the Drude model [136], in which carriers are considered free to
respond to the electric field. In addition to acceleration by an external
field, mobile carriers undergo collisions with scattering centers described
by a characteristic scattering time τ . The collisions are assumed to be
instantaneous, elastic and randomly changing momentum of the carrier.
The frequency dependent complex conductivity of a conductor according
to Drude model is described by [136]:
σ (ω) = σ′ (ω) + i · σ′′ (ω) =σdc (ω)
1− iωτ. (3.11)
DC conductivity σdc is expressed using scattering time τ , carrier density
n and effective mass of the carrier m∗ by:
σdc =ne2τ
m∗= ω2
pε0τ, (3.12)
where the plasma frequency ωp is defined as ω2p = ne2/ε0m
∗. The Drude
model also gives expression for the mobility of carriers µ = eτm∗ , from
which we see that the heavier the effective mass m∗ of a carrier the
lower the mobility.
Equation 3.11 can be seperated into real and imaginary parts
σ′ (ω) = σdc1
1 + (ωτ)2 , (3.13)
σ′′ (ω) = σdcωτ
1 + (ωτ)2 . (3.14)

Chapter 3. Simultaneous reference and differential waveformacquisition in time-resolved terahertz spectroscopy 39
0 1 2 3 4 5 60 . 0
0 . 2
0 . 4
0 . 6
0 . 8
1 . 0
σ’ ( ω) = σ’ ’ ( ω)
σ(ω
)/σdc
ωτ
σ’ ( ω) / σd c σ’ ’ ( ω) / σd c
σ( ω) = σ’ ( ω) + i σ’ ’ ( ω)
Figure 3.5: Real and imaginary parts of complex conductivity inthe Drude model.
Figure 3.5 shows the real and imaginary parts of the complex Drude
conductivity normalized by DC conductivity σdc as a function of the
product ωτ . The most feature-rich area of the plot is in the vicinity of
ωτ = 1, where σ′ (ω) = σ′′ (ω). For typical semiconductors, the scatter-
ing time τ is on the order of tens to few hundreds of femtoseconds, so
the characteristic frequency where ωτ ∼ 1 is placed in the terahertz re-
gion. For that reason, if one is able to measure the complex conductivity
function of semiconductor in the THz range and one assumes that the
response is given by only one type of carrier, one can accurately extract
carrier concentration, mobility and scattering time.
3.4 Experimental Setup
Figure 3.6(a) shows the schematic representation of the time-resolved
terahertz spectroscopy setup. A regenerative Ti:sapphire femtosecond
laser amplifier is delivering 45 fs, 2.8 mJ pulses with center wavelength

Chapter 3. Simultaneous reference and differential waveformacquisition in time-resolved terahertz spectroscopy 40
BNA crystal
BBO crystal
blackpolyethylene
sample
GaP
fs pulse for THz detection
fs pulse for sample excitation
fs pulse for THz generation
optical chopper
/4
(a)
(b)
BS
BS
time delay 1
time delay 2
fs pulses from laser amplifier
Wollaston prism
PD 1
PD 2
Figure 3.6: (a) Schematic of the simultaneous reference and dif-ferential waveform acquisition TRTS setup. (b) 2 frequency chopper
blade.
of 800 nm at a 1 kHz repetition rate. The laser output is split into three
portions: a source beam for THz pulse generation, a pump beam for
excitation of the sample and a gating beam for THz detection by free
space electro-optic sampling. Terahertz waves are generated by opti-
cal rectification in 1.4 mm-thick [010] N-benzyl-2-methyl-4-nitroaniline
(BNA) crystal [73, 74], which in detail is presented in chapter 2.2.1. The
800 nm light transmitted through the BNA crystal is blocked by a black
polyethylene sheet, transmissive to the THz pulse. Off-axis parabolic
mirrors are used to expand the THz beam and next to collimate and fo-
cus it to a ∼ 1 mm-diameter spot on the sample. The transmitted THz

Chapter 3. Simultaneous reference and differential waveformacquisition in time-resolved terahertz spectroscopy 41
pulse is then collimated and re-focused onto a [110] GaP crystal (300
µm-thick) for free space electro-optic detection of the THz transients.
GaP is chosen for detection over the more efficient ZnTe to allow higher
bandwidth detection, as the first phonon is at ∼11 THz whereas ZnTe
has its first phonon at ∼5.3 THz [94]. The usable bandwidth of such
a system extends from 0.1 to nearly 6 THz - Fig. 3.7(b) and is over
two times broader than a similar setup with THz generation based on
optical rectification in ZnTe. The highest THz electric fields obtained in
this setup are on the order of ∼ 5 kV/cm so we do not expect to observe
any nonlinear phenomena. The setup was enclosed in a plexiglass box
and purged with dry N2 to avoid water absorption lines. Both the 800
nm probe beam and the pump beam were focused through small holes
in the centers of off-axis parabolic mirrors for collinear detection and
excitation of the sample at normal incidence. The pump beam was fre-
quency doubled to 400 nm by β-BaB2O4 (BBO) crystal to ensure that
the ∼ 15 nm penetration depth of the pump beam in semi-insulating
gallium arsenide (SI GaAs) creates a film thin enough to fulfil the thin
film approximation [137]. The sample is mounted on the back of a 1.5
mm-diameter aperture to aid in pump/probe overlap. The pump beam
spot is approximately 3 mm in diameter, ∼3 times larger than the THz
spot which ensured uniform excitation [138]. Two computer controlled
delay stages are used to change the pump-probe delay times and also to
map the THz pulse shape. The setup is constructed in such a way that
one delay stage is scanning the time interval between the pump pulse
with respect to both the THz source and probe pulses. In this way the
whole THz transient is experiencing a constant delay from the pump
pulse [139].
Double modulation is a well-known technique for both static and time-
resolved terahertz spectroscopy [140–143], however to date this has only
been used for noise reduction of the differential scan. The key element
in simultaneous acquisition of reference and differential THz scans is
the use of a two frequency chopper blade, which shape is shown on Fig
3.6(b). The chopper blade consists of two kinds of sets of slots and

Chapter 3. Simultaneous reference and differential waveformacquisition in time-resolved terahertz spectroscopy 42
Figure 3.7: (a)Waveforms and (b) spectra of THz radiation gen-erated in 1 mm-thick (110) ZnTe and 1.3 mm-thick (010) BNA and
crystals.
shutters. The outer set is built of 15 slots and 15 shutters in equal
spacing, while the inner set consists of 10 slots and 10 shutters, where
the shutters are twice as wide as the slots. The chopper blade is rotating
at such a speed to modulate the beam going though the outer part at
500 Hz, synchronized to the 1-kHz repetition rate of the laser. At the
same time chopper blade modulates the beam going though the inner
part at 333 Hz. The output from the balanced photodiode detector
is split and sent to two independent lock-in amplifiers. The reference
signals for the lock-in amplifiers are second (500Hz) and third (333 Hz)
sub-harmonics of the laser system reference signal, and therefore are not
harmonic with respect to each other. As a result the cross talk between
signals measured at those frequencies is on the noise level.
Figure 3.8 shows the time sequence of the laser, pump, generation and
THz pulses with respect to each other. The inner chopper blade selects
every third pulse which is used for THz generation, while the outer blade
transmits every second pulse which is used as a pump. The first trans-
mitted THz transient does not experience the presence of a pump, while
the transmission of the second THz pulse decreases due to increased ab-
sorption from excited free carriers. The reference and pumped electric
fields of the terahertz transients can be expressed by the signals mea-
sured by the first [E1 (t), modulated at 333 Hz] and the second [E2 (t),

Chapter 3. Simultaneous reference and differential waveformacquisition in time-resolved terahertz spectroscopy 43
Figure 3.8: Time sequence of incoming pulses.
modulated at 500 Hz] lock-in amplifiers by
Eref (t) = E1 (t) +AE2 (t) (3.15)
Epump (t) = E1 (t)−AE2 (t) (3.16)
where A is a calibration constant.
Figure 3.9(a) shows a typical shape of the voltage difference V1−2 be-
tween the two balanced photodiodes while monitoring the induced phase
retardation at the peak of the THz transient, as illustrated in the lowest
row of signals in Fig. 3.8. The exponential decay at t = 0 ms corre-
sponds to the transmitted THz signal strength without pump, whereas
the exponential decay at t = 3 ms corresponds to the transmitted THz
signal with pump light, thus resulting in a lower amplitude. The values

Chapter 3. Simultaneous reference and differential waveformacquisition in time-resolved terahertz spectroscopy 44
measured by the lock-in amplifiers at 333 Hz and 500 Hz are correspond-
ingly the third (a333) and second (a500) harmonic Fourier coefficients of
the repetitive voltage difference between the two photodiodes with 6-ms
period (167 Hz repetition rate). The constant A can be expressed using
a333 and a500 by
A =a333|pump off − a333|pump on
a500|pump on. (3.17)
Figure 3.9(b) shows calculated values of the calibration constant A as a
function of the decay time τ of the voltage difference. For fast photodi-
odes (τ ≈ 0) the constant A is 1, and increases to a maximum value at
τ = 0.75 ms, followed by a gradual decrease at even slower photodiode
response times. We note that not only the decay time constant, but
also the detailed shape of the photodiode decay curve can influence the
constant A significantly.
Figure 3.10(a) shows the measured E1 and E2 signals of the peak of
the THz pulse as a function of time after 400 nm excitation of undoped
silicon, as well as the calculated Eref and Epump. The carrier life time in
silicon following 400 nm excitation is on the order of hundreds of µs [144],
and so the first 20 ps after excitation the Epump response is flat. This
step-like response allows for accurate experimental determination of the
constant A, which is found to be equal to 1.33. The decay constant of
the voltage difference V1−2 between the balanced detector photodiodes
was found to be 1.02 ms, what corresponds to the value of A of 1.28.
The difference from the experimentally obtained value can be explained
by variations of the voltage difference waveform from a pure exponential
decay. Figure 3.10(b) shows the reference signal Eref , calculated from E1
and E2. Eref is constant except for near the arrival of the pump where
a slight distortion originating from the detector response is visible.
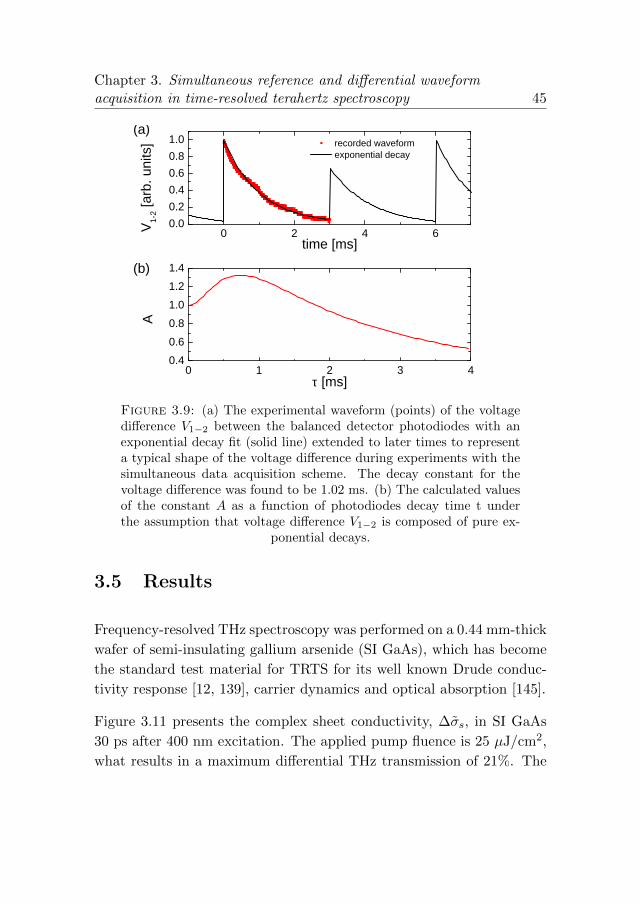
Chapter 3. Simultaneous reference and differential waveformacquisition in time-resolved terahertz spectroscopy 45
0 2 4 60 . 00 . 20 . 40 . 60 . 81 . 0
0 1 2 3 40 . 40 . 60 . 81 . 01 . 21 . 4
( a )
V 1-2 [a
rb. un
its]
t i m e [ m s ]
r e c o r d e d w a v e f o r m e x p o n e n t i a l d e c a y
( b )
A
τ [ m s ]Figure 3.9: (a) The experimental waveform (points) of the voltagedifference V1−2 between the balanced detector photodiodes with anexponential decay fit (solid line) extended to later times to representa typical shape of the voltage difference during experiments with thesimultaneous data acquisition scheme. The decay constant for thevoltage difference was found to be 1.02 ms. (b) The calculated valuesof the constant A as a function of photodiodes decay time t underthe assumption that voltage difference V1−2 is composed of pure ex-
ponential decays.
3.5 Results
Frequency-resolved THz spectroscopy was performed on a 0.44 mm-thick
wafer of semi-insulating gallium arsenide (SI GaAs), which has become
the standard test material for TRTS for its well known Drude conduc-
tivity response [12, 139], carrier dynamics and optical absorption [145].
Figure 3.11 presents the complex sheet conductivity, ∆σs, in SI GaAs
30 ps after 400 nm excitation. The applied pump fluence is 25 µJ/cm2,
what results in a maximum differential THz transmission of 21%. The

Chapter 3. Simultaneous reference and differential waveformacquisition in time-resolved terahertz spectroscopy 46
0
2 0
4 0
6 0
E 1 E 2 E r e f = E 1 + 1 . 3 3 E 2 E p u m p = E 1 - 1 . 3 3 E 2
Trans
missi
on [a
rb. un
its]( a )
- 2 0 - 1 0 0 1 0 2 05 2
5 3 E r e f( b )
P r o b e t i m e d e l a y [ p s ]Figure 3.10: (a) Measured E1 and E2 signals at the peak of THzpulse after 400 nm excitation of semi-insulating silicon in a 1D pump-probe experiment. (b) The recovered reference signal Eref = E1+AE2
(A = 1.33) indicating a disordered response at the arrival of the pump.
left column (a-c) shows data obtained with the standard data acqui-
sition method (Eref and ∆E (t) obtained in separate scans). Refer-
ence Eref (t), pump Epump (t) and differential ∆E (t) waveforms for Fig.
3.11(a) are presented in the Fig. 3.4. The right column (d-f) shows re-
sults of measurements in which the simultaneous data collection scheme
was applied. The individual plots differ from each other by the number
of measured THz pulses used for averaging, which was done in the time-
domain. The observed transient complex conductivity of photoexcited
SI GaAs can be well described by a simple Drude model, although to a
varying degree depending on data acquisition method and the number
of averaged scans. It is evident that the spectra extracted from the si-
multaneous detection scheme employed here are better represented by
the Drude model than the spectra obtained by separate acquisition.
Drude model fits to both ∆σ′s (ω) and ∆σ′′s (ω) data were performed
simultaneously using the Levenberg-Marquardt algorithm [146]. The

Chapter 3. Simultaneous reference and differential waveformacquisition in time-resolved terahertz spectroscopy 47
Drude scattering time τ obtained using the separate and simultaneous
acquisition methods differ, and the standard method gives lower values
with greater variations. The results obtained with simultaneous data
acquisition are identical within error and the uncertainty decreases with
number of scans.
Comparing Fig. 3.11 (a) and (d) it can be seen that especially at high
frequencies the conductivity spectrum obtained using the simultaneous
method contains more noise. This behaviour can be explained by the
fact that only every third pump pulse is measured by the E2 signal, so
the signal to noise ratio (SNR) decreases by a factor of√
3 in comparison
to the standard technique. This estimation of SNR is valid under the
assumptions that the main source of noise in the system is the laser.
In the case when the SNR is determined by the electrical noise from
photodiodes and lock-in amplifiers (∆E is not much higher than noise
on a base line), the fact that E2 = 12A∆E results in further decrease
in SNR by a factor of 2A. However, the factor of 2 which is gained in
data acquisition speed with the simultaneous method increases signal-
to-noise ratio by a factor of√
2 for a given acquisition time. This is also
observed when comparing Fig. 3.11(c) and Fig. 3.11(f). Scattering of
data points at high frequencies, caused by the high ω roll-off of the THz
pulse power spectrum, decreases with the number of scans in the average.
The bandwidth at which the collected data agrees with the Drude model
increases with the number of scans only for the simultaneous detection
scheme.
Analyzing Figs. 3.11(a), (b) and (c) we find that the data obtained using
the standard method are characterized with lower point to point noise,
but the agreement with the Drude model is very poor. At frequencies
higher than 1.5 THz, ∆σ′s (ω) is higher than expected from the Drude
model, while ∆σ′′s (ω) is lower than expected. Such a difference can
have its origins in a small time shift between the reference Eref and
differential ∆E scans. A constant time shift ∆t results in a linear phase
shift ∆Φ (ω) = ω∆t. Based on the fact that cos (Φ + ∆Φ) ≈ cos (Φ) −Φ∆Φ and sin (Φ + ∆Φ) ≈ sin (Φ) + ∆Φ (which holds for |∆Φ| |Φ|

Chapter 3. Simultaneous reference and differential waveformacquisition in time-resolved terahertz spectroscopy 48
0
2
4
6
∆σ!∆σ!
∆σ!∆σ!
∆σs [1
0-3 Ω-1 ]
! #"τ& !
∆σ!∆σ!
! #"τ&!
0
2
4
6
∆σs [1
0-3 Ω-1 ]
∆σ!∆σ!
!! #"τ&!
∆σ!∆σ!
!! #"τ&!
0 1 2 3 4 5
0
2
4
6
∆σs [1
0-3 Ω-1 ]
#$%
∆σ!∆σ!
!! #"τ&!
0 1 2 3 4 5
#$%
!! #"τ &!
Figure 3.11: Complex sheet conductivities ∆σs = ∆σ′s + i∆σ′′s ofphotoexcitated SI GaAs, 30 ps after 400 nm excitation at room tem-perature. Conductivity extracted by taking (a-c) two separately and(d-f) simultaneously acquired reference and pump waveforms. Thelines over the conductivity data are simultaneous Drude fits to ∆σ′s
and ∆σ′′s with scattering times given in the figures.

Chapter 3. Simultaneous reference and differential waveformacquisition in time-resolved terahertz spectroscopy 49
1) and using Eqs. 3.9 and 3.10 we find expressions for the measured
sheet conductivities ∆σ′∗s (ω) and ∆σ
′′∗s (ω),
∆σ′∗s (ω) = ∆σ′s (ω)− N + 1
Z0
1
|T (ω)|Φ∆Φ, (3.18)
∆σ′′∗s (ω) = ∆σ′′s (ω)− N + 1
Z0
1
|T (ω)|∆Φ. (3.19)
A constant time shift influences both the real and imaginary part of
conductivity in a linear fashion with opposite signs of the corrections to
the real and the imaginary part (Φ is negative for a Drude response).
This phase error influences the results of the extracted conductivity more
at higher frequencies than lower frequencies. The relative error in the
phase will be less in the vicinity of the scattering rate since this is where
the transmission function has a peak in its phase response.
An analysis of the data in Fig. 3.11(c) shows that a constant time shift
of 17 fs between the reference and differential scans can explain most
of the disagreement between the data and the Drude model. The new
value for the scattering time taking this shift into account is 141 ± 7
fs and is in better agreement with that obtained using simultaneous
data acquisition scheme. To test the simultaneous data acquisition, we
similarly performed a fit including a floating time shift correction to data
from figure 3.11(f). A time shift of 1.0 ± 0.5 fs was found to improve
the Chi2 of the fit, but this is on level of accuracy of delay lines and
confirms the principle of simultaneous scans acquisition.
A small time shift between the reference transient Eref and the differ-
ential ∆E can have several origins. It can be a result of a change in the
optical path between the THz generation and gating pulse (on the order
of few just few µm), which can be caused by temperature changes of the
optical table and elements on it, changes in the refractive index of air
due to variations in atmospheric humidity or N2 purging conditions, or
changes in the output of the laser system. Particularly changes in the
near infrared pulse duration can greatly impact the shape of the ampli-
tude spectrum of the generated THz radiation. Accurate spectroscopy
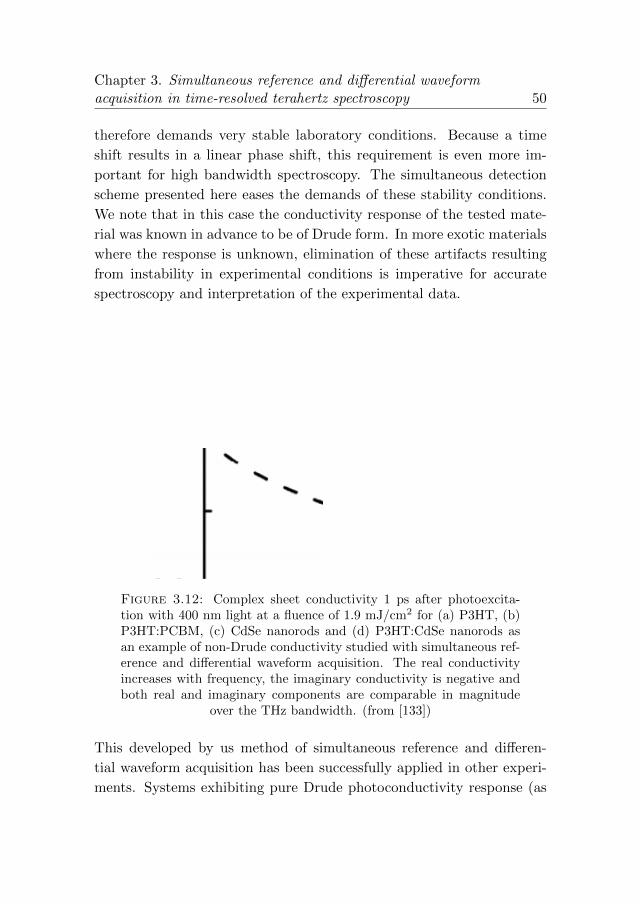
Chapter 3. Simultaneous reference and differential waveformacquisition in time-resolved terahertz spectroscopy 50
therefore demands very stable laboratory conditions. Because a time
shift results in a linear phase shift, this requirement is even more im-
portant for high bandwidth spectroscopy. The simultaneous detection
scheme presented here eases the demands of these stability conditions.
We note that in this case the conductivity response of the tested mate-
rial was known in advance to be of Drude form. In more exotic materials
where the response is unknown, elimination of these artifacts resulting
from instability in experimental conditions is imperative for accurate
spectroscopy and interpretation of the experimental data.
Figure 3.12: Complex sheet conductivity 1 ps after photoexcita-tion with 400 nm light at a fluence of 1.9 mJ/cm2 for (a) P3HT, (b)P3HT:PCBM, (c) CdSe nanorods and (d) P3HT:CdSe nanorods asan example of non-Drude conductivity studied with simultaneous ref-erence and differential waveform acquisition. The real conductivityincreases with frequency, the imaginary conductivity is negative andboth real and imaginary components are comparable in magnitude
over the THz bandwidth. (from [133])
This developed by us method of simultaneous reference and differen-
tial waveform acquisition has been successfully applied in other experi-
ments. Systems exhibiting pure Drude photoconductivity response (as
Chapter 3. Simultaneous reference and differential waveformacquisition in time-resolved terahertz spectroscopy 51
semiconductors [147]), and non-Drude response (InGaN/GaN multiple
quantum well [128], black silicon [128] and conjugated polymer/CdSe
nanorod composites [133] - Fig. 3.12) have been investigated. A similar
method of two lockin detection for time-resolved terahertz spectroscopy
was independently developed by Golde et al. [148].
3.6 Conclusions
In summary, we have suscessfully applied 1.4 mm-thick [010] BNA gen-
eration crystal combined with 0.3 mm-thick [110] GaP detection crystal
to perform TRTS experiments with a bandwidth expanding from 0.1 to
nearly 6 THz, which is over two time broader then similar setup based
on ZnTe. We developed a new method for simultaneous data acquisition
in time-resolved terahertz spectroscopy experiments. We have applied
this method to extract the sheet conductivity of photoexcited carriers
in SI GaAs and compared the results with those of a standard data ac-
quisition scheme. We have shown that application of the new method
minimizes errors in spectrally resolved photoconductivity data originat-
ing from fluctuations in the laser system output and timing errors in the
THz pulse detection.


Chapter 4
Imaging THz field insidea
parallel plate waveguide
Guiding of terahertz waves by various structures is a topic of extensive
investigation [149]. Due to its unique properties such as dispersionless
propagation of the TEM mode with no frequency cut-off, the parallel
plate waveguide (PPWG) has attracted significant attention [104, 150–
154] . Recently a tapered PPWG (TPPWG) has been proposed [155–
157]. THz waves can be confined inside a TPPWG on subwavelength
scale in both transverse dimensions [158] thus enabling THz near-field
spectroscopy with subwavelength resolution. Recently a nanofocusing
of mid-infrared radiation has been experimentally illustrated [159]. The
TPPWG also offers significant field enhancement and thus has a big
potential for investigation of nonlinear THz phenomena with tabletop
laser sources, which in recent years has become a very active research
field. For experimental characterization of the TPPWG it is necessary to
characterize the electric field distribution inside the waveguide. Recently
a method based on scattering of the field from needle tip inserted into
the waveguide was demonstrated [160].
53
Chapter 4. Imaging THz field inside a parallel plate waveguide 54
In the first part of the chapter we present a short review of chosen
topic concerning THz waveguides. In more detail we describe parallel
plate waveguide, which is in the focus of this chapter. Thereafter a
short introduction to the air bias coherent detection of THz radiation
will be given. As a next part of the chapter we present a new non-
invasive method for characterization of the propagating electric field
inside a TPPWG. We adapt the air bias coherent detection (ABCD)
technique and apply it to a TPPWG in order to image the THz electric
field distribution inside the waveguide along the propagation direction
without disturbing the propagation of the guided THz wave. As an
application of the method we demonstrate the direct measurements of
the reflection coefficient for the THz wave at the end of the waveguide. In
the next part of the chapter we investigate field enhancement properties
of the TPPWG. We show that THz peak electric field exceeding 1.4
MV/cm can be obtained. That high values of electric field open exciting
possibilities of investigating THz nonlinear processes.
4.1 Terahertz waveguides
The majority of THz systems are based on free space propagation of
THz transients. At the same time THz waveguides show significant
potential in many applications, including THz based sensors [161], THz
communication [17, 162] and subwavelength imaging [163]. Development
of waveguides for terahertz waves is motivated by the necessity of remote
delivery of broad band terahertz radiation from a terahertz source to the
point of interaction with the sample. The main challenge the THz field
is facing, is a high loss in most structures; which is caused by either
absorption losses in the material or conduction losses for the structures
incorporating metals.
Variety of realized and proposed structures is very rich. So far the most
investigated structure for guiding THz waves is a parallel plate waveg-
uide, which in detail will be described in the next section of this chapter.

Chapter 4. Imaging THz field inside a parallel plate waveguide 55
To other metal structures allowing for THz propagation one can account
single [164–166] or double [167] metal wires, hollow circular and rectan-
gular metal waveguides [168, 169] or metallic slit waveguides [170]. THz
propagation on a metal surfaces in a form of Zennek surface waves has
been also demonstrated [171, 172]. A next big class of THz waveguides
are THz fibers, which include crystalline solid core fibers [173], polymer
solid core fibers [174, 175] and hollow core photonic crystal fibers [176–
178] and air-clad porous fiber with sub-wavelength features in the core
[179]. Losses in those structures vary from tens of dB/cm for dielectric
slab waveguides [180] and metal hollow core waveguides [168] to few
dB/m for metal wires with plasmon mediated guidance [164]. Losses
depend highly on the designed structure, but the general tendency is
that the tighter the confinement the higher losses.
4.2 Parallel plate waveguides
Fig. 4.1(a) shows the simple geometry of the parallel plate waveguide
(PPWG). PPWG consists of two conducting plates separated by a set
distance b and forming in this way a waveguide. Many variations of this
structure have been designed during years. Usually conducting plates are
made of a well conducting bulk metals (mainly copper and aluminum),
but constructions where plates are formed by thin evaporated metal
[181] or by transparent conducting oxide like fluorinated tin oxide (FTO)
[182] have been also used. The volume between the space can be filled
with dielectric [161, 183] or left empty, depending on the purpose of the
waveguide.
For the electric field polarized along y-direction and propagating in the
z-direction only transverse magnetic (TM) modes can exist. If the plates
are formed out of perfect conductor, the non-vanishing terms of the field

Chapter 4. Imaging THz field inside a parallel plate waveguide 56
b
x
y
z metal plates
w
0.5 1.0
-1
1
Ey [
abr.
uni
ts]
y [b]
TM1
TM2
(a) (b) TEM
Figure 4.1: (a) Schematic of the parallel plate waveguide. (b) Modeprofiles of the first three modes in PPWG.
components are [184]:
Hx (y, z) = Am cos(mπby)e−iβzz, (4.1)
Ey (y, z) = −Amβzω0ε
cos(mπby)e−iβzz, (4.2)
Ez (y, z) =Amiω0ε
(mπb
)sin(mπby)e−iβzz, (4.3)
and β2z +
(mπb
)2= β0 = ω2
0µε, (4.4)
where m = 0, 1, 2, ... is the order of the TM mode, 0 ≤ y ≤ b, Am is the
field amplitude, ω0 is THz wave angular frequency, µ and ε are magnetic
permeability and dielectric permittivity of the medium filling waveguide.
The cut-off frequencies are given by
fm =mc
2b√µε, (4.5)
where c is the speed of light. The lowest order TM0 mode is in fact
TEM mode. It has no cut-off frequency and for perfectly conducting
plates, it is dispersionless, meaning that phase and group velocity of the
whole structure are equal to the phase and group velocity of the filling
dielectric.
Fig 4.1(b) shows mode profiles of the first three TM modes in PPWG.
Modes have spatial dependence of cos (mπy/b). This dependence results

Chapter 4. Imaging THz field inside a parallel plate waveguide 57
in a uniform field profile for the TEM mode, odd profile for TM1 and even
for TM2 mode. It is important to note that all the modes are orthogonal
to each other. That implies that any field distribution can be expressed
as a superposition of waveguide modes. That allows for easy calculation
of coupling coefficients of incoming field into the waveguide modes. For
example Gaussian beam, which has a even symmetry, will excite only
even modes (TEM, TM2, TM4) and the coupling coefficients will be
given by overlap integrals. Presented theory predicts that for infinitely
wide PPWGs mode profiles have no frequency dependance. That is due
to the strong boundary conditions at the conductor-dielectric interfaces.
Recently it has been experimentally shown that finite-width PPWGs
with real (not perfect) metals exhibit transition frequency above which
TEM-like mode changes its field profile and propagates as a plasmonic
mode [160].
The propagation losses in a ideal PPWG come from two sources: con-
duction losses from currents in metal plates and dielectric losses from
the medium filling the waveguide. In case of the PPWG filled with dry
air/nitrogen the second type of losses is obviously vanishing. The first
type of losses arises from the finite conductivity of the metal. The THz
field after propagating for distance L along the waveguide is attenuated
by factor e−αL/2. The attenuation constant α for the TEM mode coming
from the Ohmic losses can be expressed by [185]
α =2nRsZ0b
(4.6)
where Rs =√πfµ/σ is a surface resistivity, n is the refractive index of
the material filling waveguide, Z0 free space impedance and σ the con-
ductivity of the metal. From this equation two important observations
are seen. First of all losses of the TEM mode in the PPWG depend
inversely proportionally on the plate separation b, and secondly they
increase with frequency as a square root. This situation is different for
higher order modes, where Ohmic losses for frequencies above cut-off are
decreasing [151].

Chapter 4. Imaging THz field inside a parallel plate waveguide 58
4.3 Air bias coherent detection
TH
zHigh Voltage
Modulator
400 nm Bandpass Filters
Photomultiplying Tube
800 nm probe pulse
Ebias ETHz E800
t
z
x
Figure 4.2: Schematic diagram of air bias coherent detection.
Coherent detection of THz radiation is based on the interaction between
the laser pulse Iω and the THz electric field ETHz in the presence of the
external oscillating electric field Ebias [34]. Figure 4.2 shows a simple
geometry of the air bias coherent detection (ABCD) setup. By focusing
the terahertz pulse with a probe fundamental (ω) beam without addition
of external bias, an optical field at second harmonic (2ω) is emitted:
E2ω (~r, t) ∝ χ(3)xxxxETHz (~r, t)Eω (~r, t)Eω (~r, t) , (4.7)
where χ(3)xxxx is the third-order nonlinear susceptibility of the gas. All the
fields on the Fig. 4.2 are polarized along x-direction. For the moment
lets consider interaction only at one point (~r, t) and omit time-space
coordinates. Since E2ω ∝ ETHzEωEω, the intensity of the second har-
monic is proportional to the intensity of the THz wave I2ω ∝ ITHz. The
signal measured in this way is incoherent, and its applications are lim-
ited. To realize coherent detection, external ac bias field with amplitude
Ebias is added at the point of the optical focus. The phase of the exter-
nal field relative to the THz pulse trains is oscillating from 0 to 180
with every other THz pulse, changing in this way direction of the bias

Chapter 4. Imaging THz field inside a parallel plate waveguide 59
field. The external ac bias together with fundamental beam generates
second harmonic pulse with field amplitude ELO2ω ∝ χ(3)IωEbias, which
mixes with terahertz induced second harmonic ETHz2ω ∝ χ(3)IωETHz.
The total second-harmonic intensity has a form
I2ω ∝(ETHz2ω ± ELO2ω
)2=(ETHz2ω
)2 ± 2ETHz2ω ELO2ω +(ELO2ω
)2, (4.8)
where we assume that Ebias is constant during the interaction time be-
tween the THz transient and the probe pulse, and what can be also
written as
I2ω ∝(χ(3)Iω
)2 [E2THz ± 2EbiasETHz + E2
bias
]. (4.9)
Due to the phase modulation of the bias field between 0 to 180, lock-
in detection can easily isolate the cross-term. The amplitude of second
harmonic intensity measured by the lock-in amplifier locked to the os-
cillation frequency of the high voltage modulator is equal to
I2ω ∝ 4[χ(3)Iω
]2EbiasETHz. (4.10)
By changing the THz-probe time delay τ the full THz waveform can
be mapped out. Since the detection of the THz radiation occurs in a
nearly non-absorbing and non-dispersive medium, the spectrum is only
limited by the properties of the laser probing pulse. In contrast to
the free space electrooptic sampling in crystals, the measured spectrum
is not disturbed by crystal phonon modes and accurately corresponds
to the spectrum of the incident THz pulse. More over the acquired
waveform does not suffer from reflections in the crystal and the spectral
resolution can be increased by increasing the length of the measurement
time window. The optimal intensity of the probe beam is such that
it does not cause creation of plasma, what would lead to a white light
generation and result in increased noise measured by the photomultiplier
tube. On the other hand, it has been shown that for very high probe
intensities ( 6 · 1014 W/cm2) the generated second harmonic (SH) can
act as a local oscillating field, so coherent detection is possible without

Chapter 4. Imaging THz field inside a parallel plate waveguide 60
need external ac bias [32]. However this method is characterized by
much poorer signal to noise ratio. THz detection in other gases than
just air has been investigated and it has been found out that the THz
ABCD detection in xenon can be more efficient [186]. Further more by
applying balance detection signal to noise ratio of ADCD scheme can be
improved [101].
4.4 Imaging terahertz field inside parallel plate
waveguide
THz
NIR pump
LiNbO3
Lens
2000 l/mm
HWP
TPPWG
THz
4"
3"
x
z
Figure 4.3: Schematic of THz generation and coupling to the ta-pered parallel plate waveguide. THz radiation is generated using tiltedwavefront method in LiNbO3. A pair of 4” and 3” off-axis parabolicmirrors is used to couple THz into the TPPWG. Inset shows THz spotat the input to the TPPWG measured using pyroelectric detector witha 250 µm-diameter aperture has elliptical shape with FWHMs inten-sity of 1.6 mm along x-direction and 0.7 mm along y-direction. HWP
- half wave plate.
Here we present a novel non-invasive method for characterization of the
propagating electric transients inside a tapered parallel plate waveguide
(TPPWG). For this purpose we adapt previously described ABCD tech-
nique and apply it to a TPPWG in order to image the THz electric field
distribution inside the waveguide along the propagation direction. This

Chapter 4. Imaging THz field inside a parallel plate waveguide 61
method does not disturb the propagating THz field. In a closer detail
we look at the influence of the cross-directional propagation.
translation stage
THzTHz
F
PMT
L1
L2
NIR probe
time delay
THz
NIR probe
THz
TPPWG
HVM
zx
y
HWP
Figure 4.4: Schematic of the air photonic setup for non-invasive fieldimaging inside a tapered parallel plate waveguide. THz radiation iscoupled into the TPPWG, propagates along it and then interacts withNIR probe inducing second harmonic generation in the presence ofoscillating local electric bias field. L1, L2 - lenses, F - 400 nm bandpassfilter, HVM - high voltage modulator, PMT - photomultiplying tube,
HWP - half wave plate.
Figures 4.3 and 4.4 show the schematics of the experimental setup. The
TPPWG consists of two electrically isolated, fine polished aluminum
plates of varying width (input 3 mm, output 49 µm) and a varying plate
separation. The input plate separation to the waveguide is set to 1 mm,
while the output plate separation can be varied between 0µm and 500

Chapter 4. Imaging THz field inside a parallel plate waveguide 62
µm by help of a micrometric stage. Aluminum was chosen as a mate-
rial for metal plates because of its combination of high conductivity and
hardness, that is needed for low loss propagation and possibility of man-
ufacturing narrow tips. The total length of the TPPWG is 25.4 mm. A
high voltage modulator (HVM) delivering ±100 V at 500 Hz (synchro-
nized with first subharmonic of the laser repetition rate) is connected to
the waveguide plates. The applied voltage results in an electric bias field
of ±5 kV/cm at the point of the narrowest gap between metal plates
for 200 µm plate separation. Broadband THz pulses are generated by
tilted pulsefront optical rectification in LiNbO3 (described in chapter
2.2.2) using near-infrared (NIR) 0.6 mJ pump pulse from a 1 kHz, 90 fs,
800 nm regenerative Ti:sapphire femtosecond laser amplifier (Spectra-
Physics Hurricane). The intensity front of fs pulses is tilted by a 2000
line/mm holographic grating and imaged by a 63 mm-focal length lens
with demagnification factor of 2 onto the front surface of a stoichiomet-
ric LiNbO3 crystal at room temperature. THz pulse energies up to 0.5
µJ measured directly after the LiNbO3 were obtained. Pair of 50.8 mm-
diameter, 101.6 mm- and 76.2 mm-focal length off-axis parabolic mirror
is used to collimate and focus THz radiation at the input to the TPPWG.
A pyroelectric detector with a 0.25 mm-diameter aperture mounted on
a x-y motorized translation stage was used to image THz field intensity
at the input to the waveguide. The THz beam has an elliptical shape,
shown in the inset to the Fig. 4.3, with intensity FWHMs of 1.6 mm
along x-direction and 0.7 mm along y-direction. The THz wave couples
into the TPPWG, propagates between the aluminium plates in a TEM
mode and then couples out into the free space at the narrow end of the
waveguide. A NIR beam from the same laser is used for probing the
THz field between the plates of the waveguide. The probe beam is fo-
cused in the center of the volume between the plates with a 19 mm-focal
length lens (L1) and recollimated after the waveguide with lens L2. The
beam waist at the focus point has been estimated to be 6.5 µm and
the Rayleigh range is 41 µm. The highest NIR pulse energy limited to
18 µJ in order to avoid ionization of the air. This part of the setup is

Chapter 4. Imaging THz field inside a parallel plate waveguide 63
mounted on a translation stage, that enables scanning along the waveg-
uide (z- direction). The beam is sent through 400 nm bandpass filters
to a photomultiplier tube (PMT) which detects the 400-nm light gener-
ated in the ABCD process. The signal from the PMT is measured by
a lock-in amplifier referenced to HVM modulation frequency. The po-
larizations of the four interacting electric fields (terahertz, fundamental,
second harmonic and bias) are perpendicular to the waveguide plates.
In the standard ABCD configuration the probe pulse and the THz tran-
sient propagate collinearly through the area of a bias field. For a given
THz-probe delay time τ , each point of the NIR probe interacts with
the same part of a THz waveform through out the whole interaction
length. Thus the detected second harmonic intensity I2ω (τ) is propor-
tional to the time convolution between the THz waveform ETHz (t) and
the square of probe intensity I2ω (t):
I2ω (τ) ∝ Ebias∫ETHz (t) I2
ω (τ − t) dt. (4.11)
In our configuration the THz transient and the probe pulse propagate in
perpendicular directions. In this case for a given THz-probe delay time
τ , each point of the NIR probe interacts with a moving THz waveform
and the intensity I2ω (τ) of the generated SH is expressed as:
I2ω (τ) ∝∫Ebias (~r)
(∫ETHz (t, ~r) I2
ω (t+ τ, ~r) dt
)d3~r. (4.12)
In the above equation the inner integral is a temporal cross-correlation
between the THz transient and the square of the probe beam intensity
at the space point ~r, while the outer integral sums contributions from
each point of the interaction volume.
We now consider our case of a 800 nm, 90 fs-long NIR pulse in a focused
Gaussian beam of waist 6.5 µm and a Rayleigh range of 41 µm. The
beam is focused in a uniform THz field restrained to a volume of thick-
ness Lx (inset in Fig. 4.5(a)). The maximum induced SH I2ωmax as a

Chapter 4. Imaging THz field inside a parallel plate waveguide 64
0 50 100 150 2000.0
0.2
0.4
0.6
0.8
1.0
2 4 6 8 101E-5
1E-4
1E-3
0.01
0.1
1
I 2
max [
arb.
uni
ts]
Lx [
(a)
(b)
R [a
rb. u
nits
]
Frequency [THz]
Lx = 20
Lx = 80
Lx = 200
m]
m
m
m
THz
NIR
Lx
t
Figure 4.5: (a) Normalized maximum second harmonic intensity I2ωas a function of interaction length Lx between fundamental and THzbeams. The 800 nm beam waist at the focus point has been calculatedto be 6.5 µm and the Rayleigh range is 41 µm, pulse duration 90 fs.Inset presents considered geometry. (b) Normalized response function
R (f) for Lx = 20µm, 80µm and 200µm.
function of Lx calculated with Eq. 4.12 is shown in Fig. 4.5(a). Single-
cycle THz transient with frequency components in the range 0.05 - 3.0
THz was used for the calculations. For Lx shorter than the Rayleigh
range the interaction length between the THz wave and the probe is de-
fined by Lx. In the opposite limit of Lx longer than the Rayleigh range
I2ω saturates. The interaction length is limited by the geometrical di-
mensions of the focus of the probe beam, as indicated by the quadratic

Chapter 4. Imaging THz field inside a parallel plate waveguide 65
dependence of Iω in Eq. 4.12. This is valid as long as the wavelength of
the highest frequency components within the THz transient is shorter
than the Rayleigh range of the probe beam. The response function
R (f) = I2ω (f) /ETHz (f), which describes the spectral response, has
been evaluated for different widths of the THz region as shown in Fig.
4.5(b). For small Lx the response function is monotonously decreasing
with frequency. For larger Lx the effects of positive and negative part
of THz waveform can interfere leading to sharp dips in the response.
In Fig. 4.6(a) we show a 2D map of THz induced SH I2ω (τ, z) as a
function of the THz transient-probe delay time τ for different positions
z of the probe beam along the waveguide can be obtained. Two THz
transients are visible in the plot: the first transient, centered at 5 ps
time delay, is the incident pulse propagating inside the waveguide. The
second transient, propagating in the opposite direction, originates from
the reflection at the waveguide end (position z = 0 mm) due to the
impedance mismatch between the waveguide (z < 0) and free space
(z > 0). Values of I2ω (t, z) for z < 0 has been corrected for the local
bias field Ebias (z), which changes with the plate separation. We have
to note that for z > 0 (outside the waveguide) the bias electric field
quickly decays which leads to vanishing I2ω (t, z). Fig. 4.6(b) shows the
retrieved and simulated peak value of THz electric field as a function of
NIR probe position z along the waveguide. To calculate ETHz (t, z) the
values of I2ω (t, z) have been corrected using the width of metal plates
(and correspondingly by the interaction length Lx (z)) according to the
dependence from Fig. 4.5(a). The time-domain numerical simulation
was performed with CST Microwave Studio for a TPPWG made of alu-
minium treated as a lossy metal with conductivity of σ = 3.56 · 107
S/m [187]. The simulation agrees well with the measurement except
for z > 0 where the fast decrease in the measured value is caused by
the rapid decay of Ebias outside the waveguide. The dip at z = −0.15
mm has its origins in the interference between incident and reflected
wave. The shape of the TPPWG structure can cause field enhance-
ment in the proximity of the waveguide edges (propagating THz edge

Chapter 4. Imaging THz field inside a parallel plate waveguide 66
THz THz
NIR probeEbias
Tim
e [p
s](a)
(b)
-1.0 -0.8 -0.6 -0.4 -0.2 0.0 0.20.0
0.2
0.4
0.6
0.8
1.0
measurement simulation
Pea
k E
l. fie
ld [a
rb. u
nits
]
Position z [mm]
Figure 4.6: (a) 2D map of THz induced second harmonic I2ω (t) asa function of THz wave-probe delay time for different positions of theprobe beam along the waveguide. Values of I2ω (t) have been correctedfor the bias field. (b) Measured and simulated integrated peak THzelectric field across the waveguide as a function of NIR probe position
z.
plasmons)[158], while the calculated value of ETHz (t, z) is an integrated
value of the THz electric field along the probe direction within the in-
teraction volume. If additional freedom of the scanning stage movement
along directions x and y is available, then edge enhancement effects
Chapter 4. Imaging THz field inside a parallel plate waveguide 67
can also be investigated using our method, with a transverse resolution
determined by the Rayleigh range of the probe beam.
Fig. 4.7 shows measured frequency dependent amplitude reflection co-
efficient Γ (f) = Erefl (f) /Einc (f) of the waveguide end together with
the result of a numerical simulation. For a good temporal separation
between the incident and reflected pulses, the data (shown at the inset
to the Fig. 4.7) is taken at a point z = −0.9 mm from the waveg-
uide end. That implies that the presented reflection coefficient Γ in-
cludes not only reflection but also propagation effects, such as ohmic
losses and wave scattering, which will lead to additional reduction of
the amplitude of the reflected field. The reflection of the THz wave
is caused by impedance mismatch between free space Z0 = 377Ω and
the waveguide ZPPWG =√
(R+ iωL) / (G+ iωC), where R, L, G, C
are correspondingly distributed resistance, inductance, conductance and
capacitance of the waveguide. We observe that the reflection coeffi-
cient Γ = (ZPPWG − Z0) / (ZPPWG + Z0) decreases with increasing THz fre-
quency, as it is expected since short waves are easier to squeeze through
subwavelength gap. We find good agreement between measurement and
simulation in the frequency range 0.1 - 0.5 THz. At higher frequencies
the measured reflection coefficient Γ is smaller than theoretically pre-
dicted. This can be caused by the increased wave scattering (especially
important at higher frequencies and at interfaces) [188] and increased
ohmic losses at higher frequencies.
4.5 Field enhancement inside tapered parallel
plate waveguide
Figure 4.8 shows the output intensity distributions of the THz electric
field measured using a pyroelectric detector with a 0.25 mm-diameter
aperture placed 0.8 mm away from the waveguide tip for output gaps
of 0 µm, 20 µm and 200 µm with the input gap Bin = 1 mm. For
the closed waveguide no THz field is transmitted directly through the

Chapter 4. Imaging THz field inside a parallel plate waveguide 68
0 . 1 0 . 2 0 . 3 0 . 4 0 . 5 0 . 6 0 . 7 0 . 8 0 . 9 1 . 00 . 0
0 . 2
0 . 4
0 . 6
0 . 8
1 . 0
0 4 8 1 2 1 6- 4- 3- 2- 10123
Refle
ction c
oeffic
ient
Γ
F r e q u e n c y [ T H z ]
m e a s u r e m e n t s i m u l a t i o n
Electr
ic field
[arb.
units]
T i m e [ p s ]
Figure 4.7: Measured and simulated frequency dependent amplitudereflection coefficient Γ of the waveguide end. Waveform from point
z = −0.9 mm shown in the inset.
output. However we are able to observe THz waves that leaked around
the tip - blurred halo around the center of the scan. The vertical lines
visible on the picture come from the THz waves that propagate on the
outside vertical walls of the waveguide. For the open gaps the majority
of the THz wave propagates through the gap and dominates the pic-
tures. Those strong burst of THz radiation, even for output gaps that
are over one order of magnitude smaller than the THz wavelength, indi-
cate that high THz intensities are focused below diffraction limit. This
subwavelength energy concentration opens possibility of strong field en-
hancement which will be discussed below.
First we will try to estimate in an analytical manner the field enhance-
ment at the output of the waveguide. Lets consider 1D-tapered infinitely
wide PPWG with THz wave propagating as a TEM mode. In the case
of PPWG tapered in the y-direction, the plate spacing b is a function of
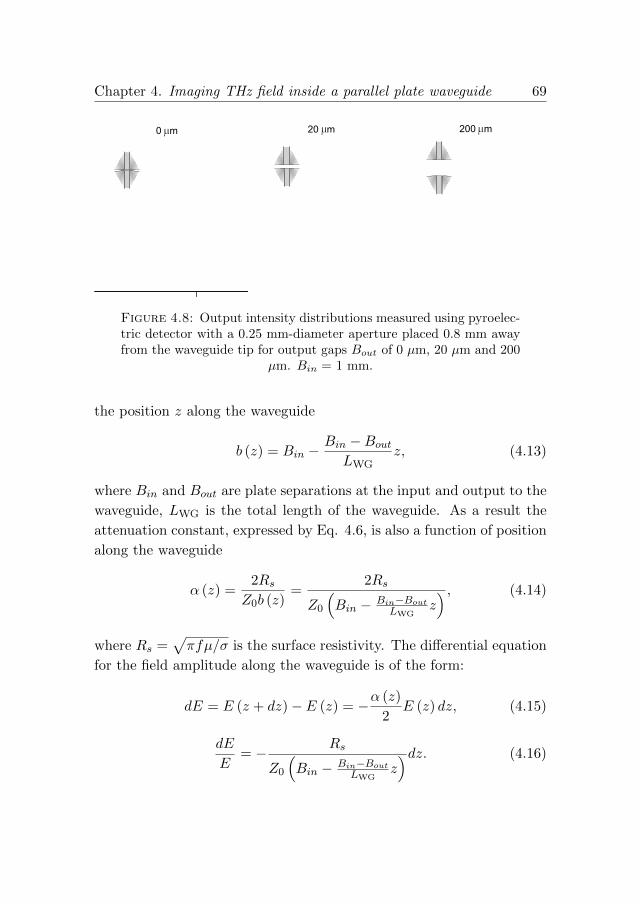
Chapter 4. Imaging THz field inside a parallel plate waveguide 69
0 m 20 m 200 m
Figure 4.8: Output intensity distributions measured using pyroelec-tric detector with a 0.25 mm-diameter aperture placed 0.8 mm awayfrom the waveguide tip for output gaps Bout of 0 µm, 20 µm and 200
µm. Bin = 1 mm.
the position z along the waveguide
b (z) = Bin −Bin −BoutLWG
z, (4.13)
where Bin and Bout are plate separations at the input and output to the
waveguide, LWG is the total length of the waveguide. As a result the
attenuation constant, expressed by Eq. 4.6, is also a function of position
along the waveguide
α (z) =2Rs
Z0b (z)=
2Rs
Z0
(Bin − Bin−Bout
LWGz) , (4.14)
where Rs =√πfµ/σ is the surface resistivity. The differential equation
for the field amplitude along the waveguide is of the form:
dE = E (z + dz)− E (z) = −α (z)
2E (z) dz, (4.15)
dE
E= − Rs
Z0
(Bin − Bin−Bout
LWGz)dz. (4.16)

Chapter 4. Imaging THz field inside a parallel plate waveguide 70
By integrating both sides of above equation, the electric field as a func-
tion of position inside the waveguide is found in a form
E (z) = E0
[1−
(1− Bout
Bin
)z
LWG
]RsZ0
LWGBin−Bout
. (4.17)
The field reduction FR at the output to the waveguide due to Ohmic
attenuation is equal to:
FR =E (z = LWG)
E0=
[BoutBin
]√πfµ/σZ0
LWGBin−Bout
. (4.18)
1 1 0 1 0 00 . 8 00 . 8 20 . 8 40 . 8 60 . 8 80 . 9 00 . 9 20 . 9 40 . 9 60 . 9 8
Field
Redu
ction F
R
B o u t [ µm ]
0 . 5 T H z 1 . 0 T H z 2 . 0 T H z
Figure 4.9: Calculated field reduction FR due to Ohmic losses at theoutput of a 1D-tapered PPWG as a function of the output gap Bout
for 0.5, 1.0 and 2.0 THz. Data for input plate spacing Bin = 1000µm,the total length of the waveguide LWG = 25.4 mm and conductivity
of the metal σ = 3.56 · 107 S/m.
Figure 4.9 shows the calculated field reduction FR at the output of a
1D-tapered PPWG as a function of the output gap Bout for the field
frequencies of 0.5, 1.0 and 2.0 THz. Lines are calculated using Eq.
4.18, where the conductivity of aluminum was set to σ = 3.56 · 107 S/m
[187], input plate spacing Bin = 1000 µm, and the total length of the

Chapter 4. Imaging THz field inside a parallel plate waveguide 71
waveguide LWG = 25.4 mm. It can be seen on the figure that the field
reduction depends strongly on the output plate separation Bout, in a way
that the larger the plate separation the smaller the losses. Hence the
attenuation coefficient α increases with the frequency of the propagating
THz field as a√f , and therefore the field reduction FR is also frequency
dependent.
1 1 0 1 0 0
5 0
1 0 0
1 5 0
2 0 0
Field
Enha
ncem
ent F
E
B o u t [ µm ]
0 . 5 T H z 1 . 0 T H z 2 . 0 T H z
Figure 4.10: Calculated field enhancement FE at the output of a2D-tapered PPWG as a function of the output gap Bout for 0.5, 1.0and 2.0 THz. The field enhancement is achieved by energy squeezingin the area between metal plates. Data for Bin = 1000µm, Win =3000µm, Wout = 49µm, LWG = 25.4 mm and conductivity of the
metal σ = 3.56 · 107 S/m.
The analytical calculation of field reduction FR, which is presented
above, is only an indication of the average Ohmic loss along a PPWG
tapered in one direction, and does not include the fact that the THz en-
ergy of a THz wave is getting squeezed to a smaller area. The TPPWG
investigated in this thesis has two-dimensional tapering in directions per-
pendicular to the propagation of THz wave. Now we will assume that
a THz wave, which is uniformly distributed across input facet, is con-
fined within the volume between metal plates. That is the transmitted
total power is constant: E2 (z)A (z) /ZWG (z) = const, where A (z) is a
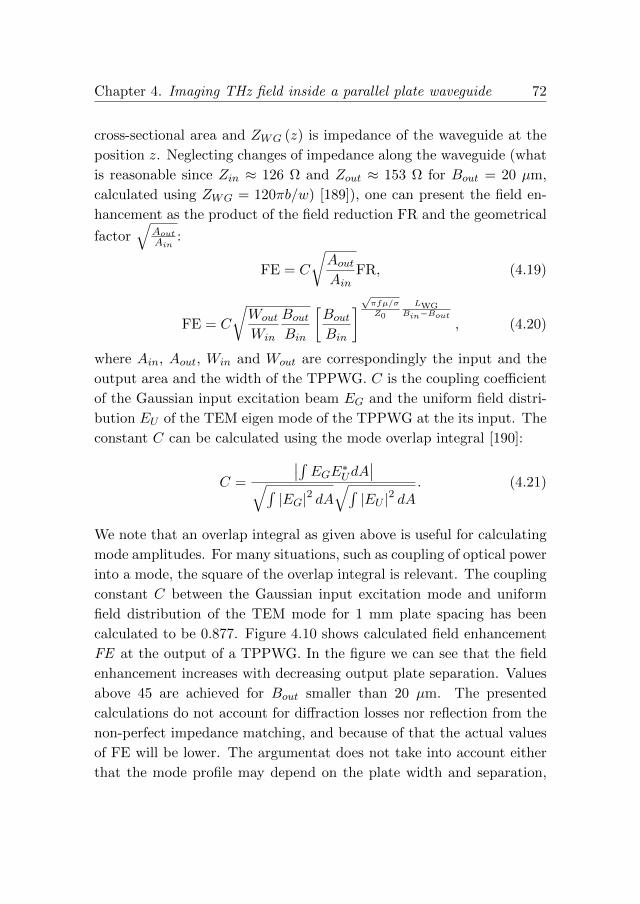
Chapter 4. Imaging THz field inside a parallel plate waveguide 72
cross-sectional area and ZWG (z) is impedance of the waveguide at the
position z. Neglecting changes of impedance along the waveguide (what
is reasonable since Zin ≈ 126 Ω and Zout ≈ 153 Ω for Bout = 20 µm,
calculated using ZWG = 120πb/w) [189]), one can present the field en-
hancement as the product of the field reduction FR and the geometrical
factor√
AoutAin
:
FE = C
√AoutAin
FR, (4.19)
FE = C
√Wout
Win
BoutBin
[BoutBin
]√πfµ/σZ0
LWGBin−Bout
, (4.20)
where Ain, Aout, Win and Wout are correspondingly the input and the
output area and the width of the TPPWG. C is the coupling coefficient
of the Gaussian input excitation beam EG and the uniform field distri-
bution EU of the TEM eigen mode of the TPPWG at the its input. The
constant C can be calculated using the mode overlap integral [190]:
C =
∣∣∫ EGE∗UdA∣∣√∫|EG|2 dA
√∫|EU |2 dA
. (4.21)
We note that an overlap integral as given above is useful for calculating
mode amplitudes. For many situations, such as coupling of optical power
into a mode, the square of the overlap integral is relevant. The coupling
constant C between the Gaussian input excitation mode and uniform
field distribution of the TEM mode for 1 mm plate spacing has been
calculated to be 0.877. Figure 4.10 shows calculated field enhancement
FE at the output of a TPPWG. In the figure we can see that the field
enhancement increases with decreasing output plate separation. Values
above 45 are achieved for Bout smaller than 20 µm. The presented
calculations do not account for diffraction losses nor reflection from the
non-perfect impedance matching, and because of that the actual values
of FE will be lower. The argumentat does not take into account either
that the mode profile may depend on the plate width and separation,

Chapter 4. Imaging THz field inside a parallel plate waveguide 73
neither that the absorption constant may be different for finite width
PPWG.
The time-domain numerical simulations are performed with CST Mi-
crowave Studio for a full size TPPWG made of aluminium treated as a
lossy metal. The TPPWG is divided into 40 · 106 mesh cells. Perfectly
matched layer (PML) boundary conditions are used. Simulations are
performed on a 12-core processor computer workstation with 48GB of
memory and take ∼ 4.5 hours of computing time each. The THz beam
at the input to the waveguide has shape close to elliptical Gaussian,
with FWHM in intensity of 1.6 mm along x-direction and 0.7 mm along
y-direction. Figure 4.11 shows the peak electric field at the central point
between metal plates along the TPPWG for output gaps Bout of 20, 40,
60, 100, 140 and 200 µm. The electric field is normalized to the maxi-
mum of Gaussian field at the input to the waveguide. The input to the
waveguide is at z = −25.4 mm and the output at z = 0.0 mm. During
the first 7 mm of the waveguide the THz peak electric field oscillates.
Those changes are caused by mode fitting between Gaussian mode and
TEM mode. In the last 18 mm of the waveguide gradual increase of the
peak THz electric field happens. Field enhancement higher than a factor
of 20 is achieved for the output gap of 20 µm. At z = 0 THz field couples
out of the TPPWG, and for z > 0 the peak electric field decreases due to
strong diffraction. The smaller the output gap the bigger the diffraction
angle in the vertical direction and the faster the decrease of the peak
electric field. Also the reflection coefficient is larger for smaller gaps, so
less energy couples out when Bout is narrow.
Figure 4.12 shows the calculated distributions of the y-component of the
peak THz electric field along the TPPWG for a few chosen positions z.
The field at the input (z = −25.1 mm) of the waveguide has an elliptical
gaussian distribution. The general trend visible from presented field
distribution is that the majority of the energy of the THz field is confined
within the area between metal plates. The confinement is tighter the
closer the metal plates are. At the position of z = −9.1 mm the field has
a distribution more resembling the uniform field distribution of the TEM

Chapter 4. Imaging THz field inside a parallel plate waveguide 74
- 2 5 - 2 0 - 1 5 - 1 0 - 5 0
1
1 0
Ele
ctric F
ield [a
rb. un
its]
z [ m m ]
B o u t 2 0 µ m 4 0 µ m 6 0 µ m 1 0 0 µ m 1 4 0 µ m 2 0 0 µ m
Figure 4.11: Simulated peak electric field along the TPPWG foroutput gaps Bout of 20, 40, 60, 100, 140 and 200 µm. Electric fieldis normalized to the field at the input to the waveguide. Field valuesfor the center points between plates. Input to the waveguide is at z =−25.4 mm and the output at z = 0.0 mm. Data for Bin = 1000 µm,Win = 3000 µm, Wout = 49 µm, LWG = 25.4 mm and conductivity
of the metal σ = 3.56 · 107 S/m.
mode, with exception of proximity to edges of the waveguide, where it
is enhanced. This effect has been previously reported by Zhan et al.
[157], and can be explained by the presence of THz propagating edge
plasmon. Once the THz transient couples out of the TPPWG the THz
beam rapidly diffracts. In Fig. 4.12(j) a blurred halo around the center
of the image and the vertical lines that come from the THz waves that
propagate on the outside vertical walls of the waveguide are visible, what
is in agreement with measurements shown at Fig. 4.8(a) and (b).

Chapter 4. Imaging THz field inside a parallel plate waveguide 75
200 m 20 m
z = -25.1 mm
z = -9.1 mm
z = -0.1 mm
z = 0.9 mm
z = -4.1 mm
(a)
(b)
(c)
(d)
(e)
(f)
(g)
(h)
(i)
(j)
Figure 4.12: Distributions of the y-component of the peak THzelectric field along the TPPWG for Bout of (a-e) 200 µm and (f-j) 20µm at positions along the waveguide z = −25.1, −9.1, −4.1, −0.1 and0.9 mm. Note that scales in the left and right column are different(left column range is 0 to 20000 V/m, while for the right column has
range from 0 to 100000 V/m).

Chapter 4. Imaging THz field inside a parallel plate waveguide 76
Figure 4.13 shows the ratio between THz field enhancement simulated
using CST Microwave Studio FEsim and calculated in analytical man-
ner FEan using Eq. 4.20 at the output of the TPPWG for different
sizes of the output gap Bout. The main difference between FEsim and
FEan is that the second one does not account for wave diffraction in the
x-direction, so FEsimFEan
is a good representation of diffraction losses. It is
clear that diffraction losses increase with increasing output gap separa-
tion. This effect can be explained using the contrast between effective
waveguide impedance ZWG and a free space impedance Z0. Narrowing
plate separation increases effective waveguide impedance ZWG. Higher
contrast between ZWG and Z0 leads to higher reflection coefficient in the
x-direction, which means that the THz wave is tighter confined within
the waveguide. This effect is analogous to solid core optical fibers, where
high contrast in refractive index gives tight confinement of the optical
wave. A single exponential decay has been fitted to the data points in
Fig. 4.13 with parameters shown in the figure. The agreement between
data points and the exponential decay is very good. The long distance
limit of FEsimFEan
(Bout →∞) fit is 0.174 ± 0.011. This result is in agree-
ment with work of Zhan et al. [157], who has experimentally showed that
the field confinement in the area between plates of a PPWG decreases
exponentially with increasing plate separation.
To experimentally verify THz field enhancement by TPPWG two meth-
ods are used. The first method is to detect THz radiation using free space
electro-optic sampling outside the TPPWG and then to use outcoupling
coefficients, delivered by numerical simulation, to compute fields at the
output of the waveguide. The second method is based on detection of
THz induced second harmonic and is similar to the ABCD method.
Figure 4.14 show a schematic of the free space electro-optic setup for de-
tection of the THz field at the output of the tapered parallel plate waveg-
uide. NIR probe pulses from the same laser amplifier are focused using
a 50 mm-focal length lens onto 300 µm-thick [110] GaP crystal. Part
of the NIR probe enters the GaP crystal and is reflected from the back
surface of the electro-optic crystal and copropagates with THz radiation.

Chapter 4. Imaging THz field inside a parallel plate waveguide 77
0 4 0 8 0 1 2 0 1 6 0 2 0 0
0 . 2 4
0 . 2 8
0 . 3 2
0 . 3 6
0 . 4 0
0 . 4 4
F E s i m / F E a n G a u s s i a n d e c a y f i t
FEsim
/FEan
B o u t [ µm ]
y = y 0 + A e - B o u t / B D
y 0 = 0 . 1 7 4 + / - 0 . 0 1A = 0 . 2 8 5 + / - 0 . 0 0 9B D = 1 2 8 + / - 1 0 µm
Figure 4.13: Calculated diffraction losses in a TPPWG as a func-tion of the output gap Bout for THz wave at 1.0 THz. Solid lineshows exponential decay fit. Data for Bin = 1000µm, Win = 3000µm,Wout = 49µm, LWG = 25.4 mm and conductivity of the metal
σ = 3.56 · 107 S/m.
THz
NIR pump
LiNbO3
Lens
2000 l/mm
HWP
TPPWG
NIR probe
To balance detection
BS
GaP
THzTHz
zx
y
GaP
TPPWG
Figure 4.14: Schematic of the electro-optic detection of output fromthe tapered parallel plate waveguide. THz radiation is generated usingthe tilted wavefront method in LiNbO3, coupled into the TPPWG,propagates along it, couples out and is detected in 300 µm-thick [110]GaP crystal in reflection configuration. Distance between output of
TPPWG and the GaP crystal is ∼ 360µm.

Chapter 4. Imaging THz field inside a parallel plate waveguide 78
The beam waist at the focus point has been estimated to be approxi-
mately 20 µm. The lens is mounted on a micrometric xyz-translation
stage for an accurate alignment on the crystal. Due to unfortunate ge-
ometrical restrictions the distance between GaP crystal and waveguide
output can not be shorter than 300 µm. The THz electric field induces
a phase retardation between polarization components of the NIR probe.
The phase retardation is measured by the balanced detection. The same
setup was used to detect THz field at the input to the waveguide.
The second method of calibrating the electric field of the THz wave at
the output of the TPPWG is based on measuring the THz induced SH
intensity. According to Eq. 4.9 the total second harmonic generated as
a result of interaction between the THz transient, the fundamental pulse
and the DC bias electric field is expressed by
I2ω ∝(χ(3)Iω
)2 [E2THz + 2EbiasETHz + E2
bias
]. (4.22)
Now, instead of modulating Ebias as it is done in the ABCD method, we
will modulate the THz beam by inserting an optical chopper in its path.
A lock-in amplifier is locked to chopper frequency and detects following
SH intensity
I2ω ∝ [E2THz + 2EbiasETHz]. (4.23)
Performing two measurements of SH intensity: I02ω without and Ibias2ω
with known external DC bias, the absolute amplitude and sign of the
THz electric field can be determined:
x =Ibias2ω − I0
2ω
I02ω
=2EbiasETHz
E2THz
, (4.24)
ETHz =2Ebiasx
, (4.25)
where x is the modulation depth of the generated second harmonic.
Figure 4.15 shows measurements of intensity of the THz induced SH
without and with external 10 kV/cm bias at the output of TPPWG
with an output gap of 100 µm. Measurements are performed in the setup

Chapter 4. Imaging THz field inside a parallel plate waveguide 79
presented in Fig. 4.4. Because of the bipolar nature of the THz transient
one peak of the induced SH decreases in the presence of external field
while the other one increases. Using the method outlined above the
peak of the THz electric field has been calculated to be 295 kV/cm. To
check if the THz induced second harmonic has a nature described by Eq.
4.23, a pair of polarizers has been inserted in the path of THz beam. By
rotating the first polarizer, the THz field strength can be varied. Figure
4.16(a) shows the intensity of the generated SH as a function of E2THz.
A linear dependence is clear for over two orders of magnitude of the THz
intensity. Figure 4.16(b) shows the difference of the generated SH in the
presence of external bias DC field, which is well described by a linear
function of ETHz.
5 8 5 9 6 0 6 1 6 20 . 00 . 20 . 40 . 60 . 81 . 01 . 21 . 41 . 61 . 8
Inten
sity of
SH [a
rb. un
its]
T i m e [ p s ]
0 k V / c m 1 0 k V / c m
Figure 4.15: Intensity of THz induced second harmonic (SH) foroutput gap of 100 µm with and without DC bias.
Figure 4.17 presents the collection of results of the peak THz field at
the output of the TPPWG for different output gaps Bout in the range
20 - 200 µm. Black squares are results of direct measurement using
THz-induced second harmonic generation. Unfortunately due to high
intensity of the probe beam (though still lower than plasma ionization
threshold) measurements of the THz field in this way for Bout smaller
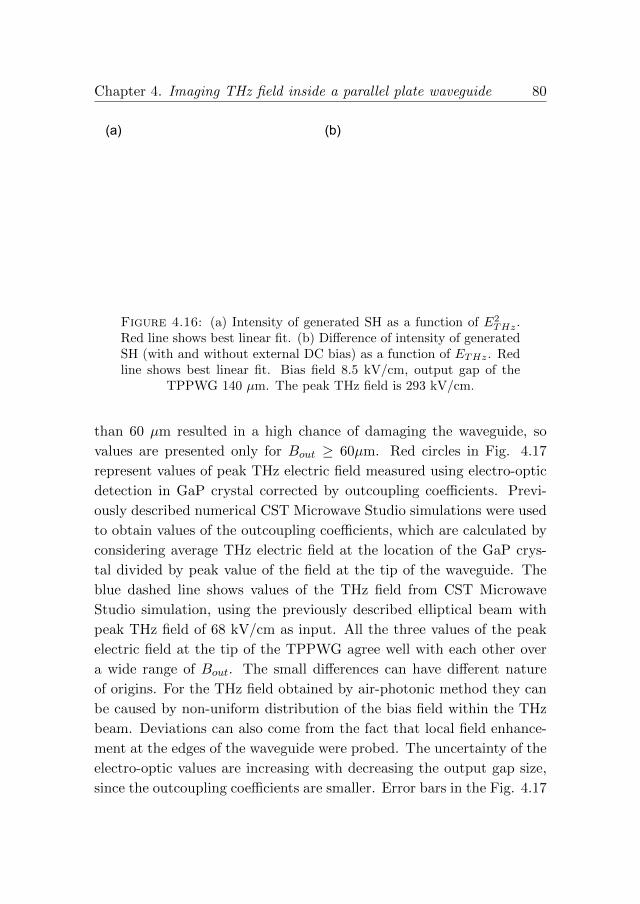
Chapter 4. Imaging THz field inside a parallel plate waveguide 80
(a) (b)
Figure 4.16: (a) Intensity of generated SH as a function of E2THz.
Red line shows best linear fit. (b) Difference of intensity of generatedSH (with and without external DC bias) as a function of ETHz. Redline shows best linear fit. Bias field 8.5 kV/cm, output gap of the
TPPWG 140 µm. The peak THz field is 293 kV/cm.
than 60 µm resulted in a high chance of damaging the waveguide, so
values are presented only for Bout ≥ 60µm. Red circles in Fig. 4.17
represent values of peak THz electric field measured using electro-optic
detection in GaP crystal corrected by outcoupling coefficients. Previ-
ously described numerical CST Microwave Studio simulations were used
to obtain values of the outcoupling coefficients, which are calculated by
considering average THz electric field at the location of the GaP crys-
tal divided by peak value of the field at the tip of the waveguide. The
blue dashed line shows values of the THz field from CST Microwave
Studio simulation, using the previously described elliptical beam with
peak THz field of 68 kV/cm as input. All the three values of the peak
electric field at the tip of the TPPWG agree well with each other over
a wide range of Bout. The small differences can have different nature
of origins. For the THz field obtained by air-photonic method they can
be caused by non-uniform distribution of the bias field within the THz
beam. Deviations can also come from the fact that local field enhance-
ment at the edges of the waveguide were probed. The uncertainty of the
electro-optic values are increasing with decreasing the output gap size,
since the outcoupling coefficients are smaller. Error bars in the Fig. 4.17
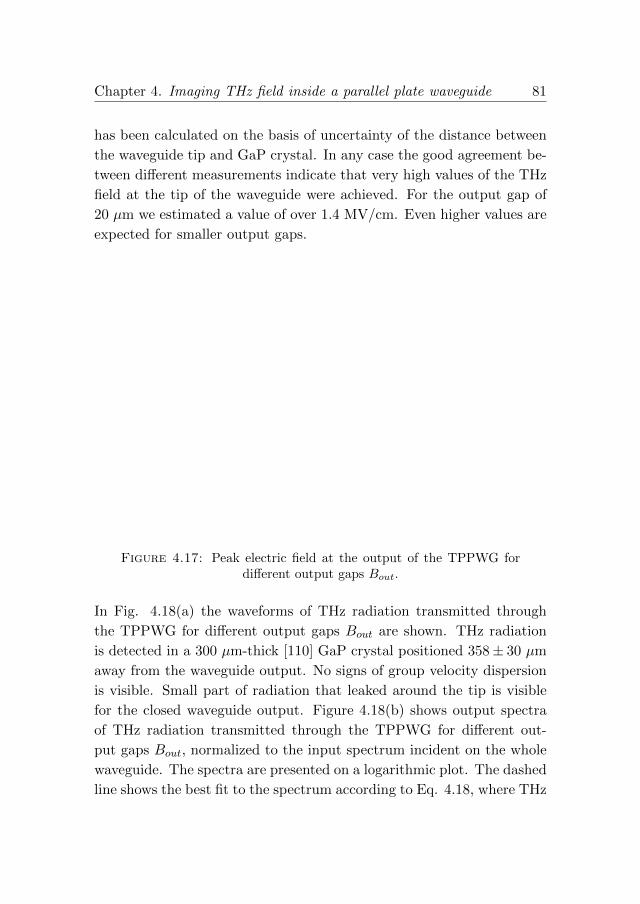
Chapter 4. Imaging THz field inside a parallel plate waveguide 81
has been calculated on the basis of uncertainty of the distance between
the waveguide tip and GaP crystal. In any case the good agreement be-
tween different measurements indicate that very high values of the THz
field at the tip of the waveguide were achieved. For the output gap of
20 µm we estimated a value of over 1.4 MV/cm. Even higher values are
expected for smaller output gaps.
Figure 4.17: Peak electric field at the output of the TPPWG fordifferent output gaps Bout.
In Fig. 4.18(a) the waveforms of THz radiation transmitted through
the TPPWG for different output gaps Bout are shown. THz radiation
is detected in a 300 µm-thick [110] GaP crystal positioned 358± 30 µm
away from the waveguide output. No signs of group velocity dispersion
is visible. Small part of radiation that leaked around the tip is visible
for the closed waveguide output. Figure 4.18(b) shows output spectra
of THz radiation transmitted through the TPPWG for different out-
put gaps Bout, normalized to the input spectrum incident on the whole
waveguide. The spectra are presented on a logarithmic plot. The dashed
line shows the best fit to the spectrum according to Eq. 4.18, where THz

Chapter 4. Imaging THz field inside a parallel plate waveguide 82
Ohmic losses are proportional to the square root of frequency. The dip
at ∼ 1.7 THz comes from incomplete cancellation of water vapor ab-
sorption lines in the reference and sample spectra, due to 25.4 mm of
extra propagation in the humid air.
(a) (b)
Figure 4.18: (a) Measured waveforms and (b) spectra of THz ra-diation transmitted through the TPPWG normalized to the inputspectrum. THz radiation is detected in 300 µm-thick [110] GaP crys-tal positioned ∼ 360 µm away from the waveguide output. Dashed
line shows the best fit to the spectrum according to the Eq. 4.18.
4.6 Conclusions
In conclusion we have presented a novel non-invasive broadband method
of imaging the THz field inside PPWGs. The method does not disturb
the propagating THz field as exemplified by the measurement of the
THz reflection coefficient from the tip of the waveguide. The resolution
of the method is restricted by the geometrical dimensions of the NIR
probe focus spot only, while the frequency response depends on the
interaction length between THz and the NIR probe. We investigated
field enhancement properties of the TPPWG and we showed that a field
enhancement of over 20 is possible, resulting in THz peak electric field
exceeding 1.4 MV/cm for the output gaps of 20 µm. Field values were
measured using two methods: free-space electro-optic sampling and THz

Chapter 4. Imaging THz field inside a parallel plate waveguide 83
enhanced second harmonic generation. Obtained values agree with each
other and also with predictions from numerical simulations. Even higher
values of peak THz field are expected for smaller output gaps. Such
high values of electric field open exciting possibilities of investing THz
nonlinear processes.

Chapter 5
Terahertz radar cross
sections
Scattering of terahertz waves by conducting and dielectric objects is an
area of intensive investigation both from theoretical and experimental
side [191–195]. Time-domain based THz systems can provide a conve-
nient, fast and precise method of visualization of scattering centers. At
the same time, the measurement of the radar cross section (RCS) is
a standard technique, particularly important for military and defense-
related purposes, including detection and identification of aircrafts, ships
and other targets as well as for countermeasures such as RCS reduction
and stealth. The necessity for operating on massive objects, such as
full-size airplanes or ships, can make those measurements complicated,
time consuming, and expensive. Also the size of the platforms makes
it impractical to iterate the design and testing phases allowing only for
software calculations of RCS values with limited possibility of experi-
mental testing.
Submillimeter continuous wave systems based on molecular lasers with
bolometric detectors for characterization of RCS on scale targets have
85
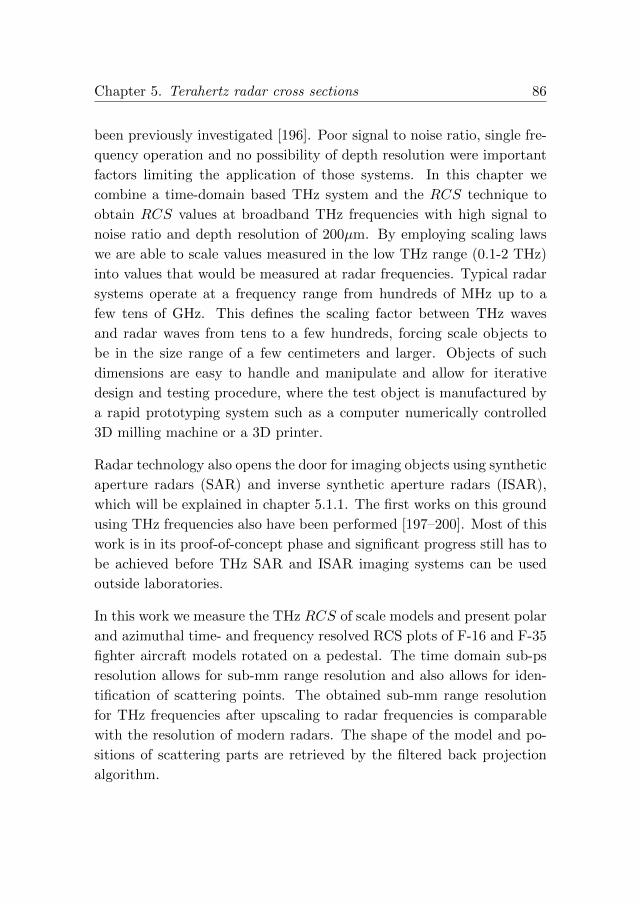
Chapter 5. Terahertz radar cross sections 86
been previously investigated [196]. Poor signal to noise ratio, single fre-
quency operation and no possibility of depth resolution were important
factors limiting the application of those systems. In this chapter we
combine a time-domain based THz system and the RCS technique to
obtain RCS values at broadband THz frequencies with high signal to
noise ratio and depth resolution of 200µm. By employing scaling laws
we are able to scale values measured in the low THz range (0.1-2 THz)
into values that would be measured at radar frequencies. Typical radar
systems operate at a frequency range from hundreds of MHz up to a
few tens of GHz. This defines the scaling factor between THz waves
and radar waves from tens to a few hundreds, forcing scale objects to
be in the size range of a few centimeters and larger. Objects of such
dimensions are easy to handle and manipulate and allow for iterative
design and testing procedure, where the test object is manufactured by
a rapid prototyping system such as a computer numerically controlled
3D milling machine or a 3D printer.
Radar technology also opens the door for imaging objects using synthetic
aperture radars (SAR) and inverse synthetic aperture radars (ISAR),
which will be explained in chapter 5.1.1. The first works on this ground
using THz frequencies also have been performed [197–200]. Most of this
work is in its proof-of-concept phase and significant progress still has to
be achieved before THz SAR and ISAR imaging systems can be used
outside laboratories.
In this work we measure the THz RCS of scale models and present polar
and azimuthal time- and frequency resolved RCS plots of F-16 and F-35
fighter aircraft models rotated on a pedestal. The time domain sub-ps
resolution allows for sub-mm range resolution and also allows for iden-
tification of scattering points. The obtained sub-mm range resolution
for THz frequencies after upscaling to radar frequencies is comparable
with the resolution of modern radars. The shape of the model and po-
sitions of scattering parts are retrieved by the filtered back projection
algorithm.
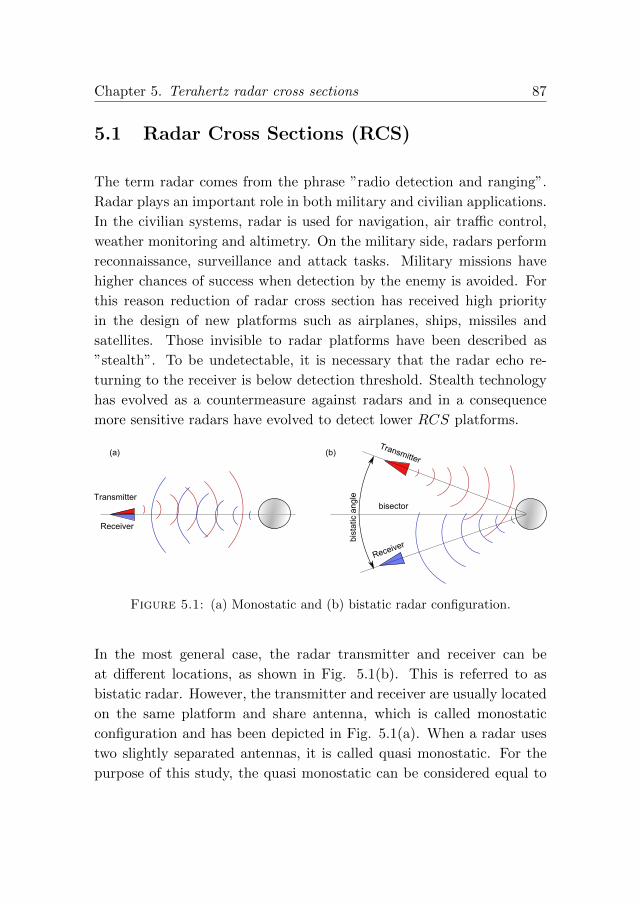
Chapter 5. Terahertz radar cross sections 87
5.1 Radar Cross Sections (RCS)
The term radar comes from the phrase ”radio detection and ranging”.
Radar plays an important role in both military and civilian applications.
In the civilian systems, radar is used for navigation, air traffic control,
weather monitoring and altimetry. On the military side, radars perform
reconnaissance, surveillance and attack tasks. Military missions have
higher chances of success when detection by the enemy is avoided. For
this reason reduction of radar cross section has received high priority
in the design of new platforms such as airplanes, ships, missiles and
satellites. Those invisible to radar platforms have been described as
”stealth”. To be undetectable, it is necessary that the radar echo re-
turning to the receiver is below detection threshold. Stealth technology
has evolved as a countermeasure against radars and in a consequence
more sensitive radars have evolved to detect lower RCS platforms.
bisector
Transmitter
Receiver
Transmitter
Receiver
bist
atic
ang
le
(a) (b)
Figure 5.1: (a) Monostatic and (b) bistatic radar configuration.
In the most general case, the radar transmitter and receiver can be
at different locations, as shown in Fig. 5.1(b). This is referred to as
bistatic radar. However, the transmitter and receiver are usually located
on the same platform and share antenna, which is called monostatic
configuration and has been depicted in Fig. 5.1(a). When a radar uses
two slightly separated antennas, it is called quasi monostatic. For the
purpose of this study, the quasi monostatic can be considered equal to

Chapter 5. Terahertz radar cross sections 88
monostatic, since the distance between antennas is much smaller than
the distance to the target.
Most radars operate in the frequency range of 10 MHz - 100 GHz, where
low frequencies are used for long range high power search radars and
higher frequencies for airborne compact short range radars. Typical
bandwidths are up to few percent of the central frequency. A modern
radar can provide a large amount of information about a target and the
environment, such as: 1) range, measured as the propagation time of a
radar pulse to the target and back, 2) velocity, by measuring the Doppler
frequency shift 3) size of the target, based on the scattered signal inten-
sity 4) target shape, determined by the magnitude as a function of the
viewing angle.
0.0001 0.01 1 100 10000
Insects Birds Creeping waves
Fighter aircraft
Bomberaircraft
Ships
[m2]
Figure 5.2: Typical values of RCS for some natural and man-madeobjects.
The RCS of a scattering target illuminated with radar radiation is a
parameter expressed in units of area which describes the intensity of the
wave reflected back to the radar. The most general definition of RCS
can be written as [201, 202],
RCS = limR→∞
4πR2 |Es|2
|Ei|2(5.1)
where Ei and Es are the incident and scattered electric fields, and R is
the distance between radar and target. In this definition the limiting
process is primarily introduced to ensure that the incident wave is a
plane wave which, in the optical design of our setup presented in Chap.
5.3, is fulfilled. As indicated in Fig. 5.2, typical values of RCS range
from ∼0.001 m2 for insects, ∼ 0.01 - 0.1 m2 for birds, ∼ 100 m2 for
fighter airplanes to over 10000 m2 for large ships. The RCS depends on

Chapter 5. Terahertz radar cross sections 89
many factors. Those include the size and shape of the target, incident
and reflected angle, ratio between the size of target and the wavelength,
polarization of the emitted and detected radiation and finally on the
properties of the material that the target is made of.
Below we will derive the radar range equation. Let us consider a mono-
static radar located a distance R from a target. The radar transmitter
power is Pt and the antenna gain is Gt. The incident power density at
the target Wi is given by
Wi =PtGt4πR2
. (5.2)
The RCS relates the incident power density Wi at the target to the
power scattered back in the direction of the observer Ws.
Ws =PtGt4πR2
·RCS · 1
4πR2(5.3)
Power received by the detector Pr is the product of the scattered power
density Ws and effective receiving antenna area Aeff :
Pr =PtGt
42π2R4·RCS ·Aeff =
PtGt42π2R4
RCSGrλ
2
2π, (5.4)
where Gr =2πAeffλ2
is the receiving antenna gain. Since Pr ∼ RCS/R4
that implies that if an airplane wants to be twice as close to the radar
and stay undetected it has to reduce RCS by factor of 24 = 16. This
strong dependance of maximum stealth RCS on the minimal radar-
target range underlines the importance of proper design of the aircraft
and its RCS characterization.
The wave scattering of a target is strongly dependent on the incident
wave frequency. There are three frequency regions in which the scatter-
ing characteristics are different. Those regions are distinguished by the
product of the incident wavevector k and the characteristic size of the
target L.

Chapter 5. Terahertz radar cross sections 90
- Low-frequency region, also called Rayleigh range, where k ·L 1.
At those frequencies the phase variations of the incoming plane
wave across the target are small. The shape of the target’s body is
not important (e.g., a small metal sphere and a small metal cube
will have similar scattering pattern). Wave scattering is essentially
isotropic (direction independent). In general, RCS vs. k · L is
smooth and varies as 1/λ4 (as presented on the Fig. 5.3). Rayleigh
scattering of the sun light on microscopic air density fluctuations
is the phenomena that makes the sky blue.
- Resonance region, also called Mie range, where k · L ≈ 1. The
phase variations of the incoming plane wave across the target are
significant. All parts of the object contribute to the scattering
pattern. RCS vs. k · L will oscillate.
- High-frequency region, also called optical range. k · L 1. Mul-
tiple 2π phase variations of the incoming plane wave across the
target. The scattered field is strongly angle dependent. Strong
narrow scattering peaks are possible due to the specular scatter-
ing (mirror-like reflection) by big flat surfaces. In general, in this
region RCS vs. k · L may be smooth and independent of λ.
A perfect illustration to those three frequency regions is the scattering
of electromagnetic waves on the most simple scatterer, which is a metal
sphere. The RCS of a perfectly conducting sphere with radius r as a
function of k · r is depicted in the Fig. 5.3. The presented RCS is
calculated on the base of the Mie theory [203, 204]. For k · r 1 the
RCS varies as 1/λ4, for k · r ≈ 1 the RCS oscillates around πr2 and for
k · r > 1 a metal sphere has a frequency independent RCS equal to its
physical cross section area RCS = πr2.
For a conducting cylinder the largest RCS = 2πrh2/λ is achieved at the
specular angle, where h is the height of the cylinder. The RCS of a flat
conducting plate with sides a and b decreases rapidly with angle from
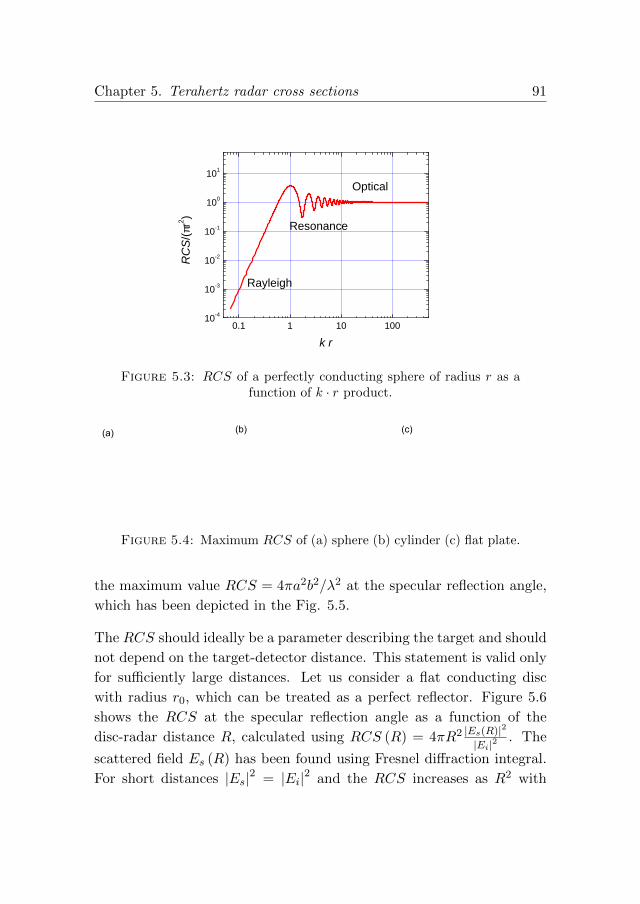
Chapter 5. Terahertz radar cross sections 91
0 . 1 1 1 0 1 0 01 0 - 4
1 0 - 3
1 0 - 2
1 0 - 1
1 0 0
1 0 1
R a y l e i g h
R e s o n a n c e
RCS/(
πr2 )
k r
O p t i c a l
Figure 5.3: RCS of a perfectly conducting sphere of radius r as afunction of k · r product.
(b) (c)(a)
Figure 5.4: Maximum RCS of (a) sphere (b) cylinder (c) flat plate.
the maximum value RCS = 4πa2b2/λ2 at the specular reflection angle,
which has been depicted in the Fig. 5.5.
The RCS should ideally be a parameter describing the target and should
not depend on the target-detector distance. This statement is valid only
for sufficiently large distances. Let us consider a flat conducting disc
with radius r0, which can be treated as a perfect reflector. Figure 5.6
shows the RCS at the specular reflection angle as a function of the
disc-radar distance R, calculated using RCS (R) = 4πR2 |Es(R)|2
|Ei|2. The
scattered field Es (R) has been found using Fresnel diffraction integral.
For short distances |Es|2 = |Ei|2 and the RCS increases as R2 with

Chapter 5. Terahertz radar cross sections 92
- 8 - 6 - 4 - 2 0 2 4 61 0 - 5
1 0 - 4
1 0 - 3
1 0 - 2
1 0 - 1
1 0 0
Norm
alized
P2P e
lectric
field
[arb.
units]
A n g l e [ d e g ]
n o i s e l e v e l
Figure 5.5: Normalized peak-to-peak electric field scattered by a 15cm in diameter flat plate measured as a function of azimuthal plateorientation. Blue line represents noise level without the plate in the
THz path.
modulation which originates in interferences. For longer distances wave
diffraction becomes dominant and |Es|2 ∝ 1/R2 implying that the RCS
saturates. It can be shown that the RCS of a circular flat disc reaches
91% of its long-distance value at a distance R = 3r20/λ. The distance
where the RCS reaches its far-distance value is shorter for objects with
smaller radius of curvature. Also, the angular distribution of scattered
electric field depends on the distance from the target. It may seem
counterintuitive that RCS increases with the distance to the radar. It
can be explained a bit more on the example of a radar operator. If
radar detects an unknown object, the distance to the object R can be
computed using time of flight of the scattered signal. The radar operator,
knowing the power of his radar, may calculate value of the electric field
at the position of scatterer. Hence one measures scattered field, one can
calculate RCS using equation 4πR2 |Es|2
|Ei|2. Now if the object is closer to
the radar, the computed values of R, Es and Ei will be different, so RCS
can also change. Even though the calculated value of RCS can decrease,
it does not mean that the object will be less visible to the radar, simply

Chapter 5. Terahertz radar cross sections 93
because according to Eq. 5.4 power received by radar increases with
decreasing distance faster (Pr ∼ RCS/R4).
0 1 0 0 2 0 0 3 0 00
5
1 0
1 5
2 0
2 5
3 0 4 π3 r 04 / λ 2
RC
S [m2 ]
R [ c m ]
3 r 02 / λ
Figure 5.6: RCS of a flat conducting disc of a radius r0 = 12 mmas a function of disc-radar distance R. THz radiation at frequency of1 THz is incident and scattered at normal angle. RCS reaches 91%of its long-distance value RCS∞ = 4π3r40/λ
2 = 28.6 m2 at a distanceR = 3r20/λ = 143 cm. The RCS is over 63000 times larger than the
geometrical cross section.
The RCS of objects typically encountered by radars are more compli-
cated than simple spheres, cylinders or plates. But the scattering pat-
tern of any complex targets can be decomposed into primitives (basic
geometrical shapes). It is possible to express the total scattered electric
field as a superposition of fields scattered by the individual source on
the target:
|Es| =
∣∣∣∣∣Ns∑n=1
Esn
∣∣∣∣∣ , (5.5)
where Ns is the number of primitive scattering objects. Each of the
basic objects may be characterized by different frequency and angle de-
pendent scattering mechanism. For RCS measurements the three most
important scattering mechanisms are:

Chapter 5. Terahertz radar cross sections 94
- Reflections. This mechanism gives the highest RCS peaks, but
peaks are limited to the number or reflecting surfaces. Multiple
surfaces can produce multiple reflection (e.g. corner reflector).
- Diffraction. Diffracted waves originate at discontinuities on the
target, such as edges and tips. Scattered fields are less intense but
appear in a wide angular range.
- Surface waves. Electromagnetic waves that propagate along the
target and then are reemitted in the direction of the receiver. One
example are creeping waves, which travel around a curved object.
5.1.1 Synthetic aperture and inverse synthetic aperture
radar imaging
A Synthetic Aperture Radar (SAR), is a coherent radar system which
utilizes the movement of the radar platform to electronically simulate
an extremely large antenna or an aperture. This procedure generates
high-resolution remote sensing images. The synthetic aperture radars
are mostly airborne or spaceborne sidelooking systems. The SAR works
similar to a phased array, but in contrast to a large number of the parallel
antenna elements of a phased array, SAR uses one antenna in different
locations. The different geometric positions of the antenna elements are
a result of the moving platform.
Complimentary to SAR is the inverse synthetic aperture radar (ISAR)
systems. The ISAR technology uses movement of the target rather than
emitter to create the synthetic aperture. High resolution ISAR images
allow for discrimination between various missiles, military and civilian
aircrafts. If the investigated target is rotated by an angle ∆θ, the phase
φ of the object will change proportionally to the cross-range (direction
perpendicular to the radar wave propagation) distanceX from the center
of rotation to the target as it undergoes a change in range according to
the formula: φ ≈ 2π∆θX/λ. Therefore, if the change of the phase φ

Chapter 5. Terahertz radar cross sections 95
of the target is measured over a finite angular extent, the cross-range
coordinate X of the scatterer can be calculated by performing a simple
Fourier transform. In a similar way, the downrange distance (along the
radar wave propagation) to the target can be calculated by varying the
frequency of the radar and carefully measuring the change in the phase
of the scatterers. For accurate ISAR imaging, high resolution frequency
determination of the phase of scattered field is needed. Also very high
phase stability is required. To obtain a 2D image, the investigated object
has to be rotated independently along two perpendicular axes, which are
perpendicularly oriented to the radar wave propagation. The acquired
2D matrix of phase values of the scattered field is Fourier transformed
to obtain 2D image of the scattering centers.
5.2 Terahertz Computed Tomography
Tomography is a cross-sectional imaging of objects, obtained by mea-
suring the transmitted or reflected radiation. The most common type of
tomography is computed tomography (CT), in which digital geometry
processing is used to generate a three-dimensional image of the inside
of an object from a large series of images taken around a single axis
of rotation. Particularly popular version of CT is a X-ray CT, which
through out years has become a standard medical imaging techniques
(Nobel prize in 1979). Although primarily used in medicine, CT is also
used in other fields, such as nondestructive materials testing, archaeol-
ogy, paleontology and biological studies.
In computed tomography investigated object is rotated by 360 along
single rotation axis. Next the object is divided into set of slices along
this rotation axis. For each slice a set of line scans indexed by the slice
orientation round the rotation axis is measured. Those line scans are
also called as shadow images and are connected to the optical properties

Chapter 5. Terahertz radar cross sections 96
x
y
r
L(r, )
f(x,y)
R f (
r, )
r
Figure 5.7: Schematic of the Radon transform. The Radon trans-form R f (r, θ) of the function f (x, y) represents a total object op-tical density integrated along the L (r, θ) line. Line L (r, θ) is defined
by the distance to the rotation axis r and the angle θ.
of the investigated slice by a Radon transform [205]:
R f (r, θ) =
∫L(r,θ)
f (x, y) ds, (5.6)
where f (x, y) is a function describing the properties of the scanned
object. In case of X-ray CT, f (x, y) ds represents the probability that
the radiation is absorbed or scattered in the section ds along a straight
line L (r, θ). For each shadow image filtered backprojection algorithm
[206] can be used to invert Eq. 5.6 and obtain 2D tomography slice.
The basic idea behind back projection method is to populate pixels of
the reconstructed image with the shadow projections back along the
directions they were measured (hence the name ”back projection”) to
obtain a rough approximation to the original. The back projections from
different angles will add constructively in regions they originate from.

Chapter 5. Terahertz radar cross sections 97
Unfortunately this solution gives blurring of the image and high-pass
spatial filtering is needed to make the back projected image sharp. A
set of 2D tomography slices stacked together give a full 3D image.
Terahertz computed tomography, demonstrated first by Ferguson and
co-workers [207], is a growing imaging technique [208–210]. There are
several differences between THz and X-ray CT, which come from the
different nature of wave interaction with matter. In the X-ray range
choosing the absorption as the f (x, y) function is straightforward and it
is a good representation of the density of the object. In the THz range
different quantities have been used: total transmitted power, time of
flight of the THz pulse or the phase of transmitted radiation. The next
difference arises from the fact that the THz beam propagation can not be
accurately described as a straight ray-line, which is valid for X-ray. The
wavelength of THz radiation is seven order of magnitude longer than X-
ray, so the diffraction and scattering can blur and deform reconstruction
image. Also choice of the reconstruction algorithm is an important factor
and can improve the quality of the reconstructed image [211]. In most
cases THz CT is performed in the transmission configuration, but the
reflection configuration has also been investigated [212].
5.3 Experimental Setup
A schematic diagram of our THz RCS setup is shown in Fig. 5.8. A re-
generative Ti:sapphire femtosecond laser amplifier delivers 35 fs, 2.9 mJ
pulses with center wavelength of 800 nm at a 1 kHz repetition rate. The
laser output is split into a source beam for THz pulse generation and a
gating beam for THz detection by free-space electro-optic sampling. THz
waves are generated by optical rectification in lithium niobate LiNbO3
crystal applying the tilted pulse front method, described in chapter 2.2.2.
The intensity front of fs pulses is tilted by a 1714 line/mm grating and
imaged by a 75 mm lens with demagnification factor of 2 onto the front
surface of a stoichiometric LiNbO3 crystal at room temperature. The

Chapter 5. Terahertz radar cross sections 98
LiNbO3 crystal was doped with 2% of MgO to prevent photorefractive
damage [213]. The highest THz peak electric field in the focused THz
beam achieved in our setup is at least 40 kV/cm, limited predominantly
by the high angular and material dispersion inside the LiNbO3 crystal of
the 60 nm-FWHM pump pulses. The high efficiency of THz generation
allows us to obtain high dynamic range of the setup up to 43 dB, defined
as ratio between the peak electric field to the noise floor for the THz
beam reflected in a specular angle off a metal mirror bigger than the
THz beam - (blue line in the Fig. 5.5). The near-infrared light trans-
mitted through the LiNbO3 crystal is blocked by a black polyethylene
sheet, which is highly transmissive for the THz pulse.
Rotation platform
6.6°
λ/2
PD1
Grating 1714/mm
Mg: LiNbO3
PD2
Lock-in amplifier
ZnTecrystals
λ/4 Wollastonprism
Δτ
THz
Generation pulse
Sam
plin
g pu
lse
Detection
Generation
fs pulse
Black polyethylene
Opticalchopper
FWHM = 73 mm
1200
1200
Figure 5.8: (a) Schematic diagram of the THz RCS setup. (b) 10cm-long 1:150-scale metal model of aircraft fighter F-16.
A pair of off-axis parabolic mirrors with focal lengths of 25.4 mm and
516.8 mm and diameters of 25.4 mm and 101.6 mm respectively is used
to expand the THz beam and subsequently to collimate it. The wide,

Chapter 5. Terahertz radar cross sections 99
collimated THz beam propagates 1200 mm towards the target which is
placed on a computer-controlled rotation platform. The expansion optics
increases the THz beam size by a factor of 20, which leads to a spatial
FWHM of 73 mm of the THz electric field at the object distance. The
electric field of the THz transient is polarized in the vertical plane. The
scattered THz radiation is collected by a 170 mm−diameter flat metal
mirror at a distance of 1200 mm from the target, and focused using a
101.6 mm-diameter, 152.4 mm-focal length off-axis paraboloidal mirror
onto a detection crystal. The scattered THz radiation thus travels 1430
mm before it reaches the detector. The angle between the incident and
scattered radiation is 6.6 and therefore our RCS measurements are in
principle bistatic, but in practice reasonably close to a monostatic radar
configuration. A truly monostatic configuration can be achieved by using
a thick wedge silicon beam splitter and a normal incidence. Such a
configuration will inevitably reduce the dynamic range due to reflection
losses on the beam splitter. All THz and infrared beams propagate
at a height of 160 mm above optical table which is sufficient to avoid
reflections from the table surface. The setup is aligned using a big 170
mm-diameter metal mirror in a place of the scattering object. This
mirror reflects all THz radiation in the direction of the receiver. The
complete THz beam path is purged by dry nitrogen to avoid absorption
by water vapor in the atmosphere.
The 800 nm probe beam is directed through a small hole in the center of
off-axis parabolic mirror for collinear detection. A computer-controlled
delay stage is used to map the temporal THz pulse shape. The electric
field of the THz transients is detected by free-space electrooptic sampling
in a [110] zinc telluride (ZnTe) crystal (2 mm-thick). A second passive
[100] 2mm-thick ZnTe crystal with anti-reflective coating for 800 nm
light on one facet is stacked together with the active crystal to increase
temporal separation between the directly transmitted THz pulse (tran-
sient A in Fig. 5.9(a)) and the pulse that experience two reflections in
the detection crystals (transient B in Fig. 5.9(a)) [214]. The time delay
between these two pulses is 89 ps. The temporal order of incoming pulses

Chapter 5. Terahertz radar cross sections 100
0 5 0 1 0 0 1 5 0 2 0 0 2 5 0- 6 0- 3 0
03 06 09 0
0 . 5 1 . 0 1 . 5 2 . 0 2 . 5 3 . 00 . 1
1
1 0
El.
field
[arb.
units]
T i m e [ p s ]
AB C
( a )
Amplit
ude [
arb. u
nits]
F r e q u e n c y [ T H z ]
( b )
Figure 5.9: (a) THz waveform reflected from a 170 mm-diametermetal flat disk. The transient include the main THz pulse (labeledA), a partial reflection of the main pulse inside the detection crystals(labeled B), and a part of the main pulse undergoing multiple reflec-tions in the LiNbO3 crystal (labeled C). (b) The amplitude spectrumof the generated THz radiation obtained as a Fourier transform of a
50 ps-wide time window around transient A.
is further complicated by an additional THz pulse (transient C in Fig.
5.9(a)) which experiences multiple reflections inside LiNbO3 crystal and
arrives at detector 160ps after the main pulse. Between transient A and
pulse B (at 60 ps) there is also a small pulse visible, which has its origins
in imperfections of the boundary between the [110] detection crystal and
the [100] inactive spacer crystal. The FWHM of the main THz transient
of 0.96 ps allows for distinction of two different point scatterers sepa-
rated by 144 µm along the THz propagation direction. Figure 5.9(b)
shows the amplitude spectrum of the detected THz radiation obtained
from a Fourier transform of a 50 ps time window around transient A.
The amplitude spectrum extends from 0.02 THz up to 3 THz, but 95%
of the generated THz energy lies within 0.1 THz - 1.0 THz range. The

Chapter 5. Terahertz radar cross sections 101
longest THz waves that are generated in our setup have a wave vector
of k = 2π/λ =∼ 2 mm−1 (at ∼ 0.1 THz), so for all the investigated
objects (L > 1 mm) we are in the optical regime (kL 1).
The target objects are placed on a support column of polystyrene foam,
which consists of 97% air or other gases and only 3% polymer, and thus
has low refractive index of 1.02 in the THz range [215]. Furthermore, the
polystyrene foam is cut in a shape which resembles a tapered diamond
column, which reflects all the THz radiation away from the detector.
No signs of volume reflections from the thousands of internal cells in the
foam structure have been observed. No THz signal has been measured
without samples positioned on the polystyrene support column above the
background noise level. The investigated target was a 1:150-scale model
of aircraft fighter F-16. The model was 10 cm long with a wingspan of
6.7 cm. The object was made of painted metal with elements such as
missiles, nose and undercarriage made of plastic.
5.4 Terahertz radar cross section on scale mod-
els of aircrafts
Before the RCS measurements are performed in the previously described
setup, the linearity check and calibration of the setup has to be executed.
We have decided to do it using the most standard technique, based on
the field scattering from conducting spheres. Figure 5.10 shows the peak
scattered electric field as a function of metal sphere diameter between
2 and 45 mm. The steel spheres are placed on the polystyrene column
and centered in the THz beam. The data are results of averaging up to
25 single THz waveforms. Since all the frequency components arrive in
phase at the peak of the THz transient, the squared value of the peak
electric field Ep accurately represents the energy carried by the pulse.
Since RCSsphere = πr2 and RCSsphere ∼ E2p , we find that Ep ∼ r. This
linear relationship is shown in Fig. 5.10 from which the coefficient of
proportionality is obtained by linear regression (red line). For metal

Chapter 5. Terahertz radar cross sections 102
0 1 0 2 0 3 0 4 0 5 00
5 01 0 01 5 02 0 02 5 03 0 03 5 0
Peak
elec
tric fie
ld [ar
b. un
its]
S p h e r e d i a m e t e r [ m m ]
n o i s e l e v e l
Figure 5.10: The peak electric field of THz radiation scattered froma conducting sphere as a function of sphere diameter. The red lineshows the best linear fit to the experimental data. The horizontalgreen line represents the average noise level in single scan measure-ment. The red and green curves intercept at the point corresponding
to a sphere of 0.98 mm diameter.
spheres with diameter larger than the THz beam waist dependence of
Ep of sphere radius will become sublinear, and will saturate at a constant
value at the limit of r → ∞, when all the THz radiation is reflected to
the detector. The horizontal green line in Fig. 5.10 represents the noise
level of a single scan. The smallest detectable sphere in a single scan
has a diameter of 0.98 mm (crossing of the red and green line).
For complicated structures, which we will be dealing with below, the
electric field from multiple point scatterers overlap and another method
is required for calculating the RCS. For the purposes of this article we
introduce a frequency-averaged RCS, which can be defined by:
RCS = πr20
∫ T0 |Eobject (t)|2∫ T
0 |Ecal (t)|2 −∫ T
0 |Ebg (t)|2, (5.7)
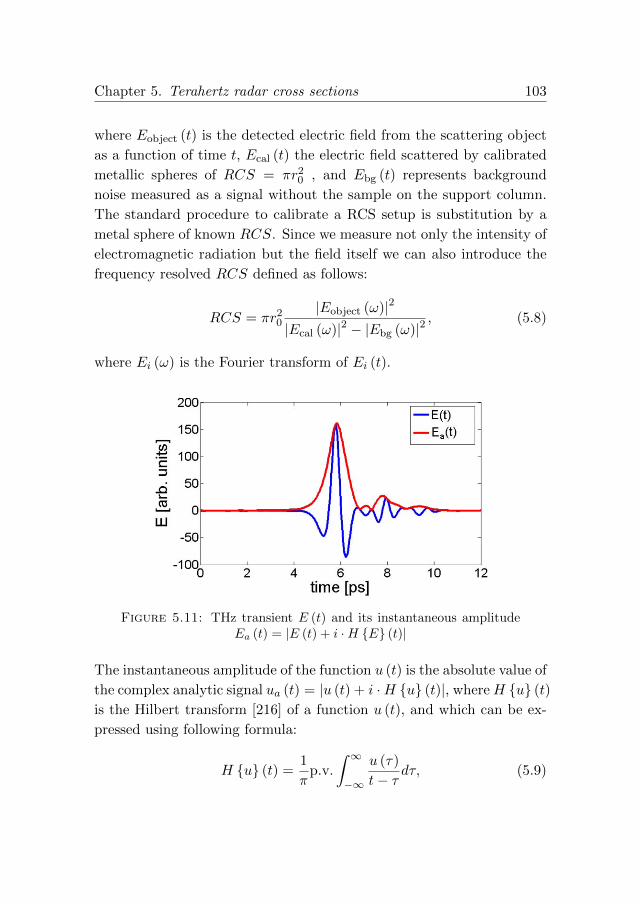
Chapter 5. Terahertz radar cross sections 103
where Eobject (t) is the detected electric field from the scattering object
as a function of time t, Ecal (t) the electric field scattered by calibrated
metallic spheres of RCS = πr20 , and Ebg (t) represents background
noise measured as a signal without the sample on the support column.
The standard procedure to calibrate a RCS setup is substitution by a
metal sphere of known RCS. Since we measure not only the intensity of
electromagnetic radiation but the field itself we can also introduce the
frequency resolved RCS defined as follows:
RCS = πr20
|Eobject (ω)|2
|Ecal (ω)|2 − |Ebg (ω)|2, (5.8)
where Ei (ω) is the Fourier transform of Ei (t).
Figure 5.11: THz transient E (t) and its instantaneous amplitudeEa (t) = |E (t) + i ·H E (t)|
The instantaneous amplitude of the function u (t) is the absolute value of
the complex analytic signal ua (t) = |u (t) + i ·H u (t)|, whereH u (t)
is the Hilbert transform [216] of a function u (t), and which can be ex-
pressed using following formula:
H u (t) =1
πp.v.
∫ ∞−∞
u (τ)
t− τdτ, (5.9)

Chapter 5. Terahertz radar cross sections 104
where p.v. stands for principal value. For example for a pure sinusoid,
the instantaneous amplitude is a constant, while for single-cycle electro-
magnetic pulses the instantaneous amplitude is a good representation of
the envelope function - Fig. 5.11.
Figure 5.12(a) shows the logarithm of the instantaneous amplitude of the
THz waveforms vs. polar angle and range (calculated from the time-of-
flight of the reflected THz pulse and the speed of light), recorded on
the F-16 scale model. In such high range resolution maps the single
point scatterers are seen as sine functions (sinograms) of the rotation
angle. 0 position on Fig. 5.12(a) corresponds to the position where
the nose of the airplane faces the incoming THz radiation, while 180 is
tail-on. Clear traces of scattering originating at the airplane nose, wing
tips, fuselage, tail and exhaust pipe are visible. Figure 5.12(b) shows
the frequency-averaged polar RCS for the investigated scale model. The
values of RCS vary from 1.4 cm2 (seen from the front of the airplane)
up to 193 cm2 (seen from a wing side). The RCS plot is rotated slightly
counter-clockwise with respect to the orientation of the symmetry plane
because of the 6.6 bistatic design of the setup. The RCS plot is also
asymmetric due to a possible minor unintentional azimuthal tilt of the
scale model. Figure 5.12(c) presents again the logarithm of the instanta-
neous amplitude of the THz waveforms, now as function of the azimuthal
angle and range. On the azimuthal map, the orientation 0 corresponds
to the situation at which the airplane is exposed to THz radiation di-
rectly from above. Scattering from wing surfaces and edges, tail, fuselage
and even plastic missiles is easily distinguishable. However, due to pulse
reflections B and C in Fig. 5.9(a) some of the sinograms are repeated
with a delay corresponding to the delay between the reflections, but at
significantly lower amplitudes. By inspection of Fig. 5.12(d) we no-
tice that the largest RCS in the azimuthal configuration is when the
airplane is seen exactly from below (1208 cm2) and above (881 cm2).
The smallest RCS is observed just below the wings. The RCS plot is
again counter-clockwise rotated with respect to the orientation of the
symmetry plane due to the bistatic nature of measurement. Scaling

Chapter 5. Terahertz radar cross sections 105
by a factor of 1502 can provide the RCS of a full-sized F-16 measured
at a distance of 150 · 143 cm = 214.5 m at frequency ∼ 3 GHz. This
scaling approach is only valid as far as the model is a true scale copy
of the original and under the assumption that the material reflection
properties are unchanged as function of frequency. This scaling assump-
tion is true for metals between the GHz and THz frequencies, but may
be invalid for the dielectric objects. Both data sets were measured in
the configuration where the incoming THz radiation was polarized in
the vertical direction. Obtained results would have been different if the
THz radiation was polarized in the horizontal direction. We can expect
that the biggest differences would come from objects with dimensions in
one direction longer than the THz wavelength and in the perpendicular
direction comparable or shorter than the THz wavelength, such as thin
wires or sharp edges (e.g. wing or tail tips). The FWHM of the instan-
taneous amplitude of the main THz transient from the Fig. 5.9(a) is 1.8
ps, which gives range resolution of presented sinograms of 270µm.
RCS measurements have also been performed on a 1:150-scale metal
model of the aircraft fighter F-35. Fig. 5.13 shows frequency-averaged
polar RCS for the investigated scale model. When comparing RCS
for F-16 (Fig. 5.12(b)) and for F-35 (Fig. 5.13), few differences are
visible. All values of RCS for F-35 fighter are smaller. Secondly, the
biggest differences are at angles 90 and 270. The fighter F-16 has a
vertically oriented tail, which gives a strong specular reflections at those
angles. Small azimuthal tilt of the model causes the RCS peaks to be
asymmetric. At the same time F-35 has two tails, each of them tilted
by 20 from the vertical axis so the specular reflections are avoided and
measured RCS is ∼ 10 time lower.
Figure 5.14 shows values of the frequency-resolved THz RCS of the
scale model of the F-16 fighter in the azimuthal configuration for fre-
quencies 0.3, 0.7 and 1.1 THz. We notice that at angles where the THz
waves are reflected from large plane surfaces (0 and 180 - from the
wing surfaces and at 90 and 270 from the tail surface), the RCS at
high frequencies is larger than at low frequencies, in agreement with the

Chapter 5. Terahertz radar cross sections 106
Figure 5.12: Logarithm of the instantaneous amplitude of THzwaveforms scattered from the F-16 scale model shown in Fig. 5.8(b)for different (a) polar and (c) azimuthal angles and (b), (d) theirfrequency-averaged RCS. Letter marks indicate positions of differ-ent scattering parts of the airplane model: nose (N), wing tips (WT),wing surface (WS), vertical tail surface (VTS), vertical tail tip (VTT),fuselage (F), missiles (M1, M2). Additionally letters marks A, B andC show example of the main transient and two echoes (according to
Fig. 5.9(a)).
frequency-dependent nature of wave scattering by objects with different
curvatures.
Our THz radar system is similar to a reflection tomography setup [212].
Each sinogram contains enough information about the target to trans-
form it into a two-dimensional image of the target. The filtered back
projection algorithm (FBP) [206] is one possible method to retrieve the
spatial distribution of scatterers. However, the FBP algorithm does not

Chapter 5. Terahertz radar cross sections 107
Figure 5.13: Frequency-averaged polar RCS of a metal model ofaircraft fighter F-35
1
1 0
1 0 0
1 0 0 0
03 0
6 0
9 0
1 2 0
1 5 01 8 0
2 1 0
2 4 0
2 7 0
3 0 0
3 3 0
1
1 0
1 0 0
1 0 0 0
R C S [ c m 2 ] 0 . 3 T H z 0 . 7 T H z 1 . 1 T H z
Figure 5.14: Frequency-resolved azimuthal RCS of a metal model ofthe fighter aircraft F-16 at frequencies 0.3, 0.7 and 1.1 THz. The pre-sented data are averaged within a frequency interval of +/− 20GHz.

Chapter 5. Terahertz radar cross sections 108
Figure 5.15: (a) Metal test target (b) Logarithm of the instan-taneous amplitude of THz waveforms scattered from the metal testtarget. (c) Cross section of the test target reconstructed using filteredback projection algorithm (d) Cross section of the test target recon-structed using filtered back projection algorithm with windowing out
flat surface reflections.
include wave diffraction effects which leads to artifacts that we demon-
strate by measurements on a metal test target shown in Fig. 5.15(a).
The test target is an elongated cuboid (20 x 20 mm in cross section)
with two 4 x 4 mm grooves cut in its cross-section profile. Addition-
ally on one of the sides a 4 mm-thick step was introduced to make the
structure more asymmetric. Figure 5.15(b) shows sinogram for the test
target. Data are taken with 1 angular resolution. Figure 5.15(c) shows
the FBP reconstruction using data from Fig. 5.15(b). Because of the
small sizes of the test object (for most of the angles echoes B and C
do not overlap in time with the real reflected signals) it was possible
to apply simple time windowing function that would minimize effects of

Chapter 5. Terahertz radar cross sections 109
echoes B and C. The reconstructed image represents the actual shape
of the target well. However, the image is not free from artifacts in the
form of lines crossing the whole image, with the tendency for large plane
surfaces to be represented by stronger and longer lines. This behavior
originates in the fact that the FBP algorithm does not compensate for
diffraction of scattered waves. That effect is especially important at in-
termediate target-detector distances, where the angular distribution of
electric field depends strongly on object size and shape. In our case the
detector is placed 143 cm away from the target. At this distance, the
RCS reaches 91% of its long-distance value for a plane metal plate of
radius r0 =√Rλ/3 = 12 mm at a frequency of 1 THz (what has been
also presented at Fig. 5.6). This implies that for flat objects bigger than
12 mm, the angular distribution of the scattered electric field is strongly
dependent on the size of the target even within a class of objects with
the same shape. A more complete reconstruction algorithm would have
to take such diffraction effects into account. To further illustrate this
weakness of the FBP algorithm in the form that we have applied here,
we window out the intense, localized reflections from flat surfaces in the
sinogram in Fig. 5.15(b), since these reflections are the main source of
error. Figure 5.15(d) shows the result of the FBP algorithm after win-
dowing. The picture is much clearer and in a better way represents all
the point and edge scatterers. The depth resolution of a single angle
scan is 270µm, but because FBP uses many projections for image recon-
struction, both depth and lateral resolution of the reconstructed image
is 270/√
2 = 191µm.
Finally we have applied the FBP algorithm, with and without windowing
on the data from the model aircraft sinogram in Fig. 5.12(c), and the
results are shown in Fig. 5.16. The outline shape of the airplane can be
easily recognized. Also particular scatterers such as fuselage, tail, wings,
end of the wings and even missiles are distinguishable.
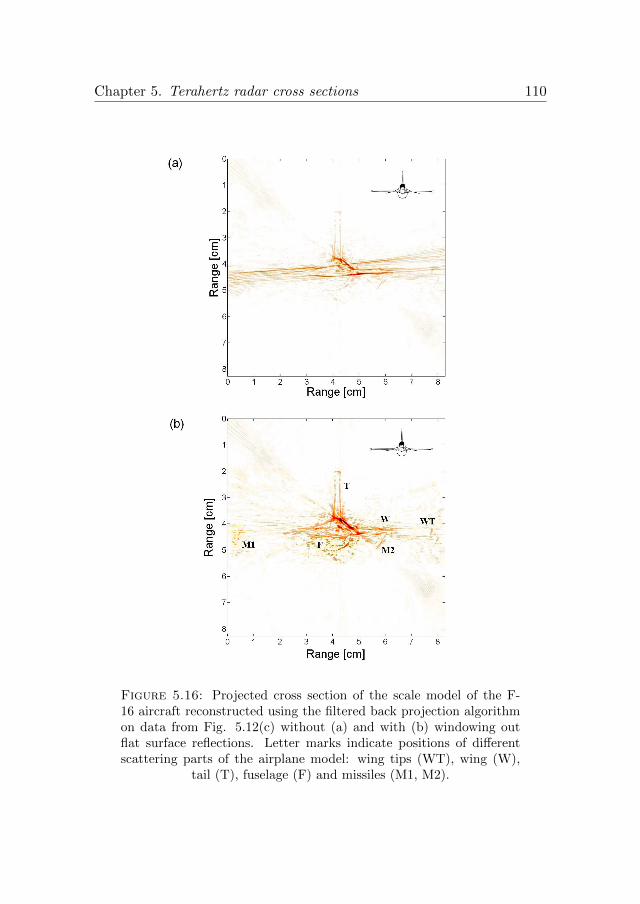
Chapter 5. Terahertz radar cross sections 110
Figure 5.16: Projected cross section of the scale model of the F-16 aircraft reconstructed using the filtered back projection algorithmon data from Fig. 5.12(c) without (a) and with (b) windowing outflat surface reflections. Letter marks indicate positions of differentscattering parts of the airplane model: wing tips (WT), wing (W),
tail (T), fuselage (F) and missiles (M1, M2).

Chapter 5. Terahertz radar cross sections 111
5.5 Stealth metamaterial objects characterized
in the far field by Radar Cross Section mea-
surements
Stealth technology, that includes reduction of RCS, radar jamming and
deception techniques, is an ongoing trend in the design of new aircrafts,
ships and ground vehicles, which aims to make them less visible (ideally
invisible) to radars. For a full control over RCS, both the shape and the
material that the object is made of, has to be optimized. The geomet-
rical approach to reduction of RCS is based on using multiple angled
surfaces, that reflect incoming electromagnetic radiation away from the
radar - a beautiful example is Lockheed F-117 Nighthawk aircraft. Mul-
tiple surfaces that give return reflections like corner reflector should be
also avoided. Complimentary approach is to use radar absorbing mate-
rials (RAM) that give low reflections. RAMs can be realized in several
different ways, that include foam absorbers for anechoic chambers, can-
celation of phase shifted ways reflected from multilayered materials, and
radar absorbing paints. Due to their broadband absorption spectrum
and planar configuration radar absorbing paints are probably most use-
ful for the military aircraft industry. Most of RAMs are based on ferrites,
which are ceramic materials with a cubic crystalline structure and chem-
ical formula MOFe2O3, where Fe2O3 is iron oxide and MO refers to a
combination of two or more divalent metal oxides. Different metal oxides
create ferrites that exhibit different magnetic and absorptive properties.
The reduction of wave reflection from ferrites is based on the fact that
they can have complex magnetic permeability equal (or nearly equal)
to complex dielectric constant, what results in their impedance equal to
that of free space. Ferrites can provide 10 - 25 dB of absorption between
30 MHz and 1 GHz.
As we have explained in the chapter 5.1, scaling law of transforming
RCS values measured at THz frequencies to the RCS values at radio
frequencies is valid only if the electric properties of the material are

Chapter 5. Terahertz radar cross sections 112
the same in those two frequency ranges. This condition is basically
fulfilled in case of metals. For example for copper with DC conductiv-
ity of σDC = 5.7 · 107 S/m, the THz reflectivity is 0.9972 at 1 THz,
while reflectivity at 1 GHz is 0.99991 [136], which gives the difference
of reflection factors smaller than 3 · 10−3 0.99991. The situation is
more complicated for dielectric materials, for which dielectric function
ε (ω) may have completely different values at radio frequency and cor-
responding THz frequency. The lack of natural materials, which would
allow for designing electromagnetic response, has led to the development
of new artificial materials - metamaterials (MMs). Most metamaterials
are based on a periodic arrangement of a single unit cell structure, which
mimics the natural occurring crystal structure. Unit cells of metama-
terials are much larger than atoms or even single molecules, but still
shorter than the wavelength of the electromagnetic wave that they are
designed for. The response of such metamaterial is based on electro-
magnetic resonances in fabricated fundamental elements, and can be
tailored for specific applications. Metamaterials exhibit numerous novel
effects, such as negative refractive index [217], perfect lensing [218, 219]
or cloaking [220]. Fabrication and optical characterization of metamate-
rial films designed for THz frequencies is a very active area in the THz
field [221–223]. THz MM enabled the demonstration of device concepts
such as frequency-agile filters [224], absorbers [225–227], polarizers [228],
modulators for THz radiation [229–231] and sensing devices [232].
In this chapter we apply a near-unity absorbing MM as a way to reduce
the radar cross section of an object, and consider the real-life situa-
tion where the probe beam is significantly larger than the MM film and
the object under investigation. Thus we need to be concerned not only
about the intrinsic properties of the MM film, but also on scattering
from edges of the object and other disturbances. The metamaterial
absorber is based on the principle of minimal transmission and simul-
taneously, minimal reflection [225, 227]. By manipulating resonances in
dielectric permittivity ε and magnetic permeability µ of the metama-
terial independently, it is possible to absorb both the incident electric

Chapter 5. Terahertz radar cross sections 113
90o45o 45o
PI/Au/PI/MM
PI/Au/PIPI/Au/PI
54.5 µm
75 µm
54.5 µm4 µm
2 µm
(a) (b)
10 mm
20 mm
10 mm 10 mm
12 µm
75 µm
12 µm
Figure 5.17: (a) Unit cell layout and dimensions of the metamate-rial absorber. (b) Metamaterial foil wrapped around an aluminium
cylinder with circumference 80 mm. PI: polyimide spacer.
and magnetic field. Additionally, by matching ε and µ, a metamaterial
can be impedance-matched to free space, minimizing reflectivity. Tao
et al. [226] recently designed, fabricated and characterized thin, flexible
films of near-unity resonant metamaterial-based absorbers which could
be wrapped around mm-sized cylinders [233]. The real-world applica-
tions of such absorbing materials are plentiful, including suppression of
unwanted reflections, stealth operation, and frequency-selective filters
for chemical imaging applications [234, 235]. We follow closely this de-
sign, with a geometry shown in Fig. 5.17. A 12 µm thick polyimide
(PI) layer is covered with a 200 nm thick gold layer, followed by another
12 µm thick layer of PI. On top of this sandwich structure a periodic
array of split-ring resonator (SRR) is defined in 200 nm thick gold by
UV lithography, with SRR side lengths of 54.5 µm, capacitor gap of 2
µm, and line width of 4 µm, and a lattice period of 75 µm, as illustrated
in Figure 5.17(a).
The resonant electromagnetic response to an electric field applied par-
allel to the central capacitor is due to the LC resonator formed by the
two inductive loops on each side of the central capacitor and a dipolar
response of the side conductors. For electric fields polarized perpendicu-
larly to the central capacitor leads, a single dipole resonance is expected.
The metamaterial array forms an active area of 20x10 mm, flanked by
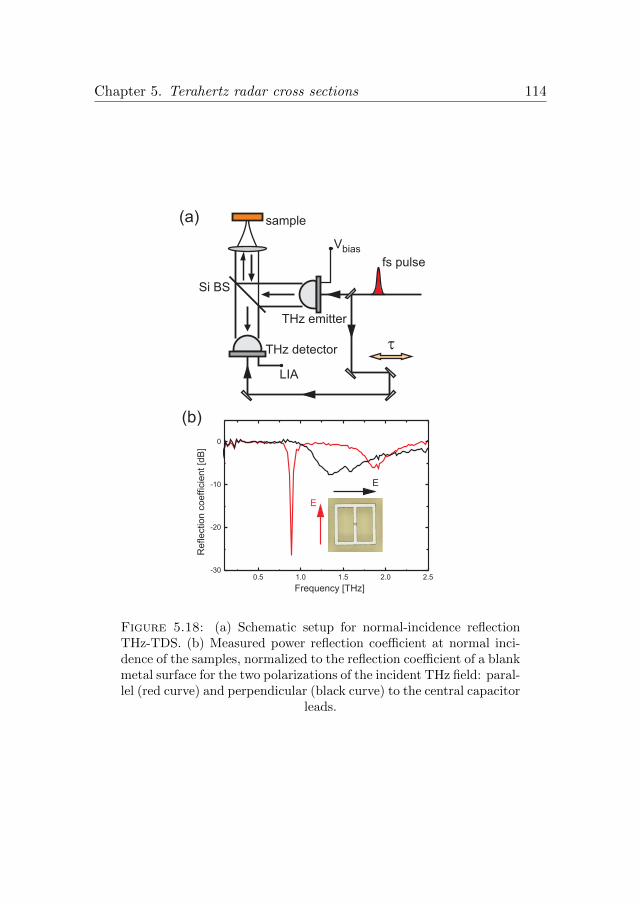
Chapter 5. Terahertz radar cross sections 114
THz emitter
Si BS
sample
THz detector
LIA
Vbias
fs pulse
(a)
(b)
0.5 1.0 1.5 2.0 2.5-30
-20
-10
0
Reflection
coeffic
ient[d
B]
Frequency [THz]
E
E
Figure 5.18: (a) Schematic setup for normal-incidence reflectionTHz-TDS. (b) Measured power reflection coefficient at normal inci-dence of the samples, normalized to the reflection coefficient of a blankmetal surface for the two polarizations of the incident THz field: paral-lel (red curve) and perpendicular (black curve) to the central capacitor
leads.

Chapter 5. Terahertz radar cross sections 115
pads of dimensions 10x10 mm, consisting of the gold layer embedded be-
tween the PI layers but without MM structures defined on the top. The
full sample of dimensions 40x10 mm is wrapped around an aluminium
cylinder with circumference 80 mm and height 10 mm, thus covering
exactly half of the circumference of the cylinder. The MM absorber was
attached to the cylinder by double-sided sticky tape. The macroscopic
sample geometry is illustrated in Fig. 5.17(b).
First, the normal-incidence reflection spectra were recorded with a refle-
ction-type THz-TDS system based on low-temperature-grown GaAs pho-
toconductive emitters and detectors (Menlo Systems) and driven by a
femtosecond oscillator (Femtolasers Fusion 300 Pro). The experimental
setup is illustrated schematically in Fig. 5.18(a). For this measurements
MM sample is placed on a flat aluminum mounting plate. Briefly, the
THz beam is coupled from the emitter onto the sample at normal in-
cidence by a 2-mm thick high-resistivity silicon wafer. The reflected
beam is transmitted back through the beamsplitter and directed to the
detector. The spot size of the THz probe beam on the sample for this
measurement is slightly below 1 mm, measured as the 10-90% rise dis-
tance of the reflection signal when scanned over a razor blade edge. The
focusing is achieved by a polymer lens with 40 mm focal length.
The reflection spectrum recorded at a position close to the center of the
sample active area is shown in Fig. 5.18(b), for the two polarizations
of the incident THz field: parallel (red curve) and perpendicular (black
curve) to the central capacitor leads. The LC resonance is seen as a sharp
dip in the reflection coefficient, reaching a minimum reflectivity of -27
dB at 0.89 THz. Power transmission through the sample is estimated
to be smaller than 0.0067, what has been calculated on the base of
the skin depth of 80 nm [236, 237] for 1 THz radiation through a 200
nm gold layer. Power reflectivity of -27 dB with transmission T <
0.0067 corresponds to an absorptivity A = 1 − R − T = 0.9913. A
second, less pronounced reflectivity minimum is seen at 1.9 THz. For
the perpendicular polarization the dipole resonance is seen as a relatively
broad reflectivity minimum reaching -7.5 dB at 1.35 THz. A weak,

Chapter 5. Terahertz radar cross sections 116
secondary reflectivity minimum is observed at 1.6 THz. The reflectivity
spectra are each normalized to the reflectivity of the blank metal surfaces
at the each side of the active area.
-20 -10 0 10 20
0.5
1.0
1.5
2.0
Position across sample [mm]
Fre
quency
[TH
z]
-27.00
-19.50
-12.00
-4.500
3.000
Reflectivity [dB]
-20 -10 0 10 20-30
-24
-18
-12
-6
0
Reflection
coeffic
ient[d
B]
Position across sample [mm]
0.42 THz
0.89 THz
1.32 THz
+3.0
-4.5
-12.0
-19.5
-27.0
(a) (b)
Figure 5.19: (a) Position-dependent power reflection spectrum ofthe sample along the direction indicated. (b) Position-dependent re-flection coefficient at representative frequencies 0.42, 0.89 and 1.32
THz as indicated by cross-lines in (a).
In Fig. 5.19(a) we have plotted the positional dependence of the power
reflectivity spectrum of the sample across its surface along the route
indicated in the illustration above the diagram. The LC resonance is
clearly visible at 0.89 THz in the region from -7 to +9 mm. Near the
edges of the MM array the resonance is blurred and abruptly shifted
to a higher frequency of 1.3 THz. While this edge effect is subjected
to ongoing further investigations we believe that it is a signature of the
finite size of the MM array and modified coupling between the MM cells
near the edge of the sample area, due to the neighbor interactions [238].
In addition to this significant modification of the reflection spectrum
we observe a slight variation across the active area of the resonance fre-
quency of the order of 0.03 THz around the average resonance frequency
of 0.89 THz. This may be due to fabrication inaccuracies of the flexible
film or the subsequent significant handling of the film during repeated
attachment and release on various metallic objects.

Chapter 5. Terahertz radar cross sections 117
1 0 - 2
1 0 - 1
1 0 0
03 0
6 0
9 0
1 2 0
1 5 01 8 0
2 1 0
2 4 0
2 7 0
3 0 0
3 3 0
1 0 - 2
1 0 - 1
1 0 0
Relat
ive RC
S
A n g l e [ d e g r e e s ]
0 . 4 0 T H z 0 . 8 7 T H z 1 . 3 0 T H z
Figure 5.20: RCS measurements of the MM-covered cylinder at0.40, 0.87, and 1.30 THz.
Figure 5.19(b) shows the positional dependence of the power reflectivity
at specific frequencies (0.42, 0.89, and 1.32 THz) across the sample, as
indicated by cross-lines in Fig. 5.19(a). For 0.42 THz the reflectivity
is uniform except of the edges of the sample (position -20 and 20 mm),
where interferences and scattering from the boundary between the sam-
ple (which is elevated due to the double-sided sticky tape beneath) and
the aluminum metal surface causes the reflectivity to decrease. For 0.89
THz at the position -3 mm, reflectivity reaches minimum of -27 dB. A
slight variation across the active area of the resonance frequency results
in an increase of the reflectivity at the position ∼ 0 mm, and then its
decrease at +7 mm. For 1.3 THz the reflectivity reaches minima at the
edges of the MM area.
To investigate effects of the illumination with THz beam larger than
the sample, we have performed radar cross section measurements on the
MM sample mounted on the metal cylinder, depicted in Fig. 5.17(b) and
placed in a target position in the RCS setup presented in Fig. 5.8(a).
Results of the frequency-resolved RCS measurements for frequencies
0.4, 0.87 and 1.3 THz are presented in Fig. 5.20. Values of RCS are

Chapter 5. Terahertz radar cross sections 118
normalized to the RCS of a metal cylinder (in this case 180 orienta-
tion). Here we note that the resonance frequencies between flat planar
geometry (Fig. 5.19(b)) and bent cylidrycal geometry (Fig. 5.17(b)) are
shifted by 0.02 THz into longer waves. For 0.4 THz the variations of
RCS in Fig. 5.20 are small, and they mostly occur at the edges of the
sample, where interferences and scattering causes decrease in the reflec-
tivity. For 0.87 THz, the minimal RCS of 0.0026 is achieved for sample
orientation of −8. RCS of 0.0026 corresponds well to the reduction of
reflectivity in the planar geometry by -27 dB (−27 dB = 0.002 = 1/384).
For 1.3 THz, RCS has two minima: one at −32 and the second one at
+8. In general the shape of the RCS for those three frequencies is very
similar to the shape of the reflectivity across the sample, as shown in
Fig. 5.19(b). Here we show that significant reduction of RCS is possi-
ble, even though the MM sample is bent to accommodate for the round
shape of the cylinder, and even though the THz beam that is used for
illumination of the structure is larger then the size of the structure, and
interferences between THz radiation originating at different part of the
structure are present.
Recently a dual band terahertz metamaterial absorbers have been de-
signed and manufactured [239, 240]. The dual band absorber consists
of a dual electric-field-coupled resonator on a metallic plane. Individual
fine tuning of the two absorption resonances can be achieved by indi-
vidually adjusting each electric-field-coupled resonator geometry, and in
this way providing possibility for even larger freedom in designing object
with decreased RCS in even broader frequency range.
5.6 Conclusions
We have presented a method for bistatic RCS measurements using THz
waves. The calibrated setup has resolution of 0.2 mm. We have per-
formed a series of RCS measurements in the polar and azimuthal ori-
entation on a scale model of the fighter aircrafts F-16 and F-35. By

Chapter 5. Terahertz radar cross sections 119
scaling wavelengths and models to real-scale platforms we can make de-
tailed comparisons to RCS of real sized aircrafts at standard MHz/GHz
frequencies. The application of a time domain system allows not only
for determination of the total RCS but it also provides RCS values of
particular elements of the model. Using the filtered back projection al-
gorithm we are able to reconstruct a two-dimensional (and in principle
also three-dimensional) visualization of all the scattering points. Our re-
sults show need for better algorithms, which could take into account the
shape of the object and could compensate for diffraction, for improving
the quality of reconstructed images. Furthermore we have investigated
properties of flexible metamaterial absorbers, that allow for designing
electromagnetic response according to our requirements. We have shown
that reduction of RCS by factor of nearly 400 at the frequency of 0.87
THz is possible. Possibility of designing and manufacturing MM ac-
cording to our requirements, makes them ideal for simulating stealth
materials in the THz frequency range.


Chapter 6
Conclusions and outlook
This thesis has been dealing with chosen aspects of THz technology
that can have defense and security-related applications. In chapter 2 we
have presented a short review of the current THz technologies, used for
purposes of this thesis. The review included a brief description of THz
sources, with a focus on high intensity THz generation using the tilted
wavefront technique. A summary of possible detection schemes for THz
experiments has been also presented.
In this thesis we have developed a novel method for simultaneous data
acquisition in time-resolved terahertz spectroscopy experiments, based
on the simultaneous double modulation of the probe and pump beams.
We have applied this method to extract the sheet conductivity of pho-
toexcited carriers in SI GaAs and compared the results with those of a
standard data acquisition scheme. We have shown that application of
the new method minimizes errors in spectrally resolved photoconduc-
tivity data originating from fluctuations in the laser system output and
timing errors in the THz pulse detection. Furthermore we have demon-
strated that the new organic material, BNA, is a very strong and broad-
band THz emitter, which enabled us to carry out spectroscopy with a
bandwidth twice as large (from 0.1 to nearly 6 THz) as conventional
121

Chapter 6. Conclusions and Outlook 122
spectroscopy in the field. Fast development of high power THz sources
will make advanced techniques such as all-THz pump-probe [241–243]
and even two dimensional nonlinear THz spectroscopy accessible in the
near future. Those techniques will allow for investigation of yet poorly-
understood anharmonic interactions between different phonon modes in
molecular crystals including explosives and related compounds. Nonlin-
ear interactions and energetic coupling between lattice vibrations will
not only open a new big block of fundamental science, but will also
provide additional information about the investigated sample and its
environment. This extra information can allow for example for more
accurate discrimination between different compounds that might have
similar linear phonon spectrum. 2D nonlinear THz spectroscopy is a
very challenging technique and only experiments in the mid infrared,
have been performed [45, 244]. For that reason at first we have concen-
trated on time-resolved terahertz spectroscopy, which in its pump-probe
nature is a simplified linear version of the 2D THz spectroscopy. Be-
fore 2D spectroscopy will be realized it is essential to be sure that the
extracted data correspond to the physical reality. According to our
predictions the technique of simultaneous data acquisition can also be
adapted and used for the THz 2D spectroscopy.
The need for high intensity sources of THz radiation directed our fo-
cus on possible ways of enhancing THz field in different waveguide
structures. As a result we have manufactured a tapered parallel plate
waveguide consisting of two aluminium plates of a varying width and a
varying plate separation. To fully understand field dynamics inside the
waveguide, we have developed a novel non-invasive broadband method
of imaging the THz electric field inside PPWGs. The method is based
on nonlinear interaction between NIR probe pulse and a THz transient
in the presence of external oscillating bias. The interaction leads to the
generation of THz-enhanced second harmonic of a near-infrared probe
pulse, which can be measured and related to the value of THz field in
an absolute and calibrated manner. The method does not disturb the

Chapter 6. Conclusions and Outlook 123
propagating THz field as exemplified by the measurement of the THz re-
flection coefficient from the tip of the waveguide. The resolution of the
method is restricted by the geometrical dimensions of the NIR probe
focus spot only, while the frequency response depends on the interac-
tion length between THz and the NIR probe. Next we investigated field
enhancement properties of the TPPWG. Analytical and numerical ap-
proaches are compared and based on the differences diffraction losses
are estimated. We show that a field enhancement factor of over 20 is
possible, resulting in a THz peak electric field exceeding 1.4 MV/cm for
the output gaps of 20 µm, which is a significant fraction of molecular
field inside crystals. Obtained values are verified using two independent
methods and agree well with numerical predictions. Even higher val-
ues of the THz electric field are expected for smaller output gaps, and
further work needs to be done to find limits of this field enhancement.
High values of electric field opens exciting possibilities of THz nonlinear
processes. One extremely interesting phenomena would be overcoming
the work function of a metal by the ponderomotive potential of high
intensity THz wave. The work function is the minimum energy needed to
remove an electron from a solid to a point immediately outside the solid
surface. For example for aluminum the work force is 4.08 eV, for silver
4.7 eV and for gold 5.1 eV [245]. The ponderomotive energy is the cycle-
averaged energy of a free electron in an electric field. The ponderomotive
energy is given by Up = e2E2
4mω2 , where E is the amplitude of the electric
field, m is mass of electron and ω is the frequency of electro-magnetic
radiation. For 1 MV/cm peak field THz wave of a central frequency
of 1 THz, the ponderomotive potential is 11.1 eV and is bigger than
the work function. It would be very interesting to investigate if so high
ponderomotive potential is able to remove the electron from the metal.
The electric field of the TEM mode in the PPWG is perpendicular to the
metal plate, so if such effect is achievable then the free electron would
be accelerated by the electric field and travel to the other plate causing
microscopic current. Because of the field enhancement and TEM mode
Chapter 6. Conclusions and Outlook 124
propagation, the TPPWG structure seems to be ideal for investigation
of the described phenomena.
The measurement of the radar cross section of a target is a standard
technique in the GHz region, particularly important for military and
defense-related purposes including detection and identification of un-
known targets as well as for countermeasures. In chapter 5 we have
presented a method for bistatic RCS measurements using THz waves.
By employing scaling laws we are able to scale values measured in the
low THz range (0.1-2 THz) into values that would be measured at radar
frequencies. The access to high intensity THz pulses, generated by tilted
wavefront optical rectification, allowed for determination of THz RCS
of small scattering centers. The calibrated setup is able to detect ob-
ject smaller than 1 mm-diameter metal sphere. The range resolution
of the setup is 0.27 mm and cross range resolution 0.19 mm. We have
performed a series of RCS measurements in the polar and azimuthal
orientation on scales model of the aircraft fighters F-16 and F-35. By
scaling wavelengths and models to real-scale platforms we can make de-
tailed comparisons to RCS of real sized aircrafts at standard MHz/GHz
frequencies. The application of a time domain system allows not only
for determination of the total RCS but it also provides RCS values of
particular elements of the model. Using the filtered back projection al-
gorithm we are able to reconstruct a two-dimensional (and in principle
also three-dimensional) visualization of all the scattering points. Our re-
sults show need for better algorithms, which could take into account the
shape of the object and could compensate for diffraction, for improving
the quality of reconstructed images. To have a better control over the
measured RCS we have investigated possibility of using metamaterials
(MMs). We have showed that using MM perfect absorbers significant
reduction of RCS can be achieved. Possibility of designing and manufac-
turing MM according to requirements, makes them ideal for simulating
stealth materials in the THz frequency range. Elasticity of produced
MM structures opens door for placing them on curved surfaces. Fur-
ther work on different techiques for depositing MM on the surfaces of

Chapter 6. Conclusions and Outlook 125
investigated targets is still required. Next class of interesting problems
concerning THz RCSs is the influence of the environment on the result
of measurements and capability of simulating real life scenarios in the
THz frequency range.

Appendix A
Acknowledgements
During the past three years of my PhD studies at DTU Fotonik, I had
a chance to meet, know and work with many wonderful people, without
whom this thesis would probably have never been written.
First I would like to express my gratitude to my supervisors, Peter Uhd
Jepsen from DTU Fotonik and Henning Heiselberg from Danish
Defense Acquisition and Logistics Organization for their supervision,
advice, and guidance from the very early stage of this research, as well as
giving me extraordinary experiences throughout the work. Peter showed
me that a real scientist always finds a passion in his job.
I am highly indebted to all present and former members of the Terahertz
and Biophotonic Group at DTU Fotonik. I would like to mention few
of them. First of all thanks to David Cooke, whom I had a chance to
work with for over two years. It is Dave who thought me how to align
the laser, it is with him that I have done my first terahertz experiments,
and it is him who helped me interpret the first THz data. Special thanks
to Henrik Porte, my fellow PhD colleague whom I worked with the
whole duration of my PhD program and who recently received his PhD.
We have spent with Henrik countless hours in the lab and had count-
less conversations, which for sure benefited my work. I would like to
127

Chapter 6. Conclusions and Outlook 128
thank Andrei Andryieuski for patiently performing all the numerical
simulations of the tapered parallel plate waveguide. Thanks to Dmirty
Turchinovich for lot of simulating discussions and ideas. I want to
thank Binbin Zhou for fixing so many laser problems and his advise
with autocorrelation measurements. I would like to thank all my col-
leagues and friends who were involved in proofreading of this thesis.
I would like to thank people from Rensselaer Polytechnic Insitute in
Troy, USA, where I had a chance to work for nearly 5 months. First of
all to Xi-Cheng Zhang, director of Center for THz Research who gave
me the opportunity to work in his group. Second to Jianming Dai
for his patient assistance in the lab and help with laser issues. Special
thanks for all the grad students at the Center for Terahertz Research for
extremely stimulating scientific discussions, help in the lab and friendly
atmosphere which helped me survive a cold North-American winter.
A special thanks to Martin Nielsen and Frank Persson from me-
chanical workshop at DTU Electro for manufacturing many of the cur-
tail parts of my systems. They used high precision even with parts that
were asked for with a short notice, improving the results of this thesis.
I would like to thank all my friends from all over the world. Time with
you even though not connected to scientific research has helped me keep
a healthy balance between work and personal life. Thanks to everyone
from Copenhagen Mermates, my swimming and triathlon team, for
motivating me to do sport, and, to stay fit and healthy. Last but not
least I would like to thank my family for support which I could always
feel even being thousands of kilometers away.
Appendix B
Ph.D. Publications
B.1 Peer Reviewed Journal
1. Krzysztof Iwaszczuk, Andrei Andryieuski, Andrei Lavrinenko, Xi-
Cheng Zhang and Peter Uhd Jepsen, “Non-invasive terahertz field
imaging inside parallel plate waveguides,” Applied Physics Letters
99, 071113 (2011).
2. Krzysztof Iwaszczuk, Henning Heiselberg, Peter Uhd Jepsen, ”Ter-
ahertz radar cross section measurements,” Optics Express 18, 26399
(2010).
3. Krzysztof Iwaszczuk, David Cooke, Masazumi Fujiwara, Hideki
Hashimoto and Peter Uhd Jepsen, “Simultaneous reference and
differential waveform acquisition in time-resolved terahertz spec-
troscopy,” Optics Express 17, 21969 (2009).
4. Krzysztof Iwaszczuk, Andrei Andryieuski, Andrei Lavrinenko, Xi-
Cheng Zhang and Peter Uhd Jepsen, “Terahertz field enhancement
using tapered parallel plate waveguides,” (in preparation).
129

Chapter 6. Conclusions and Outlook Appendix A. Ph.D. Publications
5. Krzysztof Iwaszczuk, Andrew C. Strikwerda, Kim Fan, Xi Zhang,
Richard D. Averitt, and Peter Uhd Jepsen, ”Flexible terahertz ab-
sorbers for stealth applications,” Optics Express, (in preparation).
6. Krzysztof Iwaszczuk, Binbin Zhou, Morten Bache and Peter Uhd
Jepsen “Spectral compression of intense sub-picosecond pulses,”
(in preparation).
B.2 Conference Contributions
7. Krzysztof Iwaszczuk, Andrei Andryieuski, Andrei Lavrinenko, Xi-
Cheng Zhang and Peter Uhd Jepsen, “ Non-invasive method of
field imaging in parallel plate waveguides,” presentation and a
proceedings publication at the 36th International Conference on
Infrared, Millimeter and THz waves, Huston, USA, October 2011
(proceedings + talk).
8. Krzysztof Iwaszczuk, Kim Fan, Andrew C. Strikwerda, Xi Zhang,
Richard D. Averitt, and Peter Uhd Jepsen, ”Radar Cross Section
measurements on the stealth metamaterial objects,” Danish Phys-
ical Society Meeting, Nyborg, Denmark, June 2011 (poster).
9. Krzysztof Iwaszczuk, Andrei Andryieuski, Andrei Lavrinenko, Xi-
Cheng Zhang and Peter Uhd Jepsen, ”Terahertz field imaging in-
side tapered parallel plate waveguides,” THz Science and Technol-
ogy - The Castle Meeting, Schloss Rauischholzhausen, Germany,
June 2012 (poster).
10. Krzysztof Iwaszczuk, Kim Fan, Andrew C. Strikwerda, Xi Zhang,
Richard D. Averitt, and Peter Uhd Jepsen, ”Stealth metamaterial
objects characterized in the far field by Radar Cross Section mea-
surements”, poster and a proceedings publication at International
Workshop on Optical Terahertz Science and Technology, Santa
Barbara, California, USA, March 2011 (poster).
Appendix A. Ph.D. Publications 131
11. Krzysztof Iwaszczuk and Peter Uhd Jepsen, ”Defense and security-
related applications of THz radiation,” Militaer Teknisk Forening
(MTF), Copenhagen, April 2011 (talk).
12. - Krzysztof Iwaszczuk, Henning Heiselberg, Peter Uhd Jepsen ”Ter-
ahertz radar cross secition measurements,” keynote presentation
and a proceedings publication at the 35th International Conference
on Infrared, Millimeter and THz waves, Rome, Italy, September
2010 (proceedings + keynote talk).
13. Krzysztof Iwaszczuk, Henning Heiselberg, and Peter Uhd Jepsen,
”Terahertz radar cross section measurements,” Sensors and Elec-
tronics Technology Panel Specialists Meeting, Terahertz and other
electromagnetic wave techniques for defence and security (SET) -
159, Vilnius, Lithuania, 2010 (proceedings + talk).
14. Krzysztof Iwaszczuk and Peter Uhd Jepsen, ”DTU THz activi-
ties,” Sensors and Electronics Technology Panel Specialists Meet-
ing, Terahertz and other electromagnetic wave techniques for de-
fence and security (SET) - 124 meeting, Rome, Italy, May 2009
(talk).
15. Krzysztof Iwaszczuk, David Cooke and Peter Uhd Jepsen, ”Broad-
band high power THz generation,” 1 Nordic Meeting in Physics,
2009, DTU, Lyngby, Denmark (poster).
16. David Cooke, Krzysztof Iwaszczuk, Kristian Nielsen, Ole Bang
and Peter Uhd Jepsen, ”Broadband THz waveguiding and high-
precision broadband time-resolved spectroscopy,” International Work-
shop on Terahertz Technology (TeraTech) - 2 , 2I-B5, 2009, Osaka,
Japan (Invited conference contribution).

Chapter 6. Conclusions and Outlook Appendix A. Ph.D. Publications
B.3 Book chapters
17. Krzysztof Iwaszczuk, Henrik Porte, Rasmus Kjelsmark Olsson,
David Cooke, Dmitry Turchinovich and Peter Uhd Jepsen, ”Ter-
ahertz technology : terahertz sources and detectors,” Chapeter in
”Beyond optical horizons, today and tomorrow with photonics,”
pp. 113-129, DTU Fotonik, Kgs. Lyngby (2009).

Bibliography
[1] P. U. Jepsen, D. G. Cooke, and M. Koch. Terahertz spectroscopyand imaging - modern techniques and applications. Laser & Pho-tonics Reviews, 5(1):124–166, January 2011.
[2] Jason B. Baxter and Glenn W. Guglietta. Terahertz spectroscopy.Anal. Chem., 83(12):4342–4368, 2011.
[3] M.R. Scarfi, M. Romano, R. Di Pietro, O. Zeni, A. Doria, G.P.Gallerano, E. Giovenale, G. Messina, A. Lai, G. Campurra,D. Coniglio, and M. D’Arienzo. THz exposure of whole blood forthe study of biological effects on human lymphocytes. J. BIOL.PHYS., 29:171–176, 2003.
[4] R.H. Clothier and N. Bourne. Effects of THz exposure on hu-man primary keratinocyte differentiation and viability. J. BIOL.PHYS., 29:179–185, 2003.
[5] B. E. Cole, J. B. Williams, B. T. King, M. S. Sherwin, and C. R.Stanley. Coherent manipulation of semiconductor quantum bitswith terahertz radiation. Nature, 410(6824):60–63, March 2001.
[6] R. Huber, F. Tauser, A. Brodschelm, M. Bichler, G. Abstre-iter, and A. Leitenstorfer. How many-particle interactions de-velop after ultrafast excitation of an electron-hole plasma. Nature,414(6861):286–289, November 2001.
[7] S. Leinß, T. Kampfrath, K. v.Volkmann, M. Wolf, J. T. Steiner,M. Kira, S. W. Koch, A. Leitenstorfer, and R. Huber. Terahertzcoherent control of optically dark paraexcitons in Cu2O. Phys.Rev. Lett., 101:246401, Dec 2008.
133
Bibliography Appendix A. Ph.D. Publications
[8] M. Schall, M. Walther, and P. Uhd Jepsen. Fundamental andsecond-order phonon processes in CdTe and ZnTe. Phys. Rev. B,64:094301, Aug 2001.
[9] Markus Walther, Bernd M. Fischer, and P. Uhd Jepsen. Non-covalent intermolecular forces in polycrystalline and amorphoussaccharides in the far infrared. Chem. Phys., 288(2-3):261 – 268,2003.
[10] C Ronne, L Thrane, PO Astrand, A Wallqvist, KV Mikkelsen, andSR Keiding. Investigation of the temperature dependence of dielec-tric relaxation in liquid water by THz reflection spectroscopy andmolecular dynamics simulation. J. Chem. Phys., 107(14):5319–5331, OCT 8 1997.
[11] Charles A. Schmuttenmaer. Exploring dynamics in the far-infraredwith terahertz spectroscopy. ChemInform, 35(24):no–no, 2004.
[12] Michael Schall and Peter Uhd Jepsen. Photoexcited GaAs surfacesstudied by transient terahertz time-domain spectroscopy. Opt.Lett., 25(1):13–15, Jan 2000.
[13] K. P. H. Lui and F. A. Hegmann. Ultrafast carrier relaxation inradiation-damaged silicon on sapphire studied by optical-pump-terahertz-probe experiments. Appl. Phys. Lett., 78(22):3478 –3480,may 2001.
[14] D. G. Cooke, A. N. MacDonald, A. Hryciw, J. Wang, Q. Li,A. Meldrum, and F. A. Hegmann. Transient terahertz conduc-tivity in photoexcited silicon nanocrystal films. Phys. Rev. B,73(19):193311, May 2006.
[15] Masayoshi Tonouchi. Cutting-edge terahertz technology. Nat Pho-ton, 1(2):97–105, February 2007.
[16] Hai-Bo Liu, Hua Zhong, N. Karpowicz, Yunqing Chen, and Xi-Cheng Zhang. Terahertz spectroscopy and imaging for defenseand security applications. Proceedings of the IEEE, 95(8):1514–1527, aug. 2007.
[17] Martin Koch. Terahertz communications: A 2020 vision. InRobert Miles, Xi-Cheng Zhang, Heribert Eisele, and ArunasKrotkus, editors, Terahertz Frequency Detection and Identificationof Materials and Objects, volume 19 of NATO Security throughScience Series, pages 325–338. Springer Netherlands, 2007.
Bibliography 135
[18] Ernest V. Loewenstein. The history and current status of fouriertransform spectroscopy. Appl. Opt., 5(5):845–854, May 1966.
[19] K. D. M. Moeller and W. G. Rothschild. Far-Infrared Spectroscopy.Wiley Interscience, 1971.
[20] Jam Farhoomand and Herbert M. Pickett. Stable 1.25 Watts CWfar infrared laser radiation at the 119 µm methanol line. Interna-tional Journal of Infrared and Millimeter Waves, 8:441–447, 1987.10.1007/BF01013257.
[21] D. H. Auston. Picosecond optoelectronic switching and gating insilicon. Appl. Phys. Lett., 26(3):101–103, 1975.
[22] Martin van Exter, Ch. Fattinger, and D. Grischkowsky. Terahertztime-domain spectroscopy of water vapor. Opt. Lett., 14(20):1128–1130, Oct 1989.
[23] P. F. Moulton. Spectroscopic and laser characteristics of ti:al2o3.J. Opt. Soc. Am. B, 3(1):125–133, Jan 1986.
[24] J.D. Kafka, M.L. Watts, and J.-W.J. Pieterse. Picosecondand femtosecond pulse generation in a regeneratively mode-locked ti:sapphire laser. Quantum Electronics, IEEE Journal of,28(10):2151 –2162, oct 1992.
[25] D. W. Faries, K. A. Gehring, P. L. Richards, and Y. R. Shen. Tun-able far-infrared radiation generated from the difference frequencybetween two ruby lasers. Phys. Rev., 180:363–365, Apr 1969.
[26] K. H. Yang, P. L. Richards, and Y. R. Shen. Generation of farinfrared radiation by picosecond light pulses in linbo3. Appl. Phys.Lett., 19(9):320–323, 1971.
[27] Q. Wu and X.-C. Zhang. Free-space electro-optic sampling of ter-ahertz beams. Appl. Phys. Lett., 67(24):3523–3525, 1995.
[28] P. Uhd Jepsen, C. Winnewisser, M. Schall, V. Schyja, S. R. Keid-ing, and H. Helm. Detection of thz pulses by phase retardation inlithium tantalate. Phys. Rev. E, 53(4):R3052–R3054, Apr 1996.
[29] Ajay Nahata, David H. Auston, Tony F. Heinz, and Chengjiu Wu.Coherent detection of freely propagating terahertz radiation byelectro-optic sampling. Appl. Phys. Lett., 68(2):150–152, 1996.

Bibliography Appendix A. Ph.D. Publications
[30] Q. Wu and X.-C. Zhang. Ultrafast electro-optic field sensors. Appl.Phys. Lett., 68(12):1604–1606, 1996.
[31] D. J. Cook and R. M. Hochstrasser. Intense terahertz pulses byfour-wave rectification in air. Opt. Lett., 25(16):1210–1212, Aug2000.
[32] Jianming Dai, Xu Xie, and X.-C. Zhang. Detection of broadbandterahertz waves with a laser-induced plasma in gases. Phys. Rev.Lett., 97(10):103903, Sep 2006.
[33] Jingle Liu, Jianming Dai, See Leang Chin, and ZhangX.-C. Broad-band terahertz wave remote sensing using coherent manipulationof fluorescence from asymmetrically ionized gases. Nat Photon,4(9):627–631, September 2010.
[34] Nicholas Karpowicz, Jianming Dai, Xiaofei Lu, Yunqing Chen,Masashi Yamaguchi, Hongwei Zhao, X.-C. Zhang, LiangliangZhang, Cunlin Zhang, Matthew Price-Gallagher, Clark Fletcher,Orval Mamer, Alain Lesimple, and Keith Johnson. Coherent het-erodyne time-domain spectrometry covering the entire terahertzgap. Appl. Phys. Lett., 92(1):011131, 2008.
[35] Andrei G. Stepanov, Jnos Hebling, and Jrgen Kuhl. Efficient gen-eration of subpicosecond terahertz radiation by phase-matched op-tical rectification using ultrashort laser pulses with tilted pulsefronts. Appl. Phys. Lett., 83(15):3000–3002, 2003.
[36] Matthias C Hoffmann and Jozsef A. Fulop. Intense ultrashortterahertz pulses: generation and applications. J. Phys. D: Appl.Phys., 44(8):083001, 2011.
[37] X. Xin, H. Altan, A. Saint, D. Matten, and R. R. Alfano. Terahertzabsorption spectrum of para and ortho water vapors at differenthumidities at room temperature. J. Appl. Phys., 100(9):094905,2006.
[38] Takeshi Yasui, Eisuke Saneyoshi, and Tsutomu Araki. Asyn-chronous optical sampling terahertz time-domain spectroscopy forultrahigh spectral resolution and rapid data acquisition. Appl.Phys. Lett., 87(6):061101, 2005.

Bibliography 137
[39] C. Janke, M. Forst, M. Nagel, H. Kurz, and A. Bartels. Asyn-chronous optical sampling for high-speed characterization of inte-grated resonant terahertz sensors. Opt. Lett., 30(11):1405–1407,Jun 2005.
[40] O. Morikawa, M. Tonouchi, and M. Hangyo. A cross-correlationspectroscopy in subterahertz region using an incoherent lightsource. Appl. Phys. Lett., 76(12):1519–1521, 2000.
[41] Maik Scheller and Martin Koch. Terahertz quasi time domainspectroscopy. Opt. Express, 17(20):17723–17733, Sep 2009.
[42] Kohji Yamamoto, Mariko Yamaguchi, Fumiaki Miyamaru,Masahiko Tani, Masanori Hangyo, Takeshi Ikeda, Akira Mat-sushita, Kenji Koide, Michiaki Tatsuno, and Yukio Minami. Non-invasive inspection of C-4 explosive in mails by terahertz time-domain spectroscopy. Jpn. J. Appl. Phys., 43(3B):L414–L417,2004.
[43] Feng Huang, Brian Schulkin, Hakan Altan, John F. Federici, DaleGary, Robert Barat, David Zimdars, Minghan Chen, and D. B.Tanner. Terahertz study of 1,3,5-trinitro-s-triazine by time-domainand fourier transform infrared spectroscopy. Appl. Phys. Lett.,85(23):5535–5537, 2004.
[44] T. M. Goyette J. C. Dickinson R. H. Giles W Goodhue W. Wald-man W. E. Nixon A. J. Gatesman, A. Danylov and W. Hoen.Terahertz behaviour of optical components and common materi-als. SPIE, 6212, 2006.
[45] W. Kuehn, K. Reimann, M. Woerner, and T. Elsaesser. Phase-resolved two-dimensional spectroscopy based on collinear n-wave mixing in the ultrafast time domain. J. Chem. Phys.,130(16):164503, 2009.
[46] G. Vaillancourt, T. B. Norris, J. S. Coe, P. Bado, and G. A.Mourou. Operation of a 1-kHz pulse-pumped ti:sapphire regen-erative amplifier. Opt. Lett., 15(6):317–319, Mar 1990.
[47] Donna Strickland and Gerard Mourou. Compression of amplifiedchirped optical pulses. Opt. Commun., 56(3):219 – 221, 1985.
[48] F. J. McClung and R. W. Hellwarth. Giant optical pulsations fromruby. J. Appl. Phys., 33(3):828–829, 1962.
Bibliography Appendix A. Ph.D. Publications
[49] J. A. Armstrong. Measurement of picosecond laser pulse widths.Appl. Phys. Lett., 10(1):16–18, 1967.
[50] M. Maier, W. Kaiser, and J. A. Giordmaine. Intense light burstsin the stimulated Raman effect. Phys. Rev. Lett., 17:1275–1277,Dec 1966.
[51] F. Salin, P. Georges, G. Roger, and A. Brun. Single-shot mea-surement of a 52-fs pulse. Appl. Optics, 26(21):4528–4531, Nov1987.
[52] J. Horvat and R. A. Lewis. Peeling adhesive tape emits electromag-netic radiation at terahertz frequencies. Opt. Lett., 34(14):2195–2197, Jul 2009.
[53] D. T. Hodges, F. B. Foote, and R. D. Reel. Efficient high-poweroperation of the cw far-infrared waveguide laser. Appl. Phys. Lett.,29(10):662–664, 1976.
[54] Benjamin S. Williams. Terahertz quantum-cascade lasers. NatPhoton, 1(9):517–525, September 2007.
[55] B. F. J. Zuidberg and A. Dymanus. High-order submillimetermixing in point-contact and schottky diodes. Appl. Phys. Lett.,29(10):643–645, 1976.
[56] W. H. Haydl, S. Smith, and R. Bosch. 100 GHz Gunn diodes fab-ricated by molecular beam epitaxy. Appl. Phys. Lett., 37(6):556–557, 1980.
[57] G. P. Williams. FAR-IR/THz radiation from the jefferson labora-tory, energy recovered linac, free electron laser. Rev. Sci. Instrum.,73(3):1461–1463, 2002.
[58] Y. Shen, T. Watanabe, D. A. Arena, C.-C. Kao, J. B. Murphy,T. Y. Tsang, X. J. Wang, and G. L. Carr. Nonlinear cross-phasemodulation with intense single-cycle terahertz pulses. Phys. Rev.Lett., 99(4):043901–4, July 2007.
[59] Gwyn P Williams. Filling the THz gap - high power sources andapplications. Reports on Progress in Physics, 69(2):301, 2006.
[60] D. H. Auston, K. P. Cheung, and P. R. Smith. Picosecond pho-toconducting hertzian dipoles. Appl. Phys. Lett., 45(3):284–286,1984.

Bibliography 139
[61] D. H. Auston, K. P. Cheung, J. A. Valdmanis, and D. A. Kleinman.Cherenkov radiation from femtosecond optical pulses in electro-optic media. Phys. Rev. Lett., 53:1555–1558, Oct 1984.
[62] Ch. Fattinger and D. Grischkowsky. Terahertz beams. Appl. Phys.Lett., 54(6):490–492, 1989.
[63] P.R. Smith, D.H. Auston, and M.C. Nuss. Subpicosecond photo-conducting dipole antennas. Quantum Electronics, IEEE Journalof, 24(2):255 –260, feb 1988.
[64] A. C. Warren, J. M. Woodall, J. L. Freeouf, D. Grischkowsky,D. T. McInturff, M. R. Melloch, and N. Otsuka. Arsenic pre-cipitates and the semi?insulating properties of gaas buffer layersgrown by low?temperature molecular beam epitaxy. Appl. Phys.Lett., 57(13):1331–1333, 1990.
[65] I. S. Gregory, C. Baker, W. R. Tribe, M. J. Evans, H. E. Beere,E. H. Linfield, A. G. Davies, and M. Missous. High resistivityannealed low-temperature gaas with 100 fs lifetimes. Appl. Phys.Lett., 83(20):4199–4201, 2003.
[66] Masato Suzuki and Masayoshi Tonouchi. Fe-implanted ingaas pho-toconductive terahertz detectors triggered by 1.56 µm femtosecondoptical pulses. Appl. Phys. Lett., 86(16):163504, 2005.
[67] N. Chimot, J. Mangeney, L. Joulaud, P. Crozat, H. Bernas,K. Blary, and J. F. Lampin. Terahertz radiation from heavy-ion-irradiated in0.53ga0.47as photoconductive antenna excited at 1.55µm. Appl. Phys. Lett., 87(19):193510, 2005.
[68] M. Bass, P. A. Franken, J. F. Ward, and G. Weinreich. Opticalrectification. Phys. Rev. Lett., 9(11):446–448, Dec 1962.
[69] F. Blanchard, L. Razzari, H.C. Bandulet, G. Sharma, R. Moran-dotti, J. C. Kieffer, T. Ozaki, M. Reid, H. F. Tiedje, H. K. Haugen,and F. A. Hegmann. Generation of 1.5 µj single-cycle terahertzpulses by optical rectification from a large aperture ZnTe crystal.Opt. Express, 15(20):13212–13220, Oct 2007.
[70] P. Y. Han, M. Tani, F. Pan, and X.-C. Zhang. Use of the organiccrystal DAST for terahertz beam applications. Opt. Lett., 25:675,2000.
Bibliography Appendix A. Ph.D. Publications
[71] J. O. White, D. Hulin, M. Joffre, A. Migus, A. Antonetti, E. Tou-ssaere, R. Hierle, and J. Zyss. Ultrabroadband second harmonicgeneration in organic and inorganic thin crystals. Appl. Phys.Lett., 64(3):264–266, 1994.
[72] John J. Carey, Ray T. Bailey, D. Pugh, J. N. Sherwood, F. R.Cruickshank, and Klaas Wynne. Terahertz pulse generation in anorganic crystal by optical rectification and resonant excitation ofmolecular charge transfer. Appl. Phys. Lett., 81(23):4335–4337,2002.
[73] Hideki Hashimoto, Hironori Takahashi, Takashi Yamada,Kazuyoshi Kuroyanagi, and Takayoshi Kobayashi. Characteristicsof the terahertz radiation from single crystals of n -substituted2-methyl-4-nitroaniline. J. Phys.: Condens. Matter, 13(23):L529,2001.
[74] Kazuyoshi Kuroyanagi, Masazumi Fujiwara, Hideki Hashimoto,Hironori Takahashi, Shin ichiro Aoshima, and Yutaka Tsuchiya.All organic terahertz electromagnetic wave emission and detec-tion using highly purified N -benzyl-2-methyl-4-nitroaniline crys-tals. Jpn. J. Appl. Phys., 45(5A):4068–4073, 2006.
[75] Masazumi Fujiwara, Kazuhiro Yanagi, Minoru Maruyama, Mit-suru Sugisaki, Kazuyoshi Kuroyanagi, Hironori Takahashi, Shinichiro Aoshima, Yutaka Tsuchiya, Andrew Gall, and HidekiHashimoto. Second order nonlinear optical properties of the singlecrystal of N -benzyl 2-methyl-4-nitroaniline: Anomalous enhance-ment of the d333 component and its possible origin. Jpn. J. Appl.Phys., 45(11):8676–8685, 2006.
[76] Masazumi Fujiwara, Minoru Maruyama, Mitsuru Sugisaki, Hi-ronori Takahashi, Shin ichiro Aoshima, Richard J. Cogdell, andHideki Hashimoto. Determination of the d-tensor components ofa single crystal of N -benzyl-2-methyl-4-nitroaniline. Jpn. J. Appl.Phys., 46(4A):1528–1530, 2007.
[77] Kazuyoshi Kuroyanagi, Masazumi Fujiwara, Hideki Hashimoto,Hironori Takahashi, Shin ichiro Aoshima, and Yutaka Tsuchiya.Determination of refractive indices and absorption coefficients ofhighly purified N -benzyl-2-methyl-4-nitroaniline crystal in tera-hertz frequency regime. Jpn. J. Appl. Phys., 45(29):L761–L764,2006.
Bibliography 141
[78] Katsuhiko Miyamoto, Hiroaki Minamide, Masazumi Fujiwara,Hideki Hashimoto, and Hiromasa Ito. Widely tunable terahertz-wave generation using an n-benzyl-2-methyl-4-nitroaniline crystal.Opt. Lett., 33(3):252–254, Feb 2008.
[79] J. Hebling, A.G. Stepanov, G. Almsi, B. Bartal, and J. Kuhl.Tunable thz pulse generation by optical rectification of ultrashortlaser pulses with tilted pulse fronts. Appl. Phys. B: Lasers Opt.,78:593–599, 2004. 10.1007/s00340-004-1469-7.
[80] K.-L. Yeh, M. C. Hoffmann, J. Hebling, and Keith A. Nelson. Gen-eration of 10µj ultrashort terahertz pulses by optical rectification.Appl. Phys. Lett., 90(17):171121, 2007.
[81] O. E. Martinez. Grating and prism compressors in the case offinite beam size. J. Opt. Soc. Am. B, 3(7):929–934, July 1986.
[82] J. A. Fulop, L. Palfalvi, G. Almasi, and J. Hebling. Design ofhigh-energy terahertz sources based on optical rectification. Opt.Express, 18(12):12311–12327, Jun 2010.
[83] P. L. Richards. Bolometers for infrared and millimeter waves. J.Appl. Phys., 76(1):1–24, 1994.
[84] M. J. E. Golay. A pneumatic infra-red detector. Rev. of Sci. Intr.,18:357–362, 1947.
[85] Gael Sebald, Daniel Guyomar, and Amen Agbossou. On thermo-electric and pyroelectric energy harvesting. Smart Materials andStructures, 18(12):125006, 2009.
[86] S. M. Sze. Semiconductor Devices. John Wiley and Sons, Physicsand Technology, 1984.
[87] D. Grischkowsky, Søren Keiding, Martin van Exter, and Ch.Fattinger. Far-infrared time-domain spectroscopy with terahertzbeams of dielectrics and semiconductors. J. Opt. Soc. Am. B,7(10):2006–2015, Oct 1990.
[88] X.-C. Zhang and D. H. Auston. Optoelectronic measurement ofsemiconductor surfaces and interfaces with femtosecond optics. J.Appl. Phys., 71(1):326–338, 1992.
Bibliography Appendix A. Ph.D. Publications
[89] P. Uhd Jepsen, R. H. Jacobsen, and S. R. Keiding. Generation anddetection of terahertz pulses from biased semiconductor antennas.J. Opt. Soc. Am. B, 13(11):2424–2436, Nov 1996.
[90] A. Cingolani, M. Ferrara, and M. Lugar. Dispersion of the linearelectrooptic coefficient and of the non-linear susceptibility in ZnTe.Solid State Commun., 38(9):819 – 821, 1981.
[91] Yu Berozashvili, S Machavariani, A Natsvlishvili, and A Chi-rakadze. Dispersion of the linear electro-optic coefficients andthe non-linear susceptibility in GaP. J. Phys. D: Appl. Phys.,22(5):682, 1989.
[92] Q. Chen and X.-C. Zhang. Polarization modulation in optoelec-tronic generation and detection of terahertz beams. Appl. Phys.Lett., 74(23):3435–3437, 1999.
[93] Paul C. M. Planken, Han-Kwang Nienhuys, Huib J. Bakker, andTom Wenckebach. Measurement and calculation of the orientationdependence of terahertz pulse detection in ZnTe. J. Opt. Soc. Am.B, 18(3):313–317, Mar 2001.
[94] Q. Wu and X.-C. Zhang. 7 terahertz broadband GaP electro-opticsensor. Appl. Phys. Lett., 70(14):1784–1786, April 1997.
[95] A. Leitenstorfer, S. Hunsche, J. Shah, M. C. Nuss, and W. H.Knox. Detectors and sources for ultrabroadband electro-optic sam-pling: Experiment and theory. Appl. Phys. Lett., 74(11):1516–1518, 1999.
[96] C Kubler, R Huber, and A Leitenstorfer. Ultrabroadband tera-hertz pulses: generation and field-resolved detection. Semicond.Sci. Technol., 20(7):S128–S133, 2005.
[97] Alexander Sell, Rdiger Scheu, Alfred Leitenstorfer, and RupertHuber. Field-resolved detection of phase-locked infrared transientsfrom a compact er:fiber system tunable between 55 and 107 THz.Appl. Phys. Lett., 93(25):251107, 2008.
[98] M. R. Freeman, M. J. Brady, and J. Smyth. Extremely highfrequency pulse magnetic resonance by picosecond magneto?opticsampling. Appl. Phys. Lett., 60(20):2555–2557, 1992.

Bibliography 143
[99] J. A. Riordan, F. G. Sun, Z. G. Lu, and X.-C. Zhang. Free-spacetransient magneto-optic sampling. Appl. Phys. Lett., 71(11):1452–1454, 1997.
[100] Jingle Liu, Jianming Dai, and X.-C. Zhang. Ultrafast broadbandterahertz waveform measurement utilizing ultraviolet plasma pho-toemission. J. Opt. Soc. Am. B, 28(4):796–804, Apr 2011.
[101] Xiaofei Lu and X.-C. Zhang. Balanced terahertz wave air-biased-coherent-detection. Appl. Phys. Lett., 98(15):151111, 2011.
[102] Jingle Liu and X.-C. Zhang. Terahertz-radiation-enhancedemission of fluorescence from gas plasma. Phys. Rev. Lett.,103(23):235002, Dec 2009.
[103] Benjamin Clough, Jingle Liu, and X.-C. Zhang. Laser-inducedphotoacoustics influenced by single-cycle terahertz radiation. Opt.Lett., 35(21):3544–3546, November 2010.
[104] David G. Cooke and Peter Uhd Jepsen. Time-resolved THz spec-troscopy in a parallel plate waveguide. Physica Status Solidi A,206(5):997–1000, 2009.
[105] Bradley Ferguson and Xi-Cheng Zhang. Materials for terahertzscience and technology. Nat. Mater., 1(1):26–33, September 2002.
[106] Daniel Mittleman, editor. Sensing with terahertz radiation.Springer, Berlin, 2003.
[107] H. Harde, Søren Keiding, and D. Grischkowsky. Thz commensu-rate echoes: Periodic rephasing of molecular transitions in free-induction decay. Phys. Rev. Lett., 66(14):1834–1837, Apr 1991.
[108] D.M. Mittleman, R.H. Jacobsen, R. Neelamani, R.G. Bara-niuk, and M.C. Nuss. Gas sensing using terahertz time-domainspectroscopy. Appl. Phys. B: Lasers Opt., 67:379–390, 1998.10.1007/s003400050520.
[109] L. Thrane, R.H. Jacobsen, P. Uhd Jepsen, and S.R. Keiding.THz reflection spectroscopy of liquid water. Chem. Phys. Lett.,240(4):330 – 333, 1995.
[110] J. T. Kindt and C. A. Schmuttenmaer. Far-infrared dielectricproperties of polar liquids probed by femtosecond terahertz pulsespectroscopy. The Journal of Physical Chemistry, 100(24):10373–10379, 1996.

Bibliography Appendix A. Ph.D. Publications
[111] Uffe Møller, David G. Cooke, Koichiro Tanaka, and Peter UhdJepsen. Terahertz reflection spectroscopy of Debye relaxation inpolar liquids. J. Opt. Soc. Am. B, 26(9):A113–A125, Sep 2009.
[112] Jie Shan, Feng Wang, Ernst Knoesel, Mischa Bonn, and Tony F.Heinz. Measurement of the frequency-dependent conductivity insapphire. Phys. Rev. Lett., 90(24):247401, Jun 2003.
[113] Hiroaki Yasuda and Iwao Hosako. Measurement of terahertz re-fractive index of metal with terahertz time-domain spectroscopy.Jpn. J. Appl. Phys., 47(3):1632–1634, 2008.
[114] D. M. Mittleman, J. Cunningham, M. C. Nuss, and M. Geva. Non-contact semiconductor wafer characterization with the terahertzhall effect. Appl. Phys. B: Lasers Opt., 71(1):16–18, 1997.
[115] Paul C. M. Planken, Martin C. Nuss, Igal Brener, Keith W.Goossen, Marie S. C. Luo, Shun Lien Chuang, and Loren Pfeiffer.Terahertz emission in single quantum wells after coherent opticalexcitation of light hole and heavy hole excitons. Phys. Rev. Lett.,69(26):3800–3803, Dec 1992.
[116] Y. C. Shen, T. Lo, P. F. Taday, B. E. Cole, W. R. Tribe, and M. C.Kemp. Detection and identification of explosives using terahertzpulsed spectroscopic imaging. Appl. Phys. Lett., 86(24):241116,2005.
[117] Joseph S. Melinger, N. Laman, and D. Grischkowsky. The un-derlying terahertz vibrational spectrum of explosives solids. Appl.Phys. Lett., 93(1):011102, 2008.
[118] Robert J. Foltynowicz, Ronald E. Allman, and Eric Zucker-man. Terahertz absorption measurement for gas-phase 2,4-dinitrotoluene from 0.05thz to 2.7THz. Chem. Phys. Lett., 431(1-3):34 – 38, 2006.
[119] M. C. Nuss, D. H. Auston, and F. Capasso. Direct subpicosec-ond measurement of carrier mobility of photoexcited electrons ingallium arsenide. Phys. Rev. Lett., 58(22):2355–2358, Jun 1987.
[120] D. G. Cooke, F. A. Hegmann, E. C. Young, and T. Tiedje. Elec-tron mobility in dilute GaAs bismide and nitride alloys mea-sured by time-resolved terahertz spectroscopy. Appl. Phys. Lett.,89(12):122103, 2006.

Bibliography 145
[121] E. Hendry, M. Koeberg, J. Pijpers, and M. Bonn. Reduction ofcarrier mobility in semiconductors caused by charge-charge inter-actions. Phys. Rev. B, 75(23):233202, Jun 2007.
[122] O. Ostroverkhova, D. G. Cooke, S. Shcherbyna, R. F. Egerton,F. A. Hegmann, R. R. Tykwinski, and J. E. Anthony. Bandliketransport in pentacene and functionalized pentacene thin filmsrevealed by subpicosecond transient photoconductivity measure-ments. Phys. Rev. B, 71(3):035204, Jan 2005.
[123] James T. Kindt and Charles A. Schmuttenmaer. Theory for deter-mination of the low-frequency time-dependent response function inliquids using time-resolved terahertz pulse spectroscopy. J. Chem.Phys., 110(17):8589–8596, 1999.
[124] J. F. Federici, B. I. Greene, P. N. Saeta, D. R. Dykaar, F. Sharifi,and R. C. Dynes. Direct picosecond measurement of photoinducedcooper-pair breaking in lead. Phys. Rev. B, 46(17):11153–11156,Nov 1992.
[125] Robert A. Kaindl, Marc A. Carnahan, Daniel S. Chemla, Seong-shik Oh, and James N. Eckstein. Dynamics of cooper pair for-mation in bi2sr2cacu2o8 + δ. Phys. Rev. B, 72(6):060510, Aug2005.
[126] A. Dienst, M. C. Hoffmann, D. Fausti, J. C. Petersen, S. Pyon,T. Takayama, H. Takagi, and A. Cavalleri. Bi-directional ultra-fast electric-field gating of interlayer charge transport in a cupratesuperconductor. Nat Photon, 5(8):485–488, August 2011.
[127] Hakan Altan, Feng Huang, John F. Federici, Aidong Lan, andHaim Grebel. Optical and electronic characteristics of single walledcarbon nanotubes and silicon nanoclusters by tetrahertz spec-troscopy. J. Appl. Phys., 96(11):6685–6689, 2004.
[128] Henrik Porte. Time-resolved terahertz spectroscopy of semiconduc-tor nanostructures. PhD thesis, DTU, 2011.
[129] Matthew C. Beard, Gordon M. Turner, James E. Murphy, Olga I.Micic, Mark C. Hanna, Arthur J. Nozik, and Charles A. Schmut-tenmaer. Electronic coupling in InP nanoparticle arrays. NanoLett., 3(12):1695–1699, 2003.
Bibliography Appendix A. Ph.D. Publications
[130] D. Turchinovich, K. Pierz, and P. Uhd Jepsen. InAs/GaAs quan-tum dots as efficient free carrier deep traps. physica status solidi(c), 0(5):1556–1559, 2003.
[131] R. P. Prasankumar, A. Scopatz, D. J. Hilton, A. J. Taylor, R. D.Averitt, J. M. Zide, and A. C. Gossard. Carrier dynamics inself-assembled ErAs nanoislands embedded in GaAs measured byoptical-pump terahertz-probe spectroscopy. Appl. Phys. Lett.,86(20):201107, 2005.
[132] Tae-In Jeon, Keun-Ju Kim, Chul Kang, Seung-Jae Oh, Joo-HiukSon, Kay Hyeok An, Dong Jae Bae, and Young Hee Lee. Terahertzconductivity of anisotropic single walled carbon nanotube films.Appl. Phys. Lett., 80(18):3403–3405, 2002.
[133] David G. Cooke, Jun Y. Lek, Frederik C. Krebs, Yeng MingLam, and Peter Uhd Jepsen. Time-resolved terahertz spectroscopyof conjugated polymer/CdSe nanorod composites. Proc. SPIE,7600(1):76000H, 2010.
[134] J. D. Wiley. Semiconductor and Semimetals. Academic Press,N.Y., 1975.
[135] M. Tinkham. Energy gap interpretation of experiments on in-frared transmission through superconducting films. Phys. Rev.,104(3):845–846, Nov 1956.
[136] Martin Dressel and George Gruner. Electrodynamics of Solids.Cambridge University Press, 2003.
[137] F A Hegmann and K P H Lui. Optical pump - Terahertz probeinvestigation of carrier relaxation in radiation-damaged silicon-on-sapphire, volume 4643, pages 31–41. 2002.
[138] Georgi L. Dakovski, Brian Kubera, Song Lan, and Jie Shan. Fi-nite pump-beam-size effects in optical pump-terahertz probe spec-troscopy. J. Opt. Soc. Am. B, 23(1):139–141, Jan 2006.
[139] Matthew C Beard, Gordon M Turner, and Charles A Schmutten-maer. Subpicosecond carrier dynamics in low-temperature grownGaAs as measured by time-resolved terahertz spectroscopy. J.Appl. Phys., 90(12):5915, 2001.

Bibliography 147
[140] Samuel P. Mickan, Kwang-Su Lee, Toh-Ming Lu, Jesper Munch,Derek Abbott, and X. C. Zhang. Double modulated differen-tial THz-TDS for thin film dielectric characterization. MICRO-ELECTR. J., 33(12):1033 – 1042, 2002.
[141] Samuel Peter Mickan, Regina Shvartsman, Jesper Munch, Xi-Cheng Zhang, and Derek Abbott. Low noise laser-based T-rayspectroscopy of liquids using double-modulated differential time-domain spectroscopy. J. OPT. B-QUANTUM S. O., 6(8):S786,2004.
[142] Jegathisvaran Balakrishnan, Bernd M. Fischer, and Derek Abbott.Low noise spinning wheel technique for THz material parameterextraction. Opt. Commun., 283(10):2301 – 2307, 2010.
[143] Jared H. Strait, Paul A. George, Mark Levendorf, Martin Blood-Forsythe, Farhan Rana, and Jiwoong Park. Measurements of thecarrier dynamics and terahertz response of oriented germaniumnanowires using optical-pump terahertz-probe spectroscopy. NanoLett., 9(8):2967–2972, 2009. PMID: 19594164.
[144] M. S. Tyagi and R. Van Overstraeten. Minority carrier recombi-nation in heavily-doped silicon. Solid-State Electron., 26(6):577 –597, 1983.
[145] D. E. Aspnes and A. A. Studna. Dielectric functions and opticalparameters of Si, Ge, GaP, GaAs, GaSb, InP, InAs, and InSb from1.5 to 6.0 ev. Phys. Rev. B, 27(2):985, Jan 1983.
[146] Kenneth Levenberg. Method for the solution of certain non-linearproblems in least-squares. Quarterly of Applied Mathematics,2(2):164, 1944.
[147] Casper Larsen, David G. Cooke, and Peter Uhd Jepsen. Finite-difference time-domain analysis of time-resolved terahertz spec-troscopy experiments. J. Opt. Soc. Am. B, 28(5):1308–1316, May2011.
[148] D. Golde, M. Wagner, D. Stehr, H. Schneider, M. Helm, A. M. An-drews, T. Roch, G. Strasser, M. Kira, and S. W. Koch. Fano sig-natures in the intersubband terahertz response of optically excitedsemiconductor quantum wells. Phys. Rev. Lett., 102(12):127403,Mar 2009.

Bibliography Appendix A. Ph.D. Publications
[149] G. Gallot, S. P. Jamison, R. W. McGowan, and D. Grischkowsky.Terahertz waveguides. J. Opt. Soc. Am. B, 17(5):851–863, May2000.
[150] R. Mendis and D. Grischkowsky. Undistorted guided-wave propa-gation of subpicosecond terahertz pulses. Opt. Lett., 26(11):846–848, June 2001.
[151] Rajind Mendis and Daniel M. Mittleman. Comparison of thelowest-order transverse-electric (TE1) and transverse-magnetic(TEM) modes of the parallel-plate waveguide for terahertz pulseapplications. Opt. Express, 17(17):14839–14850, August 2009.
[152] Rajind Mendis and Daniel M. Mittleman. An investigation ofthe lowest-order transverse-electric (TE1) mode of the parallel-plate waveguide for thz pulse propagation. J. Opt. Soc. Am. B,26(9):A6–A13, September 2009.
[153] R. Mendis and D. Grischkowsky. THz interconnect with low-lossand low-group velocity dispersion. Microwave and Wireless Com-ponents Letters, IEEE, 11(11):444–446, 2001.
[154] Joseph S. Melinger, N. Laman, S. Sree Harsha, ShuFan Cheng,and D. Grischkowsky. High-resolution waveguide terahertz spec-troscopy of partially oriented organic polycrystalline films. TheJournal of Physical Chemistry A, 111(43):10977–10987, 2007.
[155] Mark I. Stockman. Nanofocusing of optical energy in taperedplasmonic waveguides. Phys. Rev. Lett., 93(13):137404, Sep 2004.
[156] Anastasia Rusina, Maxim Durach, Keith A. Nelson, and Mark I.Stockman. Nanoconcentration of terahertz radiation in plasmonicwaveguides. Opt. Express, 16(23):18576–18589, November 2008.
[157] Hui Zhan, Rajind Mendis, and Daniel M. Mittleman. Superfo-cusing terahertz waves below λ/250 using plasmonic parallel-platewaveguides. Opt. Express, 18(9):9643–9650, April 2010.
[158] Hui Zhan, Rajind Mendis, and Daniel M. Mittleman. Character-ization of the terahertz near-field output of parallel-plate waveg-uides. J. Opt. Soc. Am. B, 28(3):558–566, March 2011.
Bibliography 149
[159] M. Schnell, P. Alonso-Gonzalez, L. Arzubiaga, F. Casanova, L. E.Hueso, A. Chuvilin, and R. Hillenbrand. Nanofocusing of mid-infrared energy with tapered transmission lines. Nat Photon,5(5):283–287, MAY 2011.
[160] Jingbo Liu, Rajind Mendis, and Daniel M. Mittleman. The transi-tion from a TEM-like mode to a plasmonic mode in parallel-platewaveguides. Appl. Phys. Lett., 98(23):231113–3, June 2011.
[161] Rajind Mendis, Victoria Astley, Jingbo Liu, and Daniel M. Mit-tleman. Terahertz microfluidic sensor based on a parallel-platewaveguide resonant cavity. Appl. Phys. Lett., 95(17):171113, 2009.
[162] Michael J Fitch and Robert Osiander. Terahertz waves for com-munications and sensing. Most, 25(4):348355, 2004.
[163] M. M. Awad and R. A. Cheville. Transmission terahertzwaveguide-based imaging below the diffraction limit. Appl. Phys.Lett., 86(22):221107, 2005.
[164] Kanglin Wang and Daniel M. Mittleman. Metal wires for terahertzwave guiding. Nature, 432(7015):376–379, November 2004.
[165] Hua Cao and Ajay Nahata. Coupling of terahertz pulses onto asingle metal wire waveguide using milled grooves. Opt. Express,13(18):7028–7034, Sep 2005.
[166] Victoria Astley, Rajind Mendis, and Daniel M. Mittleman. Char-acterization of terahertz field confinement at the end of a taperedmetal wire waveguide. Appl. Phys. Lett., 95(3):031104, 2009. jour-nal article.
[167] Marx Mbonye, Rajind Mendis, and Daniel M. Mittleman. A tera-hertz two-wire waveguide with low bending loss. Appl. Phys. Lett.,95(23):233506, 2009.
[168] R. W. McGowan, G. Gallot, and D. Grischkowsky. Prop-agation of ultrawideband short pulses of terahertz radiationthrough submillimeter-diameter circular waveguides. Opt. Lett.,24(20):1431–1433, Oct 1999.
[169] Jen-Tang Lu, Yu-Chun Hsueh, Yu-Ru Huang, Yuh-Jing Hwang,and Chi-Kuang Sun. Bending loss of terahertz pipe waveguides.Opt. Express, 18(25):26332–26338, December 2010.

Bibliography Appendix A. Ph.D. Publications
[170] Markus Wachter, Michael Nagel, and Heinrich Kurz. Metallic slitwaveguide for dispersion-free low-loss terahertz signal transmis-sion. Appl. Phys. Lett., 90(6):061111, 2007.
[171] Tae-In Jeon and D. Grischkowsky. THz Zenneck surface wave(THz surface plasmon) propagation on a metal sheet. Appl. Phys.Lett., 88(6):061113–3, February 2006.
[172] Mufei Gong, Tae-In Jeon, and D. Grischkowsky. THz surface wavecollapse on coated metal surfaces. Opt. Express, 17(19):17088–17101, September 2009.
[173] S. P. Jamison, R. W. McGowan, and D. Grischkowsky. Single-mode waveguide propagation and reshaping of sub-ps terahertzpulses in sapphire fibers. Appl. Phys. Lett., 76(15):1987–1989,2000.
[174] H. Han, H. Park, M. Cho, and J. Kim. Terahertz pulse propagationin a plastic photonic crystal fiber. Appl. Phys. Lett., 80(15):2634–2636, 2002.
[175] Masahiro Goto, Alex Quema, Hiroshi Takahashi, Shingo Ono, andNobuhiko Sarukura. Teflon photonic crystal fiber as terahertzwaveguide. Jpn. J. Appl. Phys., 43(2B):L317–L319, 2004.
[176] Kristian Nielsen, Henrik K. Rasmussen, Peter Uhd Jepsen, andOle Bang. Broadband terahertz fiber directional coupler. Opt.Lett., 35(17):2879–2881, September 2010.
[177] Kristian Nielsen, Henrik K. Rasmussen, Peter Uhd Jepsen, andOle Bang. Porous-core honeycomb bandgap THz fiber. Opt. Lett.,36(5):666–668, Mar 2011.
[178] Maksim Skorobogatiy and Alexandre Dupuis. Ferroelectric all-polymer hollow Bragg fibers for terahertz guidance. Appl. Phys.Lett., 90(11):113514, 2007.
[179] Shaghik Atakaramians, Shahraam Afshar V., Heike Ebendorff-Heidepriem, Michael Nagel, Bernd M. Fischer, Derek Abbott, andTanya M. Monro. THz porous fibers: design, fabrication and ex-perimental characterization. Opt. Express, 17(16):14053–15062,Aug 2009.
[180] R. Mendis and D. Grischkowsky. Plastic ribbon thz waveguides.J. Appl. Phys., 88(7):4449–4451, 2000.
Bibliography 151
[181] Rajind Mendis. Nature of subpicosecond terahertz pulse propa-gation in practical dielectric-filled parallel-plate waveguides. Opt.Lett., 31(17):2643–2645, Sep 2006.
[182] D. G. Cooke and P. U. Jepsen. Optical modulation of terahertzpulses in a parallel plate waveguide. Opt. Express, 16(19):15123–15129, Sep 2008.
[183] Rajind Mendis. THz transmission characteristics of dielectric-filledparallel-plate waveguides. J. Appl. Phys., 101(8):083115, 2007.
[184] N. Marcuvitz. Waveguide handbook. Peregrinus, London, 1986.
[185] C.A. Balanis. Advanced engineering electromagnetics. Wiley, 1989.
[186] Xiaofei Lu, Nicholas Karpowicz, and X.-C. Zhang. Broadbandterahertz detection with selected gases. J. Opt. Soc. Am. B,26(9):A66–A73, Sep 2009.
[187] Raymond A. Serway. Principles of Physics (2nd ed.). SaundersCollege, Fort Worth, Texas; London, 1998.
[188] S. Coleman and D. Grischkowsky. A THz transverse electro-magnetic mode two-dimensional interconnect layer incorporatingquasi-optics. Appl. Phys. Lett., 83(18):3656–3658, 2003.
[189] S. Ramo, J. R. Whinnery, and T. V. Duzer. Field and Waves inCommunications, Third Edition. Wiley, 1993.
[190] Rudiger Paschotta. Encyclopedia of Laser Physics and Technology.Wiley, 2008.
[191] R. A. Cheville and D. Grischkowsky. Time domain terahertz im-pulse ranging studies. Appl. Phys. Lett., 67(14):1960–1962, 1995.
[192] R.A. Cheville, R.W. McGowan, and D.R. Grischkowsky. Late-time target response measured with terahertz impulse ranging.Antennas and Propagation, IEEE Transactions on, 45(10):1518–1524, oct 1997.
[193] X.J. Zhong, T.J. Cui, Z. Li, Y.B. Tao, and H. Lin. Terahertz-wavescattering by perfectly electrical conducting objects. J. ELEC-TROMAGNET. WAVE., 21(15):2331–2340, 2007.

Bibliography Appendix A. Ph.D. Publications
[194] Jeremy Pearce and Daniel M Mittleman. Scale model experimen-tation: using terahertz pulses to study light scattering. Physics inMedicine and Biology, 47(21):3823, 2002.
[195] Jeremy Pearce and Daniel M Mittleman. Using terahertz pulses tostudy light scattering. Physica B: Condensed Matter, 338(1-4):92– 96, 2003. Proceedings of the Sixth International Conferenceon Electrical Transport and Optical Properties of InhomogeneousMedia.
[196] J. Waldman, H. R. Fetterman, P. E. Duffy, T. G. Bryant, andTannenwald P. E. Submillimeter model measurements and theirapplications to millimeter radar systems. Proceedings of the FourthInternational Conference on Infrared and Near-Millimeter Waves,pages 49 – 50, 1979.
[197] K. McClatchey, M. T. Reiten, and R. A. Cheville. Time resolvedsynthetic aperture terahertz impulse imaging. Appl. Phys. Lett.,79(27):4485–4487, 2001.
[198] M. J. Coulombe, T. Horgan, J. Waldman, G. Szatkowski, andNixon W. A 524 GHz polarimetric compact range for scale modelrcs measurements. Proc. Antenna Meas. Tech. Assoc., 1999.
[199] J. Waldman T. M. Goyette, J. C. Dickinson and W. E. Nixon. A1.56 THz compact radar range for W-band imagery of scale-modeltactical targets. Proc. SPIE, Algorithms for Synthetic ApertureRadar Imagery VII, 4053:615, 2000.
[200] Andriy A. Danylov, Thomas M. Goyette, Jerry Waldman,Michael J. Coulombe, Andrew J. Gatesman, Robert H. Giles,Xifeng Qian, Neelima Chandrayan, Shivashankar Vangala, Kro-ngtip Termkoa, William D. Goodhue, and William E. Nixon. Ter-ahertz inverse synthetic aperture radar (ISAR) imaging with aquantum cascade laser transmitter. Opt. Express, 18(15):16264–16272, Jul 2010.
[201] E. F. Knott. Radar cross section measurements. Van NostrandReinhold, New York, 1993.
[202] D. L. Mensa. High resolution radar cross-section imaging. ArtechHouse, 1991.

Bibliography 153
[203] Gustav Mie. Beitrage zur optik truber medien, speziell kolloidalermetallosungen. Annalen der Physik, 330(3):377–445, 1908.
[204] M. Born and E. Wolf. ”Diffraction by a Conducting Sphere; Theoryof Mie.” Chapter 13.5 in Principles of Optics: ElectromagneticTheory of Propagation, Interference, and Diffraction of Light, 7thed. Cambridge University Press, Cambridge, England, 1999.
[205] Herman T. Gabor. Fundamentals of Computerized Tomography.Springer, 2nd edition, 2010.
[206] A. C. Kak and Malcolm Slaney. Principles of Computerized To-mographic Imaging. IEEE Press, 1988.
[207] Bradley Ferguson, Shaohong Wang, Doug Gray, Derek Abbot,and X.-C. Zhang. T-ray computed tomography. Opt. Lett.,27(15):1312–1314, Aug 2002.
[208] Takashi Yasuda, Takeshi Yasui, Tsutomu Araki, and EmmanuelAbraham. Real-time two-dimensional terahertz tomography ofmoving objects. Opt. Commun., 267(1):128–136, November 2006.
[209] A. Brahm, M. Kunz, S. Riehemann, G. Notni, and A. Tanner-mann. Volumetric spectral analysis of materials using terahertz-tomography techniques. Appl. Phys. B: Lasers Opt., 100(1):151–158, 2010.
[210] S Wang and X-C Zhang. Pulsed terahertz tomography. J. Phys.D: Appl. Phys., 37(4):R1, 2004.
[211] B. Recur, A. Younus, S. Salort, P. Mounaix, B. Chassagne, P. Des-barats, J.-P. Caumes, and E. Abraham. Investigation on recon-struction methods applied to 3D terahertz computed tomography.Opt. Express, 19(6):5105, March 2011.
[212] Jeremy Pearce, Hyeokho Choi, Daniel M. Mittleman, Jeff White,and David Zimdars. Terahertz wide aperture reflection tomogra-phy. Opt. Lett., 30(13):1653–1655, July 2005.
[213] D. A. Bryan, Robert Gerson, and H. E. Tomaschke. Increasedoptical damage resistance in lithium niobate. Appl. Phys. Lett.,44(9):847–849, 1984.

Bibliography Appendix A. Ph.D. Publications
[214] Dmitry Turchinovich and Jaap I. Dijkhuis. Performance of com-bined ¡100¿-¡110¿ ZnTe crystals in an amplified THz time-domainspectrometer. Opt. Commun., 270(1):96 – 99, 2007.
[215] Guozhong Zhao, Maarten ter Mors, Tom Wenckebach, and PaulC. M. Planken. Terahertz dielectric properties of polystyrene foam.J. Opt. Soc. Am. B, 19(6):1476–1479, Jun 2002.
[216] R. Bracewell. The Hilbert Transform The Fourier Transform andits Applications, 3rd ed. McGrawHill, 1999.
[217] Viktor G Veselago. The electrodynamics of substances with si-multaneously negative values of ε and µ. Soviet Physics Uspekhi,10(4):509, 1968.
[218] J. B. Pendry. Negative refraction makes a perfect lens. Phys. Rev.Lett., 85:3966–3969, Oct 2000.
[219] Nicholas Fang, Hyesog Lee, Cheng Sun, and Xiang Zhang.Subdiffraction-limited optical imaging with a silver superlens. Sci-ence, 308(5721):534–537, 2005.
[220] D. Schurig, J. J. Mock, B. J. Justice, S. A. Cummer, J. B. Pendry,A. F. Starr, and D. R. Smith. Metamaterial electromagnetic cloakat microwave frequencies. Science, 314(5801):977–980, 2006.
[221] W. J. Padilla, M. T. Aronsson, C. Highstrete, Mark Lee, A. J.Taylor, and R. D. Averitt. Electrically resonant terahertz meta-materials: Theoretical and experimental investigations. Phys. Rev.B, 75:041102, Jan 2007.
[222] R. D. Averitt, W. J. Padilla, H. T. Chen, J. F. O’Hara, A. J.Taylor, C. Highstrete, M. Lee, J. M. O. Zide, S. R. Bank, andA. C. Gossard. Terahertz metamaterial devices. Proceedings ofSPIE, 6772(1):677209, 2007.
[223] Hou-Tong Chen, John F. O’Hara, Antoinette J. Taylor, Richard D.Averitt, Clark Highstrete, Mark Lee, and Willie J. Padilla.Complementary planar terahertz metamaterials. Opt. Express,15(3):1084–1095, Feb 2007.
[224] Hou-Tong Chen, John F. O’Hara, Abul K. Azad, Antoinette J.Taylor, Richard D. Averitt, David B. Shrekenhamer, and Willie J.Padilla. Experimental demonstration of frequency-agile terahertzmetamaterials. Nat Photon, 2(5):295–298, May 2008.

Bibliography 155
[225] N. I. Landy, S. Sajuyigbe, J. J. Mock, D. R. Smith, andW. J. Padilla. Perfect metamaterial absorber. Phys. Rev. Lett.,100:207402, May 2008.
[226] Hu Tao, Nathan I. Landy, Christopher M. Bingham, Xin Zhang,Richard D. Averitt, and Willie J. Padilla. A metamaterial absorberfor the terahertz regime: design, fabrication and characterization.Opt. Express, 16(10):7181–7188, May 2008.
[227] Hu Tao, A C Strikwerda, K Fan, C M Bingham, W J Padilla,Xin Zhang, and R D Averitt. Terahertz metamaterials on free-standing highly-flexible polyimide substrates. J. Phys. D: Appl.Phys., 41(23):232004, 2008.
[228] ShengXi Li, ZhenYu Yang, Jing Wang, and Ming Zhao. Broadbandterahertz circular polarizers with single- and double-helical arraymetamaterials. J. Opt. Soc. Am. A, 28(1):19–23, Jan 2011.
[229] W. J. Padilla, A. J. Taylor, C. Highstrete, Mark Lee, and R. D.Averitt. Dynamical electric and magnetic metamaterial responseat terahertz frequencies. Phys. Rev. Lett., 96:107401, Mar 2006.
[230] Hou-Tong Chen, Willie J. Padilla, Joshua M. O. Zide, Arthur C.Gossard, Antoinette J. Taylor, and Richard D. Averitt. Active ter-ahertz metamaterial devices. Nature, 444(7119):597–600, Novem-ber 2006.
[231] Hou-Tong Chen, Willie J. Padilla, Joshua M. O. Zide, Seth R.Bank, Arthur C. Gossard, Antoinette J. Taylor, and Richard D.Averitt. Ultrafast optical switching of terahertz metamateri-als fabricated on eras/gaas nanoisland superlattices. Opt. Lett.,32(12):1620–1622, Jun 2007.
[232] John F. O’Hara, Ranjan Singh, Igal Brener, Evgenya Smirnova,Jiaguang Han, Antoinette J. Taylor, and Weili Zhang. Thin-filmsensing with planar terahertz metamaterials: sensitivity and limi-tations. Opt. Express, 16(3):1786–1795, Feb 2008.
[233] Hu Tao, C. M. Bingham, A. C. Strikwerda, D. Pilon, D. Shreken-hamer, N. I. Landy, K. Fan, X. Zhang, W. J. Padilla, and R. D.Averitt. Highly flexible wide angle of incidence terahertz metama-terial absorber: Design, fabrication, and characterization. Phys.Rev. B, 78:241103, Dec 2008.
Bibliography Appendix A. Ph.D. Publications
[234] Frank Baumann, Jr. William A. Bailey, Ahmer Naweed,William D. Goodhue, and Andrew J. Gatesman. Wet-etch opti-mization of free-standing terahertz frequency-selective structures.Opt. Lett., 28(11):938–940, Jun 2003.
[235] D.J. Shelton, J.W. Cleary, J.C. Ginn, S.L. Wadsworth, R.E. Peale,D.K. Kotter, and G.D. Boreman. Gangbuster frequency selec-tive surface metamaterials in terahertz band. Electronics Letters,44(22):1288 –1289, 23 2008.
[236] M. A. Ordal, L. L. Long, R. J. Bell, S. E. Bell, R. R. Bell, Jr.R. W. Alexander, and C. A. Ward. Optical properties of themetals Al, Co, Cu, Au, Fe, Pb, Ni, Pd, Pt, Ag, Ti, and W inthe infrared and far infrared. Appl. Opt., 22(7):1099–1119, Apr1983.
[237] AbulK. Azad and Weili Zhang. Resonant terahertz transmissionin subwavelength metallic hole arrays of sub-skin-depth thickness.Opt. Lett., 30(21):2945–2947, Nov 2005.
[238] Ranjan Singh, Carsten Rockstuhl, Falk Lederer, and Weili Zhang.The impact of nearest neighbor interaction on the resonances interahertz metamaterials. Appl. Phys. Lett., 94(2):021116, 2009.
[239] Qi-Ye Wen, Huai-Wu Zhang, Yun-Song Xie, Qing-Hui Yang,and Ying-Li Liu. Dual band terahertz metamaterial absorber:Design, fabrication, and characterization. Appl. Phys. Lett.,95(24):241111, 2009.
[240] Hu Tao, C M Bingham, D Pilon, Kebin Fan, A C Strikwerda,D Shrekenhamer, W J Padilla, Xin Zhang, and R D Averitt. Adual band terahertz metamaterial absorber. J. Phys. D: Appl.Phys., 43(22):225102, 2010.
[241] H. Wen, M. Wiczer, and A. M. Lindenberg. Ultrafast electron cas-cades in semiconductors driven by intense femtosecond terahertzpulses. Phys. Rev. B, 78:125203, Sep 2008.
[242] Matthias C. Hoffmann, Janos Hebling, Harold Y. Hwang, Ka-LoYeh, and Keith A. Nelson. THz-pump/THz-probe spectroscopyof semiconductors at high field strengths. J. Opt. Soc. Am. B,26(9):A29–A34, Sep 2009.

Bibliography 157
[243] I-Chen Ho and X.-C. Zhang. Driving intervalley scattering andimpact ionization in inas with intense terahertz pulses. Appl. Phys.Lett., 98(24):241908, 2011.
[244] Kenan Gundogdu, Katherine W. Stone, Daniel B. Turner, andKeith A. Nelson. Multidimensional coherent spectroscopy madeeasy. Chem. Phys., 341(1-3):89 – 94, 2007. Ultrafast Dynamics ofMolecules in the Condensed Phase: Photon Echoes and CoupledExcitations - A Tribute to Douwe A. Wiersma.
[245] Paul A. Tipler and Ralph A. Llewellyn. Modern Physics, 3rd Ed.W.H. Freeman, 1999.