Embed Size (px)
Citation preview

TBR—The College System of Tennessee / Spring 2018 Promise Summary Page 1
Tennessee Promise Students at Community Colleges The Fall 2015 Cohort after Five Semesters
SUMMARY The first wave of Tennessee Promise students arrived in Fall 2015, when 13,287 Promise students enrolled at community colleges. By Fall 2017, after five semesters of eligibility, 2,857 of these Promise students had earned a degree or certificate.
The overall success rate for Promise students at community colleges was 52.2%, meaning more than half of students earned a degree or certificate, transferred, or were still enrolled after five semesters. Specifically, 2,857 Promise students (21.5% of the 2015 Promise cohort) had earned a degree or certificate. Promise students earned 2,578 Associate degrees and 433 certificates, including, but not limited to:
• 199 awards in computer and information sciences, engineering, or engineering-related technology;
• 173 awards in health-related professions; and • 2,107 awards in Associate degree programs that prepare
students to transfer to a four-year university.
This summary explores key findings about the participation and success of Promise students. For example, while the number of students increased across the ACT spectrum in Fall 2015, the highest enrollment growth occurred at the lower end of the ACT score range. Additionally, three distinct groups of students have emerged, based on differences in the value of their Promise awards. Lastly, the federal financial aid application was a common barrier for participation in Promise in 2015. Recent FAFSA changes, like the ability to use the prior year’s tax information, may promote participation.
ABOUT THE 2015 PROMISE COHORT In Fall 2015, Promise encouraged greater full-time and first-time enrollment. For example, from Fall 2014 to Fall 2015, the number of first-time freshmen at community colleges grew by 24.7% (an increase of 4,300 students).
Promise Student Diversity: The first Promise cohort included students from diverse backgrounds. At community colleges:
• 55.9% of Promise students were female; • 79.3% of Promise students were white; • 11.6% of Promise students were Black; • 4.1% of Promise students were Hispanic; and • 48.3% of Promise students were Pell recipients.
Promise Awards: In Fall 2015, the average Promise award at community colleges was $588. However, 43.6% of Promise students (5,788 students) received $0 from Promise in Fall 2015, as other forms of aid covered their tuition and fees. For students who received Promise funding above $0, the average award in Fall 2015 was $1,042. Specifically:
• 28.0% of Promise students (3,715 students) received small awards, averaging $532. For these students, tuition and fees were mostly covered by other forms of aid, like the HOPE scholarship.
• 16.3% of Promise students (2,169 students) received larger awards, averaging $2,015. Students in this group accounted for 16.3% of the Promise cohort but 56% of Promise award dollars.
Female55.9%
Male44.1%
By Gender
Black11.6%
Hispanic4.1%
Other5.0%
White79.3%
By Race
No Pell51.7%
Pell48.3%
By Pell Status
Promise Students at Community Colleges

TBR—The College System of Tennessee / Spring 2018 Promise Summary Page 2
PROMISE OUTCOMES Promise encouraged greater full-time and first-time freshmen enrollment.
In Fall 2015, 87,929 students enrolled at community colleges, an increase of 865 students over Fall 2014. But
the full-time equivalent headcount grew by 3,098 students in Fall 2015. Additionally, from Fall 2014 to Fall 2015, the number of first-time freshmen grew by 24.7% at community colleges (an increase of 4,300 students).
The success rate for Promise students was higher than for non-Promise students.
At community colleges, the overall success rate for Promise students was 52.2% after five semesters. This
means more than half of the students from the first Promise cohort had earned a degree or certificate, transferred, or remained enrolled after five semesters of Promise eligibility.1
In total, 21.5% of Promise students (2,857 students) earned a degree or certificate, compared to 13.8% of students from the 2014 cohort. 2
The highest enrollment growth occurred at the lower end of the ACT score spectrum.
The average ACT score for freshmen at community colleges changed slightly, from 19.2 in Fall 2014 to 19.0
in Fall 2015. However, the number of first-time freshmen with ACT scores below 19 grew by 85.3% (an increase of 3,825 students).
1 Based on data from TBR, TSAC, THEC, and the National Student Clearinghouse. 2 Non-Promise students are defined as full-time, first-time freshmen, recent high school graduates who did not take part in Tennessee Promise in the 2015 cohort.
The success rate was highest for students who received small Promise awards.
Three distinct groups of students emerged within the first Promise cohort, based on differences in the value
of their Promise award in Fall 2015.3
Student Success by Promise Awards
Group Number
of Students
Average Promise Award
Average ACT
Score
Overall Success
Rate
Received Credential
A 5,788 $0 18.7 45.8% 16.9% B 3,715 $532 21.1 66.8% 32.3% C 2,169 $2,015 17.4 40.7% 11.3%
Success rates were highest for students who received small Promise awards in Fall 2015 (Group B). In fact, 32.3% of students in this group had earned a degree or certificate after five semesters, compared to 11.3% of students who received large Promise awards (Group C).4
Further, of the 246 students in Group C who earned a credential, 25.2% earned a short-term or long-term certificate, and 79.7% earned an Associate degree. (By comparison, of the 1,199 students in Group B who earned a credential, 93.7% earned an Associate degree.)
Recent FAFSA changes may promote greater access to Promise.
In Fall 2015, 4,791 non-Promise students enrolled at community colleges. The vast majority of these
students were eligible for Promise but did not complete key requirements for participation.
Nearly half of non-Promise students were ineligible due to issues with their financial aid application. For example, 10.7% of non-Promise students did not meet the deadline for the Free Application for Federal Student Aid (FAFSA). Additionally, 38.0% of non-Promise students did not complete the FAFSA verification process, which requires students to submit additional information about their financial aid application.
However, recent changes to the FAFSA are expected to lower some of these barriers. These changes include the earlier availability of the FAFSA application, the ability to use the prior year’s tax information, and the use of the IRS Data Retrieval tool, which pulls information directly into the application and reduces the need for verification. These changes were fully applied for the 2017-18 FAFSA, and upcoming data analysis will determine the effects of these changes for the Fall 2017 cohort.
3 Based on Fall 2015 Promise awards at community colleges. 4 An additional 1,615 Promise students received awards outside of these three groups.
23.9% 20.4% 20.6% 20.0%
12.2%10.7% 10.1% 12.5%
13.8% 18.0% 21.5%8.3%
Success Rate: 49.9%
Success Rate: 49.2%
Success Rate: 52.2% Success
Rate: 40.8%
2014 2015 Promise Non-Promise
Recent HS graduates 2015 Recent HS graduates
Success at Community Colleges
Still Enrolled Transferred Graduated
1
2
3
4
5

Tennessee Promise Students at Community CollegesThe Fall 2015 Cohort after Five Semesters

2015 Promise students at community colleges
48.3%
18.9%
4.1%
11.6%
79.3%
44.1%
55.9%
Pell Recipients
Underrepresented Minorities
Hispanic Students
Black Students
White Students
Male Students
Female Students
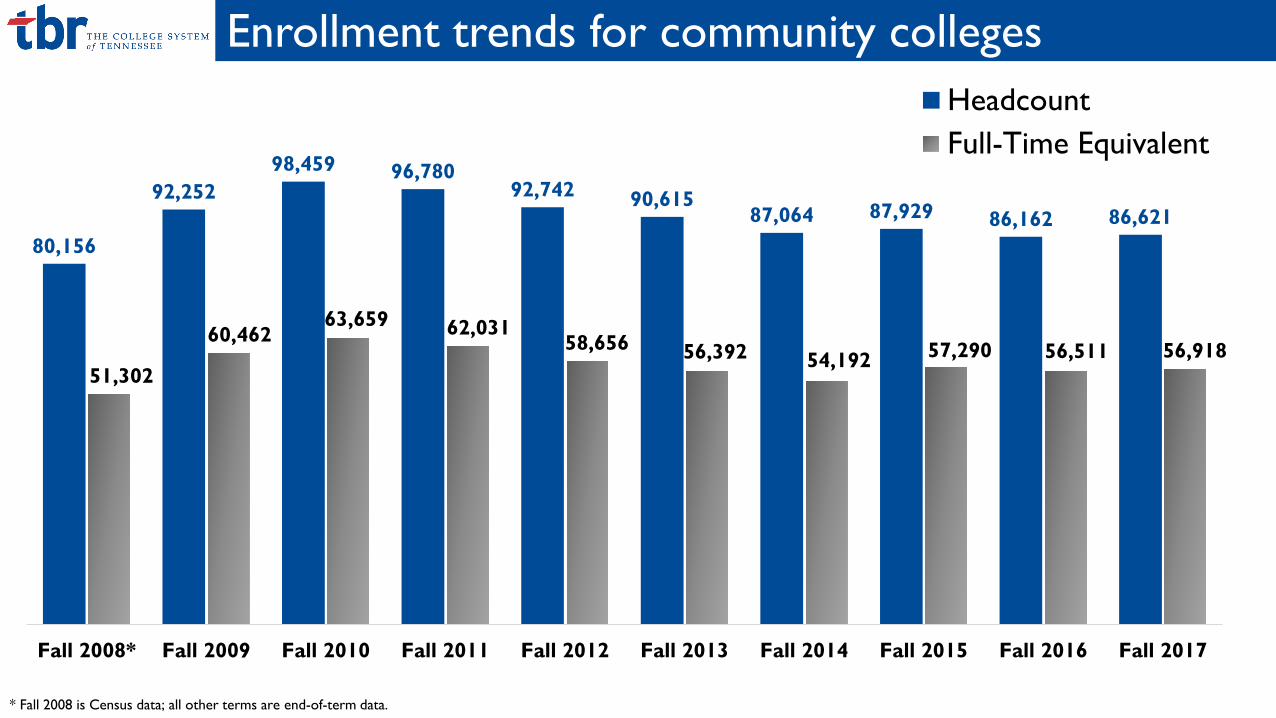
Enrollment trends for community colleges
* Fall 2008 is Census data; all other terms are end-of-term data.
80,156
92,25298,459 96,780
92,742 90,61587,064 87,929 86,162 86,621
51,302
60,46263,659 62,031
58,656 56,392 54,192 57,290 56,511 56,918
Fall 2008* Fall 2009 Fall 2010 Fall 2011 Fall 2012 Fall 2013 Fall 2014 Fall 2015 Fall 2016 Fall 2017
HeadcountFull-Time Equivalent

Enrollment by ACT scores for first-time freshmen
0
400
800
1,200
1,600
2,000
10 orless
12 14 16 18 20 22 24 26 28 30 32 34 36
Fall 2014Fall 2015
Fall 2014 Avg. ACT = 19.2
Fall 2015 Avg. ACT = 19.0
*ACT scores for first-time, full-time freshmen, recent high school graduates.
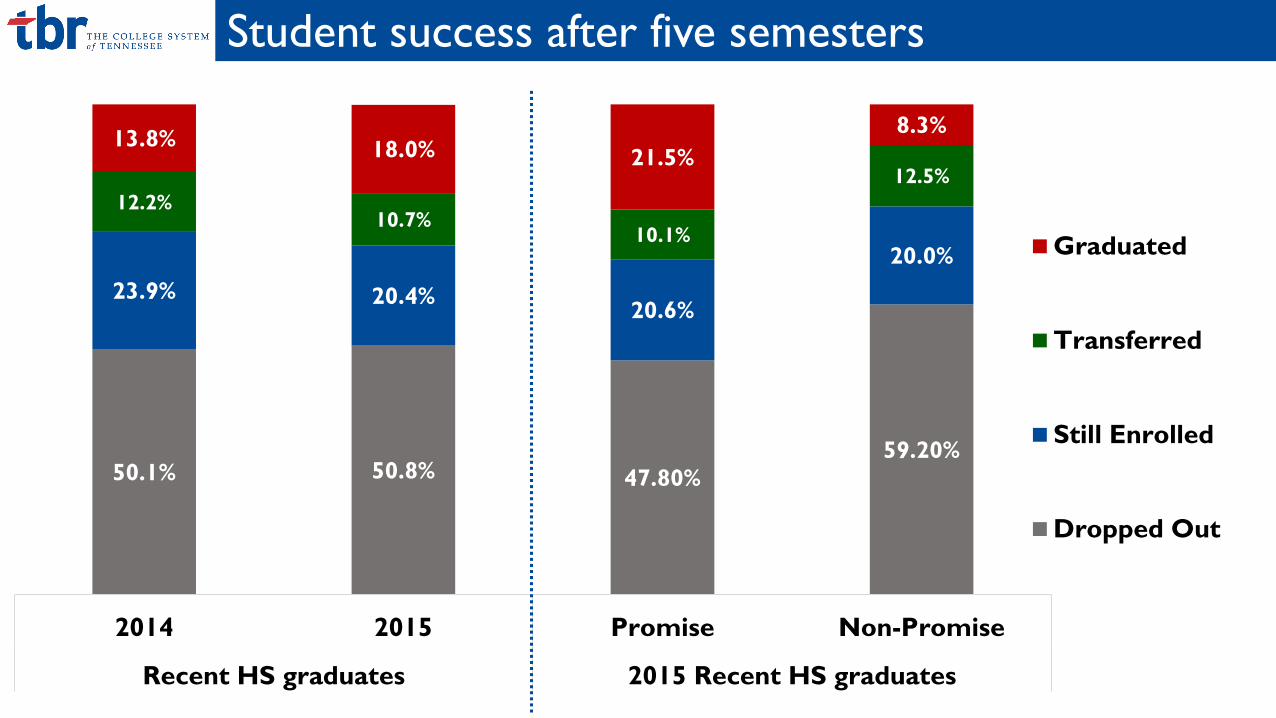
Student success after five semesters
23.9% 20.4% 20.6%
20.0%
13.8% 18.0% 21.5%8.3%
12.2%10.7%
10.1%
12.5%
50.1% 50.8% 47.80%59.20%
2014 2015 Promise Non-Promise
Recent HS graduates 2015 Recent HS graduates
Graduated
Transferred
Still Enrolled
Dropped Out

Promise student success
TN Promisestudents13,287
Awards2,857 (21.5%)
Associate + Certificate: 154 (1.2%)
Associate degree: 2,424 (18.2%)
Short-term certificate: 218 (1.6%)
Long-term certificate: 54 (0.4%)
Both certificates: 7 (0.05%)
Still enrolled,no awards
2,739 (20.6%)
Left the system7,691 (57.9%)
Transferred out: 1,335 (10.1%)
Dropped/stopped out: 6,356 (47.8%)
Overall success
rate: 52.2%

Promise Pool Average Award in Fall 2015
Number of Students Total $ amount Percent of
Promise spending
Group A $0 5,788 (43.6%) $0 0%
Group B $532 3,715 (28.0%) $1.98 million 25%
Group C $2,015 2,169 (16.3%) $4.37 million 56%
Other Every value outside of above pools 1,615 (12.1%) $1.46 million 19%
TOTAL 13,287 $7.81 million 100%
Promise award groups

Shares of each Promise group receiving other aid
20.2%
96.8%
1.3%
33.1%
0.0% 0.0%
97.9%
2.5% 0.0%
Group A Group B Group C
HOPEASPIREPell

Average ACT scores by Promise group
18.7
21.1
17.417.819.8
16.818.1
21.0
16.6
19.2
21.7
17.6
Group A Group B Group C
ACT Composite ACT Math ACT English ACT Reading
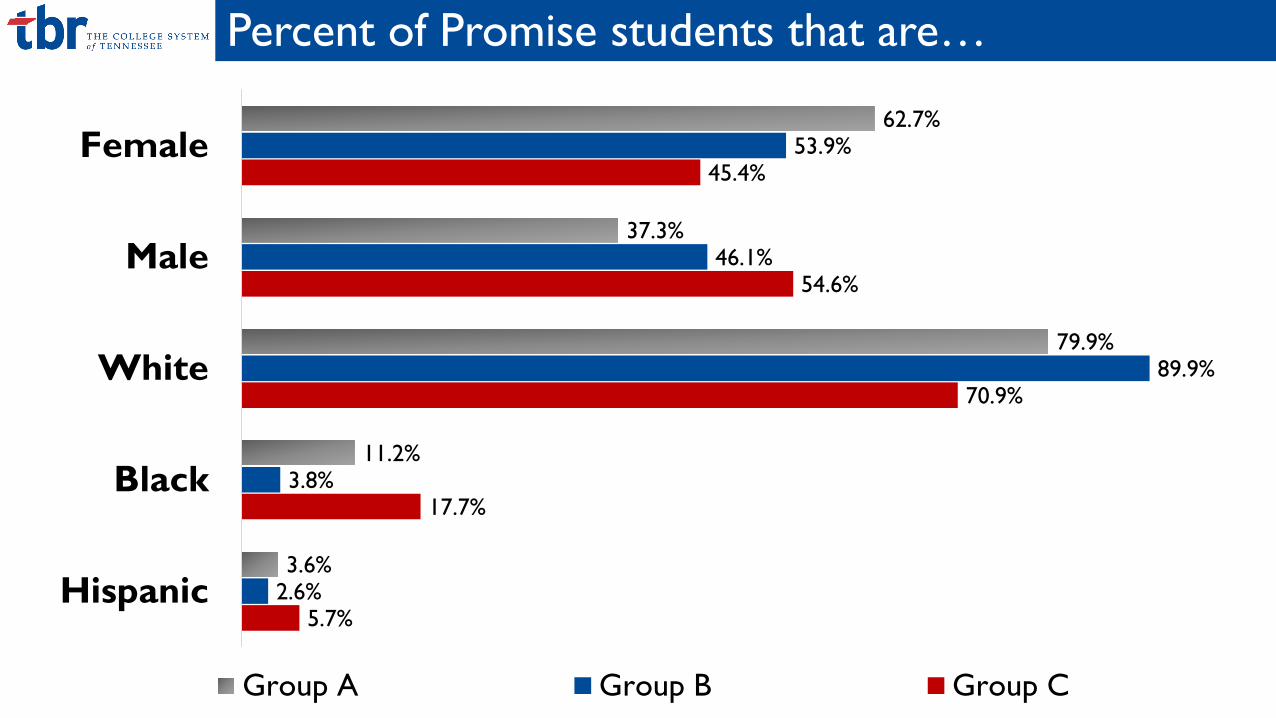
Percent of Promise students that are…
5.7%
17.7%
70.9%
54.6%
45.4%
2.6%
3.8%
89.9%
46.1%
53.9%
3.6%
11.2%
79.9%
37.3%
62.7%
Hispanic
Black
White
Male
Female
Group A Group B Group C
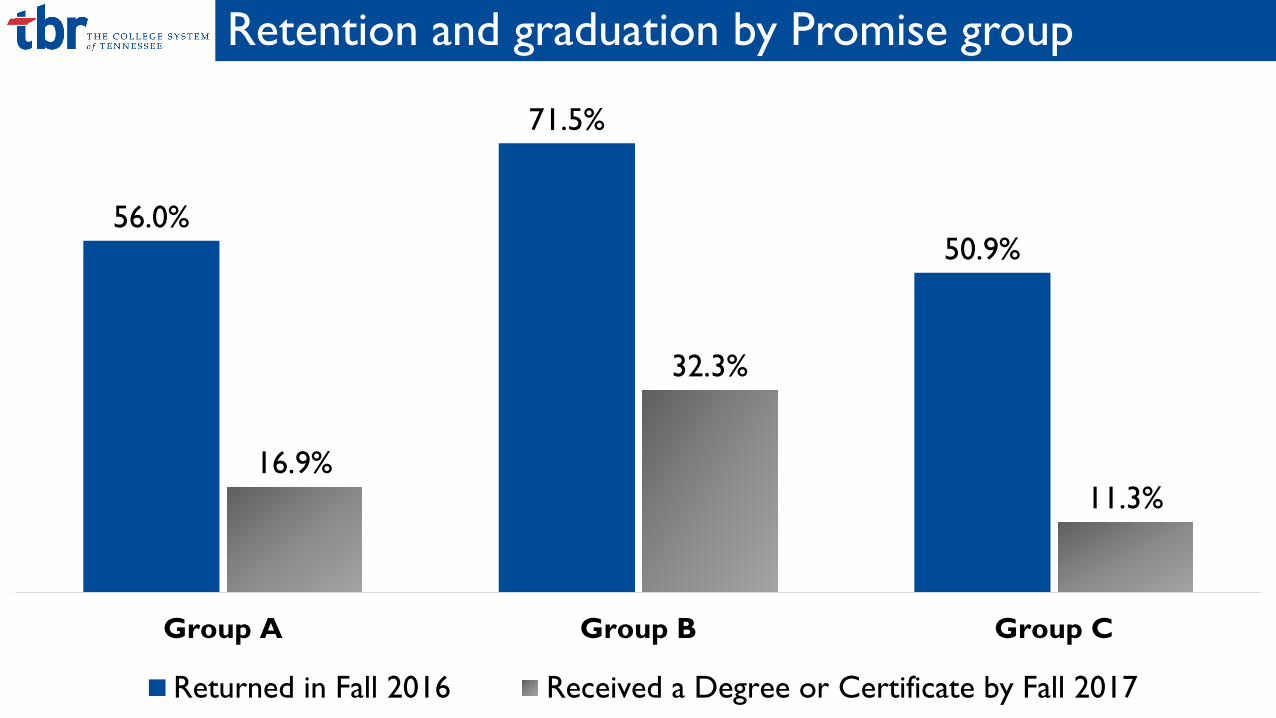
Retention and graduation by Promise group
56.0%
71.5%
50.9%
16.9%
32.3%
11.3%
Group A Group B Group C
Returned in Fall 2016 Received a Degree or Certificate by Fall 2017

Degrees and certificates earned by Promise group
89.4% 93.7%79.7%
12.7%9.9%
17.5%
3.8% 2.0%7.7%
Group A Group B Group C
Associate Degree Short-Term Certificate Long-Term Certificate

Promise and Non-Promise students at community colleges
49.0%
6.6%
29.0%
58.4%
54.7%
41.0%
4.1%
11.6%
79.3%
55.9%
First Generation
Hispanic
Black
White
Female
2015 Promise Students 2015 Non-Promise Students

Non-Promise Students at Community
Colleges
1. Did Not Meet FAFSA Deadline (February 1, 2015) 10.7%
2. Did Not Attend Meetings (January-April 2015) 16.6%
3. Did Not Complete Community Service (August 1, 2015) 13.8%
4. Did Not Complete FAFSA Verification (August 1, 2015)38%
Other Reasons for Ineligibility 20.9%
Categories of non-Promise students
*Based on analysis of 3,716 non-Promise students at community colleges, who were full-time, first-time freshmen, recent high school graduates in the Fall 2015 cohort.

Non-Promise students who are first generation
48.8%
49.5%
57.8%
45.2%
40.1%
48.8%
Other Reasons for Ineligibility
Did Not Complete FAFSA Verification
Did Not Complete Community Service
Did Not Attend Meetings
Did Not Meet FAFSA Deadline
All Non-Promise Students

$33,107
$28,053
$26,493
$39,766
$40,927
$32,044
Other Reasons for Ineligibility
Did Not Complete FAFSA Verification
Did Not Complete Community Service
Did Not Attend Meetings
Did Not Meet FAFSA Deadline
All Non-Promise Students
Average income of non-Promise students