Embed Size (px)
Citation preview
ORIGINAL RESEARCH ARTICLE Open Access
Temporal trends in healthcare resourceutilization and costs following acutemyocardial infarctionArthur Shiyovich1,2* , Harel Gilutz3, Jonathan Eli Arbelle3,4, Dan Greenberg3 and Ygal Plakht3,5
Abstract
Background: Acute myocardial infarction (AMI) is associated with greater utilization of healthcare resources andfinancial expenditure.
Objectives: To evaluate temporal trends in healthcare resource utilization and costs following AMI throughout2003–2015.
Methods: AMI patients who survived the first year following hospitalization in a tertiary medical center (SorokaUniversity Medical Center) throughout 2002–2012 were included and followed until 2015. Length of the in-hospitalstay (LOS), emergency department (ED), primary care, outpatient consulting clinic visits and other ambulatoryservices, and their costs, were evaluated and compared annually over time.
Results: Overall 8047 patients qualified for the current study; mean age 65.0 (SD = 13.6) years, 30.3% women.During follow-up, LOS and the number of primary care visits has decreased significantly. However, ED andconsultant visits as well as ambulatory-services utilization has increased. Total costs have decreased throughout thisperiod. Multivariate analysis, adjusted for potential confounders, showed as significant trend of decrease in LOS andambulatory-services utilization, yet an increase in ED visits with no change in total costs.
Conclusions: Despite a decline in utilization of most healthcare services throughout the investigated decade,healthcare expenditure has not changed. Further evaluation of the cost-effectiveness of long-term resourceallocation following AMI is warranted. Nevertheless, we believe more intense ambulatory follow-up focusing onsecondary prevention and early detection, as well as high-quality outpatient chest pain unit are warranted.
Keywords: Acute myocardial infarction; healthcare resource utilization, Costs, Temporal trends
IntroductionSurvivors of acute myocardial infarction (AMI) continueto be at greater risk and utilize more healthcare re-sources, resulting in increased economic burden [1–3].Moreover, expenditure throughout the first year follow-ing an AMI seems to be exceptionally high, estimatedbetween $22,000–$87,000 (European countries and theUnited States) [3–6]. Most aspects of AMI managementhave experienced dramatic changes throughout recentyears, including patient characteristics, presentation,
invasive procedures, medical therapy, and outcomeswhich overall have improved significantly [1, 7]. How-ever, data dealing with healthcare resource utilizationand expenditure are sparse and inconsistent [8, 9]. Theaim of the current study was to evaluate the temporaltrends in healthcare resource utilization and costsfollowing AMI.
MethodsStudy populationThe current study included patients who survived thefirst year following hospitalization with an AMI (indexadmission) throughout 1.1.2002–31.12.2012 in SorokaUniversity Medical Center and who were members ofone of the two largest insurers in Israel (Health
© The Author(s). 2020 Open Access This article is distributed under the terms of the Creative Commons Attribution 4.0International License (http://creativecommons.org/licenses/by/4.0/), which permits unrestricted use, distribution, andreproduction in any medium, provided you give appropriate credit to the original author(s) and the source, provide a link tothe Creative Commons license, and indicate if changes were made. The Creative Commons Public Domain Dedication waiver(http://creativecommons.org/publicdomain/zero/1.0/) applies to the data made available in this article, unless otherwise stated.
* Correspondence: [email protected] of Cardiology, Beilinson Hospital, Rabin Medical Center, RabinMedical Center, 39 Jabotinski Street, 49100 Petah Tikva, Israel2Sackler Faculty of Medicine, Tel Aviv University, Tel Aviv, IsraelFull list of author information is available at the end of the article
Shiyovich et al. Israel Journal of Health Policy Research (2020) 9:6 https://doi.org/10.1186/s13584-020-0364-y
Maintenance Organizations – HMOs): Maccabi Health-care Services or (Maccabi) or Clalit Health Services(Clalit). For patients who suffered more than one AMIthroughout the investigated period, the first event wasconsidered as the index event.Soroka University Medical Center is a tertiary referral
center (~ 1200 beds), serving the metropolitan area ofBeer-Sheva, Negev, southern Israel. This region com-prises approximately 60% of the area of Israel and isinhabited by more than 500,000 residents, Jews over60%. Thus, this hospital and its cardiology departmentface unique challenges: for example management ofacute myocardial infarction transferred after thrombo-lytic therapy in Eilat (the most southern city in Israel),while all other cardiology departments in Israel can pro-vide primary PCI services for STEMI.The local ethics committees of the participating
organizations approved the study, which was performedconsistently with the Helsinki declaration.
Individual follow-up and study outcomesThe personal follow-up of the study participants began 1year after the index admission (i.e. 1 year survivors) andlasted up to10 years (or until the participant’s death).The follow-up period of the study ended in 31.12.2015.Evaluation of healthcare services utilization comprisedthe following: the length of in-hospital stay, all causes,number of emergency department (ED) visits not result-ing in hospital admissions, number of primary care andoutpatient clinic visits and other ambulatory services(e.g. various ambulatory diagnostic or therapeutic proce-dures). In addition, the per-patient total cost was esti-mated by summing the costs of all the utilized services.
Data sources and classificationsData were retrieved from the participating organizations’computerized medical records. The baseline data ob-tained from the hospitals’ database included patientcharacteristics clinical evaluation and management aspreviously reported for the Soroka Acute MyocardialInfarction (SAMI-II) project [10]. Most variables wereobtained using The International Classification of Dis-eases, Ninth Revision, Clinical Modification (ICD-9-CM)discharge codes (see Appendix for examples). Further-more, the diagnosis of anemia was grouped togetherwith low hematocrit and low hemoglobin blood levels atdischarge as following: for men—hemoglobin < 13 g/dLand hematocrit < 39%; for women—hemoglobin < 12 g/dL and hematocrit < 36%. Similarly, the diagnosis ofrenal diseases included high creatinine blood levels (atdischarge) ≥1.2 mg/dL. The diagnosis of diabetes melli-tus comprised high levels of Hemoglobin A1C (greaterthan 6.5%). Diagnoses of diabetes mellitus (DM) withcomplications were classified in accordance with the
target of complications. In this way, the diagnoses ofDM with renal manifestations were defined as renal dis-eases, the diagnoses of DM with peripheral circulationmanifestations were grouped with peripheral vasculardiseases. The remaining diagnoses of DM were assignedto DM with no recorded complications.Adherence with medical therapy for the following
guideline-recommended medications: Aspirin, statins,beta blockers and angiotensin-converting-enzyme inhibi-tors (ACEi) or Angiotensin II receptor blockers (ARBs).The adherence rate was calculated based on the issuedprescriptions during the first year following hospitaldischarge and calculated consistently with the well de-scribed proportion of days covered (PDC) parameter [11].Adherence (PDC) of 80% or more for all the evaluatedmedication groups was considered as adherent [12–15].Utilization of the various healthcare services were ob-
tained from the records of the insurers. Per-patient costswere obtained for the year before the index admissionand for each year throughout the follow-up period there-after. Costs were based on the rates set by the IsraeliMinistry of Health. Costs were obtained in local cur-rency (Israeli Shekel – [ILS]) and converted to UnitedStates Dollar (USD) based on currency exchange rates (1ILS = 0.29 USD, 04.01.2020). In this context it should bementioned, that primary clinic visits mainly refers to aphysician-patient encounter while ambulatory visit in-cludes various ambulatory procedures (analyses or treat-ments) which are charged differently by the HMOs.Mortality data were obtained from the Ministry of the
Interior Population Registry.Patient-level data from the records of the above-
mentioned authorities were linked through the individ-ual personal identification number.
Statistical analysisStatistical analyses were performed with IBM SPSS Sta-tistics 25 software. Baseline characteristics of the studycohort were presented as mean and standard deviation(SD) for continuous variables and n/percent for categor-ical data. Healthcare service utilization and their costswere calculated for every year throughout 2003–2015and are presented as mean and SD. Comparisons of theinvestigated outcomes between the years throughout thestudy period were performed using Analysis of variance(ANOVA) test for linear trend in the univariate level. Inaddition, generalized estimating equations (GEE) werebuilt separately for each investigated outcome, for thepurpose of controlling for repeated measures for eachpatient. Three level models for each outcome were built.The first level model (“unadjusted”) included the variableof the study year only. The second level model includedthe variable of the study year and the personal timefollowing the AMI (follow-up period). The third level
Shiyovich et al. Israel Journal of Health Policy Research (2020) 9:6 Page 2 of 10

model included all the above variables in addition to thepatients’ baseline characteristics, healthcare serviceutilization 1 year before AMI and adherence with med-ical therapy during the first year after AMI. The resultsof the models are presented as the coefficients (B) withStandard errors (SE) and 95% confidence intervals (CI).For each test, two-sided p < 0.05 was consideredsignificant.
ResultsBaseline characteristicsThroughout 2002–2012 a total of 12,535 patientswere admitted with an AMI and screened for thecurrent study. Overall 8047 patients qualified for thestudy (mean age 64.96 ± 13.58), as the rest were ex-cluded for the following reasons: 2293 (18.3%) werenot insured by the HMOs participating in the study,930 (8.9%) died during the index admission, amongstthe survivors of the index AMI an additional 1265(13.2%) died during the first follow-up year and thuswere excluded from the study. A flowchart displayingthe number of patients as well as inclusion and exclu-sion for each year is presented in Fig. 1. Baselinecharacteristics of the patients by study year are pre-sented in Table 1.Throughout the later study years, patients’ age was
lower and the rate of male patients was greater com-pared with earlier years. The prevalence of most trad-itional cardiovascular risk factors increased (exceptdiabetes mellitus) while the prevalence of most other in-vestigated comorbidities decreased over time. Through-out the later period the rates of STEMI - ST segmentelevation myocardial infarction (STEMI) and of 3-vesselor left main coronary artery disease decreased as well.However, the rate of invasive treatments (Percutaneouscoronary intervention or/and Coronary artery bypasssurgery [PCI/CABG]) has increased. The rate of
adherence with medical therapy during the first yearafter AMI has improved significantly over time.
Trend of healthcare resources utilization and costs afterAMIHealthcare resource utilization and costs by study yearare displayed in Fig. 2. Throughout the investigated dec-ade the mean length of in-hospital stay and the numberof primary care visits decreased significantly (6.65 days2003 vs. 1.63 days 2015 and 15.6 vs. 11.1 respectively; pfor trend < 0.001 for each). During the same period, themean number of ED visits, consultant visits and ambula-tory visits increased significantly (0.03 vs. 0.34, p fortrend < 0.001; 1.2 vs. 1.5, p for trend < 0.001; 6.2 vs. 9.0,p for trend = 0.005 respectively). Mean total costs de-creased throughout the investigated period (4579 vs.3018 USD, p for trend < 0.001).
Multivariable analysisThe results of the multivariable models for each investi-gated outcome are presented in Table 2. The first levelmodels (“unadjusted”) show an increased number of ED,ambulatory and consulting clinic visits, while the yearlylength of hospital stay, number of primary care visitsand the annual total cost decreased during the studyperiod. The second level model, adjusting for time fol-lowing AMI, shows an increase in the number of EDvisits and a decrease in all other parameters. Finally, thethird level model which included all variables in additionto patients’ baseline characteristics, healthcare serviceutilization 1 year before AMI and adherence with med-ical therapy during the first year after AMI, shows a sig-nificant decrease in the length of hospital stay, primarycare visits and consultant visits, while the yearly numberof ED visits has increased and no significant change wasobserved in the ambulatory visits. No statistically signifi-cant difference was found in the adjusted total costs inthe third level model.
Fig. 1 The study flowchart: number of patients by the study year
Shiyovich et al. Israel Journal of Health Policy Research (2020) 9:6 Page 3 of 10

Table 1 The baseline characteristics of the study population by study year
Year 2003 2004 2005 2006 2007 2008 2009 2010 2011 2012 2013 2014 2015 p fortrendn 426 1233 1822 2491 3111 3695 4211 4664 5067 5482 5650 5223 2115
Demographics
Age at AMI, years;Mean (SD)
64.20(12.97)
64.09(12.96)
63.76(12.88)
63.40(12.84)
63.06(12.72)
63.02(12.88)
62.68(12.94)
62.44(12.93)
62.23(12.95)
62.09(13.00)
61.99(13.01)
61.78(12.97)
60.79(12.74)
< 0.001
Sex, Male 293(68.8)
850(68.9)
1278(70.1)
1761(70.7)
2235(71.8)
2662(72.0)
3068(72.9)
3404(73.0)
3717(73.4)
4013(73.2)
4165(73.7)
3886(74.4)
1579(74.7)
< 0.001
Muslims 85(20.0)
246(20.0)
371(20.4)
508(20.4)
642(20.6)
774(20.9)
910(21.6)
1056(22.6)
1180(23.3)
1306(23.8)
1367(24.2)
1310(25.1)
515(24.3)
< 0.001
Cardiac diseases
Supraventriculararrhythmias
46(10.8)
159(12.9)
221(12.1)
306(12.3)
373(12.0)
456(12.3)
497(11.8)
540(11.6)
570(11.2)
616(11.2)
645(11.4)
577(11.0)
223(10.5)
0.003
CHF 80(18.8)
186(15.1)
261(14.3)
341(13.7)
390(12.5)
450(12.2)
499(11.8)
525(11.3)
533(10.5)
554(10.1)
555(9.8)
486(9.3)
172(8.1)
< 0.001
Pulmonary heartdisease
13(3.1)
56(4.5)
88(4.8)
140(5.6)
162(5.2)
214(5.8)
241(5.7)
282(6.0)
307(6.1)
314(5.7)
349(6.2)
308(5.9)
109(5.2)
0.012
CIHD 305(71.6)
932(75.6)
1407(77.2)
1928(77.4)
2458(79.0)
2951(79.9)
3426(81.4)
3860(82.8)
4205(83.0)
4565(83.3)
4761(84.3)
4447(85.1)
1820(86.1)
< 0.001
AV block 14(3.3)
42(3.4)
68(3.7)
92(3.7)
111(3.6)
118(3.2)
129(3.1)
148(3.2)
159(3.1)
177(3.2)
183(3.2)
161(3.1)
63(3.0)
0.092
Cardiovascular risk factors
Renal diseases 206(48.4)
479(38.8)
640(35.1)
844(33.9)
1001(32.2)
1125(30.4)
1244(29.5)
1335(28.6)
1416(27.9)
1499(27.3)
1447(25.6)
1296(24.8)
504(23.8)
< 0.001
Diabetes Mellitus 157(36.9)
409(33.2)
598(32.8)
801(32.2)
1028(33.0)
1250(33.8)
1416(33.6)
1536(32.9)
1678(33.1)
1802(32.9)
1908(33.8)
1770(33.9)
681(32.2)
0.825
Dyslipidemia 291(68.3)
815(66.1)
1236(67.8)
1671(67.1)
2140(68.8)
2555(69.1)
2969(70.5)
3331(71.4)
3680(72.6)
4006(73.1)
4170(73.8)
3871(74.1)
1563(73.9)
< 0.001
Hypertension 200(46.9)
648(52.6)
929(51.0)
1252(50.3)
1556(50.0)
1872(50.7)
2114(50.2)
2368(50.8)
2575(50.8)
2796(51.0)
2921(51.7)
2670(51.1)
1074(50.8)
0.253
Obesity 87(20.4)
255(20.7)
369(20.3)
535(21.5)
683(22.0)
849(23.0)
1001(23.8)
1145(24.5)
1254(24.7)
1368(25.0)
1414(25.0)
1302(24.9)
553(26.1)
< 0.001
Smoking 168(39.4)
487(39.5)
770(42.3)
1064(42.7)
1359(43.7)
1617(43.8)
1896(45.0)
2110(45.2)
2313(45.6)
2524(46.0)
2616(46.3)
2451(46.9)
1030(48.7)
< 0.001
PVD 58(13.6)
165(13.4)
245(13.4)
305(12.2)
365(11.7)
411(11.1)
444(10.5)
471(10.1)
492(9.7)
501(9.1)
472(8.4)
416(8.0)
164(7.8)
< 0.001
Family history of IHD 18(4.2)
60(4.9)
109(6.0)
169(6.8)
225(7.2)
292(7.9)
351(8.3)
419(9.0)
469(9.3)
512(9.3)
543(9.6)
531(10.2)
237(11.2)
< 0.001
Other disorders
COPD 20(4.7)
79(6.4)
121(6.6)
155(6.2)
182(5.9)
206(5.6)
220(5.2)
239(5.1)
247(4.9)
261(4.8)
273(4.8)
235(4.5)
87(4.1)
< 0.001
Neurologicaldisorders
47(11.0)
139(11.3)
207(11.4)
277(11.1)
321(10.3)
399(10.8)
465(11.0)
508(10.9)
570(11.2)
623(11.4)
640(11.3)
563(10.8)
210(9.9)
0.841
Anemia 199(46.7)
576(46.7)
836(45.9)
1140(45.8)
1414(45.5)
1737(47.0)
1975(46.9)
2215(47.5)
2409(47.5)
2578(47.0)
2670(47.3)
2440(46.7)
944(44.6)
0.530
GI bleeding 6 (1.4) 20(1.6)
35(1.9)
48(1.9)
60(1.9)
61(1.7)
73(1.7)
78(1.7)
84(1.7)
94(1.7)
97(1.7)
84(1.6)
35(1.7)
0.391
Schizophrenia/Psychosis
5 (1.2) 18(1.5)
22(1.2)
40(1.6)
50(1.6)
59(1.6)
59(1.4)
62(1.3)
63(1.2)
62(1.1)
65(1.2)
54(1.0)
17(0.8)
0.001
Alcohol/drugaddiction
9(2.1)
20(1.6)
30(1.6)
48(1.9)
67(2.2)
76(2.1)
79(1.9)
90(1.9)
96(1.9)
106(1.9)
105(1.9)
97(1.9)
37(1.7)
0.743
Malignancy 8(1.9)
34(2.8)
45(2.5)
56(2.2)
69(2.2)
87(2.4)
97(2.3)
98(2.1)
106(2.1)
119(2.2)
128(2.3)
121(2.3)
43(2.0)
0.430
Administrative characteristics of the hospitalization
Shiyovich et al. Israel Journal of Health Policy Research (2020) 9:6 Page 4 of 10
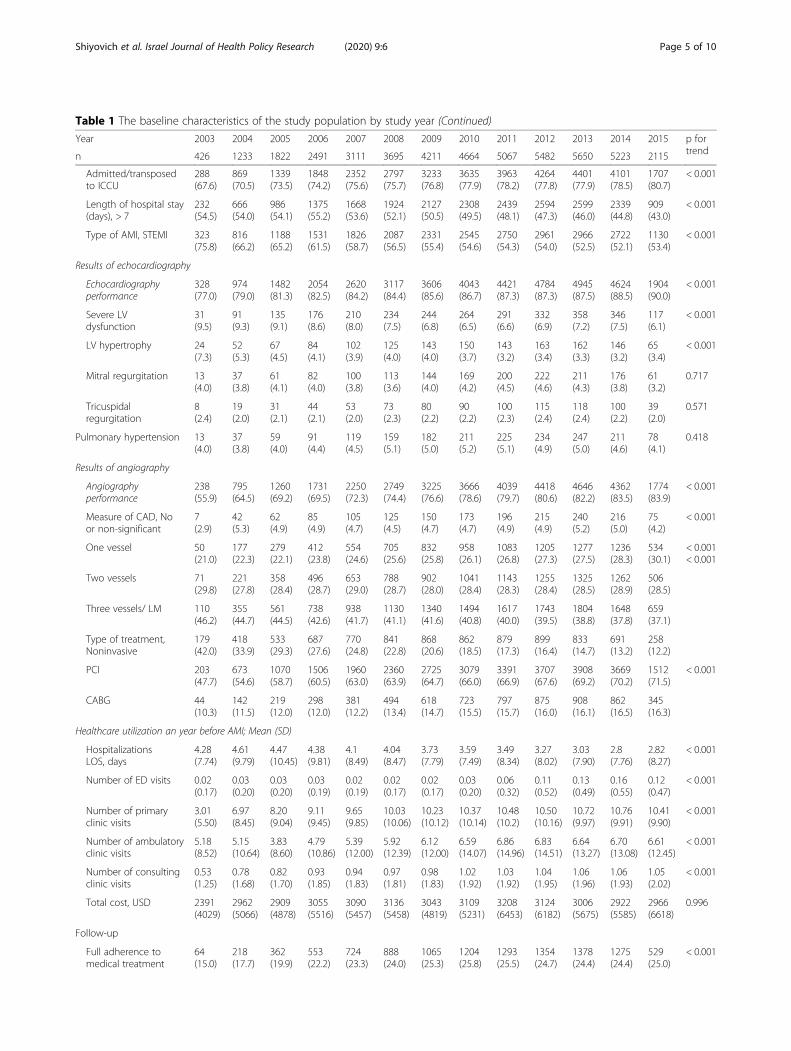
Table 1 The baseline characteristics of the study population by study year (Continued)
Year 2003 2004 2005 2006 2007 2008 2009 2010 2011 2012 2013 2014 2015 p fortrendn 426 1233 1822 2491 3111 3695 4211 4664 5067 5482 5650 5223 2115
Admitted/transposedto ICCU
288(67.6)
869(70.5)
1339(73.5)
1848(74.2)
2352(75.6)
2797(75.7)
3233(76.8)
3635(77.9)
3963(78.2)
4264(77.8)
4401(77.9)
4101(78.5)
1707(80.7)
< 0.001
Length of hospital stay(days), > 7
232(54.5)
666(54.0)
986(54.1)
1375(55.2)
1668(53.6)
1924(52.1)
2127(50.5)
2308(49.5)
2439(48.1)
2594(47.3)
2599(46.0)
2339(44.8)
909(43.0)
< 0.001
Type of AMI, STEMI 323(75.8)
816(66.2)
1188(65.2)
1531(61.5)
1826(58.7)
2087(56.5)
2331(55.4)
2545(54.6)
2750(54.3)
2961(54.0)
2966(52.5)
2722(52.1)
1130(53.4)
< 0.001
Results of echocardiography
Echocardiographyperformance
328(77.0)
974(79.0)
1482(81.3)
2054(82.5)
2620(84.2)
3117(84.4)
3606(85.6)
4043(86.7)
4421(87.3)
4784(87.3)
4945(87.5)
4624(88.5)
1904(90.0)
< 0.001
Severe LVdysfunction
31(9.5)
91(9.3)
135(9.1)
176(8.6)
210(8.0)
234(7.5)
244(6.8)
264(6.5)
291(6.6)
332(6.9)
358(7.2)
346(7.5)
117(6.1)
< 0.001
LV hypertrophy 24(7.3)
52(5.3)
67(4.5)
84(4.1)
102(3.9)
125(4.0)
143(4.0)
150(3.7)
143(3.2)
163(3.4)
162(3.3)
146(3.2)
65(3.4)
< 0.001
Mitral regurgitation 13(4.0)
37(3.8)
61(4.1)
82(4.0)
100(3.8)
113(3.6)
144(4.0)
169(4.2)
200(4.5)
222(4.6)
211(4.3)
176(3.8)
61(3.2)
0.717
Tricuspidalregurgitation
8(2.4)
19(2.0)
31(2.1)
44(2.1)
53(2.0)
73(2.3)
80(2.2)
90(2.2)
100(2.3)
115(2.4)
118(2.4)
100(2.2)
39(2.0)
0.571
Pulmonary hypertension 13(4.0)
37(3.8)
59(4.0)
91(4.4)
119(4.5)
159(5.1)
182(5.0)
211(5.2)
225(5.1)
234(4.9)
247(5.0)
211(4.6)
78(4.1)
0.418
Results of angiography
Angiographyperformance
238(55.9)
795(64.5)
1260(69.2)
1731(69.5)
2250(72.3)
2749(74.4)
3225(76.6)
3666(78.6)
4039(79.7)
4418(80.6)
4646(82.2)
4362(83.5)
1774(83.9)
< 0.001
Measure of CAD, Noor non-significant
7(2.9)
42(5.3)
62(4.9)
85(4.9)
105(4.7)
125(4.5)
150(4.7)
173(4.7)
196(4.9)
215(4.9)
240(5.2)
216(5.0)
75(4.2)
< 0.001
One vessel 50(21.0)
177(22.3)
279(22.1)
412(23.8)
554(24.6)
705(25.6)
832(25.8)
958(26.1)
1083(26.8)
1205(27.3)
1277(27.5)
1236(28.3)
534(30.1)
< 0.001< 0.001
Two vessels 71(29.8)
221(27.8)
358(28.4)
496(28.7)
653(29.0)
788(28.7)
902(28.0)
1041(28.4)
1143(28.3)
1255(28.4)
1325(28.5)
1262(28.9)
506(28.5)
Three vessels/ LM 110(46.2)
355(44.7)
561(44.5)
738(42.6)
938(41.7)
1130(41.1)
1340(41.6)
1494(40.8)
1617(40.0)
1743(39.5)
1804(38.8)
1648(37.8)
659(37.1)
Type of treatment,Noninvasive
179(42.0)
418(33.9)
533(29.3)
687(27.6)
770(24.8)
841(22.8)
868(20.6)
862(18.5)
879(17.3)
899(16.4)
833(14.7)
691(13.2)
258(12.2)
PCI 203(47.7)
673(54.6)
1070(58.7)
1506(60.5)
1960(63.0)
2360(63.9)
2725(64.7)
3079(66.0)
3391(66.9)
3707(67.6)
3908(69.2)
3669(70.2)
1512(71.5)
< 0.001
CABG 44(10.3)
142(11.5)
219(12.0)
298(12.0)
381(12.2)
494(13.4)
618(14.7)
723(15.5)
797(15.7)
875(16.0)
908(16.1)
862(16.5)
345(16.3)
Healthcare utilization an year before AMI; Mean (SD)
HospitalizationsLOS, days
4.28(7.74)
4.61(9.79)
4.47(10.45)
4.38(9.81)
4.1(8.49)
4.04(8.47)
3.73(7.79)
3.59(7.49)
3.49(8.34)
3.27(8.02)
3.03(7.90)
2.8(7.76)
2.82(8.27)
< 0.001
Number of ED visits 0.02(0.17)
0.03(0.20)
0.03(0.20)
0.03(0.19)
0.02(0.19)
0.02(0.17)
0.02(0.17)
0.03(0.20)
0.06(0.32)
0.11(0.52)
0.13(0.49)
0.16(0.55)
0.12(0.47)
< 0.001
Number of primaryclinic visits
3.01(5.50)
6.97(8.45)
8.20(9.04)
9.11(9.45)
9.65(9.85)
10.03(10.06)
10.23(10.12)
10.37(10.14)
10.48(10.2)
10.50(10.16)
10.72(9.97)
10.76(9.91)
10.41(9.90)
< 0.001
Number of ambulatoryclinic visits
5.18(8.52)
5.15(10.64)
3.83(8.60)
4.79(10.86)
5.39(12.00)
5.92(12.39)
6.12(12.00)
6.59(14.07)
6.86(14.96)
6.83(14.51)
6.64(13.27)
6.70(13.08)
6.61(12.45)
< 0.001
Number of consultingclinic visits
0.53(1.25)
0.78(1.68)
0.82(1.70)
0.93(1.85)
0.94(1.83)
0.97(1.81)
0.98(1.83)
1.02(1.92)
1.03(1.92)
1.04(1.95)
1.06(1.96)
1.06(1.93)
1.05(2.02)
< 0.001
Total cost, USD 2391(4029)
2962(5066)
2909(4878)
3055(5516)
3090(5457)
3136(5458)
3043(4819)
3109(5231)
3208(6453)
3124(6182)
3006(5675)
2922(5585)
2966(6618)
0.996
Follow-up
Full adherence tomedical treatment
64(15.0)
218(17.7)
362(19.9)
553(22.2)
724(23.3)
888(24.0)
1065(25.3)
1204(25.8)
1293(25.5)
1354(24.7)
1378(24.4)
1275(24.4)
529(25.0)
< 0.001
Shiyovich et al. Israel Journal of Health Policy Research (2020) 9:6 Page 5 of 10

DiscussionThe current study investigated temporal trends inhealthcare resource utilization throughout more than adecade (2003–2015) among post-AMI patients. Mainfindings include: throughout the investigated periodutilization of most health-care resources, particularly thelength of hospital stay and primary clinic visits havedecreased. However, a major increase in ED visits wasobserved. The unadjusted healthcare expenditure has de-creased throughout the study period. When this analysisis adjusted for potential confounders no statistically sig-nificant change in total cost was observed.It has been widely described that AMI survivors are
prone to increased morbidity (compared to matchedgeneral population), healthcare services utilization andeconomic burden which seem to be exceptionally highthroughout the first year after the AMI followed bysome subsequent decline [2–5, 16]. We found a
significant attenuation in the length of hospitalizationsand ambulatory services utilization throughout the lastdecade yet an increase in the rate of ED visits and nochange in total cost. This finding is consistent with thefindings of Chen et al. [17] that showed a decrease inhospitalization of AMI patients (for heart failure) inMedicare beneficiaries 1998–2010 and with those ofChaudhry et al. [18] who reported a decline in the rateof recurrent AMI hospitalization between 1999 and2000. Likosky et al. [9],who investigated readmission ratewithin the first year following AMI, found no differencethroughout 1998–2008. Importantly, our analysis in-cludes all hospitalizations rather than those for a par-ticular cause, while previous reports showed that about30% of readmissions are for reasons unrelated to the ori-ginal condition [19]. In partial consistency with our find-ings, a recent report from the US found significantdifferences across the country and between different
Table 1 The baseline characteristics of the study population by study year (Continued)
Year 2003 2004 2005 2006 2007 2008 2009 2010 2011 2012 2013 2014 2015 p fortrendn 426 1233 1822 2491 3111 3695 4211 4664 5067 5482 5650 5223 2115
during the 1st year
Age in the presentyear, years; Mean (SD)
64.20(12.97)
64.74(12.95)
65.00(12.88)
65.11(12.84)
65.23(12.71)
65.64(12.82)
65.77(12.88)
66.00(12.85)
66.27(12.84)
66.55(12.83)
66.65(12.83)
66.69(12.86)
67.40(12.64)
< 0.001
Period since AMI,years; Mean (SD)
1.00(0)
1.33(0.47)
1.85(0.74)
2.28(1.05)
2.71(1.34)
3.16(1.62)
3.61(1.90)
4.08(2.17)
4.56(2.44)
4.97(2.74)
5.14(2.87)
5.37(2.75)
6.68(2.53)
< 0.001
The data are presented as n (%) unless otherwise stated. Dyslipidemia is defined as recorded diagnosis of dyslipidemia and/or average LDL level > 130 mg/dLduring the hospitalization. Anemia is defined as recorded diagnosis of anemia and/or hemoglobin level < 14 g/dL or hematocrit level < 42% for males andhemoglobin level < 12 g/dL or hematocrit level < 37% for females during a hospitalizationAbbreviations: AMI Acute myocardial infarction; AV Atrioventricular; CABG Coronary artery bypass surgery; CAD Coronary artery disease; CHF Congestive heartfailure; CIHD Chronic ischemic heart disease; COPD Chronic obstructive pulmonary disease; ED emergency department; GI Gastro-intestinal; ICCU Intensive CardiacCare Unit; IHD Ischemic heart disease; LOS length of (hospital) stay; LM Left main (artery); LV Left ventricular; PCI Percutaneous coronary intervention; PVDPeripheral vascular disease; SD standard deviation; STEMI ST segment elevation myocardial infarction; USD United States Dollars
Fig. 2 Trends of healthcare resources utilization and costs during the study period, by study year. a Length of hospital stay (days). b Number ofhospital emergency department (ED) visits (with no hospital admission). c Number of primary clinic visits. d Number of ambulatory visits. eNumber of consultant visits. f Total cost (United States Dollars - USD)
Shiyovich et al. Israel Journal of Health Policy Research (2020) 9:6 Page 6 of 10

services, in ambulatory and outpatient resourceutilization and expenditure following hospital dischargewith an AMI (31–180 days) between 1999 and 2014 [20].The current study was not designed to determine the
causes for the observed time dependent changes. How-ever, several reasons can be suggested to explain thedecline in hospitalizations and primary medicine servicesutilization. First and foremost, introduction of evidencebased treatments in the acute phase management incorpo-rated into AMI guidelines, improvements in thetimeliness, and in particularly the use of invasive revascu-larization treatments as also observed in the current study[21, 22]. Furthermore, significant improvements have beenreported in secondary prevention treatments and post dis-charge management including control of risk factors, theuse of guideline recommended medications and rehabili-tation [18, 23]. Improved post-discharge adherence withguideline recommended therapies, as observed in thecurrent study, is also an important factor which has previ-ously been reported to be associated with reduced health-care resources utilization [14]. It should be mentionedthat individual long-term healthcare resource utilizationtends to decrease after the first year post AMI [16].
However, this individual decline does not seem to be aprominent explanation for the observed trend in thecurrent study, since an adjustment for the time from theindex AMI (the second level models) was performed.A trend of increase in ED visits was observed throughout
the years, consistent with previous reports [20]. This dispar-ity in the trends of ED utilization and the other resourcescould possibly be attributed to increased awareness andcaution by the AMI survivors and their healthcare pro-viders to complaints that could be related to an acute car-diac condition. Alternatively insufficient availability of out-of-hospital services could all also cause increased frequencyof ED visits [24]. Furthermore, the exceptionally greater in-crease in the ED visits overtime should be a focus of furtherinvestigation and intervention; for example, dedicated highquality out of hospital services with utilization of high sensi-tivity troponin point-of-care essays or the establishment ofchest pain unit for such patient. In addition, a trend of in-creased age, increased prevalence of cardiovascular risk fac-tors and other comorbidity were reported among AMIpatients. The latter trends could counter-balance a trend ofreduction and support a trend of increase in healthcare re-sources (e.g. ED visits) utilization [25, 26].
Table 2 Trends of healthcare resources utilization and costs – multivariate analysis
Dependent variable Model Levela B (SE)c 95% CI (B) p
Length of hospital stay (days per patient-year) 1 − 0.075 (0.008) (−0.091; − 0.060) < 0.001
2 − 0.155 (0.009) (− 0.172; − 0.137) < 0.001
3 −0.142 (0.030) (− 0.201; − 0.083) < 0.001
ED visits (number of visits per patient-year)b 1 0.276 (0.009) (0.259; 0.293) < 0.001
2 0.277 (0.021) (0.236; 0.318) < 0.001
3 0.289 (0.014) (0.262; 0.317) < 0.001
Primary clinic visits (number of visits per patient-year) 1 −0.358 (0.026) (−0.409; − 0.307) < 0.001
2 − 0.696 (0.026) (− 0.746; − 0.645) < 0.001
3 −0.612 (0.025) (− 0.661; − 0.563) < 0.001
Ambulatory visits (number of visits per patient-year) 1 0.009 (0.004) (0.001; 0.018) 0.033
2 −0.012 (0.005) (−0.021; − 0.003) 0.008
3 0.008 (0.005) (−0.001; 0.016) 0.091
Consultant visits (number of visits per patient-year) 1 0.015 (0.003) (0.008; 0.021) < 0.001
2 −0.026 (0.004) (−0.034; − 0.019) < 0.001
3 − 0.025 (0.004) (− 0.033; − 0.017) < 0.001
Total cost (USD per patient-year) 1 −0.015 (0.005) (− 0.025; − 0.006) 0.001
2 − 0.050 (0.006) (− 0.061; − 0.040) < 0.001
3 −0.005 (0.011) (− 0.027; 0.016) 0.627a The first level models – unadjusted. The second level models - adjusted for the time following the Acute myocardial infarction (AMI). The third level models -adjusted for the time following the AMI, age (at the evaluated year), sex, nationality, utilization / cost during an year before AMI, adherence to medical treatmentduring the 1st year, type of AMI, type of treatment and comorbidities (renal diseases, diabetes mellitus, neurological disorders, anemia, supraventriculararrhythmias, Congestive heart failure, Chronic obstructive pulmonary disease and Alcohol/drug addictionb Emergency department (ED) visits with no hospital admissionc Beta coefficient represents the degree of change in the outcome variable for every 1-unit of change in the predictor variable i.e. for every increase of 1 yearthroughout the follow-up period (e.g. 2003–2004 or 2014–2015) the LOS / cost differed by B units (day / USD), on averageAbbreviations: B regression coefficient; CI confidence interval; SE standard error; USD United States Dollars
Shiyovich et al. Israel Journal of Health Policy Research (2020) 9:6 Page 7 of 10

Total annual healthcare expenditure found in thisstudy is lower than that reported in other studies [9–12].This disagreement is probably due to differences inhealthcare and insurance systems and the methodologyfor estimating healthcare expenditure. The unadjusted(the first level model) and the adjusted to time fromAMI (the second level model), total cost has shown asignificant trend of decrease throughout the evaluateddecade. However, following adjustment to multiple po-tential confounders in a multivariate model (the thirdlevel model) we did not find statistically significant dif-ferences in overall healthcare expenditure throughoutthe investigated time period. The latter findings probablymean that the unadjusted decrease in costs is explainedby the changes in patient characteristics, administeredtreatments (e.g. increase in interventional therapy) andimprovement in adherence with medical therapy. A pre-vious report, [9] found an increase of 16.5% in thehealthcare expenditure per AMI patient between theyears 1998–2008 in the US. Interestingly, the authorsfound that expenditures for skilled nursing facilities,hospice, home health agency, durable medical equip-ment, and outpatient care nearly doubled during theperiod of 31–365 days after admission. The differencescan stem from different study periods, adjustment toconfounders as well as differences in healthcare systems.A recent report that evaluated expenditure on Medicarebeneficiaries 180 days following AMI in four time pe-riods 1999–2000, 2004, 2008 and 2013–2014) found thatexpenditure increased 13.9% from 1999 to 2000, and2013,-2014, but declined 0.5% between 2008 and 2013–2014 [20]. It should however be mentioned that exclud-ing patients that died throughout the first year mighthave resulted in underestimation of costs since treatingthese patients is usually associated with increased ex-penditure [16]. This possibly had an impact over thetemporal trend of costs, especially when considering thetrend of improvement in short term survival observedduring the study period [7].Our findings should be discussed considering several
important characteristics of the Israeli health caresystem. Israel has a national health insurance financedpredominantly via progressive taxation and includes fourcompeting, non-profit health plans (HPs) which providea broad package of services determined by the govern-ment [27, 28]. The HPs provide care in the communityand purchase hospital services for their members. Never-theless, approximately 40% of health care expenditure isfinanced privately. Access to primary care physiciansand community-based specialists is good overall (traveland waiting times), although in some areas and popula-tions (e.g. Israeli Arabs) it could be insufficient resultingin excessive use of hospital services. The occupancy ratesof Israeli hospitals is one of the highest among the
Organization for Economic Co-operation and Develop-ment (OECD) countries (greater than 90%) while thelength of stay is one of the shortest (around 4 days) [27,28]. Furthermore, hospital pricing system is consideredoutdated and limits their reimbursement while pricingof novel procedures and technologies and rising.
LimitationsThe current study has several limitations. First, the studyis retrospective and based mostly on administrative data(e.g. ICD-9-CM codes) hence prone for bias resultingfrom such a design such as recording bias. Furthermore,such a design also does not enable identification of thecauses for the observed trends. Second, patients fromonly one hospital with unique characteristics, populationmix and from a unique region in Israel were evaluatedhence generalizability is limited. Third, differentiation ofcardiovascular from non-cardiovascular related health-care services utilization was not performed. Fourth, outof pocket expenses were not evaluated thus true costsare probably higher. Fifth, it is possible that unaccountedchanges, not directly related to the AMI, in patients’health throughout the individual follow-up might haveled to changes in health care utilization.
Conclusions and implicationsThe current study investigated temporal trends in health-care resource utilization and costs in post-AMI patientsthroughout 2003–2015. The study shows a significant de-crease in the length of the in-hospital stay and ambulatoryservices utilization with an increase in ED visits. Totalcosts (unadjusted or adjusted for the time following AMI),have declined. However, following adjustment for a varietyof potential confounders no significant trend was found.Further and more comprehensive studies evaluating suchtrends, mechanisms and causes behind the observed find-ings, as well as the association between hospital servicesutilization and ambulatory utilization of healthcare ser-vices and costs in general and in subgroups of interest, arewarranted, in order to improve resource allocation, patientoutcomes and maximize cost-effectiveness in the long-term management of AMI patients. Nevertheless, evenwith current findings we believe that more resources andattention should be shifted towards ambulatory follow-upfocusing on secondary prevention measures (i.e. optimalcontrol of risk factors and prudent, cost-effective, earlydetection of subsequent and recurrent manifestations ofatherosclerosis), particularly in high risk patients. Further-more, we recommend reinforcing out of hospital measuresfor high quality chest pain evaluation such as a dedicatedservice, for chest pain evaluation (e.g. outpatient chestpain units) with high sensitivity troponin point-of-care es-says and non-invasive coronary evaluation tests that wouldreduce ED visits and in-hospital evaluations.
Shiyovich et al. Israel Journal of Health Policy Research (2020) 9:6 Page 8 of 10

AppendixAppendix 1. Diagnoses and interventions according toICD-9-CM codesCoronary artery bypass graft (CABG) Z361–Z362;Thrombolytic therapy and/or Percutaneous coronary
intervention (PCI): PCI Z3601–Z3607;Renal diseases 403*, 580–591*, 7910, V420, 2504*;Obesity 278, 2780*;Gastro-intestinal hemorrhage 53,021, 5307, 53,082,
5310*, 5314*, 5316*, 5322*, 5324*,5326*, 5330*, 5322*,5334*, 5336*, 5340*, 5342*, 5344*,5346*, 53,501, 53,511,53,521, 53,531, 53,541, 53,551,53,561, 53,783, 53,784, 56,202, 56,203, 56,212, 56,213,56,985, 578*;Anemia 280–285*;Pulmonary heart disease 416*-417*;Chronic obstructive pulmonary disease 491*, 492*,
494*, 496*;Malignant neoplasm 148–208*, 230–233*;Alcohol or drug addiction 303–3050*, 3052–3059*,
V113;Neurological disorders 294*, 310*, 320–349*, 430–
438*, Z0131*;Schizophrenia and/or psychosis 295*, 298*, V110.
AcknowledgementsWe are indebted to Mr. Asaf Cohen, Maccabi Institute for Health ServicesResearch for his assistance on data preparation.
Authors’ contributionsAS drafted the manuscript. HG and YP conceived the study, all authorsparticipated in the design of the study, JEA and DG coordinated and helpedin obtaining all the data, YP performed the data preparation andmanagement and YP and AS analyzed the data. All authors read andapproved the final manuscript.
FundingThe study was supported by the funds of Maccabi Institute for HealthServices Research and The Israel National Institute for Health Policy research.The funding body had no role in the study design, data analysis andinterpretation and writing the manuscript.
Availability of data and materialsPlease contact author for data requests.
Ethics approval and consent to participateThe local ethics committees of the participating organizations andinstitutions approved the study, which was performed consistently with theHelsinki declaration. Receiving approval for informed consent was waived bethe Helsinki committee.
Consent for publicationNot applicable.
Competing interestsThe authors declare that they have no competing interests.
Author details1Department of Cardiology, Beilinson Hospital, Rabin Medical Center, RabinMedical Center, 39 Jabotinski Street, 49100 Petah Tikva, Israel. 2Sackler Facultyof Medicine, Tel Aviv University, Tel Aviv, Israel. 3Faculty of Health Sciences,Ben-Gurion University of the Negev, Beer-Sheva, Israel. 4Maccabi HealthServices, Southern Region, Beer-Sheva, Israel. 5Soroka University MedicalCenter, Beer-Sheva, Israel.
Received: 5 October 2019 Accepted: 29 January 2020
References1. Plakht Y, Gilutz H, Shiyovich A. Excess long-term mortality among hospital
survivors of acute myocardial infarction. Soroka acute myocardial infarction(SAMI) project. Public Health. 2017;143:25–36.
2. Yang E, Stokes M, Johansson S, Mellstrom C, Magnuson E, Cohen DJ, HuntP. Clinical and economic outcomes among elderly myocardial infarctionsurvivors in the United States. Cardiovasc Ther. 2016;34(6):450–9.
3. Janzon M, Henriksson M, Hasvold P, Hjelm H, Thuresson M, Jernberg T. Long-term resource use patterns and healthcare costs after myocardial infarction ina clinical practice setting: results from a contemporary nationwide registrystudy. Eur Heart J Qual Care Clin Outcomes. 2016;2(4):291–8.
4. Etemad LR, McCollam PL. Total first-year costs of acute coronary syndromein a managed care setting. J Manag Care Pharm. 2005;11(4):300–6.
5. Zhao Z, Winget M. Economic burden of illness of acute coronary syndromes:medical and productivity costs. BMC Health Serv Res. 2011;11:35.
6. Menzin J, Korn JR, Cohen J, Lobo F, Zhang B, Friedman M, Neumann PJ.Relationship between glycemic control and diabetes-related hospital costsin patients with type 1 or type 2 diabetes mellitus. J Manag Care Pharm.2010;16(4):264–75.
7. Plakht Y, Gilutz H, Shiyovich A. Temporal trends in acute myocardialinfarction: what about survival of hospital survivors? Disparities betweenSTEMI & NSTEMI remain. Soroka acute myocardial infarction II (SAMI-II)project. Int J Cardiol. 2016;203:1073–81.
8. Krumholz HM, Nuti SV, Downing NS, Normand SL, Wang Y. Mortality,hospitalizations, and expenditures for the Medicare population aged 65years or older, 1999-2013. Jama. 2015;314(4):355–65.
9. Likosky DS, Zhou W, Malenka DJ, Borden WB, Nallamothu BK, Skinner JS.Growth in medicare expenditures for patients with acute myocardialinfarction: a comparison of 1998 through 1999 and 2008. JAMA Intern Med.2013;173(22):2055–61.
10. Plakht Y, Shiyovich A, Weitzman S, Fraser D, Zahger D, Gilutz H. A new riskscore predicting 1- and 5-year mortality following acute myocardialinfarction Soroka acute myocardial infarction (SAMI) project. Int J Cardiol.2012;154(2):173–9.
11. Raebel MA, Schmittdiel J, Karter AJ, Konieczny JL, Steiner JF. Standardizingterminology and definitions of medication adherence and persistence inresearch employing electronic databases. Med Care. 2013;51(8 Suppl 3):S11–21.
12. Butler J, Arbogast PG, BeLue R, Daugherty J, Jain MK, Ray WA, Griffin MR.Outpatient adherence to beta-blocker therapy after acute myocardialinfarction. J Am Coll Cardiol. 2002;40(9):1589–95.
13. Hamood H, Hamood R, Green MS, Almog R. Determinants of adherence toevidence-based therapy after acute myocardial infarction. Eur J Prev Cardiol.2016;23(9):975–85.
14. Bansilal S, Castellano JM, Garrido E, Wei HG, Freeman A, Spettell C, Garcia-Alonso F, Lizano I, Arnold RJ, Rajda J, et al. Assessing the impact ofmedication adherence on long-term cardiovascular outcomes. J Am CollCardiol. 2016;68(8):789–801.
15. Choudhry NK, Glynn RJ, Avorn J, Lee JL, Brennan TA, Reisman L, Toscano M,Levin R, Matlin OS, Antman EM, et al. Untangling the relationship betweenmedication adherence and post-myocardial infarction outcomes: medicationadherence and clinical outcomes. Am Heart J. 2014;167(1):51–8 e55.
16. Plakht Y, Gilutz H, Arbelle JE, Greenberg D, Shiyovich A. Healthcare-serviceutilization and direct costs throughout ten years following acute myocardialinfarction: Soroka acute myocardial infarction II (SAMI II) project. Curr MedRes Opin. 2019;1:1257.
17. Chen J, Hsieh AF, Dharmarajan K, Masoudi FA, Krumholz HM. Nationaltrends in heart failure hospitalization after acute myocardial infarction forMedicare beneficiaries: 1998-2010. Circulation. 2013;128(24):2577–84.
18. Chaudhry SI, Khan RF, Chen J, Dharmarajan K, Dodson JA, Masoudi FA,Wang Y, Krumholz HM. National trends in recurrent AMI hospitalizations 1year after acute myocardial infarction in Medicare beneficiaries: 1999-2010. JAm Heart Assoc. 2014;3(5):e001197.
19. Dunlay SM, Weston SA, Killian JM, Bell MR, Jaffe AS, Roger VL. Thirty-dayrehospitalizations after acute myocardial infarction: a cohort study. AnnIntern Med. 2012;157(1):11–8.
20. Likosky DS, Van Parys J, Zhou W, Borden WB, Weinstein MC, Skinner JS.Association between Medicare expenditure growth and mortality rates in
Shiyovich et al. Israel Journal of Health Policy Research (2020) 9:6 Page 9 of 10

patients with acute myocardial infarction: a comparison from 1999 through2014. JAMA Cardiol. 2018;3(2):114–22.
21. Antman EM, Anbe DT, Armstrong PW, Bates ER, Green LA, Hand M,Hochman JS, Krumholz HM, Kushner FG, Lamas GA, et al. ACC/AHAguidelines for the management of patients with ST-elevation myocardialinfarction--executive summary: a report of the American College ofCardiology/American Heart Association task force on practice guidelines(writing committee to revise the 1999 guidelines for the Management ofPatients with Acute Myocardial Infarction). Circulation. 2004;110(5):588–636.
22. Peterson ED, Shah BR, Parsons L, Pollack CV Jr, French WJ, Canto JG, GibsonCM, Rogers WJ. Trends in quality of care for patients with acute myocardialinfarction in the National Registry of myocardial infarction from 1990 to2006. Am Heart J. 2008;156(6):1045–55.
23. Arbel Y, Matetzky S, Gavrielov-Yusim N, Shlezinger M, Keren G, Roth A, KopelE, Finkelstein A, Banai S, Klempfner R, et al. Temporal trends in all-causemortality of smokers versus non-smokers hospitalized with ST-segmentelevation myocardial infarction. Int J Cardiol. 2014;176(1):171–6.
24. Nguyen JT, Vakil K, Adabag S, Westanmo A, Madlon-Kay R, Ishani A, Garcia S,McFalls EO. Hospital readmission rates following AMI: potential interventionsto improve efficiency. South Med J. 2018;111(2):93–7.
25. Khot UN, Khot MB, Bajzer CT, Sapp SK, Ohman EM, Brener SJ, Ellis SG, LincoffAM, Topol EJ. Prevalence of conventional risk factors in patients withcoronary heart disease. Jama. 2003;290(7):898–904.
26. Plakht Y, Abu Eid A, Gilutz H, Shiyovich A. Trends of cardiovascular riskfactors in patients with acute myocardial infarction: Soroka acute myocardialinfarction II (SAMI II) project. Angiology. 2018;3319718816479:530.
27. Rosen B, Waitzberg R, Merkur S. Israel: health system review. Health SystTrans. 2015;17(6):1–212.
28. Waitzberg R, Quentin W, Daniels E, Perman V, Brammli-Greenberg S, BusseR, Greenberg D. The 2010 expansion of activity-based hospital payment inIsrael: an evaluation of effects at the ward level. BMC Health Serv Res. 2019;19(1):292.
Publisher’s NoteSpringer Nature remains neutral with regard to jurisdictional claims inpublished maps and institutional affiliations.
Shiyovich et al. Israel Journal of Health Policy Research (2020) 9:6 Page 10 of 10