Embed Size (px)
Citation preview

Old Dominion University Old Dominion University
ODU Digital Commons ODU Digital Commons
Health Services Research Dissertations College of Health Sciences
Fall 2017
Healthcare Outcomes and Resource Utilization Associated with Healthcare Outcomes and Resource Utilization Associated with
Neonatal Hypoglycemia: Analysis of Data from the HCUP Kid’s Neonatal Hypoglycemia: Analysis of Data from the HCUP Kid’s
Inpatient Database Inpatient Database
Brook T. Alemu Old Dominion University, [email protected]
Follow this and additional works at: https://digitalcommons.odu.edu/healthservices_etds
Part of the Epidemiology Commons, Maternal and Child Health Commons, and the Statistics and
Probability Commons
Recommended Citation Recommended Citation Alemu, Brook T.. "Healthcare Outcomes and Resource Utilization Associated with Neonatal Hypoglycemia: Analysis of Data from the HCUP Kid’s Inpatient Database" (2017). Doctor of Philosophy (PhD), Dissertation, Health Services Research, Old Dominion University, DOI: 10.25777/0bf0-e433 https://digitalcommons.odu.edu/healthservices_etds/11
This Dissertation is brought to you for free and open access by the College of Health Sciences at ODU Digital Commons. It has been accepted for inclusion in Health Services Research Dissertations by an authorized administrator of ODU Digital Commons. For more information, please contact [email protected].

HEALTHCARE OUTCOMES AND RESOURCE UTILIZATION ASSOCIATED WITH
NEONATAL HYPOGLYCEMIA: ANALYSIS OF DATA FROM THE HCUP KID’S
INPATIENT DATABASE
by
Brook T. Alemu
B.A. August 2007, Addis Ababa University
M.A. August 2011, Unity University
M.P.H. May 2014, Eastern Virginia Medical School
A Dissertation Submitted to the Faculty of
Old Dominion University in Partial Fulfillment of the
Requirements for the Degree of
DOCTOR OF PHILOSOPHY
HEALTH SERVICES RESEARCH
OLD DOMINION UNIVERSITY
December 2017
Approved by:
Muge Akpinar-Elci (Chair)
Matthew C. Hoch (Member)
Bonnie Van Lunen (Member)

ABSTRACT
HEALTHCARE OUTCOMES AND RESOURCE UTILIZATION ASSOCIATED WITH
NEONATAL HYPOGLYCEMIA: ANALYSIS OF DATA FROM THE HCUP KID’S
INPATIENT DATABASE
Brook T. Alemu
Old Dominion University, 2017
Chair: Dr. Muge Akpinar-Elci
Neonatal hypoglycemia is the most common metabolic abnormality in infants and is
associated with neurological damage and death. The risk of developing hypoglycemia among
infants born from diabetic mothers is even higher. Although much work has been performed
addressing issues for treatment and care, research related to neonatal hypoglycemia has been
focused on the clinical or individual level risk factors. Contextual risk factors such as hospital
characteristics, neighborhood economic status, and regional variations were not considered in
earlier studies. Additionally, although healthcare resources utilization of hypoglycemia has been
adequately addressed in the adult population, this topic has not been studied in hypoglycemic
neonates.
The overarching purpose of this dissertation was to investigate healthcare outcomes and
resource utilization related to neonatal hypoglycemia. The first purpose was to conduct a
systematic review in order to investigate whether previous studies only focused on clinical risk
factors or included a broader health service-related contextual risk factors in assessing the
determinants of neonatal hypoglycemia. The second purpose was to identify the key factors
associated with increased hospital cost associated with neonatal hypoglycemia in the United
States. The third and final purpose of the dissertation was to construct multi-level models that
include individual-level and contextual-level characteristics.

The systematic review (Project I) determined that previous studies mainly focus on the
clinical characteristics of infants and mothers. The systematic review suggested that contextual
variables should be included in future research. Project II found that increased cost was
observed, when more than five procedures were performed during the same hospitalization,
when hospital bed size was between 100 and 300 or ≥ 400, when hospital length of stay
exceeded 15 days, in teaching hospitals, in the presence of chronic conditions, comorbidities,
prematurity, and death. In project III we found that infant of diabetic mothers had more than 5-
fold increased risk of developing neonatal hypoglycemia compared to infants of non-diabetic
mothers. Infants born in urban and teaching hospitals also had significantly higher chance of
developing neonatal hypoglycemia. Project III also determined that the inclusion of the
contextual risk factors improved the final model that was constructed to predict neonatal
hypoglycemia.

iv
Copyright, 2017, by Brook T. Alemu, All Rights Reserved.

v
To Sara A., Sisay M., and Bethlehem A.

vi
ACKNOWLEDGMENTS
First and for most, I would like to thank Dr. Muge Akpinar-Elci for her willingness to
work with me as my academic advisor and dissertation chair. Thank you for taking a chance on
me and teaching me that there is always room for improvement. You always encouraged me to
push myself to a higher level of academic and professional excellence. You also led by example.
That is why we never missed our scheduled meetings throughout the Ph.D. program. Your
persistent guidance and genuine help have made my studying years very enjoyable. Thank you
for your excellent mentorship and firm yet gentle leadership.
I would like to thank Dr. Hind Beydoun for her constant guidance throughout my master
and Ph.D. program. She introduced me to the databases that I used in my dissertation. Even if
she lives in another State, she was always available to provide guidance and detailed comments
and suggestions on my work. Third, I would like to thank Dr. Matthew Hoch for his guidance on
my research projects. His door was always open to his students. He introduced me to several new
research techniques and methods that will be instrumental in my future research endeavours.
Thank you for being patient, understanding, and resourceful throughout my studying years.
Lastly, I would like to thank Dr. Bonnie Van Lunen. Although she had an extremely busy
schedule, she always makes time for her students. I was able to compete the Ph.D. program in
time, because of her constant follow-up, flexibility, and her willingness to resolve issues in a
timely manner. The Health Services Research Ph.D. program is very lucky to have a director of
such calibre. Thank you for your wholehearted assistance and effective guidance.
I completed this Ph.D. program while working at Eastern Virginia Medical School. It
would be impractical for me to complete my studies without the support of my supervisors Dr.
Daniel Sullivan and Ms. Betsy Conner. Dan was not only my supervisor. He was also my big

vii
brother and mentor who provided comfort throughout the seemingly unbearable studying years.
Betsy was also very supportive of my education. Her charm and wit made our office a fun place
to work. Thank you both for your kindness, flexibility, and support.
My family has also played a big role to help me achieve my educational goals. I would
like to thank my father Tilahun Alemu and my dear mother Sisay Milash for the many sacrifices
they have made for me. Mother, you are my true role model, source of inspiration, and example
of endurance and perseverance. I would also like to thank my big sister Bethlehem and her
husband Paul for their support and encouragement. My brothers Kirubel and Samuel, my niece
Naomi and my nephews Benjamin and Nathan deserve a heartfelt thank you for always being
welcoming and loving.
Last but not least, I would like to thank my wife Sara for her care and love. You did not
complain when I was studying on the weekends and late nights. And you were very patient with
me when I get anxious at times. You are truly a person “after my own heart.” Thank you for your
decency, unconditional love, and extraordinary personality.

viii
TABLE OF CONTENTS
Page
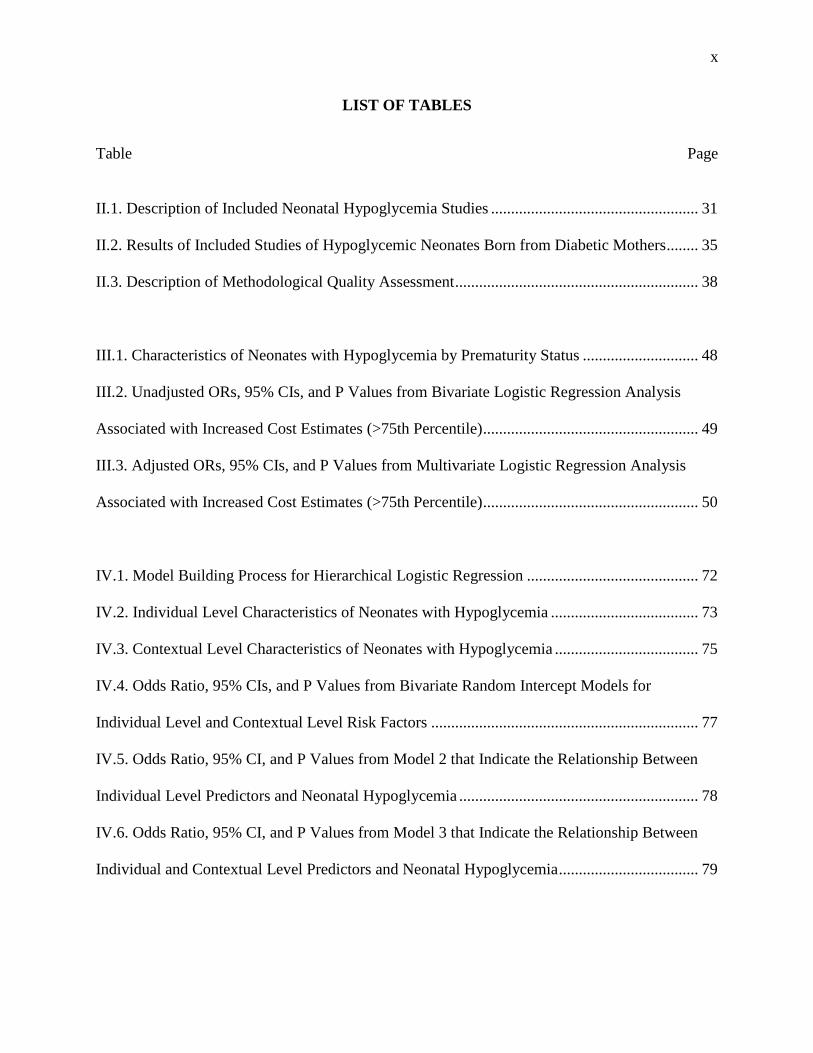
LIST OF TABLES .......................................................................................................................... x
LIST OF FIGURES ....................................................................................................................... xi
Chapter
I. INTRODUCTION ....................................................................................................................... 1
BACKGROUND .................................................................................................................. 1
STATEMENT OF THE PROBLEM ................................................................................... 3
PURPOSE OF THE STUDY ............................................................................................... 5
SIGNIFICANCE OF THE STUDY ..................................................................................... 8
SPECIFIC AIMS AND HYPOTHESES ............................................................................ 10
OPERATIONAL DEFINITIONS ...................................................................................... 11
ASSUMPTIONS ................................................................................................................ 13
DELIMITATIONS ............................................................................................................. 14
LIMITATIONS .................................................................................................................. 14
II. REVIEW OF THE LITERATURE .......................................................................................... 17
PROJECT I: NEONATAL HYPOGLYCEMIA IN DIABETIC MOTHERS: A
SYSTEMATIC REVIEW .................................................................................................. 17
INTRODUCTION .............................................................................................................. 18
METHOD ........................................................................................................................... 19
SEARCH STRATEGY ...................................................................................................... 19
DATA ABSTRACTION AND OVERALL ASSESSMENT OF STUDIES .................... 20
RESULTS ........................................................................................................................... 21
STUDY SELECTION ........................................................................................................ 21
CRITICAL APPRAISAL ................................................................................................... 22
CLINICAL SIGNIFICANCE AND RISK FACTORS OF NEONATAL
HYPOGLYCEMIA ............................................................................................................ 23
DISCUSSION .................................................................................................................... 26
CONCLUSIONS AND RECOMMENDATIONS FOR FUTURE RESEARCH ............. 29
III. PROJECT II: PREDICTORS OF HOSPITALIZATION COST IN INFANTS WITH
HYPOGLYCEMIA: ANALYSIS OF HCUP KID’S DATABASE ............................................. 41
INTRODUCTION .............................................................................................................. 41
METHODS ......................................................................................................................... 42
RESULTS ........................................................................................................................... 44
DISCUSSION .................................................................................................................... 46
CONCLUSION .................................................................................................................. 47

ix
Chapter Page
IV. PROJECT III: A MULTILEVEL MODELING ANALYSIS OF PREDICTORS OF
NEONATAL HYPOGLYCEMIA IN DIABETIC AND NON-DIABETIC MOTHERS ........... 54
INTRODUCTION .............................................................................................................. 54
MATERIALS AND METHODS ....................................................................................... 55
INCLUSION/EXCLUSION CRITERIA ........................................................................... 57
VARIABLES ...................................................................................................................... 57
STATISTICAL ANALYSIS .............................................................................................. 58
HIERARCHICAL MODELING SCHEME ....................................................................... 58
MODEL BUILDING PROCESS ....................................................................................... 59
RESULTS ........................................................................................................................... 59
DISCUSSION .................................................................................................................... 63
CONCLUSIONS AND RECOMMENDATIONS ............................................................. 69
V. CONCLUSIONS ...................................................................................................................... 80
SUMMARY AND POLICY IMPLICATIONS ................................................................. 82
REFERENCES ............................................................................................................................. 85
APPENDICES ............................................................................................................................ 105
APPENDIX A. CODES FOR THE IDENTIFICATION OF VARIABLES ................... 105
APPENDIX B: SINGLE-LEVEL VERSUS MULTI-LEVEL MODELS ....................... 106
VITA ... ....................................................................................................................................... 108
x
LIST OF TABLES
Table Page
II.1. Description of Included Neonatal Hypoglycemia Studies .................................................... 31
II.2. Results of Included Studies of Hypoglycemic Neonates Born from Diabetic Mothers........ 35
II.3. Description of Methodological Quality Assessment ............................................................. 38
III.1. Characteristics of Neonates with Hypoglycemia by Prematurity Status ............................. 48
III.2. Unadjusted ORs, 95% CIs, and P Values from Bivariate Logistic Regression Analysis
Associated with Increased Cost Estimates (>75th Percentile) ...................................................... 49
III.3. Adjusted ORs, 95% CIs, and P Values from Multivariate Logistic Regression Analysis
Associated with Increased Cost Estimates (>75th Percentile) ...................................................... 50
IV.1. Model Building Process for Hierarchical Logistic Regression ........................................... 72
IV.2. Individual Level Characteristics of Neonates with Hypoglycemia ..................................... 73
IV.3. Contextual Level Characteristics of Neonates with Hypoglycemia .................................... 75
IV.4. Odds Ratio, 95% CIs, and P Values from Bivariate Random Intercept Models for
Individual Level and Contextual Level Risk Factors ................................................................... 77
IV.5. Odds Ratio, 95% CI, and P Values from Model 2 that Indicate the Relationship Between
Individual Level Predictors and Neonatal Hypoglycemia ............................................................ 78
IV.6. Odds Ratio, 95% CI, and P Values from Model 3 that Indicate the Relationship Between
Individual and Contextual Level Predictors and Neonatal Hypoglycemia ................................... 79

xi
LIST OF FIGURES
Figure Page
I.1. Modified Ecological Model for Risks Associated with the Development of Neonatal
Hypoglycemia ............................................................................................................................... 16
II.1. Selection Process for Including Studies in the Systematic Review ...................................... 39
III.1. Total Cost Estimates in Neonates with Hypoglycemia by Prematurity Status .................... 51
III.2. Total Cost Estimates in Neonates with Hypoglycemia by Primary Payer........................... 52
III 3. Per Capita Cost Estimates in Neonates with Hypoglycemia by Region .............................. 53

1
CHAPTER I
INTRODUCTION
Background
Health services research, among other things, examines determinants of health outcomes,
healthcare cost, and quality of care usually at the population level and may investigate parts or
the entire spectrum of care.1,2 One important aspect is understanding the healthcare outcomes and
efficient utilization of resources by including a broader spectrum of influencing factors. For
neonatal hypoglycemia, although much work has been performed addressing issues for treatment
and care3 research in the area has been focused on the clinical determinants of the condition.
Before discussing these issues in further detain, a synopsis of what neonatal hypoglycemia is and
how it affects the newborn’s health is warranted.
Neonatal hypoglycemia is the most frequently encountered metabolic disorder of
newborn infants and has been linked to various adverse health outcomes.4,5 Hypoglycemia is a
metabolic abnormality in neonates due to inability to maintain glucose homeostasis.6-8 Glucose is
an essential primary substrate for the brain and its consumption by the brain is high and as a
result, neurons and glial cells are susceptible to hypoglycemia.9-15 Therefore, glucose
homeostasis is crucial for the overall physical and neurological development of newborns.6
Throughout gestation, maternal glucose provides all the glucose for the fetus via facilitated
diffusion across the placenta according to a maternal-to-fetal glucose concentration gradient.1,6
Hypoglycemia in neonates has been recognized as a cause of serious short-term and long-term
morbidity for over 50 years.16 Several clinical conditions could be associated with neonatal stress
that could affect glucose homeostasis including infection, asphyxia, congenital heart disease,
decreased substrate availability as a result of birth defects, prematurity and fetal growth

2
restriction, islet cell hyperplasia, erythroblastosis fetalis, and Beckwith-Wiedemann
Syndrome.4,17-21 In addition, endocrine abnormalities such as pan-hypopituitarism,
hypothyroidism, adrenal insufficiency, increased glucose utilization, sepsis, and perinatal
asphyxia could also be associated with neonatal hypoglycemia.17,22 Although in most of these
neonates, hypoglycemia is transient and asymptomatic, unrecognized hypoglycemia may lead to
neonatal seizures, coma, and neurologic injury.23,24 Prolonged neonatal hypoglycemia may also
cause neuroglycopenic signs such as seizure, coma, cyanotic episodes, apnea, bradycardia or
respiratory distress, and hypothermia.4,22
The risk of developing hypoglycemia among infants born from diabetic mothers is even
higher.25-32 Although the predisposing risk factors for the development of neonatal hypoglycemia
in diabetic pregnancies are thought to be mainly related to poor maternal glycemic control,
neonatal weight at birth, and gestational age at delivery37,38, the full extent of the individual and
contextual risk factors remains unclear. Previous studies of neonatal hypoglycemia15,17-27,39-42
mainly focused on clinical risk factors such as poor maternal glycemic control, neonatal weight
at birth, and gestational age at delivery as predisposing risk factors for neonatal hypoglycemia in
diabetic pregnancies. However, contextual risk factors such as neighborhood socioeconomic
status, hospital characteristics, and regional variations were not considered in these studies.
Therefore, it is important to identify the various levels of risk factors that can predict neonatal
hypoglycemia in this vulnerable population.
In addition to leading to serious acute1,4 and chronic health problems43, neonatal
hypoglycemia also consumes a considerable amount of healthcare resources4. Although
healthcare resource utilization of hypoglycemia has been adequately addressed in the adult
population44-49, this topic has not been studied in neonates with hypoglycemia. With the current

3
increase in the overall healthcare cost in the United States, there is a strong interest to enhance
efficacy through reform and system improvement.51,51 A better understanding of factors
associated with healthcare resource utilization such as hospitalization cost and length of stay for
neonates with hypoglycemia may help hospitals improve the efficiency of the care they provide
while maintaining high quality of care.
Statement of the Problem
Estimates for neonatal hypoglycemia are between 3% and 29% of all pregnancies in the
United States.1,26 The risk of developing hypoglycemia among infants born from diabetic
mothers is even higher.25-32 Hypoglycemia occurs in approximately 8-30% of neonates born to
mothers with diabetes33,34, with an estimated incidence rate of approximately 27% among infants
born to women with diabetes compared to 3% among apparently healthy full-term infants born to
nondiabetic women.12-13 Previous studies15,17-27,39-42 mainly focused on clinical risk factors
without considering the contextual risk factors for the development of neonatal hypoglycemia. In
addition to leading to serious acute4 and chronic health problems43, neonatal hypoglycemia also
consumes a considerable amount of healthcare resources.52 With this overarching problem, this
dissertation plans to address three problem areas that will be carried out with three interrelated
but independent research projects.
Problem 1
Although the predisposing risk factors for the development of neonatal hypoglycemia in
diabetic pregnancies are thought to be mainly related to poor maternal glycemic control, neonatal
weight at birth and gestational age at delivery 37,38, the full extent of individual and contextual
level determinants of neonatal hypoglycemia remain unclear. For health services research, it is
important to investigate whether previous studies only focused on clinical risk factors or

4
included broader contextual risk factors in assessing the determinants of neonatal hypoglycemia.
Conducting the systematic review on the topic will examine, collate, and synthesize the current
collective evidence on the subject matter.
Problem 2
Although healthcare resource utilization of hypoglycemia has been adequately addressed
in the adult population44-49, this topic has not been studied in neonates with hypoglycemia.
Therefore, identifying predictors of hospital cost estimates associated with neonatal
hypoglycemia is important for efficient allocation of resources. Additionally, most cost estimate
studies use total hospital charge as a proxy measurement for actual cost.53 This may lead to
drawing unwarranted conclusions about efficiency in hospital resource utilizations.53 Therefore,
using actual cost is important to accurately identify factors associated with increased hospital
cost related to neonatal hypoglycemia.
In this regard, the Kids’ Inpatient Database provides a separate cost-to-charge-ratio data
file that will enable us to convert total hospital charge to total cost.54 This will maximize the
accuracy of the hospital cost estimation at the national level. Identifying the key factors
associated with increased hospital cost is important to improve health outcomes and minimize
hospitalization costs in these priority populations. To date, no study has been conducted to
estimate hospitalization cost and identify predictors related to neonatal hypoglycemia.
Problem 3
Neonates with hypoglycemia are prone to different acute37 and chronic health problems.43
In the short run, newborns may experience jitteriness, hypotonia, lethargy, irritability, apnea,
tachypnea, poor feeding, hypothermia, and seizures.55 Later in their life, they may experience a
neurodevelopmental delay or even death.45,46 The risk of developing hypoglycemia among

5
infants born from diabetic mothers is even higher.35,56 Research in this topic15,17-27,39-42 mainly
focused on clinical risk factors such as poor maternal glycemic control, neonatal weight at birth,
and gestational age at delivery as predisposing risk factors for the development of neonatal
hypoglycemia in diabetic pregnancies. However, contextual risk factors such as neighborhood
socioeconomic status, institutional characteristics, and regional variations were not considered in
these studies. Due to lack of adequate knowledge about the potential individual and contextual
level risk factors, the prevention of neonatal hypoglycemia has been difficult.57As a health
service researcher, one should consider the contextual risk factors that has not been included in
previous neonatal hypoglycemia research. Therefore, using multilevel models that include
individual (demographic and clinical characteristics of mothers and infants) level and contextual
(neighborhood, institutional characteristics, and regions) level characteristics in order to predict
neonatal hypoglycemia is warranted.
Purpose of the Study
The dissertation will address the three identified problems described above. Accordingly,
the first objective was to conduct a systematic review in order to investigate whether previous
studies only focused on clinical risk factors or included a broader health service-related
contextual risk factors in assessing the determinants of neonatal hypoglycemia. The second
objective was to estimate hospitalization cost and identify the key factors associated with
increased hospital cost associated with neonatal hypoglycemia in the United States. The third and
final objective of the dissertation was to construct multi-level models that include individual-
level and contextual-level characteristics in order to predict neonatal hypoglycemia in diabetic
and non-diabetic pregnancies.

6
The Social Ecological Model
This dissertation will apply the social ecological model which captures several layers of
factors that include the infant’s biology, his/her immediate family/community environment, and
the societal landscape that affects his/her development.58 Therefore, to understand the numerous
risk factors for a particular disease that affects an infant, these layers of the larger contextual or
distal factors has to be considered in addition to the immediate individual or proximal level
factors. The social ecological model was originally developed by Urie Bronfenbrenner over the
span of several years.58-61 However, Kenneth McLeroy59 and Daniel Stokols60 have also made
significant contributions to the development of the social ecological model by applying it to
other health-related topics such as health behaviors and health promotion.
Although the social ecological model has not been applied to the identification of risk
factors associated with neonatal hypoglycemia, it has been widely used in several public health
and epidemiological research and practice. This includes reproductive health65, health education,
and promotion66, environmental health66, violence prevention67, chronic diseases such as
obesity68 and diabetes.69 As practiced in these studies, while keeping the major components of
the model, necessary modifications will be made to fit the current topic.
The original social ecological model developed by Bronfenbrenner58 has five major
components that include microsystem, mesosystem, exosystem, macrosystem, and
chronosystem. These constitute the ecological environment which is conceived as a set of nested
structure, each inside the next.58 According to the theory, microsystem indicates the immediate
environment that proximal processes operate to produce and sustain the child’s development.58,59
In the dissertation, demographics, clinical, and laboratory measures are considered to be the
immediate factors in the development of neonatal hypoglycemia (Figure I.1). Mesosystem

7
comprises the linkage and process taking place between two or more settings such as the
relationship between a mother and her child.58,61 For example, the mother’s health directly
affects the health of a newborn child. Hypoglycemic neonates born from diabetic mothers are at
higher risk than those born from non-diabetic mothers mainly because of the poor health
condition of the mother.35,56 Exosystem comprises the linkages and processes taking place in two
or more settings, at least one of which does not contain the developing person, but in which
events occur that indirectly influence processes within the immediate setting in which the
developing person lives.58 The exosytem considered in this dissertation are neighborhood and
hospital characteristics that may affect neonates with hypoglycemia. Macrosystem indicates
policy and societal culture that ultimately affect the particular conditions and process occurring
in the development of a child.59-62 As indicated in Figure I.1, regional variations and
neighborhood socio-economic status are considered to be the macrosystem. The chronosystem
encompasses change or consistency over time not only in the characteristics of the child but also
in the environment in which the child lives.62 Since time is not considered in the dissertation, we
will only be focusing on the first four factors of the ecological model.
In the case of neonatal hypoglycemia, because of the intertwined relationship between the
health of the mother and the newborn, the microsystem and mesosystem are classified as
individual level characteristics (Figure I.1). Similarly, as exosystem and macrosystem are
interrelated, the two systems are classified as contextual level characteristics. Therefore, in our
current analysis, the two levels of characteristics will be examined. By combining both the
individual and contextual level characteristics, we propose to build multilevel models that can
predict the probability of developing neonatal hypoglycemia in diabetic and non-diabetic

8
mothers. As indicated in Figure I.1, the overlapping elliptical circles in the model illustrate how
factors at one level influence factors at another level.
The application of such conceptual framework will enhance the current research in
neonatal hypoglycemia by providing a broader perspective of the risk factors that were
previously limited to clinical or individual level risk factors. In addition, the application of
multilevel models, through taking complex survey design into consideration, will promote the
use of advanced statistical methodologies in other areas of health outcomes research in the
pediatric population.
Significance of the Study
For neonates to have a normal brain, adequate supply of glucose during infancy is
crucial.70 Therefore, the lack of this essential substrate at the early stage of growth may lead to
various acute4 and long term43 life-threatening medical conditions. Specific groups of newborn
infants, including infants having prematurity, macrosomia, intrauterine growth restriction,
maternal diabetes, and sepsis, are at increased risk for hypoglycemia.14,35,36 Neonatal
hypoglycemia is a highly preventable medical condition71 and yet it poses a significant threat to
the health of newborns. Due to lack of adequate knowledge about the potential individual and
contextual level risk factors, the prevention of neonatal hypoglycemia has been difficult.57
Considering these multilevel characteristics in assessing the predictors for neonatal
hypoglycemia is necessary to understand the complex interaction among various individual and
contextual level factors that determine neonatal hypoglycemia. In addition, since neonatal
hypoglycemia is strongly associated with diabetic pregnancies33,72,73, the identification of the risk
factors will also have important implications on mothers’ health through effective prevention
measures that can reduce high-risk pregnancies. It is expected that the results of the current

9
research will guide the prevention and control of adverse health outcomes associated with
hypoglycemia in these priority populations.
The use of a conceptual framework to identify predictors of neonatal hypoglycemia is
also lacking in current research on the topic. Although the primary objective of the current
dissertation is not to test a theory, the use of social ecological model58,63,64 as a conceptual
framework will help us understand the complex influencing factors associated with neonatal
hypoglycemia. The social ecological model defines complex layers of factors that affect the
development of a child. That is the interaction between factors in the child’s biology, his/her
immediate environment and the societal landscape affecting his/her development. Using a
conceptual framework in health outcomes research is a vital tool to insure that all essential risk
factors are considered.74
Identifying predictors of hospital cost associated with neonatal hypoglycemia is
important for efficient utilization and allocation of healthcare resources. However, healthcare
resource utilization of hypoglycemia has only been studied in adult populations.26-34
Furthermore, most cost estimate studies have used total hospital charge as a proxy measurement
for actual cost.53 However, this may lead to drawing unwarranted conclusions about economic
efficiency and hospital resource utilizations.53 Project II of the dissertation seeks to determine the
predictors of hospital cost estimates by using actual cost rather than using hospital charges as a
proxy for cost. In this regard, the Kids’ Inpatient Database provides a separate cost-to-charge-
ratio data file that will enable us to convert total hospital charge to total cost54. This will
maximize the accuracy of the cost estimation at the national level. Identifying the key factors
associated with increased hospital cost is important to improve health outcomes and minimize
hospitalization costs in these priority populations.

10
Overall, the results of this dissertation are expected to improve scientific knowledge
through the identification of multiple levels of risk factors based on a conceptual framework and
appropriate application of rigorous statistical methodologies. Additionally, we anticipate that the
proposed work will improve prevention of neonatal hypoglycemia and promote efficient
utilization of hospital resources. The studies included in this dissertation were conducted in
compliance with the institutional review board.
Specific Aims and Hypotheses
Aim 1: To conduct a systematic review in order to investigate whether previous studies only
focused on clinical risk factors or included a broader health service-related contextual risk
factors in assessing the determinants neonatal hypoglycemia.
Hypotheses 1: In the literature, all studies will focus on the individual level characteristics
as determining risk factors for neonatal hypoglycemia.
Aim 2: To determine the overall hospital cost estimates and identify predictors of increased
hospital cost in neonates with hypoglycemia.
Hypotheses 2.1: Healthcare outcome measures including length of stay, comorbidities,
mortality, prematurity, number of procedures, hospital bed size, chronic conditions, and
hospital teaching status will predict increased hospital cost associated with neonatal
hypoglycemia.
Hypotheses 2.2: Neonates with hypoglycemia will consume a higher percentage of
resources associated with hospital births while accounting for a smaller percentage of
hospitalization.
Aim 3: To construct multilevel models for individual and contextual predictors of neonatal
hypoglycemia among diabetic and non-diabetic pregnancies.

11
Hypotheses 3.1: Infants born from diabetic mothers have significantly higher chance of
developing hypoglycemia compared to those born from non-diabetic mothers.
Hypotheses 3.2: The addition of the contextual risk factors will enhance the predictive
power of the model that will be constructed to predict neonatal hypoglycemia in diabetic
and non-diabetic pregnancies.
Operational Definitions
Comorbidities: ICD-9-CM codes indicating any of the following medical conditions; jitteriness
(796.9), hypotonia (781.3), lethargy (799.22), apnea (786.03), tachypnea (786.06), poor feeding
(783.3), hypothermia (991.6), sepsis (995.91& 771.81), seizures (345.x), and
neurodevelopmental disorder (315.x). 75, 76
Contextual-Level Characteristics: Contextual risk factors such as neighborhood socio-economic
status, hospital characteristics, seasons, and regions.
Cost-to-Charge Ratios (CCRs): CCRs enables the conversion of actual cost from total hospital
charge (i.e. Hospital Costs = Cost-to-Charge Ratios*Total Charges).77, 78
Diagnosis Related Groups, version 24 (DRG24): A statistical system of classifying any inpatient
stay into one of originally 467 groups. DRG24 is assigned by the Centers for Medicare and
Medicaid Services DRG grouper algorithm during HCUP processing and has been available
since 2006.54
Exosystem: Comprises the linkages and processes taking place in two or more settings, at least
one of which does not contain the developing person, but in which events occur that indirectly
influence processes within the immediate setting in which the developing person lives.58, 59
Hospital File: It contains variance estimation data elements, linkage data elements, and data
elements that describe hospital characteristics.54

12
Hypoglycemia: A metabolic abnormality in neonates due to inability to maintain glucose
homeostasis.1,2
In-hospital Births: They are identified by any principal or secondary diagnosis code in the range
of V3000 to V3901 with the last two digits “00” to “01” whereby the patient is not transferred
from another acute care hospital or healthcare facility.54
Individual-level characteristics: Demographics, clinical, and laboratory measures of the mother
and the child.
Kids’ Inpatient Database (KID): KID is a database developed by the Healthcare Cost and
Utilization Project (HCUP) of the Agency for Healthcare Research and Quality (AHRQ) which
contains a sample of pediatric discharges from all community, non-rehabilitation hospitals in 44
participating States.54
Macrosystem: It indicates policy and societal culture that ultimately affect the particular
conditions and process occurring in the development of a child.58,59
Major Diagnostic Categories (MDC): Obtained by classifying all possible principal diagnoses
(from ICD-9-CM) into 25 mutually exclusive diagnosis areas.54
Maternal Diabetes: Diagnosis information (DX1-DX25) or Major Diagnosis Category (MDC)
are coded as ‘250.00’ to ‘250.93’ and the variable neonatal/maternal flag (NEOMAT) indicates a
maternal diagnosis (codes as ‘1’ or ‘3’).75,76
Mesosystem: Comprises the linkage and process taking place between two or more settings such
as the relationship between a mother and her child.58,59
Microsystem: Indicates the immediate environment that proximal processes operate to produce
and sustain a child’s development.58,59

13
Neonatal hypoglycemia (NH): If any of the diagnosis information (DX1-DX25) variables is
equal to ‘775.6’, the newborn infant is identified as having experienced neonatal hypoglycemia
during his or her hospital stay.75,76
The International Classification of Diseases, 9th version (ICD-9-CM): ICD-9-CM is the United
States health system's adaptation of international ICD-9 standard list of six-character
alphanumeric codes to describe diagnoses.76
Assumptions
The primary assumptions of this dissertation were the following:
For Chapter III and IV:
1. Kids’ Inpatient Database developed by the Healthcare Cost and Utilization Project of
the Agency for Healthcare Research and Quality is accurate and valid.
2. The definition of neonatal hypoglycemia is universally accepted by the medical
community.
3. All symptomatic and asymptomatic neonatal hypoglycemia were included in the
database.
4. The International Classification of Diseases, 9th version, is an accurate coding
mechanism to identify diagnosis and procedures associated with neonatal
hypoglycemia.
5. The social ecological model assumes that multiple factors influence health.63,64
6. There is a reciprocal relationship between individuals and their environments.63,64
7. Human-environment interactions can be described at varying levels of organization.64
8. All hospital participated in the Healthcare Cost and Utilization Project has proper data
entry and management systems.

14
For Chapter IV:
1. Assumptions 1-8 for Chapter III and IV
2. Individual level and contextual level characteristics encompass all potential risk factors
for the development of neonatal hypoglycemia.
Delimitations
1. Subjects are male and female neonates discharged from community, non-rehabilitation
hospitals in the United States.
2. The study will be limited to uncomplicated and complicated in-hospital births and will
not include all other pediatric cases.
3. The study will be limited to the 44 participating States in Healthcare Cost and Utilization
Project.
Limitations
For Chapter III and IV:
1. Inconsistencies in the collection of data and quality problems may hinder the use of
hospital discharge data for specific applications such as comparative analysis.79,80
2. Errors in providers’ understanding of diagnostic coding/groupings (e.g., ICD-9-CM,
DRG, MDC) may lead to misclassification.81
3. Co-morbidities (reported as secondary diagnosis codes) may be underreported,
particularly for some conditions that are not directly associated with cause of
admission.82,83
4. Only 44 states participate in the in Healthcare Cost and Utilization Project. Even in those
states that mandate hospital participation, certain types of hospitals, such as Veterans’

15
Administration and Indian Health System facilities, are typically exempt. Incomplete data
can hinder efforts to use discharge data at the State and national level.81
5. Submission of discharge data is voluntary in some states and submission of certain data
elements may be voluntary even in states that mandate hospital participation resulting in
missing data points (e.g. race and ethnicity).81

Figure I.1. Modified Ecological Model for Risks Associated with the Development of Neonatal Hypoglycemia
16

17
CHAPTER II
REVIEW OF THE LITERATURE
The purpose of this chapter is to systematically review the literature regarding whether
previous studies only focused on clinical risk factors or included broader contextual risk factors
in assessing the determinants of neonatal hypoglycemia. Chapter II (Project I), Neonatal
hypoglycemia in diabetic mothers: a systematic review, critically appraises the literature to
evaluate risk factors of neonatal hypoglycemia. PubMed and EBSCOhost search engines were
used to identify published studies. A modified STROBE statement was also used to assess
studies’ strengths, weaknesses, and generalizability. Overall, this chapter provides a synthesis of
the literature regarding the relationship between hypoglycemia and diabetic pregnancies. The
overall evidence suggested that the studies included in the systematic review mainly focused on
clinical risk factors. The reviewed risk factors were classified into two: infant-related and
mother-related. Based on the gap observed in the literature, directions for future research were
provided.

18
PROJECT I: NEONATAL HYPOGLYCEMIA IN DIABETIC MOTHERS: A
SYSTEMATIC REVIEW
Introduction
Neonatal hypoglycemia is a common metabolic abnormality in newborns due to inability
to maintain glucose homeostasis.84,85 Glucose is an essential primary substrate for the brain and
its consumption by the brain is high and as a result, neurons and glial cells are susceptible to
hypoglycemia.86,4 Therefore, glucose homeostasis is crucial for the overall physical and
neurological development of newborns.6 Throughout gestation, maternal glucose provides all the
glucose for the fetus via facilitated diffusion across the placenta according to a maternal-to-fetal
glucose concentration gradient.6 Hypoglycemia was defined by studies as early as 1937 as
“mild” (2.2–3.3 mmol/l), “moderate” (1.1–2.2 mmol/l), and “severe” (<1.1 mmol/l).7 A specific
blood glucose concentration to define neonatal hypoglycemia for infants is a subject of
controversy.8,11, 87 However, it is generally accepted that neonatal hypoglycemia is defined by a
plasma glucose level of less than 30 mg/dl or 1.65 mmol/l in the first 24 hours of life.12 To date,
hypoglycemia remains one of the major metabolic abnormalities of the newborn.13,15, 88
The most common symptoms of neonatal hypoglycemia are shakiness, tachycardia,
lethargy, and temperature irregularities.23, 39 In the presence of these symptoms, neonatal
hypoglycemia is defined as capillary plasma glucose of less than 46 mg/dl (2.6 mmol/l).23
Prolonged neonatal hypoglycemia may also cause neuroglycopenic signs such as seizure, coma,
cyanotic episodes, apnea, bradycardia or respiratory distress, and hypothermia.4, 22
Several clinical conditions could be associated with neonatal stress that could affect
glucose homeostasis of the newborn infant including infection, asphyxia, congenital heart
disease, decreased substrate availability as a result of birth defects, prematurity and fetal growth

19
restriction, islet cell hyperplasia, erythroblastosis fetalis, and Beckwith-Wiedemann
Syndrome.4,15, 17-21 In addition, endocrine abnormalities such as pan-hypopituitarism,
hypothyroidism, adrenal insufficiency, increased glucose utilization, sepsis, and perinatal
asphyxia could also be associated with neonatal hypoglycemia.17,18 Although in most of these
neonates, hypoglycemia is transient and asymptomatic, unrecognized hypoglycemia may lead to
neonatal seizures, coma, and neurologic injury.23, 41
The risk of developing hypoglycemia among infants born from diabetic mothers is even
higher.25-35 Hypoglycemia occurs in approximately 8-30% of neonates born to mothers with
diabetes33,34, with an estimated incidence rate of approximately 27% among infants born to
women with diabetes compared to 3% among apparently healthy full-term infants born to
nondiabetic women.35, 36 Although the predisposing risk factors for the development of neonatal
hypoglycemia in diabetic pregnancies are thought to be mainly related to poor maternal glycemic
control, neonatal weight at birth, and gestational age at delivery37,38, the full extent of the
individual and contextual risk factors remains unclear. In addition, to date, no systematic reviews
of the available studies exist.
Our objective is to conduct a systematic review of the literature on the risk factors for
hypoglycemia in infants of diabetic mothers. Accordingly, all relevant empirical studies on
neonatal hypoglycemia in diabetic mothers were reviewed and appraised for methodological
quality. The results were summarized in a way that informs both clinical practice and future
research.
Method
Search Strategy

20
We identified published studies using PubMed and EBSCOhost search engines. The
search was carried out by using the population, intervention, control, and outcome (PICO)
strategy. The following concepts and related key words searched in their respective PICO
category and they were finally combined together: (1) neonatal terms (‘neonate, ‘neonates’,
‘neonatal’, ‘newborn’, ‘newborns’, and ‘infant’), (2) diabetes and pregnancies terms (‘pregnancy
in diabetics’, ‘diabetic mothers’, ‘diabetic pregnancy’, ‘pregnancy in diabetes’), and outcome
terms (‘hypoglycemia’, ‘hypoglycaemia’, ‘hypoglycemic’, and ‘neonatal hypoglycemia’). We
included all empirical studies published in the English language between January 1, 2000, and
March 31, 2016. Additional studies were identified from reference lists of identified articles. The
following inclusion and exclusion criteria were used to identify relevant articles:
Inclusion criteria: (1) observational studies, (2) neonatal hypoglycemia is used as the
primary outcome of interest, (3) neonates born from type 1 (defined as blood glucose ≥11.1
mmol\l), type 2 (defined as fasting blood glucose ≥ 7.0 mmol\l or ≥11.1 mmol\l during OGTT)
or gestational diabetic mothers (defined as having at least two plasma glucose measurements
during the diagnostic test of the following OGTT glucose threshold values: 5.3 mmol/l fasting,
10.0 mmol/l at 1 hr, 8.7 mmol/l at 2 hr, and 7.8 mmol\l at 3 hr ), (4) has appropriate comparison
group, (5) neonatal hypoglycemia diagnosed within 3 days of life, and outcome defined in the
ranges of 20 to 50 mg/dl or 1.1-2.8 mmol/l.
Exclusion Criteria: (1) animal studies, (2) review articles, (3) articles published in a non-
English language, (4) articles published prior to 2000, and (5) poorly defined or no comparison
group.
Data Abstraction and Overall Assessment of Studies

21
The abstracts of all potential publications were reviewed initially by the first (B.A.) and
the second (O.O.) authors to identify eligible publications for further review. Full text screening
was made by the two authors through a detailed review of the complete text of each articles
using the inclusion/exclusion criteria as a guideline. The two authors then independently
reviewed publications that were identified for inclusion. Relevant study attributes were extracted
from the selected publications using standardized forms developed for the systematic review
project by the authors. A third author (M.A) mediated to resolve any disagreements between the
authors.
The STROBE (Strengthening the Reports of Observational Studies in Epidemiology)
Statement (checklist of items that should be included in reports of observational studies) was
used to assess studies’ strengths, weaknesses, and generalizability. An explanation and
elaboration article that discusses each checklist item and gives methodological background and
published examples of transparent reporting were used in conjunction with the STROBE
checklist.41 As most of the studies on this topic are observational, we used the STROBE checklist
as a guide to systematically evaluate the studies that were included in this review. The STROBE
checklist has 21 items with 15 items relevant to all three study designs (i.e. cohort, case-control,
and cross-sectional studies) and 4 are specific for each. However, items 1-3 (background and
objectives), 6b (for matched studies), 11(quantitative variables), and 22 (funding information)
were removed as they were not applicable to the included studies. Therefore, a modified 15-item
STROBE checklist was used to critically appraise study quality for this systematic review.
Results
Study Selection

22
A total of 1233 titles were identified on PubMed and EBSCOhost in the initial literature
search, 1202 of which were excluded by the first screening based on the title or abstract, leaving
31 articles for full-text review (Figure II.1). Thirteen of these studies met the inclusion criteria
and an additional 3 articles were included from reference lists25,33,34, resulting in 16 eligible
studies, most of which were based on observational studies (Table II.1). The main reasons for
excluding studies after full review were (i) hypoglycemia was not listed as primary outcome, (ii)
comparison group were not defined and, (iii) hypoglycemia was not defined within the specified
range of 1.7-2.8 mmol/l.
We identified four prospective cohorts, one nested case-control and ten retrospective
cohort studies that examined the various clinical risk factors for hypoglycemia in diabetic
mothers. Mother’s diabetes types included gestational diabetes mellitus (GDM), type-1 diabetes
mellitus (T1D), and type-2 diabetes mellitus (T2D). Other details on included studies are
summarized in Table II.1. A total of 13,248 infants were identified in the 16 included studies.
The key findings are described in the following section.
Critical Appraisal
The two authors agreed initially on 228 out of 240 (95%) items on the modified STROBE
checklist. All disagreements were resolved by discussion among the two reviewers. Overall, the
quality scores of the included studies ranged from 26.7% to 86.7%, with a median of 46.7%.
Included studies were classified as high quality if the individual quality scores were ≥80%,
studies were classified as moderate quality for quality scores between 79% and 60% and studies
with quality scores below 59% were classified as low quality. Accordingly, a total of five high
quality15,39,26-28, two moderate quality29,30, and nine low quality studies were identified.12,21,31,32,33-
38 The individual item, assessment responses, and quality scores can be found in Table II.3.

23
Clinical Significance and Risk Factors of Neonatal Hypoglycemia
Four prospective cohort studies21,25,91,92 examined various risk factors of hypoglycemia in
neonates of women with different diabetes type. Roux et al.25 prospectively examined glucose
levels in infants of women with GDM and the influence of maternal, gestational and peripartum
factors on the development of hypoglycemia. They found that hypoglycemic infants were more
frequently large for gestational age (LGA) (29.3% vs 11.3%), had lower umbilical cord pH (7.28
vs 7.31), and their mothers had more frequently been hyperglycemic during labor (18.8% vs
8.5%). The study obtained data from infants born in a hospital to mothers with GDM over a
period of 30 months. After adjusting for confounding factors, umbilical cord venous pH [odds
ratio (OR) 0.04, 95% Confidence Interval (CI) 0.261–0.99)] and Pakistani origin patients (OR
2.94, 95% CI 1.14 7.55) were significantly and independently associated with hypoglycemia.
Similarly, Agrawal et al.21 found that infants of mothers diagnosed with GDM or preexisting
diabetes prior to 28 weeks gestation were at a higher risk of developing hypoglycemia compared
to those with maternal diabetes diagnosed at 28 weeks gestation (OR 7.2, 95% CI 1.3-40.7).
However, there was no difference in the cord blood glucose levels between infants with or
without hypoglycemia.
Sarkar et al.91, on the other hand, examined the risk of developing hypoglycemia in
infants born to women with diet-controlled GDM (GDM-A1), insulin-requiring (GDM-A2) and
insulin-dependent diabetes (IDDM) at ≥ 36 weeks of gestation compared to infants born to
healthy controls using data obtained over a period of 16 months. They found that there is no
significant difference in the incidence of hypoglycemia in infants born to GDM-A1 (4.3%)
compared to infants born to healthy controls (4.4%). They concluded that infants born to GDM
Class A1 women at ≥ 36 weeks of gestation are not at increased risk of developing

24
hypoglycemia. On the other hand, Cordero and Landon35,36 found a 3% incidence of transient
hypoglycemia in healthy full-term infants born to nondiabetic women.
Using national data from the Swedish Medical Birth Registry, Persson et al.92,
investigated whether disproportionate body composition is a risk factor for perinatal
complications, including hypoglycemia, in LGA infants born to mothers with T1D. Their
findings showed that there was no significant difference in the risk for hypoglycemia between
proportionate LGA (OR 1.42, 95% CI 1.01-2.0) and disproportionate LGA infants (OR 1.42,
95% CI 0.97-2.08) compared to appropriate for gestational age (AGA). Disproportionate LGA
was defined as Ponderal Index (PI) >90th centile and proportionate <90th centile LGA according
to gestational age and sex. Similar results were obtained by Leperque et al.93 while Ballard et
al.94 and Bollepalli et al.95 contrasted the result. Furthermore, Ferrara et al.96 found that women
with GDM defined by American Diabetes Association (ADA) criteria had an increased risk of
having an infant with hypoglycemia (OR 2.61, 95% CI 0.99–6.92), although not statistically
significant. The study used a group practice database that included 16 hospitals and provides
medical services to approximately 3.0 million people. Their findings supported the ADA 2000
recommendations (GDM, 2000) to adopt a lower plasma glucose thresholds proposed by
Carpenter and Coustan97 for the diagnosis of GDM.
We also identified ten retrospective cohort studies and one nested case-control
study23,33,34,72,70,95,98-101 that examined the risk of developing hypoglycemia in infants born to
mothers with different diabetic conditions. Most of these observational studies were conducted
using single institution databases.
Garcia-Patterson et al.72 examined the relationship between maternal pre-pregnancy BMI
and hypoglycemia among infants born to women with GDM with a gestational age higher than

25
22 weeks using databases from a tertiary care center. Maternal pre-pregnancy BMI ≥25 kg/m2
was determined as an independent predictor of hypoglycemia irrespective of potential
intermediate variables being included in the model (OR 2.11, 95% CI 1.10–4.03) or without (OR
2.66, 95% CI 1.44–4.92). The rate of hypoglycemia in neonates was 3% (63). On the other hand,
Maayan-Metzger et al.33 examined the impact of duration of delivery room breastfeeding on
blood glucose levels (BGL) during the first hours of life among term neonates born to mothers
with GDM and to examine its relationship with hypoglycemia using a medical center database.
Among the neonates in the study group, 29 (36.7%) had at least one hypoglycemia value of <47
mg/dl, and 8 (10.1%) had a value of <40 mg/dl in the first 8 hours of life. After controlling
confounding factors such as birth weight, delivery number, and grasp evaluation, only lower cord
blood glucose significantly predicted hypoglycemia for each decrease of 10 mg/dl (OR 2.11,
95% CI 1.1–4.03). The mean glucose at the first hour of life was 56.2 mg/dl (range 28–105
mg/dl). A trend towards a higher incidence of normoglycaemia (>40 mg/dl) was recorded for the
longer duration of delivery room breastfeeding subgroup (OR 1.923, 95% CI 0.984-3.76).
However, the duration of delivery room breastfeeding did not influence the rate of
hypoglycemia. In contrast to this findings, Chertok et al.102 found that breastfed infants had a
significantly higher mean BGL (3.20 mmol/l) compared to those who were formula fed (2.68
mmol/l). One reason for the different results could arise from the definition of hypoglycemia. In
Garcia-Patterson, et al.72 hypoglycemia was defined as “normal” (≥2.6 mmol/l), “mild
hypoglycemia” (2.2–2.5 mmol/l), “moderate hypoglycemia” (1.7–2.1 mmol/l) and “severe
hypoglycemia” (1.7 mmol/l). While Chertok et al.102 defined hypoglycemia as BGL < 1.93
mmol/l and borderline hypoglycemia were 1.93–2.48 mmol/l. In addition to differences in

26
measurement, the difference in adjusting factors may have contributed to the apparent contrast in
the results.
Ramos et al.23 assessed factors associated with hypoglycemia in a cohort of pregnancies
with T2D and GDM. The incidence of hypoglycemia in this study was 18% (44/242). The
frequency of hypoglycemia between the glyburide and insulin-treated pregnancies did not differ
significantly (23% vs. 27%). Maternal age ≥35 years (OR 2.78, 95% CI 1.13–6.85) and Ponderal
Index (OR 5.59, 95% CI 1.34–23.25), a measure of fetal adiposity, significantly predicted
hypoglycemia. Similarly, Majeed et al.73 investigated if maternal glycated hemoglobin (HbA1c)
was a good predictor of hypoglycemia. As hypothesized HbA1c in late pregnancy, between 36
and 38 weeks of gestation, significantly predicted hypoglycemia in the newborn, giving an area
under the ROC curve of 0.99 with a 95% CI of 0.992 to 1. A ROC curve determined the optimal
cut-off point for maternal HbA1c level in predicting hypoglycemia, was 51 mmol/l (6.8 %).
However, various studies gave mixed results regarding the association between maternal HbA1c
and hypoglycemia. Using logistic regression Kline & Edwards 2007 also found that a third
trimester HbA1c of > 6.5% (47.54mmol/l) had a stronger association with neonatal
hypoglycemia requiring intervention when compared to maternal delivery BGLs (OR 3.89, 95%
CI 1.42-10.68). However, Taylor, et al.100 found that hypoglycemia correlates with maternal
hyperglycemia in labor, not with HbA1c during pregnancy. They found that maternal blood
glucose during labor influenced neonatal blood glucose if over 8 mmol/l.
Discussion
Neonatal hypoglycemia is the most common metabolic abnormality in newborn infants
due to the inability to maintain glucose homeostasis13,84 To date, the full extent of various risk
factors of hypoglycemia in infants of diabetic mothers are not known. Our findings are the result

27
of a systematic search for all relevant studies on hypoglycemia in diabetic mothers and critical
appraisal of methodologies and study quality assessment.
We found few prospective studies that carefully examined the clinical and demographic
risk factors of hypoglycemia among neonates. However, the majority of studies identified in our
literature review were observational retrospective design that used existing institutional
databases. As a result, after assessing studies’ strengths, weaknesses, and generalizability using
the STROBE Statement103, the overall quality of evidence was low. The clinical risk factors in
these studies can be broadly classified into two: infant-related and mother-related clinical risk
factors. The infant-related significant risk factors identified in these study were SGA,
LGA43,70,95, macrosomia, prematurity94, lower cord blood glucose33, Ponderal Index23, and male
sex101. On the other hand, mother-related significant risk factor of hypoglycemia includes
maternal hyperglycemia, ethnic origin25, diabetes diagnosed prior to 28 weeks of gestation21, pre-
pregnancy BMI ≥25 kg/m272, hyperglycemia, blood glucos100, maternal diabetes type94, and
material HbA1c.73 Although several other risk factors were considered in these studies, the
statistically significant risk factors are important for understanding the clinical management of
the study population and future studies using multilevel design of risk assessment. Irrespective of
diabetes type, it appears that infants of diabetic mothers have a higher risk of hypoglycemia
compared to those born to normal mothers.91, 96
Overall, the results of the individual studies assessed various risk factors. However, a
consistent pattern of risks of hypoglycemia among infants of diabetic mothers was not identified
which may be the result of several factors. First, as the definition of clinical significance of
hypoglycemia remains one of the contentious issues in contemporary neonatology6,8,10,37,106-109,
individual studies included in this review used different definitions of hypoglycemia ranging

28
from <1.1 mmol/l to <2.8mmol/l. The variation in the definition of hypoglycemia has an
important implication on the predictive power of individual studies. The standard of care in most
neonatology units involves close surveillance if the plasma glucose concentration is less than 2.2
mmol/l.40,73,110-116 Second, mothers included in this review were diagnosed with diabetes.
However, there was variation in the type of diabetes. The review included mothers with T1D,
T2D, GDM, which are commonly recognized.37, 106 Sarkar et al.91 pointed out that the incidence
of hypoglycemia and the associated risk factors may vary based on the specific type of diabetes.
Third, about 65% of studies identified in the review were observational studies that used existing
data collected as part of the standard of care (i.e. not for research purpose). In this regard,
collecting prospective data or using national registry data may have provided more consistent
predictors of hypoglycemia. Fourth, individual studies used different measurements of blood
glucose. Although more than 76% of studies specified their blood glucose measurement
methods, variations in these methods, measurement time, and place (laboratory vs. bedside) may
have affected the accuracy of blood glucose measurement. Similarly, a recent systematic review
identified 18 studies that examined neonatal hypoglycemia and its relationship to
neurodevelopmental outcomes found a higher rate of heterogeneity among studies.43 In our
study, we also found major clinical heterogeneity in patient characteristics, measurement of
hypoglycemia, design, and quality. As a result, statistical pooling of result to conduct a meta-
analysis was not carried out.
Overall, the majority of the studies in our review were observational in design, which
makes an inference of causality difficult, especially when different protocols were followed to
measure, handle, and analyze blood sampling. Less than a third of the studies used a prospective
design to minimize errors associated with measuring exposure. Key limitations include the

29
possibility of publication bias. As our review found both positive and negative results,
publication bias may not be a great concern for the current review. The fact that our systematic
review included studies only written in English may be another limitation. However, previous
studies have shown that language restrictions in systematic reviews have minimal effect on the
results.117,118 The fact that 47 percent of studies did not report a laboratory measurement for
confirmation of neonatal hypoglycemia and the lack of generally acceptable definition of
neonatal hypoglycemia may have affected the proper direction of the outcome. However, as all
studies followed a written clinical protocol in the management of hypoglycemia, the bias
associated with laboratory confirmation is not differential.
Conclusions and Recommendations for Future Research
In summary, there is evidence supporting the clinical importance of giving attention to
infants of diabetic mothers. Irrespective of the type of diabetes, infants of diabetic mothers have
a higher risk of developing hypoglycemia compared to those born to mothers without diabetes.
However, the studies included in this review mainly focused on the clinical characteristics of the
infants and mothers. Future research should also focus on identifying other factors that may
increase the risk of neonatal hypoglycemia such as neighborhood and institutional characteristics
including, genetics, socioeconomic status, and disparities in health care delivery. This can be
accomplished by taking the following four steps:
1. Defining neonatal hypoglycemia using the multiple clinical cut-of-points to identify
the most salient risk factors.
2. Using large population based national registry database that is developed to facilitate
the conduct of analyses pertaining to neonatal complications will help to obtain
adequate comparison groups.

30
3. Stratifying the mother’s diabetes type to identify the significance of T1D, T2D, and
GDM on the risk of developing neonatal hypoglycemia.
4. Using multilevel statistical models to incorporate the individual and contextual
characteristics of infants and mothers.

Table II.1. Description of Included Neonatal Hypoglycemia Studies
Author (s)
(Year)
Design, N Location Patients Clinical
Characteristics
Mother’s
Diabetes Type
Definition of
Hypoglycemia,
mmol/l/ mg/dl
Glucose
Measurement
Method (infant,
mother)
Outcome
Measured (hrs
after birth)
Risk Factors
Assessed
Agrawal, et
al., 2000
Prospective
cohort, 38
Australia 38 term infants of
well-controlled
diabetic, ≥37 wk
gestation, 5 pre-
existing diabetes, 35
GDM, 16 managed
on insulin, 17 on diet
GDM
<2/36
Hexokinase;
QIDTM
0.5, 1, 2 UBCG, RDS,
BW
Majeed et al.,
2011
Prospective
Cohort, 150
Malaysia 139 GDM (76.7%
diet control, 23.3%
insulin), 11 pre-
existing
GDM
≤2.6/47 NS, BioRad D-
10
3 HbA1c
Bollepalli, et
al., 2010
Retrospectiv
e Cohort,
229
U.S. 302 singleton,
asymmetric
LGA (63), symmetric
LGA (67),
asymmetric non-LGA
(30), symmetric non-
LGA (142)
T1D <1.1/20 NS; Ames
Dextrometer
NS HB, AC, RD,
PC
Ferrara, et al.,
2007
Nested
Case–
Control,
2444
U.S. 1560 infants with
neonatal
complications, 884
control infants
GDM <2.2/40 NS; Hexokinase
NS MS, HB
31

Table II.1.Continued.
Author (s)
(Year)
Design, N Locat
ion
Patients Clinical
Characteristics
Mother’s
Diabetes Type
Definition of
Hypoglycemia,
mmol/l/ mg/dl
Glucose
Measurement
Method (infant,
mother)
Outcome
Measured (hrs
after birth)
Risk Factors
Assessed
Flores-le
Roux , et al.,
2012
Prospective
Cohort,190
Spain 190 infants, 39.3 wk
mean gestational age;
3349 mean birthweight
GDM Normal
(>2.5/45), Mild
(2.2/40-
2.4/43),
Moderate
(1.6/29-
2.1/38), Severe
(<1.6/29)
Chromogen
Reagent Strips;
NS
1, 2, 4, 8,
12, 18, 24
PBMI, IG,
GA, IL, CD,
BW, LGA,
AC, UCPH
García-
Patterson, et
al., 2012
Retrospective
Cohort, 2092
Spain 2029 NH infants and
63 non-NH infants;
2029 pregnancies
of women with GDM
GDM <2.22 Cornblath
criteria; NS
48 GA,
CBG, HbA1c,
IT, BMI,
WDP, MP,
NG
Das et al.,
2009
Retrospective
cohort, 305
U.S. 305 singleton neonates
with a birthweight of
≥4000 g
GDM <2.8/50 NS NS RDS, BI, CH,
HS,
Maayan-
Metzger et al.,
2014
Retrospective
cohort, 576
Israel 576 term infants, 37–
42 wk gestation, non-
complicated vaginal
delivery
GDM-A1,
GDM-A2,
IDDM
(>2.6/47), Mild
(2.2/40-
2.5/45),
Moderate
(1.7/31-
2.1/38), Severe
(<1.7/31)
Glucometer Elite
XL; NS
1, 2, 4, 6, 8 AGA, SGA,
LGA, CD,
MA, MH,
MSAF
32

Table II.1.Continued.
Author (s)
(Year)
Design, N Location Patients Clinical
Characteristics
Mother’s
Diabetes Type
Definition of
Hypoglycemia,
mmol/l/ mg/dl
Glucose
Measurement
Method (infant,
mother)
Outcome
Measured (hrs
after birth)
Risk Factors
Assessed
Ryan et al.,
2012
Retrospective
cohort, 274
Canada 55 T1D, 55 T2D, 164
GDM
GDM, T1D,
T2D
< 2/26 Capillary Blood
Glucose; NS
Hourly MBG
Sarkar et al.,
2003
Prospective
cohort, 160
U.S. Infants born at ≥36
wk to women with
GDM (class Al) over
a period of 16
months; Infants born
at
≥36 wk to
nondiabetic women
GDM-A1 < 2.2/40
glucose oxidase;
NS
0.5-1, 3
BW,
GA, AC, MC,
HbA1c
Taylor, et al.,
2002
Retrospective
Cohort, 107
UK 12.9 years of average
duration of Type-1
Diabetes; 44
primigravidas
T1D < 2.5/45 Yellow Springs NS MC
Tundidor, et
al., 2012
Retrospective
Cohort, 2299
Spain Singleton pregnancies
of women with GDM;
< 22 wk gestation
GDM < 2.6/47 NS NS PB, AS, LGA,
SGA, OT, JD,
CM, RDS,
PT, HC, PM
33

Table II.1.Continued.
UCBG, umbilical cord blood glucose; RDS, respiratory distress syndrome; BW, birthweight; NS, not stated; HbA1c, glycated hemoglobin; HB; hyperbilirubinemia;
AC, acidosis; PC, polycythemia; MS, macrosomia; GA, gestationalage; IT, insulin treatment; BMI, body max index; WDP; weight during pregnancy; MP, multiple
pregnancy; NG, newborn gender, BI, birth injury; CH; cephalhaematoma, HS, hospital stay; CD, Cephalhaematoma; CD, Cesarean Delivery; MA, Maternal Age;
MH, Maternal Hypertension; MSAF, meconium-stained amniotic fluid; AS, apgar score; PE, pre-eclampsia; BT, birth trauma; ARD, acute respiratory disorders;
PI, ponderal index, MOGCT, maternal oral glucose challenge test; PBMI; Pregestational BMI; IG, insulin in gestation, IL, insulin in labor; UCPH; umbilical cord
venous pH; MBG, maternal blood glucose, MC, microsomia; PT, polycythemia; HC, hypocalcaemia; PM, perinatal mortality; CM, congenital malformation; OT,
obstetric trauma; JD, jaundice; PB, preterm birth; MI maternal insulin; TDM, type of gestational diabetes; PM, prematurity
Author (s)
(Year)
Design, N Location Patients Clinical
Characteristics
Mother’s
Diabetes Type
Definition of
Hypoglycemia,
mmol/l/ mg/dl
Glucose
Measurement
Method (infant,
mother)
Outcome
Measured (hrs
after birth)
Risk
Factors
Assessed
VanHaltren et
al., 2013
Retrospecti
ve Cohort,
326
Australia 39 wk average
Gestation; 3300 g.
average birth weight;
15% LGA infants
GDM, T1D,
T2D
< 2.6/47 Automated
bench top blood
gas; NS
0, 4 MI, TDM,
HbA1c,
BGL, GA,
PM, BW
Mitrovic et
al., 2014
Retrospecti
ve cohort,
156
Serbia 94 mothers with
GDM, 48 T1D, 14
T2D; 106 controls
GDM, T1D NS NS NS AS, BW,
GA,CD,
PE
Persson, et al.,
2012
Prospective
cohort
study,
3517
Sweden 3517 singletons, 32–
43 wk gestation
T1D < 2.6/47 NS 6 AS, BT,
ARD, HB
Ramos, et al.,
2012
Retrospecti
ve Cohort,
385
U.S. Singleton pregnancies
diagnosed with GDM
b/n 12 & 34 wk (191),
T2D (51)
GDM,
T2D
< 2.5/45 Sure Step Flexx
Glucose Meter;
NS
0.5 PI, GA,
CD, MA,
MOGCT,
CD
34

Table II.2. Results of Included Studies of Hypoglycemic Neonates Born from Diabetic Mothers
Author (s) Years Main Results
Agrawal, et al., 2000 Hypoglycemia in 18 (47%) infants developed during the first 2 h of life. There was no difference in the cord blood glucose
levels between infants with or without hypoglycemia. Infants of mothers with diabetes diagnosed prior to 28 weeks
gestation were at a higher risk of developing hypoglycemia (OR: 7.2, 95% CI: 1.3–40.7). Hypoglycemic infants were of
significantly higher birthweight (3681) compared to normal infants (3160).
Majeed et al., 2011 There were 16 neonates who were hypoglycemic at delivery. The area under the Receiver Operator Characteristics (ROC)
curve for predicting neonatal hypoglycemia was 0.997 with a 95% CI of 0.992 to 1. The optimal threshold value for HbA1c
in predicting NH was 6.8%.
Bollepalli, et al., 2010 Asymmetric LGA infants had 3.5 (95% CI: 1.4, 8.7), 2.2 (95% CI: 1.2, 4.2), and 3.2 (95% CI, 1.7, 5.9) fold greater odds of
hypoglycemia, hyperbilirubinemia, and composite morbidity, respectively, compared with symmetric non-LGA infants.
Ferrara, et al., 2007 A total of 486 with infants with hypoglycemia, 488 with macrosomia, and with hyperbilirubinaemia were identified.
Women with GDM by ADA criteria had an increased risk of having an infant with hypoglycemia (OR: 2.61, 95% CI: 0.99–
6.92), macrosomia (OR: 3.40, 95% CI: 1.55–7.43), or hyperbilirubinaemia (OR: 2.22, 95% CI: 0.98–5.04) compared to
healthy control infants.
García-Patterson, et al., 2012 The rate of hypoglycaemia in neonates was 3% (63). Maternal pre-pregnancy BMI of ≥25 kg/m2 was an independent
predictor of hypoglycaemia irrespective of potential intermediate variables being included in the model (OR: 2.11, 95% CI:
1.10–4.03) or without (OR: 2.66, 95% CI:1.44–4.92).
Das et al., 2009 The incidence of hypoglycemia among IDMs was 56.1% compared to non-IDMs 28.6%. There was significantly more
hypoglycemia among the group weighing >4500 g compared to the group weighing 4000–4499g. Compared to IDMs, non-
IDMs were born later (40 vs 38 wk), were more likely to be delivered vaginally (70% vs 34%), and had a higher incidence
of birth injury than IDMs (8% vs 2.4%).
Maayan-Metzger et al., 2014
Among the neonates in the study group, 29 (36.7%) had at least one hypoglycemia value of <47 mg/dl, and 8 (10.1%) had a
value of <40 mg/dl in the first 8 hours of life. After controlling confounding factors such as birth weight, delivery number,
and grasp evaluation only lower cord blood glucose significantly predicted hypoglycemia for each decrease of 10 mg/dl
(OR: 2.11, 95% CI: 1.1–4.03).
35

Table II.2. Continued.
Author (s) Years Main Results
Mitroviu et al., 2014 The incidence of neonatal hypoglycemia was 52% in mothers with Type 1 diabetes and 16.5% in mothers with Type 2
diabetes or GDM. The incidence neonatal morbidities such as hypoglycemia, pathological jaundice, and other neonatal
pathologies at birth, was statistically significantly higher and Apgar scores after 1 minute and after 5 minutes were
statistically significantly lower in the mothers with diabetes (type 1 & 2) compared to the healthy women.
Persson et al., 2012 Neonatal morbidities were significantly more frequent in LGA compared to AGA infants. The proportions of preterm
births and girls were significantly higher in LGA infants (44% preterm and 52% girls) compared with AGA infants
(30% preterm and 47% girls) born to women with Type 1 diabetes. The risks of hypoglycemia were comparable between
P-LGA and D-LGA infants. No significant difference in risk was found between AGA and P-LGA and D-LAG.
Ramos et al., 2010 The incidence of hypoglycaemia was 18% (44/242). The incidence was significantly higher in those requiring
pharmacotherapy (25% vs. 3%). The frequency of hypoglycaemia between the glyburide and insulin-treated pregnancies
did not differ significantly (23% vs. 27%). The frequency of hypoglycaemia was statistically associated with birth
weight, macrosomia, and ponderal index. Ponderal index was the strongest predictor of hypoglycaemia (OR: 5.59, 95%
CI: 1.34–23.25).
Flores-le Roux et al.,
2012
A total of 23 (12.1%) mild, 20 (10.5%) moderate and 5 (2.6%) severe hypoglycemia were observed. Hypoglycemic
infants were more frequently LGA (29.3% vs 11.3%), had lower umbilical cord pH (7.28 vs 7.31) and their mothers had
more frequently been hyperglycemic during labor (18.8% vs 8.5%). Pakistani origin (OR: 2.94; 95% CI: 1.14 7.55) and
umbilical cord venous pH (OR: 0.04, 95% CI: 0.261–0.99) were significantly and independently associated with
hypoglycemia in multivariate analysis.
Ryan et al., 2012 The NH rate was 7.3% (4.9% in GDM mothers and 10.9% of mothers with pre-existing diabetes). The insulin-glucose
infusion was used in 47% of women with T1D, T2D, and GDM requiring ≥ 0.5 units/kg/day of insulin during pregnancy
and in 8% of women with GDM treated by diet or < 0.5 units/kg/day of insulin. The overall rate of maternal
hypoglycaemia was low (6.6% with blood glucose ≤ 3.5 mmol/L and 1.5% ≤ 3.0 mmol/L) pre-delivery; 13.9% of
women had a blood glucose level ≥ 7.0 mmol/L. Standardized management for diabetic women in labour using an
intravenous insulin-glucose protocol was effective in achieving stable maternal blood glucose levels with low rates of
neonatal hypoglycaemia.
36

Table II.2. Continued.
Authors (s) Years Main Results
Sarkar et al., 2003 The incidence of hypoglycemia was 4.3% in the GMD-A1 group compared to the control, 4.4%. Neonatal morbidity in
infants born to GDM-A1 women is similar to that seen in infants of nondiabetic women. Unlike infants of insulin-
dependent diabetic and insulin requiring GDM women, infants born to GDM-A1 women at 36 weeks of gestation or more
were not at increased risk of developing hypoglycemia, hypocalcemia, hypomagnesemia, polycythemia,
hyperbilirubinemia, birth trauma, or birth asphyxia. Infants born at 36 weeks or more gestation to class A1 GDM women
can be managed like any other normal full-term infant born to a nondiabetic woman.
Taylor, et al., 2002 Hypoglycemia correlates with maternal hyperglycemia in labor, not with HbA1c during pregnancy. Blood glucose was
less than 2.5 mmol/l in 50 neonates and was less than 2.0 mmol/l in 18 neonates. Maternal blood glucose control in
pregnancy had no bearing on the incidence of NH, but maternal blood glucose during labor influenced neonatal blood
glucose if over 8 mmol/l.
Tundidor, et al., 2012 Male sex was an independent predictor of neonatal hypoglycemia (OR: 2.13) and CS (OR: 1.48). As to neonatal
hypoglycaemia, intravenous glucose was required in 16.7% of infants (7.4% in female vs 24.2% in male fetuses; NS). The
increased risk of neonatal hypoglycemia in male fetuses of mothers with GDM is also the most relevant result in terms of
clinical practice, advising an increased awareness of neonatal hypoglycemia in these newborns.
VanHaltren et al., 2013 Hypoglycaemic episodes occurred in 109 (33.4%) infants. Macrosomia was present in 15% of the infants. Maternal
diabetes Type, HbA1c, prematurity, macrosomia, and temperature instability were identified as risk factors for neonatal
hypoglycaemic.
37

38
Table II.3. Description of Methodological Quality Assessment
Items Agrawal
et al.
(2000)
Majeed
et al.
(2011)
Bollepalli
et al.
(2010)
Ferrara
et al.
(2007)
Garcia-
Patterson
et al.
(2012)
Das
et al.
(2009)
Maayan-
Metzger
et al.
(2014)
Mitroviu
et al.
(2014)
1.Study design Yes Yes Yes Yes Yes Yes Yes Yes
2.Setting Yes Yes Yes Yes No No No No
3.Participants Yes Yes Yes Yes Yes No Yes Yes
4.Variables Yes Yes Yes Yes No No No No
5.Measurement Yes No No Yes Yes No Yes No
6.Bias No No No No No No No No
7.Study size No No No No No No No No
8.Statistical methods Yes Yes Yes Yes Yes Yes Yes No
9.Discriptive data Yes Yes Yes Yes Yes Yes Yes Yes
10.Outcome data No No No Yes No Yes No No
11.Main results Yes Yes Yes Yes Yes Yes Yes Yes
12.Key Result Yes Yes Yes Yes Yes No No No
13.Limitations Yes Yes No Yes No Yes No No
14.Interpretation Yes Yes Yes Yes No No No No
15.Generalizability Yes No No Yes No No No No
Percentages of
Yes (%)
12/15=
80.00
10/15=
66.66
9/15=
60.00
13/15=
86.66
7/15=
46.66
6/15=
40.00
6/16=
40.00
4/15=
26.66

39
Table II.3. Continued.
Items Persson
et al.
(2012)
Ramos
et al.
( 2010)
Flores-le
Roux et
al. (2012)
Ryan et
al.
(2012)
Sarkar
et al.
(2003)
Taylor
et al.
(2002)
Tundidor
et al.
(2012)
VanHaltren
et al.
(2013)
1.Study design Yes Yes Yes Yes Yes Yes Yes Yes
2.Setting No No Yes No Yes No No No
3.Participants Yes Yes Yes No Yes Yes Yes Yes
4.Variables Yes Yes Yes Yes Yes No No No
5.Measurement No No Yes No No No No No
6.Bias Yes No Yes No No No No No
7.Study size Yes No No No Yes No Yes No
8.Statistical methods Yes Yes Yes Yes Yes No Yes Yes
9.Discriptive data Yes Yes Yes Yes Yes Yes Yes Yes
10.Outcome data No No No No No No Yes No
11.Main results Yes Yes Yes Yes Yes Yes Yes No
12.Key Result Yes No Yes No Yes No No No
13.Limitations Yes No Yes No Yes No No Yes
14.Interpretation Yes Yes Yes No Yes No No Yes
15.Generalizability Yes No Yes No Yes No No No
Percentages of
Yes (%)
12/15=
80.00
7/15=
46.66
13/15=
86.66
5/15=
33.33
12/15=
80.00
4/15=
26.66
7/15=
46.66
6/15=
40.00

40
Figure II.1. Selection Process for Including Studies in the Systematic Review
1233 Studies retrieved in the initial search
661 EBSCOhost
572 PubMed
1233 Titles and abstracts read
31 Full articles were reviewed
A total of 16 articles met the inclusion criteria and were included for detailed review
Animal studies
Review articles
Written in the non-English language
Studies not conducted between 2000 and 2016
Duplicates
7 Studies did not include diabetic mothers
4 Hypoglycemia not listed as primary outcome
4 Comparison group not defined
3 Hypoglycemia not defined in mmol/l or mg/dl
3 Articles identified in the cited references search

41
CHAPTER III
PROJECT II: PREDICTORS OF HOSPITALIZATION COST IN INFANTS WITH
HYPOGLYCEMIA: ANALYSIS OF HCUP KID’S DATABASE
Introduction
Neonatal hypoglycemia is a common metabolic abnormality in newborns due to inability
to maintain glucose homeostasis.4,84 Throughout gestation, mothers provide all the glucose for
their fetuses via facilitated diffusion across the placenta according to a maternal-to-fetal glucose
concentration gradient.6 The disruption of this process can lead to several acute and chronic
illnesses. The most common symptoms of neonatal hypoglycemia are shakiness, tachycardia,
lethargy, and temperature irregularities.23 In the presence of these symptoms, neonatal
hypoglycemia is defined as capillary plasma glucose of less than 46 mg/dl (2.6 mmol/l).8,23
Several clinical conditions could be associated with neonatal hypoglycemia that could affect
glucose homeostasis including asphyxia, congenital heart disease, decreased substrate
availability as a result of birth defects, prematurity and fetal growth restriction, islet cell
hyperplasia, and Beckwith-Wiedemann Syndrome.15,17,18,20,21 Prolonged neonatal hypoglycemia
may also cause neuroglycopenic signs such as seizures, coma, cyanotic episodes, apnea,
respiratory distress, and hypothermia.4
Previous studies on this topic mainly focused on the clinical risk factors and analyses aimed
at improving the management and care of neonatal hypoglycemia. However, the economic
burden and overall hospital cost estimates has not been studied at the national level in the United
States (US). Although not in neonates, the economic burden of hypoglycemia has been
adequately addressed in adult populations44-49. This study sought to determine the overall
hospital cost estimates in neonates with hypoglycemia and compare hospital cost in premature

42
and non-premature newborns. The study also sought to identify predictors of increased hospital
cost.
Methods
This is a retrospective study based on the 2012 Kids’ Inpatient Database (KID) developed by
the Healthcare Cost and Utilization Project (HCUP) of the Agency for Healthcare Research and
Quality (AHRQ).54 The KID is the largest publicly available all-payer pediatric (≤20 years of
age) inpatient care database in the United States. The database is a sample of pediatric discharges
from all community, non-rehabilitation hospitals in 44 participating States. Systematic random
sampling is used to select 10% of uncomplicated in-hospital births and 80% of other pediatric
cases from each participating state. The 2012 KID database includes 4179 hospitals with
3,195,782 pediatric discharges. HCUP categorize hospital regions as northeast, mideast, south,
and west. Hospital ownership, teaching status, location, bed size, and other important hospital
characteristics were also included in the database. In total, 70 children’s hospitals (400,835
pediatric discharges) and 4,109 hospitals that admit all patients (2,794,947 pediatric discharges)
were included in the 2012 database. As we are interested only in neonates, this analysis is limited
to uncomplicated and complicated in-hospital births.
For the purpose of our analysis the inpatient core file, the hospital file, and cost-to-charge
ratios file of the KID 2012 database were used. Neonates with hypoglycemia (775.6) were
identified using the 9th version of the international classifications of diseases (ICD-9-CM). The
outcome variable was identified by converting the total hospital charge to hospital cost estimates
(Hospital Costs = Cost-to-Charge Ratios*Total Charges).78 Using the distribution of total
hospital cost estimates we categorized hospital cost into increased hospital cost estimates (> 75th
percentile) and lower hospital cost estimates (≤ 75th percentile).

43
Neonatal comorbidities associated with hypoglycemia were defined as a dichotomous
variable using ICD-9-CM codes. In this respect, the presence of any comorbidities associated
with neonatal hypoglycemia such as jitteriness (796.9), hypotonia (781.3), lethargy (799.22),
apnea (786.03), tachypnea (786.06), poor feeding (783.3), hypothermia (991.6), sepsis (995.91&
771.81), seizures (345.x), neurodevelopmental (315.x) deficits were used to create a
dichotomous variable that indicates the morbidity status of newborns. In addition, demographic
information (age, sex, and race), region of hospitals (northeast, midwest, south, west), hospitals
teaching status, bed-size category (small, medium, large), admission date (weekend versus
weekdays), length of hospital stay (LOS), number procedures performed during hospitalization
(NPR), number of chronic conditions during hospitalization, expected primary payer, and in-
hospital mortality were extracted for the purpose of the current analysis. Hospitalization for
hypoglycemic neonates was categorized into premature and non-premature using the Diagnosis
Related Groups version 24 (DRG24) codes (386-388). DRG24 is assigned by the Centers for
Medicare & Medicaid Services (CMS) DRG Grouper algorithm during HCUP processing and it
has been available since 2006.54
We used the Kolmogorov-Smirnov test (KS-Test) to assess normality for continuous
variables. Groups were compared using the Wilcoxon-Mann-Whitney test for continuous
variables and the χ2 test for categorical variables. For continuous variables data were presented
in median and interquartile range (IQR). Whereas categorical variables were presented as
numbers (n) and percentages (%). Odds ratios (OR) for increased hospital cost estimates were
determined by using bivariate and multivariate logistic regression. All variables that were
significantly associated with increased cost (P < 0.05) were included in the multivariable logistic

44
regression analysis. We used this stringent criterion for inclusion in the model because of the
large sample size.
A P < 0.05 was considered statistically significant for all tests. SAS® version 9.3 was used
for the analysis (Institute Inc., Cary, NC, USA). In assessing the calibration of our model, we
used the Receiver Operating Characteristics (ROC) curve to calculate c statistic and the
Deviance – Pearson (D-P) goodness of fit statistics.119,120 The two model evaluation measures
carried out in this study should provide enough assurance regarding the accuracy of our model.
Results
A total of 3,195,782 hospital discharges were included in the 2012 KID HCUP database,
from which 1,107,573 were in-hospital births. From the total in-hospital birth, we were able to
identify 50,650 neonates with hypoglycemia (5%). In 2012, the total hospital cost in neonates
with hypoglycemia was 821 M$. Since the total cost for in-hospital births was 7,692 M$,
hospital cost in neonates with hypoglycemia represents 11%. Figure III.1 indicates the relative
proportion the cost for premature (73%: 602 M$) and non-premature (27%: 219 M$) neonates.
The median cost estimates in premature and non-premature neonates were $12,755 ($4,550-
$30,339) and $2,360 ($1,153-$3,736), respectively. On the other hand, Figure III.2 represents the
distribution of hospital cost estimates by primary payer which are divided into Medicaid (50%:
410 M$), private insurance (44%: 364 M$), Self-pay (1%: 10.7 M$), and other (5%: 36.2 M$).
In addition, Figure III.3 indicates that the per capita cost estimates among the four United States
regions, that are northeast (19 K$), Midwest (15 K$), South (14 K$), and West (18 K$). Total
cost estimates that exceed the 75th percentile ($13,575) was defined as excessive cost associated
with hospital discharge.
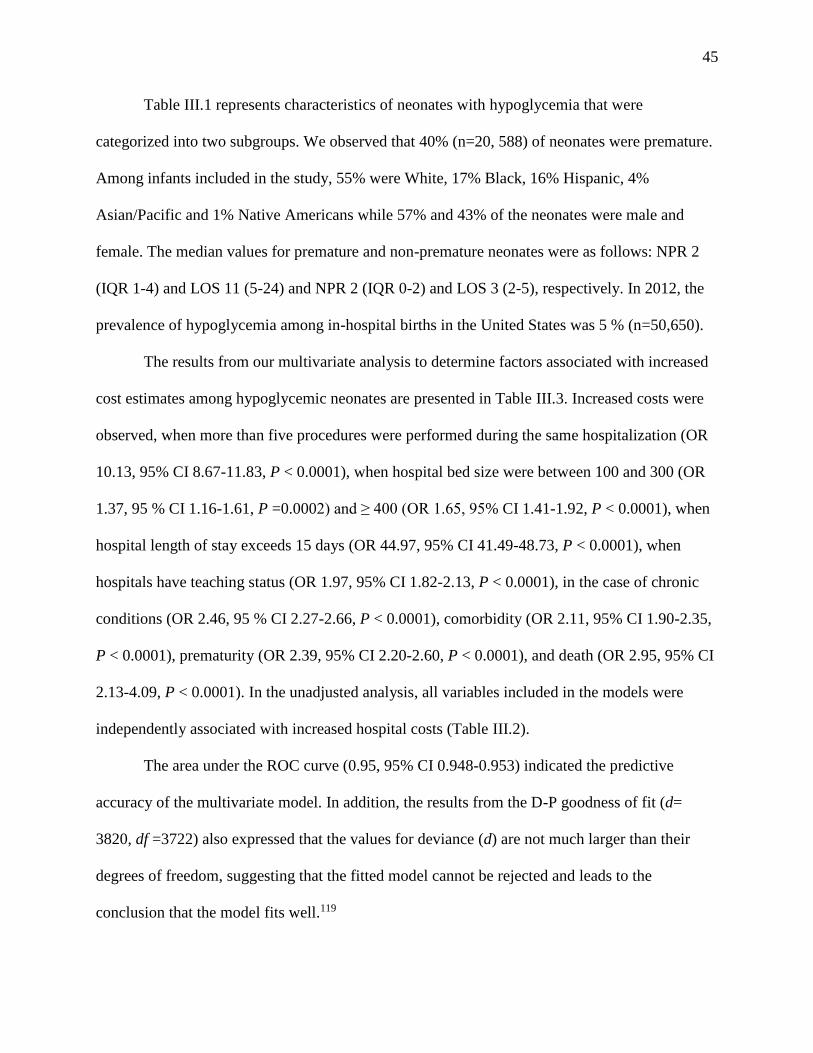
45
Table III.1 represents characteristics of neonates with hypoglycemia that were
categorized into two subgroups. We observed that 40% (n=20, 588) of neonates were premature.
Among infants included in the study, 55% were White, 17% Black, 16% Hispanic, 4%
Asian/Pacific and 1% Native Americans while 57% and 43% of the neonates were male and
female. The median values for premature and non-premature neonates were as follows: NPR 2
(IQR 1-4) and LOS 11 (5-24) and NPR 2 (IQR 0-2) and LOS 3 (2-5), respectively. In 2012, the
prevalence of hypoglycemia among in-hospital births in the United States was 5 % (n=50,650).
The results from our multivariate analysis to determine factors associated with increased
cost estimates among hypoglycemic neonates are presented in Table III.3. Increased costs were
observed, when more than five procedures were performed during the same hospitalization (OR
10.13, 95% CI 8.67-11.83, P < 0.0001), when hospital bed size were between 100 and 300 (OR
1.37, 95 % CI 1.16-1.61, P =0.0002) and ≥ 400 (OR 1.65, 95% CI 1.41-1.92, P < 0.0001), when
hospital length of stay exceeds 15 days (OR 44.97, 95% CI 41.49-48.73, P < 0.0001), when
hospitals have teaching status (OR 1.97, 95% CI 1.82-2.13, P < 0.0001), in the case of chronic
conditions (OR 2.46, 95 % CI 2.27-2.66, P < 0.0001), comorbidity (OR 2.11, 95% CI 1.90-2.35,
P < 0.0001), prematurity (OR 2.39, 95% CI 2.20-2.60, P < 0.0001), and death (OR 2.95, 95% CI
2.13-4.09, P < 0.0001). In the unadjusted analysis, all variables included in the models were
independently associated with increased hospital costs (Table III.2).
The area under the ROC curve (0.95, 95% CI 0.948-0.953) indicated the predictive
accuracy of the multivariate model. In addition, the results from the D-P goodness of fit (d=
3820, df =3722) also expressed that the values for deviance (d) are not much larger than their
degrees of freedom, suggesting that the fitted model cannot be rejected and leads to the
conclusion that the model fits well.119

46
Discussion
Our analysis of the 2012 HCUP KID database shows that hospital cost estimates in
neonates with hypoglycemia consumed 11% of the resources associated with hospital births. We
determined a 5% prevalence of neonatal hypoglycemia among in-hospital births in the U.S
during the year 2012. We also determined that medium and large hospital bed sizes, LOS, NPR,
teaching hospitals, composite neonatal comorbidities, prematurity, occurrence of chronic
conditions, and mortality were independently associated with increased hospital cost estimates in
neonates with hypoglycemia.
Previous studies have focused on estimations of the economic cost of hypoglycemia in
the adult population.44-49 To our best knowledge, this is the first study providing an empirical
estimate of the hospital cost of neonatal hypoglycemia at the national level. It is worth noting
that 100% of mortality and higher morbidity (51%) occurred in the non-premature group. As
premature neonates are usually treated in neonatal intensive care units that provide around-the-
clock care, non-premature babies appear to be prone to mortality and various hypoglycemia
related comorbidities. Furthermore, since premature neonates are more likely to be delivered by
caesarian section, non-premature neonates are at increased risk for serious birth related
morbidities such as birth trauma.70 This result is consistent with previous studies16,41,77,121 in that
neonates with asymptomatic hypoglycemia may easily be neglected of proper care which may
lead to acute comorbidities and even death. As the majority of hypoglycemic cases are
asymptomatic, enough emphasis should be given this subgroup.
At this juncture, an explanation of the cost-to-charge ratios (CCRs) is warranted. The
HCUP KID contains data on total charges for each hospital in the databases. This charge
information represents the amount that hospitals billed for services but does not reflect how

47
much hospital services actually cost.54 Cost information was obtained from the hospital
accounting reports collected by the CMS. Statistical imputation for missing values and internal
validation studies were carried out to enhance the accuracy of the CCRs.75,77 Most hospital-based
studies use total charge as a proxy measurement for actual cost.53 This may lead to drawing
unwarranted conclusions about economic efficiency and hospital resource utilizations.53 To
maximize the accuracy of the cost estimation, our study used actual cost by converting the total
hospital charge to hospital cost estimates using CCRs.
We recognize that there are some limitations associated with this study. The ICD-9-CM
classification system is imperfect for case identification, as it was created for reimbursement
rather than research purposes. As a result, important clinical conditions pertinent for neonatal
outcome research may have been missed. Because KID 2012 lacks individual identifiers for
states, we were not able to conduct comparative analysis among various states. However, despite
the potential limitations, the HCUP KID database is the largest validated and publicly available
all-payer pediatric inpatient care database54 that can be used to evaluate national cost estimates,
resource utilization, and economic burden of hospitalization in the pediatric population.
Conclusion
This study demonstrated that neonates with hypoglycemia consumed 11% of resources
associated with hospital births while accounting for only 1.5% of hospitalization. We also
determined that hospital length of stay, hospital bed size, teaching hospitals, number of
procedures performed during hospitalization, chronic conditions, comorbidity, prematurity, and
in-hospital mortality were independently associated with increased hospital cost. Our results also
suggested that non-premature hypoglycemic babies should be provided with more care to reduce
acute comorbidities and death during hospitalization

48
Table III.1. Characteristics of Neonates with Hypoglycemia by Prematurity Status
Variables Premature
(N= 20,588)
(40%)
Non-Premature
(N=30,062)
(60% )
Total
(N= 50,650)
(100%)
P Value
Gender n, (%) <.0001
Male 10,781(37.11) 18,269 (62.89) 29,050 (57.38)
Female 9,800 (45.42) 11,778 (54.58) 21,578 (42.62)
Race n, (%) <.0001
White 9,826 (38.88) 15,448 (61.12) 25,274 (55.40)
Black 3,599 (47.11) 4,041 (52.89) 7,640 (16.75)
Hispanic 2,893 (40.80) 4,197 (59.20) 7,090 (15.54)
Asian/Pacific 714 (38.02) 1,164 (61.98) 1,878 (4.12)
Native Americans 170 (38.99) 266 (61.01) 436 (0.96)
Admission Day n, (%) <.0001
Weekday 15,816 (39.51) 24,216(60.49) 40,032 (79.04)
Weekend 4,772 (44.94) 5,846 (55.06) 10,618 (20.96)
Hospital n, (%) <.0001
Teaching 12,952 (44.64) 16,060 (55.36) 29,012 (57.28)
Non-Teaching 7,636 (35.29) 14,002 (64.71) 21,638 (42.72)
Bed Size n, (%) <.0001
Small (1-99) 1,310 (30.83) 2,939 (69.17) 4,249 (8.39)
Medium (100-399) 5,071 (39.19) 7,869 (60.81) 12,940 (25.55)
Large (≥ 400) 1,4207 (42.46) 19,254 (57.54) 33,461 (66.06)
Ownership n, (%) <.0001
Private 15,161 (40.58) 22,200 (59.42) 37,361 (73.76)
Public 5,427 (40.84) 7,862 (59.16) 13,289 (26.24)
Morbidity n, (%) 2,982 (49.01) 3,102 (50.99) 6,084 (12.01) <.0001
Mortality n, (%) 0 (0) 389 (100) 389 (0.77)
NPR#* 2 (1-4) 2 (0-2) 4 (2-11) <.0001
LOS days +* 11 (2-24) 3 (2-5) 1 (0-3) <.0001 +LOS, Hospital length of stay in days; #NPR, number of procedure. Data are presented in number (n) and
percentage (%), or *Median and interquartile range (IQR)
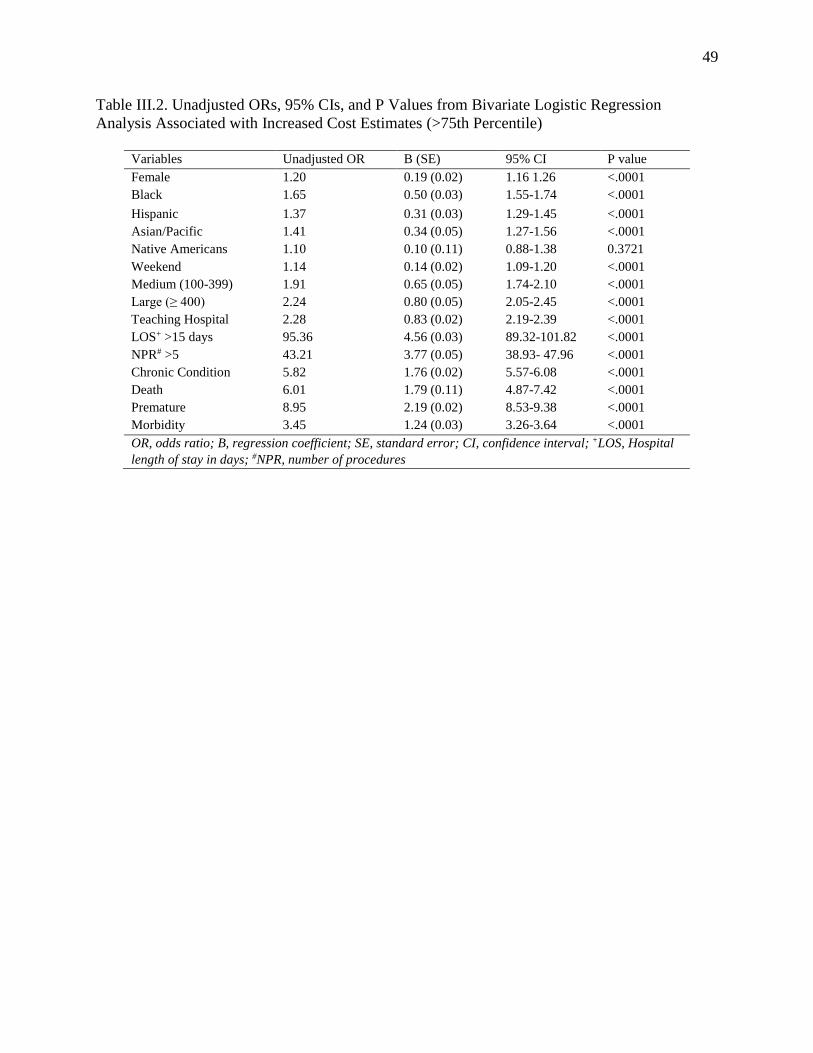
49
Table III.2. Unadjusted ORs, 95% CIs, and P Values from Bivariate Logistic Regression
Analysis Associated with Increased Cost Estimates (>75th Percentile)
Variables Unadjusted OR B (SE) 95% CI P value
Female 1.20 0.19 (0.02) 1.16 1.26 <.0001
Black 1.65 0.50 (0.03) 1.55-1.74 <.0001
Hispanic 1.37 0.31 (0.03) 1.29-1.45 <.0001
Asian/Pacific 1.41 0.34 (0.05) 1.27-1.56 <.0001
Native Americans 1.10 0.10 (0.11) 0.88-1.38 0.3721
Weekend 1.14 0.14 (0.02) 1.09-1.20 <.0001
Medium (100-399) 1.91 0.65 (0.05) 1.74-2.10 <.0001
Large (≥ 400) 2.24 0.80 (0.05) 2.05-2.45 <.0001
Teaching Hospital 2.28 0.83 (0.02) 2.19-2.39 <.0001
LOS+ >15 days 95.36 4.56 (0.03) 89.32-101.82 <.0001
NPR# >5 43.21 3.77 (0.05) 38.93- 47.96 <.0001
Chronic Condition 5.82 1.76 (0.02) 5.57-6.08 <.0001
Death 6.01 1.79 (0.11) 4.87-7.42 <.0001
Premature 8.95 2.19 (0.02) 8.53-9.38 <.0001
Morbidity 3.45 1.24 (0.03) 3.26-3.64 <.0001
OR, odds ratio; B, regression coefficient; SE, standard error; CI, confidence interval; +LOS, Hospital
length of stay in days; #NPR, number of procedures

50
Table III.3. Adjusted ORs, 95% CIs, and P Values from Multivariate Logistic Regression
Analysis Associated with Increased Cost Estimates (>75th Percentile)
Variables Adjusted OR B (SE) 95% CI P value
Female 1.01 0.01 (0.09) 0.94-1.09 0.7439
Black 0.89 -0.12 (0.05) 0.8.0-0.98 0.0185
Hispanic 1.26 0.23 (0.05) 1.13-1.39 <.0001
Asian/Pacific 1.95 0.67 (0.09) 1.63-2.32 <.0001
Native Americans 1.57 0.45 (0.19) 1.09-2.28 0.0163
Weekend 1.04 0.04 (0.05) 0.95-1.14 0.3816
Medium (100-399) 1.37 0.31 (0.08) 1.16-1.61 0.0002
Large (≥ 400) 1.65 0.50 (0.08) 1.41-1.92 <.0001
Teaching Hospital 1.97 0.68 (0.04) 1.82-2.13 <.0001
LOS >15 days 44.97 3.81 (0.04) 41.49-48.73 <.0001
NPR >5 10.13 2.32 (0.08) 8.67-11.83 <.0001
Chronic Condition 2.46 0.90 (0.04) 2.27-2.66 <.0001
Death 2.95 1.08 (0.17) 2.13-4.09 <.0001
Premature 2.39 0.87 (0.04) 2.20-2.60 <.0001
Morbidity 2.11 0.75 (0.05) 1.90-2.35 <.0001
OR, odds ratio; B, regression coefficient; SE, standard error; CI, confidence interval;+LOS,
Hospital length of stay in days; #NPR, number of procedures

51
Figure III.1. Total Cost Estimates in Neonates with Hypoglycemia by Prematurity Status. Total
Costs Are Expressed In Million US Dollars (M$) For Premature and Non-Premature Neonates
with Hypoglycemia

52
Figure III.2. Total Cost Estimates in Neonates with Hypoglycemia by Primary Payer. Total Costs
Are Expressed In Million US Dollars (M$) and Divided Among Private Insurance, Medicaid,
Self-Pay, and Other

53
Figure III.3. Per Capita Cost Estimates in Neonates with Hypoglycemia by Region. Per Capita
Costs Are Expressed In Thousand US Dollars (K$) For Four US Regions: Northeast, Midwest,
West, and South

54
CHAPTER IV
PROJECT III: A MULTILEVEL MODELING ANALYSIS OF
PREDICTORS OF NEONATAL HYPOGLYCEMIA IN DIABETIC AND NON-
DIABETIC MOTHERS
Introduction
Neonatal hypoglycemia is the most common metabolic abnormality in infants and is
associated with neurological damage and death.4 Estimates for neonatal hypoglycemia are
between 3% and 29% of all pregnancies in the United States.122 As glucose is an essential
primary substrate for the brain,4,122 neurons, and glial cells are susceptible to hypoglycemia.84
Neonates with hypoglycemia are prone to various acute84 and chronic health problems.43,123 In
the short run, newborns may experience jitteriness, hypotonia, lethargy, irritability, apnea,
tachypnea, poor feeding, hypothermia, and seizures.55 Later in their life, they may experience a
neurodevelopmental delay or even death.55,124 Due to poor nutritional status, infectious diseases,
and the lack of diagnostic facilities, neonatal hypoglycemia in resource poor countries has far
more serious consequences for health.124 The risk of developing hypoglycemia among infants
born from diabetic mothers is even higher.6
For neonates to have a normal brain, adequate supply of glucose during infancy is
crucial.70 Therefore, the lack of this essential substrate at the early stage of growth may lead to
various acute122 and long term43 life-threatening medical conditions. Hypoglycemia occurs in
approximately 3-20% of neonates born to mothers with diabetes6,55,124, with an estimated
incidence rate of approximately 27% among infants born to women with diabetes compared to
3% among full-term healthy infants born to non-diabetic women.35,36 Previous research on
neonatal hypoglycemia21,23,25,33,34,70,72,73,91,92,95,96,98-101 mainly focused on individual-level risk

55
factors such as poor maternal glycemic control, neonatal weight at birth, and gestational age at
delivery as predisposing risk factors for the development of neonatal hypoglycemia in diabetic
pregnancies. However, contextual risk factors such as neighborhood economic status, type of
insurance, hospital characteristics, and regional variations were not considered in these studies.
Neonatal hypoglycemia is a highly preventable medical condition71 and yet it poses a
significant threat to the health of newborns. Due to lack of adequate knowledge about the
potential individual and contextual risk factors, the prevention of neonatal hypoglycemia has
been difficult.57, 125 Therefore, considering these multilevel characteristics in assessing the
determinants of neonatal hypoglycemia is necessary to understand the complex relationship
among various influencing factors. In addition, since neonatal hypoglycemia is strongly
associated with poor maternal health33,72,73, the identification of the risk factors is important to
improve the mothers’ health through effective prevention measures that can reduce high-risk
pregnancies.
The purpose of the current study was to construct multilevel models that include
individual-level and contextual-level characteristics in order to predict neonatal hypoglycemia in
diabetic and non-diabetic mothers. We hypothesized that infants born from diabetic mothers will
have significantly higher chance of developing hypoglycemia compared to those born from non-
diabetic mothers. The addition of the contextual-level factors was also expected to enhance the
predictive power of the models. Addressing these issues using a large nationally representative
database is necessary to guide the prevention and control of adverse health outcomes associated
with hypoglycemia in these priority populations.
Materials and Methods

56
The current study used the 2012 Kid’s Inpatient Database (KID) developed by the
Healthcare Cost and Utilization Project (HCUP). The proposed research is a cross-sectional
study that examines hospital discharges of newborn infants delivered after complicated or
uncomplicated pregnancies.
The KID is the largest publicly available all-payer pediatric (≤20 years of age) inpatient
care database in the United States. The 2012 KID database includes 4179 hospitals and
3,195,782 pediatric discharges. HCUP categorize hospital regions as northeast, mideast, south,
and west. In addition to demographic and clinical measures, hospital ownership, teaching status,
location, bed size, and other important hospital characteristics were also included in the database.
In total, 70 children’s hospitals (400,835 pediatric discharges) and 4,109 hospitals that admit all
patients (2,794,947 pediatric discharges) were included in the 2012 database. As we are
interested only in neonates, this analysis is limited to uncomplicated and complicated in-hospital
births. Hospital discharges with missing, invalid, or inconsistent ages were excluded from the
HCUP KID.
For sampling, pediatric discharges were stratified by uncomplicated in-hospital birth,
complicated in-hospital birth, and all other pediatric cases. For an accurate representation of each
hospital’s pediatric case-mix, the discharges were sorted by State, hospital, diagnosis-related
group (DRG), and a random number within each DRG. Then, systematic random sampling was
used to select 10% of uncomplicated in-hospital births and 80% of complicated in-hospital births
and other pediatric cases from each sampling frame hospital. To obtain national estimates,
discharge weights were developed using the American Hospital Association universe as the
standard. This is the first study that proposed to use a nationally representative database to
identify risk factors and healthcare utilization outcomes associated with neonatal hypoglycemia.

57
Inclusion/Exclusion Criteria
Subjects were eligible to be included in the study if they were neonates (first 28 days
after birth), had a diagnosis of hypoglycemia (ICD-9-CM=775.6), and were born in the 44
HCUP participating States in the year 2012. All other pediatric cases occurred in the United
States community, non-rehabilitation hospitals were excluded from the study.
Variables
The current study included both individual and contextual level characteristics of
neonatal hypoglycemia. International classification of diseases, 9th version (ICD-9-CM codes),
Diagnostic Related Groups (DRGs), Clinical Classifications Software Category (DXCCS1-
DXCCS25), and Clinical classification software category for all procedures (PRCCS1-
PRCCS15) were used to extract the independent variables. The dependent variable, neonatal
hypoglycemia, was extracted as dichotomous variables using the ICD-9-CM code 775.6. The
complete list of codes used to identify variables are listed in Appendix A.
The individual characteristics included in the analysis were gender, race, prematurity,
small-for-gestational age (birth weight <10th percentile), large-for-gestational-age (birth weight
>90th percentile), mortality, addmission type (scheduled, non-scheduled), addmision day
(weekend, weekday), indicator of emergecy service use, comorbidities including jitteriness,
hypotonia, lethargy, irritability, apnea, tachypnea, poor feeding, hypothermia, sepsis, seizures,
neurodevelopmental deficits. An indicator of maternal diabetes status (Type I, Type II, or
Gestational), history of substance/alcohol abuse, and delivery mode (caesarian, normal) were
included as individual characteristics associated with the mother.
Contextual variables such as region (Northeast, Midwest, South, West), insurance type
(Medicare, Medicaid, Private insurance, Self-pay, No charge), median household income for

58
patient’s zip code ($1-$38999, $39000-$47999, $48000-$62999, $63000+), admission season
(January-March, April-June, July-September, October-December), hospital bed size (1-99, 100-
399, ≥ 400), ownership (public, private), teaching status, and location (rural, urban) were
included in the analysis.
Statistical Analysis
For the purpose of our analysis, the inpatient core file and the hospital file were used. All
analyses were weighted to account for the complex probability sampling of the dataset and
permit inferences regarding the risk factors for neonatal hypoglycemia. Descriptive and
inferential statistics were performed taking complex survey design into consideration. Groups
were compared using the Rao-Scott χ2 test for categorical variables. Values were presented as
numbers (n), percentages (%), and odds ratios (OR).
Hierarchical logistic regression models were constructed to simultaneously examine
individual and contextual predictors of neonatal hypoglycemia. The proposed statistical analysis
is appropriate because of 1) the nested structure of the data and 2) unlike ordinary least squares
models, hierarchical models enable us to investigate and explain the sources of both the within
and between variations of higher-level factors. Random-intercept models were applied to identify
key factors that can independently predict neonatal hypoglycemia among diabetic and non-
diabetic mothers. A p value < 0.05 was considered statistically significant for all tests. SAS®
version 9.3 was used for data analysis (Institute Inc., Cary, NC, USA).
Hierarchical Modeling Scheme
Multilevel or hierarchical models have been developed to properly account for the
hierarchical nesting of data126-129. Such modeling techniques should be used in health services
research that use national databases, such as HCUP, where data are typically hierarchical in

59
nature. Conducting research ignoring the hierarchical structure of the data can lead to erroneous
conclusions such as incorrect estimation of variances and the available power to detect covariate
effects130-133, increase Type I error rates134, underestimate standard errors, and lead to substantive
errors in interpreting the results of statistical significance tests.135 To avoid these potential
systematic and analytical errors, the current study followed a step-by-step procedure for building
hierarchical models. The fundamental theoretical underpinnings of hierarchical modeling are
presented in Appendix B.
Model Building Process
To estimate the most parsimonious models that best fit the data, the following three
distinct model building processes were conducted. First, intercept-only model or unconditional
model were carried out. The intercept-only model was used to calculate the intra-class
correlation coefficient (ICC) which estimates how much variation in neonatal hypoglycemia
exists between level-2 unit (i.e. hospitals). Second, level-1 fixed effects were added to a model to
assess the relationship between level-1 predictors (i.e. individual level characteristics) and
neonatal hypoglycemia. Third, level-2 predictors (contextual characteristics) were added to the
final model to evaluate the fixed effects of both individual and contextual characteristics (Table
IV.1). Forward selection methods (P ≤ 0.10) were used to identify variables that were eligible for
the multivariate analyses.
To assess the model fit, a likelihood ratio test which examines differences in the -2 log
likelihood (-2LL) were conducted. Since all models in the current analysis were nested (i.e.,
models that have been fit using the same data and where one model is a subset of the other),
model fit were assessed by examining the changes in the -2LL between models.
Results

60
A weighted total of 3,733,760 in-hospital births were included in the 2012 KID’s
inpatient database (Table IV.2). A total of 67,124 (5%) neonates were hypoglycemic. Among
neonates included in the study 51% of the neonates were male, while 52% were White, 14%
Black, 20% Hispanic, 13% Other (Asian/Pacific and Native Americans). Among neonates with
hypoglycemia 50% were small for gestational age, 15% were large for gestational age, 12% had
comorbidities, 40% were premature, 44% were delivered by cesarean section, 30% were born
from mothers with diabetes, and 2% of the births were associated with mothers with history of
substance/alcohol abuse. Almost all mothers were admitted through non-scheduled admission
(99%) and close to 80% of births occurred during weekdays.
The majority of newborns had some form of insurance coverage including 46% with
Medicaid, 46% with private insurance, and 7% with other types of coverages (self-pay and no
charge) (Table IV.3). The median household income in the zip code of patient’s residence were
proportionately distributed into 28% ($1-$38,999), 25% ($39,000-$47,999), 25% ($48,000 -
$62,999), and 22% ($63,000 and above). The majority of births occurred in urban hospitals
(88%), in hospitals with bed size greater than or equal to 400 (36%) between July and September
(27%). Furthermore, the majority of hospitals were large (63%), privately owned (72%) and well
distributed geographically among the four hospital regions including Northeast (17%), Midwest
(21%), South (38%), and West (24%). Fifty-seven percent of neonates with hypoglycemia were
born in teaching hospitals. Proportionate percentages of births were also observed in teaching
(50%) and non-teaching hospitals (50%).
Table IV.4 reports the results from the random intercept model that shows the bivariate
relationship between the specified variables and neonatal hypoglycemia. In this analysis male
sex (OR 1.3, 95% CI 1.27-1.31), Black (OR 1.1, 95% CI 1.05-1.11), Hispanic ( OR 0.8, 95% CI

61
0.77-0.81) and Other race (Asian/Pacific and Native Americans, OR 0.8, 95% CI 0.82-0.87),
morbidity (OR 2.7, 95% CI 2.57-2.73), small for gestational age (OR 9.6, 95% CI 9.41-9.72),
large for gestational age (OR 2.9, 95% CI 2.81-2.95), prematurity (OR 7.0, 95% CI 6.78-7.15),
delivery by caesarian section (OR 1.9, 95% CI 1.79-1.85), diabetes status (OR 5.6, 95% CI 5.46-
5.65), history of substance/alcohol abuse (OR 1.2, 95% CI 1.08-1.22), scheduled delivery (OR
0.8, 95% CI 0.64-0.92), emergency service use (OR 1.5, 95% CI 1.17-2.00), admission between
July and September (OR 1.1, 95% CI 1.03-1.08), admission between October and December (OR
1.1, 95% CI 1.06-1.11), neighborhood income above $63,000 (OR 0.9, 95% CI 0.94 - 0.99),
teaching hospitals (OR 1.7, 95% CI 1.58-1.87), medium hospital bed size (OR 1.2, 95% CI 1.04 -
1.29), large hospital bed size (OR 1.4, 95% CI 1.26-1.55), privately owned hospitals (OR 1.1,
95% CI 1.05-1.24), urban hospitals (OR 2.0, 95% CI 1.84-2.24), and Medicaid insurance (OR
1.2, 95% CI 1.01-1.35) were significantly associated with neonatal hypoglycemia.
Using the estimate obtained from the empty model, the intra-class correlation coefficient
(ICC) which indicates how much of the total variation in the probability of neonatal
hypoglycemia is accounted for by the hospitals was calculated. Hierarchical model assumes that
the dichotomous outcome from the hierarchical model comes from an unknown latent continuous
variable with a level-1 residual that follows a logistic distribution with a mean of 0 and a
variance of 3.29. 136,137 As a result, 3.29 were used as the level-1 variance (VP) while the hospital
variance (VH =0.8381) were obtained from the model.
ICC = VH / [(VH+VP)]*100
ICC = [0.8381 / (0.8381+3.29)]*100 = 20%
The above calculation indicates that 20% of the variability in the rate of neonatal
hypoglycemia is accounted by hospitals, leaving 80% of the variability to be accounted by

62
patients. The result also indicates that there is a statistically significant amount of variability
(VH=0.8381; Z = 26.74; p <.0001) in the odds of developing hypoglycemia between the
hospitals.
The model that was constructed to observe the relationship between individual level
predictors and neonatal hypoglycemia (model 2) is presented in Table IV.5. In this multivariate
analysis female sex (OR 0.8, 95% CI 0.81-0.85), Hispanic (OR 0.8, 95% CI 0.78-0.83), Other
race (Asian/Pacific and Native Americans, OR 0.9, 95% CI 0.84-0.90), morbidity (OR 2.6, 95%
CI 2.49-2.66), small for gestational age (OR 3.9, 95% CI 3.82-3.98), large for gestational age
(OR 2.8, 95% CI 2.76-2.92), prematurity (OR 1.9, 95% CI 1.87-1.99), delivery by caesarian
section (OR 1.4, 95% CI 1.38-1.44), diabetes status (OR 2.0, 95% CI 1.95-2.04), history of
substance/alcohol abuse (OR 1.2, 95% CI 1.10-1.25), scheduled delivery (OR 0.8, 95% CI 0.64 -
0.92), and emergency service use (OR 1.4, 95% CI 1.02-1.82) were significantly associated with
neonatal hypoglycemia.
The final model that combines both the individual and contextual level predictors is
presented in Table IV.6. In this analysis male sex (OR 1.2, 95% CI 1.18-1.23), Hispanic (OR 0.7,
95% CI 0.61-0.80) and Other race (Asian/Pacific and Native Americans, OR 0.8, 95% CI 0.78-
0.91), morbidity (OR 5.0, 95% CI 4.63-5.40), small for gestational age (OR 9.7, 95% CI 9.25-
10.27), large for gestational age (OR 3.1, 95% CI 2.86-3.34), prematurity (OR 3.8, 95% CI 3.44-
4.15), delivery by caesarian section (OR 1.5, 95% CI 1.50-1.59), diabetes status (OR 5.1, 95% CI
4.81-5.41), history of substance/alcohol abuse (OR 2.1, 95% CI 1.92-2.29), weekend admission
(OR 1.1, 95% CI 1.03-1.08), emergency service use (OR 1.5, 95% CI 1.10-2.00), teaching
hospitals (OR 1.2, 95% CI 1.10-1.34), and urban hospitals (OR 1.4, 95% CI 1.21-1.52) were
significantly associated with neonatal hypoglycemia.

63
The best fitting models were determined by using a likelihood ratio test which examines
differences in the -2 log likelihood (-2LL). Accordingly, Model 1 to Model 2 and then Model 2
to Model 3 were compared. The calculations for conducting the test between Model 1 and Model
2 is provided below. The positive value (χ2diff=291,922.9) obtained from the equation 1 shows
that model 2 is a better model than model 1.
χ2diff=(−2LLModel 1) − (−2LLModel 2 )………………………equation 1
χ2diff= (641,605.2) - (349,682.3)
χ2diff= 291,922.9
χ2diff=(−2LLModel 2) − (−2LLModel 3 ) ………………………equation 2
χ2diff= (349,682.3) - (52,276.9)
χ2diff= 297,405.4
After determining that Model 2 was a better fitting model than Model 1, a comparison
between Model 2 and Model 3 was made to examine whether the addition of the contextual level
variables improved the final model. The calculation from equation 2 (χ2diff=297,405.4) also
indicates that contextual level variables did improve the final model. This process showed that
Model 3, a model containing both the individual and contextual level fixed effects, was the best
fitting model.
Discussion
In our analysis of the 2012 HCUP KID database, which included more than 3.7 million
patient discharges, indicated a 5% (67,124) prevalence of neonatal hypoglycemia. Among
hypoglycemic neonates, we determined that 30% of neonates were born from diabetic mothers
compared to 7% born from non-diabetic mothers. We also determined that race, morbidity, small

64
for gestational age, large for gestational age, prematurity, delivery by caesarian section, diabetes
status, history of substance or alcohol abuse, scheduled delivery, emergency service use, urban
hospitals, and teaching hospitals were significantly associated with neonatal hypoglycemia. As
20% of the variability in the rate of neonatal hypoglycemia is accounted by the hospitals, our
specification of hierarchical modeling was appropriate to account for the variability among
hospitals.
In our analysis the most robust association, as evidenced by the statistical significance in
the multivariate analysis, was found between the individual level characteristics and neonatal
hypoglycemia. Our main hypothesis was confirmed by the strong association found between
neonatal hypoglycemia and diabetic mothers. Statistically significant associations were found
both in the bivariate random intercept model (OR 5.6) and multivariate model (OR 5.1). Most
studies of neonatal hypoglycemia not only focused on clinical risk factors but also used small
databases from single medical facilities without having proper comparison groups. Our study is
unique in that we used a large nationally validated database to determine the individual and
contextual risk factors of neonatal hypoglycemia both in diabetic and non-diabetic mothers. The
results of the current study highlight the high increased risk (5 fold) of neonatal hypoglycemia
among diabetic mothers compared to non-diabetic mothers at the national level. As neonatal
hypoglycemia is associated with acute and potentially permanent neurological damage4,138,
hospitals across the United States should develop a more effective method and devise
management strategies to identify fetuses from diabetic mothers so that intervention during the
neonatal period can be made.
Pertaining to the association between the other individual level risk factors and neonatal
hypoglycemia, our results were consistent with data from the literature. For example, Bollepalli

65
et al.10 found that large for gestational age or macrosomic infants had 3.5 fold higher odds of
developing hypoglycemia compared to non-macrosomic infants. Higher frequencies of maternal
diabetes and large for gestational age infants were also observed by Flores-le Roux et al.13 and
VanHaltren et al.34 Similar to our findings, Ramos et al.23 indicated that hypoglycemia was
statistically associated with prematurity, macrosomia, and Ponderal index, a measure of fetal
adiposity. Furthermore, similar to the current analysis, Tundidor et al.101 found that male sex as
an independent predictor of neonatal hypoglycemia (OR 2.13). Female newborns are more
insulin resistant than boys156, and this might suggest that male infants might be more prone to
neonatal hypoglycemia. Das et al.70 and Ecker et al.155 also found a higher percentage of
caesarian section among infants of diabetic mother compared to infants of non-diabetic mothers
which is in agreement with our findings. It is also worth noting that infants born from mothers
with a history of substance/alcohol abuse were prone to hypoglycemia (OR 2.1).
The Hispanic health paradox was also observed in our study. The paradox states that,
despite lower socioeconomic status Hispanics have comparable or better health outcomes than
whites. 139,140 Similar to what the paradox states, we found that Hispanic neonates were 30% less
likely to develop neonatal hypoglycemia compared to whites (Table IV.6). Lower birth trauma,
protective dietary practices, better breastfeeding habits, and strong social networks and support
are thought to be the main factors explaining these paradoxical result.141 Overall, the findings
related to the individual risk factors examined by the current study were consistent with the
literature.
This is the first study to incorporate contextual characteristics in determining risk factors
for neonatal hypoglycemia. Significant associations were observed in the relationship between
the contextual variables and neonatal hypoglycemia. In the bivariate random intercept models,
66
neighborhood income above $63,000 (OR 0.9), teaching hospitals (OR 1.7), large hospital bed
size (OR 1.4), privately owned hospitals (OR 1.1), urban hospitals (OR 2.0), and Medicaid
insurance (OR 1.2) were significantly associated with neonatal hypoglycemia. In the multivariate
analysis, however, only urban (OR 1.4) and teaching hospitals (OR 1.2) were significantly
associated with neonatal hypoglycemia.
Among the contextual characteristics, therefore, only urban and teaching hospitals had a
significant association with neonatal hypoglycemia. Although no studies were conducted to
determine the association of hospital characteristics and neonatal hypoglycemia, our findings
were consistent with studies that compared other health outcomes in teaching versus non-
teaching and urban versus rural hospitals. The apparent differences in neonatal health outcome in
these hospitals could be explained by 1) the quality of care that the hospitals provide and 2) the
overall health status of mothers who choose to get services in these hospitals.
The poorer neonatal health outcome in urban hospitals may be due to significant
variations in organizational and service mix characteristics that urban and rural hospitals
have.142,143 The literature on health care outcomes in urban versus rural hospitals shows that
urban hospitals have higher rates of caesarian section, lower patient safety outcomes, higher
adverse event rates, higher rates of infection due to medical care, lower quality of care, and
higher rates of pregnancy complication.144,145 Higher rate of insurance coverage in rural area and
younger age of rural mothers could also be the reason for the relatively better neonatal outcomes
in rural hospitals.145,146 In order to balance neonatal outcomes between urban and rural hospitals,
targeted intervention efforts that incorporate the particular healthcare needs of rural communities
should be introduced across hospitals in the United States.

67
Regarding neonatal outcomes in teaching hospitals, our findings were also consistent
with data from the literature. Differences in neonatal health outcome in these hospitals could also
be caused by the quality of care or the overall health status of mothers who received care in these
hospitals. Sloan et al.147 found that teaching hospitals had higher postoperative complications in
four of six surgical procedures considered in the study. In a study that included 16.9 million
Medicare patients, Yuan et al.148 found that teaching hospitals had the highest mortality rates. In
a study that included hospitals of Veterans Affairs, Khuri et al.149 also found that complication
rate was higher in teaching hospitals in six of seven specialties and four of eight operations.
In the current study, one can also presume that the difference in neonatal health outcomes
between teaching and non-teaching hospitals may be attributable to differences in the processes
of care. Teaching hospitals, for example, have a more complex structure involving multiple
levels of providers including medical students, interns, residents, and fellows, they serve as
referral centers for complex services and procedures, and most of them provide care for urban
underserved populations.150, 151 Furthermore, since residents are the primary care provider in
teaching hospitals149,152, there is a possibity that hypoglycemic neonates might be overlooked
during delivery.
Improving the quality care during pregnancies is crucial to prevent neonatal
hypoglycemia. For example, maternal blood glucose level in labor is independently associated
with neonatal hypoglycemia.100 Providing standardized management for diabetic women in labor
using an intravenous insulin-glucose protocol is effective in achieving stable maternal blood
glucose levels99 and reduce neonatal hypoglycemia. With the ongoing emphasis on quality of
care, the role of urban and teaching hospitals needs to be carefully scrutinized with regard to

68
neonatal health outcomes. Efforts should be made to examine further the structures and processes
of neonatal care prevailing in teaching and urban hospitals.
The current study was unique in several ways. First, the study used a nationally validated
database to assess risk factors of neonatal hypoglycemia. A large national database containing
millions of patient-level records has not been utilized in determining predictors of healthcare
outcomes related to neonatal hypoglycemia. As a result, the focus of previous research in this
area has been limited to assessing clinical risk factors using data generated from individual
hospitals. Second, due to the availability of a large database, we were able to include individual
and contextual characteristics in our analysis that were not considered in the past. Third, by
applying hierarchical models and taking complex survey design into consideration, we were able
to investigate and explain the sources of both within-hospital and between-hospital variations.
Although the use of hierarchical models is increasing, most studies using clustered data in the
health services literature have used ordinary least squares models (OLS). The use of OLS models
in clustered data tends to underestimate standard errors for the regression coefficient, resulting in
inflated type I error rates and misleadingly tight confidence intervals.153 By specifying the
appropriate hierarchical models, the current study ensured better inferences and yielded more
information than results that would have been obtained from traditional standard regression
models.
We also identified the limitations associated with the study. First, because of the structure
of the KID, we were not able to track patients over time to determine long term health impact of
neonatal hypoglycemia on, for example, neurological and cognitive developments. Therefore,
interpretation of the results should consider the retrospective cross-sectional nature of the study
design. Second, our analyses were limited to the variables that were provided by the data.

69
Although the variables included in the study are sufficient to understand the overall risk factors
of neonatal hypoglycemia, variables such as maternal age, educational background, and
individual income could have provided more insightful results. HCUP should consider these
variables in future preparations of the KID inpatient databases. Third, only 44 states participate
in the HCUP. Furthermore, as the data include only community, non-rehabilitation hospitals,
other types of hospitals such as Veterans’ Administration and Indian Health System facilities
were not included in the data. Our findings may have been underestimated by the exclusion of
states and hospitals. Finally, we recognize that errors in providers’ understanding of diagnostic
coding/groupings may lead to misclassifications of cases. Despite these limitations, however, the
KID database is the only nationally validated database that is available to conduct outcomes
research on the pediatric population and the use of such validated databases should be
encouraged in other areas of health services research.
Conclusions and Recommendations
The purpose of the current study was to construct multilevel models that include
individual-level and contextual-level characteristics in order to identify risk factors of neonatal
hypoglycemia in diabetic and non-diabetic mothers. We found that infant of diabetic mothers has
more than 5-fold increased risk of developing neonatal hypoglycemia compared to infants of
non-diabetic mothers. In addition, the increased risk of neonatal hypoglycemia in male,
premature, small for gestational age, large for gestational age, and neonates born from mothers
with a history of substance or alcohol abuse were also the most relevant results associated with
the individual risk factors. Increased awareness of neonatal hypoglycemia in these subgroups
should be encouraged to improve and changes clinical practices across hospitals in the United
States. Furthermore, we found that infants born in urban and teaching hospitals also had

70
significantly higher chance of developing neonatal hypoglycemia. Future research should focus
on the long term clinical significance of neonatal hypoglycemia by including a broader
individual and environmental factors.
Neonatal hypoglycemia is a highly preventable medical condition and yet it poses a
significant health threat to the newborns including long-term neurological damage resulting in
mental retardation, developmental delay, and personality disorders.39,49,154 In order to prevent and
improve the clinical practices of hypoglycemia the following recommendations, based on the
findings from the current study, are forwarded:
1. We found that the individual level risk factors have the most robust association with
neonatal hypoglycemia. Therefore, triage treatment system can be developed based on
whether the neonate has the specified individual level risk factors. For example, as infants
of diabetic mothers have more than 5-fold increased risk of developing hypoglycemia,
priority should be given to all diabetic mothers in order to facilitate early diagnosis and
treatment of hypoglycemia. Special attention should also be given to infants that are male,
premature, small for gestational age, large for gestations age, infants with comorbidities,
infants delivered by caesarian section and those born from mothers with a history of
substance abuse.
2. Treatment of neonatal hypoglycemia oftentimes involves admission to Neonatal Intensive
Care for intravenous dextrose which is costly and disruptive for the establishment of
breast feeding.157 As evidenced by the current study, most of the risk factors can be
prevented by establishing a well thought-out parental care in hospitals across the United
States so that high risk pregnancies can be identified and closely monitored.

71
3. In order to balance neonatal outcomes between urban and rural hospitals, targeted
intervention efforts that incorporates the particular needs of these hospitals should be
introduced. Furthermore, with the ongoing emphasis on quality of care, the role of
teaching and urban hospitals needs to be carefully scrutinized with regard to neonatal
health outcomes. Efforts should also be made to examine further the structures and
processes of neonatal care prevailing in teaching and urban hospitals.

72
Table IV.1. Model Building Process for Hierarchical Logistic Regression
Models Variables Expected Output
Model-1 Empty model, no predictors,
only random effect for the
intercept
Output used to calculate ICC
which provides information on
how much variation in neonatal
hypoglycemia exists between
level-2 units
Model-2 Model 1 + fixed effect for
individual level variables
Output indicate the relationship
between individual level
predictors and neonatal
hypoglycemia
Model-3 Model 2 + fixed effect for
contextual level variables
Contextual level fixed effect
results indicate the relationship
between contextual level
predictors and the neonatal
hypoglycemia. Model 3 also
include results from model 2
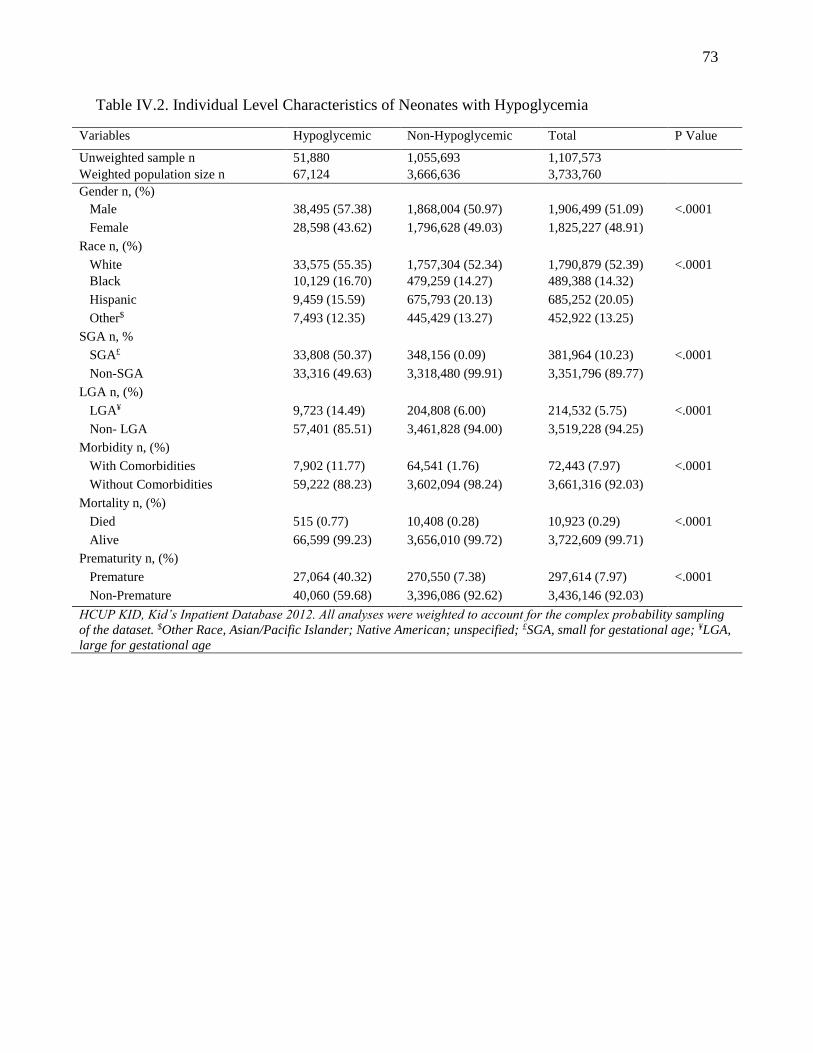
73
Table IV.2. Individual Level Characteristics of Neonates with Hypoglycemia
Variables Hypoglycemic Non-Hypoglycemic Total P Value
Unweighted sample n 51,880 1,055,693 1,107,573
Weighted population size n 67,124 3,666,636 3,733,760
Gender n, (%)
Male 38,495 (57.38) 1,868,004 (50.97) 1,906,499 (51.09) <.0001
Female 28,598 (43.62) 1,796,628 (49.03) 1,825,227 (48.91)
Race n, (%)
White 33,575 (55.35) 1,757,304 (52.34) 1,790,879 (52.39) <.0001
Black 10,129 (16.70) 479,259 (14.27) 489,388 (14.32)
Hispanic 9,459 (15.59) 675,793 (20.13) 685,252 (20.05)
Other$ 7,493 (12.35) 445,429 (13.27) 452,922 (13.25)
SGA n, %
SGA£ 33,808 (50.37) 348,156 (0.09) 381,964 (10.23) <.0001
Non-SGA 33,316 (49.63) 3,318,480 (99.91) 3,351,796 (89.77)
LGA n, (%)
LGA¥ 9,723 (14.49) 204,808 (6.00) 214,532 (5.75) <.0001
Non- LGA 57,401 (85.51) 3,461,828 (94.00) 3,519,228 (94.25)
Morbidity n, (%)
With Comorbidities 7,902 (11.77) 64,541 (1.76) 72,443 (7.97) <.0001
Without Comorbidities 59,222 (88.23) 3,602,094 (98.24) 3,661,316 (92.03)
Mortality n, (%)
Died 515 (0.77) 10,408 (0.28) 10,923 (0.29) <.0001
Alive 66,599 (99.23) 3,656,010 (99.72) 3,722,609 (99.71)
Prematurity n, (%)
Premature 27,064 (40.32) 270,550 (7.38) 297,614 (7.97) <.0001
Non-Premature 40,060 (59.68) 3,396,086 (92.62) 3,436,146 (92.03)
HCUP KID, Kid’s Inpatient Database 2012. All analyses were weighted to account for the complex probability sampling
of the dataset. $Other Race, Asian/Pacific Islander; Native American; unspecified; £SGA, small for gestational age; ¥LGA,
large for gestational age

74
Table IV.2. Continued.
Variables Hypoglycemic Non-Hypoglycemic Total P Value
Unweighted sample n 51,880 1,055,693 1,107,573
Weighted population size n 67,124 3,666,636 3,733,760
Delivery Mode n, (%)
Cesarean Section 29,903 (44.55) 114,2704 (31.16) 117,2607 (31.41) <.0001
Normal Delivery 37,221 (55.45) 2,523,931 (68.84) 2,561,152 (68.59)
Mothers’ Diabetic Status n, (%)
Diabetic 20,674 (30.80) 259,243 (7.07) 279,917 (7.50) <.0001
Non-Diabetic 46,450 (69.20) 3,407,393 (92.93) 3,453,843 (92.50)
Admission Day n, (%)
Weekday 53,029 (79.00) 2,929,102 (79.89) 2,982,131 (79.87) <.0001
Weekend 14,095 (21.00) 737,532 (20.11) 751,627 (20.13)
Scheduled Admission Status n, %
Scheduled Delivery 164 (0.24) 8,391 (0.23) 8,555 (0.23) <.0001
Non Scheduled Delivery 6,6874 (99.76) 3,654,687 (99.77) 3,721,561 (99.77)
Emergency* Dept. Service n, (%)
Serviced 88 (0.001) 2,214 (0.001) 2,302 (0.06) <.0001
Not Serviced 67,037 (99.9) 3,664,422 (99.9) 3,731,459 (99.94)
History of Sub/alc. Abuse n, (%)
Indicated 1,566 (2.33) 27,584 (0.75) 29,150 (0.78) <.0001
Not-Indicated 65,558 (97.67) 3,639,052 (99.25) 3,704,610 (99.22)
HCUP KID, Kid’s Inpatient Database 2012. All analyses were weighted to account for the complex probability sampling
of the dataset. *Emergency=HCUP Emergency Department service indicator

75
Table IV.3. Contextual Level Characteristics of Neonates with Hypoglycemia
Variables Hypoglycemic Non-Hypoglycemic Total P Value
Unweighted sample n 51,880 1,055,693 1,107,573
Weighted population size n 67,124 3,666,636 3,733,760
Type of Insurance
Medicaid 30,843 (46.04) 1,695,905 (46.38) 1,726,748 (46.37) <.0001
Medicare 276 (0.41) 12,991 (0.36) 1,326,7 (0.36)
Private insurance 31,799 (47.46) 1,687,688 (46.15) 1,719,487 (46.18)
Other % 4,081 (6.09) 259,998 (7.1) 264,079 (7.09)
Teaching status n, (%)
Teaching 38,050 (56.69) 1,813,077 (49.6) 1,851,127 (49.58) <.0001
Non-Teaching 29,074 (43.31) 1,853,559 (50.55) 1,882,633 (50.42)
Bed Size n, (%)
Small (1-99) 6,187 (9.22) 406,305 (11.08) 412,492 (11.05) <.0001
Medium (100-399) 16,811 (25.04) 935,351 (25.51) 952,162 (25.50)
Large (≥ 400) 44,126 (65.74) 2,324,980 (63.41) 2,369,106 (63.45)
Ownership n, (%)
Private 49,286 (73.43) 2,651,655 (72.32) 2,700,941 (72.34) <.0001
Public 17,838(26.57) 1,014,981 (27.68) 1,032,819 (27.66)
Neighborhood Income#
1st Quartile (1 - 38,999) 18,405 (27.92) 1,023,540 (28.41) 1,041,945 (28.40) <.0001
2nd Quartile (39,000 - 47,999) 15,945 (24.19) 886,723 (24.61) 902,668 (24.61)
3rd Quartile (48,000 - 62,999) 16,086 (24.40) 886,738 (24.61) 902,824 (24.61)
4th Quartile (63,000+) 15,489 (23.49) 805,520 (22.36) 821,009 (22.38)
HCUP KID, Kid’s Inpatient Database 2012. All analyses were weighted to account for the complex probability
sampling of the dataset. %Other Insurance = Self-pay, No charge, Other; #Income =Median Household Income for
patient’s Zip code divided into 4 quartiles

76
Table IV.3. Continued.
Variables Hypoglycemic Non-Hypoglycemic Total P Value
Unweighted sample n 51,880 1,055,693 1,107,573
Weighted population size n 67,124 3,666,636 3,733,760
Admission Season
January-March 15,388 (22.93) 880,221 (24.01) 895,609 (23.99) <.0001
April-June 16,034 (23.89) 889,119 (24.25) 905,153 (24.25)
July-September 18,080 (26.94) 975,669 (26.61) 993,749 (26.62)
October-December 17,605 (26.23) 920,905 (25.12) 938,510 (25.14)
Hospital Location
Rural 5,576 (8.31) 441,988 (12.05) 447,564 (11.99) <.0001
Urban 61,548 (91.69) 3,224,647 (87.95) 3,286,195 (88.01)
Hospital Region
Northeast 11,645 (17.35) 603,344 (16.45) 614,988 (16.47) <.0001
Midwest 14,847 (22.12) 779,609 (21.26) 794,456 (21.28)
South 25,813 (38.46) 1,395,779 (38.07) 1,421,592 (38.07)
West 14,820 (22.08) 887,905 (24.22) 902,725 (24.18)
HCUP KID, Kid’s Inpatient Database 2012. All analyses were weighted to account for the complex probability
sampling of the dataset.

77
Table IV.4. Odds Ratio, 95% CIs, and P Values from Bivariate Random Intercept Models for
Individual Level and Contextual Level Risk Factors
Variables OR* 95% CI P value
Male 1.3 1.273 - 1.313 <.0001
Black 1.1 1.052 - 1.107 <.0001
Hispanic 0.8 0.769 - 0.812 0.0002
Other$ 0.8 0.820 - 0.869 <.0001
Morbidity 2.7 2.573 - 2.734 <.0001
SGA£ 9.6 9.409 - 9.718 <.0001
LGA¥ 2.9 2.812 - 2.945 <.0001
Premature 7.0 6.782 - 7.150 <.0001
Cesarean Section 1.9 1.795 - 1.852 <.0001
Diabetic 5.6 5.455 - 5.648 <.0001
Substance 3.2 2.971 - 3.343 <.0001
Scheduled Delivery 0.8 0.635 - 0.920 0.0046
Weekend 1.0 1.022 - 1.062 <.0001
Emergency# 2.2 1.646 - 2.833 0.0018
2nd Quartile (39,000 - 47,999) 0.9 0.970 - 1.017 0.0833
3rd Quartile (48,000 - 62,999) 0.9 0.931 - 0.978 0.1898
4th Quartile (63,000+) 0.9 0.944 - 0.997 0.0302
Lower Income 1.0 1.018 - 1.058 0.0001
Midwest€ 1.2 1.123 - 1.190 <.0001
South 1.1 1.111 - 1.172 <.0001
West 1.1 1.081 - 1.135 <.0001
2nd Quarter Admission 1.0 0.999 - 1.045 <.0001
3rd Quarter Admission 1.1 1.033 - 1.079 0.0291
4th Quarter Admission 1.1 1.057 - 1.105 <.0001
Teaching Status 1.7 1.579 - 1.865 <.0001
Medium Bed Size (100-399)Ω 1.2 1.035 - 1.290 <.0001
Large Bed Size (≥ 400) 1.4 1.263 - 1.549 <.0001
Privately Owned 1.1 1.053 - 1.244 0.0016
Urban Hospitals 2.0 1.838 - 2.242 <.0001
Medicaid∞ 1.2 1.008 - 1.352 0.0389
Private insurance 1.0 1.017 - 1.056 0.0002
Other% 0.9 0.830 - 0.898 <.0001 *OR, unadjusted odds ratio; $Other Race, Asian/Pacific Islander; Native American; Unspecified; £SGA, small for gestational age; ¥LGA, large for gestational age; CI, confidence interval; #Emergency, HCUP Emergency Department service indicator; €Northeast region used as
reference; Ω Small (1-99) used as reference; ∞Medicare used as reference; %Other Insurance,
Self-pay, No charge

78
Table IV.5. Odds Ratio, 95% CIs, and P Values from Model 2 that Indicate the Relationship
between Individual Level Predictors and Neonatal Hypoglycemia
Variables OR* 95% CI P value
Female 0.8 0.81 - 0.85 <.0001
Black 1.0 0.94 - 1.09 <.0001
Hispanic 0.8 0.78 - 0.83 0.0003
Other$ 0.9 0.84 - 0.90 <.0001
Morbidity 2.6 2.49 - 2.66 <.0001
SGA£ 3.9 3.82 - 3.98 <.0001
LGA¥ 2.8 2.76 - 2.92 <.0001
Premature 1.9 1.87 - 1.99 <.0001
Cesarean Section 1.4 1.38 - 1.44 <.0001
Diabetic 2.0 1.95 - 2.04 <.0001
Substance 1.2 1.10 - 1.25 <.0001
Scheduled Delivery 0.8 0.66 - 0.99 0.0473
Weekend 1.0 1.01 - 1.06 0.0075
Emergency# 1.4 1.02 - 1.82 0.0370 +NH, Neonatal hypoglycemia;*OR, adjusted odds ratio; $Other Race, Asian/Pacific Islander;
Native American; £SGA, small for gestational age; ¥LGA, large for gestational age; CI,
confidence interval; #Emergency, HCUP Emergency Department service indicator

79
Table IV.6. Odds Ratio, 95% CIs, and P Values from Model 3 that Indicate the Relationship
Between Individual and Contextual Level Predictors and Neonatal Hypoglycemia
Variables OR* 95% CI P value
Male 1.2 1.18 - 1.23 <.0001
Black 1.0 0.90 - 1.06 0.5739
Hispanic 0.7 0.61 - 0.80 <.0001
Other$ 0.8 0.78 - 0.91 <.0001
Morbidity 5.0 4.63 - 5.40 <.0001
SGA£ 9.7 9.25 - 10.27 <.0001
LGA¥ 3.1 2.86 - 3.34 <.0001
Premature 3.8 3.44 - 4.15 <.0001
Cesarean Section 1.5 1.50 - 1.59 <.0001
Diabetic 5.1 4.81 - 5.41 <.0001
Substance 2.1 1.92 - 2.29 <.0001
Scheduled Delivery 1.0 0.79 - 1.57 0.5470
Weekend 1.1 1.03 - 1.08 <.0001
Emergency# 1.5 1.10 - 2.00 0.0106
2nd Quartile (39,000 - 47,999) 1.0 0.94 - 1.05 0.7809
3rd Quartile (48,000 - 62,999) 0.9 0.90 - 1.04 0.4293
4th Quartile (63,000+) 1.0 0.93 - 1.10 0.8046
Midwest€ 0.9 0.85 - 1.10 0.8046
South 0.9 0.87 - 1.10 0.4293
West 0.9 0.87 - 1.09 0.7809
2nd Quarter Admission 1.0 1.00 - 1.06 0.0002
3rd Quarter Admission 1.1 1.02 - 1.13 0.0040
4th Quarter Admission 1.1 1.05 - 1.15 0.0747
Teaching Status 1.2 1.10 - 1.34 0.0001
Medium Bed Size (100-399)Ω 1.1 0.92 - 1.24 0.2939
Large Bed Size (≥ 400) 1.1 0.94 - 1.23 0.4090
Privately Owned 1.0 0.90 - 1.14 0.8254
Urban Hospitals 1.4 1.21 - 1.52 <.0001
Medicaid∞ 0.9 0.67 - 1.09 0.2124
Private insurance 0.9 0.68 - 1.13 0.3010
Other% 0.8 0.60 - 1.04 0.2124 +NH, Neonatal hypoglycemia;*OR, unadjusted odds ratio; $Other Race, Asian/Pacific Islander;
Native American; £SGA, small for gestational age; ¥LGA, large for gestational age; CI,
confidence interval; #Emergency, HCUP Emergency Department service indicator; €Northeast
region used as reference; Ω Small (1-99) used as reference; ∞Medicare used as reference; %Other
Insurance = Self-pay, No charge

80
CHAPTER V
CONCLUSIONS
The overall purpose of this dissertation was to gain a better understanding of the
healthcare outcomes and resources utilizations related to neonates with hypoglycemia. To
achieve this overarching goal, a series of interrelated studies with multiple sub-goals were
carried out. The first goal of this dissertation was to conduct a systematic review in order to
investigate whether previous studies only focused on clinical risk factors or included a broader
health service-related contextual risk factors in assessing the determinants of neonatal
hypoglycemia. The second purpose was to identify the key factors associated with increased
hospital cost related to neonatal hypoglycemia in the United States. Lastly, the final purpose of
the dissertation was to construct multi-level models that include individual-level and contextual-
level characteristics in order to predict neonatal hypoglycemia in diabetic and non-diabetic
mothers. In order to summarize the findings within this dissertation the hypotheses from the
Chapter I are revisited:
Aim 1 - Hypothesis: In the literature, all studies will focus on the individual level characteristics
as determining risk factors for neonatal hypoglycemia.
Findings: The hypothesis related to the first aim was confirmed as the evidence demonstrated
that the studies included in the systematic review mainly focused on the clinical risk factors of
neonatal hypoglycemia. Although infant-related and mother-related risk factors were specified in
these studies broader health service-related contextual risk factors were not included.
Aim 2 - Hypothesis 2.1: Healthcare outcome measures including length of stay, comorbidities,
mortality, prematurity, number of procedures, hospital bed size, chronic conditions, and hospital
teaching status will predict increased hospital cost associated with neonatal hypoglycemia.

81
Findings: This hypothesis was supported by the evidence that the indicated healthcare outcome
measures were significantly associated with increased hospital cost. To maximize the accuracy
of the cost estimation and model prediction, our study, for the first time, used actual cost by
converting the total hospital charge to total hospital cost using the cost to charge ratio provided
by the HCUP KID database.
Aim 2 - Hypothesis 2.2: Neonates with hypoglycemia will consume a higher percentage of
resources associated with hospital births while accounting for a smaller percentage of
hospitalization.
Findings: This hypothesis was supported by the evidence that neonates with hypoglycemia
consumed 11% of resources associated with hospital births while accounting for only 1.5% of
hospitalization. Although healthcare resource utilization of hypoglycemia has been adequately
addressed in the adult population, this topic has not been studied in neonates with hypoglycemia.
As a result, these findings will provide important information to help allocate resources
efficiently.
Aim 3 – Hypothesis 3.1: Infants born from diabetic mothers have significantly higher chance of
developing hypoglycemia compared to those born from non-diabetic mothers.
Findings: This hypothesis was confirmed by the strong association found between neonatal
hypoglycemia and diabetic mothers. Statistically significant associations were observed both in
the bivariate random intercept model (OR 5.6) and multivariate model (OR 5.1).
Aim 3 – Hypothesis 3.2: The addition of the contextual factors will enhance the predictive power
of the model that will be constructed to predict neonatal hypoglycemia in diabetic and non-
diabetic pregnancies.

82
Findings: This hypothesis was confirmed by the findings of the investigation. The calculations
form the -2 log likelihood ratio test indicated that the addition of the contextual variables
improved the final predictive model. In addition, the magnitudes of the odds ratios on many of
the variables in model 2 has also shown a significant increase in model 3. This magnifies the
importance of using border environmental risk factors in health services research.
Summary and Policy Implications
The systematic review included in this dissertation (Project I) provided an important
synthesis of the available data on current neonatal hypoglycemia literature. Project I determined
that there is evidence supporting the clinical importance of giving attention to infants of diabetic
mothers. However, the systematic review also determined that previous neonatal hypoglycemia
studies had been solely focused on clinical or individual level risk factors. The infant-related
clinical risk factors identified in Project I were small for gestational age, large for gestational
age, macrosomia, prematurity, lower cord blood glucose, Ponderal Index, and male sex. In
addition, ethnic origin, diabetes diagnosed prior to 28 weeks of gestation, pre-pregnancy BMI
≥25 kg/m2, hyperglycemia, blood glucose, maternal diabetes type, and material HbA1c were also
identified as mother-related clinical risk factors. As such, the project identified the need to
include a broader contextual level risk factors in assessing the determinants of neonatal
hypoglycemia.
Project II sought to determine the overall hospital cost estimates in neonates with
hypoglycemia and to identify predictors of increased hospital cost. Since previous studies have
focused on estimations of the economic cost of hypoglycemia in the adult population44-49, Project
II is the first study providing an empirical estimate of the hospital cost of neonatal hypoglycemia
at the national level. To maximize the accuracy of the cost estimation and prediction of increased

83
cost, Project II used cost to charge ratio to covert total charge to total cost. Furthermore, Project
II determined that medium and large hospital bed sizes, length of stay, teaching hospitals,
composite neonatal comorbidities, prematurity, occurrence of chronic conditions, and mortality
as independent predictors of increased hospital cost associated with neonatal hypoglycemia.
Lastly, Project II demonstrated that neonates with hypoglycemia consumed 11% of resources
associated with hospital births while accounting for only 1.5% of hospitalization. Although
Project II encompassed the investigation of the resource utilization, further research is needed to
explore longitudinal trends of hospital cost and their variation among different patient and
hospital characteristics.
Project III focused on the identification of individual and contextual level risk factors
among diabetic and non-diabetic mothers using multilevel modeling scheme. Project III
determined that 30% of neonates were born from diabetic mothers compared to 7% born from
non-diabetic mothers and that 20% of the variability in the rate of neonatal hypoglycemia is
accounted by the hospitals. Furthermore, Project III determined that neonates had more than 5-
fold increased risk of developing hypoglycemia. Lastly, project III determined that male sex,
Hispanic race, Asian/Pacific and Native Americans race, morbidity, small for gestational age,
large for gestational age, prematurity, delivery by caesarian section, history of substance/alcohol
abuse, scheduled delivery, emergency service use, urban hospitals, and teaching hospitals as
significant predictors neonatal hypoglycemia. In Project III the most robust association was
found the between the individual level risk factors and neonatal hypoglycemia. Future research
should focus on the long term clinical significance of neonatal hypoglycemia by including a
broader individual and environmental factors.

84
Neonatal hypoglycemia is the most frequently encountered metabolic disorder of
newborn infants and has been linked to various adverse health outcomes4,5 including neurological
damage and death.1,49 The results of the investigations within this dissertation estimated the total
hospital cost and identified predictors of increased cost related to neonatal hypoglycemia for the
first time. With the current increase in the overall healthcare cost in the United States, there is a
strong interest to enhance efficacy through reform and system improvement.50,158 A better
understanding of total cost estimates and factors associated with increased hospital cost is
important to help hospitals improve the efficiency of the care they provide and to decrease costs
while maintaining high quality of care. Furthermore, the current dissertation identified the key
individual and contextual level risk factors that can help neonatal care providers create triage
treatment system to identify hypoglycemic neonates more quickly and efficiently. Hospitals
across the United States should develop, therefore, a more effective method and devise
management strategies to identify fetuses from diabetic mothers so that intervention during the
neonatal period can be made. In addition, in the current dissertation urban and teaching hospital
were significantly associated with neonatal hypoglycemia. Although one can argue that focusing
on the mothers who are coming to these facilities is more important in terms of preventing
neonatal hypoglycemia, the quality of services in these facilities could also be a significant
factor. As neonates with asymptomatic hypoglycemia could easily be neglected of proper
care16,41,77,121, the quality of neonatal care provided by hospitals is crucial to identify these
subgroups. As a result, the processes of care in urban and teaching hospitals should be carefully
scrutinized with regard to neonatal health outcomes. Although hypoglycemia is the most
common metabolic disorder of the newborn, with proactive prenatal care, proper case
management, and appropriate intuitional policy for treatment, it can be prevented almost entirely.

85
REFERENCES
1. Damschroder, L. J., Aron, D. C., Keith, R. E., Kirsh, S. R., Alexander, J. A., & Lowery,
J. C. (2009). Fostering implementation of health services research findings into practice:
a consolidated framework for advancing implementation science. Implementation
science, 4(1), 50.
2. Shi, L. (2007). Health services research methods. Cengage Learning, John Hopkins
University, Baltimore, MD.
3. De Leon, D. D., & Stanley, C. A. (2007). Mechanisms of disease: advances in diagnosis
and treatment of hyperinsulinism in neonates. Nature Clinical Practice Endocrinology &
Metabolism, 3(1), 57-68.
4. Najati, N., & Saboktakin, L. (2010). Prevalence and Underlying etiologies of Neonatal
hypoglycemia. Pakistan Journal of Biological Sciences, 13(15), 753.
5. Manual, I. C. N. H. S. (2004). Neonatal hypoglycemia. The Regents of University of
California. University of California, Oakland, CA.
6. Rozance, P. J., & Hay, W. W. (2006). Hypoglycemia in newborn infants: features
associated with adverse outcomes. Neonatology, 90(2), 74-86.
7. Hartmann, A. F., Jaudon, J. C., & Morton, M. (1937). Hypoglycemia. The Journal of
Pediatrics, 11(1), 1-36.
8. Cornblath, M., & Ichord, R. (2000). Hypoglycemia in the neonate. In Seminars in
perinatology (Vol. 24, No. 2, pp. 136-149). WB Saunders, Philadelphia, PA.
9. Laptook, A., & Jackson, G. L. (2006). Cold stress and hypoglycemia in the late preterm
(“near-term”) infant: impact on nursery of admission. In Seminars in perinatology (Vol.
30, No. 1, pp. 24-27). WB Saunders, Philadelphia, PA.

86
10. Tin, W. (2014, February). Defining neonatal hypoglycaemia: a continuing debate. In
Seminars in Fetal and Neonatal Medicine (Vol. 19, No. 1, pp. 27-32). WB Saunders.
Philadelphia, PA.
11. Faustino, E. V. S., Hirshberg, E. L., & Bogue, C. W. (2012). Hypoglycemia in critically
ill children. Journal of diabetes science and technology, 6(1), 48-57.
12. Stomnaroska-Damcevski, O., Petkovska, E., Jancevska, S., & Danilovski, D. (2015).
Neonatal Hypoglycemia: A Continuing Debate in Definition and Management. Prilozi,
36(3), 91-97.
13. Araz, N., & Araz, M. (2006). Frequency of neonatal hypoglycemia in large for
gestational age infants of non-diabetic mothers in a community maternity hospital. Acta
Medica-Hradec Kralove, 49(4), 237.
14. Hawdon, J. M., Platt, M. W., & Aynsley-Green, A. (1994). Prevention and management
of neonatal hypoglycaemia. Archives of Disease in Childhood Fetal and Neonatal
edition, 70(1), 60.
15. Holtrop, P. C. (1993). The frequency of hypoglycemia in full-term large and small for
gestational age newborns. American journal of perinatology, 10(02), 150-154.
16. Straussman, S., & Levitsky, L. L. (2010). Neonatal hypoglycemia. Current Opinion in
Endocrinology, Diabetes and Obesity, 17(1), 20-24.
17. Lubchenco, L. O., & Bard, H. (1971). Incidence of hypoglycemia in newborn infants
classified by birth weight and gestational age. Pediatrics, 47(5), 831-838.
18. Stanley, C. A., & Baker, L. (1999). The causes of neonatal hypoglycemia. New England
Journal of Medicine, 340(15), 1200-1201.

87
19. Singhal, P. K., Singh, M., Paul, V. K., Lamba, I. M., Malhotra, A. K., Deorari, A. K., &
Ghorpade, M. D. (1992). Prevention of hypoglycemia: a controlled evaluation of sugar
fortified milk feeding in small-for-gestational age infants. Indian pediatrics, 29(11),
1365-1369.
20. Hawdon, J. M. (1999). Hypoglycaemia and the neonatal brain. European Journal of
Pediatrics, 158(1), S9-S12.
21. Agrawal, R. K., Lui, K., & Gupta, J. M. (2000). Neonatal hypoglycaemia in infants of
diabetic mothers. Journal of Paediatrics and Child Health, 36(4), 354-356.
22. Burdan, D. R., Botiu, V., & Teodorescu, D. (2009). Neonatal hypoglycemia-the
incidence of the risk factors in salvator vuia obstetrics-gynecology hospital,
Arad. Timisoara Medical Journal, 59(78), 5.
23. Ramos, G. A., Hanley, A. A., Aguayo, J., Warshak, C. R., Kim, J. H., & Moore, T. R.
(2012). Neonatal chemical hypoglycemia in newborns from pregnancies complicated by
type 2 and gestational diabetes mellitus–the importance of neonatal ponderal index. The
Journal of Maternal-Fetal & Neonatal Medicine, 25(3), 267-271.
24. Gomella, T. L., Cunningham, M. D., & Eyal, F. G. (2009). Neonatology: Management,
Procedures, On-Call Problems, Diseases, and Drugs. 6th Ed. McGraw-Hill, New York,
NY.
25. Flores-le Roux, J. A., Sagarra, E., Benaiges, D., Hernandez-Rivas, E., Chillaron, J. J., de
Dou, J. P., & Pedro-Botet, J. (2012). A prospective evaluation of neonatal hypoglycemia
in infants of women with gestational diabetes mellitus. Diabetes Research and Clinical
Practice, 97(2), 217-222.

88
26. Silva, J. K., Kaholokula, J. K. A., Ratner, R., & Mau, M. (2006). Ethnic differences in
perinatal outcome of gestational diabetes mellitus. Diabetes Care, 29(9), 2058-2063.
27. Esakoff, T. F., Caughey, A. B., Block-Kurbisch, I., Inturrisi, M., & Cheng, Y. W. (2011).
Perinatal outcomes in patients with gestational diabetes mellitus by race/ethnicity. The
Journal of Maternal-Fetal & Neonatal Medicine, 24(3), 422-426.
28. Tanzer, F., Yazar, N., Yazar, H., & Icagasioglu, D. (1997). Blood glucose levels and
hypoglycaemia in full term neonates during the first 48 hours of life. Journal of tropical
pediatrics, 43(1), 58-60.
29. Blank, A., Grave, G. D., & Metzger, B. E. (1995). Effects of gestational diabetes on
perinatal morbidity reassessed: report of the International Workshop on Adverse Perinatal
Outcomes of Gestational Diabetes Mellitus, December 3–4, 1992. Diabetes Care, 18(1),
127-129.
30. Brand, P. L. P., Molenaar, N. L. D., Kaaijk, C., & Wierenga, W. S. (2005).
Neurodevelopmental outcome of hypoglycaemia in healthy, large for gestational age,
term newborns. Archives of Disease in Childhood, 90(1), 78-81.
31. Diwakar, K. K., & Sasidhar, M. V. (2002). Plasma glucose levels in term infants who are
appropriate size for gestation and exclusively breast fed. Archives of Disease in
Childhood-Fetal and Neonatal Edition, 87(1), F46-F48.
32. Sebastian Manzanares, G., Angel Santalla, H., Irene Vico, Z., Lopez Criado, M. S., Alicia
Pineda, L., & Jose Luis Gallo, V. (2012). Abnormal maternal body mass index and
obstetric and neonatal outcome. The Journal of Maternal-Fetal & Neonatal Medicine,
25(3), 308-312.

89
33. Maayan-Metzger, A., Schushan-Eisen, I., Lubin, D., Moran, O., Kuint, J., & Mazkereth,
R. (2014). Delivery room breastfeeding for prevention of hypoglycaemia in infants of
diabetic mothers. Fetal and Pediatric Pathology, 33(1), 23-28.
34. VanHaltren, K., & Malhotra, A. (2013). Characteristics of infants at risk of
hypoglycaemia secondary to being ‘infant of a diabetic mother’. Journal of Pediatric
Endocrinology and Metabolism, 26(9-10), 861-865.
35. Cordero, L., & Landon, M. B. (1993). Infant of the diabetic mother. Clinics in
Perinatology, 20(3), 635.
36. Cordero, L., Treuer, S. H., Landon, M. B., & Gabbe, S. G. (1998). Management of
infants of diabetic mothers. Archives of Pediatrics & Adolescent Medicine, 152(3), 249-
254.
37. Metzger, B. E., Buchanan, T. A., Coustan, D. R., De Leiva, A., Dunger, D. B., Hadden,
D. R., & Pettitt, D. J. (2007). Summary and recommendations of the fifth international
workshop-conference on gestational diabetes mellitus. Diabetes care, 30(Supplement 2),
S251-S260.
38. Neligan, G. A., Robson, E., & Watson, J. (1963). Hypoglycaemia in the newborn. A
sequel of intrauterine malnutrition. Obstetrical & Gynecological Survey, 18(6), 906-908.
39. Vannucci, R. C., & Vannucci, S. J. (2001, April). Hypoglycemic brain injury.
In Seminars in neonatology (Vol. 6, No. 2, pp. 147-155). WB Saunders. Philadelphia,
PA.
40. Cloherty, J. P., Eichenwald, E. C., & Stark, A. R. (Eds.). (2008). Manual of neonatal
care. Lippincott Williams & Wilkins. Philadelphia, PA.

90
41. Zenk, K. E. (2004). Neonatology: management, procedures, on-call problems, diseases,
and drugs (pp. 77-101). T. L. Gomella, M. D. Cunningham, & F. G. Eyal (Eds.).
McGraw-Hill, New York, NY.
42. Suh, S. W., Hamby, A. M., & Swanson, R. A. (2007). Hypoglycemia, brain energetics,
and hypoglycemic neuronal death. Glia, 55(12), 1280-1286
43. Boluyt, N., Van Kempen, A., & Offringa, M. (2006). Neurodevelopment after neonatal
hypoglycemia: a systematic review and design of an optimal future study. Pediatrics,
117(6), 2231-2243.
44. Gallo, F., Maggi, D., & Cordera, R. (2016). The economic burden of severe
hypoglycemia: Two sides of the same coin. Comment on G. Veronese and Coll. Costs
associated with emergency care and hospitalization for severe hypoglycemia. Nutrition,
metabolism, and cardiovascular diseases: NMCD.
45. Moisan, J., Breton, M. C., Villeneuve, J., & Gregoire, J. P. (2013). Hypoglycemia-related
emergency department visits and hypoglycemia-related hospitalizations among new users
of antidiabetes treatments. Canadian journal of diabetes, 37(3), 143-149.
46. Liu, S., Zhao, Y., Hempe, J. M., Fonseca, V., & Shi, L. (2012). Economic burden of
hypoglycemia in patients with Type 2 diabetes. Expert Review of Pharmacoeconomics &
Outcomes Research, 12(1), 47-51.
47. Zhao, Y., Shi, Q., Wang, Y., Fonseca, V., & Shi, L. (2016). Economic burden of
hypoglycemia: Utilization of emergency department and outpatient services in the United
States (2005–2009). Journal of Medical Economics, 1-6.

91
48. Zhang, Y., Wieffer, H., Modha, R., Balar, B., Pollack, M., & Krishnarajah, G. (2010).
The burden of hypoglycemia in type 2 diabetes: a systematic review of patient and
economic perspectives. JCOM, 17(12), 547-557.
49. Kim, G., Lee, Y. H., Han, M. H., Lee, E. K., Kim, C. H., Kwon, H. S., ... & Kim, D. J.
(2016). Economic burden of hypoglycemia in patients with type 2 diabetes mellitus from
Korea. PloS One, 11(3), e0151282.
50. Loos, R. (2005). Adding it all up. Medicare, Medicaid spending will keep skyrocketing.
Modern Healthcare, 35(8), 8.
51. Wall, T. C., Fargason, C. A., & Johnson, V. A. (1997). Comparison of inpatient charges
between academic and nonacademic services in a children's hospital. Pediatrics, 99(2),
175-179.
52. Selby, J. V., Ray, G. T., Zhang, D., & Colby, C. J. (1997). Excess costs of medical care
for patients with diabetes in a managed care population. Diabetes care, 20(9), 1396-1402.
53. Finkler, S. A. (1982). The distinction between cost and charges. Annals of Internal
Medicine, 96(1), 102-109.
54. HCUP Kids’ Inpatient Database (KID). Healthcare Cost and Utilization Project (HCUP)
(2012). Agency for Healthcare Research and Quality: Rockville, MD.
55. Hay Jr, W. W., & Rozance, P. J. (2010). Continuous glucose monitoring for diagnosis
and treatment of neonatal hypoglycemia. The Journal of Pediatrics, 157(2), 180-182.
56. Rozance, P. J., & Hay, W. W. (2006). Hypoglycemia in newborn infants: features
associated with adverse outcomes. Neonatology, 90(2), 74-86
57. Mehta, A. (1994). Prevention and management of neonatal hypoglycaemia. Archives of
Disease in Childhood-Fetal and Neonatal Edition, 70(1), F54-F60.

92
58. Bronfenbrenner, U. (1979). The ecology of human development. Harvard university press.
59. Bronfenbrenner, U. (1986). Recent advances in research on the ecology of human
development. In Development as action in context (pp. 287-309). Springer. Berlin,
Germany.
60. Bronfenbrenner, U. (1988). Interacting systems in human development. Research
paradigms: Present and future. Persons in context: Developmental processes, 25-49.
61. Bronfenbrenner, U. (1993). The ecology of cognitive development: Research models and
fugitive findings. RH Wozniam & KW Fisher, eds, Persons in context: Developmental
processes.
62. Bronfenbrenner, U. (1994). Ecological models of human development. Readings on the
Development of Children, 2(1), 37-43.
63. McLeroy, K. R., Bibeau, D., Steckler, A., & Glanz, K. (1988). An ecological perspective
on health promotion programs. Health Education & Behavior, 15(4), 351-377.
64. Glanz, K., Rimer B. K. & Viswanath, K. (2008), Health Behaviour and Health Education
– Theory, Research and Practice, 4th edn, John Wiley and Sons, San Francisco, CA.
65. Chimphamba Gombachika, B., Fjeld, H., Chirwa, E., Sundby, J., & Maluwa, A. (2012).
A social ecological approach to exploring barriers to accessing sexual and reproductive
health services among couples living with HIV in southern Malawi. ISRN Public Health,
2012.
66. Golden, S. D., McLeroy, K. R., Green, L. W., Earp, J. A. L., & Lieberman, L. D. (2015).
Upending the social ecological model to guide health promotion efforts toward policy
and environmental change. Health Education & Behavior, 8S-14S.

93
67. Dahlberg LL, Krug EG. Violence-a global public health problem. In: Krug E, Dahlberg
LL, Mercy JA, Zwi AB, Lozano R, eds. World Report on Violence and Health. Geneva,
Switzerland: World Health Organization; 2002:1–56.
68. Cassel, K. D. (2010). Using the social-ecological model as a research and intervention
framework to understand and mitigate obesogenic factors in Samoan populations.
Ethnicity & Health, 15(4), 397-416.
69. Glasgow, R. E., Wagner, E. H., Kaplan, R. M., Vinicor, F., Smith, L., & Norman, J.
(1999). If diabetes is a public health problem, why not treat it as one? A population-based
approach to chronic illness. Annals of Behavioral Medicine, 21(2), 159.
70. Das, S., Irigoyen, M., Patterson, M. B., Salvador, A., & Schutzman, D. L. (2009).
Neonatal outcomes of macrosomic births in diabetic and non-diabetic women. Archives
of Disease in Childhood-Fetal and Neonatal Edition, 94(6), F419-F422.
71. Burns, C. M., Rutherford, M. A., Boardman, J. P., & Cowan, F. M. (2008). Patterns of
cerebral injury and neurodevelopmental outcomes after symptomatic neonatal
hypoglycemia. Pediatrics, 122(1), 65-74.
72. Garcia-Patterson, A., Aulinas, A., María, M. A., Ubeda, J., Orellana, I., Ginovart, G. &
Corcoy, R. (2012). Maternal body mass index is a predictor of neonatal hypoglycemia in
gestational diabetes mellitus. The Journal of Clinical Endocrinology & Metabolism,
97(5), 1623-1628.
73. Majeed, N. A. (2011). Glycated haemoglobin is a good predictor of neonatal
hypoglycaemia in pregnancies complicated by diabetes. The Malaysian Journal of
Pathology, 33(1), 21.

94
74. Handler, A., Issel, M., & Turnock, B. (2001). A conceptual framework to measure
performance of the public health system. American Journal of Public Health, 91(8),
1235-1239.
75. Healthcare Cost and Utilization Project Summary (2012). Statistics Report KID. From
https://www.hcupus.ahrq.gov/db/nation/kid/tools/stats/KID_2012_MaskedStats_Core.PD
F.Accessed 11 February 2017.
76. National Center for Health Statistics (US). (1980). The International Classification of
Diseases, 9th Revision, Clinical Modification: Procedures: tabular list and alphabetic
index (Vol. 3). US Department of Health and Human Services, Public Health Service,
Health Care Financing Administration.
77. Healthcare Cost and Utilization Project. Cost-to-charge ratio files. Retrieved from
www.hcup-us.ahrq.gov/db/state/costtocharge.jsp, accessed 2 November 2016.
78. Song X, Friedman B. (2008). Calculate cost adjustment factors by APR-DRG and CCS
using selected states with detailed charges. HCUP Methods Series Report. 4.
79. Coffey, R. M., Ball, J. K., Johantgen, M., Elixhauser, A., Purcell, P., & Andrews, R.
(1997). The case for national health data standards. Health Affairs, 16(5), 58-72.
80. Berthelsen, C. L. (2000). Evaluation of coding data quality of the HCUP National
Inpatient Sample. Topics in health information management, 21(2), 10-23.
81. Schoenman, J. A., Sutton, J. P., Kintala, S., Love, D., & Maw, R. (2005). The Value of
Hospital Discharge Databases. NORC at the University of Chicago, Chicago, IL.
82. Kieszak, S. M., Flanders, W. D., Kosinski, A. S., Shipp, C. C., & Karp, H. (1999). A
comparison of the Charlson comorbidity index derived from medical record data and
administrative billing data. Journal of Clinical Epidemiology, 52(2), 137-142.

95
83. Malenka, D. J., McLerran, D., Roos, N., Fisher, E. S., & Wennberg, J. E. (1994). Using
administrative data to describe casemix: a comparison with the medical record. Journal
of Clinical Epidemiology, 47(9), 1027-1032.
84. De, A. K., Biswas, R., Samanta, M., & Kundu, C. K. (2011). Study of blood glucose level
in normal and low birth weight newborns and impact of early breast feeding in a tertiary
care centre. Annals of Nigerian Medicine, 5(2), 53.
85. Sperling, M. A., & Menon, R. K. (2004). Differential diagnosis and management of
neonatal hypoglycemia. Pediatric Clinics of North America, 51(3), 703-723.
86. Kliegman, R., Behrman, R. E., & Nelson, W. E. (2016). Nelson textbook of pediatrics.
Saunders, UK.
87. Tin, W. (2014). Defining neonatal hypoglycaemia: a continuing debate. Semin Fetal
Neonatal Med. 19(1): 27–32.
88. Hawdon, J. M., Platt, M. W., & Aynsley-Green, A. (1994). Prevention and management
of neonatal hypoglycaemia. Archives of Disease in Childhood Fetal and Neonatal
edition, 70(1), 60.
89. Von Elm, E., Altman, D. G., Egger, M., Pocock, S. J., Gotzsche, P. C., Vandenbroucke,
J. P., & Strobe Initiative. (2007). The Strengthening the Reporting of Observational
Studies in Epidemiology (STROBE) statement: guidelines for reporting observational
studies. Preventive medicine, 45(4), 247-251.
90. Silva, J. K., Kaholokula, J. K. A., Ratner, R., & Mau, M. (2006). Ethnic differences in
perinatal outcome of gestational diabetes mellitus. Diabetes Care, 29(9), 2058-2063.
91. Sarkar, S., Watman, J., Seigel, W. M., & Schaeffer, H. A. (2003). A prospective
controlled study of neonatal morbidities in infants born at 36 weeks or more gestation to

96
Women with diet-controlled gestational diabetes (GDM-class Al). Journal of
Perinatology, 23(3), 223-228.
92. Persson, M., Pasupathy, D., Hanson, U., & Norman, M. (2012). Disproportionate body
composition and perinatal outcome in large‐for‐gestational‐age infants to mothers with
type 1 diabetes. An International Journal of Obstetrics & Gynaecology, 119(5), 565-572.
93. Lepercq, J., Taupin, P., Dubois-Laforgue, D., Duranteau, L., Lahlou, N., Boitard, C., &
Timsit, J. (2008). Heterogeneity of fetal growth in type 1 diabetic pregnancy. Diabetes &
Metabolism, 27(3), 339-345.
94. Ballard, J. L., Rosenn, B., Khoury, J. C., & Miodovnik, M. (1993). Diabetic fetal
macrosomia: significance of disproportionate growth. The Journal of pediatrics, 122(1),
115-119.
95. Bollepalli, S., Dolan, L. M., Miodovnik, M., Feghali, M., & Khoury, J. C. (2010).
Asymmetric large-for-gestational-age infants of type 1 diabetic women: morbidity and
abdominal growth. American Journal of Perinatology, 27(08), 603-610.
96. Ferrara, A., Weiss, N. S., Hedderson, M. M., Quesenberry Jr, C. P., Selby, J. V., Ergas, I.
J., & Sacks, D. A. (2007). Pregnancy plasma glucose levels exceeding the American
Diabetes Association thresholds, but below the National Diabetes Data Group thresholds
for gestational diabetes mellitus, are related to the risk of neonatal macrosomia,
hypoglycaemia, and hyperbilirubinaemia. Diabetologia, 50(2), 298-306.
97. Carpenter, M. W., & Coustan, D. R. (1982). Criteria for screening tests for gestational
diabetes. American Journal of Obstetrics and Gynecology, 144(7), 768-773.

97
98. Mitrovic, M., Stojic, S., Tesic, D. S., Popovic, D., Rankov, O., Tomic-Naglic, D., &
Kovacev-Zavisic, B. (2014). The impact of diabetes mellitus on the course and outcome
of pregnancy during a 5-year follow-up. Vojnosanitetski Pregled, 71(10), 907-914. 35
99. Ryan, E. A., Sia, W. W., Khurana, R., Marnoch, C. A., Nerenberg, K. A., & Ghosh, M.
(2012). Glucose control during labour in diabetic women. Journal of Obstetrics and
Gynaecology Canada, 34(12), 1149-1157.
100. Taylor, R., Lee, C., Kyne-Grzebalski, D., Marshall, S. M., & Davison, J. M. (2002).
Clinical outcomes of pregnancy in women with type 1 diabetes. Obstetrics & Gynecology,
99(4), 537-541.
101. Tundidor, D., Garcia-Patterson, A., Maria, M. A., Ubeda, J., Ginovart, G., Adelantado, J.
M., & Corcoy, R. (2012). Perinatal maternal and neonatal outcomes in women with
gestational diabetes mellitus according to fetal sex. Gender Medicine, 9(6), 411-417.
102. Chertok, I. R. A., Raz, I., Shoham, I., Haddad, H., & Wiznitzer, A. (2009). Effects of
early breastfeeding on neonatal glucose levels of term infants born to women with
gestational diabetes. Journal of Human Nutrition and Dietetics, 22(2), 166-169.
103. Strobe Initiative. (2008). STROBE statement—checklist of items that should be included
in reports of observational studies. International Journal of Public Health, 53, 3-4.
104. Lucas, A., Morley, R., & Cole, T. J. (1988). Adverse neurodevelopmental outcome of
moderate neonatal hypoglycaemia. Bmj, 297(6659), 1304-1308.
105. Bonacruz, G. L., Arnold, J. D., Leslie, G. I., Wyndham, L., & Koumantakis, G. (1996).
Survey of the definition and screening of neonatal hypoglycemia in Australia. Journal of
Paediatrics and Child Health, 32(4), 299-301.

98
106. American Diabetes Association. (2016). Standards of medical care in diabetes—2016.
Diabetes care, 39(Supplement 1), S11-S61.
107. Gregory, J. W., & Aynsley-Green, A. (1993). The definition of hypoglycemia. Bailliere's
Clinical Endocrinology and Metabolism, 7(3), 587-590.
108. Wybregt, S. H., Reisner, S. H., Patel, R. K., Nellhaus, G., & Cornblath, M. (1964). The
incidence of neonatal hypoglycemia in a nursery for premature infants. The Journal of
Pediatrics, 64(6), 796-802.
109. Creery, R. D. G. (1966). Hypoglycaemia in the newborn: diagnosis, treatment, and
prognosis. Developmental Medicine & Child Neurology, 8(6), 746-754.
110. Balion, C., Grey, V., Ismaila, A., Blatz, S., & Seidlitz, W. (2006). Screening for
hypoglycemia at the bedside in the neonatal intensive care unit (NICU) with the Abbott
PCx glucose meter. BMC Pediatrics, 6(1), 1.
111. Lilien, L. D., Pildes, R. S., Srinivasan, G., Voora, S., & Yeh, T. F. (1980). Treatment of
neonatal hypoglycemia with minibolus and intravenous glucose infusion. The Journal of
Pediatrics, 97(2), 295-298.
112. Harris, D. L., Weston, P. J., Battin, M. R., & Harding, J. E. (2014). A survey of the
management of neonatal hypoglycaemia within the Australian and New Zealand Neonatal
Network. Journal of Paediatrics and Child Health, 50(10), E55-E62.
113. Griffiths, A. D., & Bryant, G. M. (1971). Assessment of Effects of Neonatal
Hypoglycaemia A Study of 41 Cases with Matched Controls. Archives of Disease in
Childhood, 46(250), 819-827.
114. Cowett, R. M., Howard, G. M., Johnson, J., & Vohr, B. (1997). Brain stem auditory-
evoked response in relation to neonatal glucose metabolism. Neonatology, 71(1), 31-36.

99
115. Langer, O., Conway, D. L., Berkus, M. D., Xenakis, E. M. J., & Gonzales, O. (2000). A
comparison of glyburide and insulin in women with gestational diabetes mellitus. New
England Journal of Medicine, 343(16), 1134-1138.
116. Jacobson, G. F., Ramos, G. A., Ching, J. Y., Kirby, R. S., Ferrara, A., & Field, D. R.
(2005). Comparison of glyburide and insulin for the management of gestational diabetes in
a large managed care organization. American Journal of Obstetrics and Gynecology,
193(1), 118-124.
117. Moher, D., Klassen, T. P., Schulz, K. F., Berlin, J. A., Jadad, A. R., & Liberati, A.
(2000). What contributions do languages other than English make on the results of meta-
analyses? Journal of Clinical Epidemiology, 53(9), 964-972.
118. Klassen, T. P., Lawson, M. L., & Moher, D. (2005). Language of publication restrictions
in systematic reviews gave different results depending on whether the intervention was
conventional or complementary. Journal of Clinical Epidemiology, 58(8), 769-776.
119. Hosmer, D. W., Taber, S., & Lemeshow, S. (1991). The importance of assessing the fit of
logistic regression models: a case study. American Journal of Public Health, 81(12),
1630-1635.
120. Daniel, W.W. (1995). Biostatistics: a foundation for analysis in the health sciences. John
Wiley and Sons. Inc, New York, NY.
121. Kline, G. A., & Edwards, A. (2007). Antepartum and intra-partum insulin management of
type 1 and type 2 diabetic women: Impact on clinically significant neonatal hypoglycemia.
Diabetes Research and Clinical Practice, 77(2), 223-230.
100
122. DePuy, A. M., Coassolo, K. M., Som, D. A., & Smulian, J. C. (2009). Neonatal
hypoglycemia in term, nondiabetic pregnancies. American Journal of Obstetrics and
Gynecology, 200(5), 45-51.
123. Alkalay, A. L., Flores-Sarnat, L., Sarnat, H. B., Farber, S. J., & Simmons, C. F. (2006).
Plasma glucose concentrations in profound neonatal hypoglycemia. Clinical Pediatrics,
45(6), 550-558.
124. Osier, F. H. A., Berkley, J. A., Ross, A., Sanderson, F., Mohammed, S., & Newton, C. R.
J. C. (2003). Abnormal blood glucose concentrations on admission to a rural Kenyan
district hospital: prevalence and outcome. Archives of Disease in Childhood, 88(7), 621-
625.
125. Sweet, C. B., Grayson, S., & Polak, M. (2013). Management strategies for neonatal
hypoglycemia. The Journal of Pediatric Pharmacology and Therapeutics, 18(3), 199-208.
126. Heck, R. H., & Thomas, S. L. (2015). An introduction to multilevel modelling techniques:
MLM and SEM approaches using Mplus. Routledge, New York, NY.
127. Hox, J. J., Moerbeek, M., & van de Schoot, R. (2010). Multilevel analysis: Techniques
and applications. Routledge, New York, NY.
128. Klein, K. J., & Kozlowski, S. W. (2000). Multilevel theory, research, and methods in
organizations: Foundations, extensions, and new directions. Jossey-Bass. San Francisco,
CA.
129. Raudenbush, S. W., & Bryk, A. S. (2002). Hierarchical linear models: Applications and
data analysis methods (Vol. 1). Sage, Thousand Oaks, CA.
130. Donner A, Klar N. (2000). Cluster randomization. Editorial. Stat Methods Med Res,
9:79–80.
101
131. Julian, M. W. (2001). The consequences of ignoring multilevel data structures in
nonhierarchical covariance modeling. Structural Equation Modeling, 8(3), 325-352.
132. Moerbeek, M. (2004). The consequence of ignoring a level of nesting in multilevel
analysis. Multivariate Behavioral Research, 39(1), 129-149.
133. Shadish, W.R., Cook, T. D., & Campbell, D. T. (2002). Experimental and quasi-
experimental designs for generalized causal inference. Wadsworth Cengage Learning,
Boston, MA.
134. Wampold, B. E., & Serlin, R. C. (2000). The consequence of ignoring a nested factor on
measures of effect size in analysis of variance. Psychological Methods, 5(4), 425.
135. Goldstein, H. (2005). Multilevel statistical models (4th Ed.). John Wiley & Sons, Ltd.
136. Snijders, T.A.B. & Bosker, R.J. (1999). Multilevel analysis: An Introduction to basic and
advanced multilevel modeling. Sage, Thousand Oaks, CA.
137. O’Connell, A. A., Goldstein, J., Rogers, H. J., & Peng, C. J. (2008). Multilevel logistic
models for dichotomous and ordinal data. Multilevel Modeling of Educational Data, 199-
242.
138. Pedersen, J. (1954). Weight and length at birth of infants of diabetic mothers. Acta
Endocrinologica, 16(4), 330-342.
139. Chatman J., Donato K. M., & Guerra R. (2007). Infant Mortality and the Hispanic
Paradox: A Meta-analysis. Prepared for presentation at the 2007 annual meeting of the
Population Association of America. Rice University, Houston, TX.
140. Ribble, F., Ph.D., M., & Keddie, M. S. P. H. (2001). Understanding the Hispanic
paradox. Ethn Dis, 11(3), 496-518.

102
141. Ruiz, J. M., Steffen, P., & Smith, T. B. (2013). Hispanic mortality paradox: a systematic
review and meta-analysis of the longitudinal literature. American Journal of Public
Health, 103(3), e52-e60.
142. Coburn, A. F., Wakefield, M., Casey, M., Moscovice, I., Payne, S., & Loux, S. (2004).
Assuring rural hospital patient safety: what should be the priorities? The Journal of Rural
Health, 20(4), 314-326.
143. Moscovice, I., Wholey, D. R., Klingner, J., & Knott, A. (2004). Measuring rural hospital
quality. The Journal of Rural Health, 20(4), 383-393.
144. Vartak, S., Ward, M. M., & Vaughn, T. E. (2010). Patient safety outcomes in small urban
and small rural hospitals. The Journal of Rural Health, 26(1), 58-66.
145. Kozhimannil, K. (2014). Rural-urban differences in childbirth care, 2002-2010, and
implications for the future. Medical Care, 52(1), 4.
146. Hulme, P. A., & Blegen, M. A. (1999). Residential status and birth outcomes: is the
rural/urban distinction adequate? Public Health Nursing, 16(3), 176-181.
147. Sloan, F. A., Conover, C. J., & Provenzale, D. (2000). Hospital credentialing and quality
of care. Social Science & Medicine, 50(1), 77-88.
148. Yuan, Z., Cooper, G. S., Einstadter, D., Cebul, R. D., & Rimm, A. A. (2000). The
association between hospital type and mortality and length of stay: a study of 16.9 million
hospitalized Medicare beneficiaries. Medical Care, 231-245.
149. Khuri, S. F., Najjar, S. F., Daley, J., Krasnicka, B., Hossain, M., Henderson, W. G., &
DePalma, R. (2001). Comparison of surgical outcomes between teaching and nonteaching
hospitals in the Department of Veterans Affairs. Annals of surgery, 234(3), 370.

103
150. Thiemann, D. R., Coresh, J., & Powe, N. R. (2000). Quality of care at teaching and
nonteaching hospitals. JAMA, 284(23), 2994-2995.
151. Ayanian, J. Z., Weissman, J. S., Chasan-Taber, S., & Epstein, A. M. (1998). Quality of
care for two common illnesses in teaching and nonteaching hospitals. Health Affairs,
17(6), 194-205.
152. Johns, M. M., Wolman, D. M., & Ulmer, C. (Eds.). (2009). Resident duty hours:
enhancing sleep, supervision, and safety. National Academies Press, Washington, D.C.
153. Houchens, R., Chu, B., & Steiner, C. (2007). Hierarchical Modeling using HCUP Data
HCUP Methods Series Report# 2007–01 Online. US Agency for Healthcare Research and
Quality.
154. Dalgic, N., Ergenekon, E., Soysal, S., Koç, Ε., Atalay, Y., & GuCuyener, K. (2002).
Transient neonatal hypoglycemia-long-term effects on neurodevelopmental
outcome. Journal of Pediatric Endocrinology and Metabolism, 15(3), 319-324.
155. Ecker, J. L., Greenberg, J. A., Norwitz, E. R., Nadel, A. S., & Repke, J. T. (1997). Birth
weight as a predictor of brachial plexus injury. Obstetrics & Gynecology, 89(5), 643-647.
156. Wilkin, T. J., Voss, L. D., Metcalf, B. S., Mallam, K., Jeffery, A. N., Alba, S., & Murphy,
M. J. (2004). Metabolic risk in early childhood: the EarlyBird Study. International
Journal of Obesity, 28(S3), S64.
157. Harding, J. E., Hegarty, J. E., Crowther, C. A., Edlin, R., Gamble, G., & Alsweiler, J. M.
(2015). Randomised trial of neonatal hypoglycaemia prevention with oral dextrose gel
(hPOD): study protocol. BMC Pediatrics, 15(1), 120.
158. Loos, R. (2005). Budget woes. Medicaid, Medicare likely targets. Modern Healthcare,
35(11), 8.

104
159. Hosmer, D. W., & Lemeshow, S. (2000). Special topics. Applied Logistic Regression,
Second Edition, 260-351.
160. Dai, J., Li, Z., & Rocke, D. (2006). Hierarchical logistic regression modeling with SAS
GLIMMIX. In Proceedings of the Thirty-first Annual SAS Users Group International
Conference. SAS Institute Inc, Cary, NC.
161. Demidenko, E. (2013). Mixed models: theory and applications with R. John Wiley &
Sons, New York, NY.
162. Littell, R. C., Stroup, W. W., Milliken, G. A., Wolfinger, R. D., & Schabenberger, O.
(2006). SAS for mixed models. SAS Institute Inc, Cary, NC.

105
APPENDICES
Appendix A. Codes for the Identification of Variables
Variables
ICD-9-CM/ PRCCS/ DXCCS/ DRG24
Neonatal Hypoglycemia 775.6 (ICD-9-CM)
Large for Gestational Age 766.1 (ICD-9-CM)
Small for Gestational Age 764.0, V21.30- V21.35 (ICD-9-CM)
Prematurity 386, 387, 388, 375 (DRG24)
History of Alcohol/Substance Abuse 660, 661 (DXCCS); 52,433,521,523 (DRG24)
Complicated Pregnancy 219 (DXCCS)
Delivery by
Cesarean Section
669.7; V3001(ICD-9-CM)/ 134,
134,740,741,742,743,744,745,746,747,748,749 (PRCCS)/
370, 371 (DRG24)
Indicator of Diabetic Status
(Type I, Type II, Gestational)
250.01-250.93, 775.0, 648.03, 648.83 (ICD-9-CM)/ 49,
50, 186 (DXCCS)/295 (DRG24)
Comorbidities
Jitteriness 796.9 (ICD-9-CM)
Hypotonia 781.3 (ICD-9-CM)
Lethargy 780.7 (ICD-9-CM)
Irritability 799.22 (ICD-9-CM)
Apnea 786.03 (ICD-9-CM)
Tachypnea 786.06 (ICD-9-CM)
Poor feeding 783.3 (ICD-9-CM)
Hypothermia 991.6 (ICD-9-CM)
Sepsis 995.91, 771.81 (ICD-9-CM)
Seizures 345.0-345.9 (ICD-9-CM)
Neurodevelopmental Delay 315.0-315.9 (ICD-9-CM)
ICD-9-CM= International classification of diseases, 9th version; PRCCS= Clinical classification software
category for all procedures; DRG24= Diagnostic related groups, version 24; DXCCS=Clinical classifications
software category for all diagnosis
106
Appendix B: Single-level versus Multi-level Models
Let us assume that 𝑌 is neonatal hypoglycemia with binary outcome which follows the
Bernoulli distribution 𝑌 ~ Bin (1, π). Equation 1 indicate a single-level logistic regression where
i =1…𝐼𝑗 is the individual level variable, j= 1…J is the contextual level variable, conditional on
the risk factor for neonatal hypoglycemia 𝑥 (e.g. prematurity). Ordinary logistic regression
model (equation 1) assumes individual level random errors 𝑒𝑖𝑗 are independent with moments E
(𝑒𝑖𝑗) = 0 and Var (𝑒𝑖𝑗) = 𝜎𝑒2=𝜋𝑖𝑗(1 − 𝜋𝑖𝑗).159 Equation 2 indicates the probability function of the
outcome variable and it has the 𝑖𝑗 subscripts to show that that individual level factors are nested
within the contextual level factors (i.e. the subjects within hospitals). However, this model is
single-level because it does not contain contextual level effects.
To extend the single-level model into multi-level analysis, we add design level variables
to equation 1 so that each higher-level unit has its own intercept in the model (equation 3).160-162
In this case, the hospital intercept is treated as random effect 𝛼𝑗 (j=1….J). This leads to a random
intercept model (equation 4) which is the combination of a grand mean (𝛼) and a deviation from
that mean (𝑢𝑗). The random variable 𝑢𝑗 is assumed to be normally distributed 𝑢𝑗 ~ N (0, 𝜎𝑢2) and
independent of the single level random error 𝑒𝑖𝑗.
The model in equation 4 is a multi-level logistic regression model with two levels of
hierarchy. At level 1, outcome is expressed as the sum of an intercept for the patient’s hospital
and the patient’s risk factor. At level 2, the hospital level intercepts as the sum of an overall
mean and the random deviations from that mean are specified. Equation 5 is a hierarchical/mixed
model because it has both fixed effects (α, β) and random effects(𝑢𝑗). However, equation 5 has
treat the hospital effect as a random effects only and does not include hospital level predictors
(level-2).

107
Single-Level Logistic Regression Model
𝑌𝑖𝑗 = 𝜋𝑖𝑗 + 𝑒𝑖𝑗,
logit(𝜋𝑖𝑗) = log(𝜋𝑖𝑗
1 − 𝜋𝑖𝑗) = 𝛼 + 𝛽𝑥𝑖𝑗
Eq.1
𝜋𝑖𝑗 =exp( 𝛼 + 𝛽𝑥𝑖𝑗)
1 + exp( 𝛼 + 𝛽𝑥𝑖𝑗)
Eq.2
Random Intercept and Level-1 Fixed Effects
logit(𝜋𝑖𝑗) = 𝛼𝑗 + 𝛽𝑥𝑖𝑗 Eq.3
logit(𝜋𝑖𝑗) = 𝛼𝑗 + 𝛽𝑥𝑖𝑗
𝛼𝑗 = 𝛼 + 𝑢𝑗 Eq.4
logit(𝜋𝑖𝑗) = 𝛼 + 𝑢𝑗 + 𝛽𝑥𝑖𝑗 Eq.5
Random Intercept and Level-1 + Level-2 Fixed Effects
logit(𝜋𝑖𝑗) = 𝛼𝑗 + 𝛽𝑥𝑖𝑗
𝛼𝑗 = 𝛼 + 𝛾𝑧𝑗 + 𝑢𝑗
Eq.6
logit(𝜋𝑖𝑗) = 𝛼 + 𝛾𝑧𝑗 + 𝑢𝑗 + 𝛽𝑥𝑖𝑗 Eq.7
As the objective of the current study is to also see the effects of contextual level
attributes, a hospital level predictors (e.g. z for teaching status) should be included in equation 4.
Equation 6 now indicates that the intercept 𝛼𝑗 is a linear combination of a grand mean (𝛼),
hospital fixed effect (𝛾), and hospital foxed effect (𝑢𝑗). Equation 7 is the final mathematical
model that contain the individual level and hospital level fixed effects. For the purpose of
simplicity, during the model building process, only one individual and one hospital level
variables were included. However, in the actual analysis multiple individual and hospital or
contextual level variables were included.

108
VITA
Brook T. Alemu, PhD, MA, MPH, CPH, CIP
Department of Study Old Dominion University
College of Health Sciences
2114 Health Sciences Building
Norfolk, VA 23529
EDUCATION
Doctor of Philosophy, Old Dominion University, Norfolk, VA Fall 2017
Major Area: Health Services Research
Cognate: Statistics
Dissertation: Healthcare Outcomes and Resource Utilization Associated with Neonatal
Hypoglycemia: Analysis of Data from the HCUP Kid’s Inpatient Database.
Master of Public Health, Eastern Virginia Medical School, Norfolk, VA May 2014
Major Area: Public Health
Concentration: Epidemiology
Masters Research Project: Determinants of Elevated Alkaline Phosphatase in Patients Infected
with HIV.
Master of Arts, Unity University, Ethiopia August 2011
Major Area: Development Economics
Bachelor of Arts, Addis Ababa University, Ethiopia August 2007
Major Area: Economics
SELECTED PUBLICATIONS
Alemu, B. T., Cramer, R. J., Carlisle, K. L., & Akpinar-Elci, M. (2017). A Theoretical
Analysis of Health Beliefs of Physical Activity among Women with Previous
Gestational Diabetes—A Commentary. American Journal of Health Education, 1-4
Alemu, B. T., Troy, S. B., Beydoun, H. A., Akpinar-Elci, M., & Cunningham, T. D.
(2016). Determinants of Elevated Alkaline Phosphatase in Patients Infected with HIV.
Southern medical journal, 109(8), 487.
Alemu, B. T., Olayinka, O., Baydoun, H. A., Hoch, M., & Elci, M. A. (2016). Neonatal
hypoglycemia in diabetic mothers: A systematic review. Current Pediatric Research,
21(1), 42-53.
Summers, P., Alemu, B. T., & Quidgley-Nevares, A. (2014). History of drug use
predicts opioid treatment agreement violation. Journal of opioid management, 11(6),
501-506.