Embed Size (px)
Citation preview

TEMPORAL DISTRIBUTION OF INSECTICIDE RESIDUES IN FOUR
CALIFORNIA RIVERS
C. Ganapathy, C. Nordmark, K. Bennett, A. Bradley
and
H. Feng, J. Hernandez, J. White
December 1997

Abstract
Several studies have indicated that certain pesticides are present in Californiarivers at levels which could be harmful to aquatic life. Generally, these studieshave been conducted during certain seasons, but not year-round. Since year-round pesticide concentration data was limited for many California rivers havingsignificant amounts of agricultural runoff, water was collected weekly from onesampling site along each of four rivers for a one-year period. This study was acooperative effort between the Department of Pesticide Regulation (DPR) and theCalifornia Department of Fish and Game (CDFG). The portion conducted byDPR was an investigation of organophosphate, carbamate, and endosulfanresidues in surface waters of four rivers: the Sacramento, Merced, Salinas andRussian Rivers. In addition to pesticide residue quantification by DPR, sampleswere tested for toxicity and ammonia concentration by CDFG on a bimonthlybasis. Monitoring began on the Sacramento River in November 1993, followedby the Merced River in June of 1994 and by the Salinas and the Russian Riversin August 1994. The primary sampling method was collecting composite samplesduring a 3-day period with an automatic sampler. Equal-width depth-integratedsampling and grab samples were also used. Pesticides were detected two ormore times on each river. Diazinon was detected twice on the Sacramento Riverduring periods of increased river flows. Dimethoate was detected twice,methidathion and diazinon were detected three times, and 3-hydroxy carbofuranwere detected in samples collected from the Merced River. Each detection cameduring increased flows and with the exception of the dimethoate detections, thedetections occurred during the rainy season. Chlorpyrifos was detected duringthe first major runoff event of the rainy season along the Salinas River. Sampleswere also collected monthly at the Salinas River Lagoon. Diazinon anddimethoate were detected in one sample collected in early summer. Samplescollected from the Russian River yielded two detections: diazinon during the firstrunoff event in the fall and dimethoate during a winter rain event. CDFG found noapparent relationship between the presence of pesticide residues and mortalityobserved in the samples tested for toxicity.

Acknowledgements
Disclaimer
The mention of commercial products, their source, or use in connection withmaterial reported herein is not to be construed as an actual or impliedendorsement of such product.


Pesticide Detections .............................. .84Toxicity Results ................................. .90Other Pesticides Used in the Watershed .............. .90
Conclusions .............................................Recommendations .......................................References ..............................................Appendix I Sample collection, extraction and analysis dates and
detections .................................Appendix I I Analytical Methods ................................Appendix Ill Method Validation .................................Appendix IV QC Summary Table ...............................Appendix V CDFG Toxicity Report .............................

List of Tables
Table 1
Table 2
Table 3
Table 4
Table 5
Table 6
Table 7
Table 8
vi

List of Figures
Figure 1Figure 2
Figure 3
Figure 4
Figure 5
Figure 6Figure 7
Figure 8Figure 9Figure 10Figure 11Figure 12Figure 13Figure 14Figure 15
Figure 16
Figure 17
Figure1 8
Figure 19Figure 20Figure 21Figure 22
Figure 23Figure 24
Figure 25
Figure 26
vii

Figure 27
Figure 28Figure 29Figure 30Figure 31Figure 32Figure 33
Figure 34
Figure 35
Figure 36
Figure 37Figure 38
Figure 39Figure 40Figure 41Figure 42Figure 43Figure 44Figure 45Figure 46Figure 47
Figure 48
Figure 49
Figure 50
Figure 51Figure 52
Figure 53Figure 54

Figure 55 Phosmet Use in the Salinas River Watershed ............... .92Figure 56 Chlorpyrifos Use in the Salinas River Watershed .............. 92Figure 57 Azinphos-Methyl Use in the Salinas River Watershed .......... 94Figure 58 Carbaryl Use in the Salinas River Watershed ............... .94

Temporal Distribution of Insecticide Residues in Four California Rivers
Introduction
This study was a cooperative effort between DPR and the California Department of Fishand Game (CDFG). Water was collected weekly from one sampling site along each offour rivers for a one-year period. DPR collected water samples and analyzed them forpesticide residues. CDFG tested the water for acute toxicity to fathead minnows,Pimephales promelas and cladoceran, Ceriodaphnia dubia on a bimonthly basis. Theobjective of this study was to identify rivers and seasons requiring more detailedpesticide investigation. Monitoring was conducted as reconnaissance to be used toindicate if more intense monitoring in the future will be needed. This study was notdesigned to derive statistical correlations between pesticide detections and rainfall,discharge, or pesticide use; however, useful information regarding tendencies wasobtained.
The 3-day (72-hour) composite sampling method was chosen as a compromisebetween sampling for an entire week, which would likely create diluted samples, andsampling only a small portion of the flow each week. Monitoring for residues on a dailybasis would have been optimal, but the travelling distance to three of the riversprevented this. Composite sampling with the autosamper was chosen to sample arepresentative portion of the river’s flow each week, yet without causing too muchdilution that detections would be impossible.

The four rivers selected for this study include the Sacramento, Merced, Salinas, andRussian Rivers. Watersheds for these rivers have high density agriculture andassociated pesticide use. The Sacramento River was selected since pesticides weredetected during several studies conducted by DPR and other agencies on the river andits tributaries (Wofford and Lee, 1995; Kuivila and Foe, 1995; Lee et al., 1993; MacCoyet al., 1995). The Merced River was chosen because organophosphate residues weredetected in river samples collected in 1993 by DPR (Ross et al., 1996) and by U.S.Geological Survey (Domagalski, 1995); however, year-round pesticide contaminationdata for these rivers were lacking.
The Salinas and Russian Rivers were chosen because few surface water monitoringstudies of pesticide residues have been conducted in each of these watersheds. Thestudies that were conducted suggested a need for further study. Pesticide residueswere detected in clam and fish tissue collected from both watersheds for the StateMussel Watch Program (SMWP) and the Toxic Substances Monitoring Program(TSMP) (Rasmussen, 1995a; Rasmussen, 1995b). In the Salinas River Watershed,chlorpyrifos, chlorthal-dimethyl, dicofol, endosulfan, and oxadiazon were detected inclam tissue and chlorpyrifos and chlorthal-dimethyl were detected in fish tissue. In theRussian River Watershed, chlorpyrifos, diazinon, endosulfan sulfate, chlorthal-dimethyl,and oxadiazon were detected in clam tissue and oxadiazon and ethyl parathion weredetected in fish tissue. Other than SMWP and TSMP, the only pesticide sampling inthe Salinas River watershed consisted of sediment sampling for endosulfan andchlorthal-dimethyl (Oakden and Oliver, 1988; Fleck et al., 1988). According to theWater Quality Control Plan for the Central Coast Region of the Regional Water QualityControl Board (CCRWQCB), the Salinas River is listed as water body needing anintensive survey for pesticides (1994). In the Russian River Watershed, studies havefocused mainly on water quality issues other than pesticide residues. However, one ofthe studies conducted in the watershed found DDVP, 2,4-D and dichloprop(NCRWQCB, 1992). EPA priority pollutants, including some pesticides were alsosampled; however, no pesticides were detected (Goodwin, 1993). Additional surfacewater monitoring of these two rivers was needed. The Salinas River Lagoon was alsoincluded in the study because it represents the lower portion of the Salinas River wherewater is present year-round.
The format of this report is as follows: sampling and analytical methods generic to allfour rivers can be found in the materials and methods section, detailed description ofeach watershed and the sampling sites plus results and discussion can be found listed
2

under each watershed, a general conclusion section covering all four rivers follows theriver sections and a recommendation section for all four rivers concludes the report.This report will use the data collected to determine the temporal distribution of pesticideresidues in each of the four rivers in order to make recommendations for furthermonitoring. Results of this study will be compared with previous studies and thephysical-chemical properties of the more highly used pesticides will be examined toassess their environmental fate.

MATERIALS AND METHODSSampling Methods
Monitoring began on the Sacramento River in November 1993, followed by the MercedRiver in June 1994 and then by the Salinas and the Russian Rivers in August 1994.Each river was monitored weekly for an entire year.
Sampling sites were located downstream from agricultural areas and upstream frommajor sources of dilution water. Care was taken to select sites along the river that werewell mixed. Accessibility of sites, safety for sampling crews and presence of year-roundflow narrowed the choices of possible sites.
One drawback of using the 3-day sampling period is possible degradation of pesticideresidues during sample collection and during transport time. River water subsamplescollected during the beginning of the sampling period sat refrigerated and unacidifiedfor up to 4 days including travel time, and subsamples collected near the end of the 72-hour period, sat for a much shorter time. The results of a storage stability studyconducted on carbamates and organophosphates by Ross et al. (1995) showed that afew pesticides may begin to degrade during this length of time. The storage stabilitystudy was conducted by spiking two sets of test samples with a basic pH of 8.5 and one

During the winter months organophosphate insecticide use within the watershed isintensified along the Merced River due to dormant spray of chlorpyrifos, diazinon, andmethidathion on almonds. These three OPs were detected during the dormant sprayseason in the Merced and San Joaquin Watershed in past studies (Domagalski, 1995;MacCoy et al., 1995; CVRWQCB, 1995a; Ross et al., 1996). To better determine thetemporal distribution of dormant sprays in the Merced River, sample collectionfrequency was increased during the the dormant spray season to twice weekly fromJanuary 31 through March 6. A sample volume of 20 L was collected over a 48-hourperiod (versus 72 hours) and the second sample of the week (no pH adjustment) wasanalyzed for OPs only. CDFG conducted acute toxicity tests once per week during thisperiod instead of every other week.
The automatic sampler was used throughout the year on the Sacramento River.However, the autosampler was not used year-round along the Merced and RussianRivers and not used at all along the Salinas River. Heavy rains resulted in regionalflooding in the Merced River watershed rendered the automatic sampler inoperative thethird week of March. A contingency plan called for the collection of samples using thedepth-integration method as described by Guy and Norman (1970). However, theequipment needed for this method was unavailable due to another project beingconducted in another region of the state. Consequently, as an interim collectionmethod, grab samples were collected from the center of the river during March 13 toApril 17 from the old River Road bridge, located approximately 100 yards downstreamof the automatic sampler. Grab samples reflect instantaneous concentrations, similar to
5

a l-hour water quality criterion. Due to continued large amounts of precipitation in thewatershed, Merced River discharge remained greater than normal and we were unableto use the automatic sampler to collect further samples. However, the equipmentrequired to conduct depth-integrated sampling became available in April. Sampleswere collected weekly from April 24 through the end of the study, from the old RiverRoad bridge, using the equal-width depth-integration method (Guy and Norman, 1970).
Due to the lack of available power and security, and the necessity to move theautomatic sampler often due to fluctuations in the water level, the automatic samplercould not be used to sample the Salinas River. Instead, water was collected weekly foran entire year using the equal-width increment, depth-integration method (Guy andNorman, 1970). To provide a representative water sample, depth-integrated sampleswere taken at 10 to 30 verticals across the width of the river using a USGS model DH-81 sampler. The procedure took approximately 1 hour. A total of 20 L of water werecollected and stored at about 4°C until analyzed. The monthly Salinas River Lagoonsamples were collected by submersing l-gallon amber-glass bottles in the water,uncapping and recapping the bottles underwater when full.
Similar to the Merced River, flooding prevented the use of the automatic sampler on theRussian River. The autosampler was removed from its location on January 5, 1995.Subsequent samples were collected weekly from January 17 through May 1 from theHacienda Bridge located 4 miles upstream of the original sampling site. Two methodswere used; a grab sample was collected from the center of the river during the extremeflows to avoid equipment damage, and the equal-width depth-integration method (Guyand Norman, 1970). From May 8 to August 8, samples were again to be collectedusing the automatic sampler that was returned to the site near Guerneville. However,due to mechanical failure of the autosampler on May 8 and June 26, grab sampleswere collected from the river’s edge.
Within one day of collection, samples from the Sacramento, Merced and RussianRivers were split with a ten-port splitter (Geotech@ dekaport) into 6 discrete samples.Salinas River samples were split within 3 days of collection. For each sampling date,14.5 L of water were sent to CDFG for toxicity testing with C.dubia and /? promelas.DPR retained three I-L samples for pesticide analyses by the California Department ofFood and Agriculture (CDFA) Center for Analytical Chemistry. Water samples werekept at about 4°C on ice or refrigerated until analyzed.

Environmental Measurement Methods
In addition to parameters measured by DPR, discharge data were obtained from DWR(Department of Water Resources) or USGS (U.S. Geological Survey) gauging stations.At the Salinas River at Gonzales, a gauging station was not available, discharge wasmeasured by DPR staff weekly from August to December, 1994, using the six-tenths-depth method (Buchanan and Somers, 1969).
Pesticide Analytical Methods
Pesticides included in the screens for this study were not necessarily those with thegreatest number of pounds of active ingredient (lb a.i.) applied in a given riverwatershed. Due to the large volume of water needed for the biotoxicity tests and thelimitations of the automatic sampler, approximately 4 L of water from each compositesample was available for chemical analysis. Since the amount of water for chemicalanalysis was limited, pesticides that were generally more toxic to aquatic organismsand that have previously been detected in surface water were selected for analysis.Organophosphate and carbamate insecticides were included since both types areacetyl cholinesterase inhibiting pesticides, have been detected in surface water in thepast, and can affect aquatic organisms at low concentrations. Endosulfan isomers Iand II and the endosulfan breakdown product, endosulfan sulfate, were included in theanalyses since each are still detected in fish and mussel tissue in state surface waters(Rasmussen, 1995a; Rasmussen, 1995b). Endosulfan is highly toxic to certain fishspecies (Mayer and Ellersieck, 1986). In addition, endosulfan was analyzed to assessthe effects of recent changes to permit conditions which restrict the use of endosulfan inareas where it may run off directly into surface water.
7

Many other pesticides were applied in large amounts in one or more of the river basinsbut were not included in the analyses. For example, herbicides make up a large portionof pesticide use in each watershed but herbicides are generally not as toxic to aquaticinvertebrates as insecticides (Mayer and Ellersieck, 1986). Many pesticides, such assulfur and methyl bromide that are heavily used in the basins, are not expected to reachsurface water due to their physical properties such as low water solubility or highvolatility, respectively, or in the case of sulfur, it may be naturally occuring in an area.Fungicides vary in toxicity and some may be the focus of future studies. The fungicideziram and the insecticide permethrin were considered for inclusion, but due to the poorreliability of detection methods and the requirement for special handling duringsampling and storage, these two chemicals were excluded. Thiobencarb and molinatewere not included in this study, because they have been extensively monitored inprevious and ongoing studies and are only used in the Sacramento River Watershed.
Three I-L samples were retained for chemical analysis at 1 L for each of the following:organophosphates, carbamates, and endosulfan (I, II, and sulfate forms) (Table 1). Topreserve samples prior to analysis, the OP and CB samples were acidified withhydrochloric acid to a pH of 3.0 to 3.5. In most cases, the pesticides listed in Table 1were adequately preserved under acidic conditions for at least 2 weeks in storage at4OC. However, in past studies, diazinon was found to degrade rapidly under acidicconditions (Ross et al., 1996). Therefore, diazinon was analyzed using a portion of theendosulfan sample, which was not acidified. Pesticides analyzed in the OP and CBscreens and reporting limits (RL) for each pesticide are listed in Table 1. Extraction andanalysis dates for samples are listed in appendix I.
Organophosohate ScreenFor OP analysis, the river water was extracted with 100 ml methylene chloride byshaking for 2 min. The methylene chloride layer was drained through 20 g sodiumsulfate and transferred to a 500-ml round bottom flask. The sample was extracted twomore times. The solvent was evaporated to dryness on a rotary evaporator at 35°Cand transferred with one 5-ml rinse and two 2-ml rinses with acetone, to a calibratedtube. The extract was reduced to 0.5 ml under N2 without heat, and brought to a finalvolume of 1 ml with acetone. Analysis was performed by gas chromatography (GC)using a Hewlett Packard GC model HP-5890 (Wilminton, DE), equipped with a flamephotometric detector. Oven temperature was 150°C held for one min, and increasedto 200°C by lO”C/min, and held for two min. This temperature was then increased to afinal temperature of 250°C by 20”C/min and held for five min. Injector temperatures

Table 1. List of active ingredients and their breakdown products analyzed by theCalifornia Department of Food and Agriculture, Center for Analytical Chemistry, for theFour-River Monitoring Study
RL
0.005
0.005
0.01
EndosulfanMethod: Gas chromatography/Electron capture detector

were 220°C and 250°C respectively. The complete analytical method and methodvalidation recoveries are in Appendix II and Appendix III, respectivley.
Carbamate Screen

Quality Control Methods

standard deviations and coefficients of variation of the QC data are summarized inappendix IV. The entire table of continuing QC results is filed at the Department ofPesticide Regulation and copies are available upon request. In addition, blind spikeswere analyzed. A blind spike is a surface water sample that is spiked by one chemistand submitted to another for analysis. The analyte and concentration of blind spikes istherefore not known by the chemist performing the analysis.
As a quality assurance procedure in the field, equipment rinse samples were preparedfor each river approximately every IO weeks. Equipment rinse procedures involvedpouring deionized water sequentially into or through each piece of equipment used inthe splitting procedure after a typical cleaning was performed. Sufficient deionizedwater was used to obtain three I-L samples which were stored and analyzed forpesticide residues the same way as river water samples. Equipment rinse samples forthe Salinas River also included rinse water poured through the DH-81 sampler, thenanalyzed for pesticide residues.
CDFG Toxicity Testing Methods
Acute toxicity tests were performed by the CDFG’s Aquatic Toxicology Laboratory. Thetoxicity tests were performed with fathead minnows Pimephales promelas larvae andcladoceran Ceriodaphnia dubia neonates on a bi-monthly basis on samples from eachof the four rivers. Ten fathead minnow larvae were place into 1.0-L glass test chamberscontaining undiluted river water under static conditions with daily renewal. There weretwo replicates per treatment. Cladoceran neonates were also exposed to undilutedsamples under static conditions with daily renewal solutions. Five cladocerans wereplaced in each of four 20-ml glass vials, containing river water. ATL well water andcommercial spring water were used as the water in control samples. Mortality andwater quality measurements for each test chamber were recorded daily for each testorganism. A thorough description of the toxicity testing methods is presented inAppendix V.
12

Sacramento River
Sacramento River Watershed
The primary source of water entering the system is surface runoff from the SierraNevada Mountains to the east. Runoff from rain events occurring in the SacramentoValley provides significant short term increases in river flow. Seasonal rains occur fromOctober to March with little significant rain from June to September. River flow duringthe summer is composed of dam releases of snowmelt water for irrigation and returnflows from agricultural land. Due to the seasonal nature of rainfall in the SacramentoRiver Watershed, most agriculture is heavily dependent on irrigation from springthrough fall.
The Feather River is the largest tributary of the Sacramento River. It contributes up to47% of the discharge at the Verona gauging station and is the last major source ofagricultural runoff flowing into the Sacramento River above the confluence of theSacramento and American Rivers, 17 miles downstream. The sampling site used inthis study was located at a private dock approximately 2.5 miles downstream of theconfluence of the Sacramento and Feather Rivers and was located 1 mile downstreamof the DWR gauging station at Verona (Figure 1).
The main flow of the Sacramento and Feather Rivers and their tributaries are heavilyregulated by dams and water transfers. The Sacramento River’s main flow is regulatedby Shasta Dam and by water transfers from the Trinity River (CSLC, 1993). TheFeather River is regulated by releases from Oroville Dam. Release rates are driven bydemand and water availability. For example, discharge is increased during August andSeptember to aid salmon swimming upriver at that time.
13

Figure 1. Map of the Sacramento River Watershed.
14

In the Sacramento River watershed water for agricultural use is dispersed through asystem of canals and drains. Two major sources of agricultural return water to theSacramento River above the sampling site are the Sacramento Slough (3.5 miles abovethe sampling site) and the Colusa Basin Drain (13.5 miles above the sampling site)(Figure 1). The Sacramento Slough flows east across the southern end of the SutterBy-pass and is formed from the merging of the Reclamation Slough and the westernedge of the Sutter By-pass at Karnak. During the irrigation season, this flow isdominated by agricultural return water. The Colusa Basin Drain, which originates northof the city of Willows, discharges into the Sacramento River at Knights Landing. TheColusa Basin Drain captures waters from the two major diverters located on the westside of the Sacramento River, the Tehama-Colusa and Glenn-Colusa irrigation districts.These systems carry water originally diverted from the Sacramento River. Much of thiswater is used multiple times for irrigation by the time it is returned to the SacramentoRiver at Knights Landing. The Sacramento Slough captures most of the agriculturalrunoff from the area between the Sacramento and Feather Rivers. As much as 16% ofthe daily flow at the sampling site from August through September was supplied via theColusa Basin Drain and the Sacramento Slough. Historically, during low water years,agricultural drains may contribute as much as 30% of the total river flow above theAmerican River (SWRCB, 1990).
15

downstream of our sites, upstream of large reservoirs and areas where pesticidesanalyzed in this study are not generally applied.
Environmental Measurements
Dissolved Oxygen was initially monitored weekly in situ but the frequency was reducedto random checks due to the consistently high oxygen levels in the Sacramento River.Daily rainfall measurements during the sampling period were obtained from theSacramento Metropolitan Airport (4.5 miles south of the sampling site) and from theColusa DWR weather station (40 miles northwest of the sampling site). When rain datafrom the selected monitoring station was absent, data from the closest operatingweather station was substituted.
Water samples collected during the 12 month period had pH values ranging from 6.1 to7.8 and DO values were between 8.3 to 11.2 mg/L (78 to 98% saturation, respectively)(Table 2). Both pH and DO met the water quality criteria set by the Central ValleyRegional Water Quality Control Board (CVRWQCB,1995b) and the U.S. EnvironmentalProtection Agency (U.S. EPA, 1986) (Table 3) except for the pH value on November15. This low reading, pH 6. I, may be an anomaly as the pH for the next 3 weeksexceeded 7.4 and no other value during the year fell below 6.9. Water temperatures onsample pick-up days ranged from 7.5” to 23.5” C and air temperatures from 4.7” to29.0” c.
During the first quarter of the study there were 7.9 inches of rain recorded at the Colusaweather station and the Sacramento River discharge rate fluctuated between 10,600 to29,100 cubic feet per second (cfs) (Figure 2). In the second quarter there were 2.3inches of rain at Colusa and discharge ranged from 6,200 to 27,428 cfs (Figure 3).During the last 6 months there were I .4 inches of rain at Colusa and discharge wasbetween 5,400 and 13,953 cfs (Figures 4 and 5). Total annual discharge for the yearwas 70% of the mean historical discharge for the Sacramento River (Mullen et al.,1994b). Rainfall, however, was sufficient to allow for surface runoff from agriculturalareas in the Sacramento Valley in December, January and February.
Pesticide Detections
During the 12-month sampling period, only two of the 52 samples (3.8%) had a pesticideconcentration above the reporting limit (Table 2). Diazinon was detected at a concentration
16
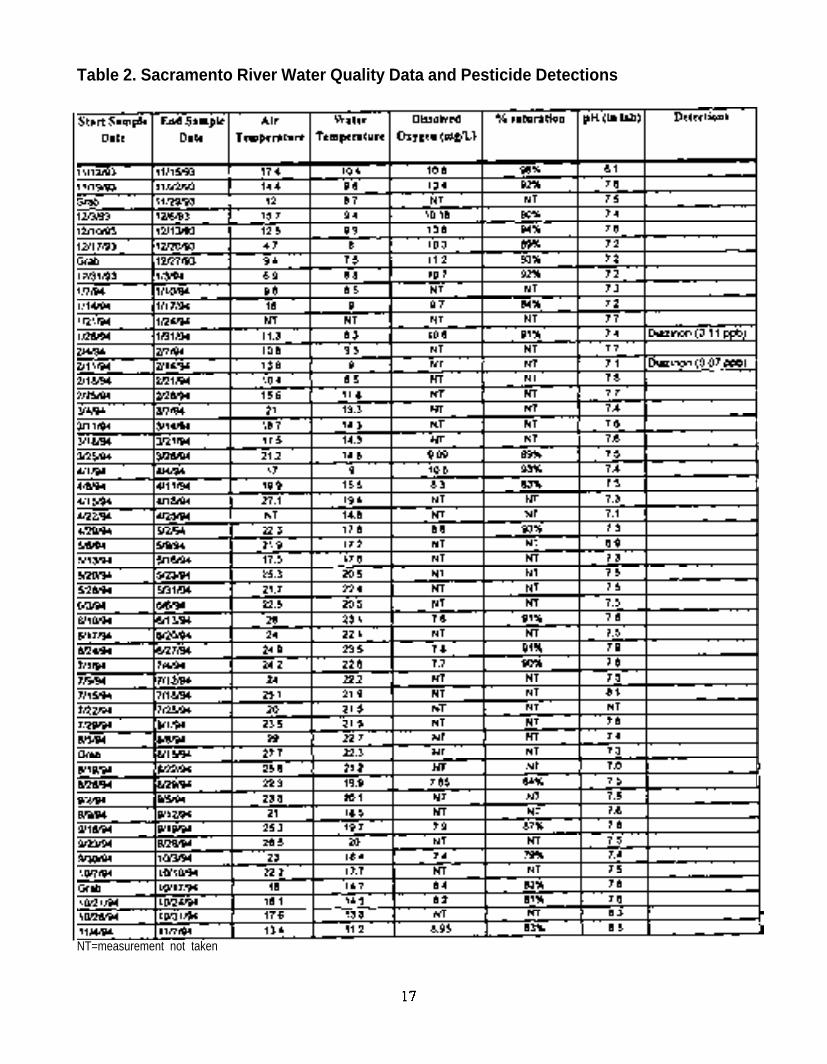
Table 2. Sacramento River Water Quality Data and Pesticide Detections
NT=measurement not taken

Table 3. Acute water quality objectives and criteria for the protectionof freshwater aquatic life

Sacramento River
Figure 2. Daily rainfall and Sacramento River discharge (river flow) for November 9, 1993 through February 11, 1994.
Second Quarter Daily Rainfall and Discharge Rates: February-May
FEBRUARY MARCH APRIL
19

Third Quarter Daily Rainfall and Discharge Rates: May-August
M A Y J U N E J U L Y A U G U S T
Figure 4. Daily rainfall and Sacramento River discharge for May 10, 1994 through August 10, 1994.
Fourth Quarter Daily Rainfall and Discharge Rates: August-November
OCTOBER
Figure 5. Daily rainfall and Sacramento River discharge for August 9, 1994 through November 10, 1994.
20

The above criteria are presented for comparison purposes since the sample period in thisstudy represents a 3-day average, not a 4-day average. The amount of diazinon detected ifour sample was collected over 4-days may have been greater or less than the amountsdetected in this study conducted for . The amount detected depends on the distribution ofpesticide residues during our sampling period. However, given that both concentrationsexceeded 0.04 ppb indicates the need for further chronic and acute monitoring in theSacramento River Watershed during the winter months.
In the Sacramento River Watershed, over half of the diazinon used is applied during wintermonths as a dormant spray on prunes, almonds, and walnuts (Figure 6). Most of thesesprays are ground applications made predominately in Butte, Colusa, Glenn, Sutter,Tehama, Yolo, and Yuba Counties. Applications were made throughout the year and themajority of the dormant spray applications of diazinon occured in two regions: 1) along theFeather River in Yuba and Sutter Counties and in the southern portion of Butte County, and2) along the Sacramento River in the northern portion of Glenn and Butte Counties. Theseare the major stone fruit growing areas of the valley. Figure 7 presents the lb a.i. of diazinonapplied each week and the application locations by section for the period preceding the tworeported detections.
During October 1993 through April 1994, USGS conducted a pesticide study of theSacramento River concurrently with our study. Their sample collection method and detectionlimit were different from ours; the results provide us with an opportunity to compare findings.USGS staff collected water three times or more per week from the I Street bridge in the cityof Sacramento, 17 miles downstream from our sampling site. Their method detection limitwas 0.038 ppb for diazinon (RL for DPR study was 0.05 ppb) (MacCoy et al., 1995).
21

Table 4. Water quality criteria for pesticide residues in water for the protection okfreshwater aquatic life
insecticide
22

DIAZINON USE IN THE SACRAMENTO RIVER WATERSHED
MONTHLY DIAZINON USEq Each square represents one or more
applications within a one square mile section
-
23

More diazinon was applied during the dry period, January 26 through February 5, prior to thesecond storm (Figures 2, 3 and 7). The amount applied was much less than during the dryperiod before the first storm, but more than the periods preceding the following storms. Onceagain there was no detection in the sample collected on February 4-7. This was probablybecause, despite the occurrence of rainfall, the sampling period ended prior to an increase inriver discharge. Discharge started to increase February 8, peaked on February 9-10 andcontinued to decline until February 17 (Figures 2 and 3). Diazinon was detected in theFebruary 11-14 sample which was collected during the decline in discharge that followed thisrain event. Again, detections by USGS were comparable to our detections. During ourFebruary II-14 sampling period, USGS detected diazinon concurrently on each day,averaging 0.07 ppb, the same as our detection. The USGS data indicated peak diazinonlevels occurred February 10, a day after peak river discharge (Figure 6) and prior to the startof the DPR sample period (MacCoy et al., 1995).
24

DIAZINON USE IN THE SACRAMENTO RIVER WATERSHEDDECEMBER 26,1993 TO FEBRUARY 12,1994
-area of pesticide
WEEKLY DIAZINON USE
Primary Crops Pounds
25

Since detections coincided with peak discharge, the amount of rain runoff was probably ascritical as the quantity of pesticide applied in producing detectable levels of diazinon in theSacramento River. About 60,000 lb a.i. of diazinon were applied prior to the second stormbeginning January 22 and another 9,000 lb a-i. were applied prior to the third stormbeginning February 6 (DPR, 1994). Diazinon has an average field dissipation half-life of 14days (Table 5) and Ross et al. (1997) reported a 5 or 6 day half-life in the SacramentoValley. However, total persistence is reported at anywhere between 3 and 12 weeks(Howard, 1991). Diazinon is not expected to bind strongly to soil and is expected to exhibitmoderate mobility. Wauchope (1978) calculated that total pesticide losses are 0.5% or lessof the amount applied, unless severe rainfall events occur within 1 to 2 weeks afterapplication. He described a critical runoff event as one which “occurs within 2 weeks ofapplication, has at least one cm (0.4 inches) of rain, and a runoff volume which is 50% ormore of the precipitation.” He found that “these events almost always produce the bulk ofthe runoff loses for an entire season unless the chemical is incorporated or extremelypersistent.”
Approximately 1.7 inches of rain fell in the week prior to January 28-31, 1994 which providedsufficient runoff to raise river flow rates by 102% at the peak on January 27, 1994 (calculatedusing daily average discharge). The second detection of diazinon on February 1 I-14 waspreceded by 3.16 inches of rainfall at Colusa and a 166% increase in flow volumes at thepeak which occurred on February 9, 1994. From these data, with the exception of diazinonresidues in rainfall itself, which has not been quantified, rain runoff appears to be theprincipal means by which diazinon reached the Sacramento River. Part of the same study byUSGS was conducted year-round from October 1992 through September 1993. Diazinonwas detected in the Sacramento River only during the rainy season, except for a detectionon 1 day in July (MacCoy et al., 1995).
Toxicity Results
CDFG found that two of the 22 Sacramento River water samples caused significantmortality to fathead minnows. Those samples were not correlated with any pesticidesdetected. In addition, CDFG toxicity tests showed no significant mortality tocladocerans. See Appendix V for the results and discussion.
26
Table 5. Physical-chemical properties of selected pesticides
malathion
27

Other Pesticides Used In The Watershed
Several other highly used pesticides, which have previously been detected in surfacewater, were applied in the Sacramento Valley during this study but were not detected.Due to the quantities used and timing of applications, methidathion had the greatestpotential of all the pesticides included in the screens to move offsite into theSacramento River. During January, 42,000 lb a.i. of meth,idathion were applied toareas and crops that were similar to diazinon uses (Figure 8). Methidathion is moresoluble and has less affinity for binding to soil than diazinon; therefore, it should havegreater runoff potential. The primary difference between the two is that methidathionhas a shorter field-dissipation half-life of 6.4 days (Ross et al., 1997). Methidathion wasdetected by USGS during the same sampling periods when diazinon was detected.However, the USGS detections were below our RL (0.05 ppb) on all but one of ourcollection days, when their concentration was at our RL (MacCoy et al., 1995).
Over 52,000 lb a.i. of carbaryl were applied from January through September with apeak application period in July (Figure 9). Carbaryl has a moderate water solubility(113 to1 19 ppm) and a low soil adsorption coefficient (average K,., 2.66) and thereforehas potential to move offsite (Table 5). However, it was applied only in low amountsduring the rainy months to peaches, prunes and almonds. Most of the applicationsoccurred throughout the dry months, which combined with a short half-life (average 10days) made carbaryl unlikely to reach the sample site at measurable concentrations.
Carbofuran (Figure 10) is applied to rice predominantly in April and May and methylparathion (Figure 11) in May and June to rice. Both have a moderate water solubility at351 and 70.3 ppm, respectively (Table 5). When rice water is released there ispotential for river contamination from these two pesticides. However, growers arerequired to hold water on the fields for at least 24 days prior to release. With a half-lifeof 3 weeks in water, most of the carbofuran applied will have undergone degradationprior to release back into the river system. Methyl parathion is reported to degrade byphotolysis in a natural water in 8 days in the summer (Howard, 1991) and most likelywould be degraded prior to release.
Azinphos-methyl (Figure 12 ) and chlorpyrifos (Figure 13) represent another typical usepattern for pesticides in the Sacramento River Watershed. Both are applied during thesummer months, largely to tree and nut crops. Neither is particularly soluble but theyhave greatly different field dissipation half-lives (8 and 45 days, respectively) and
28

Total pounds appliedduring sampling year:
q Each square represents one or moreapplications within a one square mile section
CARBARYL USE IN THE SACRAMENTO RIVER WATERSHED
* Sampling site
29

CARBOFURAN USE IN THE SACRAMENTO RIVER WATERSHED
q Each square represents one or moreapplications within a one square mile section
Primary Crops Pounds
q Each square represents one or moreapplications within a one square mile section
30

AZINPHOS-METHYL USE IN THE SACRAMENTO RIVER WATERSHED
Figure 12. Applications of azinphos-methyl in seven counties of the Sacramento River watershed upstreamof the sampling site near Verona, from November 1993 through October 1994 .
ICHLORPYRIFOS USE IN THE SACRAMENTO RIVER WATERSHEDI 1
31

If rain runoff is the primary vector for moving pesticides into surface water, pesticidesapplied during the rainy winter months have the greatest likelihood of entering riversystems. Diazinon, for example, was applied nearly year round at significant levels butwas only detected during the rainy season. However, most pesticides are appliedduring the dry season. Since the primary water source during the dry season for mostCalifornia crops is irrigation, only the more soluble pesticides or pesticides applied onhighly erodible soil are susceptible to transport off-site. Since growers control irrigationvolume to save water, generally runoff is avoided. Our 3-day sampling method at onesite along the Sacramento River would detect those pesticides that move easily off thesite of application. Some of the chemicals not detected in this study may be importantin localized areas where discharge is less and therefore dilution is less.
32

Merced River
Merced River Watershed
Agricultural influence on the Merced River stretches approximately 45 miles from nearthe town of Snelling to the Merced River’s confluence with the San Joaquin River atHills Ferry (Figure 14). Agricultural influence on the river from Snelling to Cresseyconsists of management practices involved with orchard crops, predominantly almondsand peaches, though apples are also grown in the area. From Cressey to the River’send, crops within the watershed become more diverse adding alfalfa, grapes andassorted row crops to the mix of nut and fruit crops.
The sampling site chosen for the Merced River was located approximately 1 mileupstream from the river’s confluence with the San Joaquin River, at Hatfield StateRecreation Area (Figure 14). The site was selected because it is downstream from allsources of agricultural runoff along the Merced River and it has been used in previousstudies (Ross et al., 1996). Discharge data were obtained from the USGS gaugingstation at Stevinson, located 4 miles upstream of the sampling site.
Environmental Measurements
Water samples collected during the 12 month study had pH values ranging from 6.3 to8.2 (Table 6). The pH values fell outside the CVRWQCB (1995b) criteria on twooccasions, January 30 at pH 6.3 and February 9 at pH 6.4 (Table 3). Measurements of
33

Figure 14. Map of the Merced River watershed. The California map inset indicates therelationship to the San Joaquin River watershed.
34

35

DO were made in situ when equipment was available. The DO readings ranged from5.1 to 11 mg/L (54 to 106% saturation). DO measurements fell below the CVRWQCBcold water minimum of 7.0 mg/L for this river on September 30 (6.8) February 6 (6.9)May 1 (6.9) and June 5 (5.1) (Table 3 and 6). The measurement of 5.1 mg/L on June5 had rebounded to 9.1 mg/L by the next sampling period on June 12, 1995. Watertemperatures on sample collection days varied from 8.6 to 29°C and air temperaturesranged from 7.1 to 40°C (Table 6).
Pesticide Detections
There were pesticide detections in seven of the 57 (12.3%) samples collected andanalyzed from the Merced River (Table 6). Three of the samples had multiple pesticidedetections. None of the equipment rinse samples had detectable residues. During theyear of sampling, three different pesticides: dimethoate, diazinon, and methidathion,and one breakdown product, 3-OH carbofuran, were detected.
Two detections of the OP, dimethoate at a concentration of 0.13 ppb were reported forthe sampling periods of September 2-5 and September 23-26 (Table 6). The CaliforniaDepartment of Health Services (DHS) has set an action level of 140 ppb for dimethoatein drinking water (Marshack, 1993); currently, there is no U.S. EPA, CDFG or
36

Merced River
First Quarter Daily Rainfall and Discharge Rates: June-September
Second Quarter Daily Rainfall and Discharge Rates: September-December
OCTOBER NOVEMBER

Merced River
Third Quarter Daily Rainfall and Discharge Rates: December-March
DECEMBER JANUARY FEBRUARY MARCH
38

CVRWQCB water quality criterion established for the protection of freshwater aquaticorganisms (Table 4).
In the Merced River watershed, the majority of dimethoate is used on beans, grapes,and corn and is applied from June to September with peak use in August (Figure 19).During the 4 month period the applications within the watershed add up to slightlygreater than 1,600 lb a.i.. The first detection, September 2-5, 1994, occurred during thelast week that dimethoate was applied in the watershed (Figure 20). Two applicationswere made to corn within 3 miles East of the sampling site during the sampling period.These applications were made in a section of land that the river transects and were lessthan a mile from the river itself. Within the 2 weeks before the first detection,dimethoate was applied to crops in other sections of land that the Merced River alsotransects. The second detection, September 23-26, 1994, happened over 2 weeksafter all reported applications.
Direct runoff from flooded fields and/or aerial drift to the river may have been thetransport mechanism. The discharge data for the Merced River showed that the flowwas increasing during both 3-day sampling periods (Figures 15 and 16). Sincedischarge was less than 120 cfs during September, irrigation runoff could easilyincrease the flow. For instance, 12 cfs of runoff would increase the flow by 10%. Infact the flow increase during the 3-day sampling periods was 44% and 66%,respectively. However, flow may appear to increase when a diversion pump is turnedoff. The field dissipation half-life of dimethoate is approximately 8 days (Table 5) andthus the second detection could have been from residues still remaining on site. Thedetections were probably due to an irrigation event occurring one to two weeks afterapplication. This is likely scenario since irrigation water could carry dimethoate from afield because it does not adsorb well to soil, has a high water solubility (39,800 ppm),low average Kd (0.339 g/cm3) (Table 5) and is expected to be highly mobile. In water,dimethoate tends not to sorb to sediment and is subject to hydrolysis and possiblybiodegradation (Howard, 1991).
These data are consistent with prior data collected in the San Joaquin River watershedindicating that dimethoate is present during late summer (Ross 1992, 1993b). Priorconcentrations in samples collected in the San Joaquin River upstream of the mouth ofthe Merced River ranged from 0.05 to 0.14 ppb in 1991 and 0.07 to 2.4 ppb in 1992.Due to a lack of available data, CDFG was unable to develop water quality criteria fordimethoate (Siepmann and Yargeau, 1996). However, when compared with known
39

DIMETHOATE USE IN THE MERCED RIVER WATERSHED
STANISLAUS COUNTY
San Joaquin influence
Atwater
cl
MERCEDCOUNTY q q
q Each square represents one or moreapplications within a one square mile section
40

DIMETHOATE USE IN THE MERCED RIVER WATERSHEDJULY-SEPTEMBER 1994
San Joaquin influenceRiver
41

toxicity data, CDFG noted that dimethoate levels detected in previous studies of theSan Joaquin River system indicate that dimethoate does not appear to pose an acuteor chronic hazard to aquatic organisms (Seipman and Yargeau, 1996). The mostsensitive species LC,, for a 96-hr toxicity test listed in Mayer and Ellersieck (1986) wasstoneflies (Pteronarcys califomica) at 43 pug/L. The level we detected during our 72-hrsamples was much lower and does not appear to pose a hazard.
Diazinon was detected in several samples collected during the periods ending January9, 30, and February 2, 1995 at concentrations of 0.11, 0.077 and 0.17 ppb, respectively(Table 6). These levels may exceed the CDFG recommended chronic freshwatercriteria (4-day) for diazinon (Table 4). However, our samples were collected over 2 or 3-days.
Diazinon is used throughout the year with most use occurring during the dormantperiod, December through February (Figure 21). During this time, diazinon, as well aschlorpyrifos and methidathion, are applied with an oil on nut and stone fruit trees tocontrol peach twig borer, San Jose scale, European red mite and brown mite pests.The applications are generally made during rain-free periods with enough time to applythe pesticide. Since most rain falls during the dormant period, the chance of transportof spray residues via runoff to streams and rivers is greatly increased. In the MercedRiver watershed, almost 4,000 lb a.i. of diazinon were applied on almond orchards andto a lesser degree on peach and plum orchards. The diazinon detections in the MercedRiver occurred during the rainy season and during peak pesticide use in the watershed.From December to the end of February more than 2,400 lb a.i. of diazinon were applied(Figure 22).
Rainfall in December was light, totalling about 0.40 inches prior to the diazinonapplications which began the week ending December 24, 1994 (Figure 22). A smallamount of rain fell on December 24 and 28 but there was no increase in the MercedRiver discharge to indicate that runoff occurred. According to discharge data belowMerced Falls Dam, near Snelling, CA, dam releases were held steady below 250 cfsfrom November 1994 through March 10, 1995 (USGS, 1995). Therefore, increases inflow in January, February and the first half of March were due to rain runoff. Theelevated flow after March 10 to the end of this study was due to dam releases.
Rainfall began again on January 3 and continued through January 17, 1995 (Figure17). During this period there were no applications of diazinon (DPR, 1995). Diazinon
42

Ri
MADERA COUNTY
FRESNO COUNTYA - - - - -
43

STANISLAUS COUNTY
l Merced

was detected in the sample collected January 6-9, the 3-day sampling period whichcoincided with the peak and subsequent declining discharge. The river’s discharge hadincreased 69% from January 2 to the peak on January 7. Since there were no diazinonapplications in early January (Figure 22), this first detection was most likely the result ofapplications made during late December. The average half-life of diazinon is reportedat 14 days (Kollman and Segawa, 1995) and 6.4 days (Ross et al., 1997); thus,diazinon was applied one or more half-lives before the detection.
There were no detections in the next two samples collected January 13-16 and 20-23,despite the fact that diazinon applications and rainfall both occured during the samplingperiods. Rainfall occurred daily January 20 through 28 and discharge in the riverincreased to a level greater than 388% of the level prior to the storm. Diazinon wasapplied during this period, mainly on the days when only a trace of rainfall wasrecorded. During each of the weeks ending January 21 and January 28, the weekspreceding the next two detections, about 400 lb a.i. of diazinon were applied (Figure22). The detections occurred on January 28-30 and January 31-February 2 during theweek when the greatest quantity of diazinon was used, about 800 lb a.i., and whendischarge was declining after peak discharge on January 28.
Due to these detections, a decision was made to more closely examine runoff ofdormant spray residues; thus, sampling was increased to twice weekly, collecting sub-samples over two 2-day periods per week with the automatic sampler beginning onJanuary 31 and ending on March 6. However, after the January 31-February 2 sample,diazinon was not detected again in subsequent sampling probably due to a decrease inthe number of applications after the first week in February and an absence of significantrain in February (Figure 17).
The detections of diazinon are consistent with previous data collected in the MercedRiver watershed which indicated that diazinon is present during winter months. In astudy conducted during the winters of 1992 and 1993, samples collected during stormsat several sites in the Merced River Watershed contained diazinon concentrationsranging from 0.07 to 2.54 ppb (Ross et al., 1996). During 1992 the CVRWQCBdetected diazinon in the Merced River, four times from January through April atconcentrations of 0.01 to 0.32 ppb (CVRWQCB, 1995). A USGS study conducted onthe Merced River indicated that diazinon levels in the river increased as dischargeincreased and peak diazinon levels coincided with the highest flows (Domagalski,1995). During a storm in February 1993, USGS detected diazinon in the five samples
45

collected during part of a hydrograph of the Merced River. The levels detected rangedfrom 0.12 ppb prior to an increase in flow to 2.5 ppb during the decline after peakdischarge (Domagalski, 1995). Our data also indicated that diazinon detectionscoincide with higher flows.
Methidathion was detected at concentrations of 0.22, 0.11, 0.13 and 0.061 ppb insamples collected during sampling periods ending on Jan,uary 9 and 16, February 2,and March 13, 1995, respectively. Currently, there are no water quality criteria formethidathion for the protection of freshwater aquatic organisms (Table 4). Waterquality criteria for methidathion have not yet been developed due to a lack of availableinformation (Menconi and Seipmann, 1996). However, when compared with knowntoxicity data, CDFG noted that methidathion levels detected in previous studies of theSacramento and San Joaquin River systems indicated methidathion may be a hazardto aquatic organisms, especially sensitive aquatic invertebrates.
Detections of methidathion coincided with peak use, rainfall and consequent peakdischarges (Figures 17 and 23). About 2,500 lb a.i. of methidathion were applied in thewatershed primarily on almond, walnut, apricot and prune orchards during the one-yearstudy period (Figure 23). Most use occurred from November through January with thegreatest amount applied applied in December (1,900 lb a.i.). There was little rainfall orrunoff in December and there were no detections of methidathion in the samplescollected. In January less methidathion was used (1,062 lb a.i.), but there was rainfall,followed by increased runoff and the first methidathion detections. The first two weeksof January, weeks ending on January 7 and 14, there were few applications ofmethidathion due to rainfall. Methidathion was dectected in the sample collectedJanuary 6-9, the same sample in which diazinon was detected. This sample periodcoincided with a minor peak in river flow followed by declining flow after a storm. Theresidues detected in the January 6-9 sample must have been from applications inDecember or the one 35 pound application January 2 on a peach orchard near Atwater(DPR, 1995).
46

METHIDATHION USE IN THE MERCED RIVER WATERSHED
Each square represents one or moreapplications within a one square mile section
L.

The heavy rainfall in the mountains in mid-March resulted in an increase in the MercedRiver flow through the remainder of the study due to releases from dams upstream.There were no further detections of any of the pesticides analyzed in this study due todeclining use in the spring and possibly the increased flows diluting residues.
The detections of methidathion are consistent with previous data collected in theMerced River watershed which indicated that methidathion is present during wintermonths. In a study conducted during the winters of 1992 and 1993, two samplescollected in the Merced River Watershed during storms contiined methidathion at 0.14and 0.18 ppb (Ross et al., 1996).
A degradation byproduct of carbofuran, 3-hydroxycarbofuran, was detected at 0.18 ppbin the January 28-30 sample. This sample was collected following peak discharge onJanuary 28. There are no current water quality criteria established for the protection offreshwater aquatic organisms for carbofuran or its metabolites.
Approximately 1,760 lb a.i. of carbofuran were used during the study period on alfalfa inthe Merced River watershed (DPR 1994 and 1995). It is typically applied during
48

METHIDATHION USE IN THE MERCED RIVER WATERSHEDDECEMBER 1994 -FEBRUARY 1995
San JoaquinRiver
STANISLAUS COUNTY
l Merced
1
week endingI- J

METHIDATION USE IN THE MERCED RIVER WATERSHEDJANUARY -MARCH 1995
STANISLAUS COUNTY
Merced
Each square represents one or moreapplications within a one square mile section

Toxicity Testing
Samples tested for toxicity by CDFG showed no significant mortality to cladocerans orfathead minnows in any of the 30 samples tested (Appendix V).
Other Pesticides Used in the Watershed
During this study, chlorpyrifos was not detected in the Merced River samples although itwas used in the greatest quantity compared to the other organophosphate andcarbamate pesticides analyzed in this study (Figure 26). It has previously beendetected in the Merced River in other studies (Ross et al., 1996; CVRWQCB, 1995).Greater than 37,000 lb a.i. were applied in the watershed area during the study period(Figure 26). Chlorpyrifos was applied from December through August and most heavilyapplied in July. More chlorpyrifos was used than diazinon and methidathion combinedduring the dormant spray period (Figure 27). More than 6,000 lb a.i. were applied fromDecember through February, mainly to almond and apple orchards and use wascontinued in March on alfalfa.
Chlorpyrifos has a longer half-life than diazinon or methidathion but a lower watersolubility (Table 5). Chlorpyrifos may move offsite with soil errosion since it has a highsoil absorptivity (Table 5). Pesticides that are tightly adsorbed to soil are held near thetreatment site. Since chlorpyrifos is not very mobile in soil, residues may betransported off-site as residue bound soil particles that could be carried to surface waterin runoff from agricultural fields. The amount of the pesticide in runoff depends on theextent of soil erosion, and the amount of sediment transported, and the amount andtiming of applications.
Heavy amounts were applied prior to rainfall events and some was applied during smallbreaks in the rain. However, no chlorpyrifos was detected in the samples collected.
51

CHLORPYRIFOS USE IN THE MERCED RIVER WATERSHED
MONTHLY CHLORPYRIFOS USE
Each square represents one or moreapplications within a one square mile section
CHLORPYRIFOS USE IN THE MERCED RIVER WATERSHED, DECEMBER-FEBRUARY
MERCED COUNTY
Primary Crops Pounds
52

Some of the other OPs and CBS that were analyzed and not detected in this study wereused less or used during the dry season when rain runoff did not occur. For example,only about 1,200 lb a.i. of malathion were used in the watershed (Figure 28).Applications occurred in July, August and in March, mainly on alfalfa, walnut orchardsand watermelon crops. Azinphos-methyl was used on almonds and peaches during thedry season from May through August (Figure 29); the month of peak use is July.Phosmet was applied June through August (Figure 30). Applications were mainly madeto almond and peach orchards. The carbamate pesticide carbaryl was used during thedry season, mainly in July, on peach orchards and grape vineyards (Figure 31).
53

MALATHION USE IN THE MERCED RIVER WATERSHED
FRESNO COUNTY
AZINPHOS-METHYL USE IN THE MERCED RIVER WATERSHED
MERCED COUNTY
54

PHOSMET USE IN THE MERCED RIVER WATERSHED
Sampling siteq Each square represents one or more
CARBARYL USE IN THE MERCED RIVER WATERSHED
FRESNOCOUNTY q Each square represents one or moreapplications within a one square mile section
55

Salinas River
Salinas River Watershed
The Salinas River watershed is situated between the Diablo mountain range in the eastand the Santa Lucia Mountain range to the west (Figure 32). The watershed is about150 miles long and about 20 to 30 miles wide (Salinas River Lagoon Management andEnhancement Plan, 1992). In this report, the Salinas River will be described as theupper, middle and lower portion. The upper reach of the river begins in the south atSanta Margarita Lake in San Luis Obispo County. The river flows northward to themiddle reach where the flow increases due to releases from the reservoirs on theNacimiento and San Antonio Rivers. Agricultural influences of the middle reach of theSalinas River begins at the confluence with the Nacimiento River since surface waterflows upstream of Paso Robles are minimal during three quarters of the year (Palmer etal., 1994; Friebel et al., 1995). Below the confluence of the Nacimiento and SanAntonio Rivers, flow occurs year round.
The Salinas River flow in the middle reach is dependent on releases from theNacimiento and San Antonio Reservoirs. Water discharged from the reservoirs isprimarily used in the middle portion of the river for groundwater recharge via the riverchannel and is also diverted for irrigation in the Salinas Valley. Information onagricultural drainage for the middle reach indicates that, although no major drains exist,significant agricultural runoff does occur through individual draining sites from farmslocated along the river.
During the dry-season, which last from approximately May through November, norainfall-induced flow reaches the lower portion of the river (Salinas River LagoonManagement and Enhancement Plan, 1992). During this time, releases are regulatedto flow down to Chualar, with no water reaching farther downstream. The geology ofthe river watershed has a significant effect on the amount and timing of the releasesbecause flow is regulated to those areas that will allow drainage. For this reason,releases from the reservoirs are regulated to flow only into those areas wheregroundwater recharge may result. Consequently, flow from Chualar downstream to theLagoon is intermittent throughout most of the year and consists mainly of agriculturalreturn water, which enters the river channel from several agricultural drains. However,during the rainy season, flow throughout the river is increased as a result of rain runoff,agricultural return water, and periodic releases from the reservoirs.
57

See
58

The middle and lower reach of the Salinas River, situated in Monterey County, weresampled in this study. The sampling site chosen for the middle reach was located nearthe Gonzales River Road bridge, approximately 60-70 river miles downstream of theNacimiento reservoir and 25 miles upstream from the mouth of the river. Informationobtained through discussions with the Monterey County Water Resources Agencyindicated that the flow at this site remains constant throughout the year. Wedetermined that the area of pesticide influence at our sampling site begins at theconfluence of the Nacimiento River and the Salinas River.
Rapid fluctuations in river stage height, and a lack of electrical power and security wereseveral reasons why it was not feasible to use the autosampler on the Salinas River.Instead, samples were collected using the equal-width depth integration method (Guyand Norman, 1970). Since the discharge at Gonzales was different from the discharge6 miles downstream at the gauging station at Chualar, discharge was measured usingthe six-tenths-depth method (Buchanan and Somers, 1969). Samples were collectedweekly from the Gonzales site from August 1, 1994 to January 17, 1995. DuringJanuary, February and March, regional flooding occurred and prevented access to theGonzales site. On January 24 we began collecting water at the Chualar River RoadBridge, approximately 6 miles downstream of Gonzales. During the following 6-monthperiod, water was collected at Chualar whenever river flow reached this site.Otherwise, samples were collected at Gonzales.
Since flows below Gonzales and Chualar were intermittent, the Salinas River Lagoonnear Monterey Bay was sampled to survey the lower portion of the Salinas River forpesticide residues since water is present in the lagoon year-round. The lagoon is partof the Salinas River National Wildlife Refuge designated by the U.S. Fish and WildlifeService and is a valuable resource for a variety of species.
In the winter, rainfall runoff may cause flows from the upper portion of the river to reachthe lagoon. If flows in the Salinas River Lagoon become great enough to flood nearby
59

In addition to weekly samples collected from the Salinas River by DPR, staff from theElkhorn Slough Foundation (ESF) collected monthly grab samples from the SalinasRiver Lagoon. As part of their conservation effort, the ESF monitors water quality in thelagoon area by collecting monthly samples analyzed for various water qualityparameters. Samples collected by ESF for DPR were used to survey the lower portionof the Salinas River for pesticide residues. Water samples were collected bysubmersing 4-L amber glass bottles in the lagoon. Samples were treated the same assamples from the other four monitoring sites and were submitted to the CDFA Lab forOP and CB screens and endosulfan and diazinon analyses. CDFG however, did notconduct toxicity testing on the lagoon samples because the water typically has highsalinity and nutrient (ammonia, nitrate, phosphate) content.
Environmental Measurements
60

61

During the first quarter 0.37 inches of rain was recorded at the Salinas Municipal Airportand the Salinas River discharge rate fluctuated between 56 and 192 cfs at Gonzales,and 42 to 127 cfs at Chualar (Figure 33). Discharge rates were similar to thosereported in 1993 (Palmer et.al., 1994) and 1992 (Markham et al., 1993) for the sametime period. During the second quarter total rainfall was 12.0 inches at SalinasMunicipal Airport and discharge ranged from 0 to 12,000 cfs at Chualar (Figure 34). InJanuary, 1995, there was heavy rain and flooding throughout the Salinas Riverwatershed. The stage height during January reached 13.85 feet, close to the recordstage height of 14.92 feet in 1983.
During the third quarter 8.45 inches of rain were recorded at the Salinas MunicipalAirport (figure 35). Rainfall that occurred on March 8 through 12 caused devastatingflooding in the watershed. A record stage height at 19.70 feet and a record dischargeof 92,000 cfs was set at Chualar on March II, 1995. In the fourth quarter (Figure 36)daily average discharge ranged from 814 cfs in May to the lowest recorded in early Julyat less than lcfs (Friebel et al., 1996). Total rainfall during the fourth quarter was 0.81inches.
Pesticide Detections
During the year-long sampling period, only one of the 52 samples (1.9%) collected fromthe Salinas River had a pesticide concentration above the reporting limit (Table 4).Chlorpyrifos was detected in one sample collected along the middle reach in January.Diazinon and dimethoate were both detected in the monthly sample collected from thelagoon in June. There were no detections from the six equipment rinse samples or thesix rinse samples of the DH-81 sampler bottle.
Chlorpyrifos was detected at a concentration of 0.12 ppb at Gonzales on January 10,1995. This concentration exceeded the maximum (l-hour average) of 0.083 ppbestablished by the U.S. EPA as a criterion to protect freshwater aquatic life (U.S. EPA,1986) (Table 4).
Greater than 52,000 lb a.i. of chlorpyrifos were applied to the Salinas River watershedwithin Monterey County (area of pesticide influence along the middle reach) during thestudy period (Figure 37). Chlorpyrifos was used primarily on broccoli and cauliflowerfields with over 34,000 lb a.i. used to treat broccoli alone. Chlorpyrifos was usedsteadily throughout most of the year with the greatest amount used from August
62

J
Second Quarter Daily Rainfall and Discharge Rates: November-January
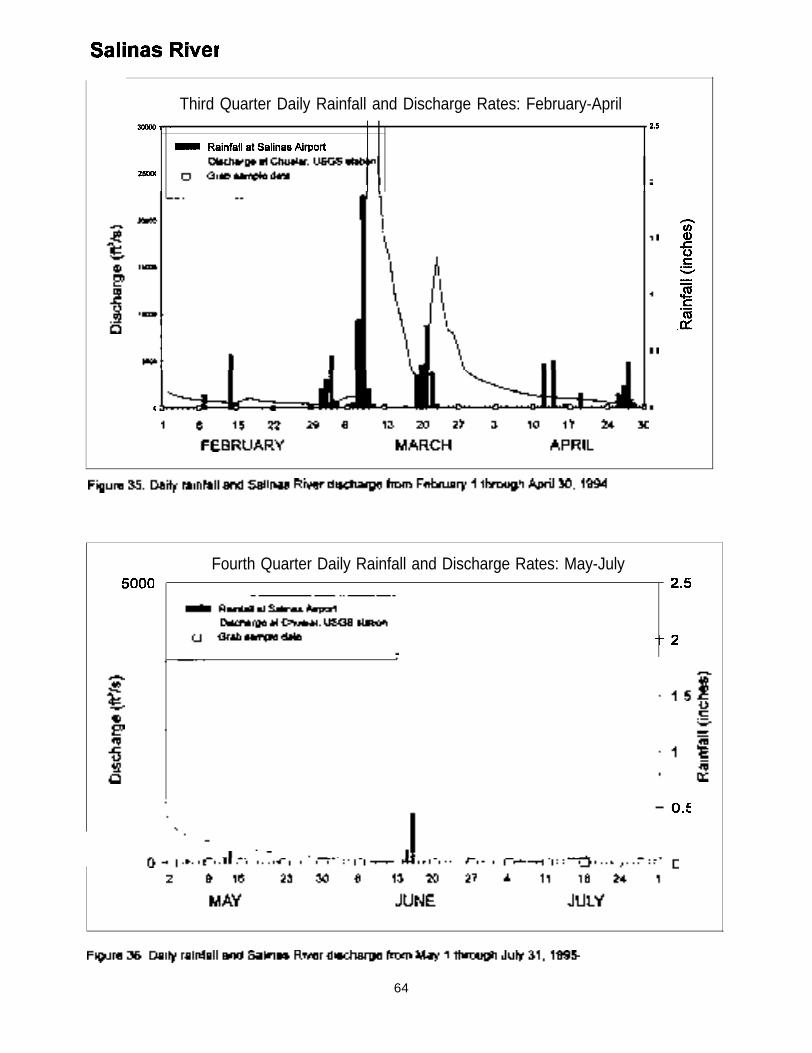
Third Quarter Daily Rainfall and Discharge Rates: February-April
Fourth Quarter Daily Rainfall and Discharge Rates: May-July
64

PACIFIC OCEAN
MONTEREY COUNTY

Prior to the detection of chlorpyrifos, flows began to increase upstream in San LouisObispo County as well as in Monterey County. According to the discharge datacollected for 1994-95, the Salinas River flowed from San Luis Obispo County intoMonterey County during January, February, and March (Friebel et al., 1996). At thetime of the detection, flow was just beginning to increase in both counties. It is likelythat the flow at the sampling site on January 10 was only from Monterey County andthat flow during subsequent days was from both counties. During December andJanuary, 1,141 and 25 lb a.i. of chlorpyrifos were applied respectively, in San LuisObispo County. Although there were no further detections at the sampling site on themiddle reach, past or future contribution of pesticide residues from San Luis ObispoCounty cannot be ruled out during the short duration that water flows from San LuisObispo County into Monterey County. Since the two sampling sites are about 75 milesdownstream of the county line, it is expected that this would probably only occur duringhigh flows, when travel times are short since pesticides will continue to undergodegradation in river water.
66

CHLORPYRIFOS USE IN THE SALINAS RIVER WATERSHEDNOVEMBER 1994JANUARY 1995
I -
q Each square represents one or moreapplications within a one square mile section
Figure 38. Applications and pounds of chlorpyrifos used in the middle and lower Salinas River watershed,November 1994 through January 1995.
67

Despite an increase in chlorpyrifos applications in February, March and April, additionalrainfall events and some sampling periods coinciding with increased discharge, therewere no further detections of any pesticides in samples collected along the middlereach.
Diazinon was detected at a concentration of 0.20 ppb in the monthly sample collectedfrom the Salinas River Lagoon during the week of June 26. U.S. EPA has not yetdetermined a water quality criterion for the protection of freshwater aquatic organisms.However, the detection exceeded the CDFG acute freshwater criterion for diazinon of0.08 ppb (Menconi and Cox, 1994) (Table 4).
Diazinon is used throughout the Salinas Valley and close to 62,000 lb a.i. were appliedduring the study period (Figure 39). The greatest amounts of diazinon were applied tolettuce and spinach. The peak in applications occurred in August and September,followed by decreased applications. The number of applications increased again inMarch and April before declining in May. One hundred thirty-two applications ofdiazinon were made in the middle and lower reach of the watershed during the monthbefore the June 26 detection of diazinon in the Lagoon (Figure 40). The applicationsclosest to the Lagoon were made primarily on lettuce (DPR, 1995).
68

DIAZINON USE IN THE SALINAS RIVER WATERSHED
PACIFIC OCEAN
MONTHLY DIAZINON USE
69

DIAZINON USE IN THE SALINAS RIVER WATERSHEDAPRIL-JUNE 1995
PACIFIC OCEAN
Reservoir
MONTEREY COUNTY

On June 26, 1995, 0.11 ppb of dimethoate was detected in the same sample in whichdiazinon was detected. Currently, there are no water quality criteria for the protection offresh or salt water organisms.
71

PACIFIC OCEAN
72

APRILJUNE 1995
Toxicity Results
Split samples tested for toxicity by DFG showed no significant mortality to cladoceransor fathead minnows in the 27 samples tested (Appendix V).
Other Pesticides Used in the Watershed
Approximately 42,000 lb a.i. of malathion were applied in the Salinas River watershedwithin Monterey County during the study period primarily to strawberry fields (Figure43). Most use occurred in August and September and again in April and May.Malathion does not persist in soil and has a short half-life. The hydrolysis half-life isabout 6 days at a neutral pH and it is even shorter lived when the pH is more alkalineas is the Salinas River (Table 5). Malathion is moderately soluble and has a low tomoderate adsorptivity (Table 5). The physical-chemical properties of malathion maketransport to surface water less likely.
Approximately the same amount of methomyl (63,149 lb a.i.) was used in the county asdiazinon (Figure 44). Methomyl is a carbamate pesticide used as a broad-spectrumcontrol for insects, primarily on lettuce (>33,000 lb a.i.) and to a lesser extent onbroccoli, celery, strawberries, wine grapes and cauliflower. Methomyl use was greatestin August and September when more than 13,000 lb a.i. were used each month. Theleast was applied during the months of highest rainfall, November through February.Methomyl was applied in March, but there were abnormally high flows in the river thatmonth. Despite being among the pesticides with the greatest quantities appliedthroughout the county, methomyl was never detected. It has been detected inCalifornia rivers in other studies (Ross, 1992 a and b; Foe and Sheipline, 1993).Methomyl is prone to leaching (Howard, 1991) and has a low average soil adsorptivity(Table 5). It has a fairly long half-life; less than chlorpyrifos but greater than diazinon(Table 5).
About 20,000 lb a.i. of carbofuran were applied in the county during the study period(Figure 45). Carbofuran is an insecticide, nematicide and miticide used mainly ongrapes. Carbofuran is very mobile in soil and has a tendency to leach (Howard, 1991).The average field dissipation half-life is about the same as for methomyl (Table 5).Despite applications being made during some months when rain runoff occurred,carbofuran was not detected in the river.
74

MALATHION USE IN THE SALINAS RIVER WATERSHED
MONTHLY MALATHION USE
MONTEREY COUNTYPACIFIC OCEAN
7.5

PACIFIC OCEAN
Each square represents one or moreapplications within a one square mile section
Figure 45. Applications and pounds of carbofuran used in the middle and lower Salinas River watershedfrom August 1994 through July 1995 .
76

Endosulfan residues (along with chlorthal-dimethyl) in soil and sediment was studied inMonterey County in 1986 (Fleck et al., 1988). Eight percent of the soil samplescollected in the Salinas and Carmel Valleys contained endosulfan I, while 9 and 27%contained endosulfan II and endosulfan sulfate, respectively. Other studies conductedin the area also found endosulfan residues in drainages (Oakden and Oliver, 1988).Endosulfan is fairly persistent and exhibits high adsorptivity (Table 5). Endosulfan I, IIand sulfate were analyzed in eight clam tissue samples for the SMWP. At least one ormore of the three (when added together it is reported as total endosulfan) weredetected in the clam samples every time ranging from 19.0 to 300.0 ppb wet weight oftotal endosulfan. Total endosulfan was detected two of the four sediment samplescollected for the SMWP. Use of endosulfan has been reduced in recent years. In1994, only 1,731 lb a.i. of endosulfan were used in Monterey County.
77

Russian River
Russian River Watershed
Generally, the highest flow of the Russian River occurs from October to May. Flow iscontinuous throughout the year and is controlled by releases from Coyote Dam at LakeMendocino, and Warm Springs Dam at Lake Sonoma (Figure 46) (NCRWQCB, 1993).In addition, there is a hydropower project that diverts water from the Eel River into theRussian River above Lake Mendocino at an average annual rate of 330 cfs (SWRCB,1994). Most of the tributaries flow during the wet-weather season, but flows dwindle bymid to late summer. There are greater than 40 tributaries to the mainstem of theRussian River. Most of the tributaries are intermittent and some are perennial(Goodwin, NCRWQCB). The principal tributaries are Big Sulphur Creek, Dry Creek,Mark West Creek and Austin creeks (NCRWQCB, 1993). The tributary farthestdownstream that contributes agricultural runoff to the Russian River is Green ValleyCreek (Klamt, NCRWQCB) which flows from south of Sebastopol to the Russian Rivernear Rio Dell. Most tributaries entering the river upstream of Green Valley Creek carrysome crop runoff while those downstream contribute less runoff from crops. Practicallyall insecticide use occurs upstream from the sampling site chosen (Figure 51 through58). The major crops grown in the watershed include wine grapes, alfalfa, pears, hay,walnuts, apples and a variety of row crops.
The Russian River sampling site was located at a private residence on the RussianRiver approximately 1 mile upstream of the Highway 116 Bridge, in Guerneville (Figure46). The site is 5 miles downstream of Green Valley Creek and about 17 milesupstream of the mouth of the river. Discharge data were obtained from the DWR
79

Figure 46. Map of the Russian River watershed.
80

gauging station located 4 miles upstream of the sampling site at Hacienda Bridge. Atthis location the river is impounded for recreational purposes during the summermonths. During this period there is a chance that the river at this site may not be mixedadequately. Pesticides that tend to adhere to sediment have potential to settle andpesticides entering the river locally, within the impounded area, may not be completelymixed across the cross section. The environmental measurements would be affectedthe most during this period, and would be more accurate if taken across the river’scross section.
Weekly sample collection began on August 8, 1994, using the automatic sampler. Dueto heavy rains that resulted in regional flooding in the sampling area, the automaticsampler was removed from its location on January 5. Subsequent samples werecollected weekly from January 17 through May 1 from the Hacienda Bridge located 4miles upstream of the original sampling site using two methods; a grab samplecollected with a bucket at center-stream and the equal-width depth-integration method(Guy and Norman, 1970). From May 8 to August 8, samples were again to be collectedusing the automatic sampler that was returned to the site near Guerneville.
Environmental Measurements
Besides parameters measured by DPR, discharge data were obtained from the DWRgauging station at Hacienda Bridge. Daily rainfall measurements were obtained fromthe DWR weather station at Venado, 6 miles north of the sampling site. During the firstquarter there were 1.6 inches of rain recorded at the Venado weather station and theRussian River discharge rate fluctuated between 91 and 285 cfs (Figure 47). August
81

Table 8. Russian River Water Quality Data and Pesticide Detections
82

Russian River
First Quarter Daily Rainfall and Discharge Rates: August-October
AUGUST SEPTEMBER OCTOBER
NOVEMBER DECEMBER JANUARY
83

through December discharges were lower than the historical monthly averages (Ayerset al., 1995; Friebel et al.,1 996). However, during the second quarter rainfall totaled59.8 inches at Venado and the discharge ranged from 107 to 93,900 cfs (Figure 48). Inmid-January heavy rain and flooding occurred in the watershed. The river gage heightduring January reached 48.0 feet, close to the record stage height of 48.6 feet duringthe 1986 flood (Friebel et al., 1996). Total annual runoff for the 1995 water year wasgreater than 200% of the historical average.
During the third quarter 38.1 inches of rain were recorded at the Venado weatherstation and the Russian River discharge rate fluctuated between 1,241 and 61,274 cfs(Figure 49). The highest discharge during the third quarter came in March, coincidingwith heavy rain and flooding in the watershed for the second time that year. The stageheight during the March flood reached 42.0 feet, 6 feet less than the flood in January.During the fourth quarter, rainfall totaled 2.08 inches at Venado and the dischargeranged from 188 to approximately 9,000 cfs (Figure 50).
/ Pesticide detections
During the 12-month sampling period, two of the 52 samples (3.8%) had a pesticideconcentration above the reporting limits (Table 8). Diazinon was detected in a samplecollected in November 1994, and dimethoate was detected in a equal-width incrementdepth integrated sample collected in March 1995. There were no detections reportedfrom the six quality control rinse blanks of the splitting equipment.
Diazinon was detected at a concentration of 0.076 ppb in the sample collectedNovember 5-8, 1994. According to CDFG, freshwater organisms should not be affectedunacceptably if the average concentration of diazinon does not exceed 0.04 ppb in a 4-day period more than once every 3-years (Menconi and Cox, 1994; Stephan et al.,1985, Table 4). Our results are not directly comparable to these criteria since theduration of sampling does not match the exposure period for which the criteria weredeveloped. However, the detection indicates that additional, more intensive samplingfor diazinon may be warranted.
Diazinon was applied throughout the year in the Russian River Watershed with a peakin April. More than 2,200 lb a.i. of diazinon were used on a variety of crops and the usewas scattered throughout the watershed (Figure 51). November was the month whenthe least diazinon was applied to crops, the same month in which diazinon was
84

Russian River
I
FEBRUARY MARCH
Fourth Quarter Daily Rainfall and Discharge Rates: May-August
AUGUST
85

DIAZINON USE IN THE RUSSIAN RIVER WATERSHED
MONTHLY DIAZINON USE

detected in the river sample. During the 10 weeks before the November 8 diazinondetection, a total of 174 lb a.i. of diazinon was used in the watershed (Figure 52). Theuse was mostly in Sonoma County on row crops such as lettuce, mustard, broccoli, andSwiss chard at less than 20 lb a.i. per crop. Some was used on nursery plants. In the3-weeks before the detection, only about 30 lb a.i. of diazinon were used for agricultureand no diazinon use was reported for the week prior to the detection. The applicationthat was made closest to the sampling site in the highlighted section in figure 52,happened 58 days prior to the detection and was located downstream of the site.
Due to the low agricultural use of diazinon in the watershed, there is a possibility thatthe detection resulted from landscape, structural or home and garden use. Diazinon iscommonly used for home and garden applications to control pests such as ants, lawngrubs, and flies. Home and garden use is not reported to DPR and is not included infigures 51 and 52. In addition, diazinon has been detected in other parts of the UnitedStates and California in urban runoff (Schueler, 1995). Most of the urban runoff inSonoma County is untreated. For instance, the Laguna de Santa Rosa receivesdischarges from street and stormwater drain systems which eventually flow to theRussian River (NCRWQCB, 1992). Typical of most diazinon detections in surfacewater, the detection came during rainfall and during a period of increased riverdischarge. The river flow increased about 309% by November 8 and greater than700% at the peak 2 days later. This was the first storm of the season resulting in asignificant increase in discharge.
Diazinon has been detected in a previous study. Thirteen clam samples were collectedand analyzed for Diazinon for the SMWP. Diazinon was detected once out of 13samples collected from the Russian River and some of the tributaries, at 70 ppb at theLaguna de Santa Rosa (Rasmussen, 1995a).
Dimethoate was used throughout the watershed primarily from March through Augustwith peak use in June and July (Figure 53). Dimethoate is a systemic insecticide andacaricide used mostly on wine grapes and some was used on table grapes and apples.About 6,200 lb a.i. were applied during the l-year study period. A total of 51 lb a.i. ofdimethoate were applied on grapes and apples during the 3-week period prior to the
87

DIAZINON USE IN THE RUSSIAN RIVER WATERSHEDSEPTEMBER 4- NOVEMBER 8,1994
PACIFIC OCEAN
Week ending
Figure 52. Applications and pounds of diazinon used in the Russian River watershed from September 4through November 8, 1994.
88

DIMETHOATE USE IN THE RUSSIAN RIVER WATERSHED
LAKECOUNN
-area of pesticide
Figure 53. Applications and pounds of dimethoate used in the Russian River watershed fromAugust 1994 through July 1995.
89

March 20 detection, at a time when the season for dimethoate applications was justbeginning (Figure 54). Applications were made on March 16, 18 and 19, which weredays when there was no rain. Rain occurred every week during the month prior to thedetection with flooding occurring March 9 though March 15. From March 7, before thestorm to the peak discharge on March IO, there was greater than a 5000% increase inflow. The detection occurred as discharge was declining but during a minor increasedue to another storm. Despite a short half-life, dimethoate can reach surface water dueto its high solubility (Table 5). Therefore, it is likely that the dimethoate entered theRussian River in rain runoff from fields treated between the storms. The use ofdimethoate increased significantly after March 20. However, despite applications inexcess of 700 lb a.i. in April and with rainfall still occurring, dimethoate was not detectedagain. During February, March and April equal-width increment samples were collectedinstead of using the autosampler, and thus only a very small portion of the weeklydischarge in the Russian River was examined.
Toxicity Results
Only one of the 23 split samples analyzed by DFG for toxicity caused significantmortality to cladocerans. Mortality was not correlated with any pesticide detections.Tests showed no significant mortality to fathead minnows (Appendix V).
Other Pesticides Used in the Watershed
Chlorpyrifos was used primarily on apple orchards mainly in the area between GreenValley Creek and the Laguna de Santa Rosa from February through June at about5,600 lb a.i. (Figure 55). Due to a longer half-life and a use period corresponding withthe last half of the rainy period, chlorpyrifos had potential for being found in the river,but it was not detected. Since chlorpyrifos tends to bind with sediment and to moveoffsite with soil erosion, it may have moved offsite during periods of greatest rainfall,which may not have coincided with our sampling. Also these periods may havecorresponded with flow discharges that diluted chlorpyrifos residue and made itundetectable. Chlorpyrifos was detected in the SMWP. Of the 21 clam samples takenat several locations in the watershed, IO had detectable levels of chlorpyrifos rangingfrom 4.4 to 290 ppb. The chlorpyrifos detection of 290 ppb was from mussels placed inGreen Valley Creek in 1993 (Rasmussen, 1995a).
90

DIMETHOATE USE IN THE RUSSIAN RIVER WATERSHEDJANUARY 22 - MARCH 25.1995
LAKE COUNTY
PACIFIC OCEAN
Figure 54. Applications and pounds of dimethoate used in the Russian River watershed fromJanuary 22 through March 25,1995.
91

PACIFIC OCEAN
PHOSMET USE IN THE RUSSIAN RIVER WATERSHED
LAKE COUNTY
PACIFIC OCEAN
Primary Crops Pounds
Figure 56. Applications and pounds of phosmet used in the Russian River watershed from August 1994through July 1995 .
92

Phosmet was applied on apple orchards in many of the same sections whereChlorpyrifos was used (Figure 56). More than 8,800 lb a-i. of phosmet was appliedduring the study period but it was never detected in the samples collected. Phosmetwas used from April through August, with the most use occuring in June and July.Azinphos-methyl was applied on pear orchards in Mendocino and Somoma Countiesand apple orchards mainly in Sonoma County. It was used at greater than 9,800 lb a.i.,primarily in May and through July (Figure 57). With the exception of the use in April,these OPs would be expected to have less potential to reach the Russian Riverbecause each were used during the early part of the dry season and have an averagefield-dissipation half-life of less than 2.5 weeks (Table 5 ). In April 560 and 322 lb a.i. ofphosmet and azinphos-methyl were used, respectively. There was no reported use ofphosmet or azinphos-methyl during September, October or November, the months priorto the first significant increase in discharge.
Carbaryl is the only carbamate applied in the watershed that was analyzed in ourscreen. Approximately 1,000 lb a.i. of carbaryl were applied within the watershed fromFebruary through September primarily on table grapes, apples, wine grapes andsquash (Figure 58). Carbaryl may be found in February, March and April in surfacewater within this watershed since it is used during the rainy season. However, it is stillunlikely carbaryl would end up in the Russian River from agricultural use due a shorthalf-life of under 2 weeks (Table 5) and few applications.
93

AZINPHOS-METHYL USE IN THE RUSSIAN RIVER WATERSHED
q Each square represents one or moreapplications within a one square mile section
CARBARYL USE IN THE RUSSIAN RIVER WATERSHED
LAKE COUNTY
Figure 58. Applications and pounds of carbaryl used in the Russian River watershed from August 1994through July 1995 .
94

Conclusions
Overall, the DO levels and pH levels in all four rivers were good. The DO was belowthe minimum required levels (Regional Water Quality Control Boards) in 12 out of 157measurements. However, the percent saturation never fell below 50% on anymeasurement. The pH readings taken primarily in situ with some taken in the lab, werebelow the regional board standards in only 4 of 212 measurements. Rainfall amountsduring the winters included in the study were atypical. The winter of 1994 was fairly dryresulting in below normal discharge in the Sacramento River. In the winter of 1995, weexperienced a tremendous amount of rainfall that produced flooding on the Merced,Russian and Salinas Rivers.
During the year-long sampling on the four rivers, the number of positive samples was13 of 224 samples (5.8%) and pesticides were detected 17 times in the 224 samples(7.6%) due to multiple detections in some samples. Five different pesticides weredetected: diazinon was detected seven times, dimethoate was detected four times,methidathion was detected four times and chlorpyrifos and 3 OH-carbofuran were eachdetected once. Ten samples were positive during the rainy season while there wereonly three positive samples during the dry season. Diazinon, methidathion, dimethoate,3 OH-carbofuran and chlorpyrifos were detected in the wet season, while dimethoateand diazinon were detected in the dry season. Most detections occurred just after orduring rainfall, and all occurred with elevated discharge except in the Salinas RiverLagoon, for which we have no flow data.
During the year-long sampling period, two of the 52 samples collected at theSacramento River had a pesticide detection. Diazinon was detected twice at 0.11 and0.07 ppb during January and February, respectively. Since the two detections cameduring periods of increased discharge due to rainfall, rain runoff from dormant sprayapplications to nut and stone fruit trees appears to be the principal means by whichdiazinon reached the Sacramento River.
The most detections were found in the Merced River samples (ten), primarily during thewinter dormant spray period. The most types of pesticides were also found in theMerced River (4) including the only carbamate found, 3-OH-carbofuran. We began tosample the river twice a week on January 31 and the results suggest that more intensemonitoring from December through March would be useful.
95

Chlorpyrifos was the only pesticide detected along the middle reach of the SalinasRiver. Chlorpyrifos was detected at 0.12 ppb in January, just after the first major stormof the year. The greatest number of detections per number of samples collected camefrom the Salinas Lagoon where only 12 monthly samples were collected. Diazinon anddimethoate were detected in the same sample collected in June, at 0.20 and 0.11 ppb,respectively. These two pesticides may have entered the lagoon via irrigation runoff ordrift.
There were two detections in samples collected from the Russian River. Diazinon wasdetected at 0.076 ppb in November, after the first storm of the year producingsignificant runoff. Agricultural use of diazinon was low during the three monthspreceeding the detection. There is a possibility that the detection could be due tolandscape, structural or home and garden use. Dimethoate was detected at 0.11 ppbin March, during a storm.
During the year-long study there were few detections in the Sacramento and RussianRivers and the middle reach of the Salinas River for several possible reasons. First,there may not be much insecticide residue moving off-site into the rivers. Secondly, oursampling periods may have missed the residue pulses or diluted them. Third, theSalinas River had one and the Russian River had two flood events during sampling. Asa result, residues may have been diluted in the abnormally high flows, at a time of theyear when detections occurred in studies of other rivers. However, the heavier rainfallsthat occur within the Russian River watershed can result in greater flow increases thanin the other three rivers. These flows may render pesticides flowing into the RussianRiver during storms, when detections normally occur, undetectable due to dilution.Furthermore, along the Merced River, dam releases during the spring of 1995 mayhave diluted residues during the last three months of monitoring. And last, there mayhave been residues present in these rivers in localized areas, upstream or along thetributaries that were diluted at our sampling sites.
The 3-day composite method was chosen to sample more of the weekly discharge thancollecting a one-hour-long equal-width increment sample. One disadvantage of usingthe 3-day sampling period is possible degradation of pesticide residues during thesample collection and during transport time. The results of a storage stability studyconducted on carbamates and organophosphates showed that only five pesticides andseven breakdown products may begin to degrade during this length of time.
96

Another concern of using the 3-day composite method was the dilution of residues.The USGS’s single-day sampling on the Sacramento River concurrently with ourmonitoring provided a comparison with our 3-day composite method. USGS’s diazinondetections corresponded with two of our detections. When the USGS’s dailyconcentrations of diazinon were averaged, the quantity of diazinon residues is the sameas our 3-day composite method. In addition, DPR’s negative 3-day sample periods (nodetections) coincided with periods when either no detections were made by USGS ordetections were below our RL. Peak levels of diazinon detected by USGS seemed tocoincide with peak river discharges, which in some cases did not coincide with our 3-day sampling periods. USGS detections of methidation on the Sacramento Rivershowed that levels were below our RL. According to the USGS data, our samplecollection method was adequate in capturing the major pulses of diazinon.
Endosulfan was included in the analyses for this study since it is still detected in fishand clam tissues by the TSMP and SMWP. In addition, it was also included to see ifchanges in use permits, which are to prevent residues from moving offsite in drainagefrom fields beside waterways, have had an effect. Statewide use of endosulfan isdeclining; 475,743 Ibs. used in 1994 and 229,157 Ibs. in 1995. Use in MontereyCounty, where endosulfan has been detected in fish and clam tissues and in soil andsediment samples, was low compared with the other pesticides used, with 1,731 and2,953 used in 1994 and 1995, respectively (PUR 1994, PUR 1995). Based on a lack ofdetections in this study, we have no evidence that the permits are not protecting theserivers.
The CDFG Aquatic Toxicology Laboratory tested 107 of the 212 samples collected ateach of the four rivers for toxicity. The Salinas River Lagoon site was not included.DFG found no apparent relationship between the presence of pesticide residues andmortality observed in the samples tested for toxicity. Three samples caused significantmortality to either fathead minnows or cladocerans but those samples did not containdetectable concentrations of pesticides. The cause of the mortality is unknown at thistime.
97

Recommendations
Since the rainfalls for both winters included in the study period were atypical, the fairlylow number of pesticide detections from samples from the Sacramento and RussianRivers and the middle reach of the Salinas River should not preclude further samplingon these rivers. There is potential, however, to increase the number of detections byoptimizing the type of sampling and the timing. Monitoring during storms when thedischarge is increasing, especially in periods after increased applications of thesechemicals, may lead to more detections from all four rivers. Our sampling procedurewas developed to survey each of these rivers for a whole year. Sampling dates werepredetermined, and therefore may not have coincided with peak residue levels in theserivers. Also, pesticides might be detectable along the tributaries of all four rivers. Sincewe sampled at one site on each river (two on Salinas River), we have no knowledge ofpesticide contamination along the tributaries that may have been diluted at theconfluence of the rivers or at our sampling site.
The Merced River and Salinas River Lagoon stand out as needing further study basedon the number of detections. The most detections were found in samples from theMerced River, primarily during the winter dormant spray periods. Also, the most typesof pesticides, three OPs and the only CB found, 3-OH-carbofuran, were found there.Further sampling along the Merced River would be beneficial since the winter of 1995was atypical and the dam releases in the spring were greater than normal. Since thelagoon is a recognized wildlife habitat area, more monitoring for pesticide residuesthere would be beneficial. Unlike the middle reach of the Salinas River, the stageheight does not fluctuate greatly. Therefore, an autosampler and the 3-day compositemethod could be used at the lagoon.
The most frequently used pesticides in the Russian River Basin were herbicides andsome fungicides which were not analyzed in this study. Since greater amounts of thesepesticides were used in the basin rather than insecticides, those that have potential tomove off-site and are toxic to aquatic organisms should be the focus of further studyalong with the pesticides we detected in this study. If further study is conducted on theSalinas River, chlorthal-dimethyl should be included due to the large quantity used andit has been detected numerous times in this watershed in other studies.
98

References
Anderson, S.W., T.C. Hunter, E.B. Hoffman, and J.R. Mullen. 1993. Water ResourcesData, California Water Year 1992. Vol. 3. U.S. Geological Survey Water-Data Report .Report #CA-92-3. Sacramento, CA.
Ayers, W. and others. 1995. Water Resources Data, California, Water Year 1994. Vol.2. U.S. Geological Survey Water-Data Report, CA-94-2. Sacramento, CA.
California Department of Food and Agriculture. 1994. 1993 County AgriculturalCommissioner’s Data. California Agricultural Statistics Service, California Department ofFood and Agriculture joint report with The U.S. Department of Agriculture. Sacramento,California.
Central Coast Regional Water Quality Control Board. 1994. Water Quality Control Plan,Central Coast Region.
California Department of Health Services. 1990. Summary: Maximum contaminantlevels (MCLs) and action levels (ALs). Office of Drinking Water. Berkeley, California.
California State Lands Commission. 1993. California’s Rivers; A public trust report.Second Edition. Sacramento, CA. p. 130-I 33, 148-152.
Central Valley Regional Water Quality Control Board . 1989. Water diversion anddischarge points along the Merced River: Cressey Bridge to San Joaquin River.Sacramento, CA.
Central Valley Regional Water Quality Control Board . 1995a. Insecticideconcentrations and invertebrate bioassay mortality in agricultural return water from theSan Joaquin Basin. Sacramento, CA.
99

Central Valley Regional Water Quality Control Board . 1995b. Water Quality ControlPlan, Central Valley Region, Sacramento and San Joaquin Rivers. California RegionalWater Quality Control Board, Central Valley Region and State Water Resources ControlBoard. Third Edition.
Domagalski, J.L. 1995. Nonpoint sources of pesticides in the San Joaquin River,California: input from Winter Storms, 1992-93. U.S. Geological Survey. Report # 95-165. Sacramento, CA.
Domagalski, J. and L.R. Brown. 1994. National Water Quality Assessment Program,Sacramento River Basin. U.S. Geological Survey. Sacramento, CA.
Department of Pesticide Regulation. 1991. Pesticide use report. Sacramento, CA.
Department of Pesticide Regulation. 1992. Pesticide use report. Sacramento, CA.
Department of Pesticide Regulation. 1993. Pesticide use report. Sacramento, CA.
Department of Pesticide Regulation. 1993. Pesticide use report. Sacramento, CA.
Department of Pesticide Regulation. 1994. Pesticide use report. Sacramento, CA.
Department of Pesticide Regulation. 1995. Pesticide use report. Sacramento, CA.
Department of Water Resources. 1993. Quality Assurance Technical Document 3.Compilation of State Drinking Water Standards and Criteria. Division of LocalAssistance. Department of Water Resources. Sacramento, CA. July 1993.
Fleck, J.E., L.J. Ross, and K. Hefner. 1988. Endosulfan and chlorthal-dimethyl residuesin soil and sediment of Monterey County. Report # EH 88-06. Environmental HazardsAssessment Program. Dept. of Pesticide Regulation. Sacramento, CA.
Foe, C. 1994. Letter to K. Bennett regarding pesticide detections on the Merced River.Central Valley Regional Water Quality Control Board. Letter dated January 4, 1994.Sacramento, CA.
100

Foe, C. and R. Sheipline. 1993. Pesticides in surface water from applications onorchards and alfalfa during the winter and spring of 1991-92. California Regional WaterQuality Control Board, Central Valley Region, Sacramento, CA.
Friebel, M.F., L. F. Trujillo and K.L. Markham. 1996. Water resources data, California,Water Year 1995. Vol. 2. U.S. Geological Survey Water-Data Report CA-95-2.Sacramento, CA.
Goodwin, C. 1994. Personal communication regarding Russian River watershed. NorthCoast Regional Water Quality Control Board. March 1994.
Goodwin, C. 1993. California Regional Water quality Control Board, North CoastRegion. Letter to C. Ganapathy regarding Russian River tributaries and past monitoringof the Russian River. December 6, 1993.
Guy, H. P. and V.W. Norman. 1970. Field methods for measurement of fluvial sedimentIn:Techniques of water-resources investigations of the United States GeologicalSurvey. Book 3. Chapter C2. U. S. Gov. Print. Office. Washington, D.C.
Howard, P. H. 1991. Handbook of environmental fate and exposure data for organicchemicals. Volume III, Pesticides. Lewis Publishers. Chelsea, Michigan.
Klamt, R. 1995. Personal communication regarding dissolved oxygen levels. NorthCoast Regional Water Quality Control Board. August 1995.
Klamt. R. 1994. Personal communication regarding Russian River watershed boundary.North Coast Regional Water Quality Control Board. April 1994.
Kollman, W., and R. Segawa, 1995. Interim report of the pesticide chemistry database.Envrionmental Hazards Assessment Program. Dept. of Pesticide Regulation.Sacramento, CA.
Kratzer, C. 1997. Personal communication in January 1997 regarding Merced RiverBasin. U.S. Geological Survey. Sacramento, CA.
101

Kuivila, K.M. and C.G. Foe. 1995. Concentrations, transport and biological effects ofdormant spray pesticides in the San Francisco Esturary, California. Environ. Toxicol.Chem. 14(7):1141-1150.
MacCoy, D., K.L. Crepeau, and K.M.Kuivila. 1995. Dissolved pesticide data for the SanJoaquin River at Vernalis and the Sacramento River at Sacramento, California, 1991-94. U.S. Geological Survey. Report# 95-l 10.
Markham, K.L., J.R. Palmer, M.F. Friebel, L. F. Trujillo. 1993. Water Resources Data,California, Water Year 1993. Vol. 2. U.S. Geological Survey Water-Data Report CA-92-2. Sacramento, CA.
Marshack, J. B. 1995. A compilation of water quality goals. Central Valley RegionalWater Quality Control Board. Sacramento, CA.
Mayer, F.L. and M. R. Ellersieck. 1986. Manual of acute toxicity: Interpretation and database for 410 chemicals and 66 species of freshwater animals. U.S. Fish and WildlifeService, Washington, DC.
Menconi, M. and S. Seipmann, 1996. Hazard assessment of the insecticide methidationto aquatic organisms in the Sacramento-San Joaquin River system. California Dept. ofFish and Game, Ranch0 Cordova. Administrative Report# 96-l.
Menconi, M. and C. Cox. 1994. Hazard assessment of the insecticide diazinon toaquatic organisms in the Sacramento-San Joaquin River system. California Departmentof Fish and Game. Environmental Services Division. Administrative Report## 94-2.
Miller, J.C. and J.N. Miller. 1988. Statistics for analytical Chemistry. 2nd ed. EllisHorwood Limited. Chichestier, West Sussex.
102

Mullen, J.R., M.F. Frieble, K.L. Markham and S.W. Anderson. 1994b. Water ResourcesData, California, Water Year 1993. Vol. 4. U.S. Geological Survey. Water-Data ReportCA-934 Sacramento, CA.
Mullen, J.R., S.W. Anderson, and P.D. Hayes. 1994a. Water Resources Data,California Water Year 1993. Vol. 3. U.S.Geological Survey. Water-Data Report CA-93-3. Sacramento, CA.
North Coast Regional Water Quality Control Board , 1992. Investigation for nonpointsource pollutants in the Laguna de Santa Rosa, Sonoma County. September 24, 1992.
North Coast Regional Water Quality Control Board . 1994. Water Quality Control Planfor the North Coast Region (Basin Plan). Revised 1997. Santa Rosa, CA.
North Coast Regional Water Quality Control Board . 1993. Interim staff report regardingRussian River water quality monitoring. Santa Rosa, CA.
Oakden, J.M. and J.S. Oliver.1988. Pesticide persistence in fields and drainages of thecentral Monterey Bay Area. Report prepared for the RWQCB, Central Coast Region byMoss Landing Marine Laboratories. Moss Landing, CA.
Palmer, J.R., M.F. Friebel, L. F. Trujillo and K.L. Markham. 1994. Water ResourcesData, California, Water Year 1993. Vol. 2. U.S. Geological Survey Water-Data ReportCA-93-2. Sacramento, CA.
Racke, K.D. 1993. Reviews of environmental contamination and toxicology. Vol. 131.Springer-Verlag. New York, NY.
Rasmussen, D. 1995b. Toxic Substances Monitoring Program, 1992-93. Report # 95-IWQ. California State Water Resources Control Board. Sacramento, CA.
Rasmussen, D. 1995a. State Mussel Watch Program,1987-1993 Data Report. Report #94-l WQ. California State Water Resources Control Board. Sacramento, CA.
103

Rassmussen, D. 1994. Preliminary Summary of the 1994 Species Data. ToxicSubstances Monitoring Program. California State Water Resources Control Board.Sacramento, CA.
Rassmussen, D. 1991 .Toxic Substances Monitoring Program, 1988-89. Report # 91-WQ. California State Water Resources Control Board. Sacramento, CA.
Rassmussen, D. 1993.Toxic Substances Monitoring Program, 1991. Report # 91 -WQ.California State Water Resources Control Board. Sacramento, CA.
Ross, L.J. 1992a. Preliminary results of the San Joaquin River study; Summer 1991.Memorandum to Kean Goh, Environmental Hazards Assessment Program. Departmentof Pesticide Regulation. May 21, 1992.
Ross, L.J. 1993a. Preliminary results of the San Joaquin River study; Summer 1992.Memorandum to Kean Goh, Environmental Hazards Assessment Program. Departmentof Pesticide Regulation. September 22, 1993.
Ross, L.J., R. Stein, J. Hsu, J. White, and K. Hefner. 1996. Distribution and massloading of insecticides in the San Joaquin River, California; Winter 1991-92 and 1992-93. Report #EH 96-02. California Department of Pesticide Regulation. Sacramento.
Ross, L.J., K.D. Bennett, K.D. Kim, K. Hefner, J. Hernandez. 1996. Reducing dormantspray runoff from orchards. Environmental Hazards Assessment Program. Report # EH97-03. Department of Pesticide Regulation. Sacramento, CA.
Salinas River Lagoon Management and Enhancement Plan. 1992. Prepared by HabitatRestoration Group for the Salinas River Lagoon Task Force. (Draft).
Schueler, T. 1995. Urban pesticides: From the lawn to the stream. WatershedProtection Techniques. Vol.2, No.1.
Seipman, S. and T. Yargeau. 1996. Hazard assessment of the insecticide dimethoateto aquatic organisms in the Sacramento-San Joaquin River system. California Dept. ofFish and Game, Ranch0 Cordova. Administrative Repot-# 96-4.
104

Shelton, L.R. and L.K. Miller.1988. Water quality data, San Joaquin valley, California.March 1985 to March 1987. U.S. Geological Survey. Open file Report 88-479.Sacramento, CA.
Stein, R.G. and J. H. White. 1993. Aerial movement and deposition of diazinon,chlorpyrifos, and Ethyl parathion. Report # EH 93-04. Dept. Pesticide Regulation.Sacramento, CA.
Stephan, C.E., D.I. Mount, D.J. Hansen, J.H. Gentile, G.A. Chapman, and W.A. Brungs.1985. Guidelines for deriving numerical national water quality criteria for the protectionof aquatic organisms and their uses. U. S. EPA. Office of Research and Development.Washington, D.C.
State Water Resources Contol Board. 1990. Sacramento River toxic chemical riskassessment project. Final Report. California State Water Resources Control Board,Division of Water Quality. Repot-# 90-I 1 WQ. Sacramento, CA
State Water Resources Contol Board. 1994. Notice of Public Workshop on January4,1995. Information relating to water right issues on the Russian River. Notice dateDecember 1, 1994. California State Water Resources Control Board. Sacramento, CA.
U.S. Environmental Protection Agency. 1986. Quality Criteria for Water. Office of WaterRegulations and Standards, Washington, D.C. May 1, 1986.
U.S. Environmental Protection Agency. 1988. Health advisories for 50 pesticides. Part1. U.S. Dept. of Commerce. National Technical Information Service. Washington D.C.p. 268-285.
U.S. Geological Survey. 1995. Water Resources Data, California, Water Year 1995.Region 3. Internet- http://wr.usgs.gov/data/index.html.
Wauchope, R.D.1978. The pesticide content of surface water draining from agriculturalfields-A review. J. Envrion. Qual., Vol. 7. no. 4.
105

Wofford, P.L. and P. Lee. 1995. Results of monitoring for the herbicide MCPA insurface water of the Sacramento River Basin. Environmental Hazards AssessmentProgram. Report # EH 95-l 1. Dept. of Pesticide Regulation. Sacramento, CA.
106