Embed Size (px)
Citation preview

Temporal behavior of the electron and negative iondensities in a pulsed radio-frequency CF4 plasmaKono, A.; Haverlag, M.; Kroesen, G.M.W.; de Hoog, F.J.
Published in:Journal of Applied Physics
DOI:10.1063/1.349318
Published: 01/01/1991
Document VersionPublisher’s PDF, also known as Version of Record (includes final page, issue and volume numbers)
Please check the document version of this publication:
• A submitted manuscript is the author's version of the article upon submission and before peer-review. There can be important differencesbetween the submitted version and the official published version of record. People interested in the research are advised to contact theauthor for the final version of the publication, or visit the DOI to the publisher's website.• The final author version and the galley proof are versions of the publication after peer review.• The final published version features the final layout of the paper including the volume, issue and page numbers.
Link to publication
Citation for published version (APA):Kono, A., Haverlag, M., Kroesen, G. M. W., & Hoog, de, F. J. (1991). Temporal behavior of the electron andnegative ion densities in a pulsed radio-frequency CF4 plasma. Journal of Applied Physics, 70(6), 2939-2946.DOI: 10.1063/1.349318
General rightsCopyright and moral rights for the publications made accessible in the public portal are retained by the authors and/or other copyright ownersand it is a condition of accessing publications that users recognise and abide by the legal requirements associated with these rights.
• Users may download and print one copy of any publication from the public portal for the purpose of private study or research. • You may not further distribute the material or use it for any profit-making activity or commercial gain • You may freely distribute the URL identifying the publication in the public portal ?
Take down policyIf you believe that this document breaches copyright please contact us providing details, and we will remove access to the work immediatelyand investigate your claim.
Download date: 06. Sep. 2018
Temporal behavior of the electron and negative ion densities in a pulsed radio-frequency CF4 plasma
A. Kono,=) M. Haverlag, G. M. W. Kroesen, imd F. J. de Hoog Eindhoven University of Technology, Department of Physics, P.O. Box 513, 5600 MB Eindhoven, The Netherlands
(Received 22 April 1991; accepted for publication 19 June 1991)
Electron and negative ion densities in the afterglow and in the plasma initiation phase of a 13.56-MHz rf discharge in CF4 were measured by using a microwave cavity method and a laser photodetachment technique. Measurements were carried out at low rf powers ( 5 10 W) and in the pressure range from 100 to 300 mTorr. The electron density in the afterglow showed an enhanced decay rate due to the presence of negative ions. Electrons originating from negative ions through associative collisional detachment with neutral radicals were also detected in the afterglow. Decay curve analysis of the negative ion density gave an ion-ion (presumably CF: - F - ) recombination rate constant of ( 5 f 2) x 10 - I3 m3 s -. ‘, and showed that, in the active plasma, the negative ion loss rates by associative detachment and ion-ion recombination are of the same order of magnitude. The behavior of the electron and negative ion densities in the plasma initiation phase indicates that molecules and radicals that slowly accumulate in the plasma do not play a significant role in the production of negative ions.
I. INTRODUCTION
Radio-frequency plasmas in halogen-containing elec- tronegative gases are widely used for dry etching of mate- rials in the fabrication of microelectronic devices. Large amounts of negative ions can exist in such plasmas and investigation of their role in the physics and chemistry of the plasmas is of particular importance. Detection of neg- ative ions in halogen-containing rf plasmas has been re- ported for such gases as Cls, BC13, Fs/He, SF,, CF4, C,Fc, C3Fs, and. CHF3. 1-6 For Cl2 and BC13 rf plasmas Gottcho and Gaebe have investigated the identities of neg- ative ions, their effects on the local fields, and their forma- tion and loss kinetics.’
Recently the authors and others have developed a quantitative and highly sensitive method for detecting neg- ative ions by utilizing a microwave cavity method to mea- sure electrons generated by laser photodetachment. By use of this technique, negative ion densities in a 13.56-MHz discharge of fluorocarbon gases (CF,, C2F6, C3Fs, and CHF,) have been measured as a function of pressure and rf power. Generally, it was found that the negative ion den- sity was about one order of magnitude higher than the electron density. For CF+and CzFs plasmas, the identity of the negative ions was also investigated in wavelength-de- pendent photodetachment measurements using a dye laser. In the case of the CF4 plasma it was found that the great majority of the negative ions consists of F -, while in the case of C,F, a significant amount of negative ions other than F - (e.g. CF,- ) exist. The results confirm mass spec- trometry data in a pulsed rf CF4 plasma” and are consistent with the relative yields of different negative ions in electron attachment to CF4 and C2F6.’
The purpose of the present work has been to extend the
‘)On leave from Nagoya University, Department of Electronics, Chikusa- ku, Nagoya 464-01, Japan.
study of a CF4 plasma to transient measurements, in order to obtain information about the formation and loss pro- cesses of negative ions in the plasma.
In CF4 plasmas, F - is produced by -dissociative elec- tron attachment to CF4 and removed by recombination with positive ions. Besides these processes, radicals and stable molecules like CF, and C2F6 which accumulate in the plasma with relatively high densities may contribute significantly to the production and loss of negative ions.’ The electron attachment rate constant for C2F6 is one to two orders of magnitude larger than that for CF4 at the usual electron temperatures in low pressure plasmas’ and thus may produce a significant amount of negative ions. The CF,(x = l-3) radicals may effectively remove F- by associative detachment collision
F- +CF,-+CF,+1+e, (1) since the reaction is exothermic” and the cross sections for such reactions can be very large at low energies.”
In order to elucidate these points, we have measured the negative ion density together with the electron density in the afterglow and in the plasma initiation phase of a pulsed rf discharge in CF,. Charged particle decay in a negative-ion containing afterglow is quite different from that in the absence of negative ions and to our knowledge this phenomenon has hardly been studied experimentahy. Therefore we will also discuss the decay phenomena itself in some detail.
I II. EXPERIMENT
The experimental apparatus and the method of deter- mining electron and negative ion densities are basically the same as reported previously6 and only the essential features are described here. A plasma was generated in a cylindrical microwave cavity made of aluminum, which at the same
2939 J. Appl. Phys. 70 (6), 15 September 1991 0021-8979/91/062939-08$03.00 . @ 1991 American institute of Physics 2939
Downloaded 31 May 2010 to 131.155.151.26. Redistribution subject to AIP license or copyright; see http://jap.aip.org/jap/copyright.jsp
time served as a quasiparallel-plate rf electrode system. The inner diameter of the cavity is 17.5 cm and its height, or the separation between the rf electrodes, is 2 cm. In the bottom of the cavity a disc of 12 cm diameter is electrically separated from the rest of the cavity to be rf powered, whereas the rest is held at the ground potential. This con- figuration minimizes the deterioration of the quality factor Q for the used TMsZO mode. The CF, gas was introduced into the cavity through holes in the rf powered electrode at a flow rate of 20 seem in all measurements.
Radio-frequency power at 13.56 MHz was amplitude modulated to form a rectangular pulse. The repetition fre- quency of the pulse was 10 Hz and its duty ratio was (mostly) 50%. At the falling edge of the rf power, the rf voltage between the electrodes disappeared in about 1 ps. However, since the rf power was fed through a matching network which contained a blocking capacitor, a dc- bias voltage, amounting from a few tens of volts to more than 100 V in the steady state, remained for a few tens of mi- croseconds after the fall of the rf voltage. To avoid possible effects of this bias voltage on afterglow measurements, some of the measurements were carried out by using a short circuit; it consists of conventional switching transis- tors and makes a short circuit between the electrodes im- mediately after the fall of the rfpower. The use of the short circuit reduced the duration of the dc bias voltage to a few microseconds, but the measurements were limited to low rf powers by the maximum applicable voltage of the transis- tors employed. The short circuit with its cabling consumed part of the rf power, as was detected by the decrease of the electron density with the output level of the rf power sup- ply unchanged. We therefore assumed that the rf power actually given to the plasma was equal to the power that gave the same electron density without using the short circuit.
The electron density of the plasma was determined from the shift of the microwave resonance frequency (at about 3 GHz using the TMazo mode) from the empty- cavity value to the plasma-containing value. A weak mi- crowave signal at a certain fixed frequency was introduced into the cavity through a small loop antenna and the trans- mitted signal was detected by another antenna. The de- tected signal was rectified, recorded by a fast digitizing oscilloscope, and stored in the memory of a personal com- puter (PC). The measurement was repeated at some 100 different microwave frequencies taken at intervals of (mostly) 0.2 MHz. From the entire set of recorded signals, the PC can reconstruct a cavity resonance curve at each instant of time, thus determining the electron density from the shift of the resonance frequency. The time resolution of the measurements was only limited by the Q factor of the cavity ( -2000) and was about a few hundred nanosec- onds. The PC also controlled the entire measurement se- quence described above.
To determine the negative ion density, the plasma was irradiated by a frequency-quadrupled (266 nm) pulsed Nd:YAG laser (Quanta Ray, DCR 11). The laser beam was introduced into the cavity through a slot made in its side wall and let out through another slot in the opposite
side; the beam axis was parallel to and through the center between the rf electrodes. The power density of the laser beam was sufficiently high to cause photodetachment of electrons from all the negative ions in its path. Thus the negative ion density can be determined from the increase of the electron density just after the irradiation of the plasma, knowing the irradiated plasma volume.6 To measure the temporal variation of the negative ion density, the plasma was irradiated by a laser pulse at various delay times with respect to the rise or fall of the modulated rf power. If the negative ion density is very low, the shift of the resonance frequency caused by the photodetached electrons can be much smaller than the width of the resonance curve. In such cases, if the microwave frequency is appropriately fixed at a slightly off-resonant position, the jump in the detected microwave signal at the instant of laser irradiation should be linearly proportional to the negative ion density. Therefore, the temporal variation of the relative negative ion density can be studied by using only one microwave frequency, significantly to reduce the measurement time. Measurements of the negative ion density in the late-after- glow plasma were carried out on such a relative scale and were put on an absolute scale ,by actually measuring the resonance-frequency shift for one of the data points.
Ill. AMBIPOLAR DIFFUSION
Ambipolar diffusion phenomena in the presence of negative ions has been formulated by a number of authors12-r4 and most thoroughly by Rogoff. l4 To an extent helpful for later discussion we briefly summarize the the- ory. Assuming that the charged particles in a weakly ion- ized plasma are only one type of positive ion, one type of negative ion, and electrons, their fluxes are given by
r+= -D,Vn+ +p+n+E, (2)
I’-== -DeVn- -p-n-E, (3)
re= - Deb - /we& (4) where E is the space-charge electric field, D the diffusion coefficient, 1-1 the mobility, and n the particle density, with subscripts +, -, and e standing for the positive ion, negative ion, and electron, respectively. On the assumption of quasineutrality n + = n _ + n, which also implies l? + = I _ + Fe, we can eliminate E from Eqs. (2)-(4). The resulting expressions are rather complicated, but can be simplified under certain conditions. Let us write
a=n -he.
Y= (D&e)/P+/p+ 1,
where y is the ratio between the electron and ion temper- atures if the particle energy distribution functions are Max- wellian (we also assume equal positive and negative ion temperatures ) . When a is small or moderately large so that a-4&@+ +p-I- lo2 - 103, and ifa is constant over space, Eqs. (2)-(4) can be approximated as
r+--D+(i+y)Vn+, (5)
2940 J. Appl. Phys., Vol. 70, No. 6, 15 September 1991 Kono et al. 2940
Downloaded 31 May 2010 to 131.155.151.26. Redistribution subject to AIP license or copyright; see http://jap.aip.org/jap/copyright.jsp

r_CX- iD-(1-y) +o+(l+a>(2~-/iU,)lVn-, (6)
I?,- - [D,(l +y)(a+ 1) +D-(y- l>alVn, (7)
Equation (5) has the same form as the well-known ambi- polar flux in the absence of negative ions. In Eq. (6) the second term in the square brackets is only important when the first term nearly vanishes with y- 1; in other words, the etfective diffusivity for negative ions is much smaller than free ion diffusivities under isothermal conditions (ye 1) and can be negative when y > 1. Equation (7) shows that the effective electron diffusivity is approxi- mately proportional to a and thus can be much larger than the ambipolar diffusivity in the absence of negative ions. The increase of the electron diffusivity with increasing a saturates when a becomes large enough that a ) ,u$(,u + + y _ ); under this condition the electron flux is given by (also on the assumption of constant a over space)
r p= -D,[l+ (p+ -p-)/“/(p+ +p-)P,, (8) that is, the effective electron diffusivity is close to the free electron diffusivity. .Further when a>y&/(p + + p _ ), the ion fluxes reduce to
1’+-17-3 -D,J7n+, (9)
whereDGi=(puD+ + p+D_)/(p+ + p-)istheambi- polar diffusion coefficient for the ion-ion system.
The electron densities measured in this work are in the range of 10” - 10” m - 3 and at low densities the assump- tion of quasineutrality might be no longer valid. To get ideas about the phenomena at low electron densities, as well as to see the variation of CY over space, a numerical simulation of the afterglow plasma was carried out. The results are presented in the appendix.
IV. EXPERIMENTAL RESULTS AND DISCUSSION
A. Electron density in the afterglow
Figures 1 and 2 show the decay of the electron and negative ion densities after termination of the discharge for different conditions. In general, the electron density decay curves show that the relatively rapid decay rate in the early afterglow (ts 0.3 ms) slows down in. the late afterglow, approaching the negative ion decay rate. Mainly referring to the result in Fig. 1 (a) for convenience, the behavior of the electron density is interpreted as follows.
First we estimate the diffusion loss rate of electrons in the afterglow. We note that the high electron temperature in the active plasma cools down to thermal values in the afterglow almost immediately on the time scale shown in the figures; on the basis of reported cross sections for vi- brational excitation of CF4 by electron impact,“‘16 the time required for the 4-eV electron to cool down to the vibra- tional threshold energy of about 0.05 eV is estimated to be of the order of 1 ,U s or less at the CF4 pressure of 100 mTorr. With y= 1, Eq. (7) gives 2(a + l)D+ as the effective ambipolar diffusion coefficient for electrons. The dominant positive ion in the CF4 discharge is reportedly
2941 J. Appl. Phys., Vol. 70, No. 6, 15 September 1991
10’
10’
m ‘E
r 10’
c co az
z 10’
10’
10’ 0.5
TihlE’ Imsl 1.5
FIG. 1. Decay of the electron (n,) and negative ion (n _ ) densities in the afterglow of a CF4 plasma generated at an rf power of 3.5 W and pres- sures of (a) 100 mTorr and (b) 300 mTorr; measurements were made by using a short circuit. The solid lines through the measured negative ion densities (Cl) are the result of a simulation with parameters shown in Table I.
CF,+ ,2*17 and therefore, from the measured mobility of CF, in CFq,18 together with the assumption of approxi- mate equality of the mobilities of CF, and CF,+ , an esti- mate of D + at 100 mTorr ( Ti = 0.03 eV) is obtained to be 0.023 m2 s - ‘. Thus the electron diffusion loss rate given by 2(a + 1)D+/h2, where A= (2/r) cm, is found to be 1.2~ lo4 s - ’ for a = 10. If the electron density decays faster than the negative ion density, the value of a, and accordingly the electron loss rate, increase rapidly as the time goes on. This means that electrons should disappear almost completely in about 100 ps, as is observed in the simulation shown in the Appendix [Fig. 5 (a), curve ai]. The behavior of the experimental electron density in Fig. 1 (a), in its early-afterglow part, shows features just de- scribed above and therefore can be explained as an ambi- polar diffusion phenomenon with the diffusivity enhanced by the presence of negative ions.
Some volume loss processes of electrons may also con- tribute significantly to the decay of the electron density in the early afterglow. Recombination of thermalized elec- trons with molecular ions can take place with a rate con- stant as large as 10 - I2 m3 s-i (Ref. 19); with n, = lOI m - 3, this rate constant gives an electron loss rate of 104 s-i, which is comparable to the diffusion loss rate at the
Kono et al. 2941
Downloaded 31 May 2010 to 131.155.151.26. Redistribution subject to AIP license or copyright; see http://jap.aip.org/jap/copyright.jsp

(aI
0 0.5 1.5 2
FIG. 2. Decay of the electron (n,) and negative ion (n _ ) densities in the afterglow of a CF4 plasma generated at a pressure of 200 mTorr and rf powers of (a) 3.5 W and (b) 9 W, only the 3.5-W measurements were made by using a short circuit. The solid lines through the measured negative ion densities (Cl) are the result of a simulation with parameters shown in Table I.
beginning of the decay. Nondissociative attachment of thermalized electrons to molecules and radicals in the CF4 plasma could safely be neglected if we use typical rate constants for ternary and radiative attachment processes.20 Dissociative attachment of thermalized electrons to CF,(x = 1 - 4) and C2F6 is energetically not possible. However, dissociative attachment to F2 has a large rate constant (-lo- I4 m3 s - 1),21 and may well be a signifi- cant electron loss process depending on the F2 density in the plasma; if the F2 density is - 1018 m - 3, the electron loss rate due to this process is comparable to the diffusion loss rate at the beginning of the decay. The decay rate of the electron density in Fig. 1 (a) gradually increases as the time increases in the early afterglow part. Thus, even if the above mentioned processes are important at the beginning of the decay, the diffusion loss process soon outweighs them as a increases.
It is clear from the above discussion that the observed persistence of the electron density in the late afterglow should be ascribed to some electron generation process, probably to the collisional detachment reaction given by Eq. ( 1). Thus the apparent slow electron-density decay rate in the late afterglow should be due to the slow negative ion decay rate. The actual electron loss rate in the late
2942 J. Appl. Phys., Vol. 70, No. 6, 15 September 1991
afterglow is much faster, as is demonstrated by the fact that the excess electrons generated by laser induced pho- todetachment in the late afterglow disappeared with a time constant of about 1 ps.
It may be of interest to note the effect of the short circuit on the electron density decay. Among the results shown in Figs. 1 and 2, only the result in Fig. 2(b) was measured wjthout short circuit. The electron density in Fig. 2(b) shows a rapid decrease for a period of a few tens of microseconds immediately after termination of the dis- charge. The length of this period coincides with the dura- tion of the dc bias voltage in the afterglow, and it is likely that the dc bias voltage accelerates the electron escape to the wall.
B. Negative ion density in the afterglow
The temporal variation of the negative ion density was measured up to about t=3 ms after termination of the discharge. However, the detected excess-electron signals for measurements with t 5L 2 ms were almost constant and showed no spatial dependence when the laser beam was scanned in the axial direction of the cylindrical cavity; this makes a marked contrast with the measurements at t=0.5 ms, in which the negative ion density showed a sine-like distribution between the electrodes. Moreover, some signal was also detected without igniting the plasma. Therefore we have judged that the signal in the very late afterglow does not come from electrons detached from negative ions, but comes from some kind of photoelectrons, possibly gen- erated on the walls by stray laser photons. In the results shown in Figs. 1 and 2, the nominal density obtained from the very late afterglow has been subtracted from all the data points. This correction is only a few percent in the early afterglow, but becomes large in the late afterglow.
The negative ion density in Figs. 1 and 2 shows a decrease of more than two orders of magnitude in the dis- played 2-ms period. The assumption that the initial decay rate is caused entirely by ion-ion recombination leads to a conclusion that the decrease of the density should be only one order of magnitude in the same time period because of the rapidly decreasing recombination loss rate with de- creasing ion density. Diffusion is not expected to be impor- tant as a negative ion loss process as is suggested by Eq. (6) with y = 1 as well as by the simulation in the appen- dix. We therefore reach the conclusion that the negative ions are lost significantly by collisional detachment, con- firming the conclusion in the previous section.
To analyze the behavior of the negative ion density more quantitatively, we have employed the following model:
dn _ -= -k,n-n, dt - &n _ exp( - Rt). (10)
Here, k, is the ion-ion recombination rate constant and & is the collisional detachment rate given by the product of the rate constant kd and no, the density of the species (in the active plasma) that cause collisional detachment; no is assumed to decrease exponentially at a rate R in the after-
Kono et a/. 2942
Downloaded 31 May 2010 to 131.155.151.26. Redistribution subject to AIP license or copyright; see http://jap.aip.org/jap/copyright.jsp

TABLE I. Collisional detachment rate & and its decreasing rate R de- duced from the fit of the solution of Eq. (10) to the experimental results. The recombination rate constant k, was fixed at 5 x 10 7 l3 m3 s - ’ in the fit. Estimated errors in Kd and R are 20%.
Pressure Power (mTorr) W)
100 3.5 200 3.5 300 3.5 200 9
Kd R (103 s-1) (103 s-1)
4.0 0.42 5.5 0.46 6.6 1.1 5.8 0.86
glow. (Note that the collisional detachment itself should be a minor process causing the decrease of no since n- is expected to be much smaller than no.) We have neglected generation of negative ions (possibly by electron attach- ment to F2) because the electron density is orders of mag- nitude smaller than the negative ion’density during most of the decay period. Equation ( 10) was solved numerically, taking n + = n _ + n, and using the experimental values of n,. By systematically changing the parameters k, &, and R, solutions were fitted to the experimental results. For the data in Figs. 1 (b) and 2(b), a good fit was obtained in the entire time span as shown in the figures. In other cases it was found that the experimental decay rate began to be- come too slow at around t- 150 ,us if we tried to get a good fit for data points in the very beginning of the decay and in the late afterglow; therefore fits’were made for data points with t > 300 ps. Best fits were obtained when we set k, = (5 =i= 2) X 10-‘3m3s-1 . This magnitude is acceptable for two-body ion-ion mutual neutralization collisions.22 Table I showsthe optimized values of & and R when k, is tixed at 5X1O-‘3 m3 s-l.
The reason why the model could not give a good fit for the full time span may be explained as follows. Electrons generated by collisional detachment can have much higher energy ( - 1 eV) than the thermal energy. As the effective electron diffusivity increases with increasing (Y, generated hot electrons do not have sufficient cooling time before escaping to the wall and thus the average electron energy becomes higher than the thermal energy. This will cause negative equivalent diffusivity of the negative ions, as is suggested by Eq. (6) and the simulation in the appendix, resulting in slowing down of the negative ion decay rate. We expect the effect to be largest shortly after the begin- ning of the decay, when initial thermalized electrons largely disappear while the generation rate of hot electrons is still relatively high. For the result in Fig. 1 (b) the effect should be small because of a relatively small diffusivity at 300 mTorr; it should also be small for the result in Fig. 2(b) because a relatively large amount of initial thermali- zed electrons takes a longer time to disappear.
The results in Table I indicate that in the active plasma collisional detachment and ion-ion recombination are comparable negative ion loss processes under the present low-power conditions. As & appears relatively insensitive to the rfpower, so does the density of the species that cause collisional detachment. This might not be surprising if we
2943 J. Appl. Phys., Vol. 70, No. 6, 15 September 1991
@a ‘E
In I- 4 0
s. c cn z “, 2- zz 0 P z 2 w
0' ' I I I I 0 2 4 6 8
TIME Imsl
FIG. 3. Variation of the electron density after the initiation of a lOO- mTorr 12-W CF, plasma.
note that R, the loss rate of those species, increases with increasing rf power.
Because of the reasons mentioned in Sec. I, the asso- ciative detachment reaction in Eq. ( 1) is believed to be most responsible for the collisional electron detachment from F- . Booth et al. investigated the CF, and CF radical densities in the afterglow and in the plasma initiation phase of a 100-W rf CF4 discharge,’ and concluded that the dom- inant loss mechanism of these radicals is a wall process.23 They found that for CF2 the density decay rate in the afterglow was around 140 s - ’ at 50 mTorr, which de- creased by a factor of 2 when pressure was increased up to 500 mTorr; for CF the decay rate was around 600 s - ’ at 50 mTorr, which also decreased by a factor of 3 at 500 mTorr. In contrast to these results, the value of R in Table I increases with increasing pressure. This suggests that the dominant species that causes associative collisional detach- ment from F - is neither CF2 nor CF, but likely to be CF3. Adopting a value of kd = 5 x 10 - I6 m3 s - I as the detachment collision rate constant,24 the density of the spe- cies that perform associative detachment is estimated to be Kd/kd - 1019 m - 3. In the simulation of a CF4 plasma (500 mTorr and n, = 6 X 10¹⁶ m - 3, by Ryan and Plumb,25 the CF3 density accumulated to a few times lOI9 m ‘- 3. Thus if. we assume that Kd depends weakly on the rf power also in the higher power region, the assumption that CF3 is mainly responsible for the detachment collision does not contra- dict with the simulation by Ryan and Plumb.
C. Plasma initiation
Figure 3 shows the variation of the electron density in the initiation period of a lOO-mTorr 12-W discharge. After a transient overshoot for a period of a few hundred micro- seconds, the electron density only shows a slow and small increase toward a steady-state value. The negative ion den- sity was also measured at t=0.5 ms and t-3 ms after the plasma initiation, as well as in the steady-state plasma; the results indicate that for t > 0.5 ms the negative ion density slightly ( - 15%) decreases toward a steady-state value.
Kono et al. 2943
Downloaded 31 May 2010 to 131.155.151.26. Redistribution subject to AIP license or copyright; see http://jap.aip.org/jap/copyright.jsp
m ‘I
z- I- -
E 10' m
4-
10’3, 0 0.2
TIhlF4tmsl 0.t’ j.8
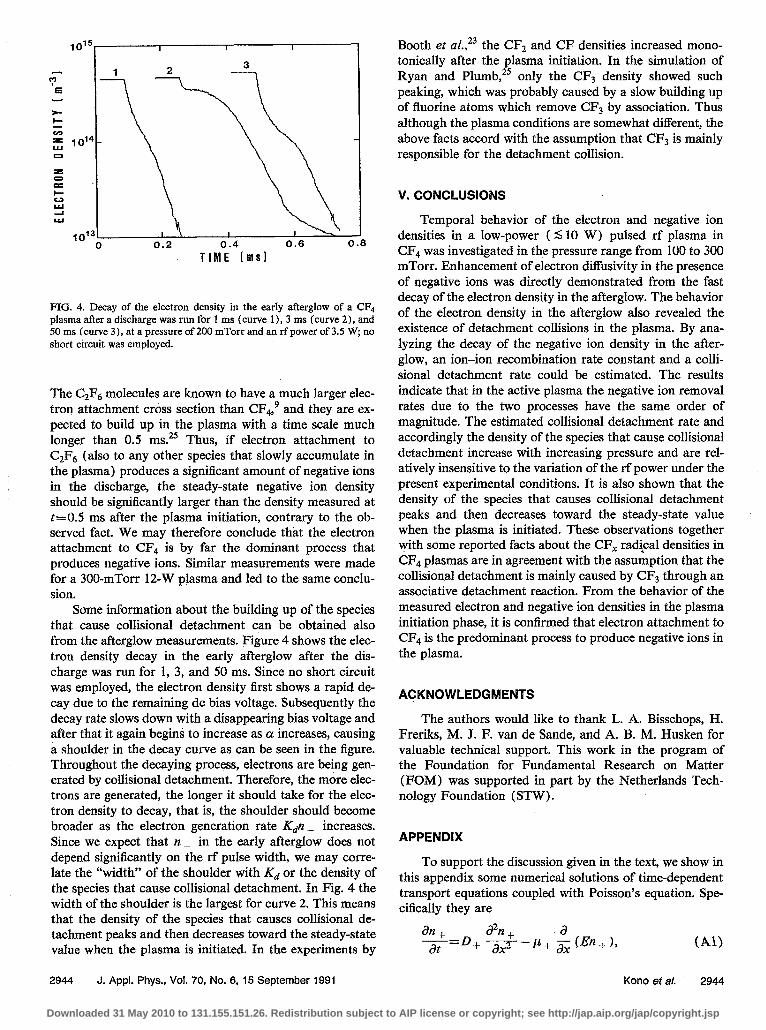
FIG. 4. Decay of the electron density in the early afterglow of a CF, plasma after a discharge was run for 1 ms (curve l), 3 ms (curve 2), and 50 ms (curve 3), at a pressure of 200 mTorr and an rfpower of 3.5 W, no short circuit was employed.
The C2F6 molecules are known to have a much larger elec- tron attachment cross section than CF4,9 and they are ex- pected to build up in the plasma with a time scale much longer than 0.5 ms.25 Thus, if electron attachment to C2F6 (also to any other species that slowly accumulate in the plasma) produces a significant amount of negative ions in the discharge, the steady-state negative ion density should be significantly larger than the density measured at t=0.5 ms after the plasma initiation, contrary to the ob- served fact. We may therefore conclude that the electron attachment to CF4 is by far the dominant process that produces negative ions. Similar measurements were made for a 300-mTorr 12-W plasma and led to the same conclu- sion.
Some information about the building up of the species that cause collisional detachment can be obtained also from the afterglow measurements. Figure 4 shows the elec- tron density decay in the early afterglow after the dis- charge was run for 1, 3, and 50 ms. Since no short circuit was employed, the electron density first shows a rapid de- cay due to the remaining dc bias voltage. Subsequently the decay rate slows down with a disappearing bias voltage and after that it again begins to increase as (r: increases, causing a shoulder in the decay curve as can be seen in the figure. Throughout the decaying process, electrons are being gen- erated by collisional detachment. Therefore, the more elec- trons are generated, the longer it should take for the elec- tron density to decay, that is, the shoulder should become broader as the electron generation rate Kdn _ increases. Since we expect that n _ in the early afterglow does not depend significantly on the rf pulse width, we may corre- late the “width” of the shoulder with Kd or the density of the species that cause collisional detachment. In Fig. 4 the width of the shoulder is the largest for curve 2. This means that the density of the species that causes collisional de- tachment peaks and then decreases toward the steady-state value when the plasma is initiated. In the experiments by
Booth et a1.,23 the CF2 and CF densities increased mono- tonically after the plasma initiation. In the simulation of Ryan and Plumb,25 only the CF3 density showed such peaking, which was probably caused by a slow building up of fluorine atoms which remove CFs by association. Thus although the plasma conditions are somewhat different, the above facts accord with the assumption that CF3 is mainly responsible for the detachment collision.
v. CONCLUSlONS
Temporal behavior of the electron and negative ion densities in a low-power ( d 10 W) pulsed rf plasma in CF4 was investigated in the pressure range from 100 to 300 mTorr. Enhancement of electron diffusivity in the presence of negative ions was directly demonstrated from the fast decay of the electron density in the afterglow. The behavior of the electron density in the afterglow also revealed the existence of detachment collisions in the plasma. By ana- lyzing the decay of the negative ion density in the after- glow, an ion-ion recombination rate constant and a colli- sional detachment rate could be estimated. The results indicate that in the active plasma the negative ion removal rates due to the two processes have the same order of magnitude. The estimated collisional detachment rate and accordingly the density of the species that cause collisional detachment increase with increasing pressure and are rel- atively insensitive to the variation of the rf power under the present experimental conditions. It is also shown that the density of the species that causes collisional detachment peaks and then decreases toward the steady-state value when the plasma is initiated. These observations together with some reported facts about the CF, radical densities in CF4 plasmas are in agreement with the assumption that the collisional detachment is mainly caused by CFs through an associative detachment reaction. From the behavior of the measured electron and negative ion densities in the plasma initiation phase, it is confirmed that electron attachment to CF4 is the predominant process to produce negative ions in the plasma.
ACKNOWLEDGMENTS
The authors would like to thank L. A. Bisschops, H. Freriks, M. J. F. van de Sande, and A. B. M. Husken for valuable technical support. This work in the program of the Foundation for Fundamental Research on Matter (FOM) was supported in part by the Netherlands Tech- nology Foundation (STW).
APPENDIX
To support the discussion given in the text, we show in this appendix some numerical solutions of time-dependent transport equations coupled with Poisson’s equation. Spe- cifically they are
an+ a2n + ---ED ----q-
at + ax- -P+ g (En+),
2944 J. Appl. Phys., Vol. 70, No. 6, 15 September 1991 Kono et al. 2944
Downloaded 31 May 2010 to 131.155.151.26. Redistribution subject to AIP license or copyright; see http://jap.aip.org/jap/copyright.jsp

cl ‘E
TIME (msl
FIG. 5. (a) Simulated decay of the average values of the electron (n,), positive ion (n .+ ), and negative ion (n- ) densities in the presence (curves (I,, u2, as) and absence (curves b,, 9) of negative ions; diffusion is assumed to be the only loss process. For clearness, the negative ion density is multiplied by 0.8 for curve as. (b) Simulated behavior of the electron density (n,: mean value) and the negative ion density (n _ : mean value; n-i value at the center of space) when collisional detachment exists; the electron temperature is assumed to be 0.3 eV (curves a, - us) or to be equal to the ion temperature of 0.03 eV (curves b,, b2).
dn- a2t2 _ a -- at -D_ --jg-+y- 3;
an, a2ne a -= at 4 . a~c2 + Y, z (En,)
aE e -=- ax Eo (n, - n- -h),
, (A3)
W4)
where e is the elementary charge, e. the permittivity of free space, and the other notations are the same as in Eqs. (2)-(4). The method of solution and the boundary condi- tions employed are essentially the same as described by Boeuf.26 The 2-cm electrode spacing was divided into 100 cells and the time step of the integration was 2 ns. A half- cycle sine function, with its zeros at the boundary, was used as the initial distribution of the particle densities. Based on Ref. 16, the following values were used for the mobility and diffusion coefficient of ions at 100 mTorr: P+ =0.76 m2sE1V-‘, ,u- =1.14 m’s-IV-‘, and D,/p+ =0-/p- =0.03 eV.
In Fig. 5 (a), the simulated decay of the particle den- sities in the presence of negative ions is compared with that in the absence of negative ions. The afterglow plasma was assumed to be isothermal (DJp, = 0.03 eV) and the value of De was somewhat arbitrarily chosen to be 90 m2 s - * (the results were not very sensitive to a specific value of DeaslongasD,%D+,D- andn,PZ 10’3m-3).Forcurves al, a2, and a3, the initial peak particle densities were taken tobe n = 1015m-3 ,n- = 10 X n,,andn+ = 11 X n, and forecurves b1 and b2, n2, = n + = 1015 m- 3. Although the figure is presented for a pressure of 100 mTorr, it can represent the results at a pressure of x times 100 mTorr if the time scale is multiplied by x. Comparison of curves
2945 J. Appl. Phys., Vol. 70, No. 6, 15 September 1991
al and bl demonstrates that the presence of negative ions can greatly enhance the electron escape (note the different time scales used for display). Though not clear from curves al - a3, the-average value of the net space-charge densityn+ - n- - n, becomes comparable to average II, when it decreases to - 10” m - ‘; however, the net space charge is concentrated in the region near the wall, and its density is always less than 10” m - 3 at the center of space. The net charge flux to the wall, I’ + - I I - lYe, becomes comparable to F, at n, - 10” m- 3. For curve a1 the elec- tron decay rate is close to that of free electrons at n, - 10” m - 3, while for curve bl the electron decay is much slower at the corresponding electron density. Thus, al- though the breakdown of the quasineutrality is consider- able at n, - 10” m - 3, the existence of large amounts of positive and negative ions still has a notable effect on the electron diffusivity around this electron density. As can be seen from curve az, the loss of negative ions by diffusion is strongly suppressed until most electrons have disappeared. While the quasineutrality is valid, suppression of the neg- ative-ion diffusion necessarily means that the ratio between the slopes of curve a3 and curve al is equal to a + 1, as Eqs. (5) and (7) (with y = 1) predict. The density ratio a is found to be a weak function of position, its variation over space being at most a factor of three throughout the decay process. (This is only true under the isothermal condition; when y> 1, the ratio a can be orders of magnitude smaller near the wall than in the center of space.)
In the late-afterglow part of Figs. 1 and 2, the electron density is low, but electrons are continuously generated by collisional detachment and escaping to the wall rapidly. To estimate the effect of such electrons on the diffusion of negative ions, the following simulation was carried out. Introducing a negative ion loss term - Kdn _ and an elec- tron generation term + Kdn I into Eqs. (A2) and (A3), respectively, Eqs. (Al )-( A4) were integrated with initial densities (peak values) n + = n _ = 1015 m - 3 and n, = 0. The collisional detachment rate Kd was assumed to be time- and space-independent and was set at 2000 s - *, which roughly corresponds to the late-afterglow value for the results in Fig. 1 (a). Figure 5 (b) shows the results of the integration with DJpe = 0.3 eV (curves al, a2, a3> and DJp, = 0.03 eV (curves br, bz); De was fixed at 90 m2 s - ‘. The calculated electron density (curves al, bl) first increases to - lo’* m - 3 within 1 ps, where generation nearly balances with diffusion loss, and subsequently varies relatively slowly because of the slow variation of the gen- eration rate and the effective diffusion loss rate. When the electron temperature is assumed to be 0.03 eV (curve b,), the electron density gradually increases to reach a magnitude comparable to the negative ion density; calcu- lations with a 10 times as large value of De led to a similar result. Since such a large electron density relative to the ion density is not observed in the experimental results in Figs. 1 and 2, it is suggested that the actual electron temperature in the late afterglow is somewhat higher than the thermal value. The slope of the average negative ion density decay curve (curve a,) almost coincides with the assumed de- tachment rate of 2000 s - ‘. This means that the detached
Kono et al. 2945
Downloaded 31 May 2010 to 131.155.151.26. Redistribution subject to AIP license or copyright; see http://jap.aip.org/jap/copyright.jsp

electrons, despite their low ~density, prevent negative ions from escaping to the wall. As seen from curve a3, the neg- ative ion density in the center of space, when calculated with an electron temperature of 0.3 eV, decays somewhat more slowly than 2000 s - * in the early stage of the decay. This indicates that electrons at low densities can still cause diffusion of negative ions with a negative equivalent di@k- sivity.
‘R. A. Gottcho and C. E. Gaebe, IEEE Trans. Plasma Sci. PS-14, 92 (1986).
‘L. J. Over&, J. H. Beberman, and J. T. Verdeyen, J. Appl. Phys. 66, 1622 (1989).
31. Ishikawa, K. Koike, T. Akitsu, S. Suganomata, and H. Matsuzawa, Jpn. J. Appl. Phys. 29, 767 ( 1990).
“J. L. Jauberteau, G. J. Meeusen, M. Haverlag, G. M. W. Kroesen, and F.~J. de Hoog, Appl. Phys. Lett. 55, 2597 (1989).
‘5. L. Jauberteau, G. J. Meeusen, M. Haverlag, G. M. W. Kroesen, and F. J. de Hoog, J. Phys. D 24, 261 (1991).
‘M. Haverlag, A. Kono, D. Passchier, G. M-W. Kroesen, W. J. Goed- heer, and F. J. de Hoog, J. Appl. Phys. (to be published).
‘S. M. Spyrou, I. Sauers, and L. G. Christophbrou, J. Chem. Phys. 78, 7200 (1983).
‘T, H. J. Bisschops, Ph.D. thesis, Eindhoven University of Technology, 1987.
9S. R. Hunter and L. G. Christophorou, J. Chem. Phys. 80,615O (1984). “W C Price, P. V. Harris, and T. R. Passmore, J; Quantum Spectrosc. . .
2946 J. Appl. Phys., Vol. 70, No. 6, 15 September 1991
Radiat. Trans. 2, 327 (1962). “L. G. Christophomu, Contrib. Plasma Phys. 27, 237:( 1987). “J. B. Thompson, Proc. Phys. Sot. 73, 818-( 1959). 13H. J. Oskam, Philips Res. Rep. 13, 335 (1958). 14G. L. Rogoff, J. Phys. D 18, 1533 (1985). Is M. Hayashi, in Swarm Studies and Inelastic Electron-Molecule Colli-
sions, edited by L. C. Pitchford, B. V. McKay, A. Chutjian, and S. Trajmar (Springer, New York, 1987), p. 167.
16B. Stefanov, N. Popkirova, and L. Zarkova, J. Phys. B 21,3989 (1988). “B. N. Chapman, T. A. Hansen, and V. J. Minkiewicz, J. Appl. Phys. 51,
3608 (1980). I8 J. Dutton, A. Goodings, A. K. Lucas, and A. W. Williams, in Proceed-
ings of the 18th ICPIG, Swansea, edited by T. Will iams (Adam Hilger, Bristol, 1987), p. 20.
“H. M. W. Massey and H. B. Gilbody, Electronic and Ionic Impact Phenomena (Oxford University Press, Oxford, 1974), Vol. IV, Chap.
“?‘M. Smimov, Negative Ions (McGraw-Hill, New York, 1982), Chaps. 4, 6.
‘*D L. McCorkle, L. G. Christophorou, A. A. Christodoulides, and L. Pichiarella, J. Chem. Phys. 85, 1966 (1986).
“R. E. Olson, J. Chem. Phys. 56, 2979 (1972). *‘J. P. Booth, G. Hancock, N. D. Perry, and M. J. Toogood, J. Appl.
Phys. 66, 5251 (1989). “D. Edelson and D. L. Ramm, J. Appl. Phys. 56, 1522 (1984). “K. R. Ryan and I. C. Plumb, Plasma Chem. Plasma Process. 6, 231
(1986). *‘J. P. Boeuf, Phys. Rev. A 36, 2782 (1987).
Kono et a/. 2946
Downloaded 31 May 2010 to 131.155.151.26. Redistribution subject to AIP license or copyright; see http://jap.aip.org/jap/copyright.jsp