Embed Size (px)
Citation preview

Temperature, pressure and water content dependence of dislocation mobility in olivine
Dissertation
zur Erlangung der Würde eines
Doktors der Naturwissenschaften
- Dr. rer. nat. -
der Bayreuther Graduiertenschule für Mathematik und Naturwissenschaften
vorgelegt von
Lin Wang
aus Anhui (China)
Bayreuth, 2018

This doctoral thesis was prepared at the department of (department) at the University of Bayreuth from 10.2014 until 04.2018 and was supervised by Prof. Dr. Tomoo Katsura.
This is a full reprint of the dissertation submitted to obtain the academic degree of
Doctor of Natural Sciences (Dr. rer. nat.) and approved by the Bayreuth Graduate School of Mathematical and Natural Sciences (BayNAT) of the University of Bayreuth.
Date of submission: 05.04.2018 Date of defence: 10.07.2018 Acting director: Prof. Dr. Dirk Schüler Doctoral committee: Prof. Dr. Tomoo Katsura (reviewer) Prof. Dr. David Rubie (reviewer) Prof. Dr. Daniel Frost (chairman) Dr. Gerd Steinle-Neumann

1
Table of contents
Summary ................................................................................................................................................. 5
Zusammenfassung .................................................................................................................................. 8
Symbols and definitions ........................................................................................................................ 12
1. Introduction to dislocation theory and rheology of the Earth’s upper mantle ............................ 14
1.1 Theory of dislocations .................................................................................................... 14
1.1.1 Dislocations .................................................................................................................... 14
1.1.2 Orowan’s equation ......................................................................................................... 21
1.1.3 Models of dislocation creep ........................................................................................... 23
1.1.4 Other deformation mechanisms .................................................................................... 29
1.2 Earth’s upper mantle rheology ...................................................................................... 33
1.2.1 Viscosity estimation of the upper mantle ...................................................................... 33
1.2.2 Seismic anisotropy in the upper mantle ........................................................................ 37
1.2.3 Dislocation creep, crystallographic preferred orientation (CPO), mantle flow and
seismic anisotropy ........................................................................................................................ 38
1.3 Mineralogical models of the Earth’s mantle .................................................................. 40
1.4 Experimental techniques to study the upper mantle rheology ..................................... 42
1.4.1 Deformation techniques ................................................................................................ 42
1.4.2 Diffusion techniques ...................................................................................................... 44
1.4.3 Dislocation recovery techniques .................................................................................... 45
1.5 Previous studies on rheological properties of olivine .................................................... 47
1.5.1 Deformation experiments .............................................................................................. 47
1.5.2 Diffusion experiments .................................................................................................... 54
1.5.3 Dislocation recovery experiments ................................................................................. 57
1.6 Aims of this study ........................................................................................................... 60
1.6.1 Temperature dependence of annihilation rate constants for A-type and B-type
dislocations ................................................................................................................................... 61
2
1.6.2 Pressure dependence of annihilation rate constants for A-type and B-type dislocations
61
1.6.3 Water dependence of annihilation rate constants for C-type dislocations ................... 62
1.6.4 TEM study of E-type dislocations at different conditions .............................................. 63
1.6.5 Examination of cross-slip as a controlled mechanism for olivine deformation ............. 63
1.7 General techniques in this study ................................................................................................ 64
1.7.1 Sample preparation ............................................................................................................. 64
1.7.2 Deformation experiments .................................................................................................... 65
1.7.3 Dislocation recovery ............................................................................................................ 66
1.7.4 Observations of dislocations .......................................................................................... 66
1.7.5 Data reductions .............................................................................................................. 67
1.8 References .................................................................................................................................. 67
2. List of manuscripts and statements of author’s contribution ...................................................... 75
3. Temperature dependence of [100](010) and [001](010) dislocation mobility in natural olivine 77
3.1 Abstract .......................................................................................................................... 77
3.2 Introduction ................................................................................................................... 77
3.3 Experimental Procedures ............................................................................................... 81
Sample Preparation ...................................................................................................................... 81
Production of high dislocation densities ....................................................................................... 81
Dislocation annihilation by annealing ........................................................................................... 83
Measurement of dislocation density ............................................................................................ 84
TEM observation ........................................................................................................................... 84
Data reduction .............................................................................................................................. 85
3.4 Results ............................................................................................................................ 86
3.5 Discussion ....................................................................................................................... 91
Comparison with previous studies ................................................................................................ 91
Comparison of results with other techniques .............................................................................. 92
Geophysics application ................................................................................................................. 93
3.6 Conclusion ...................................................................................................................... 96

3
3.7 Acknowledgements ........................................................................................................ 97
3.8 References ...................................................................................................................... 97
4. Identical activation volumes of dislocation mobility in the [100](010) and [001](010) slip systems
in natural olivine ................................................................................................................................. 102
4.1 Abstract ........................................................................................................................ 102
4.2 Introduction ................................................................................................................. 102
4.3 Experimental Procedures ............................................................................................. 104
4.4 Results .......................................................................................................................... 105
4.5 Discussion ..................................................................................................................... 108
Diffusion-controlled dislocation motion in recovery process ..................................................... 108
Comparison with previous studies .............................................................................................. 109
Comparison with other techniques ............................................................................................ 110
Geophysical application .............................................................................................................. 111
4.6 Acknowledgements ...................................................................................................... 111
4.7 References .................................................................................................................... 112
5. Identical mechanism for the motion of screw and edge dislocations in natural olivine ............ 116
5.1 Abstract ........................................................................................................................ 116
5.2 Introduction ................................................................................................................. 116
5.3 Experimental Procedures ............................................................................................. 118
5.4 Results .......................................................................................................................... 120
5.5 Discussion ..................................................................................................................... 122
5.6 Implications .................................................................................................................. 124
5.7 Acknowledgements ...................................................................................................... 126
5.8 References .................................................................................................................... 126
6. Activation of [100](001) slip system by water incorporation in olivine ...................................... 129
6.1 Abstract ........................................................................................................................ 129
6.2 Introduction ................................................................................................................. 130
6.3 Experimental Procedures ............................................................................................. 132
Sample Preparation .................................................................................................................... 132

4
Hydration/dehydration experiments .......................................................................................... 132
Deformation experiments ........................................................................................................... 134
FT-IR measurements ................................................................................................................... 135
TEM observation ......................................................................................................................... 135
6.4 Results .......................................................................................................................... 136
6.5 Discussion ..................................................................................................................... 140
Comparison of the dislocation microstructures with previous studies ...................................... 140
The mechanism of activation of the [100](001) slip system due to water incorporation .......... 141
6.6 Implications .................................................................................................................. 142
6.7 Acknowledgements ...................................................................................................... 142
6.8 References .................................................................................................................... 143
7 Small effect of water on olivine dislocation creep...................................................................... 147
7.1 Abstract ........................................................................................................................ 147
7.2 Introduction ................................................................................................................. 147
7.3 Experimental Procedures ............................................................................................. 150
Sample Preparation .................................................................................................................... 150
Hydration/dehydration experiments .......................................................................................... 150
Deformation experiments ........................................................................................................... 151
TEM observation ......................................................................................................................... 152
Recovery experiments ................................................................................................................ 153
FT-IR measurements ................................................................................................................... 153
Measurement of dislocation density and data reduction .......................................................... 154
7.4 Results .......................................................................................................................... 154
7.5 Discussion ..................................................................................................................... 158
Comparison with previous studies .............................................................................................. 158
Geophysical implications ............................................................................................................ 160
7.6 Acknowledgements ...................................................................................................... 161
7.7 References .................................................................................................................... 161
Acknowledgments ............................................................................................................................... 165

5
Summary
This thesis is a comprehensive study of dislocation in natural olivine. Since olivine is the
most abundant and weakest mineral in the Earth’s upper mantle, it is believed that the upper
mantle dynamics are controlled by the rheological properties of olivine. Dislocation creep is
considered as the most important mechanism for olivine creep at the upper mantle for the
following reasons. First, a large amount of strain is accommodated by dislocation creep, and
therefore the viscosity of the upper mantle is determined by dislocation creep to a large extent.
Second, olivine fabrics, which can reflect mantle flow geometry, are due to dislocation creep.
Previous deformation and diffusion experiments gave some information on olivine dislocation
creep. However, both of them have limitations. On one hand, the high strain rates in
deformation experiments make the application of results from these experiments to natural
conditions doubtable. On the other hand, the link between diffusion and dislocation creep is
rather indirect. The application of results from diffusion experiments to natural conditions has
to be based on certain creep models. In this project, dislocation recovery method was used to
study the dislocation motions in natural olivine and investigate upper mantle rheology. In
addition, transmission electron microscopy (TEM) was used to make observations to check
whether [100](001) slip system exists at hydrous conditions or not.
Temperature dependence of [100](010) and [001](010) slip system
The decrease of seismic anisotropy with depth [e.g. Dziewonski and Anderson, 1981;
Gung et al., 2003; Mainprice et al., 2000; Montagner and Kennett, 1996] can be explained by
olivine fabric transition of A- to B-type due to temperature [e.g. Carter and Ave'Lallemant,
1970] based on deformation experiments. However, stresses and strain rates in these
experiments are much higher than those in natural conditions. Therefore, the results from
deformation experiments have to be examined by an independent method. Dislocation
recovery was employed to measure the annihilation rate constants of dislocations in the

6
[100](010) and [001](010) slip systems in olivine single crystals at temperatures of 1,450 to
1,760 K, room pressure, and oxygen partial pressures near the Ni-NiO buffer conditions in
order to determine the temperature dependences for these two slip systems. The activation
energies for both slip systems are identical, i.e. 400 kJ/mol, indicating identical temperature
dependences for these two slip systems. Therefore, temperature cannot cause the A- to B-type
fabric transition.
Pressure dependence of [100](010) and [001](010) slip system
Pressure was proposed as a reason for the A- to B-type fabric transition in olivine based on
deformation experiments [e.g. Raterron et al., 2009]. In order to test whether this is true or not
at low stress conditons, dislocation recovery experiments were conducted on olivine single
crystals for [100](010) and [001](010) slip systems at pressures of 2 to 12 GPa, 1650 K and
oxygen fugacity at Ni-NiO buffer conditions. The activation volumes for these two slip
systems are identical, i.e. 2.5 cm3/mol. Therefore, pressure cannot cause the A- to B-type fabric
transition at low stress conditions. Moreover, since the activation volume is small, the effect of
pressure on dislocation creep is also small.
Rate-limiting process of motions of screw dislocation in natural olivine
The traditional climb-model for dislocation creep assumes that the rate-limiting process
for dislocation motions is climb of edge dislocations. However, motions of both edge and
screw dislocations are needed to produce macroscopic strain in a material. If the rate-limiting
process of motions of screw dislocations is different from that of edge dislocations, the
climb-model must be modified. Dislocation recovery experiments were conducted on
[001](010) screw and edge dislocations in olivine single crystals at 1473 to 1673 K, room
pressure and oxygen partial pressure near the Ni-NiO buffer conditions. The activation energy
for the motions of screw and edge dislocations are identical, i.e. 400 kJ/mol. Therefore, the

7
rate-limiting process of motions of screw dislocations is identical to that of edge dislocations.
Thus, the climb-model can be applied to not only to edge but also screw dislocations.
Activation of [100](001) slip system by water incorporation in olivine
E-type fabric has been proposed as the dominant fabric at moderate water content and low
stress conditions [Katayama et al., 2004]. This indicates that the [100](001) slip system must
dominate at such conditions. However, there is no previous study to confirm its existence at
such conditions. TEM observations were conducted on olivine single crystals that were simple
sheared the [100] direction on the (001) plane at anhydrous and hydrous conditions. The (001)
plane was found as a slip plane only at hydrous conditions. Therefore, incorporation of water
into olivine helps to activate the [100](001) slip system.
Water dependence of [001](100) slip system
The effect of water on olivine dislocation creep has been under debate recently.
Deformation experiments suggested that the dislocation creep rate of olivine aggregates is
enhanced by water with a power of 1.2 [e.g. Hirth and Kohlstedt et al., 2003] and that
[001](100) slip system has the largest water dependence among all slip systems in olivine [e.g.
Jung and Karato., 2001]. In contrast, Si diffusion experiments suggested that the water
dependence of dislocation creep is small [Fei et al., 2013]. In this study, dislocation recovery
experiments were conducted on pre-deformed olivine single crystals at 1,473 K, 5 GPa, and
oxygen fugacity near the enstatite-magnesite-olivine-graphite (EMOG) buffer at water
contents ranging from 5 to 90 wt. ppm to determine the annihilation rates for [001] dislocations
on the (100) plane. The dislocation annihilation rate constants increase with water content with
a power of 0.3. Therefore, water has only a small effect on olivine dislocation creep.

8
Zusammenfassung
Diese Doktorarbeit ist eine umfangreiche Studie über Versetzungen in natürlichem Olivin.
Da Olivin das am häufigsten vorkommende und gleichzeitig mechanisch schwächste Mineral
im oberen Erdmantel ist, wird angenommen, dass die rheologischen Eigenschaften von Olivin
die Dynamik des oberen Erdmantels kontrollieren. Als wichtigster Mechanismus für Kriechen
von Olivin im oberen Mantel wird das Versetzungskriechen angesehen. Die Gründe dafür sind
erstens die Aufnahme eines hohen Anteils von Verformung durch Versetzungskriechen, sodass
die Viskosität des oberen Mantels weitgehend durch Versetzungskriechen bestimmt wird.
Zweitens werden Olivin-Texturen, welche Fließmuster im Mantel widerspiegeln können,
durch Versetzungskriechen verursacht. Vorhergehende Verformungs- und
Diffusionsexperimente gaben Aufschluss über das Versetzungskriechen von Olivin, haben
jedoch Einschränkungen. Zum einen ist die Anwendung von Ergebnissen, die in
Verformungsexperimenten unter hohen Verformungsraten ermittelt worden sind, auf natürliche
Bedingungen zweifelhaft, zum anderen ist der Zusammenhang zwischen Diffusion und
Versetzungskriechen nur indirekt. Die Anwendung der Ergebnisse aus Diffusionsexperimenten
auf natürliche Bedingungen muss auf spezifischen Kriechmodellen basieren. In diesem Projekt
wurde hauptsächlich eine Methode genutzt, bei der die Erholung von Versetzungen verursacht
wird (Versetzungs-Erholungs-Methode), um die Versetzungsbewegungen in natürlichem
Olivin zu analysieren und dadurch die Rheologie des oberen Mantels zu untersuchen.
Des Weiteren wurde mithilfe von transmissionselektronenmikroskopischen (TEM)
Untersuchungen geprüft, ob das [100](001) Gleitsystem bei wasserhaltigen Bedingungen
existiert.
Temperaturabhängigkeit der [100](010) und [001](010) Gleitsysteme
Die Verminderung der seismischen Anisotropie mit zunehmender Tiefe [z.B. Dziewonski
und Anderson, 1981; Gung et al., 2003; Mainprice et al., 2000; Montagner und Kennett, 1996]

9
kann durch einen Übergang der Textur von A- zu B-Typ aufgrund von Temperaturänderung
[z.B. Carter und Ave'Lallemant, 1970] erklärt werden. Diese Kenntnisse basieren auf den
Ergebnissen aus Verformungsexperimenten. Mechanische Spannungs- und Verformungsraten
unter experimentellen Bedingungen sind jedoch signifikant höher als unter natürlichen
Bedingungen.
Deswegen müssen Ergebnisse, die aus Verformungsexperimenten gewonnen werden, mit
einer unabhängigen Methode überprüft werden.
Es wurde die Versetzungs-Erholungs-Methode an Olivin-Einkristallen, um die
Konstanten der Annihilationsraten von Versetzungen in den [100](010) und [001](010)
Gleitsystemen bei Temperaturen von 1,450 bis 1,760 K, Raumdruck und einem
Sauerstoff-Partial-Druck im Bereich des Ni-NiO-Puffers zu messen. Aus diesen Konstanten
kann eine Temperaturabhängigkeit für die beiden genannten Gleitsysteme bestimmt werden.
Die Aktivierungsenergien für die genannten Gleitsysteme sind mit 400 kJ/mol identisch,
welches auf eine identische Temperaturabhängigkeit hinweist. Daher kann
Temperaturänderung nicht die Texturentwicklung von A zu B-Typ verursachen.
Druckabhängigkeit des [100](010) und [001](010) Gleitsystems
Aufgrund von weiteren Verformungssexperimenten [z.B. Raterron et al., 2009] wird eine
Druckänderung als Grund für den Übergang von A- zu B-Typ Textur in Olivin vorgeschlagen.
Um dies bei niedriger mechanischer Spannung zu testen, wurden Experimente zur
Versetzungs-Erholung an Olivin-Einkristallen für die [100](010) und [001](010) Gleitsysteme
bei Drücken von 2 bis 12 GPa, 1,650 K und Sauerstofffugazitäten im Bereich des Ni-NiO
Puffers durchgeführt. Die Aktivierungsvolumina für die genannten Gleitsysteme sind mit 2.5
cm3/mol identisch. Deshalb kann eine Druckänderung nicht den Übergang von A- zu B-Typ
Textur bei niedrigen mechanischen Spannungen verursachen.
Zudem ist der Druckeffekt auf Versetzungskriechen aufgrund des niedrigen
Aktivierungsvolumens ebenfalls gering.

10
Geschwindigkeitsbestimmender Prozess von Bewegungen von Schraubenversetzungen in
natürlichem Olivin
Im klassischen Modell über Versetzungskriechen durch Klettern der Versetzungen wird
angenommen, dass der geschwindigkeitsbestimmende Prozess für Versetzungsbewegungen
das Klettern von Stufenversetzungen ist. Jedoch werden Bewegungen von Stufen- sowie
Schraubenversetzungen benötigt, um makroskopische Verformung in einem Material
hervorzurufen. Wenn sich der geschwindigkeitsbestimmende Prozess von
Schraubenversetzungsbewegungen von dem von Stufenversetzungsbewegungen unterscheidet,
muss das Modell über Versetzungskriechen durch Klettern der Versetzungen modifiziert
werden. Es wurden Experimente zur Versetzungs-Erholung an [001](010) Schrauben- und
Stufenversetzungen bei Temperaturen von 1,473 bis 1,673 K, Raumdruck und einer
Sauerstofffugazität im Bereich des Ni-NiO Puffers durchgeführt. Die Aktivierungsenergie für
die Bewegung von Schrauben- und Stufenversetzungen ist mit 400 kJ/mol identisch. Daraus
ergibt sich, dass der geschwindigkeitsbegrenzende Prozess von
Schraubenversetzungsbewegungen der gleiche Prozess für Stufenversetzungen ist. Das
Versetzungsklettern-Modell kann daher nicht nur für Stufen-, sondern auch für
Schraubenversetzungen angewendet werden.
Aktivierung des [100](001) Gleitsystems durch die Aufnahme von Wasser in Olivin
Die E-Typ Textur wurde als dominierende Textur bei moderaten Wassergehalten und
Bedingungen niedriger mechanischer Spannung vorgeschlagen [Katayama et al., 2004]. Dies
weist darauf hin, dass das [100](001) Gleitsystem unter diesen Bedingungen dominiert. Bisher
gibt es keine Studie, die die Existenz dieses Gleitsystems bei den genannten Bedingungen
bestätigt. Es wurden TEM Untersuchungen an Olivin-Einkristallen, die in [100] Richtung auf
(001) Ebenen geschert wurden, unter trockenen und wasserhaltigen Bedingungen durchgeführt.
Die (001) Ebene fungierte nur unter wasserhaltigen Bedingungen als Gleitebene. Daraus wird

11
geschlussfolgert, dass der Einbau von Wasser in Olivin die Aktivierung des [100](001)
Gleitsystems vorantreibt.
Wasser-Abhängigkeit des [100](001) Gleitsystems
Der Effekt von Wasser auf das Versetzungskriechen von Olivin wird zur Zeit stark
diskutiert. Verformungsexperimente weisen darauf hin, dass Versetzungskriechraten in
polykristallinem Olivin bei Wasseranwesenheit beschleunigt ist und mit der Potenz von 1.2
zunimmt [z.B. Hirth und Kohlstedt et al., 2003]. Das [100](001) Gleitsystem wird als
Gleitsystem mit größter Wasserabhängigkeit unter allen vorhandenen Gleitsystemen in Olivin
angesehen [z.B. Jung und Karato., 2001]. Im Gegensatz dazu zeigen Si Diffusionsexperimente
eine geringe Wasserabhängigkeit von Versetzungskriechen an [Fei et al., 2013]. In dieser
Arbeit wurden Experimente zur Versetzungs-Erholung von vorverformten Olivin-Einkristallen
bei Temperaturen von 1473 K, 5 GPa und einer Sauerstofffugazität im Bereich des
Enstatit-Magnesit-Olivin-Graphit (EMOG) Puffers durchgeführt, um Annihilationsraten für
[001] Versetzungen in der (100) Gleitebene zu bestimmen. Die Wassergehalte liegen im
Bereich von 5 - 90 ppm. Die Konstanten der Annihilationsraten der Versetzungen steigen mit
zunehmenden Wassergehalt mit einer Potenz von 0.3. Daraus wird gefolgert, dass Wasser einen
geringen Effekt auf Olivin-Versetzungen hat.

12
Symbols and definitions
𝑩𝑩�: dislocation mobility tensor
b: Burger’s vector of dislocations
c*: concentration of vacancy under stressed conditions
c0: concentration of vacancy at equilibrium conditions
CH2O: concentration of water
Dgb: grain-boundary diffusivity of a component
Dsd: lattice diffusivity of a component
E: activation energy
f: force exerted on a dislocation
fO2: oxygen fugacity
G: shear modulus
H: activation enthalpy
J: flux of a component
k: dislocation annihilation rate constant
K: resistance force during dislocation motion
L: grain size
Lc: dislocation climb distance
Lg: dislocation glide distance
M: direction of dislocation motion
T: length of a dislocation
t: time
T: unit vector tangent to the dislocation
v: individual dislocation velocity
�̅�𝑣: average dislocation velocity
ΔV: activation volume
𝝈𝝈�𝒆𝒆𝒆𝒆: external stress tensor

13
𝝈𝝈�𝒊𝒊𝒊𝒊: internal stress tensor
ε: strain
η: viscosity
ρ: free dislocation density
τ: resolved stress on a unit length dislocation
Ω: molar volume of atom

14
1. Introduction to dislocation theory and
rheology of the Earth’s upper mantle
1.1 Theory of dislocations
1.1.1 Dislocations
The concept of dislocations was first proposed to reconcile theoretical and experimental
values of the applied shear stress for plastic deformation. Instead of shearing the bulk of the
crystal in one step, macroscopic strains are results of accumulation of micro strains on lattice
scales. A dislocation is defined as a line defect that marks a boundary between strained and
unstrained areas in a crystal (Fig. 1.1.1a). Sweep of a dislocation through the whole crystal
leaves a step on a surface of the crystal and leads to a macroscopic strain (Fig. 1.1.1b).
Fig 1.1.1. The red region is displaced relative to the region below. Therefore, the material is
deformed. The yellow line marks the boundary between the deformed and undeformed areas
in 1.1.1a, defined as the dislocation. In Fig. 1.1.1b, the dislocation line goes through the
whole plane and leaves a step at surface, leading to a macroscopic strain.

15
1.1.1.1 Characterization of dislocations
Dislocations can be visualized using the Volterra construction. Let the lattice shown in the
left part of Fig. 1.1.2 be perfect and undeformed. Cut the lattice along any plane indicated in the
middle part of the cubes and let the atoms on one side of the cutting plane shift by a vector b
relative to the corresponding atoms on the other side. Then rejoin the atoms on either side of the
cutting plane. The new distorted lattice is shown in the right part of the figure. The lattice
structure itself is actually almost perfect except near the lines AB. The line defects AB in the
lattice are dislocation lines and the region where lattices are strongly distorted is called the
dislocation core.
Fig 1.1.2. Dislocations with different characters. The top, middle and bottom cases show edge,
screw and mixed dislocations, respectively.
The slip vector b is called Burger’s vector. The plane defined by T and b is called slip
plane, where T is a unit vector tangent to the dislocation line. A slip plane and b consist of a
slip system. The upper two figures in Fig. 1.1.2 show two end-member types of dislocation
16
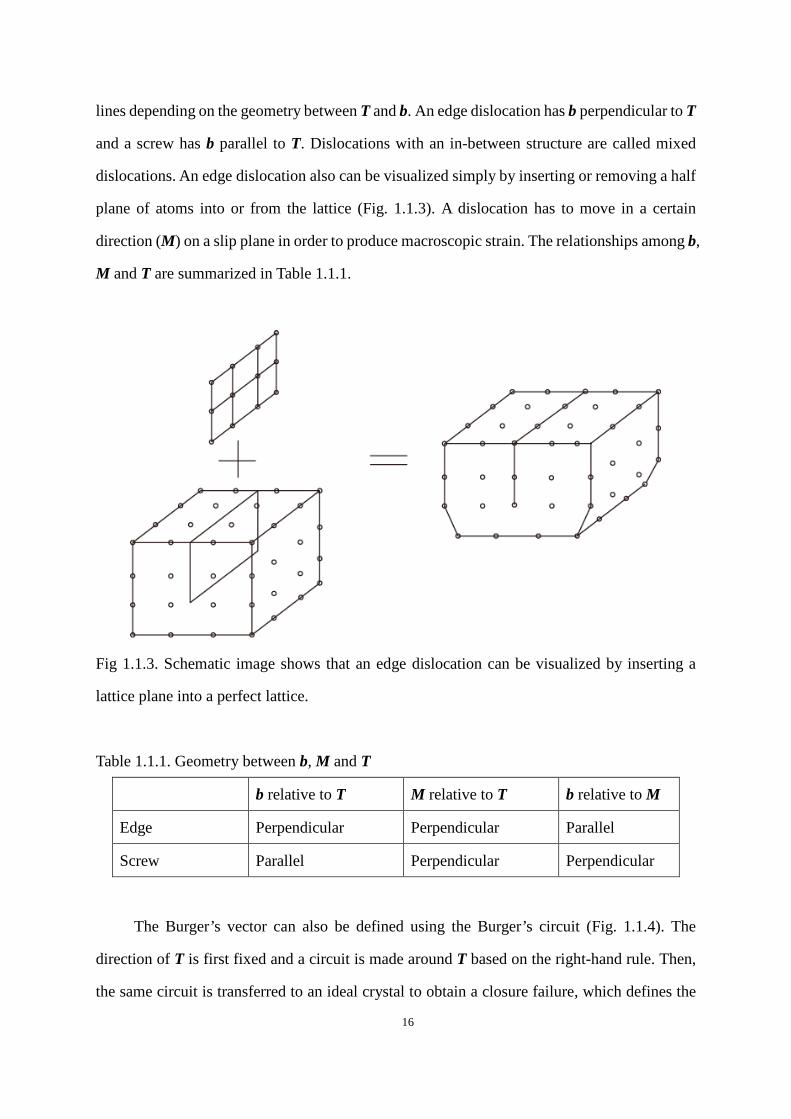
lines depending on the geometry between T and b. An edge dislocation has b perpendicular to T
and a screw has b parallel to T. Dislocations with an in-between structure are called mixed
dislocations. An edge dislocation also can be visualized simply by inserting or removing a half
plane of atoms into or from the lattice (Fig. 1.1.3). A dislocation has to move in a certain
direction (M) on a slip plane in order to produce macroscopic strain. The relationships among b,
M and T are summarized in Table 1.1.1.
Fig 1.1.3. Schematic image shows that an edge dislocation can be visualized by inserting a
lattice plane into a perfect lattice.
Table 1.1.1. Geometry between b, M and T
b relative to T M relative to T b relative to M
Edge Perpendicular Perpendicular Parallel
Screw Parallel Perpendicular Perpendicular
The Burger’s vector can also be defined using the Burger’s circuit (Fig. 1.1.4). The
direction of T is first fixed and a circuit is made around T based on the right-hand rule. Then,
the same circuit is transferred to an ideal crystal to obtain a closure failure, which defines the

17
magnitude and direction of b. A dislocation whose b is a unit vector of the crystal structure is
called a perfect dislocation. Dislocations otherwise are called partial dislocations. Dislocations
are said to be opposite when they have b in the opposite directions. The physical meaning of
opposition can be understood from two aspects. Firstly, opposite dislocations move in opposite
directions under the same stress conditions (Fig. 1.1.5a). Secondly opposite dislocations
annihilate each other when they meet to leave a perfect crystal structure (Fig. 1.1.5b).
Figure 1.1.4 Construction of Burger’s circuit to define an Burger’s vector.
Figure 1.1.5 Physical meaning of opposite dislocations.
18
1.1.1.2 Movement of dislocations
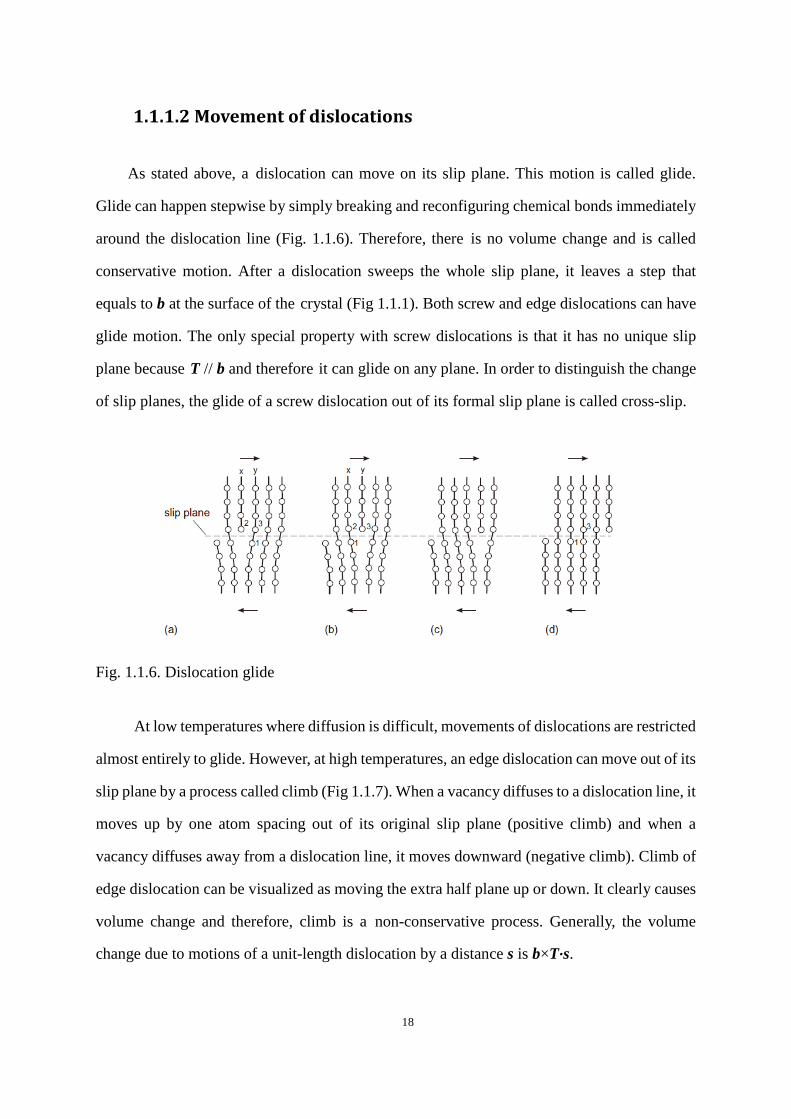
As stated above, a dislocation can move on its slip plane. This motion is called glide.
Glide can happen stepwise by simply breaking and reconfiguring chemical bonds immediately
around the dislocation line (Fig. 1.1.6). Therefore, there is no volume change and is called
conservative motion. After a dislocation sweeps the whole slip plane, it leaves a step that
equals to b at the surface of the crystal (Fig 1.1.1). Both screw and edge dislocations can have
glide motion. The only special property with screw dislocations is that it has no unique slip
plane because T // b and therefore it can glide on any plane. In order to distinguish the change
of slip planes, the glide of a screw dislocation out of its formal slip plane is called cross-slip.
Fig. 1.1.6. Dislocation glide
At low temperatures where diffusion is difficult, movements of dislocations are restricted
almost entirely to glide. However, at high temperatures, an edge dislocation can move out of its
slip plane by a process called climb (Fig 1.1.7). When a vacancy diffuses to a dislocation line, it
moves up by one atom spacing out of its original slip plane (positive climb) and when a
vacancy diffuses away from a dislocation line, it moves downward (negative climb). Climb of
edge dislocation can be visualized as moving the extra half plane up or down. It clearly causes
volume change and therefore, climb is a non-conservative process. Generally, the volume
change due to motions of a unit-length dislocation by a distance s is b×T·s.

19
Fig 1.1.7. Positive (b) and negative (c) climb of a dislocation
In practice, not the whole part of a dislocation line glides or climbs during dislocation
motions. A step is formed on the dislocation line by bowing out segments of a dislocation line.
The step due to the bowing in and out of the slip plane is called a kink and a jog (Fig. 1.1.8),
respectively. Lateral motion of kinks and jogs, respectively, brings the dislocation line into the
next low-energy position to complete glide and climb of the whole dislocation line. The
Burgers vector of kinks and jogs is the same as that of their parental dislocation. Using Table
1.1.1, it is easy to prove that kinks on edge and screw dislocations are of screw and edge
character, respectively while jogs on edge and screw dislocations are of edge character. For
glide motion, nucleation of kinks serves as a rate-limiting process. The lateral motion of kinks
is due to stresses and does not increase the line length of dislocations and therefore not the
energy of dislocations (Eq. 1.1.4 in Chapter 1.1.1.3). Hence, the lateral motion of kinks should
be relatively quick. For climb motion, the lateral motion of jogs is due to emission or
absorption of vacancies to jogs. Thus, jogs are sources and sinks for vacancies. The motion of
jogs should be much slower than that of kinks because it is diffusion-controlled. Concentration
of jogs in a crystal whose stacking fault energy is high is usually assumed to be one [Kohlstedt,
2006]. In such a case, the climb motion of jogs can serve as a rate-limiting process of
dislocation motions.

20
Fig 1.1.8. Kinks (a and b) and jogs (c and d) in edge and screw dislocations (from Hull and
Bacon, 2011)
1.1.1.3 Force and energy of dislocations
There must be some force (f) that is exerted on dislocations in order to move it. Unlike
Newton’s second law for macroscopic objects, where force is proportional to the time
derivative of velocity (v), force is directly related to velocity itself in microscopic region, i.e
𝒗𝒗 = 𝑩𝑩�𝒈𝒈(𝒇𝒇) (1.1.1)
𝑩𝑩� is the mobility tensor, g(f) is a function of the force. In simple cases, we assume g(f) as the
force itself and the equation is usually considered in one dimension. Then Eq. (1.1.1) becomes
𝑣𝑣 = 𝐵𝐵𝐵𝐵 (1.1.2)
Therefore, once the force on and mobility of dislocations are known, we can calculate the
Burger’s vector

21
velocity of dislocation motions, which is proportional to the strain rate (Chapter 1.1.2)
The force on a unit length of a dislocation is expressed by Peach-Koehler equation [Peach
and Koehler, 1950]
𝒇𝒇 = 𝑻𝑻 × ((𝝈𝝈�𝒆𝒆𝒆𝒆 + 𝝈𝝈�𝒊𝒊𝒊𝒊) ∙ 𝒃𝒃) (1.1.3)
where 𝝈𝝈�𝒆𝒆𝒆𝒆 and 𝝈𝝈�𝒊𝒊𝒊𝒊 are the stress tensors due to external and internal stresses (caused by other
dislocations), respectively. 𝝈𝝈�𝒆𝒆𝒆𝒆 is explicitly obtained, and 𝝈𝝈�𝒊𝒊𝒊𝒊 can be calculated by linear
elasticity since the distortion caused by a dislocation is mainly concentrated at dislocation
cores and at places far away from cores, the displacements of atoms can be regarded as
infinitesimal. Generally, the stress field produced by a dislocation is inverse proportional to
the distance from the dislocation [Hull and Bacon, 2001].
The existence of strains around a dislocation implies a crystal containing a dislocation is
not at its energy minimum state. The strain energy increase due to the introduction of one
dislocation in a perfect crystal is called the self-energy of the dislocation (Eself). It is composed
of energy stored at the dislocation core (Ecore) and the energy caused by elastic strains at places
away from the core (Eealstic). Since Ecore is much smaller than Eelastic, the energy of a dislocation
approximates to Eelastic
𝐸𝐸𝑠𝑠𝑠𝑠𝑠𝑠𝑠𝑠 ≈ 𝐸𝐸𝑠𝑠𝑠𝑠𝑒𝑒𝑠𝑠𝑒𝑒𝑒𝑒𝑒𝑒 ∝ 𝑇𝑇𝐺𝐺𝐺𝐺2 (1.1.4)
where T is length of the dislocation line and G is the shear modulus. From the equation, it can
be seen that a dislocation tends to reduce its length and always prefers the shortest Burgers
vector to lower the self-energy.
1.1.2 Orowan’s equation
Orowan’s equation is the most fundamental equation for describing dislocation creep. It is
the starting point from which all dislocation creep models are built. It links the microscopic

22
properties of dislocations and the macroscopic strain rate (𝜀𝜀̇) of a crystal
𝜀𝜀̇ = 𝜌𝜌𝐺𝐺�̅�𝑣 (1.1.5)
where ρ is the mobile dislocation density. It is defined by the length of mobile dislocations per
unit volume. �̅�𝑣 is the average dislocation velocity.
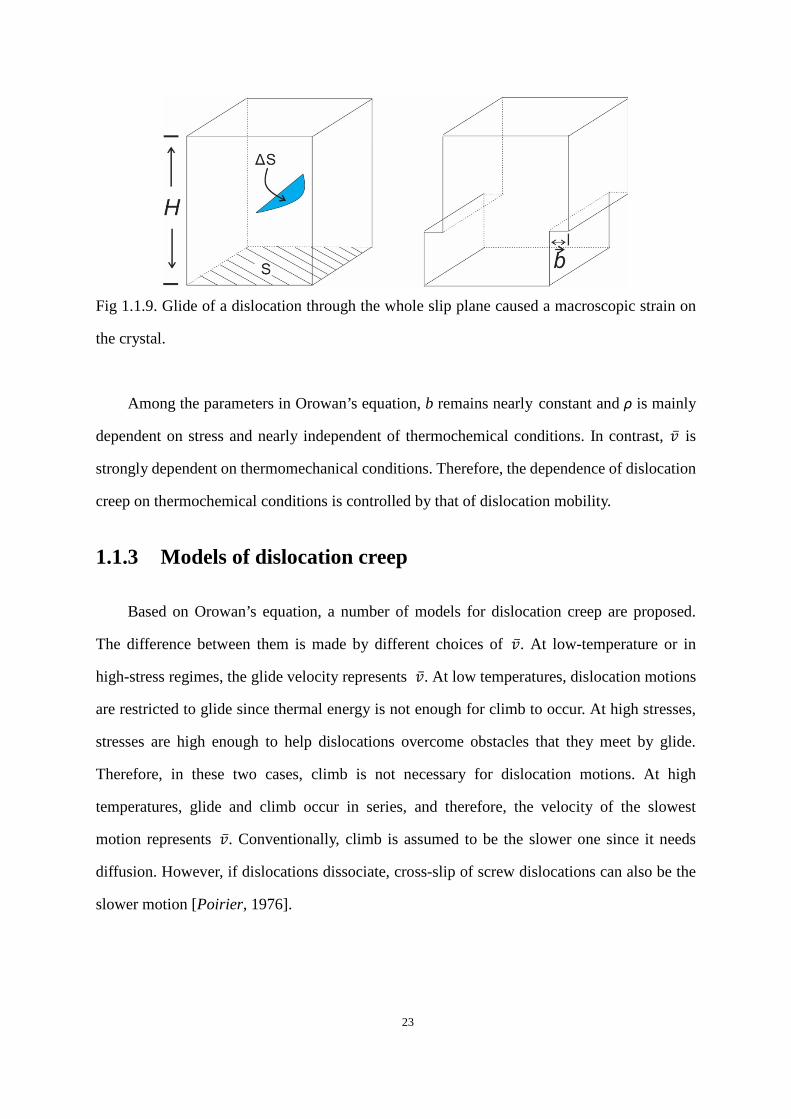
It can be seen from Fig. 1.1.9 that the strain increment is b/H, when one dislocation glides
through the slip plane S of a crystal. Therefore, when N dislocations glide through an area ΔS
over time Δt, the strain increment is
∆𝜀𝜀 = 𝑏𝑏𝐻𝐻∑ ∆𝑆𝑆𝑖𝑖
𝑆𝑆𝑁𝑁𝑒𝑒=1 = 𝑏𝑏
𝐻𝐻∑ 𝑇𝑇𝑖𝑖𝑣𝑣𝑖𝑖
𝑆𝑆𝑁𝑁𝑒𝑒=1 𝛥𝛥𝛥𝛥 = 𝐺𝐺�̅�𝑣 ∑ 𝑇𝑇𝑖𝑖𝑁𝑁
𝑖𝑖=1𝑆𝑆𝐻𝐻
∆𝛥𝛥 = 𝐺𝐺�̅�𝑣𝜌𝜌∆𝛥𝛥 (1.1.6)
The last equality is from the definition of dislocation density, and the average dislocation
velocity �̅�𝑣 is defined by
�̅�𝑣 = ∑𝑇𝑇𝑖𝑖𝑣𝑣𝑖𝑖∑𝑇𝑇𝑒𝑒 (1.1.7)
Therefore,
𝜀𝜀̇ =∆𝜀𝜀∆𝛥𝛥
=𝐺𝐺�̅�𝑣𝜌𝜌∆𝛥𝛥∆𝛥𝛥
= 𝜌𝜌𝐺𝐺�̅�𝑣
which is Orowan’s equation.
23
Fig 1.1.9. Glide of a dislocation through the whole slip plane caused a macroscopic strain on
the crystal.
Among the parameters in Orowan’s equation, b remains nearly constant and ρ is mainly
dependent on stress and nearly independent of thermochemical conditions. In contrast, �̅�𝑣 is
strongly dependent on thermomechanical conditions. Therefore, the dependence of dislocation
creep on thermochemical conditions is controlled by that of dislocation mobility.
1.1.3 Models of dislocation creep
Based on Orowan’s equation, a number of models for dislocation creep are proposed.
The difference between them is made by different choices of �̅�𝑣. At low-temperature or in
high-stress regimes, the glide velocity represents �̅�𝑣. At low temperatures, dislocation motions
are restricted to glide since thermal energy is not enough for climb to occur. At high stresses,
stresses are high enough to help dislocations overcome obstacles that they meet by glide.
Therefore, in these two cases, climb is not necessary for dislocation motions. At high
temperatures, glide and climb occur in series, and therefore, the velocity of the slowest
motion represents �̅�𝑣. Conventionally, climb is assumed to be the slower one since it needs
diffusion. However, if dislocations dissociate, cross-slip of screw dislocations can also be the
slower motion [Poirier, 1976].

24
1.1.3.1 Glide controlled model
This is model is suitable for describing low temperature and/or high stress regimes, and
the glide velocity represents �̅�𝑣. Consider a dislocation gliding in the x direction under a total
stress τ normal to L. Based on Eq. 1.1.3, the force that exerted on the unit-length dislocation
line is τb. During glide from x1 to x2, the dislocation meets an obstacle, which produces a
resistance force K on the dislocation line (Fig. 1.1.10) , the energy (Helmholtz free energy) to
overcome the resistance is
∆𝐹𝐹 = ∫ 𝐾𝐾𝐾𝐾𝐾𝐾𝑥𝑥2𝑥𝑥1
(1.1.8)
Part of this energy can be supplied by the mechanical work done by the stresses, τlb(x2 - x1),
where l is the length of the obstacle. This can be written as τV*, where V* is called the
activation volume. The remainder of the energy required is the free energy of activation
(Gibbs free energy), which is labeled ‘thermal’ in Fig. 1.1.10a.
∆𝐺𝐺 = ∆𝐹𝐹 − 𝜏𝜏𝑉𝑉∗ (1.1.9)
The probability where the energy to overcome the obstacle can be supplied by thermal
fluctuation at temperature T follows the Boltzmann distribution. Therefore, the number of
successful vibrations for a dislocation to overcome an obstacle with vibration frequency ν is
ν·exp(-ΔG/kT) per second. Thus the glide velocity is
𝑣𝑣𝑔𝑔 = 𝑠𝑠𝑠𝑠 exp (−∆𝐺𝐺𝑘𝑘𝑇𝑇
) (1.1.10)
where s is the distance of dislocation movement required to overcome the obstacle.

25
Fig 1.1.10 Profile of resistance force K versus distance x (Modified from Hull and Bacon,
2001)
If there is no thermal assistance for dislocation motions, i.e. dislocation glides at T = 0,
τbl must be equal to the maximum of K. In such a case, τ is called Peierl’s stress when K is
the lattice resistance.
Suppose that the resistance force is a step function of distance (Fig. 1.1.10b), then
∆𝐺𝐺 = ∆𝐹𝐹 �1 − 𝜏𝜏(𝑇𝑇)𝜏𝜏𝑚𝑚𝑚𝑚𝑚𝑚
� = ∆𝐹𝐹[1 − 𝜏𝜏(𝑇𝑇)𝜏𝜏(0)] (1.1.11)
In more general situations, this equation is replaced by
∆𝐺𝐺 = ∆𝐹𝐹 �1 − �𝜏𝜏(𝑇𝑇)𝜏𝜏(0)�
𝑝𝑝�𝑞𝑞 (1.1.12)
from Kocks et al. [1975]. Combine Eq. 1.1.12, Eq. 1.1.10 and Eq. 1.1.5,
𝜀𝜀̇ = 𝐶𝐶𝜌𝜌exp (−∆𝐹𝐹𝑅𝑅𝑇𝑇�1 − �𝜏𝜏(𝑇𝑇)
𝜏𝜏(0)�𝑝𝑝�𝑞𝑞
) (1.1.13)
where C is a constant. The conventional relationship between stress and dislocation density is
[Bailey and Flanagan, 1967]:
26
𝜌𝜌 ∝ ( 𝜏𝜏𝐺𝐺𝑏𝑏
)2 (1.1.14)
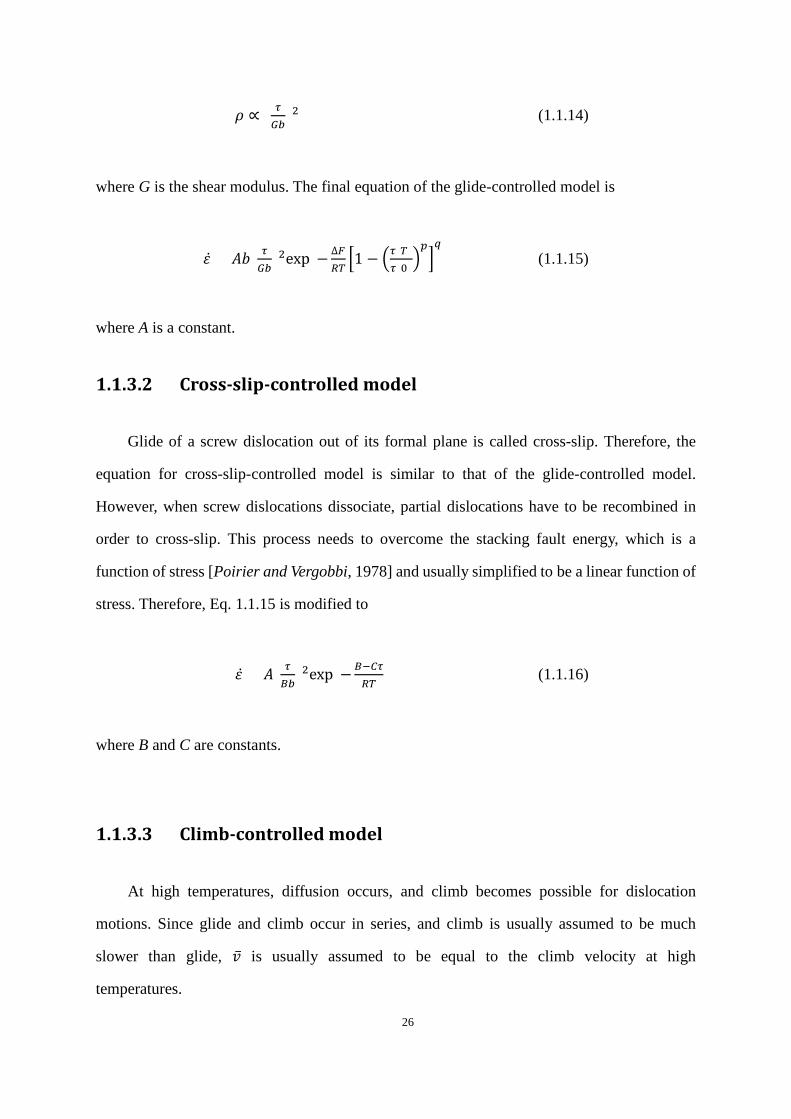
where G is the shear modulus. The final equation of the glide-controlled model is
𝜀𝜀̇ = 𝐴𝐴𝐺𝐺( 𝜏𝜏𝐺𝐺𝑏𝑏
)2exp (−∆𝐹𝐹𝑅𝑅𝑇𝑇�1 − �𝜏𝜏(𝑇𝑇)
𝜏𝜏(0)�𝑝𝑝�𝑞𝑞
) (1.1.15)
where A is a constant.
1.1.3.2 Cross-slip-controlled model
Glide of a screw dislocation out of its formal plane is called cross-slip. Therefore, the
equation for cross-slip-controlled model is similar to that of the glide-controlled model.
However, when screw dislocations dissociate, partial dislocations have to be recombined in
order to cross-slip. This process needs to overcome the stacking fault energy, which is a
function of stress [Poirier and Vergobbi, 1978] and usually simplified to be a linear function of
stress. Therefore, Eq. 1.1.15 is modified to
𝜀𝜀̇ = 𝐴𝐴( 𝜏𝜏𝐵𝐵𝑏𝑏
)2exp (−𝐵𝐵−𝐶𝐶𝜏𝜏𝑅𝑅𝑇𝑇
) (1.1.16)
where B and C are constants.
1.1.3.3 Climb-controlled model
At high temperatures, diffusion occurs, and climb becomes possible for dislocation
motions. Since glide and climb occur in series, and climb is usually assumed to be much
slower than glide, �̅�𝑣 is usually assumed to be equal to the climb velocity at high
temperatures.

27
Fig. 1.1.11. Dislocation climbs positively under compression. The vacancy concentration near
the dislocation is higher than that far from the dislocation (Modified from Weertman, 1999).
The velocity of climb can be calculated from the flux of vacancies to the dislocation.
Consider Fig. 1.1.11, compression under stress σ causes a shortening of material in the
compression direction, which corresponds to a positive climb. Therefore, the vacancy
concentration at the dislocation core (c*) is higher than the equilibrium value (c0) at some
distance, R0, away from the dislocation. If the molar volume of atoms is Ω, the formation
energy of the vacancy is modified by σΩ and the vacancy concentration at the dislocation
core is
𝑐𝑐∗ = 𝑐𝑐0 exp(− 𝑄𝑄𝑅𝑅𝑇𝑇
)exp (𝜎𝜎𝜎𝜎𝑅𝑅𝑇𝑇
) (1.1.17)
which can be approximated as
𝑐𝑐∗ ≅ 𝑐𝑐0 𝑒𝑒𝐾𝐾𝑒𝑒(− 𝑄𝑄𝑅𝑅𝑇𝑇
)(1 + 𝜎𝜎𝜎𝜎𝑅𝑅𝑇𝑇
) = 𝑐𝑐0(1 + 𝜎𝜎𝜎𝜎𝑅𝑅𝑇𝑇
) (1.1.18)
at low stress conditions, where Q is the formation energy for the vacancy under no stress
28
conditions, and 𝑐𝑐0 = 𝑐𝑐0 exp(− 𝑄𝑄𝑅𝑅𝑇𝑇
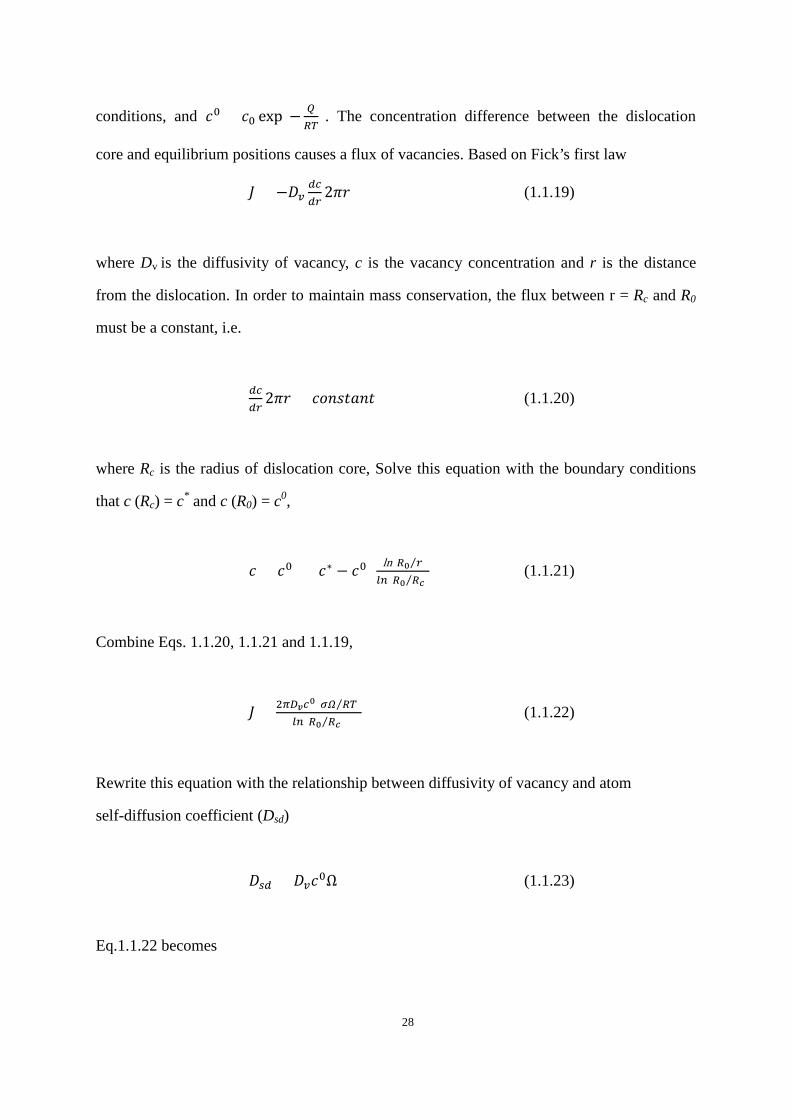
). The concentration difference between the dislocation
core and equilibrium positions causes a flux of vacancies. Based on Fick’s first law
𝐽𝐽 = −𝐷𝐷𝑣𝑣𝑑𝑑𝑒𝑒𝑑𝑑𝑑𝑑
2𝜋𝜋𝜋𝜋 (1.1.19)
where Dv is the diffusivity of vacancy, c is the vacancy concentration and r is the distance
from the dislocation. In order to maintain mass conservation, the flux between r = Rc and R0
must be a constant, i.e.
𝑑𝑑𝑒𝑒𝑑𝑑𝑑𝑑
2𝜋𝜋𝜋𝜋 = 𝑐𝑐𝑐𝑐𝑐𝑐𝑠𝑠𝛥𝛥𝑐𝑐𝑐𝑐𝛥𝛥 (1.1.20)
where Rc is the radius of dislocation core, Solve this equation with the boundary conditions
that c (Rc) = c* and c (R0) = c0,
𝑐𝑐 = 𝑐𝑐0 + (𝑐𝑐∗ − 𝑐𝑐0) ln(𝑅𝑅0 𝑑𝑑⁄ )𝑠𝑠𝑙𝑙(𝑅𝑅0 𝑅𝑅𝑐𝑐⁄ ) (1.1.21)
Combine Eqs. 1.1.20, 1.1.21 and 1.1.19,
𝐽𝐽 = 2𝜋𝜋𝐷𝐷𝑣𝑣𝑒𝑒0(𝜎𝜎𝜎𝜎 𝑅𝑅𝑇𝑇⁄ )𝑠𝑠𝑙𝑙 (𝑅𝑅0 𝑅𝑅𝑐𝑐⁄ )
(1.1.22)
Rewrite this equation with the relationship between diffusivity of vacancy and atom
self-diffusion coefficient (Dsd)
𝐷𝐷𝑠𝑠𝑑𝑑 = 𝐷𝐷𝑣𝑣𝑐𝑐0Ω (1.1.23)
Eq.1.1.22 becomes

29
𝐽𝐽 = 2𝜋𝜋𝐷𝐷𝑠𝑠𝑠𝑠(𝜎𝜎𝜎𝜎 𝑅𝑅𝑇𝑇⁄ )Ω𝑠𝑠𝑙𝑙 (𝑅𝑅0 𝑅𝑅𝑐𝑐⁄ )
(1.1.24)
The relation between flux and velocity is
𝑣𝑣 = 𝐽𝐽𝜎𝜎𝑑𝑑
(1.1.25)
where d is the lattice parameter, which can be simplified into the length of Burger’s vector, b.
Therefore, the climb velocity is
𝑣𝑣𝑒𝑒 = 2𝜋𝜋(𝐷𝐷𝑠𝑠𝑠𝑠𝑏𝑏
) 𝜎𝜎Ω 𝑅𝑅𝑇𝑇⁄ln (𝑅𝑅0 𝑅𝑅𝑐𝑐⁄ )
(1.1.26)
Assuming vg is much faster than vc, �̅�𝑣 can be expressed as
�̅�𝑣 = 𝑠𝑠𝑔𝑔𝑠𝑠𝑐𝑐𝑣𝑣𝑒𝑒 (1.1.27)
where lg and lc are the glide and climb distances, respectively. Combine Eq. 1.1.5, Eq. 1.1.14,
Eq.1.1.26 and Eq. 1.1.27, the equation for the climb-controlled model is
𝜀𝜀̇ = 𝐴𝐴 �𝐷𝐷𝑠𝑠𝑠𝑠𝑏𝑏2� (𝜎𝜎
𝐺𝐺) 3 𝐺𝐺Ω 𝑅𝑅𝑇𝑇⁄
ln(𝑅𝑅𝑜𝑜 𝑅𝑅𝑐𝑐⁄ ) (𝑠𝑠𝑔𝑔𝑠𝑠𝑐𝑐
) (1.1.28)
where A is a constant.
1.1.4 Other deformation mechanisms
Creep mechanisms other than dislocation creep are diffusion creep and grain boundary
sliding. Unlike the grain-size independence of strain rate in dislocation creep, both diffusion

30
creep and grain boundary sliding are grain-size dependent. Diffusion creep is characterized by
the linear dependence of strain rate on stress, which means that the material behaves as a
Newtonian fluid. Grain boundary sliding is actually a deformation mechanism intermediate
between diffusion and dislocation creep and has some characteristics of both mechanisms.
1.1.4.1 Diffusion creep
Unlike dislocation creep, which is caused by motions of dislocations, diffusion creep
results from flux of vacancies that is caused by a vacancy concentration gradient induced by
stresses. By the same reasoning as Chapter 1.1.3.3, the vacancy concentration under
compression and tension is expressed as:
𝑐𝑐∗ = 𝑐𝑐0(1 ± 𝜎𝜎𝜎𝜎𝑅𝑅𝑇𝑇
) (1.1.29)
The plus and minus signs correspond to compress and tension, respectively. Therefore, the
vacancy flux goes from tension areas to compression areas (Fig. 1.1.12), resulting in a
counter-direction flux of atoms. Depend on whether diffusion is through lattice or grain
boundaries, diffusion creep is classified into Nabarro–Herring and Coble creeps, respectively.
Fig.1.1.12. Crystal deformation by diffusion creep. Vacancies flow from high-stress regions
to low-stress regions through the lattice (black) and along grain boundaries (red).

31
The constitutive equations for Nabarro–Herring and Coble creeps can be deduced by the
same reasoning as in Chapter 1.1.3.3. For Nabarro–Herring creep,
𝜀𝜀�̇�𝑁𝐻𝐻 = (𝐷𝐷𝑠𝑠𝑠𝑠𝐿𝐿2
)(𝜎𝜎Ω𝑅𝑅𝑇𝑇
) (1.1.30)
For Coble creep
ε̇𝐶𝐶𝐶𝐶𝑏𝑏𝑠𝑠𝑠𝑠 = (𝐷𝐷𝑔𝑔𝑔𝑔𝛿𝛿𝐿𝐿3
)(𝜎𝜎Ω𝑅𝑅𝑇𝑇
) (1.1.31)
where L is the grain size, Dgb is the grain-boundary diffusivity, and δ is the grain boundary
width.
1.1.4.2 Grain boundary sliding (GBS)
Grain boundary sliding itself cannot accommodate all strains without deformation of
grains (A grain cannot glide relative to another grain infinitely. It has to be stopped by other
grains). Therefore, grain-boundary sliding has to be accommodated by either diffusion or
dislocation motions inside the grains. The constitutive equation for diffusion accommodated
grain boundary sliding is [Poirier, 1985]
𝜀𝜀�̇�𝐷𝑒𝑒𝑠𝑠−𝐺𝐺𝐵𝐵 = 𝛼𝛼𝐿𝐿2𝐷𝐷𝑠𝑠𝑑𝑑 �1 + 𝜋𝜋𝛿𝛿
𝜆𝜆𝐷𝐷𝑔𝑔𝑔𝑔𝐷𝐷𝑠𝑠𝑠𝑠
� 𝜎𝜎Ω𝑘𝑘𝑇𝑇
(1.1.32)
where α is a geometry constant and λ is the basic periodicity of grain boundaries. The
constitutive equation for dislocation accommodated grain boundary sliding was first
systematically investigated by Langdon, 1994. For a large grain size where grains contain
subgrains,

32
𝜀𝜀�̇�𝐷𝑒𝑒𝑠𝑠−𝐺𝐺𝐵𝐵 = 𝐴𝐴 𝐷𝐷𝑠𝑠𝑠𝑠𝐺𝐺𝑏𝑏𝑅𝑅𝑇𝑇
(𝑏𝑏𝐿𝐿
) �𝜎𝜎𝐺𝐺�3 (1.1.33)
and for a small grain size
𝜀𝜀�̇�𝐷𝑒𝑒𝑠𝑠−𝐺𝐺𝐵𝐵 = 𝐵𝐵 𝐷𝐷𝑔𝑔𝑔𝑔𝐺𝐺𝑏𝑏𝑅𝑅𝑇𝑇
�𝑏𝑏𝐿𝐿�2�𝜎𝜎𝐺𝐺�2 (1.1.34)
where A and B are constant.
In summary, constitutive equations for different deformation mechanisms can be
generalized into an equation
𝜀𝜀 ̇ = 𝐴𝐴 𝜎𝜎𝑛𝑛
𝐿𝐿𝑝𝑝exp (−𝐻𝐻𝑐𝑐𝑐𝑐𝑐𝑐𝑐𝑐𝑝𝑝(𝜎𝜎,𝑃𝑃)
𝑅𝑅𝑇𝑇) (1.1.35)
where Hcreep is the activation enthalpy of creep, which is a function of pressure and,
depending on the deformation mechanism, stress. Table 1.1.2 summarizes the parameters in
equations for different deformation mechanisms.
Table 1.1.2 Summary of different deformation mechanisms
Deformation mechanism n p H
Dislocation
creep
Glide model 2 0 ∆𝐹𝐹 �1 − �
𝜏𝜏(𝑇𝑇)𝜏𝜏(0)�
𝑝𝑝
�𝑞𝑞
Cross-slip model 2 0 𝐵𝐵 − 𝐶𝐶𝜏𝜏
climb model 3 0 H for diffusion creep
Diffusion
creep
Nabarro–Herring creep 1 2 H of diffusivity of slowest species
Coble creep 1 3 H of grain boundary diffusivity
Grain
boundary
sliding
Diffusion accommodated 1 2 Combination of NH and coble creep
Dislocation accommodated (large grain size)
3 1 H for NH creep
Dislocation accommodated (small grain size)
2 2 H for coble creep

33
1.2 Earth’s upper mantle rheology
Tectonics indicates that the Earth’s mantle, or at least some part of it, is plastically
deformed. To understand the mantle rheology, it is important to know the mantle viscosity
and the direction of mantle flow. Viscosity of the mantle can be estimated from various
geophysical observations, and the direction of mantle flow can be estimated from the
knowledge of seismic anisotropy and crystal preferred orientation (CPO)
1.2.1 Viscosity estimation of the upper mantle
One method of estimating the viscosity of the mantle is based on seismic wave attenuation.
Seismic wave attenuation is characterized by a Q factor which measures the energy loss during
wave propagation. In many cases, attenuation involves thermally activated process and Q-1
obeys an Arrhenius equation [e.g. Gueguen et al., 1989; Jackson et al., 2002]
𝑄𝑄−1 ∝ 𝜔𝜔−𝛽𝛽exp (−𝛽𝛽𝛽𝛽𝑅𝑅𝑇𝑇
) (1.2.1)
where β is constant, ω is frequency and E is the activation energy. For olivine, β is 0.2 and E
is 440 kJ/mol [Gueguen et al., 1989]. By definition of effective viscosity η = σ/2𝜀𝜀 ̇ and using
Eq. 1.1.35, at constant strain rate
𝜂𝜂 ∝ exp (𝐻𝐻𝑐𝑐𝑐𝑐𝑐𝑐𝑐𝑐𝑝𝑝𝑙𝑙𝑅𝑅𝑇𝑇
) (1.2.2)
Combing Eq.1.2.1 and 1.2.2,
log �𝑄𝑄−1 𝑄𝑄0−1⁄𝜂𝜂 𝜂𝜂0⁄ � = −𝑐𝑐𝑛𝑛 𝛽𝛽
𝐻𝐻𝑐𝑐𝑐𝑐𝑐𝑐𝑐𝑐𝑝𝑝 (1.2.3)
where Q-10 and η0 are the seismic wave attenuation and effective viscosity at a reference state.

34
The similar equation can be obtained at constant stress
log �𝑄𝑄−1 𝑄𝑄0−1⁄𝜂𝜂 𝜂𝜂0⁄ � = −𝑛𝑛 𝛽𝛽
𝐻𝐻𝑐𝑐𝑐𝑐𝑐𝑐𝑐𝑐𝑝𝑝 (1.2.4)
The ratio of E and Hcreep can be regarded as a constant for certain minerals. For olivine, this
ratio is 0.8 based on experiments [e.g. Gueguen et al., 1989; Hirth and Kohlstedt, 2003;
Jackson et al., 2002]. Eq. 1.2.2 and 1.2.3 suggest logarithmic viscosity is inversely
proportional to the logarithmic Q. Therefore, the mantle viscosity can be esitmated from Q to
some extent.
Fig 1.2.1 shows models of Q compiled by Lawrence and Wysession [2006]. It indicates a
rigid lithosphere (high Q) above a soft asthenosphere (low Q). Below that, Q decreases and
therefore, η increases gradually with depth in Earth’s upper mantle.
Fig 1.2.1. Q factor for different models. Modified from Lawrence and Wysession (2006).

35
Another way to estimate mantle viscosity is based on post-glacial rebound. It measures
the crustal motions due to the melting of ice sheets. It can give the absolute value of mantle
viscosity but the result depends on the pre-assumed viscosity structure in the Earth’s mantle.
The average viscosity is 3 × 10²¹ Pa s by assuming that mantle viscosity does not change with
depth [Haskell, 1937]. In addition, the rebound results in a change of moment of inertia of
Earth, which can be detected by monitoring changes of Earth rotation. These data can be used
to evaluate the viscosity of the deep mantle and gave the viscosity of ~ 1022 Pa s for deep
mantle [e.g. Yuen et al., 1982].
Viscosity of the mantle can also be estimated from geoid anomalies, or dynamic
topography. Geoid anomalies are not only caused by density anomalies itself inside the earth
but also by the position of the density anomalies. The stresses caused by mantle flow deflect
density boundaries and therefore influence the geoid anomalies (Fig. 1.2.2). By changing the
pre-assumed viscosity structures of the Earth mantle and combining with the information of
density anomalies obtained by seismic studies, one can calculate geoid anomalies and
compare them with the measured ones until the assumed viscosity structures best reproduce
the observed one. It is clear that only the viscosity contrast between different viscosity layers
can be obtained by such studies. This method suggests a significant increase of viscosity from
upper to lower mantle [e.g. Hager, 1984].
The one-dimensional viscosity-depth profile is shown in Fig. 1.2.3.

36
Fig 1.2.2 Schematic diagram which shows the gravity anomalies are not only caused by
density anomalies but also by the rheological structure of the investigated region. Depending
on viscosity contrast between two layers, the anomalies can be negative (left) or positive
(right). From Karato, 2012, after Hager, 1984.

37
Fig 1.2.3 One-dimensional viscosity-depth profile compiled by Peltier, 1998.
1.2.2 Seismic anisotropy in the upper mantle
Velocity of seismic waves depends not only on material that they pass through but also on
the propagation and polarization directions. Seismic anisotropy reflects the anisotropy of the
elastic properties of rocks, which originate in the stress field of rock deformation. Therefore, it
can provide information regarding mantle flow directions.
When seismic waves propagate in different directions, their velocities can be different.
This is called azimuthal anisotropy. Both body and surface waves show this kind of anisotropy.
It is measured by pairs of sources and receivers that are located on different ray paths through
the same target region. It is apparently limited by the number and configurations of seismic
stations. In addition, a main shortcoming of this method is that measured anisotropies may
come from regions outside the target region but are located on a ray path of the seismic wave.
Polarization anisotropy reflects the dependence of seismic velocity on the polarization
direction of S waves. When a S wave passes through an anisotropic region, it decomposes into
horizontally polarized (SH) and vertically polarized (SV) waves. This phenomenon is called
shear wave splitting. SV and SH arrive at the seismic station at different times since SH and
SV have different velocities. This time difference is determined by the thickness of the
anisotropic layer and the extent of anisotropy of the layer. One advantage of this method is that
the anisotropy can be obtained by a single station, in principle. Like azimuthal anisotropy,
however, the location of anisotropy is unclear. There are some methods to constrain the region
of anisotropy. For example, one can use S waves formed by P-to-S wave conversion at a
discontinuity, whose wave splitting must occur in the region above the discontinuity.
Radial models of the Earth’s seismic anisotropy suggested that VSH > VSV in shallow
regions of the upper mantle, but this anisotropy becomes weaker with depth, and VSV > VSH at
the bottom of upper mantle [e.g. Dziewonski and Anderson, 1981; Gung et al., 2003; Mainprice
et al., 2000; Montagner and Kennett, 1996]. In addition, regional seismic studies suggest that
the direction of the faster shear wave is trench-parallel near trenches, while it becomes

38
perpendicular to the trench away from trenches [e.g. Nakajima and Hasegawa, 2004]
1.2.3 Dislocation creep, crystallographic preferred orientation
(CPO), mantle flow and seismic anisotropy
Mantle forming minerals are elastically anisotropic and are necessary to explain seismic
anisotropy. However, if minerals are randomly distributed in the mantle, the overall properties
will be isotropic. Thus, there must be preferred orientations of crystals or fabrics in mantle
rocks if seismic anisotropy is observed.
Fabrics originate by different deformation mechanisms. In the case of diffusion creep,
there is no gap among grains inside an aggregate since the only constraint for this mechanism is
the stress field which must be a continuous function in space. If there was a gap, the stress field
there is zero and material would flow to the gap and fill it. Therefore, no grain rotation is
needed to accommodate strains and the crystallographic orientations of grains would remain
unchanged after deformation. It is noted, however, that grains would have a shape-preferred
orientation (SPO). SPO makes little contribution to the seismic anisotropy but can indicate the
stress field that grains experienced. On the other hand, gaps should form among grains in the
case of dislocation creep, because grains are constrained to deform in slip directions on a slip
plane, which are different among neighboring grains. Grain rotations are necessary to fill the
gaps (Fig 1.2.4). Therefore, grains would show not only SPO but also crystallographic
preferred orientation (CPO) when dislocation creep occurs. Generally, slip directions prefer to
align to flow directions. Slip planes prefer to align to the flow plane if they are planar flows.
CPO is the main cause of seismic anisotropy

39
Fig 1.2.4 Grain rotation during dislocation creep. The black lines in each grain indicate slip
planes. A gap (red region) forms due to the deformation of individual grains constrained by
their slip systems (b). Grains need rotation to reduce the gap (c). Finally, the slip directions
and planes in grains prefer to be parallel to the shear direction and shear plane, respectively.
From the above discussion, it is clear that parameters that influence dislocation creep
also influence the formation of CPO. Therefore, both stress and thermochemical conditions
are important for the development of CPO. The stress fields in the mantle are controlled by the
directions and velocity gradients in mantle flow. Once we know the relations between CPO,
stress fields and thermochemical conditions, we can use CPO to estimate the geometry of
mantle flow. On the other hand, we can estimate mantle thermochemical conditions if we
know the geometry of a mantle flow. The relationships among slip systems, CPO and seismic
anisotropy are summarized in Fig. 1.2.5.
Fig 1.2.5 Diagram shows the relationships among slip system, CPO, and seismic anisotropy.
CPOs developed at different conditions can be investigated from natural samples.

40
Lineation and foliation are used to estimate the stress fields experienced by natural samples.
Distributions of crystallographic axes can be determined by the electron backscatter diffraction
(EBSD) method. CPOs of natural olivines are summarized at Table 1.2.1. Relations between
thermomechanical conditions and CPOs can also be studied by deformation experiments
(Chapter 1.5.1). Whether the listed slip systems actually occur or not have to be determined
by TEM. Unfortunately, a limited number of samples with fabrics found in nature have been
examined by TEM
Table 1.2.1 CPOs of natural olivine
Name Lineation direction Foliation plane Supposed slip system*
A-type [100] (010) [100](010)
B-type [001] (010) (001)(010)
C-type [001] (100) [001](100)
D-type [100] 0kl [100]0kl
E-type [100] (001) [100](001)
AG-type h0l (010) [100](010)+[001](010)
* These are based on the hypothesis that a dominant slip system determines the fabric.
1.3 Mineralogical models of the Earth’s mantle
One commonly accepted composition of the Earth’s mantle is the pyrolite composition
[Ringwood, 1975]. It is a mixture of mid-ocean ridge basalt and peridotite, since it is
considered that the former forms by partial melting of the upper-mantle materials and the
latter is the residue of partial melting. The mineralogical assemblages in the pyrolite model as
a function of depth are shown in Fig. 1.3.1. They are obtained from high-pressure
high-temperature experiments. Olivine ((Mg,Fe)2SiO4) occupies 60% by volume of the upper
mantle. The polymorphs of olivine, namely wadsleyite and ringwoodite, are the dominant
minerals in the transition zone. The low mantle mainly consists of bridgemanite. The phase

41
transitions of olivine into wadsleyite and of ringwoodite into bridgemanite plus ferropericlase
in this model correspond to the 410 km and 660 km seismic discontinuities quite well. This
model assumes that there is no chemical stratification in the whole mantle, implying whole
mantle convection.
Fig 1.3.1 Pyrolite model of the Earth mantle (modified from Frost, 2008)
Another commonly used model for the bulk Earth’s composition is the so-called
chondrite model. It assumes that the abundances of refractory elements of the bulk Earth are
the same as those of type I carbonaceous chondrite (CI chondrite). This assumption is based
on the abundances of refractory elements in CI chondrite being the same as those found in the
Sun’s convective layer, which are estimated from optical spectroscopy. This agreement
indicates that the composition of CI chondrite can represent that of a primordial solar system.
Under the assumption that the Earth is a product of accretion of materials in a primitive solar
system, the CI composition can be a good candidate for the bulk Earth. There is more SiO2

42
and less MgO contents in the CI composition compared with those in the pyrolite model.
Therefore, this model may indicate layered mantle convection and compositional
stratification.
1.4 Experimental techniques to study the upper mantle
rheology
The rheology properties of the Earth’s upper mantle can be studied through experiments
in the laboratory on the Earth forming minerals and then extrapolating results to the Earth
mantle conditions. Deformation experiments give direct results on constitutive equations but
the stress difference between experimental and mantle conditions may cause a problem
during extrapolation. Diffusion experiments focus on the diffusivity of the slowest species in
the mineral and link the diffusivity and strain rate by different models mentioned in Chapter
1.1.3 and 1.1.4. Therefore, it can only provide indirect information on the rheological
properties of minerals. Dislocation recovery experiments study the dislocation mobility by
annealing a pre-deformed sample. It can only be employed to study the dependence of
dislocation mobility on thermochemical conditions and cannot give final constitutive
equations.
1.4.1 Deformation techniques
In deformation experiments, stresses and strains during deformation must be recorded
very accurate. Strains can be determined by measuring displacements of a piston relative to
the fixed position of the apparatus or using X-ray imaging to monitor a strain marker in situ.
Stresses are determined by various types of force transducers (loading cell) or by X-ray
diffraction [Singh, 1993]
The easiest way to supply a stress to a sample is dead weight loading in which a mass is
put on the top of the sample [e.g. Kohlstedt and Goetze, 1974]. The stress is by definition σ =
mg/A, where m is the mass of the loading, g is acceleration due to gravity, A is the sectional

43
area of the loading. The stress supplied by this method is accurate but the magnitude of stress
is limited. In addition, this method is only feasible at room pressure.
The Paterson apparatus [Paterson, 1970] is a deformation apparatus that can generate a
deviatoric stress in a gas confining environment. This equipment can be fitted with either a
standard axial deformation piston for pure shear deformation or a torsion actuator for simple
shear deformation. However, the confining pressure is limited to 0.5 GPa.
The Griggs-type apparatus is a modified piston cylinder high pressure deformation
apparatus. It deforms a sample in a soft pressure media (salt or molten salt). The stress is
provided by advancing a piston which is close to the sample. The confining pressure is
limited to 3 GPa.
Some apparatus were developed to achieve deformation at high pressures and high
temperatures. Deformation DIA (D-DIA) [Wang et al., 2003] can deform a sample up to 20
GPa [Kawazoe et al., 2011; Kawazoe et al., 2010]. Compared with the traditional DIA press,
two opposing anvils in this apparatus can move independently and therefore deform the
sample at constrained strain rate. The other type of the apparatus is the rotational Drickamer
apparatus (RDA) [Yamazaki and Karato, 2001]. The stress is provided by rotating one of its
anvils and the pressure can be up to 55 GPa by using sinter diamond anvils [Nishiyama et al.,
2010].
The deviatoric stress can also be generated by squeezing a sample in an anisotropic way.
For example, Bussod et al. [1993] developed a way to deform samples in Kawaii type
multi-anvils. Samples were sandwiched between two alumina pistons which were cut at an
angle of 45º for simple shear deformation. Similarly, the axial compression in a diamond
anvil cell can be employed to generate deviatoric stress [e.g. Kinsland and Bassett, 1977].
The main problem in deformation experiments is the strain rates (and therefore stresses)
are much higher than those in natural conditions. Although using the Paterson/Griggs
apparatus can achieve low stresses, confining pressures are limited in these apparatus. The
differences in strain rates between laboratory and natural conditions may lead to a transition
in deformation mechanisms, which may bias the understandings of the mantle rheology.

44
This is demonstrated by Fig 1.4.1. At low-stress conditions, when a dislocation meets an
obstacle, it absorbs a vacancy and moves out of the slip plane to overcome obstacle. This is
called the climb-controlled mechanism. It involves diffusion because the dislocation needs to
absorb a vacancy to climb. In the other hand, at high-stress conditions, the dislocation can
directly pass the obstacle. This is called the glide-controlled mechanism and does not involve
diffusion.
Fig 1.4.1 Dislocation motions controlled by different mechanisms at different stresses
conditions
1.4.2 Diffusion techniques
Diffusion experiments can be used to measure the diffusivity of the slowest species in
minerals and the validity of applications of results in these experiments into rheology
depends on the rheological model that summarized in Chapter 1.1.3 and 1.1.4. In diffusion
experiments, a layer with a different isotopic composition, called a diffusion source, is placed
on a mineral sample with an otherwise similar composition. This couple is then annealed at
target conditions and the isotope composition changes during annealing due to self-diffusion.
The diffusion profile of the isotope is determined after annealing and the diffusivity is fitted.
The diffusivity is then plugged into appropriate equations listed in Chapter 1.1.3 and 1.1.4 to
get the constitutive equations for different deformation mechanisms. Since there is no need to
generate deviatoric stresses, such experiments are usually done at hydrostatic conditions and

45
can provide a much wider range of experiment conditions than that in deformation
experiments. However, there are certain differences between diffusion and creep processes.
Firstly, the defects involved in these two processes are not always the same. For example,
diffusion does not involve dislocations. Secondly, although self-diffusivity of the slowest
species is assumed to represent the rate-limiting process during creep, deformation can only
occur when the whole unit cell transfers. Therefore, coupled diffusion of the slowest and the
fastest species may be important [Jaoul, 1990]. In summary, results from diffusion
experiments can only give indirect information on rheology.
1.4.3 Dislocation recovery techniques
Dislocation recovery is one experimental technique to estimate dislocation mobility. In
this technique, a sample is first deformed to generate dislocations of a certain type and is then
annealed under hydrostatic conditions. Dislocations in the sample move due to internal
stresses and dislocations with different signs annihilate with each other, causing a reduction
in dislocation density at a rate proportional to the dislocation density, ρ, square, i.e.
𝑑𝑑𝑑𝑑𝑑𝑑𝑒𝑒
= 𝑘𝑘𝜌𝜌2 (1.4.1)
where k is the rate constant. By integrating this equation,
𝑘𝑘 = ( 1𝑑𝑑𝑓𝑓− 1
𝑑𝑑𝑖𝑖) 𝛥𝛥⁄ (1.4.2)
where ρi and ρf are dislocation densities before and after annealing, respectively, t is the
annealing time.
The primary advantage of this technique is that no external stresses, which are many
orders of magnitude higher in deformation experiments than in natural conditions, are applied.
Hence, the physical environments in annealing experiments are more representative of the

46
mantle than those in the deformation experiments. In addition, the rate constants are
independent of internal stresses [Karato and Ogawa, 1982]. Therefore, the rate constants are
not biased by different initial dislocation densities and can be used to represent mobility of
dislocations (Eq. 1.1.1). Another advantage of this method is that it allows a much wider
range of physical and chemical conditions than those in deformation experiments, making it
possible, for example, to precisely determine the dependence of recovery on thermochemical
conditions. Strictly speaking, the rate constant is not identical to the dislocation velocity in
dislocation creep since we lack the information about the force that corresponds to this
mobility (Eq. 1.1.1). However, the rate constant gives the information about the rate-limiting
process of dislocation motions since all kinds of motions of dislocations occur during
recovery. Moreover, the dependence of dislocation creep and the rate constant on
thermochemical conditions are identical as stated in chapter 1.1.2.
The main disadvantage for this method is that it cannot give the strain rate that is caused
by dislocation motions. This is because the proportional constant between the dislocation
velocity and the mobility is unknown from experiments and is strongly dependent on the
distribution of dislocations. For example, the dislocation reduction rate must be quite
different in Fig 1.4.2 a and b even we assume each individual dislocation has the same
velocity. Therefore, to direct link the reduction rate and velocity is problematic. Thus, direct
comparisons of results in recovery experiments and those from deformation experiments or
diffusion experiments are not appropriate. Only information about strain rate dependence on
thermochemical conditions can be correctly obtained by this method.
Fig 1.4.2 Two extreme cases for dislocation distribution in two otherwise identical crystals a
and b. Red and black circles represent dislocations with different signs.

47
1.5 Previous studies on rheological properties of olivine
1.5.1 Deformation experiments
The constitutive equation of olivine creep at high temperatures is usually written as
follows
𝜀𝜀̇ = 𝐴𝐴 𝜎𝜎𝑛𝑛
𝐿𝐿𝑝𝑝𝐵𝐵𝑂𝑂2𝑚𝑚𝐶𝐶H2Or exp (−𝛽𝛽+𝑃𝑃Δ𝑉𝑉
𝑅𝑅𝑇𝑇) (1.5.1)
where E and ΔV are the activation energy and volume, respectively. They reflect the
temperature and pressure dependence of creep. The effects of water and oxygen fugacity are
reflected through the exponents r and m. There are many deformation experiments that focused
on different deformation mechanisms. The values of parameters in the constitutive equation are
summarized in Table 1.5.1. It is clear that from the equation 1.5.1 and the discussions in chapter
1.1.3, the climb model is assumed for dislocation creep by previous studies.
Table 1.5.1 Parameters in Eq 1.5.1 from previous deformation experiments
Mechanism* n p r E (kJ/mol) ΔV (cm3/mol)
Dry diffusion* 1 3 0 375 ± 50 2 - 10
Wet diffusion* 1 3 0.7 - 1 375± 75 0 - 20
Dry dislocation* 3.5 ± 0.3 0 0 530 ± 40 1 - 27
Wet dislocation* 3.5 ± 0.3 0 1.2 ± 0.4 520 ± 40 22 ± 11
Dry GBS** 3 0.7 - 1 1.2 420 - 460 17.6 ± 0.8
* From Hirth and Kohlstedt, 2003
**From Hansen et al., 2011 and Ohuchi et al., 2015

48
1.5.1.1 Stress and grain size dependence
These two parameters are keys to identify the deformation mechanism. However,
determination of the grain-size exponent p is quite inaccurate. Firstly, the range of grain sizes in
deformation experiments is limited, usually a factor of 2 to 3 [Mei and Kohlstedt, 2000a; Mei
and Kohlstedt, 2000b]. Secondly, obtaining actual grain sizes is difficult, and different
measurement methods render different results [Hansen et al., 2011]. The inaccuracy of p would
directly bias the fitted stress exponent n, since n is usually obtained with fixed p.
Judging from values of p and n given in literature, diffusion creep is controlled by grain
boundary diffusion, namely it is Coble creep. Therefore, the activation energy of diffusion
creep should correspond to that of grain boundary diffusion.
It is noted that the reported stress exponents of dislocation creep of olivine are not 3 as
suggested by Eq. 1.1.28 but approximately 3.5. One explanation is that the diffusion process
involved in dislocation climb is not lattice diffusion but diffusion through dislocation cores
(pipe diffusion) [Hirth and Kohlstedt, 2015]. However, there is a discrepancy in the activation
energies between deformation and pipe diffusion. The activation energy of pipe diffusion can
be regarded as one half to two thirds that required for lattice diffusion [Shewmon, 2016],
which renders a value of 265 – 353 kJ/mol, using the activation energy of lattice diffusion as
529 ± 41 kJ/mol from [Dohmen et al., 2002]. This value is much lower than that in
deformation experiments used in Hirth and Kohlstedt [2015] (449 ± 7 kJ/mol).
Another contradiction rises from the values in grain boundary sliding (GBS). Judging
from p and n, GBS should be accommodated by dislocation creep. However, n for dislocation
creep should be 3.5 based on deformation experiments. It is unreasonable that dislocation
motions in dislocation creep regime and GBS regime are controlled by different mechanisms,
namely, pipe diffusion and lattice diffusion, respectively. Therefore, either n in GBS or in
dislocation creep must be wrongly determined.

49
1.5.1.2 Activation energy
Reported activation energies of olivine creep rate are listed in table 1.5.1.1, which were
obtained at constant oxidation conditions. It is noted that diffusion creep has a lower activation
energy (325~450 kJ/mol) in comparison with dislocation creep (480~570 kJ/mol). This fact
can be explained by assuming that diffusion creep is controlled by grain boundary diffusion. If
so, dislocation creep is not controlled by grain boundary diffusion of Si. Therefore, lattice
diffusion and pipe diffusion of Si are two candidates for the rate-limiting process in
dislocation creep.
Keefner et al. [2011] measured the activation energy of dislocation creep at constant
oxygen fugacity to find 449 ± 7 kJ/mol. They concluded that the apparently high activation
energies in previous deformation studies was caused by a change in oxygen fugacity at
different T conditions. The oxygen fugacity exponent, m, of dislocation creep obtained in their
study was 1/5.
The effect of water on activation energy seems negligible judging from table 1.5.1.1.
However, this may be due to fitting data to a wrong equation (see the effect of water chapter).
The effect of iron on activation energy is also negligible within the experimental errors
[Durham and Goetze, 1977; Ricoult and Kohlstedt, 1985].
The activation energy of GBS lies between those of dislocation creep and diffusion creep,
indicating that, although both lattice and grain boundary diffusion occur in GBS, neither of
them dominates as a rate-limiting process. This contradicts with similarity of n and p values of
GBS to those of dislocation creep rather than those of diffusion creep, which implies the
dominance of dislocation creep in GBS.
1.5.1.3 Activation volume
Activation volume is poorly constrained by deformation experiments, with values ranging
from 1 to 30 cm3/mol. The main reason for this inconsistency is due to difficulties to obtain
precise relations of stress and strain rate at high pressure. In deformation apparatus in which
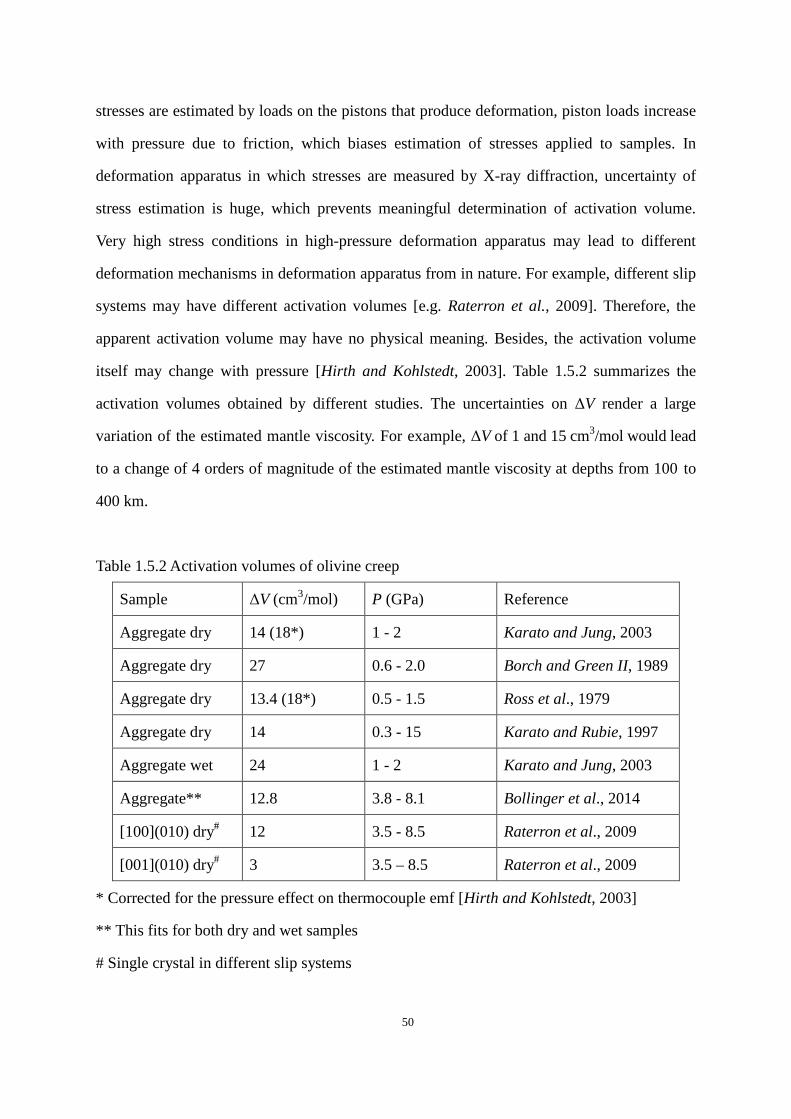
50
stresses are estimated by loads on the pistons that produce deformation, piston loads increase
with pressure due to friction, which biases estimation of stresses applied to samples. In
deformation apparatus in which stresses are measured by X-ray diffraction, uncertainty of
stress estimation is huge, which prevents meaningful determination of activation volume.
Very high stress conditions in high-pressure deformation apparatus may lead to different
deformation mechanisms in deformation apparatus from in nature. For example, different slip
systems may have different activation volumes [e.g. Raterron et al., 2009]. Therefore, the
apparent activation volume may have no physical meaning. Besides, the activation volume
itself may change with pressure [Hirth and Kohlstedt, 2003]. Table 1.5.2 summarizes the
activation volumes obtained by different studies. The uncertainties on ΔV render a large
variation of the estimated mantle viscosity. For example, ΔV of 1 and 15 cm3/mol would lead
to a change of 4 orders of magnitude of the estimated mantle viscosity at depths from 100 to
400 km.
Table 1.5.2 Activation volumes of olivine creep
Sample ΔV (cm3/mol) P (GPa) Reference
Aggregate dry 14 (18*) 1 - 2 Karato and Jung, 2003
Aggregate dry 27 0.6 - 2.0 Borch and Green II, 1989
Aggregate dry 13.4 (18*) 0.5 - 1.5 Ross et al., 1979
Aggregate dry 14 0.3 - 15 Karato and Rubie, 1997
Aggregate wet 24 1 - 2 Karato and Jung, 2003
Aggregate** 12.8 3.8 - 8.1 Bollinger et al., 2014
[100](010) dry# 12 3.5 - 8.5 Raterron et al., 2009
[001](010) dry# 3 3.5 – 8.5 Raterron et al., 2009
* Corrected for the pressure effect on thermocouple emf [Hirth and Kohlstedt, 2003]
** This fits for both dry and wet samples
# Single crystal in different slip systems

51
1.5.1.4 Effect of water on the deformation of olivine
The effect of water is reflected in the exponent r in the equation of 1.5.1.1. However, this
equation assumes that the effect of water on olivine creep is made by changing point defect
concentrations in the crystal. This is true for diffusion creep since deformation by this
mechanism is controlled by the motions of point defects. On the other hand, the validation of
this assumption needs to be tested for dislocation creep and GBS. It is valid only when
dislocation creep and GBS are controlled by climb. Furthermore, it must also be noted that the
power law dependence on water is empirical. For example, one may expect that the
incorporation of water may reduce bond strengths in crystals, leading to a reduction in the
activation energy of creep, where the effect of water should be included in the Boltzmann factor.
Practically, the power-law formalism of Eq. 1.5.1.1 predicts to a zero creep rate at zero water
content, which is unreasonable. Although workers assume a switchover from dry to wet
constitutive equations at some water content, definition of the switchover of water content is
quite arbitrary.
Judging from deformation experiments [complied by Hirth and Kohlstedt, 2003], the
exponent r is around 1.2, which indicates a large effect of water. Water content increases from
the lithosphere to the asthenosphere [Hirth and Kohlstedt, 1996]. Therefore, it could explain
the softening of the asthenosphere as demonstrated in Chapter 1.2.1.
1.5.1.5 Fabric transitions in olivine
As discussed in Chapter 1.2.3, different thermomechanical conditions can lead to different
fabrics, and fabrics can be recognized by seismic anisotropies. Therefore, if we know
thermochemical conditions under which a fabric forms, we could deduce mantle flow
geometries from seismic anisotropy (Fig 1.2.5). Moreover, knowledge of conditions of the
fabric formation could help to explain the variation of seismic anisotropy in different regions in
the mantle because the magnitudes of anisotropy of different fabrics are different (Table 1.5.3).
Thus, many deformation experiments aim at determining fabrics under different conditions.

52
Fig 1.5.1 summarizes the present knowledge of fabric transitions in olivine.
It can be seen that A-type fabric dominates over the B-type at high temperatures, and that
fabric changes from A-type to E-type and then to C-type with increasing water content. In
addition, B-type fabric dominates at high stresses. These results can be used to explain seismic
observations in different mantle regions. The E-type fabric has a lower VSV/VSH seismic
anisotropy than the A-type. Therefore, the decrease in VSV/VSH seismic anisotropy with depth
can be explained by this A- to E-fabric transition. If the mantle flows in the trench-normal
direction, the polarization direction of fast shear wave caused by B- and A-type fabrics are
trench-parallel and trench-vertical, respectively. Therefore, the observed change in the
polarization directions of fast shear waves across Japan trench [Nakajima and Hasegawa, 2004]
can be explained by the A- to B-type fabric transition due to stress decrease away from the
trench without introducing trench-parallel mantle flows [e.g. Jung and Karato, 2001].
Fig 1.5.1 Olivine fabrics at different conditions [From Karato et al., 2008]
Besides temperature and stress, pressure can also cause the A- to B-type transition, which

53
was suggested by Raterron et al. [2007; 2009; 2011]. They found that the activation volume of
the [100](010) slip system was higher than that of the [001](010) slip system, This indicates
that the B-type fabric should dominate at high pressures. The transition occurs at pressures
around 8 GPa. This can also explain the observed decreases in seismic anisotropy with depth.
It is interesting to note that different fabrics dominate at different conditions indicates that
there is no uniform constitutive equation for dislocation creep. Experimental data were usually
fitted to one constitutive equation in a limited experimental range. This process neglects
contributions of different slip systems to total strain. However, existence of dominant fabric
under different conditions indicates that strain rates caused by different slip systems must be
different. Therefore, the experimentally obtained constitutive equations should not be
extrapolated beyond the experimental ranges in which the data were obtained, because such an
extrapolation may over/underestimate the contributions for certain slip systems. An
appropriate way to construct a constitutive equation is to obtain such equations for different
slip systems and then to sum them together.
Table 1.5.3 Olivine fabrics and corresponding seismic anisotropy information
Shear wave splitting, polarization direction of fast shear wave
Fabric Horizontal flow Vertical planar flow
A-type Parallel to flow Small splitting
B-type Vertical to flow Parallel to the plane
C-type Parallel to flow Vertical to the plane
D-type Parallel to flow Small splitting
E-type Parallel to flow Small splitting
VSH/VSV anisotropy
A-type VSH/VSV > 1 VSH/VSV < 1
B-type VSH/VSV > 1 VSH/VSV > 1 (weak)
C-type VSH/VSV < 1 VSH/VSV > 1 (weak)
D-type VSH/VSV > 1 VSH/VSV < 1

54
E-type VSH/VSV > 1 (weak) VSH/VSV < 1
1.5.2 Diffusion experiments
The data obtained from diffusion experiments are fitted to an equation
𝐷𝐷 = 𝐷𝐷0𝐵𝐵O2m𝐶𝐶H2Or exp (−𝛽𝛽+𝑃𝑃∆𝑉𝑉𝑅𝑅𝑇𝑇
) (1.5.2)
where E and ΔV are the activation energy and volume for diffusion, respectively. The
exponents m and r are applied oxygen fugacity and water content, respectively. Since Si is the
slowest diffusion species in olivine, it is expected that rheological properties of olivine are
controlled by Si diffusion. There are several studies on Si diffusivity summarized in Table 1.5.4.
Si diffusivities from these studies are plotted against the reciprocal temperature in Fig. 1.5.2.
Table 1.5.4 Experimental results for Si lattice and grain boundary (GB) diffusivity
Type T
(K)
P
(GPa)
E
(kJ/mol)
ΔV
(cm3/mol)
reference
Lattice* 1600-2000 10-4 368 ± 38 - Jaoul et al., 1981
Lattice# 1400-1800 10-4 291 ± 15 - Houlier et al, 1990
Lattice# 1763 4-9 - 0.7 ± 2.3 Bejina et al., 1999
Lattice# 1373-1773 10-4 529 ± 41 - Dohmen et al., 2002
Lattice## 1473-1623 2 358 ± 28 - Costa and Chakraborty,
2008
Lattice * 1600, 1800 10-4-13 410 ± 30 1.7 ± 0.4 Fei et al., 2012
GB* 900-1200 10-4 203 ± 36 - Farver and Yund, 2000
GB* 1200-1600 10-4-8 220 ± 30 4.0 ± 0.7 Fei et al., 2016
* Dry forsterite; # Dry olivine; ## Wet olivine

55
The magnitudes of Si lattice diffusivity (DSilattice) vary by around 3 orders of magnitude
among different studies (Fig 1.5.2). This may be due to the difficulty of Si diffusivity
measurements due to the very low magnitudes of diffusivity. Estimated creep rates from
DSilattice are much lower than those shown by deformation experiments. This discrepancy can be
explained by introducing pipe diffusion [Hirth and Kohlstedt, 2015]. However, judging from
the activation energy discussed in Chapter 1.5.1.1, their explanation is also problematic.
Fig 1.5.2 Diffusivities of Si against the reciprocal temperature from previous studies (Table
1.5.4). The plot of Si grain-boundary diffusivity (DSiGB) from Fei 2016 is obtained by assuming
a grain boundary with ~10 nm width. The legends are abbreviations from from Table 1.5.4.
For example, FY means Farver and Yund, 2000.
Reported activation energy of Si lattice diffusion ranges from 200 kJ/mol to 530 kJ/mol.
Results from Dohmen et al. [2002] were obtained at constant oxygen fugacity while the others
were obtained at constant oxygen buffer conditions if controlled. The activation energy and
volume determined by Fei et al. [2012] were obtained simultaneously by fitting their data at
two different temperatures and different pressures to Eq. 1.5.2. Namely, they did not design a

56
temperature-series of experiments to obtain the activation energy. The activation energy of
DSilattice generally agrees with that of diffusion creep, implying that diffusion creep might be
controlled by the lattice diffusion. This agreement contradicts the conclusion that diffusion
creep is controlled by grain-boundary diffusion (Chapter 1.5.1.1). The activation energy of
DSilattice is much smaller than that of dislocation creep. This indicates that the creep mechanism
in deformation experiments may not controlled by lattice diffusion. Results from Dohmen et al.
[2002] rendered a high E. However, the dislocation creep experiments conducted at constant
oxygen fugacity [Keefner et al., 2011] gave a lower activation energy around 450 kJ/mol.
The activation energies for DSiGB
by two studies are consistent and are lower than that in
diffusion creep. This also indicates that the diffusion creep is not controlled by grain boundary
diffusion of Si.
Results from the studies of ΔV agree with each other. This agreement means that, if olivine
creep is controlled by Si lattice diffusion, the pressure dependence of olivine creep must be
smaller than the experimentally obtained values. The activation volumes obtained by
deformation experiments, are actually much higher than those given by diffusion experiments,
although their uncertainties are large. This disagreement regarding pressure dependence also
raises a question regarding the assumption that deformation is controlled by diffusion.
The effect of water on DSilattice was investigated by Costa and Chakraborty [2008] and Fei
et al. [2013], who found that the water exponents are 1.2 and 0.3, respectively. Costa and
Chakraborty [2008] fitted their high-pressure (therefore high water contents) data and
room-pressure (therefore low water contents) data to a single constitutive equation. Their
different experimental setups may bias their results. In contrast, Fei et al. [2013] fitted the data
from the experiments with identical setups. Therefore, their results should be more reliable.
The effect of water on DSiGB [Fei et al., 2016] is as small as that of DSi
lattice indicated by Fei et al.
[2013]. Therefore, the effect of water on Si diffusion also contradicts with that from
deformation experiments, according to which the water exponent is around 1.
The oxygen fugacity exponent, m, of DSilattice
in natural olivine was found to be -1/6
[Houlier et al., 1990], which is also inconsistent with the results from dislocation creep

57
experiments.
1.5.3 Dislocation recovery experiments
Dislocation recovery experiments on olivine single crystals and aggregates have been
performed by several studies, and are summarized in Table 1.5.5. Since dislocation motions are
thermally activated processes, the rate constants are fitted by the Arrhenius equation
𝑘𝑘 = 𝑘𝑘0𝐵𝐵𝑂𝑂2𝑚𝑚exp (−𝛽𝛽+𝑃𝑃Δ𝑉𝑉𝑅𝑅𝑇𝑇
) 1.5.1
where E and ΔV are the activation energy and volume for recovery, and m is the
oxygen-fugacity exponent. The parameters obtained by previous studies are summarized in
Table 1.5.6. The rate constants plotted against the reciprocal temperature are in Fig. 1.5.3
The absolute values of k in previous studies varied by one order of magnitude (Fig 1.5.3).
This variation is much smaller than those in Si self-diffusion experiments, and the uncertainty
for each data point is much smaller than that in the diffusion experiments. The main reason is
that the diffusion distance of Si in diffusion experiments is very small, which makes the
determination of concentration-distance profiles difficult. The values from Karato et al. [1993]
are about 0.8 orders of magnitude lower than those from Karato and Ogawa [1982]. This is due
to the different methods in counting dislocation densities as explained by Farla et al. [2011].
The rate constants obtained for single crystals are generally higher than those for aggregates,
indicating that grain boundaries may hinder dislocation annihilation. One possibility is that
when a single dislocation moves to a grain boundary, it disappears but when one dislocation
meets another, two dislocations disappear. Therefore, assuming that grain boundaries and
dislocations have the same ability to attract one free dislocation, the density reduction due to
dislocation-dislocation annihilation should be higher.

58
Table 1.5.5 Summary of previous study in dislocation recovery in olivine
Sample T (K) P (GPa) Observation
method Reference
Single 1563-1723 10-4 TEM Goetze and Kohlstedt, 1973*
Aggregate 1573-1773 10-4 OM Toriumi and Karato, 1978
Single 1525-1675 10-4, 0.5 TEM Kohlstedt et al., 1980
Single 1613-1788 10-4, 2 OM Karato and Ogawa, 1982
Single** 1673 10-4 OM Karato and Sato, 1982
Single 1773 10-4-10 SEM Karato et al., 1993
Aggregate 1373-1723 10-4 SEM Farlar et al., 2011
* This study did not study dislocation annihilation but collapse of sessile dislocation loop.
** The oxygen partial pressure ranged from 10 to 10-6 Pa in this study
Table 1.5.6 Summary of previous results on dislocation recovery of olivine
Reference E (kJ/mol) ΔV (cm3/mol) m
Geotze and Kohlstedt, 1973* 565 ± 125 - -
Toriumi and Karato, 1977 460 ± 40 - -
Kohlstedt et al., 1980 300 ± 15 11 ± 1
Karato and Ogawa, 1982 389 ± 59 14 ± 2
Karato and Sato, 1982 - - -1/6
Karato et al., 1993 - 6 ± 1 -
Farla et al., 2011 355 ± 81 - -
Reported values of the activation energy of annihilation rate constants are between 300
and 450 kJ/mol (Table 1.5.6). These values generally agree with the results from Si lattice
diffusion experiments, suggesting that dislocation motions are controlled by diffusion, namely

59
climb. However, the smaller E of the rate constants compared with that in dislocation creep
experiments indicates that dislocation creep in experiments is not controlled by climb. The
higher E in Geotze and Kohlstedt (1973) was obtained by measuring the collapsing rates of
sessile dislocation loops. Although collapse of sessile loops also involves climb, the jog
concentration of free dislocations, which influences the rates of dislocation annihilation, and
sessile loops may be different. Moreover, dislocation annihilation has to occur during
deformation in order to reach a steady state while collapse of sessile loops is not necessary in
deformation. Therefore, the E of annihilation rate constants is more relevant to deformation.
Fig 1.5.3 Rate constants of dislocation recovery in olivine from previous studies (Table 1.5.6)
The activation volumes of rate constants are different by a factor of 3 among previous
studies. The activation volumes become smaller if the investigated pressure range is wider. In
general, the values obtained in dislocation recovery experiments are smaller than those in
dislocation-creep experiments. The smallest reported activation volume is 6 cm3/mol., which
was obtained by Karato et al. (1993) with a pressure range from 10-4 to 10 GPa. This value is
close to those determined from Si lattice diffusion experiments.
The oxygen fugacity dependence of the rate constants was found with the exponent
around -1/6 by Karato and Sato (1982). Again, this value agrees with the results from diffusion

60
experiments but disagrees to those from dislocation-creep experiments.
1.6 Aims of this study
Olivine is the most abundant and weakest mineral in the Earth’s upper mantle. Therefore,
creep in the upper mantle is mainly controlled by the rheological properties of olivine. Among
various deformation mechanisms, dislocation creep is the main cause of the seismic anisotropy.
Although there are many studies that have focused on the dislocation-creep region in olivine,
an inherent problem in those experiments (Chapter 1.4.1 and 1.4.2) means that their results
should be checked by an independent method. The dislocation recovery method focuses on
dislocation motions. The majority of previous studies did not distinguish between different slip
systems. Therefore, I adopted the dislocation recovery method to study dislocation motions of
different slip systems using olivine single crystals in this study. Moreover, there are various
discrepancies between deformation experiments, diffusion and dislocation recovery
experiments (Table 1.6.1). It is unclear which mechanism is dominant for olivine creep in the
Earth’s mantle. For this reason, I also test the possibility of cross-slip as the rate-limiting
process in dislocation motions by the recovery method.
Table 1.6.1 Discrepancies among different studies with different techniques
Deformation exp. Diffusion Annihilation
E ~530 kJ/mol* ~400 kJ/mol# ~400 kJ/mol!
ΔV >14 cm3/mol* 1.7 cm3/mol# 6 cm3/mol¥ ¥
fO2 effect Exponent of 1/5& Exponent of -1/6¥ Exponent of -1/6&&
Water effect Exponent of 1.2* Exponent of 0.3# -
Isotropy Different fabrics** Isotropic## -
* Hirth &Kohlstedt et al., 2003; ** Karato, 2012; # Fei et al., 2013; & Keefner et al., 2011; &&
Karato & Sato, 1982; ¥ Houlier et al., 1990; ## Jaoul et al., 1981; ! Karato & Ogawa, 1982;
¥ ¥ Karato et al., 1993

61
1.6.1 Temperature dependence of annihilation rate constants for
A-type and B-type dislocations
Deformation experiments suggested that A-type dislocations should dominate at high
temperatures, while B-type dislocations dominate at low temperatures (Fig 1.5.1). This
indicates that the activation energy of A-type dislocations is higher than that of B-type
dislocations. However, there are neither deformation nor recovery experiments to compare
dislocation mobility of these two slip systems.
AG-type fabric was found in nature [Ismaı̈l and Mainprice, 1998; categorized by
Mainprice, 2007]. This fabric suggests that both A-type and B-type dislocations have similar
mobilities. Therefore, in order to understand the temperature dependence of these two slip
systems, dislocation recovery experiments were conducted at room pressure with a temperature
range of 1473-1773 K at oxygen partial pressure near nickel-nickel oxide (NNO) buffer
conditions in a gas mixing furnace using Pakistan olivine.
1.6.2 Pressure dependence of annihilation rate constants for
A-type and B-type dislocations
Different studies involving high-pressure deformation experiments have reported
significantly different activation volumes, They are generally larger than those determined
from diffusion experiments. Reasons for this difference are not understood. Therefore, a better
constraint for the activation volume for olivine creep is necessary by using a different method
from deformation and diffusion experiments.
Deformation experiments suggested that B-type dislocations dominate at high pressures,
while A-type dislocations dominate at low pressures (Chapter 1.5.1.5). If this is the case in
natural conditions, it can explain the decreases of seismic anisotropies with depth. Although
Raterron et al. [2009] studied strain rates caused by A-type and B-type dislocations, their
activation volumes for these two slip systems were obtained by fitting their own high-pressure

62
data and previous low-pressure data from other studies. Different experimental setups may bias
the results.
Karato et al. [1993] reported that climb of A-type dislocations has an activation volume
of 6 cm3/mol. There are no data for the activation volume of B-type dislocations. Therefore,
dislocation recovery experiments were conducted for A-type and B-type dislocations from 2 to
12 GPa at 1650 K to obtain better constraints for the activation volumes of these two slip
systems.
1.6.3 Water dependence of annihilation rate constants for C-type
dislocations
As demonstrated in Chapter 1.5.1.4, water could cause fabric transitions, which were
determined by deformation experiments. Namely, A-type dislocations dominate at low water
contents while C-type dislocations dominate at high water contents. Like the pressure effect,
this fabric transition may explain the decreases of seismic anisotropies with depth, because the
C-type fabric has a lower VSH/VSV seismic anisotropy. In addition to the fabric transition, it was
also claimed that water incorporation softens olivine. Deformation experiments reported that a
hydrous olivine deforms faster than a dry olivine in proportion the water content raised to the
power 1.2 (Chapter 1.5.1.3). We know that the asthenosphere is more hydrous than the
lithosphere. The softening of the asthenosphere might be explained by the hydrous weakening
of olivine if those results are applicable to the natural conditions.
However, Fei et al. [2013] demonstrated that the water effect on Si lattice self-diffusion is
small. Namely, the diffusivity increases in proportion water content to 0.3 power. Therefore,
they expected that the effect of water on dislocation creep is small. They attributed the large
water exponent reported by deformation experiments to free water in grain boundaries and high
stresses in those experiments. In order to obtain better understanding about the effect of water
on olivine dislocation creep, we conducted dislocation annihilation experiments on C-type
dislocations at 5 GPa, 1473 K with a water content range from 5 to 100 wt. ppm. Because

63
C-type fabric was suggested to be dominant at high water contents and the water exponent in
dislocation-creep experiments is 1.2, the water exponent for C-type dislocation mobility should
be higher than 1.2
1.6.4 TEM study of E-type dislocations at different conditions
Deformation experiments suggested that olivine fabrics change from A-type to E-type
then to C-type with increasing water content [Jung and Karato, 2001; Jung et al., 2006;
Katayama et al., 2004]. E-type was proposed to be a candidate for the dominant fabric at upper
mantle conditions [Karato et al., 2008]. A-type and C-type are well documented both in natural
and laboratory deformed samples and the responsible slip systems for these two fabrics are
well studied. However, there are a limited number of reports regarding E-type fabrics from
natural samples. Moreover, the responsible slip system for this fabric, namely, [100](001) was
never confirmed by TEM observations under hydrous conditions. In this study, it was
examined whether and at what water content the [100](001) slip system is activated.
Olivine single crystals were first annealed under dry or wet conditions, and then simply
sheared in the [100] direction on the (001) plane, trying to activate the target slip system at
pressures of 2~5 GPa, temperatures of 1473 and 1600 K under dry or wet conditions. Thin
sections parallel to the (001) plane of the deformed samples were prepared, and then argon
milled for TEM observations to examine their dislocation structures.
1.6.5 Examination of cross-slip as a controlled mechanism for
olivine deformation
The constitutive equation for olivine dislocation creep at high temperatures is based on the
climb-controlled model, namely, dislocation motion is rate-limited by diffusion-controlled
climb of edge dislocation segments. However, there are many discrepancies between results
from deformation experiments and diffusion/recovery experiments (Table 1.6.1), suggesting
that the mechanism in olivine dislocation creep may be not controlled by climb. Moreover,

64
both motions of screw and edge segments are needed for a dislocation loop to produce
macroscopic strains. If the rate-limiting process of screw dislocation segments is different from
that of edge segments, the rheology of olivine should be reconsidered.
Cross-slip of screw dislocations was proposed as a rate-limiting process by Poirier et al
[1976] because cross-slip of dissociated screw dislocations needs additional energy to
recombine partial dislocations. However, whether cross-slip can be a rate-limiting process for
olivine high-temperature creep has never been examined in experimental studies. Therefore,
we conducted dislocation recovery experiments on [001](010) screw and edge dislocations to
compare their activation energies at room pressure at temperatures ranging from 1473 to 1773
K.
1.7 General techniques in this study
1.7.1 Sample preparation
Samples used in this study are single crystals of natural olivine from Pakistan. The same
olivine has been describe by Gose et al. [2010] and its major and trace elements, including
water content, were reported there, and are shown in Table 1.7.1. Inclusion- and crack-free
grains were handpicked under an optical microscope.
Table 1.7.1 Composition of olivine used in this study. The major-element contents are in wt.%
while those of the trace-element are in wt. ppm (from Gose et al., 2010).
SiO2 MgO FeO NiO MnO
1.29 49.95 8.79 0.35 0.13
Li Be B Ca Sc Ti V Cr Co H2O
19 <0.02 37 243 1.9 12 2.1 68 133 35/51
Orientations of single crystals were determined using a single-crystal X-ray
diffractometer (Oxford diffraction Xcalibur 2) at the University of Bayreuth. This

65
diffractometer is equipped with a two-dimensional CCD detector and allows a crystal to
rotate in two directions. After obtaining orientation information, the crystals were transferred
to a highly precise single-crystal X-ray diffractometer (Huber SMC 9000) operated by
SINGLE2014 software [Angel and Finger, 2011] at the University of Bayreuth. One
crystallographic plane ((100), (010) or (001)) of the crystals was orientated with a precision
of 0.1o parallel to the horizontal plane and then mounted in the epoxy resin. The plane was
then polished using diamond powders with a grain size of 0.25 μm. The other two planes
were determined by means of electron backscattered diffraction (EBSD) in a scanning
electron microscope (SEM). Cubes were shaped from the oriented crystals along their
crystallographic planes. The orientations of the crystals were checked again by EBSD after
shaping the cubes.
1.7.2 Deformation experiments
The purpose of deformation experiments is to produce initial dislocations in the crystals.
The orientated crystals were put in MgO slices with a cubic hole at the center, and then
sandwiched between two crushable alumina pistons, cut at an angle of 45º for simple shear
deformation. Depending on a target slip system, different crystallographic axes were aligned
in shear directions. Experiments were conducted in a Kawai-type multi-anvil apparatus at the
University of Bayreuth at a pressure of 3 or 5 GPa and a temperature of 1,600 or 1473 K.
Cell assemblies were first pressurized to target pressures, and then temperatures were
increased to the target values. After holding them for 15 min to sinter the crushable alumina
pistons, the cell assemblies were then further compressed by increasing the press load to
deform the samples. After deformation, the samples were quenched by switching off heating
power. The cell assemblies were then decompressed to ambient pressure.
After decompression, the pressure media with the samples were polished to expose the
shear planes of the crystals. Deviation of the crystallographic axes from shear directions was
examined by means of EBSD. Shear directions were assumed to be aligned along the long

66
axes of the MgO slices.
1.7.3 Dislocation recovery
Room-pressure recovery experiments were conducted in a CO/CO2 gas-mixing furnace
at the University of Bayreuth. Deformed crystals were annealed at temperatures ranging from
1,460 to 1,760 K for 20 min to 24.5 hours. Oxygen partial pressures were controlled at 10-6 to
10-8 MPa by changing CO/CO2 ratio, which were near the NNO-buffer conditions.
High-pressure recovery experiments were conducted in Kawai-type multi-anvil
apparatus. Deformed samples were buffered by enstatite to control the silica activity. The
oxygen fugacity was controlled by different buffers in different experiments. An undeformed
sample was annealed in the same setup to check the stress in such assembly by counting
dislocation density increase.
1.7.4 Observations of dislocations
Deformed olivine crystals were examined by TEM to determine whether the target slip
systems were activated or not. In addition, characters of dislocations were determined.
Samples were polished on both sides parallel to the shear planes until the thicknesses ranges
from 23 to 35 μm. Then, Ar ion-milling was used to make the sample thinner, using voltages
of 4.5 to 5 kV voltages, at an elevation angle of 4 to 8º from the top and bottom
ion-bombardment. Dislocation microstructures were examined by dark field (DF, Bragg
condition, deviation parameter, s = 0) and weak-beam dark field (WBDF, s > 0) imaging and
selected area electron diffraction (SAED).We chose appropriate diffraction vectors (g) to
identified the Burger’s vectors. When g∙b = integer, dislocations are visible by diffraction
contrast. Since dislocations were observed on the slip planes, they should be screw
dislocations if they elongate in the shear direction, and they should be edge dislocations if
their elongation direction is perpendicular to the shear direction.
Dislocation densities before and after annealing were measured using the oxidation
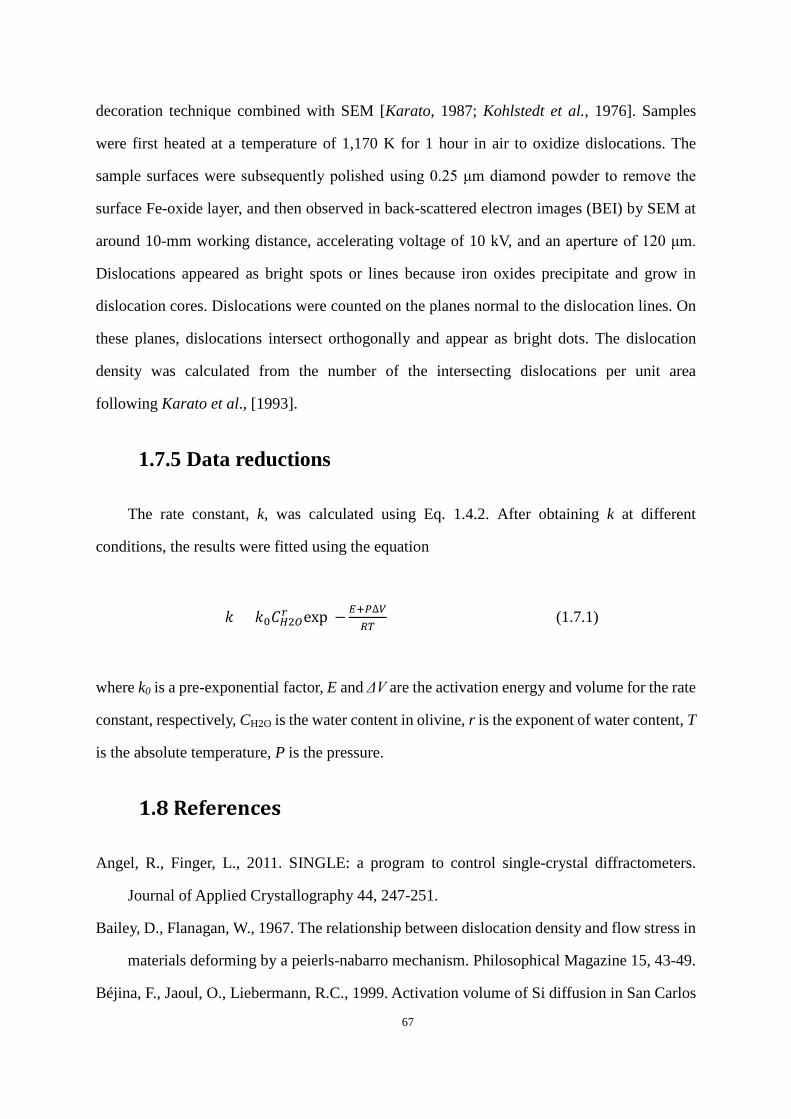
67
decoration technique combined with SEM [Karato, 1987; Kohlstedt et al., 1976]. Samples
were first heated at a temperature of 1,170 K for 1 hour in air to oxidize dislocations. The
sample surfaces were subsequently polished using 0.25 μm diamond powder to remove the
surface Fe-oxide layer, and then observed in back-scattered electron images (BEI) by SEM at
around 10-mm working distance, accelerating voltage of 10 kV, and an aperture of 120 μm.
Dislocations appeared as bright spots or lines because iron oxides precipitate and grow in
dislocation cores. Dislocations were counted on the planes normal to the dislocation lines. On
these planes, dislocations intersect orthogonally and appear as bright dots. The dislocation
density was calculated from the number of the intersecting dislocations per unit area
following Karato et al., [1993].
1.7.5 Data reductions
The rate constant, k, was calculated using Eq. 1.4.2. After obtaining k at different
conditions, the results were fitted using the equation
𝑘𝑘 = 𝑘𝑘0𝐶𝐶𝐻𝐻2𝑂𝑂𝑑𝑑 exp (−𝛽𝛽+𝑃𝑃∆𝑉𝑉𝑅𝑅𝑇𝑇
) (1.7.1)
where k0 is a pre-exponential factor, E and ΔV are the activation energy and volume for the rate
constant, respectively, CH2O is the water content in olivine, r is the exponent of water content, T
is the absolute temperature, P is the pressure.
1.8 References
Angel, R., Finger, L., 2011. SINGLE: a program to control single-crystal diffractometers.
Journal of Applied Crystallography 44, 247-251.
Bailey, D., Flanagan, W., 1967. The relationship between dislocation density and flow stress in
materials deforming by a peierls-nabarro mechanism. Philosophical Magazine 15, 43-49.
Béjina, F., Jaoul, O., Liebermann, R.C., 1999. Activation volume of Si diffusion in San Carlos

68
olivine: Implications for upper mantle rheology. Journal of Geophysical Research: Solid
Earth 104, 25529-25542.
Bollinger, C., Raterron, P., Cordier, P., Merkel, S., 2014. Polycrystalline olivine rheology in
dislocation creep: Revisiting experimental data to 8.1 GPa. Physics of the Earth and
Planetary Interiors 228, 211-219.
Borch, R., Green II, H., 1989. Deformation of peridotite at high pressure in a new molten salt
cell: Comparison of traditional and homologous temperature treatments. Physics of the
Earth and Planetary Interiors 55, 269-276.
Bussod, G., Katsura, T., Rubie, D., 1993. The large volume multi-anvil press as a highP-T
deformation apparatus. PAGEOPH 141, 579-599.
Costa, F., Chakraborty, S., 2008. The effect of water on Si and O diffusion rates in olivine and
implications for transport properties and processes in the upper mantle. Physics of the
Earth and Planetary Interiors 166, 11-29.
Dohmen, R., Chakraborty, S., Becker, H.W., 2002. Si and O diffusion in olivine and
implications for characterizing plastic flow in the mantle. Geophysical research letters 29.
Durham, W., Goetze, C., 1977. A comparison of the creep properties of pure forsterite and
iron-bearing olivine. Tectonophysics 40, T15-T18.
Dziewonski, A.M., Anderson, D.L., 1981. Preliminary reference Earth model. Physics of the
Earth and Planetary Interiors 25, 297-356.
Farla, R.J.M., Kokkonen, H., Fitz Gerald, J.D., Barnhoorn, A., Faul, U.H., Jackson, I., 2011.
Dislocation recovery in fine-grained polycrystalline olivine. Physics and Chemistry of
Minerals 38, 363-377.
Farver, J.R., Yund, R.A., 2000. Silicon diffusion in forsterite aggregates: Implications for
diffusion accommodated creep. Geophysical Research Letters 27, 2337-2340.
Fei, H., Hegoda, C., Yamazaki, D., Wiedenbeck, M., Yurimoto, H., Shcheka, S., Katsura, T.,
2012. High silicon self-diffusion coefficient in dry forsterite. Earth and Planetary Science
Letters 345–348, 95-103.
Fei, H., Koizumi, S., Sakamoto, N., Hashiguchi, M., Yurimoto, H., Marquardt, K., Miyajima,

69
N., Yamazaki, D., Katsura, T., 2016. New constraints on upper mantle creep mechanism
inferred from silicon grain-boundary diffusion rates. Earth and Planetary Science Letters
433, 350-359.
Fei, H., Wiedenbeck, M., Yamazaki, D., Katsura, T., 2013. Small effect of water on
upper-mantle rheology based on silicon self-diffusion coefficients. Nature 498, 213-+.
Frost, D.J., 2008. The upper mantle and transition zone. Elements 4, 171-176.
Goetze, C., Kohlstedt, D.L., 1973. Laboratory study of dislocation climb and diffusion in
olivine. Journal of Geophysical Research 78, 5961-5971.
Gose, J., Schmaedicke, E., Markowitz, M., Beran, A., 2010. OH point defects in olivine from
Pakistan. Mineralogy and Petrology 99, 105-111.
Gueguen, Y., Darot, M., Mazot, P., Woirgard, J., 1989. Q− 1 of forsterite single crystals.
Physics of the earth and planetary interiors 55, 254-258.
Gung, Y., Panning, M., Romanowicz, B., 2003. Global anisotropy and the thickness of
continents. Nature 422, 707-711.
Hager, B.H., 1984. Subducted slabs and the geoid: Constraints on mantle rheology and flow.
Journal of Geophysical Research: Solid Earth 89, 6003-6015.
Hansen, L.N., Zimmerman, M.E., Kohlstedt, D.L., 2011. Grain boundary sliding in San Carlos
olivine: Flow law parameters and crystallographic-preferred orientation. Journal of
Geophysical Research: Solid Earth 116, B08201.
Haskell, N.A., 1937. The viscosity of the asthenosphere. Am. J. Sci., 22-28.
Hirth, G., Kohlstedt, D., 2003. Rheology of the Upper Mantle and the Mantle Wedge: A View
from the Experimentalists, Inside the Subduction Factory. American Geophysical Union,
pp. 83-105.
Hirth, G., Kohlstedt, D., 2015. The stress dependence of olivine creep rate: Implications for
extrapolation of lab data and interpretation of recrystallized grain size. Earth and
Planetary Science Letters 418, 20-26.
Hirth, G., Kohlstedt, D.L., 1996. Water in the oceanic upper mantle: implications for rheology,
melt extraction and the evolution of the lithosphere. Earth and Planetary Science Letters

70
144, 93-108.
Houlier, B., Cheraghmakani, M., Jaoul, O., 1990. Silicon diffusion in San Carlos olivine.
Physics of the Earth and Planetary Interiors 62, 329-340.
Hull, D., Bacon, D.J., 2001. Introduction to dislocations. Butterworth-Heinemann.
Ismaı̈l, W.B., Mainprice, D., 1998. An olivine fabric database: an overview of upper mantle
fabrics and seismic anisotropy. Tectonophysics 296, 145-157.
Jackson, I., Gerald, F., John, D., Faul, U.H., Tan, B.H., 2002. Grain‐size‐sensitive seismic
wave attenuation in polycrystalline olivine. Journal of Geophysical Research: Solid Earth
107.
Jaoul, O., 1990. Multicomponent diffusion and creep in olivine. Journal of Geophysical
Research: Solid Earth 95, 17631-17642.
Jaoul, O., Poumellec, M., Froidevaux, C., Havette, A., 1981. Silicon diffusion in forsterite: a
new constraint for understanding mantle deformation. Anelasticity in the Earth, 95-100.
Jung, H., Karato, S.-i., 2001. Water-Induced Fabric Transitions in Olivine. Science 293,
1460-1463.
Jung, H., Katayama, I., Jiang, Z., Hiraga, T., Karato, S., 2006. Effect of water and stress on the
lattice-preferred orientation of olivine. Tectonophysics 421, 1-22.
Karato, S.-i., 2012. Deformation of earth materials: an introduction to the rheology of solid
earth. Cambridge University Press.
Karato, S.-I., Jung, H., 2003. Effects of pressure on high-temperature dislocation creep in
olivine. Philosophical Magazine 83, 401-414.
Karato, S.-i., Jung, H., Katayama, I., Skemer, P., 2008. Geodynamic Significance of Seismic
Anisotropy of the Upper Mantle: New Insights from Laboratory Studies. Annual Review
of Earth and Planetary Sciences 36, 59-95.
Karato, S.-i., Rubie, D.C., 1997. Toward an experimental study of deep mantle rheology: A
new multianvil sample assembly for deformation studies under high pressures and
temperatures. Journal of Geophysical Research: Solid Earth 102, 20111-20122.
Karato, S.-I., Rubie, D.C., Yan, H., 1993. Dislocation recovery in olivine under deep upper
71
mantle conditions: Implications for creep and diffusion. Journal of Geophysical Research:
Solid Earth 98, 9761-9768.
Karato, S.-i., Sato, H., 1982. Effect of oxygen partial pressure on the dislocation recovery in
olivine: a new constraint on creep mechanisms. Physics of the Earth and Planetary
Interiors 28, 312-319.
Karato, S., 1987. Scanning electron microscope observation of dislocations in olivine. Physics
and Chemistry of Minerals 14, 245-248.
Karato, S., Ogawa, M., 1982. High-pressure recovery of olivine: implications for creep
mechanisms and creep activation volume. Physics of the Earth and Planetary Interiors 28,
102-117.
Katayama, I., Jung, H., Karato, S.-i., 2004. New type of olivine fabric from deformation
experiments at modest water content and low stress. Geology 32, 1045-1048.
Kawazoe, T., Nishihara, Y., Ohuchi, T., Nishiyama, N., Higo, Y., Funakoshi, K.-i., Irifune, T.,
2011. In situ stress-strain measurements in a deformation-DIA apparatus at P-T conditions
of the upper part of the mantle transition zone. American Mineralogist 96, 1665-1672.
Kawazoe, T., Nishiyama, N., Nishihara, Y., Irifune, T., 2010. Deformation experiment at P–T
conditions of the mantle transition zone using D-DIA apparatus. Physics of the Earth and
Planetary Interiors 183, 190-195.
Keefner, J., Mackwell, S., Kohlstedt, D., Heidelbach, F., 2011. Dependence of dislocation
creep of dunite on oxygen fugacity: implications for viscosity variations in Earth's mantle.
Journal of Geophysical Research: Solid Earth 116.
Kinsland, G.L., Bassett, W.A., 1977. Strength of MgO and NaCl polycrystals to confining
pressures of 250 kbar at 25 C. Journal of Applied Physics 48, 978-985.
Kocks, U.F., Argon, A.S., Ashby, M., F., 1975. Thermodynamics and kinetics of slip. Progress
in Material Science 19, 1-291.
Kohlstedt, D., Nichols, H., Hornack, P., 1980. The effect of pressure on the rate of dislocation
recovery in olivine. Journal of Geophysical Research: Solid Earth (1978–2012) 85,
3122-3130.

72
Kohlstedt, D.L., 2006. The Role of Water in High-Temperature Rock Deformation. Reviews in
Mineralogy and Geochemistry 62, 377-396.
Kohlstedt, D.L., Goetze, C., 1974. Low-stress high-temperature creep in olivine single crystals.
Journal of Geophysical Research 79, 2045-2051.
Kohlstedt, D.L., Goetze, C., Durham, W.B., Sande, J.V., 1976. New Technique for Decorating
Dislocations in Olivine. Science 191, 1045-1046.
Langdon, T., 1994. A unified approach to grain boundary sliding in creep and superplasticity.
Acta Metallurgica et Materialia 42, 2437-2443.
Lawrence, J.F., Wysession, M.E., 2006. QLM9: A new radial quality factor (Q μ) model for the
lower mantle. Earth and Planetary Science Letters 241, 962-971.
Mainprice, D., 2007. Seismic anisotropy of the deep Earth from a mineral and rock physics
perspective. Schubert, G. Treatise in Geophysics Volume 2 pp437-492. Oxford.
Mainprice, D., Barruol, G., Ismail, W.B., 2000. The seismic anisotropy of the Earth's mantle:
from single crystal to polycrystal. Earth's Deep Interior: Mineral physics and tomography
from the atomic to the global scale, 237-264.
Mei, S., Kohlstedt, D., 2000a. Influence of water on plastic deformation of olivine aggregates:
1. Diffusion creep regime. Journal of Geophysical Research: Solid Earth 105,
21457-21469.
Mei, S., Kohlstedt, D.L., 2000b. Influence of water on plastic deformation of olivine
aggregates 2. Dislocation creep regime. Journal of Geophysical Research-Solid Earth 105,
21471-21481.
Montagner, J.P., Kennett, B.L.N., 1996. How to reconcile body-wave and normal-mode
reference earth models. Geophys. J. Int. 125, 229-248.
Nakajima, J., Hasegawa, A., 2004. Shear-wave polarization anisotropy and
subduction-induced flow in the mantle wedge of northeastern Japan. Earth and Planetary
Science Letters 225, 365-377.
Nishiyama, N., Maeda, T., Irifune, T., Wada, K., Shinmei, T., Isobe, F., Akatsu, M., 2010.
Pressure generation up to 55 GPa using a Drickamer-type apparatus with sintered

73
diamond anvils toward use of nano-polycrystalline diamond as anvils, Journal of Physics:
Conference Series. IOP Publishing, p. 012189.
Ohuchi, T., Kawazoe, T., Higo, Y., Funakoshi, K.-i., Suzuki, A., Kikegawa, T., Irifune, T., 2015.
Dislocation-accommodated grain boundary sliding as the major deformation mechanism
of olivine in the Earth’s upper mantle. Science advances 1, e1500360.
Paterson, M., 1970. A high-pressure, high-temperature apparatus for rock deformation,
International Journal of Rock Mechanics and Mining Sciences & Geomechanics
Abstracts. Elsevier, pp. 517-526.
Peach, M., Koehler, J.S., 1950. THE FORCES EXERTED ON DISLOCATIONS AND THE
STRESS FIELDS PRODUCED BY THEM. Physical Review 80, 436-439.
Peltier, W., 1998. Postglacial variations in the level of the sea: Implications for climate
dynamics and solid‐earth geophysics. Reviews of Geophysics 36, 603-689.
Poirier, J.-P., 1985. Creep of crystals: high-temperature deformation processes in metals,
ceramics and minerals. Cambridge University Press.
Poirier, J.-P., Vergobbi, B., 1978. Splitting of dislocations in olivine, cross-slip-controlled
creep and mantle rheology. Physics of the Earth and Planetary Interiors 16, 370-378.
Poirier, J., 1976. On the symmetrical role of cross-slip of screw dislocations and climb of edge
dislocations as recovery processes controlling high-temperature creep. Revue de Physique
Appliquée 11, 731-738.
Raterron, P., Amiguet, E., Chen, J., Li, L., Cordier, P., 2009. Experimental deformation of
olivine single crystals at mantle pressures and temperatures. Physics of the Earth and
Planetary Interiors 172, 74-83.
Raterron, P., Chen, J., Geenen, T., Girard, J., 2011. Pressure effect on forsterite dislocation slip
systems: Implications for upper-mantle LPO and low viscosity zone. Physics of the Earth
and Planetary Interiors 188, 26-36.
Raterron, P., Chen, J., Li, L., Weidner, D., Cordier, P., 2007. Pressure-induced slip-system
transition in forsterite: Single-crystal rheological properties at mantle pressure and
temperature. American Mineralogist 92, 1436-1445.
74
Ricoult, D., Kohlstedt, D., 1985. Experimental evidence for the effect of chemical environment
upon the creep rate of olivine. Point defects in minerals, 171-184.
Ringwood, A., 1975. Composition and Structure of the Earth’s Mantle. McGraw-Hill, New
York.
Ross, J.V., Ave'Lallemant, H.G., Carter, N.L., 1979. Activation volume for creep in the upper
mantle. Science 203, 261-263.
Shewmon, P., 2016. Diffusion in solids. Springer.
Singh, A.K., 1993. The lattice strains in a specimen (cubic system) compressed
nonhydrostatically in an opposed anvil device. Journal of Applied Physics 73, 4278-4286.
Toriumi, M., Karato, S.-I., 1978. Experimental studies on the recovery process of deformed
olivines and the mechanical state of the upper mantle. Tectonophysics 49, 79-95.
Wang, Y., Durham, W.B., Getting, I.C., Weidner, D.J., 2003. The deformation-DIA: A new
apparatus for high temperature triaxial deformation to pressures up to 15 GPa. Review of
Scientific Instruments 74, 3002-3011.
Weertman, J., 1999. Microstructural mechanisms of creep. Mechanics and materials:
Fundamentals and linkages, 451-488.
Yamazaki, D., Karato, S.-i., 2001. High-pressure rotational deformation apparatus to 15 GPa.
Review of Scientific Instruments 72, 4207-4211.
Yuen, D.A., Sabadini, R., Boschi, E.V., 1982. Viscosity of the lower mantle as inferred from
rotational data. Journal of Geophysical Research: Solid Earth 87, 10745-10762.

75
2. List of manuscripts and statements of
author’s contribution
1. Wang, L., S. Blaha, Z. Pintér, R. Farla, T. Kawazoe, N. Miyajima, K. Michibayashi, and T.
Katsura (2016), Temperature dependence of [100](010) and [001](010) dislocation
mobility in natural olivine, Earth and Planetary Science Letters, 441, 81-90
In this study, the idea comes from T. Katsura. LW performed all the deformation and
annealing experiments. ZP conducted TEM observations under the instruction of NM. LW
wrote the manuscript with further improvements of SB, ZP, RF, NM, KM, T. Kawazoe,
and T. Katsura
2. Wang, L., S. Blaha, T. Kawazoe, N. Miyajima, and T. Katsura (2017), Identical activation volumes of dislocation mobility in the [100](010) and [001](010) slip systems in natural olivine, Geophysical Research Letters, 44, 2687-2692.
In this study, the idea comes from T. Katsura. LW performed all the deformation and
annealing experiments. LW wrote the manuscript with further improvements of SB, T.
Kawazoe, NM and T. Katsura.
3. Wang, L. and T. Katsura (2018), Identical mechanism for the motion of screw and edge
dislocations in natural olivine, Geology, (under review).
In this study, the idea comes from LW. LW performed all the deformation and annealing
experiments. LW wrote the manuscript with further improvements of TK.
4. Wang, L., N. Miyajima, T. Kawazoe, T. Katsura (2018), Activation of [100](001) slip
system by water incorporation in olivine, American Mineralogist, (submitted).

76
In this study, the idea comes from T. Katsura. LW performed all the deformation
experiments. TEM observations were conducted by LW under the instruction of NM. LW
wrote the manuscript with further improvements of T. Kawazoe, NM and T. Katsura.
5. Wang, L., T. Kawazoe, N. Miyajima, and T. Katsura, Small effect of water on olivine
dislocation creep (Completed manuscript for submission)
In this study, the idea comes from T. Katsura. LW performed all the deformation and
annealing experiments. LW wrote the manuscript with further improvements of T.
Kawazoe, NM and T. Katsura.

77
3. Temperature dependence of [100](010) and
[001](010) dislocation mobility in natural
olivine
Lin Wanga,*, Stephan Blahaa, Zsanett Pintéra, Robert Farlaa, Takaaki Kawazoea,
Nobuyoshi Miyajimaa, Katsuyoshi Michibayashib and Tomoo Katsura
a Bayerisches Geoinstitut, University of Bayreuth, 95440 Bayreuth, Germany.
b Institute of Geosciences, Shizuoka University, Shizuoka 422-8529, Japan.
3.1 Abstract
Dislocation recovery experiments were conducted on pre-deformed olivine single
crystals at 1,450 to 1,760 K, room pressure, and oxygen partial pressures near the Ni-NiO
buffer to determine the annihilation rates for [100] and [001] dislocations on the (010) plane.
Olivine single crystals were first deformed to activate the desired slip systems under simple
shear geometry and then annealed at target conditions. The edge and screw dislocations with
Burgers vectors, b, of [100] and [001], respectively, both elongated in the [001] direction
were produced by the deformation. The dislocation annihilation rate constants of both types
of dislocations are identical within 0.3 log unit. The activation energies for both dislocations
are also identical, i.e., ~400 kJ/mol, which is also identical to that of the Si self-diffusion
coefficient. This correspondence suggests that olivine dislocation creep controlled by a
diffusion-controlled process under low-stress and high-temperature conditions. This study
offers a potential insight into the formation of AG-type fabric in olivine.
3.2 Introduction
Formation of lattice preferred orientation (LPO) in mantle minerals is a consequence of

78
the dominant slip systems activated by dislocation creep. Dominant slip system changes
depending on chemical and physical conditions (Karato, 2008). Therefore, knowledge of
conditions of LPO formation is useful to understand the chemical and physical conditions in
the Earth’s interior. In addition, LPO causes seismic anisotropy, which provides insight into
the direction of upper mantle convective flow by combining observations about seismic
anisotropy and conditions of formation of LPO in mantle minerals.
A number of seismic studies have shown seismic anisotropy in the upper mantle
(Dziewonski and Anderson, 1981; Montagner and Kennett, 1996; Gung et al., 2003; Nettles
and Dziewonski, 2008; Visser et al., 2008). These studies showed that the magnitude of seismic
anisotropy decreases with depth. For example, the frequently cited one-dimensional global
model, PREM (Dziewonski and Anderson, 1981), demonstrated that anisotropy in Vs and Vp
gradually diminishes with depth. Montagner and Kennett (1996) suggested that horizontally
polarized S-wave velocity (VSH) is faster than vertically polarized S-wave velocity (VSV) at the
shallow part (< 250 km) of the upper mantle, but this difference decreases with depth. Visser et
al. (2008) reported similar results.
Since olivine is the most abundant mineral in the Earth’s upper mantle, the LPOs of
olivine from natural specimens and experimentally deformed samples have been extensively
studied (Karato, 1988; Jung et al., 2001; Katayama et al., 2004; Jung et al., 2006; Katayama
et al., 2006). An abundance of olivine in peridotite, originating from the deep lithosphere and
upper mantle, shows concentrations on the a-axis in the direction of lineation and b-axis in
the direction normal to the foliation (e.g., Ben Ismail & Mainprice, 1998; Nicolas et al., 1971;
named as A-type fabric after Jung and Karato, 2001). Peridotites from convergent boundaries
(e.g., Dobrzhinetskaya et al., 1996; Mizukami et al., 2004; Skemer et al., 2006) show
concentrations on the c-axis in the direction of lineation and the b-axis in the direction normal
to the foliation (named as B-type fabric after Jung and Karato, 2001). AG-type fabric (Ben
Ismail and Mainprice 1998, categorized by Mainprice, 2007), in which the a- and c-axes show
a girdle structure parallel to the foliation with concentration on the b-axis normal to the
foliation, were also found in upper mantle samples. (Michibayashi and Mainprice, 2004;

79
Hidas et al, 2007; Satsukawa et al., 2011). These natural olivine fabrics have been reproduced
in deformation experiments under different chemical and physical conditions (Jung and Karato,
2001; Holtzman et al., 2003; Karato, 2008). A-type fabric forms under high-temperature
conditions and B-type fabric forms under low-temperature and/or high-stress conditions (Jung
and Karato, 2001; Karato, 2008). AG-type fabric forms with coexistence of melt (Holtzman et
al., 2003).
However, we note that olivine LPO fabrics obtained in the laboratory generally formed
under higher stresses and many orders of magnitude higher strain rates (Hirth and Kohlstedt,
2003). Competition between dislocation glide and climb and slip system activation under those
conditions may not be the same as under low stress, moderate to high temperature conditions in
the Earth. Therefore, it is necessary to investigate the origin of these fabrics using a different
strategy.
Orowan’s equation (Hull and Bacon, 2005) is a simple formula to describe dislocation
creep, in which the dislocation creep rate is a product of the Burgers vector, average mobile
dislocation density, and average mobile dislocation velocity. Generally, the average mobile
dislocation velocity is the product of average dislocation mobility, which is independent of
force, and a function of force acting on dislocations per unit length. Therefore, compared with
dislocation velocity, dislocation mobility is more representative to express the rheology
property of a material. This study focuses on variations in climb mobility in edge dislocation
and cross slip mobility in screw dislocations, among different slip systems as function of
temperature. Although glide velocity contribute much lager to the total strain, the climb/cross
slip velocity is typically much slower than glide velocity. Therefore, dislocation climb/cross
slip are the rate limiting process for olivine deformation (Poirier and Vergobbi, 1977) and
should control the temperature and pressure dependence of strain rate. Thus, whether
temperature and pressure can cause fabric transition is determined by the temperature and
pressure dependences of climb/cross slip in different slip systems. Since climb and cross slip
are controlled by thermal activated processes, we investigate the temperature dependence of
them in two different slip systems. Hereafter, we use dislocation mobility to refer dislocation

80
climb/cross slip mobility and use dislocation motion to refer climb in edge dislocation and
cross slip in screw dislocation.
Dislocation recovery is one experimental technique to estimate dislocation mobility. In
this technique, a sample containing a certain dislocation density is annealed under hydrostatic
conditions, causing a reduction in dislocation density due to annihilation. The rate constant of
dislocation annihilation should be proportional to the dislocation mobility. The primary
advantage of this technique is that no external stresses, which are many orders of magnitude
higher in deformation experiments than in natural conditions, are applied. Hence, the physical
environment in annealing experiments is more representative of the mantle than those in the
deformation experiments. Another advantage of this method is that it allows much wider
physical and chemical conditions than the deformation experiments, making it possible, for
example, to precisely determine temperature dependence. Strictly speaking, the dislocation
annihilation rate is not identical to the dislocation velocity in dislocation creep, because the
driving force of dislocation annihilation is the internal stress field created by dislocations
themselves, whereas the dislocation motion in dislocation creep is driven by external stresses.
However, we assume that the temperature derivatives over their absolute values are identical
between the dislocation motions by annihilation and the creep. In other words, the activation
energies are identical for these two cases.
The A-, B-, and AG-type fabrics are the most common fabrics in nature and should be
produced by the [100](010) slip system, which is called a-slip in this study, and/or the
[001](010) slip system, which is called c-slip in this study. Therefore, we conducted
dislocation recovery experiments on oriented single crystal olivine deformed producing a-
and c-slips at ambient pressure and temperatures of 1,455 to 1,763 K. The experimental
results obtained in this study provide information on the temperature dependence of
dislocation mobility for the most important olivine slip systems. They also offer insights into
the nature of dislocation motion under low-stress conditions. Although there are many studies
on dislocation recovery of olivine at high temperatures and pressures (Goetze and Kohlstedt,
1973; Kohlstedt et al., 1980; Karato and Ogawa, 1982; Karato et al., 1993; Farla et al., 2011),

81
there is currently no study to compare dislocation annihilation rates and their temperature
dependences between a- and c-slip systems. Therefore, this study provides unique data to
investigate dislocation processes in the upper mantle rheology.
3.3 Experimental Procedures
Sample Preparation
The samples used in this study are single crystals of natural olivine from Pakistan. The
same olivine has been describe by Gose et al., (2010) and the major and trace element,
including water content, of the olivine has been reported there. The b-axis orientation of each
crystal was determined using a Huber single-crystal diffractometer operated by SINGLE2014
(Angel et al. 2011). The oriented olivine crystals were mounted in epoxy resin with the (010)
plane exposed to the surface and then polished using diamond powder with a grain size of 0.25
μm. The [100] and [001] directions were determined via electron backscattered diffraction
(EBSD) in the scanning electron microscope (SEM). Cubes with 1.5 mm edge length were
shaped from the oriented crystal along its crystallographic planes. The orientations of the
crystals were checked again by EBSD after shaping the crystals. For the next step, inclusion-
and crack-free cubes were handpicked under an optical microscope.
Production of high dislocation densities
High dislocation densities with dislocations of either [100] or [001] Burgers vector on the
(010) plane were produced by experimental deformation in a Kawai-type multi-anvil apparatus
at a pressure of 3 GPa and a temperature of 1,600 K. Fig. 1 shows the experimental setup. A
cubic hole was made at the center of an MgO slice to accommodate the cubic olivine crystal in
a unique orientation. The MgO slice with the olivine crystal was sandwiched between two
crushable alumina pistons, cut at an angle of 45º for simple shear deformation of the olivine
single crystal. The shear geometry was in the [100] or [001] direction on the (010) plane for

82
producing dislocations from the a- or c-slips, respectively. The sample and pistons were placed
in a Pt tube, and another two columns of crushable alumina were placed on both ends of the
inner crushable alumina pistons. Tungsten carbide anvils with 17 mm truncated edge lengths
were used to generate high pressure together with a Cr2O3-doped MgO octahedron with a 25
mm edge length as a pressure medium. The furnace comprises a stepped cylindrical graphite
heater and a ZrO2 thermal insulator. Sample pressures were estimated from the hydraulic oil
pressure based on calibrations using the phase transitions of Bi and Mg2SiO4 polymorphs.
Temperatures were measured using a W97%Re3%-W75%Re25% thermocouple whose
junction was located near the end of one of the alumina pistons.
Figure 1. The sample assembly used in the multi-anvil high-pressure deformation experiments.
The cell assembly was first pressurized to 3 GPa using a press load of 3.7 MN at
ambient temperature for 2 hours. The temperature was then increased to 1,600 K for 15 min.
The target temperature and press load were kept constant for 15 min to sinter the crushable
alumina. The sample was then further compressed to a press load of 3.9 MN for 15 min to
deform the sample. After deformation, the sample was quenched by switching off the heating
power, and then decompressed to ambient pressure for more than 16 hours.
After decompression, the pressure medium with the sample was polished to expose
the (010) plane of the olivine crystal to examine the deviation of the crystallographic
orientation from the shear direction via EBSD. The shear direction was determined using the

83
long axis of the MgO slice. The deviations were found to be less than 3º (Fig. 2).
Figure 2. Relations between the crystallographic orientation and shear direction for (a)
a-deformed olivine and (b) c-deformed olivine. The red arrows show the shear direction. The
deviations in crystallographic orientation from the shear directions are less than 3º.
Dislocation annihilation by annealing
Each deformed olivine crystal was cut into eight cubic pieces. At early stages of this
study, one of them was used to determine the initial dislocation density and the others were
used for annealing experiments. Later, in order to minimize the uncertainty in annihilation rate
constant caused by heterogeneous distribution of initial dislocations, four pairs were made
from the eight pieces, where each piece shared a common (001) plane. One piece from each
pair was used to determine the initial dislocation density, while the other was used to determine
it after the annealing. The annealing experiment was conducted at ambient pressure and
temperatures of 1,460-1,760 K for 20 min to 24.5 hours using a gas mixing furnace. Oxygen
partial pressure was controlled at 10-6-10-8 MPa, which was near the Ni-NiO buffer, using a
CO-CO2 gas mixture. Table 1 summarizes the conditions of the annealing experiment.
84
Measurement of dislocation density
Dislocations were observed using the oxidation decoration technique (Kohlstedt et al.,
1976; Karato, 1987). For this method, the samples were first heated at a temperature of 1,170 K
for 1 hour in air to oxidize dislocations. The sample surface was subsequently polished using
0.25 μm diamond powder to remove the surface Fe-oxide layer, and then observed in
back-scattered electron images (BEI) by SEM at around 10 mm working distance, accelerating
voltage of 10 kV, and aperture of 120 μm. Dislocations appeared as bright spots or lines by
concentration of ferric iron produced by the oxidation in dislocation cores. For the paired
sample, the corresponding areas in the initial and annealed pieces were observed to determine
change in dislocation density caused by the annealing. We counted the [100](010) edge
dislocations and [001](010) screw dislocations in a- and c-slip sample, respectively on (001)
plane. On this plane, these dislocations intersect orthogonally and appear as dot contrast. The
dislocation density was calculated from the number of intersecting dislocations per area
following Karato et al. (1993). This method allows us to avoid the geometrical complications
of dislocation density measurements taken as cumulative line lengths per unit volume. The
number of dots was determined using ImageJ image processing software
(http://rsbweb.nih.gov/ij/). We applied a contrast threshold and then automatically counted the
number of particles/dislocations per area. If the raw images were not sharp enough for the
software to identify the dislocations as individual particles, we manually counted the number
of dislocations.
TEM observation
In order to identify the nature of the dislocations produced by a- and c-slips, two
additional deformation runs were conducted (Z1031 and Z1054), and analyzed via
transmission electron microscopy (TEM). The samples were double side polished with
thicknesses ranging from 23 to 35 μm and fixed on glass slides. After removing the selected
olivine grains from the glass slide, an Ar ion-milling method was used to make the sample

85
thinner, using 4.5-5 kV voltages, 4-8º angles from top and bottom ion-bombardment, and total
thinning times varying between 14 to 25 hours depending on the thicknesses and size of each
sample. TEM observations were performed using Philips CM20FEG TEM, operating at 200 kV.
Dislocation microstructures were examined by dark field (DF, Bragg condition, deviation
parameter, s = 0) and weak-beam dark field (WBDF, s > 0) imaging and selected area electron
diffraction (SAED).We chose diffraction vectors with g = 400 and 004 to observe dislocations
with Burgers vectors b = [100] and [001] on the (010) plane, respectively. When g∙b = integer,
dislocations are visible by diffraction contrast.
Data reduction
Because dislocation annihilation should occur through coalescence of two
dislocations with opposite signs, the dislocation annihilation rate is expected to be proportional
to the dislocation density squared (Li, 1966; Toriumi and Karato, 1978). The fundamental
equation for the dislocation annihilation is therefore:
𝑑𝑑𝑑𝑑𝑑𝑑𝑒𝑒
= −𝑘𝑘 · ρ2 (1)
where ρ is the dislocation density, dρ/dt is annihilation rate, k is the annihilation rate constant.
By solving this equation, we have
𝑘𝑘 =1𝜌𝜌𝑓𝑓− 1𝜌𝜌𝑖𝑖
𝑒𝑒, (2)
where 𝜌𝜌𝑠𝑠 and 𝜌𝜌𝑒𝑒 are the dislocation density after and before annealing, respectively, and t is
the annealing time. Because of the thermally activated process, the dislocation annihilation rate
constant follows an Arrhenius relationship:
𝑘𝑘 = 𝑘𝑘0exp (− 𝛽𝛽 𝑅𝑅𝑇𝑇
) (3)
where k0 is a constant, E is the activation energy of the dislocation annihilation, 𝑇𝑇 is the
temperature, and 𝑅𝑅 is the gas constant. As mentioned previously, 𝐸𝐸 is also considered
identical to the activation energy of the dislocation climb/cross slip.

86
3.4 Results
Table 1 shows the experimental results together with the annealing conditions. Figure 3
shows BEIs of the decorated dislocations after deformation and before annealing. These
images show that dislocations appear mainly as dots on the (001) plane and mainly as lines on
the (100) plane in both slip directions. That is, the dislocation lines are elongated in the [001]
direction in both slip systems. For this reason, the dislocation densities are counted using the
images on the (001) plane in both kinds of samples. Because the slip directions are [100] and
[001] in the a- and c-slips, respectively, the dislocations produced by these slip systems should
be [100] edge and [001] screw dislocations, respectively. Hereafter, the dislocations produced
by the a- and c-slips are called a- and c-dislocations, respectively.
Figure 3. BEIs showing the initial dislocation structures. The crystallographic axes are shown
by arrows in b) and d). a) a-deformed sample on the (001) plane. b) a-deformed sample on the
(100) plane. c) c-deformed sample on the (001) plane. d) c-deformed sample on the (100)
plane.
a b
c d
c
b
c
b
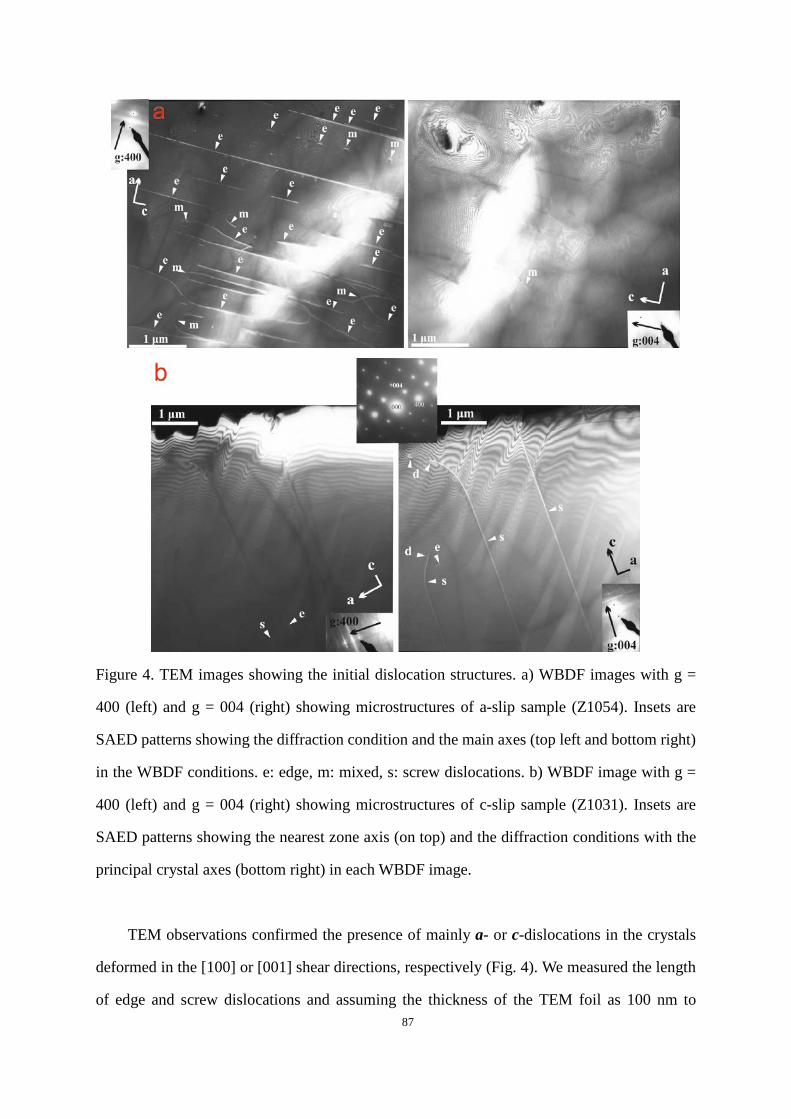
87
Figure 4. TEM images showing the initial dislocation structures. a) WBDF images with g =
400 (left) and g = 004 (right) showing microstructures of a-slip sample (Z1054). Insets are
SAED patterns showing the diffraction condition and the main axes (top left and bottom right)
in the WBDF conditions. e: edge, m: mixed, s: screw dislocations. b) WBDF image with g =
400 (left) and g = 004 (right) showing microstructures of c-slip sample (Z1031). Insets are
SAED patterns showing the nearest zone axis (on top) and the diffraction conditions with the
principal crystal axes (bottom right) in each WBDF image.
TEM observations confirmed the presence of mainly a- or c-dislocations in the crystals
deformed in the [100] or [001] shear directions, respectively (Fig. 4). We measured the length
of edge and screw dislocations and assuming the thickness of the TEM foil as 100 nm to

88
calculate the dislocation density. We also use Ham’s (1961) method to measure the density of
edge and screw dislocation. For the a-slip sample (Z1054), 93% of the dislocations were found
to have Burgers vector in the [100] direction, 74% of which were edge dislocations (Fig. 4b)
with the dislocation density as 1.4μm-2 (using total length of the edge dislocation divided by
volume) and 1.6μm-2 (using Ham, 1961 method) ). For the c-slip sample (Z1031), 94% of the
dislocations were found to have Burgers vector of [001], 57% of which were screw dislocations
(Fig. 4a), with the dislocation density as 0.12 μm-2 (using total length of the screw dislocation
divided by volume) and 0.26 μm-2 (using Ham, 1961 method).
The water content of olivine after deformation is below the detection limit by infrared
spectroscopy. We didn’t determine the water content after annealing, expecting it is nearly
zeros since the annealing was held at room pressure and high temperature.
Fig. 5 shows the decorated dislocations after annealing. The decrease in dislocation
density and formation of dislocation arrays were observed after annealing (Fig 5a). Changes in
dislocation density in areas away from the dislocation arrays were measured to prevent the
formation of the dislocation arrays from influencing the dislocation annihilation. The curved
dislocation structures after annealing suggest that dislocation climb occurred during recovery
for edge dislocations (Fig. 5b). The bent dislocation lines (Fig. 5c) indicate that cross slip
occurred during recovery of screw dislocations.
Figure 6 plots the logarithmic of rate constant of dislocation annihilation against the
reciprocal temperature. The results from the previous dislocation recovery experiments on
olivine single crystal are also plotted in this figure. The dislocation annihilation rate constant of
a-dislocations and c-dislocations are comparable, but those for the c-dislocations are half an
order of magnitude higher than those for the a-dislocations. The temperature dependences of
the dislocation annihilation rate constants for the a- and c-dislocations are identical. The
activation energies calculated for the dislocation annihilation rate constant, which in this study
are considered identical to those of the dislocation mobility, are 𝐸𝐸𝑒𝑒 = 400 ± 20 and
𝐸𝐸𝑒𝑒 = 400 ± 30 kJ/mol for a- and c-dislocations, respectively.

89
Table 1. Summary of experiment results.
* The experimental runs from which one of the deformed piece was used to determine the
initial dislocation density while others used to determine the dislocation density after
annealing. # The experimental runs from which one a pair of deforemd pieces with common (001) plane
were used to determine intitial and annealed dislocation density. Explaination see text.
[100](010) edge dislocation
Sample T
(K)
Annealing
time (h)
log( 𝒇𝒇𝑶𝑶𝟐𝟐 , 10-5
Pa)
𝝆𝝆𝒊𝒊 (μm-2) 𝝆𝝆𝒇𝒇 (μm-2) log(k, m2s-1)
Z1238-1# 1763 0.4 -4.9 0.23±0.08 0.15±0.01 -14.8±0.3
Z997-1* 1748 0.3 -4.9 2.13±0.25 0.79±0.19 -15.2±0.2
Z1238-2# 1673 2.5 -5.7 0.19±0.03 0.15±0.03 -15.8±0.5
Z1238-3# 1573 11.5 -6.6 0.21±0.05 0.17±0.04 -16.5±0.7
Z997-2* 1553 1.3 -6.6 2.13±0.25 1.81±0.15 -16.8±0.4
Z997-3* 1455 24.5 -7.7 2.13±0.25 1.17±0.05 -17.4±0.1
[001](010) screw dislocation
Sample T
(K)
Annealing
time (h)
log(𝒇𝒇𝑶𝑶𝟐𝟐, 10-5 Pa) 𝝆𝝆𝒊𝒊 (μm-2) 𝝆𝝆𝒇𝒇 (μm-2) log(k, m2s-1)
Z1240-1# 1763 0.4 -4.9 0.19±0.06 0.08±0.02 -14.3±0.2
Z1005-1* 1748 0.5 -4.9 0.76±0.07 0.15±0.04 -14.6±0.1
Z1240-2# 1673 2.5 -5.7 0.36±0.18 0.07±0.02 -14.9±0.1
Z1005-2* 1648 3 -5.7 0.76±0.07 0.10±0.04 -15.1±0.2
Z1240-3# 1573 11.5 -6.6 0.31±0.06 0.12±0.03 -15.9±0.2
Z1240-4# 1473 25 -7.7 0.31±0.19 0.21±0.03 -16.8±0.6
Z1005-3* 1455 24 -6.6 0.76±0.07 0.33±0.07 -16.7±0.2

90
Figure 5. BEIs showing the dislocation structures after annealing. a) a-deformed sample
annealed at 1,748 K for 20 min on the (001) plane. Alignment of edge dislocations occurred. b)
a-deformed sample annealed at 1,400 ºC for 20 min observed on the (100) plane. Larger arrows
indicate curved dislocation and dislocation loop. The crystallographic axes are shown by
smaller arrows in b). c) c-deformed sample annealed at 1,490 ºC for 25 min observed on the
(100) plane. The arrow points to a bent dislocation line indicating cross slip occurred during
annealing. The crystallographic axes are shown.

91
Figure 6. Logarithmic dislocation annihilation rate constant of a- and c-dislocations (red
diamonds and blue squares, respectively) versus the reciprocal temperature. No transition
between a- and c-slip dislocation mobility occurs. Black circles: Kohlstedt et al. (1980); brown
squares: Karato and Ogawa (1982); violet triangles: Karato et al. (1992).
3.5 Discussion
Comparison with previous studies
Karato and Ogawa (1982) obtained an activation energy of 400 ± 60 kJ/mol for the
dislocation annihilation rate constant. This value is reproduced in this study. The experiment by
Kohlstedt et al. (1980) gave an activation energy of 300 ± 15 kJ/mol for the annihilation rate
constant of natural and deformed olivine single crystal. However, we notice that the
temperature range in Kohlstedt et al. (1980) was only 150 K. Karato et al. (1993) studied the
pressure dependence of dislocation mobility, in which they adopted a similar activation energy
(290 kJ/mol) to correct the difference in temperature conditions for their data points. Farla et al.
(2011) gave an activation energy of 355 ± 81 kJ/mol for annihilation rate constant on San
Carlos olivine polycrystals, which also agree to the present results within the margin of error.
The rate constants of a-dislocations from this study are comparable with those from

92
Karato et al. (1993), which used the same technique to study the recovery of a-dislocations.
The results from Kohlstedt et al. (1980) and Karato and Ogawa (1982) are similar to or slightly
higher than the rate constants of c-dislocations in this study. Although the dislocation
characters were not characterized in these studies, both a- and c-dislocations should be present
because their samples were deformed in the [101]c direction. Therefore, the values of previous
single crystal work should reflect the average rate constant for both slip systems. The
somewhat larger rate constants may be due to the different techniques employed to observe
dislocations in their studies (TEM by Kohlstedt, 1980, optical microscopy by Karato and
Ogawa 1982). The TEM method is restricted by the limited sampling area, which cannot give a
statistical average when calculating dislocation density. Optical microscopy potentially
underestimates dislocation density when it is high, which applies equally to the initial and
annealed dislocation densities, resulting in a lower annihilation rate constant through Eq. 2
(Farla et al., 2011). The rate constants obtained from polycrystalline olivine by Farla et al.
(2011) are two orders of magnitude lower than those in this study. This might be due to pinning
the dislocation on grain boundaries and tangling dislocations of different types in their
experiments.
The olivine single crystal starting material used in this study is not mantle origin and the
trace element abundance is somewhat different from mantle derived olivine (Gose et al., 2010).
However, the similar annihilation rate constant of our study and Karato et al, 1993 (See our
Fig.6 ) indicate dislocation interactions and annihilation, which is defect assisted, does not
change significantly between Pakistan olivine and San Carlos olivine. In addition, the water
content after deformation is below the detect limit of infrared spectrometry. Therefore, we do
not think the composition difference between the olivine we used and mantle derived olivine
alter the results.
Comparison of results with other techniques
The microstructures of dislocation after annealing indicate climb occurred for edge
dislocation and cross slip occurred for screw dislocation. In addition, since they are the slower

93
process compared to dislocation glide, we think the activation energy we obtain for
annihilation represent that of dislocation climb for a-dislocation and cross slip for c-dislocation.
The activation energies obtained in this study are identical to that for the Si self-diffusion given
by Fei et al. (2012) (410 ± 30 kJ/mol), within the margin of error. The identical activation
energies for dislocation mobility and Si diffusion suggest that the dislocation climb in edge
dislocation and cross slip in screw dislocation in dislocation recovery are controlled by Si
self-diffusion. The identical activation energies for both a- and c-dislocations also support this
idea.
In contrast, deformation experiments on dry polycrystalline olivine typically yield
higher activation energies, namely about 500 kJ/mol (Goetze, 1978; Karato and Jung, 2003;
Hirth and Kohlstedt, 2003), than those of dislocation mobility (this study; Kohlstedt, 1980;
Karato and Ogawa, 1982; Karato et al., 1993; Farla et al., 2011). This discrepancy suggests that
dislocation creep in the deformation experiments is likely driven by a combination of
mechanisms. The stress levels in the deformation experiment are generally higher, in the order
of 100 MPa to 1 GPa, and the deformation mechanism in such experiments is at the boundary
of Peierls mechanism and the dislocation power law creep (e.g., Jung and Karato, 2001; Karato
and Jung, 2003). Therefore, dislocation glide should be a significant component in the
deformation experiments, but not in the dislocation recovery experiments.
Geophysics application
Whether temperature can cause the fabric transition between A- and B- type is determined
by the activation energy of creep caused by a-dislocation and c-dislocation, which are
constrained by the rate limiting process of a- and c-dislocation movement, i.e. climb or
cross-slip. We found the same activation energy for the annihilation rate of a- and c-dislocation
and think they represent the activation energy of dislocation climb and cross slip for a- and
c-dislocations. Therefore, the fabric transition between A- and B-type cannot be caused by
temperature.
94
In order to investigate the strain rate caused by a- and c-dislocations, we need to know the
relationship between the dislocation climb (cross slip) velocity and the average dislocation
velocity. The function of force (f(force)) which acting on the dislocation per unit length is also
need to link the dislocation climb (cross slip) mobility (k), which is investigated in this study,
and climb (cross slip) velocity (v), since
𝑣𝑣 = 𝑘𝑘 ∙ 𝐵𝐵(𝐵𝐵𝑐𝑐𝜋𝜋𝑐𝑐𝑒𝑒) (4)
Recent work on simulation of dislocation movement in olivine (Boioli et al, 2015)
suggested a constant ratio between dislocation glide velocity and average mobile dislocation
velocity. However, we noticed that at low stress condition (less than 5 MPa in their Fig. 9), their
average mobile dislocation velocity is nearly the same as climb velocity. Therefore, we can use
dislocation climb velocity to represent average mobile dislocation velocity at low stress
conditions when climb is the rate limiting process for creep. If we assume that dislocation cross
slip velocity is also similar to the average mobile dislocation velocity at low stress conditions
when cross slip is the rate limiting process for creep, and the force function is the same for
climb and cross slip process, the strain rate produced by a- and c-dislocation would be same.
Therefore, at such conditions, we can use our result to infer the creep caused by a- and
c-dislocations at low stress conditions. Here, we emphasize that only when the two
assumptions are met, 1) dislocation cross slip velocity is similar to the average mobile
dislocation velocity at low stress conditions when cross slip is the rate limiting process for
creep. 2) The force functions are the same for climb and cross slip are the same, can we use our
result to infer the strain rate caused by these two slip systems.
In low-stress regions, such as oceanic mantle (0.1 to 1 MPa, Hirth and Kohlstedt, 2003),
we assume that the two assumptions mentioned above are met and then the strain rate caused
by a- and c-slips should be comparable mobile in the deformation of olivine in oceanic mantle
and, accordingly, the AG-type fabric could dominate. Indeed, some natural mantle rocks, such
as olivine from the Hilti mantle section (Michibayashi & Mainprice, 2004) and olivine from the

95
Pannonian Basin (Hidas et al., 2007), show AG-fabric. Recently, Tommasi and Vauchez
compiled the LPOs of natural olivine and showed a considerable amount of AG-fabric
(Tommasi and Vauchez, 2015). This further confirms the existence of the AG-type fabric. Such
fabric could be formed by the non-coaxial flow in the lithospheric mantle, close to Moho (Hilti
mantle section after Michibayashi and Mainprice, 2004) or at the fossil
lithospheric-asthenospheric boundary (Pannonian Basin, Hidas et al., 2007) or related to the
type of strain (Higgins and Tommasi ,2012). The present results, however, provide a new
insight to the formation of AG-type, i.e. it is due to the comparable dislocation mobility in the
a- and c-slips at low stresses.
The dominance of AG-type fabric in the oceanic asthenosphere is also suggested by the
seismic studies. The oceanic asthenosphere is not only characterized by azimuthal S wave
anisotropy but also by stronger P wave and S wave radial anisotropy (e.g. Gung et al., 2003;
Nettles and Dziewonski, 2008). However, none of the fabric shown in deformation experiment
reproduces the comparably stronger radial anisotropy than azimuthal anisotropy (Song and
Kawakatsu, 2012). Instead, the AG type olivine fabric can produce such character since the
strong aliment of [010] axis and the diffusive distribution of [100] and [001] axis in the (010)
plane. Assuming the elastic tensor of orthorhombic symmetry in the subdcting oceanic
asthenosphere, which can be produced by AG-type olivine fabric, the SKS splitting patterns
across the fore-arc in central Alaska are well explained (Song and Kawakatsu, 2013). Although
existing of horizontal melt layer in asthenosphere could enhance the radial anisotropy (e.g.
Kawakatsu et al, 2009), these layer might solidify during subduction. Therefore, AG-type
olivine fabric might be a potential candidate to explain the seismic anisotropy in the oceanic
asthenosphere.
In high stress region, such as lithosphere and convergent boundaries, the average mobile
dislocation velocity deviates a lot from dislocation climb velocity (Boioli et al., 2015) and we
cannot use dislocation climb (cross-slip) velocity to represent average mobile dislocation
velocity dislocation. Since glide contributes considerably to deformation, as in the deformation
experiments, A- and B-type fabrics form.

96
The change from A- or B-type fabric to AG-type fabric with decreasing stress may
provide a new explanation for the decrease in seismic anisotropy with depth. AG-type fabric
produces weaker seismic anisotropy than A- or B-type fabric. Olivine has the highest P-wave
velocity in the a-direction. For S waves, the highest velocity occurs when oscillation is in the
a-direction. Therefore, A- or B-type fabric should produce strong P-wave azimuthal anisotropy.
On the other hand, the AG-type fabric produces no or weak P-wave azimuthal anisotropy,
because the direction of the a-axis is not concentrated, but distributed on the flow plane. A
similar situation exists for S-wave anisotropy. Therefore, the decrease in seismic anisotropy
with depth in the upper mantle down to 300 km depth might be caused by transition of olivine
from A- or B-type to AG-type, due to decrease in stress with depth.
Finally, we must emphasize that our explanation about the origin of AG-type fabric is
based on the two assumptions mentioned above, which need to be tested in the future. In
addition, our result is based on the experiments conducted on the single crystal. The results
might change in the case of polycrystalline material, which dislocation mobility might be
influenced by grain boundary.
3.6 Conclusion
The present study shows that the dislocation annihilation rates for the [100](010) edge
dislocation are slightly smaller than those for the [001](010) screw dislocation. The
temperature dependences of climb in [100] edge dislocation and cross slip in [001] screw
dislocations are identical: their activation energies are both 400 kJ/mol. Therefore, fabric
transition due to temperature is unlikely. The identical activation energies of dislocation
movement and Si self-diffusion suggest that the dislocation climb/cross slip is controlled by Si
diffusion. The discrepancy between the activation energies for the deformation experiment and
recovery experiment may be due to high stresses in deformation experiments. Under certain
assumptions, we can use our result to infer the creep caused by a- and c-dislocations at low
stress conditions. If so, under low-stress conditions, like the oceanic mantle, the AG-type fabric
may dominate, while A- or B-type fabric forms under high-stress conditions, like the

97
lithosphere and convergent boundaries. The transition from A- or B-type fabric to AG-type
fabric with decreasing stress may be the reason for the decrease in seismic anisotropy with
depth.
3.7 Acknowledgements
We acknowledge F. Heidelbach and P. O’Brien for providing the olivine single crystals
and T. Boffa-Ballaran for instructing the single crystal X-ray diffractometry. We thank
technicians in BGI for the sample and assembly preparation. This research was supported by
DFG grants to TK (KA3434/3-1, KA3434/7-1, KA3434/8-1 and KA3434/9-1) and by the
annual budget of BGI.
3.8 References
Angel, R. J., and L. W. Finger (2011), SINGLE: A program to control single-crystal
diffractometers, Journal of Applied Crystallography, 44(1), 247-251.
Ben Ismail W., Mainprice D., 1998. An overview of upper mantle fabrics and seismic
anisotropy. Tectonophysics 296, 145–157.
Boioli, F., Carrez, P., Cordier, P., Devincre, B., and Marquille, M. (2015) Modeling the creep
properties of olivine by 2.5-dimensional dislocation dynamics simulations. Physical
Review B, 92(1)
Bussod, G. Y., Katsura, T., and Rubie, D.C., 1993. The large volume multi-anvil press as a high
P-T deformation apparatus. Pure Appl. Geophys., 141,579-599.
Dobrzhinetskaya, L., Green II, H. W., & Wang, S. (1996). Alpe Arami: a peridotite massif from
depths of more than 300 kilometers. Science, 271(5257), 1841.
Dziewonski, A. M., & Anderson, D. L. 1981. Preliminary reference Earth model. Physics of
the earth and planetary interiors, 25(4), 297-356.
Farla, R.J.M., Kokkonen, H.K., Fitz Gerald, J.D., Barnhoorn, A., Faul, U.H., Jackson, J., 2011.
Dislocation recovery in fine-grained polycrystalline olivine. Phys. Chem. Minerals. 38,

98
363-377.
Fei, H., Hegoda, C., Yamazaki, D., Wiedenbeck, M., Yurimoto, H., Shcheka, S., Katsura, T.,
2012. High silicon self-diffusion coefficient in dry forsterite. Earth Planet. Sci. Lett. 345,
95-103.
Goetze, C., 1978. Mechanisms of creep in olivine. Philos Trans R Soc Lond 288(1350),
99-119.
Goetze, G., Kohlstedt, D.L., 1973. Laboratory Study of Dislocation Climb and Diffusion in
Olivine. J. Geophys. Res. 78, 5962-5970.
Goetze, C., & Poirier, J. P. 1978. The mechanisms of creep in olivine and discussion.
Philosophical Transactions of the Royal Society of London. Series A, Mathematical and
Physical Sciences, 288(1350), 99-119.
Gung, Y., Panning, M., & Romanowicz, B. 2003. Global anisotropy and the thickness of
continents. Nature, 422(6933), 707-711
Ham, R. K. 1961. The determination of dislocation densities in thin films. Philosophical
Magazine, 6(69), 1183-1184.
Hidas, K., Falus, Gy., Szabó, Cs., Szabó, P. J., Kovács, I. & Földes, T. 2007. Geodynamic
implications of flattened tabular equigranular textured peridotites from the
Bakony-Balaton Highland Volcanic Field (Western Hungary). Journal of Geodynamics,
43 (4-5), 484-503.
Higgie, K., & Tommasi, A. 2012. Feedbacks between deformation and melt distribution in the
crust–mantle transition zone of the Oman ophiolite. Earth and Planetary Science Letters,
359, 61-72.
Holtzman, B. K., Kohlstedt, D. L., Zimmerman, M. E., Heidelbach, F., Hiraga, T., & Hustoft, J.
2003. Melt segregation and strain partitioning: implications for seismic anisotropy and
mantle flow. Science, 301(5637), 1227-1230.
Houlier, B., Cheraghmakani, M., & Jaoul, O. (1990). Silicon diffusion in San Carlos olivine.
Physics of the Earth and Planetary Interiors, 62(3), 329-340.
Jung, H., & Karato, S. I. 2001. Water-induced fabric transitions in olivine. Science, 293(5534),

99
1460-1463.
Jung, H., Katayama, I., Jiang, Z., Hiraga, T., & Karato, S. I. 2006. Effect of water and stress on
the lattice-preferred orientation of olivine. Tectonophysics, 421(1), 1-22.
Jaoul, O., Poumellec, M., Froidevaux, C., & Havette, A. (1981). Silicon diffusion in forsterite:
a new constraint for understanding mantle deformation. Anelasticity in the Earth, 95-100.
Karato, S., 1987. Scanning electron microscope observation of dislocations in olivine. Phys.
Chem. Miner. 14, 245–248.
Karato, S., 2008. Deformation of Earth Materials: Introduction to the Rheology of the Solid
Earth. Cambridge, UK: Cambridge Univ. Press. 462 pp.
Karato, S., Jung, H., Katayama, I., Skemer, P., 2008. Geodynamic significance of seismic
anisotropy of the upper mantle: new insights from laboratory studies. Annu. Rev. Earth
Planet. Sci. 36, 59-95.
Karato, S., Rubie, D.C.,Yan, H.,1993. Dislocation recovery in olivine under deep upper mantle
conditions: Implications for creep and diffusion. J. Geophys. Res. 98, 9761-9768.
Karato, S., Sato, H., 1982. Effect of oxygen partial-pressure on the dislocation recovery in
olivine-a new constraint on creep mechanisms. Phys Earth Planet Inter 28, 312–319.
Karato, S., Wu, P., 1993. Rheology of the upper mantle: a synthesis. Science 260, 771–775.
Karato S., Ogawa M., 1982. High-pressure recovery of olivine: implications for creep
mechanisms and creep activation volume. Phys. Earth. Planet Inter. 28,102–117.
Katayama, I., Jung, H., & Karato, S. I. 2004. New type of olivine fabric from deformation
experiments at modest water content and low stress. Geology, 32(12), 1045-1048.
Kawakatsu, H., Kumar, P., Takei, Y., Shinohara, M., Kanazawa, T., Araki, E., & Suyehiro, K.
2009. Seismic evidence for sharp lithosphere-asthenosphere boundaries of oceanic plates.
Science, 324(5926), 499-502.
Kohlstedt, D. L., Nichols, H. P. K., & Hornack, P. 1980. The effect of pressure on the rate of
dislocation recovery in olivine. Journal of Geophysical Research: Solid Earth (1978–
2012), 85(B6), 3122-3130.
Kohlstedt, D.L., Evans, B., Mackwell, S.J., 1995. Strength of the lithosphere: constraints

100
imposed by laboratory experiments. J. Geophys. Res. 100, 17587–17602.
Kohlstedt, D. L., & Goetze, C. (1974). Low-stress high-temperature creep in olivine single
crystals. J. geophys. Res, 79(14), 2045-2051.
Kohlstedt, D.L., Goetze, C., Durham, W.B., Vandersande, J., 1976. New technique for
decorating dislocations in olivine. Science. 191, 1045–1046.
Kohlstedt, D.L., Nichols, H.P.K., Hornack, P., 1980. The effect of pressure on the rate of
dislocation recovery in olivine. J.Geophys. Res. 85, 3122-3130.
Li, J.C.M., 1966. Recovery processes in metals, In: Recrystallization, Grain Growth and
Textures. Am. Sot. Metals: 45-63.
Mainprice, D. 2007. Seismic anisotropy of the deep Earth froma mineral and rock physics
perspective. In: Schubert, G. (ed.) Treatise on Geophysics. Oxford: Elsevier, pp. 437–492.
Michibayashi, K., Mainprice, D., 2004. The role of pre-existing mechanical anisotropy on
shear zone development within oceanic mantle lithosphere: an example from the Oman
ophiolite, J. Petrol. 45 (2), 405-414.
Mizukami, T., Wallis, S. R., & Yamamoto, J. (2004). Natural examples of olivine lattice
preferred orientation patterns with a flow-normal a-axis maximum. Nature, 427(6973),
432-436.
Montagner, J. P., & Kennett, B. L. N. 1996. How to reconcile body-wave and normal-mode
reference Earth models. Geophysical Journal International, 125(1), 229-248.
Nettles, M., & Dziewoński, A. M. 2008. Radially anisotropic shear velocity structure of the
upper mantle globally and beneath North America. Journal of Geophysical Research:
Solid Earth (1978–2012), 113(B2).
Nicolas, A., Bouchez, J.L., Boudier, F., Mercier, J-CC., 1971. Textures, structures and fabrics
due to solid state flow in some European lherzolites. Tectonophyiscs 12, 55-86.
Ohuchi, T., Kawazoe, T., Nishihara, Y., Nishiyama, N., & Irifune, T. 2011. High pressure and
temperature fabric transitions in olivine and variations in upper mantle seismic anisotropy.
Earth and Planetary Science Letters, 304(1), 55-63.
Poirier, J. P., & Vergobbi, B. 1978. Splitting of dislocations in olivine, cross slip-controlled

101
creep and mantle rheology. Physics of the Earth and Planetary Interiors, 16(4), 370-378.
Ringwood, A.E., 1991. Phase-transformations and their bearing on the constitution and
dynamics of the mantle.Geochim.Cosmochim. Ac 55 (8), 2083-2110.
Satsukawa, T., Michibayashi, K., Anthony, E. Y., Stern, R. J., Gao, S. S., & Liu, K. H. 2011.
Seismic anisotropy of the uppermost mantle beneath the Rio Grande rift: Evidence from
Kilbourne Hole peridotite xenoliths, New Mexico. Earth and Planetary Science Letters,
311(1), 172-181.
Skemer, P., Katayama, I., & Karato, S. I. (2006). Deformation fabrics of the Cima di Gagnone
peridotite massif, Central Alps, Switzerland: evidence of deformation at low temperatures
in the presence of water. Contributions to Mineralogy and Petrology, 152(1), 43-51.
Song, T. R. A., & Kawakatsu, H. 2012. Subduction of oceanic asthenosphere: Evidence from
sub‐slab seismic anisotropy. Geophysical Research Letters, 39(17).
Song, T. R. A., & Kawakatsu, H. 2013. Subduction of oceanic asthenosphere: A critical
appraisal in central Alaska. Earth and Planetary Science Letters, 367, 82-94.
Tommasi, A., & Vauchez, A. 2015. Heterogeneity and anisotropy in the lithospheric mantle.
Tectonophysics.
Toriumi, M., & Karato, S. I. 1978. Experimental studies on the recovery process of deformed
olivines and the mechanical state of the upper mantle. Tectonophysics, 49(1), 79-95.
Zhang, S., & Karato, S. I. 1995. Lattice preferred orientation of olivine aggregates deformed in
simple shear. Nature, 375(6534), 774-777

102
4. Identical activation volumes of dislocation
mobility in the [100](010) and [001](010) slip
systems in natural olivine
Lin Wang*, Stephan Blaha, Takaaki Kawazoe, Nobuyoshi Miyajima and Tomoo Katsura
Bayerisches Geoinstitut, University of Bayreuth, 95440 Bayreuth, Germany.
4.1 Abstract
Dislocation recovery experiments were performed on pre-deformed olivine single crystals
at pressures of 2, 7 and 12 GPa and a constant temperature of 1650 K to determine the pressure
dependence of the annihilation rate constants for [100](010) edge dislocation (a-dislocation)
and [001](010) screw dislocation (c-dislocation). The constants of both types of dislocations
are comparable within 0.3 orders of magnitude. The activation volumes of a- and
c-dislocations are small and identical within error: 2.7 ± 0.2 and 2.5 ± 0.9 cm3/mol,
respectively. These values are slightly larger and smaller than those of Si lattice and
grain-boundary diffusions in olivine, respectively. The small and identical activation volumes
for the a- and c-dislocations suggest that the pressure-induced fabric transition is unlikely in
the asthenosphere. The decrease in seismic anisotropy with depth down in the asthenosphere
may be caused by the fabric transition from A-type or B-type to AG-type with decreasing stress
with depth.
4.2 Introduction
A number of seismological studies showed anisotropy in seismic wave velocity in the
Earth’s upper mantle [Dziewonski and Anderson, 1981; Montagner and Kennett, 1996; Gung et
al., 2003; Nettles and Dziewonski, 2008; Visser et al., 2008]. The upper-mantle seismic

103
anisotropy is interpreted by the lattice preferred orientations (LPO) and elastic anisotropy of
olivine [e.g. Karato, 2012]. Some studies [e.g. Gung et al., 2003; Visser et al., 2008] depicted
that the seismic anisotropy quickly decreases with increasing depth down to 300 km. The
origin of this decrease is an issue of debate [e.g. Karato 1992; Mainprice et al., 2005; Raterron
et al., 2009]. Since elastic anisotropy of minerals is essentially independent from physical and
chemical conditions, the decrease in seismic anisotropy should be resulted from weakening or
change in LPO patterns (i.e. fabric transition).
Formation of LPO is a consequence of movement of dislocations of the dominant slip
system(s) in dislocation creep. Therefore, if the decrease in seismic anisotropy with depth is
caused by the change in LPO pattern, the dominant slip system should change with pressure.
Several deformation experiments [Couvy et al., 2004; Raterron et al., 2007, 2009; Jung et al.,
2009; Raterron et al., 2011; Ohuchi et al., 2011] showed that, although the tranistion pressure is
under debate, the olivine fabric changes from A-type to B-type with increasing pressure. .
These results imply that the dominant slip system would change from [100](010) to [001](010),
which are hereafter called a- and c-slips, respectively, with depth. These articles explained the
decrease in seismic anisotropy by this fabric transition. However, further investigation is
necessary to verify this hypothesis because the stress magnitude in their deformation
experiments are by many orders of magnitude higher than that in asthenospheric conditions
[Hirth and Kohlstedt, 2003], which may change the rate-limiting process of dislocation creep
[Wang et al., 2016].
Our previous study [Wang et al., 2016] provided a different explanation. We reported
identical dislocation mobility between a- and c-dislocations in the recovery process in olivine
along elevating temperatures at an ambient pressure. The result indicates that there is no clear
dominance between these two slip systems under low-stress conditions. Based on these
observations, we proposed a new hypothesis that the decrease in seismic anisotropy by the
fabric transition from A- or B-type to AG-type with decreasing stress.
If the dislocation mobility of a- and c-slips has strong and different pressure dependence,
Wang et al.’s [2016] hypothesis for the origin of the decrease in seismic anisotropy should be

104
reconsidered. Therefore, the pressure dependence of dislocation mobility of the a- and c-slip
systems must be investigated. In this study, we conducted dislocation recovery experiments for
a- and c-dislocations at various pressures and a constant temperature by a similar method to
that of Wang et al. [2016] and determined the activations volumes of the annihilation rate
constants for these two dislocations. As was the case in Wang et al. [2016], it is assumed that
the average dislocation velocity is proportional to the dislocation mobility, which is
proportional to the dislocation annihilation rate constant. Therefore, we can estimate the
pressure dependences of the dislocation average velocity from those of dislocation annihilation
rate constants. Our results show that the activation volumes are small and identical, and
therefore, pressure cannot induce the fabric transition.
4.3 Experimental Procedures
The experimental procedure adopted in this study is similar to that of Wang et al. [2016]
except two differences. One is that annealing was performed at high pressures of 2, 7 and 12
GPa and a constant temperature of 1650 K using a multi-anvil press, whose sample assembly is
shown in Fig. 1. Two olivine single crystals in which a- and c-dislocations were activated
respectively in preceding simple shear deformation experiments were loaded together in a Ni
capsule. The simple shear deformation experiment setup and procedure can be found on Wang
et al. [2016]. The dominance of a- and c-dislocation in the deformed sample were confirmed by
previous study (Wang et al., 2016). The deformed samples were surrounded by a mixture of Ni
and enstatite powders with a volume ratio of 1:1 to produce a quasi-hydrostatic condition and
fix the oxygen fugacity at the Ni-NiO buffer and the SiO2 activity of aopx = 1. In order to test the
effect of cold compression to the dislocation multiplication, we check the dislocation density
increase of an undeformed sample which was cold compressed in the same experimental setup
to 12 GPa. The H2O contents in the samples were measured vertically to the (001) plane by
unpolarized FTIR spectroscopy before and after annealing based on the Paterson’s (1982)
calibration. The other difference is that paired olivine crystals, each of which shared a common
(001) plane, were used to precisely determine change in dislocation density by annealing. One

105
piece from each pair was used to determine the initial dislocation density (as-crept piece),
while the other was used to determine it after annealing (annealed piece). We counted
dislocations in the corresponding areas of the paired as-crept and annealed pieces from the
same group.
Figure 1. The sample assembly used in the multi-anvil high-pressure annealing experiments.
4.4 Results
Table 1 shows experimental results together with the annealing conditions. The
dislocation density of the undeformed olivine cold compressed to 12 GPa is 0.03 μm-2, which is
much smaller than the dislocation density of a- and c-sample after annealing. Therefore, the
effect of cold compression is negligible. Figure 2 shows backscattered electron images (BEI) of
the oxidation-decorated dislocations before and after annealing. We measured water contents
of three samples before and after annealing at 2 and 12 GPa, which are 13 ± 6 wt. ppm. Because
of small difference in water contents between low- and high-pressure annealed samples, the
effects of water on dislocation annihilation are ignored in this study.

106
Table 1. Summary of experimental conditions and results.
* Dislocation density before annealing
** Dislocation density after annealing
# 𝑘𝑘 = 1𝑑𝑑𝑓𝑓− 1
𝑑𝑑𝑖𝑖
Figure 3 plots the logarithm of the annihilation rate constants against pressure. The results
from previous studies about dislocation recovery on olivine single crystals [Kohlstedt et al.,
1980; Karato and Ogawa, 1982; Karato et al., 1993] are also plotted after temperature
[100](010) edge dislocation
Sample P (GPa) Annealing
time (h) area 𝝆𝝆𝒊𝒊* (μm-2) 𝝆𝝆𝒇𝒇** (μm-2) log (k, m2s-1)#
H3998-1 12 23.7 1 0.85±0.25 0.48±0.10 -17.2±0.4
2 2.47±0.41 0.85±0.19 -17.0±0.2
H3998-2 7 10.7 1 1.22±0.29 0.60±0.14 -16.7±0.2
2 0.86±0.30 0.54±0.14 -16.8±0.4
H3998-3 2 5.1 1 0.55±0.10 0.33±0.10 -16.2±0.3
Z1253-1 2 6.0 1 2.28±0.05 0.66±0.15 -16.3±0.1
[001](010) screw dislocation
Sample P (GPa) Annealing
time (h) area 𝝆𝝆𝒊𝒊 (μm-2) 𝝆𝝆𝒇𝒇 (μm-2) log(k, m2s-1)
Z1160-1 12 23.7 1 0.52±0.17 0.24±0.09 -16.6±0.3
2 2.01±0.19 0.67±0.14 -16.9±0.1
Z1160-2
7
10.7
1 0.66±0.07 0.47±0.09 -16.8±0.3
2 0.79±0.11 0.40±0.10 -16.5±0.2
Z1160-3 2 5.1 1 0.70±0.17 0.46±0.10 -16.4±0.3
Z1247-1 2 6 1 0.16±0.03 0.09±0.04 -15.6±0.5
Z1247-2 2 6 1 0.13±0.01 0.10±0.01 -16.0±0.3

107
correction to 1650 K with an activation energy of 400 kJ/mol and activation volume of 2.7
cm3/mol. The annihilation rate constants of a- and c-dislocations are comparable, but those for
the c-dislocations are by 0.3 orders of magnitude higher than those for the a-dislocations. The
activation volumes of dislocation annihilation rate constants in these two slip systems are both
small and identical within the error: 𝑉𝑉𝑒𝑒 = 2.7 ± 0.2 and 𝑉𝑉𝑒𝑒 = 2.5 ± 0.9 cm3/mol for a- and
c-dislocations, respectively.
Figure 2. BEIs showing the dislocation density before and after annealing at 12 GPa for 24 h.
The images were taken on the (001) plane. a) a-slip sample before annealing. b) a-slip sample
after annealing. c) c-slip sample before annealing. d) c-slip sample after annealing. The scale
bar shown represents 2 μm

108
Figure 3. Logarithmic dislocation annihilation rate constants of a- and c-dislocations versus
the pressure. No transition between a- and c-slip dislocation mobility occurs. Together plotted
are the annihilation rate constants from previous studies corrected by activation energy of 400
kJ/mol and activation volume of 2.7 cm3/mol.
4.5 Discussion
Diffusion-controlled dislocation motion in recovery process
The a- and c-dislocations have comparable magnitudes of the annihilation rate constants
and also the identical activation volumes. Wang et al. [2016] also demonstrated that they have
identical activation energies (400 ± 20 and 400 ± 30 kJ/mol, respectively). These observations
indicate that the rate-limiting process of dislocation motion in dislocation recovery process is
isotropic and independent from the dislocation character at low stress. Moreover, the activation
energy and volume of the Si lattice diffusion are 410 ± 30 kJ/mol and 1.7 ± 0.4 cm3/mol,
respectively, in forsterite [Fei et al., 2012], which are identical and comparable to those of the

109
dislocation annihilation rate constants of olivine. Furthermore, Jaoul et al. [1981] demonstrated
that the Si lattice diffusion is isotropic in forsterite. These facts reinforce that the rate-limiting
process of dislocation recovery process is Si diffusion, as already discussed by Wang et al.
[2016].
Comparison with previous studies
The activation volumes obtained in this study are considerably smaller than those by
previous studies, namely 11 ± 1 cm3/mol by Kohlstedt et al. [1980], 14 ± 2 cm3/mol by Karato
and Ogawa [1982], and 6 ± 1 cm3/mol by Karato et al. [1993]. In Kohlstedt et al., [1980] and
Karato and Ogawa [1982], the pressure range is only 0.5 and 2 GPa respectively, which is too
narrow to give accurate activation volume. In Karato et al., [1993], their activation volumes
were obtained by comparing high-pressure data with ambient-pressure ones. The differences in
their experimental setups between high-pressure and ambient-pressure experiments could
cause some discrepancy in obtained values, which might have biased the pressure dependence
in these studies. On the other hand, the annihilation rate constants were obtained in the same
experimental setup over the wide pressure interval of 10 GPa in this study, which allows robust
estimation of the activation volumes. The rate constants of a-dislocation from this study are
slightly higher than the high-pressure data of Karato et al. [1993], which used the same
technique as the present study to investigate the annihilation of a-dislocation. The rate
constants from Kohlstedt et al. [1980] and Karato and Ogawa [1982] are higher than those of
c-dislocation in this study. This may be due to different technique in counting dislocations.
Kohlstedt et al. [1980] conducted TEM observation in restricted sample areas, which made it
difficult to obtain statistical averages when calculating dislocation annihilation rate constant.
Optical microscopy [Karato and Ogawa, 1982] may underestimate dislocation density when it
is high, and was applied equally to obtain both initial and annealed dislocation density, which
could have given higher annihilation rate constants.
110
Comparison with other techniques
Although we argued that the activation volumes of the dislocation annihilation rate
constants in this study are comparable with that of Si self-diffusion given by Fei et al. [2012]
(1.7 ± 0.4 cm3/mol) in forsterite, they are slightly higher. On the other hand, the activation
volume of the Si grain-boundary diffusion in forsterite is 4.0 ± 0.4 cm3/mol [Fei et al., 2016],
which is higher than those of the dislocation annihilation and Si lattice diffusion. The lattice
diffusion, dislocation climb and grain-boundary diffusion are interactions between atoms and
vacancy, dislocation and grain-boundary, respectively. Accordingly, it seems that the activation
volume increases with increasing defect dimension. The higher-dimensional defect should
have more loose structure, which may cause the larger activation volumes.
Deformation experiments on olivine single crystal by Raterron et al. [2009] yielded
different activation volumes for a- and c-slip samples (12 ± 4 and 3 ± 4 cm3/mol, respectively).
This may be due to the large uncertainty of stress conditions in their experiments and fitting the
results from their own high-pressure data and Bai et al.’s [1991] room-pressure data. Although
both studies deformed olivine single crystals in the same orientations, their different
experimental setups may have biased the result. Moreover, since both a- and c-dislocations
elongate in the [001] direction and move in the same directions during glide and
climb/cross-slip, the activation volumes should be identical, as is shown by this study.
Deformation experiments on olivine aggregate [Karato and Rubie, 1997; Karato and Jung,
2003; Kawazoe et al., 2009] showed that the activation volume for olivine creep is larger than
10 cm3/mol. However, the stress conditions in these experiments are about 1 GPa, which is
much higher than those in asthenospheric mantle. Therefore, the mechanism of olivine creep in
such experiments may not be applicable to low-stress conditions [Wang et al., 2016]. Couvy et
al. [2004] suggested that C- or B-type olivine fabric should be dominant at a pressure of 11
GPa and a temperature of 1400 oC. However, we note that their olivine fabrics at high
temperature were developed during stress relaxation from cold compression which produced
dislocations only with the [001] Burgers vector at stresses about 1.5 GPa. Such experiments do

111
not allow to prove dominance of the dislocations with the [001] Burgers vector at 1400 oC and
11 GPa in the low-stress mantle conditions.
Geophysical application
The identical activation volumes of the a- and c-dislocations motion lead to the same
pressure dependence of olivine creep caused by a- and c-dislocations. Therefore, our results
suggest that the pressure-induced LPO transition by these two types of dislocations is unlikely
in asthenospheric mantle, on the assumption that dislocation creep and dislocation recovery are
rate limited by the same physical mechanisms in the low-stress mantle conditions. Moreover,
the small activation volumes suggest that the pressure effects on creep are small. For example,
10 GPa increase of pressure only causes decrease of creep rate by a factor of 5 at 1650 K by
using activation energy of 400 kJ/mol [Wang et al., 2016].
The comparable rate constants, the identical activation energy and volumes [this study
and Wang et al., 2016] of a- and c-dislocation recovery indicate that the rate-limiting process of
these two dislocations have similar mobilities under low-stress conditions. Under such
conditions, the free dislocation velocity should be equal to the velocity of dislocation motion in
the rate-limiting process [Boioli et al., 2015; Wang et al., 2016] and AG-type fabric should be
dominant [Wang et al., 2016]. Therefore, the decrease in seismic anisotropy with depth may be
explained by the olivine LPO transition from A- or B-type to AG-type by decrease in stress
with depth [Wang et al., 2016].
Finally, we note that the effects of water and grain/phase boundary on dislocation mobility
are necessary to be investigated in order to provide a better explanation for the LPO
development in the Earth’s mantle.
4.6 Acknowledgements
The data used are listed in the table 1 and references. We acknowledge F. Heidelbach and
112
P. O’Brien for providing the olivine single crystals and T. Boffa Ballaran for instructing the
single crystal X-ray diffractometry. We thank technical assistance in BGI for the sample and
assembly preparation. This research was supported by DFG grants to TK (KA3434/3-1,
KA3434/7-1, KA3434/8-1 and KA3434/9-1) and by the annual budget of BGI.
4.7 References
Boioli, F., P. Carrez, P. Cordier, B. Devincre, and M. Marquille (2015), Modeling the creep
properties of olivine by 2.5-dimensional dislocation dynamics simulations, Physical
Review B, 92(1).
Couvy, H., D. J. Frost, F. Heidelbach, K. Nyilas, T. Ungar, S. Mackwell, and P. Cordier (2004),
Shear deformation experiments of forsterite at 11 GPa-1400 C in the multianvil apparatus,
European Journal of Mineralogy, 16(6), 877-889.
Dziewonski, A. M., and D. L. Anderson (1981), Preliminary reference Earth model, Physics of
the Earth and Planetary Interiors, 25(4), 297-356.
Ohuchi, T., T. Kawazoe, Y. Nishihara, N. Nishiyama, and T. Irifune (2011), High pressure and
temperature fabric transitions in olivine and variations in upper mantle seismic anisotropy,
Earth and Planetary Science Letters, 304(1–2), 55-63.
Otsuka, K., and S. I. Karato (2011), Control of the water fugacity at high pressures and
temperatures: Applications to the incorporation mechanisms of water in olivine, Physics
of the Earth and Planetary Interiors, 189(1-2), 27-33.
Fei, H., C. Hegoda, D. Yamazaki, M. Wiedenbeck, H. Yurimoto, S. Shcheka, and T. Katsura
(2012), High silicon self-diffusion coefficient in dry forsterite, Earth and Planetary
Science Letters, 345–348(0), 95-103.
Fei, H., S. Koizumi, N. Sakamoto, M. Hashiguchi, H. Yurimoto, K. Marquardt, N. Miyajima, D.
Yamazaki, and T. Katsura (2016), New constraints on upper mantle creep mechanism
inferred from silicon grain-boundary diffusion rates, Earth and Planetary Science Letters,
433, 350-359.
Gung, Y., M. Panning, and B. Romanowicz (2003), Global anisotropy and the thickness of

113
continents, Nature, 422(6933), 707-711.
Hirth, G., and D. Kohlstedt (2003), Rheology of the Upper Mantle and the Mantle Wedge: A
View from the Experimentalists, in Inside the Subduction Factory, edited, pp. 83-105,
American Geophysical Union.
Jaoul, O., M. Poumellec, C. Froidevaux, and A. Havette (1981), Silicon diffusion in forsterite:
a new constraint for understanding mantle deformation, Anelasticity in the Earth, 95-100.
Jung, H., W. Mo, and H. W. Green (2009), Upper mantle seismic anisotropy resulting from
pressure-induced slip transition in olivine, Nature Geosci, 2(1), 73-77.
Karato, S. i. (1992), On the Lehmann discontinuity, Geophysical Research Letters, 19(22),
2255-2258.
Karato, S.-i. (2012), Deformation of earth materials: an introduction to the rheology of solid
earth, Cambridge University Press.
Karato, S.-I., D. C. Rubie, and H. Yan (1993), Dislocation recovery in olivine under deep upper
mantle conditions: Implications for creep and diffusion, Journal of Geophysical Research:
Solid Earth, 98(B6), 9761-9768.
Karato, S.-i., and D. C. Rubie (1997), Toward an experimental study of deep mantle rheology:
A new multianvil sample assembly for deformation studies under high pressures and
temperatures, Journal of Geophysical Research: Solid Earth, 102(B9), 20111-20122.
Karato, S.-I., and H. Jung (2003), Effects of pressure on high-temperature dislocation creep in
olivine, Philosophical Magazine, 83(3), 401-414.
Karato, S., and M. Ogawa (1982), High-pressure recovery of olivine: implications for creep
mechanisms and creep activation volume, Physics of the Earth and Planetary Interiors,
28(2), 102-117.
Kawazoe, T., S.-i. Karato, K. Otsuka, Z. Jing, M. Mookherjee (2009), Shear deformation of dry
polycrystalline olivine under deep upper mantle conditions using a rotational Drickamer
apparatus (RDA), Phys. Earth Planet. Inter., 174, 128
Kohlstedt, D., H. Nichols, and P. Hornack (1980), The effect of pressure on the rate of
dislocation recovery in olivine, Journal of Geophysical Research: Solid Earth, 85(B6),

114
3122-3130.
Kumazawa, M., and O. L. Anderson (1969), Elastic moduli, pressure derivatives, and
temperature derivatives of single-crystal olivine and single-crystal forsterite, Journal of
Geophysical Research, 74(25), 5961-5972.
Mainprice, D., A. Tommasi, H. Couvy, P. Cordier, and D. J. Frost (2005), Pressure sensitivity
of olivine slip systems and seismic anisotropy of Earth's upper mantle, Nature, 433(7027),
731-733.
Montagner, J. P., and B. L. N. Kennett (1996), How to reconcile body-wave and normal-mode
reference earth models, Geophysical Journal International, 125(1), 229-248.
Nettles, M., and A. M. Dziewonski (2008), Radially anisotropic shear velocity structure of the
upper mantle globally and beneath North America, Journal of Geophysical
Research-Solid Earth, 113(B2), 27.
Ohuchi, T., T. Kawazoe, Y. Nishihara, N. Nishiyama, T. Irifune (2001), High pressure and
temperature fabric transitions in olivine and variations in upper mantle seismic anisotropy,
Earth Planet. Sci. Lett., 304, 55
Paterson, M. (1982), The determination of hydroxyl by infrared absorption in quartz, silicate
glasses, and similar materials, Bulletin de la Societe Francaise de Mineralogie, 105,
20-29.
Raterron, P., J. Chen, T. Geenen, and J. Girard (2011), Pressure effect on forsterite dislocation
slip systems: Implications for upper-mantle LPO and low viscosity zone, Physics of the
Earth and Planetary Interiors, 188(1–2), 26-36.
Raterron, P., E. Amiguet, J. Chen, L. Li, and P. Cordier (2009), Experimental deformation of
olivine single crystals at mantle pressures and temperatures, Physics of the Earth and
Planetary Interiors, 172(1–2), 74-83.
Ringwood, A. E. (1991), Phase transformations and their bearing on the constitution and
dynamics of the mantle, Geochimica et Cosmochimica Acta, 55(8), 2083-2110.
Visser, K., J. Trampert, S. Lebedev, and B. L. N. Kennett (2008), Probability of radial
anisotropy in the deep mantle, Earth and Planetary Science Letters, 270(3–4), 241-250.

115
Wang, L., S. Blaha, Z. Pintér, R. Farla, T. Kawazoe, N. Miyajima, K. Michibayashi, and T.
Katsura (2016), Temperature dependence of [100](010) and [001](010) dislocation
mobility in natural olivine, Earth and Planetary Science Letters, 441, 81-90.

116
5. Identical mechanism for the motion of screw
and edge dislocations in natural olivine
Lin Wanga,* and Tomoo Katsuraa
a Bayerisches Geoinstitut, University of Bayreuth, 95440 Bayreuth, Germany.
5.1 Abstract
Dislocation recovery experiments were conducted on pre-deformed olivine single crystals
at temperatures of 1,450 to 1,760 K, room pressure, and oxygen partial pressures near the
Ni-NiO buffer to determine the annihilation rates constants for [001] (010) edge dislocations.
The obtained annihilation rate constants were comparable with those for previously determined
[001] screw dislocations. The activation energies for the motion of both dislocations are
identical, i.e., ~400 kJ/mol. These suggest that the motion of screw dislocations in olivine is not
controlled by cross-slip but by the same rate-limiting process of the motion of edge
dislocations, i.e. climb, under low-stress and high-temperature conditions. Therefore, the
conventional climb-controlled model for olivine should be applicable to the motions of not
only edge but also screw dislocations. The softening of the asthenosphere cannot be explained
by cross-slip as the rate-limiting process of dislocation creep.
5.2 Introduction
Geophysical observations suggested that a soft asthenosphere underlies a rigid
lithosphere based on analysis of the geoid (e.g. Hager, 1991) and post-glacial rebound (e.g.
Peltier, 1998). The geodynamic modellings (e.g. Becker, 2017; Craig and McKenzie, 1986)
also suggested the same result. The reason for the softening of the asthenosphere is under
debate. The simplest explanation is softening of materials due to temperature increase from

117
the lithosphere to the asthenosphere, but results of deformation experiments on dry peridotite
implied that high temperature is insufficient to explain softness of the asthenosphere (Hirth
and Kohlstedt, 2003). A popular explanation is hydrous weakening of olivine, but is doubted
by recent Si self-diffusion experiments (Fei et al., 2016; Fei et al., 2013) based on the
assumption that dislocation creep is controlled by climb of edge dislocations. However,
motion of screw dislocations is not considered to involve climb. Therefore, the results of
diffusion experiments cannot be applied to dislocation creep if it is controlled by motion of
screw dislocations. Moreover, Poirier and Vergobbi (1978) suggested that, if cross-slip of
dissociated screw dislocations controls olivine dislocation creep, the estimated upper mantle
viscosity would be one order of magnitude lower than that predicted by the climb-controlled
model in the stress range from 10 to 100 MPa. This potentially explains the softening of the
asthenosphere. Therefore, it is essential to know the rate-limiting process for screw
dislocations.
However, both diffusion and deformation experiments cannot solve this problem.
Diffusion does not involve motion of dislocations. The stress ranges in deformation
experiments are too narrow to constrain the rate-limiting process of dislocation motions,
although in theory it could be determined by checking the stress dependence of creep rates
(e.g. Karato, 2012; Poirier, 1985). Hirth and Kohlstedt (2003) compiled deformation data
from their previous studis, and concluded that the stress dependence of creep rates has an
exponent of 3.5, suggesting a climb-controlled model. However, the stress range of their
dislocation creep tests is 100 to 224 MPa, which is too narrow to determine the change in the
stress exponent with stress. Actually, Kohlstedt and Goetze (1974) conducted deformation
experiments on olivine single crystals at stresses from 5 to 150 MPa, and found that
d log 𝜀𝜀̇ d log𝜎𝜎⁄ , where 𝜀𝜀̇ is the strain rate and σ is the stress, gradually decreases with
decreasing stress. Poirier (1985) found that different deformation experiments on olivine
single crystals under different stress conditions give different stress exponents.
In this study, we conducted dislocation recovery experiments for edge dislocations in the
[001](010) slip system (hereafter called c-edge dislocation) at various temperatures and room

118
pressure by the same method as that of Wang et al. (2016). We have compared the rate
constants and activation energy with those from Wang et al. (2016) for screw dislocations in
the same slip system (hereafter called c-screw dislocation). It is important to compare
mobility of edge and screw dislocations in the same system, because the activation energy
may be different among different slip systems (Bai et al., 1991). The similar densities for
edge and screw dislocations in this slip system (Bai and Kohlstedt, 1992; Wang et al., 2016)
make it ideal to examine the rate-limiting processes for both kinds of dislocations. During
dislocation recovery, dislocations move under the influence of internal stress, which is a
function of dislocation density. Since dislocation motions on the slip plane (glide) and out of
the slip plane (climb, cross-slip) occur successively during recovery, the activation energy
determined by this method represents that of the rate-limiting process of dislocation motions.
Our results show the identical activation energy of c-edge and c-screw dislocations, i.e. 400
kJ/mol. Therefore, the motion of screw dislocations has the same rate-limiting process as that
of edge dislocations, and therefore softening of the asthenosphere cannot be explained by
cross-slip as the rate-limiting process of dislocation motions.
5.3 Experimental Procedures
The same Pakistan olivine and sample preparation procedure as those of Wang et al.
(2016) were employed in this study. The composition of olivine was reported by Gose et al.
(2010). The olivine single crystal was orientated by X-ray diffraction and electron
backscattered diffraction (EBSD), and then placed in the cell assembly such that the [001]
direction is parallel to the shear direction and the (010) plane is parallel to the shear plane
(Fig. 1).
High-density dislocations with the [001] Burgers vector on the (010) plane were
produced by experimental deformation using a Kawai-type multi-anvil apparatus at
University of Bayreuth. The sample assembly was first pressurized to 3 GPa using a press
load of 3.7 MN, and then heated to a temperature of 1,600 K and held for 15 min to sinter
crushable alumina. After that, the assembly was further compressed to a press load of 3.9 MN

119
for 15 min to deform the sample. After the deformation, the sample was quenched by
switching off the heating power, and then decompressed to room pressure for more than 16
hours. Transmission electronic microscopy (TEM) by Wang et al. (2016) found [001](010)
slip system was successfully activated and dominant by this procedure. The ratio of screw to
edge dislocations was 3:2, as reported by Wang et al. (2016).
Figure 1. Deformation setup used to generate c-dislocations. The crystallographic axes of
olivine are shown in the left bottom.
The deformed olivine crystals were cut into eight cubic pieces, and paired into four
groups, in which the two pieces in each group shared a common (100) plane. One piece from
each pair was used to determine the initial dislocation density, while the other was used to
determine dislocation density after the annealing. The annealing experiments were conducted
at ambient pressure and temperatures of 1,460 to 1,760 K for 35 min to 24 hours using a gas
mixing furnace. The oxygen partial pressure was controlled at 10-6-10-8 MPa, which is near
the Ni-NiO buffer, using a CO-CO2 gas mixture. Table 1 summarizes conditions of the
annealing experiments.
Dislocations were observed using the same oxidation decoration technique as Wang et al.
(2016). The corresponding areas away from subgrain boundaries on the common (100) plane
in the initial and annealed pieces from the same group were observed to determine the change

120
in dislocation densities before and after annealing.
The annihilation rate constants were calculated using the second-order dislocation
recovery kinetics (Karato and Ogawa, 1982; Kohlstedt et al., 1980; Wang et al., 2016)
𝑘𝑘 =1𝜌𝜌𝑓𝑓− 1𝜌𝜌𝑖𝑖
𝑒𝑒, (2)
where 𝜌𝜌𝑠𝑠 and 𝜌𝜌𝑒𝑒 are the dislocation densities after and before annealing, respectively, and t
is the annealing time. Because of the thermally activated process, the dislocation annihilation
rate constant is assumed to follow the Arrhenius relationship:
𝑘𝑘 = 𝑘𝑘0exp (− 𝛽𝛽 𝑅𝑅𝑇𝑇
) (3)
where k0 is a constant, E is the activation energy of dislocation annihilation, 𝑇𝑇 is the
temperature, and 𝑅𝑅 is the gas constant. As discussed above, this activation energy should
represent that of the rate-limiting process of dislocation motions.
5.4 Results
Table 1 shows experimental results together with the annealing conditions. Dislocation
density in the samples before deformation is less than 0.0004 µm-2, which is negligible in
comparison with dislocation density after deformation (Table 1). Figure 2 shows
back-scattered electron images of decorated dislocations in the corresponding areas in the
samples from the same pair before and after annealing. The c-screw dislocations appear as
lines and the c-edge dislocations as dots on the (100) plane due to their geometries. A jog on
screw dislocations is indicated by the red arrow in Figure 2. Decrease in dislocation density
was observed by comparing the images before and after annealing. The water contents in the
samples before and after annealing were below the detection limit of infrared spectroscopy.
The transmission electron microscope images of the dislocation structures after deformation
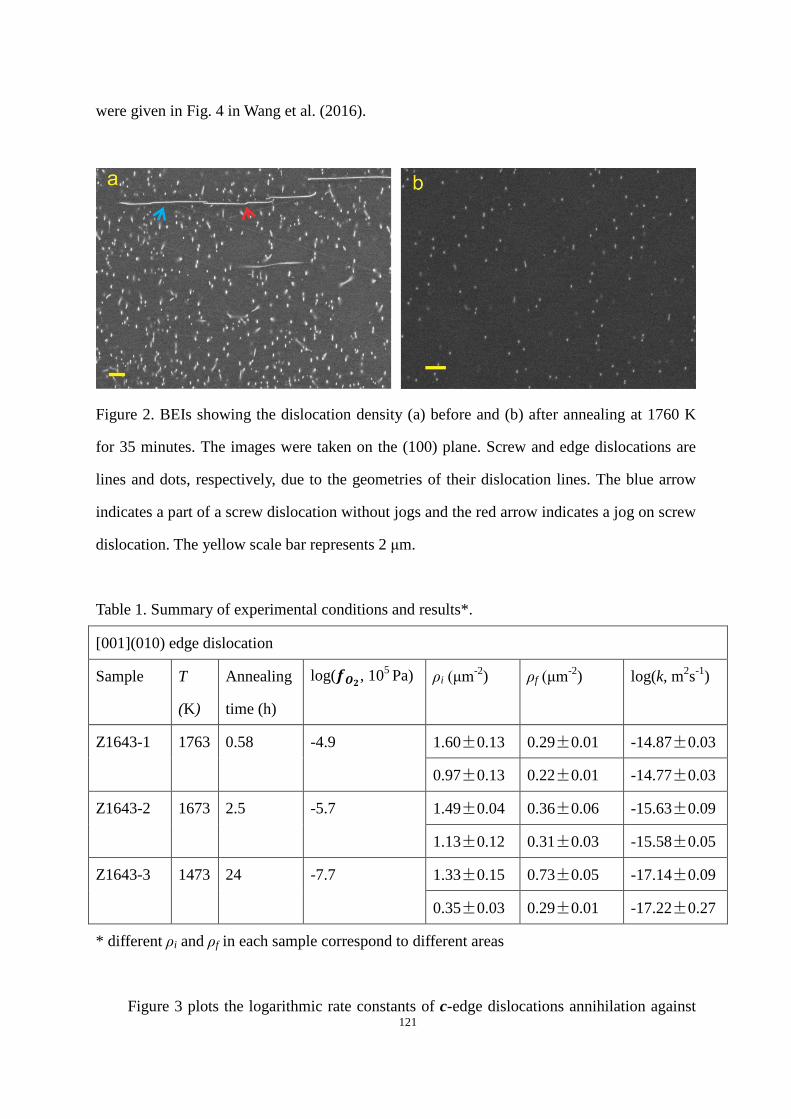
121
were given in Fig. 4 in Wang et al. (2016).
Figure 2. BEIs showing the dislocation density (a) before and (b) after annealing at 1760 K
for 35 minutes. The images were taken on the (100) plane. Screw and edge dislocations are
lines and dots, respectively, due to the geometries of their dislocation lines. The blue arrow
indicates a part of a screw dislocation without jogs and the red arrow indicates a jog on screw
dislocation. The yellow scale bar represents 2 μm.
Table 1. Summary of experimental conditions and results*.
* different ρi and ρf in each sample correspond to different areas
Figure 3 plots the logarithmic rate constants of c-edge dislocations annihilation against
[001](010) edge dislocation
Sample T
(K)
Annealing
time (h)
log(𝒇𝒇𝑶𝑶𝟐𝟐, 105 Pa) ρi (μm-2) ρf (μm-2) log(k, m2s-1)
Z1643-1 1763 0.58 -4.9 1.60±0.13 0.29±0.01 -14.87±0.03
0.97±0.13 0.22±0.01 -14.77±0.03
Z1643-2 1673 2.5 -5.7 1.49±0.04 0.36±0.06 -15.63±0.09
1.13±0.12 0.31±0.03 -15.58±0.05
Z1643-3 1473 24 -7.7 1.33±0.15 0.73±0.05 -17.14±0.09
0.35±0.03 0.29±0.01 -17.22±0.27

122
the reciprocal temperature. The results from the previous dislocation recovery experiments on
c-screw dislocations (Wang et al., 2016) are also plotted in this figure. The dislocation
annihilation rate constants of c-edge and c-screw dislocations are comparable, but those of
the c-screw are about half an order of magnitude higher than those of the c-edge. The
temperature dependences for these two dislocations are identical. Their activation energies
are found Ec-edge = 400 ± 20 kJ/mol and Ec-screw = 400 ± 30 kJ/mol for the c-edge and c-screw,
respectively.
Figure 3. Logarithmic dislocation annihilation rate constants of c-edge dislocations versus
reciprocal temperature. Together plotted are the annihilation rate constants of c-screw
dislocations from previous study. The activation energies for both dislocations are identical,
i.e. 400 kJ/mol.
5.5 Discussion
The annihilation rate constants of the c-edge and c-screw are comparable and their

123
activation energies are identical with each other, indicating that the motions of edge and
screw dislocations are both controlled by the same mechanism. The motion of edge
dislocations is controlled by climb at high temperatures and low stresses (e.g. Hull and Bacon,
2001; Kohlstedt, 2006), in which diffusion is involved. Point defects need to be absorbed to
or emitted from dislocations, rendering dislocations to move out of the slip planes. However,
motion of a pure screw dislocation does not involve climb because screw segments have no
specific slip plane (Hull and Bacon, 2001). Therefore, the motion of pure screw segments
cannot be rate-limited by climb. In order to explain the same mechanism for the motions of
both edge and screw dislocations, a climb-controlled model for the motion of screw
dislocations is proposed below (Fig. 4).
A screw dislocation forms a jog by cross-slips (Fig. 2 and 4) to overcome obstacles that
it meets during glide from A to B in Figure 4. The jogs have the same Burgers vector (b) as
their parental dislocations (the x direction in Fig. 4), but the dislocation line of the jog (J) (red
segments in Fig. 4, parallel to z direction) is normal to the direction of the Burgers vector b.
This is different from its parental screw dislocation, whose line direction (L) is parallel to the
direction of b. Therefore, the jog on the screw dislocation has an edge character. The slip
plane of the jog is defined by its dislocation line (J) and the Burgers vector (b), indicated by
the yellow plane in Fig. 4. The screw dislocation glides in the y direction in Fig. 4 and
therefore, the jog in the screw dislocation needs climb motion also in the y direction to move
along with their parental dislocation so that the screw dislocation can go through the obstacle.
This climb of the jog should serve as the rate-limiting process of the screw dislocation
motions.
The activation energy of motion of screw dislocations might be attributed to that of the
cross-slip due to recombination of partial dislocations and the agreement of the activation
energies of motions between c-edge and c-screw dislocations could be accidental. However,
this possibility is unlikely because of the following reasoning. If cross-slip served as a
rate-limiting process, the activation energy of dislocation motion should be a function of
stress (Poirier, 1976). The rate constants of c-screw dislocations are obtained at different ρi,

124
i.e. different internal stresses in our studies. The internal stresses drive dislocations to move
during annealing. If the activation energy of dislocation motion is stress-dependent, the rate
constant must have a correlation with the dislocation density ρi at a given temperature.
However, we did not find such a correlation by judging from table 1 from Wang et al., (2016).
Therefore, the activation energy of screw dislocation motions is not that of cross-slip.
Figure 4. A schematic diagram showing the jog-climb controlled motion of a screw
dislocation. The screw dislocation is elongated in the x direction, which is parallel to its
Burgers vector b, and glides in the y direction from A to B. The blue dot represents the
obstacle that the screw dislocation meets during glide. A jog (red segment) elongated in the z
direction is produced on the screw dislocation in order to overcome the obstacle. This jog has
an edge nature with the same Burgers vector b as the parental screw dislocation. The yellow
area indicates the glide plane of the jog, which is normal to the y direction. The jog has to
climb out of its glide plane in order to move along with its parental screw dislocation.
5.6 Implications
The present study improves the applicability of the climb-controlled model for olivine
dislocation creep. The climb-controlled model assumes that climb of edge dislocations is a
125
rate-limiting process of dislocation motions (Weertman, 1955), which implies the edge
dislocations move much slower than screw dislocations. However, studies on dislocation
structures (Bai and Kohlstedt, 1992; Wang et al., 2016) suggested that edge and screw
dislocations have similar velocity at least for [001](010) slip system. Therefore, the role of
screw dislocations in dislocation creep must be taken into account. The present study
demonstrates that motion of screw dislocations is also controlled by climb. This indicates that
the climb-controlled model can be used in olivine dislocation creep regardless of dislocation
characters. Moreover, because climb is controlled by diffusion, diffusion results are
applicable to dislocation creep as long as a diffusion coefficient of an appropriate species is
chosen.
The softening of asthenosphere cannot be explained by the model in which dislocation
creep is controlled by cross-slip of screw dislocations. Poirier and Vergobbi (1978) proposed
the cross-slip controlled model for olivine creep and suggested that viscosity of the Earth’s
upper mantle is about one order of magnitude lower than that predicted by the
climb-controlled model in the stress range from 10 to 100 MPa. In this model, cross-slip is
assumed to be controlled by recombination of partial screw dislocations. The dissociation of
screw dislocations were confirmed by transmission electron microscopy in olivine (Fujino et
al., 1993; Vander Sande and Kohlstedt, 1976). Therefore, this model potentially explains the
softening of the asthenosphere. However, the rate-limiting process for motion of screw
dislocations is never tested before. The present study suggests that both edge and screw
dislocations have the same rate-limiting mechanism of motions, i.e. climb, demonstrating that
the cross-slip model cannot be applied to the olivine dislocation creep.
The softening of asthenosphere may be explained by existence of melt in the
asthenosphere to some extent (e.g. Hirth and Kohlstedt 2003). We also emphasize that water
could be still a reason, at least partly, for softening of the asthenosphere although diffusion
studies disparage this hypothesis (Fei et al., 2016; Fei et al., 2013). This study proves that
climb is the rate-limiting process of dislocation motions, but the diffusion process which
controls climb is still under debate. Hirth and Kohlstedt (2015) suggested that climb in

126
olivine may be controlled by pipe diffusion rather than lattice diffusion. Further studies on
relations between dislocation climb and diffusion are needed to solve this problem.
5.7 Acknowledgements
We thank H. Fischer, R. Njul in BGI for the sample and assembly preparation. This
research was supported by DFG grants to TK (KA3434-3/1, KA3434-7/1 and KA3434-8/1)
and by the annual budget of BGI.
5.8 References
Bai, Q., and Kohlstedt, D. L., 1992, High-temperature creep of olivine single crystals, 2.
dislocation structures: Tectonophysics, v. 206, no. 1–2, p. 1-29.
Bai, Q., Mackwell, S. J., and Kohlstedt, D. L., 1991, High-temperature creep of olivine single
crystals 1. Mechanical results for buffered samples: Journal of Geophysical Research:
Solid Earth, v. 96, no. B2, p. 2441-2463.
Becker, T. W., 2017, Superweak asthenosphere in light of upper mantle seismic anisotropy:
Geochemistry, Geophysics, Geosystems.
Craig, C. H., and McKenzie, D., 1986, The existence of a thin low-viscosity layer beneath the
lithosphere: Earth and Planetary Science Letters, v. 78, no. 4, p. 420-426.
Fei, H., Koizumi, S., Sakamoto, N., Hashiguchi, M., Yurimoto, H., Marquardt, K., Miyajima,
N., Yamazaki, D., and Katsura, T., 2016, New constraints on upper mantle creep
mechanism inferred from silicon grain-boundary diffusion rates: Earth and Planetary
Science Letters, v. 433, p. 350-359.
Fei, H., Wiedenbeck, M., Yamazaki, D., and Katsura, T., 2013, Small effect of water on
upper-mantle rheology based on silicon self-diffusion coefficients: Nature, v. 498, no.
7453, p. 213-+.
Fujino, K., Nakazaki, H., Momoi, H., Karato, S.-i., and Kohlstedt, D. L., 1993, TEM
observation of dissociated dislocations with b=[010] in naturally deformed olivine:

127
Physics of the earth and planetary interiors, v. 78, no. 1-2, p. 131-137.
Gose, J., Schmaedicke, E., Markowitz, M., and Beran, A., 2010, OH point defects in olivine
from Pakistan: Mineralogy and Petrology, v. 99, no. 1-2, p. 105-111.
Hager, B. H., 1991, Mantle viscosity: A comparison of models from postglacial rebound and
from the geoid, plate driving forces, and advected heat flux, Glacial isostasy, sea-level
and mantle rheology, Springer, p. 493-513.
Hirth, G., and Kohlstedt, D., 2003, Rheology of the Upper Mantle and the Mantle Wedge: A
View from the Experimentalists, Inside the Subduction Factory, American Geophysical
Union, p. 83-105.
Hirth, G., and Kohlstedt, D., 2015, The stress dependence of olivine creep rate: Implications
for extrapolation of lab data and interpretation of recrystallized grain size: Earth and
Planetary Science Letters, v. 418, p. 20-26.
Hull, D., and Bacon, D. J., 2001, Introduction to dislocations, Butterworth-Heinemann. P.257
Karato, S.-i., 2012, Deformation of earth materials: an introduction to the rheology of solid
earth, Cambridge University Press. P.463
Karato, S., and Ogawa, M., 1982, High-pressure recovery of olivine: implications for creep
mechanisms and creep activation volume: Physics of the Earth and Planetary Interiors, v.
28, no. 2, p. 102-117.
Kohlstedt, D., Nichols, H., and Hornack, P., 1980, The effect of pressure on the rate of
dislocation recovery in olivine: Journal of Geophysical Research: Solid Earth (1978–
2012), v. 85, no. B6, p. 3122-3130.
Kohlstedt, D. L., 2006, The Role of Water in High-Temperature Rock Deformation: Reviews
in Mineralogy and Geochemistry, v. 62, no. 1, p. 377-396.
Kohlstedt, D. L., and Goetze, C., 1974, Low-stress high-temperature creep in olivine single
crystals: Journal of Geophysical Research, v. 79, no. 14, p. 2045-2051.
Peltier, W., 1998, Postglacial variations in the level of the sea: Implications for climate
dynamics and solid‐earth geophysics: Reviews of Geophysics, v. 36, no. 4, p. 603-689.
Poirier, J.-P., 1985, Creep of crystals: high-temperature deformation processes in metals,

128
ceramics and minerals, Cambridge University Press.
Poirier, J.-P., and Vergobbi, B., 1978, Splitting of dislocations in olivine, cross-slip-controlled
creep and mantle rheology: Physics of the Earth and Planetary Interiors, v. 16, no. 4, p.
370-378.
Poirier, J., 1976, On the symmetrical role of cross-slip of screw dislocations and climb of
edge dislocations as recovery processes controlling high-temperature creep: Revue de
Physique Appliquée, v. 11, no. 6, p. 731-738.
Vander Sande, J., and Kohlstedt, D., 1976, Observation of dissociated dislocations in
deformed olivine: Philosophical Magazine, v. 34, no. 4, p. 653-658.
Wang, L., Blaha, S., Pintér, Z., Farla, R., Kawazoe, T., Miyajima, N., Michibayashi, K., and
Katsura, T., 2016, Temperature dependence of [100](010) and [001](010) dislocation
mobility in natural olivine: Earth and Planetary Science Letters, v. 441, p. 81-90.
Weertman, J., 1955, Theory of Steady‐State Creep Based on Dislocation Climb: Journal of
Applied Physics, v. 26, no. 10, p. 1213-1217.
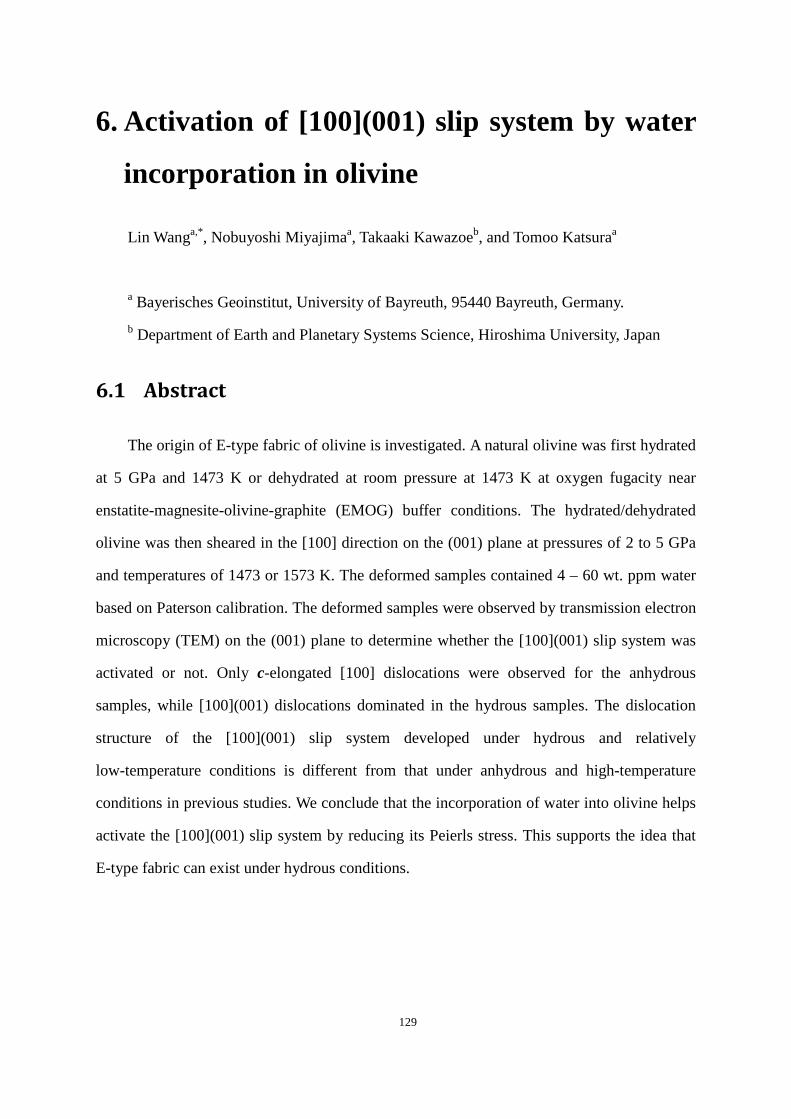
129
6. Activation of [100](001) slip system by water
incorporation in olivine
Lin Wanga,*, Nobuyoshi Miyajimaa, Takaaki Kawazoeb, and Tomoo Katsuraa
a Bayerisches Geoinstitut, University of Bayreuth, 95440 Bayreuth, Germany. b Department of Earth and Planetary Systems Science, Hiroshima University, Japan
6.1 Abstract
The origin of E-type fabric of olivine is investigated. A natural olivine was first hydrated
at 5 GPa and 1473 K or dehydrated at room pressure at 1473 K at oxygen fugacity near
enstatite-magnesite-olivine-graphite (EMOG) buffer conditions. The hydrated/dehydrated
olivine was then sheared in the [100] direction on the (001) plane at pressures of 2 to 5 GPa
and temperatures of 1473 or 1573 K. The deformed samples contained 4 – 60 wt. ppm water
based on Paterson calibration. The deformed samples were observed by transmission electron
microscopy (TEM) on the (001) plane to determine whether the [100](001) slip system was
activated or not. Only c-elongated [100] dislocations were observed for the anhydrous
samples, while [100](001) dislocations dominated in the hydrous samples. The dislocation
structure of the [100](001) slip system developed under hydrous and relatively
low-temperature conditions is different from that under anhydrous and high-temperature
conditions in previous studies. We conclude that the incorporation of water into olivine helps
activate the [100](001) slip system by reducing its Peierls stress. This supports the idea that
E-type fabric can exist under hydrous conditions.

130
6.2 Introduction
Lattice preferred orientation (LPO), or fabric, of olivine is essential to interpret the
seismic anisotropy in the Earth’s upper mantle (Karato et al., 2008), because olivine is the
most abundant mineral in the upper mantle (Ringwood, 1991), and is elastically anisotropic
(Kumazawa and Anderson, 1969). Olivine fabrics change according to physical and chemical
environments, as suggested by observations of natural samples and laboratory deformation
experiments. Therefore, knowledge of conditions of fabric formation can be used to
understand physical and chemical conditions in the Earth’s interior. Moreover, mantle flow
geometry can be inferred by combining observations of seismic anisotropy with knowledge
of fabric formation of mantle minerals.
A number of seismic studies have shown that seismic anisotropy in the upper mantle
becomes weaker with depth. One-dimensional global models, PREM (Dziewonski and
Anderson, 1981) and SP6-F (Montagner and Kennett, 1996), suggested that horizontally
polarized S-wave velocity (VSH) is faster than vertically polarized S-wave velocity (VSV) in
the uppermost mantle, but this difference decreases with depth. The VSH/VSV ratio obtained
from shear wave tomography (Gung et al., 2003) and surface wave analyses (Visser et al.,
2008) reached identical conclusions. The decrease in seismic anisotropy may reflect a change
of olivine LPO due to different thermomechanical conditions.
Conditions of formation of different fabrics in olivine aggregates have been studied by
both petrography and experiments. Lineation and foliation of peridotite are believed to
represent the shear direction and shear plane of mantle flow, respectively. By this assumption,
olivine fabrics can be identified for natural samples. Mainprice (2007) categorized olivine
LPO types to six different groups (A, B, C, D, E, AG) using dataset from Ismaı̈l and
Mainprice (1998) and found that most peridotite samples from ophiolites and the continental
lithosphere show A-type olivine fabrics. Tommasi and Vauchez (2015) used enlarged dataset
and found that the E-type fabric has been observed only in harzburgite and dunite deformed
under hydrous conditions. These investigations suggested that water can cause A- to E-type

131
fabric transition. This idea is also supported by Michibayashi et al. (2016). They
demonstrated that the E-type fabrics were not found in ridge peridotites, by investigating their
recently compiled dataset. The VSH/VSV ratios produced by the E-type fabric are smaller than
by those formed by the A-type fabric (Karato et al., 2008). Since asthenosphere contains
more water than lithosphere (Hirth and Kohlstedt, 1996), the possible water-induced A- to
E-type fabric transition can explain why the seismic anisotropy decreases with depth.
Laboratory deformation experiments also suggested water-induced fabric transitions.
Jung and Karato (2001) suggested that the olivine fabric changes from A- to C-type with
increasing water content. Katayama et al. (2004) suggested that E-type fabric dominates at
moderate water content between the A- and C-type fabrics. They reported that the boundaries
between A- and E-type fabrics and between E- and C-type fabrics are located at water
contents of 200 and of 500 to ~1100 ppm H/Si, respectively. They also suggested that the
water content for the E- to C-type transition decreases with increasing stress.
Formation of LPO in mantle minerals is a consequence of the dominant slip systems in
dislocation creep. The water-induced fabric transitions of olivine indicate that different slip
systems dominate at different water contents. The A-, C-, E-type fabrics are assumed to be
caused by the dominant activities of [100](010), [001](100) and [100](001) slip systems,
respectively (Mainprice, 2007). Transmission electron microscopy (TEM) studies of natural
(Goetze and Kohlstedt, 1973) and laboratory deformed samples (Darot and Gueguen, 1981;
Durham and Goetze, 1977; Durham et al., 1977; Kohlstedt and Goetze, 1974; Ohuchi et al.,
2015; Phakey et al., 1972) confirmed the existence of [100](010) slip system under
anhydrous conditions. The [001](100) slip system has been observed in laboratory deformed
samples at high (>1523 K, Durham et al., 1977; Bai and Kohlstedt, 1992) or low
temperatures (<1523 K, Gaboriaud et al., 1981; Mussi et al., 2014; Ohuchi et al., 2015;
Phakey et al., 1972) under anhydrous conditions and low temperatures under hydrous
conditions (Jung et al., 2006) by TEM or oxidation decoration methods. The [100](001) slip
system has been observed by TEM (Durham et al., 1977) and oxidation decoration techniques
(Bai and Kohlstedt, 1992; Durham et al., 1977) on laboratory deformed samples under

132
anhydrous conditions. However, there is no TEM study to confirm the activation of [100](001)
slip system under hydrous conditions, and the physical mechanisms for the existence of the
E-type fabric under hydrous conditions is therefore unknown. In this study, we have therefore
conducted TEM observations on hydrous olivine single crystal sheared in the [100] direction
on the (001) plane to investigate a reason for the activation of the [100](001) slip system.
6.3 Experimental Procedures
Sample Preparation
The samples used in this study were single crystals of natural olivine from Pakistan. The
same olivine has been described by Gose et al. (2010), which reported its major and trace
element contents including its water content. The c-axis of each crystal was determined using
a Huber single-crystal diffractometer operated by SINGLE2014 (Angel and Finger, 2011).
The oriented olivine crystals were mounted in epoxy resin with the (001) plane exposed to
the surface, and then polished using diamond powder with a grain size of 0.25 μm. The [010]
and [100] axes of the crystals were determined by means of electron backscatter diffraction
(EBSD). The cube with 1.5 mm edge length was shaped from the oriented crystal along its
principal crystallographic planes.
Hydration/dehydration experiments
The olivine cubes were hydrated or dehydrated before deformation. In dehydration, the
cubes were put into a Pt basket and annealed at ambient pressure and a temperature of 1473
K for 12 h in a CO-CO2 gas mixing furnace. The oxygen partial pressure was controlled at
10-7.5 MPa, which was near the enstatite-magnesite-olivine-graphite (EMOG) buffer.
Hydration experiments were conducted at a pressure of 5 GPa and a temperature of 1473
K using a Kawai-type multi-anvil apparatus at University of Bayreuth. The cell assembly is
shown in Fig. 1. A single-crystal olivine cube was loaded into a gold capsule with outer and

133
inner diameters of 3.7 and 3.2 mm, respectively, whose one end was sealed. A mixture of talc
and brucite powders (weight ratio 4:1) was loaded at the sealed end of the capsule. It was
used as a water source and also to control the silica activity of the sample. Graphite powder
was used to surround the cube to prevent its mechanical damage during compression and to
constrain the oxygen fugacity inside the capsule under the EMOG buffer conditions. Various
water contents in the samples were obtained by having different ratios of the water source to
graphite. The open end of the capsule was closed and sealed by arc welding after sample
loading. The gold capsule was located in an MgO cylinder in a graphite stepped heater with a
ZrO2 thermal insulator. Tungsten carbide anvils with a 15 mm truncated edge length were
used to generate high pressure together with a Cr2O3-doped MgO octahedron with a 25 mm
edge length as a pressure medium. Sample pressures were estimated from the hydraulic oil
pressure based on calibrations using the phase transitions of Bi and Mg2SiO4 polymorphs.
Temperatures were measured using a W97%Re3%-W75%Re25% thermocouple whose
junction was located near one end of the capsule. The sample was pressurized to 5 GPa in 4 h,
heated to a temperature of 1473 K at a rate of 50 K/min, and kept at this temperature for 16 h.
After annealing, the sample was quenched by switching off the heating power, and
decompressed to ambient pressure in 16 h. After hydration, the sample was shaped as a cube
with edge length of 1 to 1.2 mm to remove the graphite and magnesite on the surface.

134
Figure 1. The sample assembly used in the multi-anvil hydration experiments.
Deformation experiments
Deformation experiments were conducted using a Kawai-type multi-anvil apparatus at
pressures of 2 to 5 GPa and temperatures of 1473 and 1573 K. Figure 2 shows the
experimental setup. A square hole was made at the center of an MgO slice to accommodate
the cubic olivine crystal in a unique orientation. The MgO slice with the olivine crystal was
sandwiched between two crushable alumina pistons. The shear geometry was in the [100]
direction on the (001) plane. In order to prevent dehydration of hydrated olivine at high
temperatures, thin layers of talc + brucite mixtures were put between the MgO slice and
alumina pistons in the deformation experiments under hydrous conditions. The sample and
pistons were placed in a welded Pt capsule. Two columns of crushable alumina were placed
on both ends of the capsule. The other parts of assembly were the same as those used in the
hydration experiments.
Figure 2. The sample assembly used in the multi-anvil high-pressure deformation experiments.
The crystallographic orientation of the olivine single crystal is also shown.

135
The cell assembly was first pressurized to a target pressure at ambient temperature in 4 h.
A target temperature was reached in 15 min, and kept constant for 15 min to sinter the
crushable alumina. The sample was then further compressed by increasing press load of 0.2
MN in 15 min to deform the sample. After the deformation, the sample was quenched by
switching off the heating power, and then decompressed to ambient pressure for more than 16
h.
FT-IR measurements
Water contents of the samples before and after deformation were determined by
un-polarized FT-IR spectroscopy with 200 scans for each spectrum at a resolution of 1 cm−1.
Spectra were taken at the rim and center of the sample after deformation to investigate the
water distribution inside the sample. The light paths were perpendicular to the (010) planes of
the samples. Paterson (1982) calibration was used for calculation of the water contents in
order to directly compare our results with those obtained by Jung and Karato (2001) and
Katayama et al. (2004).
TEM observation
The deformed samples were double-side polished parallel to the (001) planes to
thicknesses ranging from 23 to 35 μm and fixed on glass slides. After removing olivine from
the glass slide, an Ar ion-milling method was used to make the sample thinner, with a voltage
of 4.5 kV and incident angles of 4 to 8º from the top and bottom of the ion-bombardment, and
the total thinning time varying between 14 to 25 h depending on the thicknesses and size of
each sample. TEM observations were performed with a FEI Titan G2 80-200 S/TEM
equipped with 4 silicon drift detectors for energy-dispersive X-ray spectrometry, operating at
an acceleration voltage of 200 kV. Dislocation microstructures were examined by dark-field
(DF, Bragg condition, deviation parameter, s = 0) and weak-beam dark-field (WBDF, s > 0)
imaging and selected-area electron diffraction (SAED). We chose diffraction vectors with g =

136
400 to observe the [100] dislocations which should be the Burgers vector of the deformed
olivine in the [100] direction on the (001) plane. If there are [100](001) dislocations, they
should be visible as elongated dislocation lines on the plane. We measured the total length of
dislocation lines per area and calculated a dislocation density based on the assumption that
the thickness of the TEM foils is 250 nm.
6.4 Results
Table 1 shows the experimental conditions together with the water content of the
samples before and after deformation. The FT-IR spectra of hydrous samples before and after
deformation were shown in Fig. 3. The water contents in these samples increased only
slightly after deformation, indicating that a small amount of water was absorbed from the
layers of talc and brucite mixture during deformation. Water was homogeneously distributed
in the samples as is seen from the fact that the FT-IR spectra in the center and rim of the
crystals are almost identical (Fig. 3). The water contents in the samples are below the water
solubility in olivine (Kohlstedt et al., 1996).
Table 1. Summary of experimental conditions and water content before and after deformation
* Anhydrous deformation experiment. No layer of mixture of talc and brucite was added.
# Hydrous deformation experiment. Layers of a mixture of talc and brucite were added.
No T
(K)
P
(GPa)
Dislocation
density (μm-2)
Stress
(MPa)
Water before
(ppm H/Si)
Water after
(ppm H/Si)
H4477* 1473 2 0.2 40 37 61
Z1486* 1573 3 1.6 175 37 73
Z1711# 1473 5 3.5 305 863 970
Z1714# 1473 2 1.5 167 545 583
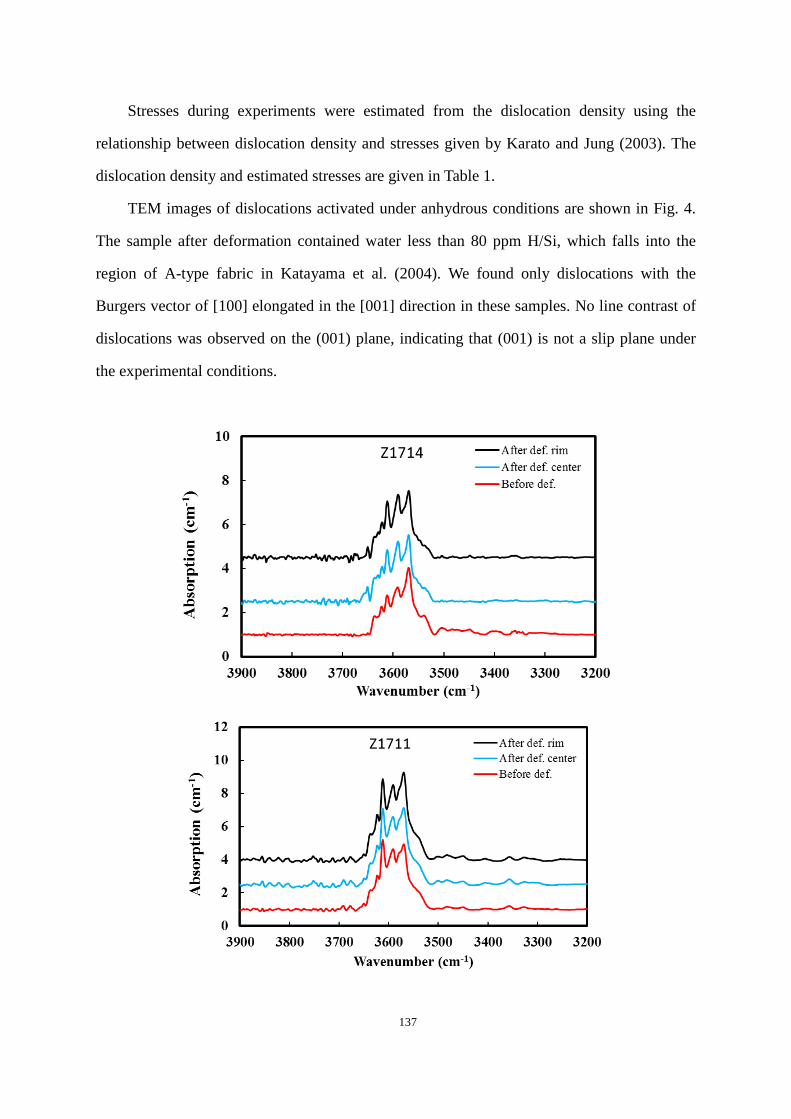
137
Stresses during experiments were estimated from the dislocation density using the
relationship between dislocation density and stresses given by Karato and Jung (2003). The
dislocation density and estimated stresses are given in Table 1.
TEM images of dislocations activated under anhydrous conditions are shown in Fig. 4.
The sample after deformation contained water less than 80 ppm H/Si, which falls into the
region of A-type fabric in Katayama et al. (2004). We found only dislocations with the
Burgers vector of [100] elongated in the [001] direction in these samples. No line contrast of
dislocations was observed on the (001) plane, indicating that (001) is not a slip plane under
the experimental conditions.
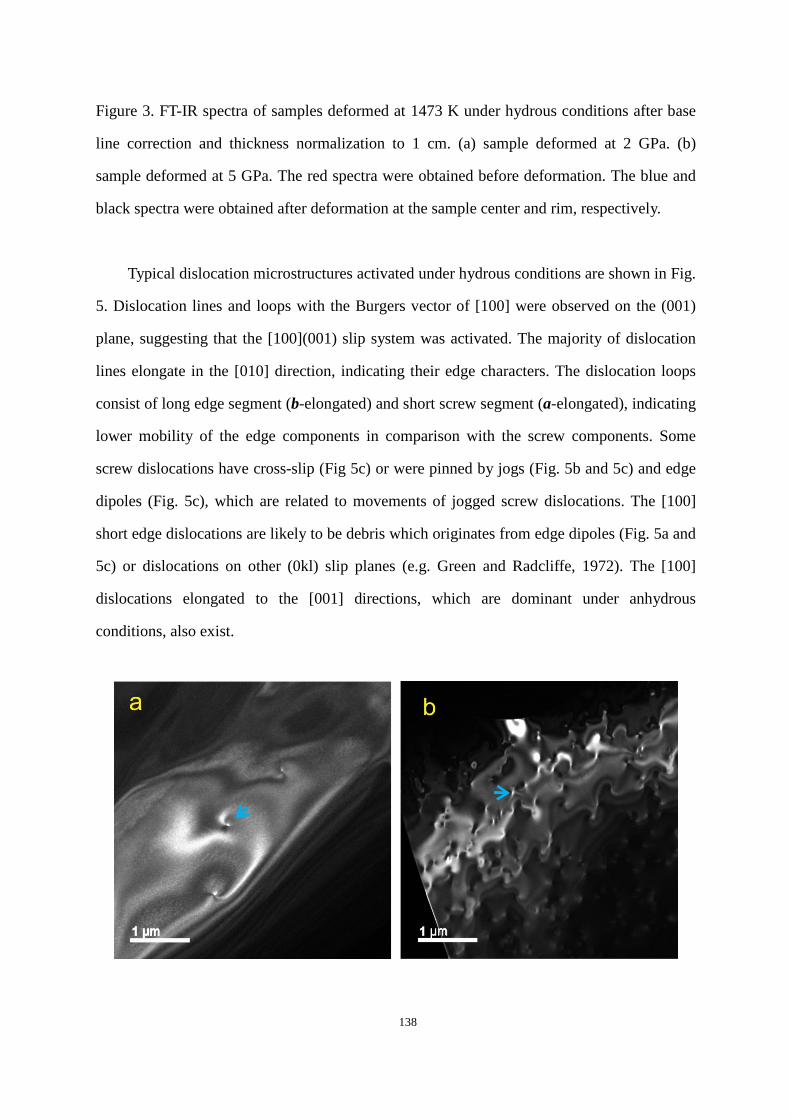
138
Figure 3. FT-IR spectra of samples deformed at 1473 K under hydrous conditions after base
line correction and thickness normalization to 1 cm. (a) sample deformed at 2 GPa. (b)
sample deformed at 5 GPa. The red spectra were obtained before deformation. The blue and
black spectra were obtained after deformation at the sample center and rim, respectively.
Typical dislocation microstructures activated under hydrous conditions are shown in Fig.
5. Dislocation lines and loops with the Burgers vector of [100] were observed on the (001)
plane, suggesting that the [100](001) slip system was activated. The majority of dislocation
lines elongate in the [010] direction, indicating their edge characters. The dislocation loops
consist of long edge segment (b-elongated) and short screw segment (a-elongated), indicating
lower mobility of the edge components in comparison with the screw components. Some
screw dislocations have cross-slip (Fig 5c) or were pinned by jogs (Fig. 5b and 5c) and edge
dipoles (Fig. 5c), which are related to movements of jogged screw dislocations. The [100]
short edge dislocations are likely to be debris which originates from edge dipoles (Fig. 5a and
5c) or dislocations on other (0kl) slip planes (e.g. Green and Radcliffe, 1972). The [100]
dislocations elongated to the [001] directions, which are dominant under anhydrous
conditions, also exist.

139
Figure 4. WBDF images showing character of [100] dislocations in the sample deformed
under anhydrous conditions. a) sample deformed at 2 GPa and 1473 K. b) sample deformed
at 3 GPa and 1573 K. The all images were taken using g = 400. The [100] dislocations along
the [001] direction are indicated by blue arrows.
Figure 5. WBDF images showing dislocation character of sample deformed at 1473 K under
hydrous conditions. Crystallographic axes are shown in a). a) sample deformed at 2 GPa. b)
and c) hydrous sample deformed at 5 GPa. The all images were taken using g = 400. The
[100] dislocations on the (001) plane are generally curved, and kinks are shown by red arrows.
Screw dislocations have cross-slips (white arrows) and are pinned by jogs (green arrows) or
edge dipoles (orange arrows). Movement of jogged screw dislocations left a lot of short edge

140
segments (pink arrows). The [100] dislocations along the [001] direction are indicated by
blue arrows.
6.5 Discussion
Comparison of the dislocation microstructures with previous
studies
The [100](001) slip system has been reported by previous studies (Durham et al., 1977;
Bai and Kohlstedt 1993) under anhydrous and high-temperature (>1623 K) conditions.
Durham et al. (1977) reported that such dislocations exhibit a peculiar microstructure with
zigzag line configurations corresponding to the stabilization of <110> segments. Bai and
Kohlstedt (1992) found that the dislocation structures developed at high oxygen fugacity are
the same as those in Durham et al. (1977). At low oxygen fugacity, Bai and Kohlstedt (1992)
found that the dislocation configuration consists of long straight screw and short curved edge
segments. The dislocation configuration developed under hydrous conditions in the present
study is quite different from these previous studies. Dislocations developed under hydrous
conditions in this study consist of long edge and short curved screw segments instead of long
straight screw and short curved edge dislocations, indicating that glide velocity of screw
dislocation is more enhanced by water incorporation than that of edge dislocations. Moreover,
no <110> zigzag edge dislocation line was observed in the present study. Instead, edge
dislocation lines are curved and have kinks. The observations that dislocation lines are
generally curved and kinked indicate that the Peierls stress for this slip system is reduced by
water incorporation and dislocation glide velocity is enhanced.

141
The mechanism of activation of the [100](001) slip system
due to water incorporation
The olivine structure has an orthorhombic symmetry with the space group Pbnm. This
structure has three different oxygen sites (O1, O2, O3), two different metal sites (M1, M2)
and one silicon site. O1, O2, M2 and Si lie on mirror planes, while M1 lies on an inversion
center. O3 lies in a general position. A slip on the (001) plane needs to cut Si-O or/and M-O
bonds. Since Si-O bonding has higher energy than M-O bonding, the slip plane prefers to
avoid cutting Si-O bonds, as shown in Fig. 6. However, this plane cuts 10 M-O bonds in one
unit cell. In the case of (010) slip plane, which is an easy slip plane for olivine, only 4 M-O
bonds are needed to be cut. Therefore, the high energy required to break chemical bonding
perpendicular to the [001] direction can explain why this slip system was activated at high
temperatures (Bai and Kohlstedt, 1993; Durham et al., 1997) but was not activated in the
samples that were deformed under low-temperature and anhydrous conditions in our study.
Figure 6. Olivine structure viewed from near [100] direction. The green plane shows a (001)
slip plane cut only M-O bonds. Red sticks indicate M-O bonds. Blue sticks indicate Si-O
bonds. M-O bonds cut by the slip plane are indicated by yellow sticks.
Crystallographic sites where H is incorporated in the olivine structure are still under
debate (Berry et al., 2005; Keppler and Bolfan-Casanova, 2006; Kohlstedt et al., 1996;

142
Lemaire et al., 2004; Matveev et al., 2001; Matveev et al., 2004; Mosenfelder et al., 2006;
Zhao et al., 2004). Nevertheless, there is an agreement on the direction of O-H bonding based
on polarized infra-red (IR) spectroscopy. The directions of O-H bonding suggested by IR
spectroscopy are generally parallel to the [100] and [001] axes but not parallel to the [010]
axis in olivine (e.g. Bell et al., 2003; Jamtveit et al., 2001; Lemaire et al., 2004). The [001]
aligned O-H bond certainly weakens the bond strength in the [001] direction, which makes
the (001) slip possible.
6.6 Implications
The decrease of seismic anisotropy with depth has been observed by several studies
(Dziewonski and Anderson, 1981; Gung et al., 2003; Montagner and Kennett, 1996; Nettles
and Dziewonski, 2008; Visser et al., 2008). One explanation is that olivine fabric changes
from A- to E-type due to water(Katayama et al., 2004; Karato et al., 2008). However, the
[100](001) slip system was only reported under anhydrous conditions (Bai and Kohlstedt,
1992; Durham et al., 1977). Whether this slip system can be activated under hydrous
conditions was unclear before the present study. Our TEM observation of the samples
deformed under anhydrous and hydrous conditions suggests that water facilitates activation
of the [100](001) slip at relatively low temperatures. The physical reason for the activation is
the reduction of Peierls stresses because of water incorporation, which was revealed by the
dislocation structures. Therefore, the E-type fabric can exist under hydrous conditions, and
the weak seismic anisotropy of the asthenosphere could be explained by the predominance of
this fabric.
6.7 Acknowledgements
We acknowledge F. Heidelbach and P. O’Brien for providing the olivine single crystals
and T. Boffa-Ballaran for instructing the single crystal X-ray diffractometry. We thank
technicians in BGI for the sample and assembly preparation. This research was supported by

143
DFG grants to TK (KA3434/3-1, KA3434/7-1, KA3434/8-1 and KA3434/9-1) and by the
annual budget of BGI.
6.8 References
Angel, R., and Finger, L. (2011) SINGLE: a program to control single-crystal diffractometers.
Journal of Applied Crystallography, 44(1), 247-251.
Bai, Q., and Kohlstedt, D.L. (1992) High-temperature creep of olivine single crystals, 2.
dislocation structures. Tectonophysics, 206(1–2), 1-29.
Bell, D.R., Rossman, G.R., Maldener, J., Endisch, D., and Rauch, F. (2003) Hydroxide in
olivine: A quantitative determination of the absolute amount and calibration of the IR
spectrum. Journal of Geophysical Research-Solid Earth, 108(B2), 9.
Berry, A.J., Hermann, J.r., O'Neill, H.S., and Foran, G.J. (2005) Fingerprinting the water site
in mantle olivine. Geology, 33(11), 869-872.
Darot, M., and Gueguen, Y. (1981) High‐temperature creep of forsterite single crystals.
Journal of Geophysical Research: Solid Earth, 86(B7), 6219-6234.
Durham, W.B., and Goetze, C. (1977) A comparison of the creep properties of pure forsterite
and iron-bearing olivine. Tectonophysics, 40(3), T15-T18.
Durham, W.B., Goetze, C., and Blake, B. (1977) PLASTIC-FLOW OF ORIENTED
SINGLE-CRYSTALS OF OLIVINE .2. OBSERVATIONS AND
INTERPRETATIONS OF DISLOCATION-STRUCTURES. Journal of Geophysical
Research, 82(36), 5755-5770.
Dziewonski, A.M., and Anderson, D.L. (1981) Preliminary reference Earth model. Physics of
the Earth and Planetary Interiors, 25(4), 297-356.
Gaboriaud, R., Darot, M., Gueguen, Y., and Woirgard, J. (1981) Dislocations in olivine
indented at low temperatures. Physics and Chemistry of Minerals, 7(2), 100-104.
Goetze, C., and Kohlstedt, D.L. (1973) Laboratory study of dislocation climb and diffusion in
olivine. Journal of Geophysical Research, 78(26), 5961-5971.

144
Gose, J., Schmaedicke, E., Markowitz, M., and Beran, A. (2010) OH point defects in olivine
from Pakistan. Mineralogy and Petrology, 99(1-2), 105-111.
Green, H., and Radcliffe, S. (1972) Dislocation mechanisms in olivine and flow in the upper
mantle. Earth and Planetary Science Letters, 15(3), 239-247.
Gung, Y., Panning, M., and Romanowicz, B. (2003) Global anisotropy and the thickness of
continents. Nature, 422(6933), 707-711.
Hirth, G., and Kohlstedt, D.L. (1996) Water in the oceanic upper mantle: implications for
rheology, melt extraction and the evolution of the lithosphere. Earth and Planetary
Science Letters, 144(1–2), 93-108.
Ismaı̈l, W.B., and Mainprice, D. (1998) An olivine fabric database: an overview of upper
mantle fabrics and seismic anisotropy. Tectonophysics, 296(1–2), 145-157.
Jamtveit, B., Brooker, R., Brooks, K., Larsen, L.M., and Pedersen, T. (2001) The water
content of olivines from the North Atlantic Volcanic Province. Earth and Planetary
Science Letters, 186(3-4), 401-415.
Jung, H., and Karato, S.-i. (2001) Water-Induced Fabric Transitions in Olivine. Science,
293(5534), 1460-1463.
Jung, H., Katayama, I., Jiang, Z., Hiraga, T., and Karato, S. (2006) Effect of water and stress
on the lattice-preferred orientation of olivine. Tectonophysics, 421(1–2), 1-22.
Karato, S.-I., and Jung, H. (2003) Effects of pressure on high-temperature dislocation creep
in olivine. Philosophical Magazine, 83(3), 401-414.
Karato, S.-i., Jung, H., Katayama, I., and Skemer, P. (2008) Geodynamic Significance of
Seismic Anisotropy of the Upper Mantle: New Insights from Laboratory Studies.
Annual Review of Earth and Planetary Sciences, 36(1), 59-95.
Katayama, I., Jung, H., and Karato, S.-i. (2004) New type of olivine fabric from deformation
experiments at modest water content and low stress. Geology, 32(12), 1045-1048.
Keppler, H., and Bolfan-Casanova, N. (2006) Thermodynamics of water solubility and
partitioning. Reviews in Mineralogy and Geochemistry, 62(1), 193-230.

145
Kohlstedt, D., Keppler, H., and Rubie, D. (1996) Solubility of water in the α, β and γ phases
of (Mg, Fe) 2SiO4. Contributions to Mineralogy and Petrology, 123(4), 345-357.
Kohlstedt, D.L., and Goetze, C. (1974) Low-stress high-temperature creep in olivine single
crystals. Journal of Geophysical Research, 79(14), 2045-2051.
Kumazawa, M., and Anderson, O.L. (1969) Elastic moduli, pressure derivatives, and
temperature derivatives of single-crystal olivine and single-crystal forsterite. Journal
of Geophysical Research, 74(25), 5961-5972.
Lemaire, C., Kohn, S., and Brooker, R. (2004) The effect of silica activity on the
incorporation mechanisms of water in synthetic forsterite: a polarised infrared
spectroscopic study. Contributions to Mineralogy and Petrology, 147(1), 48-57.
Mainprice, D. (2007) Seismic anisotropy of the deep Earth from a mineral and rock 1022
physics perspective. Schubert, G. Treatise in Geophysics Volume 2 pp437-492.
Oxford.
Matveev, S., O’neill, H.S.C., Ballhaus, C., Taylor, W.R., and Green, D. (2001) Effect of silica
activity on OH− IR spectra of olivine: implications for low-a SiO2 mantle
metasomatism. Journal of Petrology, 42(4), 721-729.
Matveev, S., Portnyagin, M., Ballhaus, C., Brooker, R., and Geiger, C. (2004) FTIR spectrum
of phenocryst olivine as an indicator of silica saturation in magmas. Journal of
Petrology, 46(3), 603-614.
Michibayashi, K., Mainprice, D., Fujii, A., Uehara, S., Shinkai, Y., Kondo, Y., Ohara, Y., Ishii,
T., Fryer, P., and Bloomer, S.H. (2016) Natural olivine crystal-fabrics in the western
Pacific convergence region: A new method to identify fabric type. Earth and Planetary
Science Letters, 443, 70-80.
Montagner, J.P., and Kennett, B.L.N. (1996) How to reconcile body-wave and normal-mode
reference earth models. Geophysical Journal International, 125(1), 229-248.
Mosenfelder, J.L., Deligne, N.I., Asimow, P.D., and Rossman, G.R. (2006) Hydrogen
incorporation in olivine from 2–12 GPa. American Mineralogist, 91(2-3), 285-294.

146
Mussi, A., Cordier, P., Demouchy, S., and Vanmansart, C. (2014) Characterization of the glide
planes of the [001] screw dislocations in olivine using electron tomography. Physics
and Chemistry of Minerals, 41(7), 537-545.
Nettles, M., and Dziewonski, A.M. (2008) Radially anisotropic shear velocity structure of the
upper mantle globally and beneath North America. Journal of Geophysical
Research-Solid Earth, 113(B2), 27.
Ohuchi, T., Kawazoe, T., Higo, Y., Funakoshi, K.-i., Suzuki, A., Kikegawa, T., and Irifune, T.
(2015) Dislocation-accommodated grain boundary sliding as the major deformation
mechanism of olivine in the Earth’s upper mantle. Science advances, 1(9), e1500360.
Paterson, M. (1982) The determination of hydroxyl by infrared absorption in quartz, silicate
glasses, and similar materials. Bulletin de la Societe Francaise de Mineralogie, 105,
20-29.
Phakey, P., Dollinger, G., and Christie, J. (1972) Transmission electron microscopy of
experimentally deformed olivine crystals. Flow and Fracture of rocks, 117-138.
Ringwood, A.E. (1991) Phase transformations and their bearing on the constitution and
dynamics of the mantle. Geochimica et Cosmochimica Acta, 55(8), 2083-2110.
Tommasi, A., and Vauchez, A. (2015) Heterogeneity and anisotropy in the lithospheric mantle.
Tectonophysics, 661, 11-37.
Visser, K., Trampert, J., Lebedev, S., and Kennett, B.L.N. (2008) Probability of radial
anisotropy in the deep mantle. Earth and Planetary Science Letters, 270(3–4),
241-250.
Zhao, Y.-H., Ginsberg, S., and Kohlstedt, D. (2004) Solubility of hydrogen in olivine:
dependence on temperature and iron content. Contributions to Mineralogy and
Petrology, 147(2), 155-161.

147
7 Small effect of water on olivine dislocation
creep
Lin Wanga,*, Nobuyoshi Miyajimaa, Takaaki Kawazoea, and Tomoo Katsuraa
a Bayerisches Geoinstitut, University of Bayreuth, 95440 Bayreuth, Germany.
7.1 Abstract
Dislocation recovery experiments were conducted on pre-deformed olivine single
crystals at 1,473 K, 5 GPa, and oxygen fugacity near the enstatite-magnesite-olivine-graphite
(EMOG) buffer at water contents ranging from 5 to 90 wt. ppm to determine the annihilation
rates for [001] dislocations on the (001) plane. Olivine single crystals were first hydrated or
dehydrated at 5 GPa, 1473 K or room pressure, 1473 K, respectively. The pre-annealed
olivine was then deformed to activate the desired slip systems under simple shear geometry
and then annealed at target conditions. The dislocation characters change from screw to edge
with increasing water contents. The dislocation annihilation rate constants increase with water
content with a power of 0.3. Since the rate constant is proportional to dislocation mobility, we
conclude that water has small effect on olivine dislocation creep. Hence, the softening of
asthenosphere cannot be explained by the hydrous weakening.
7.2 Introduction
Olivine is the most abundant and weakest mineral in the upper mantle, and therefore its
rheological properties are fundamental to understand mantle dynamics. Dislocation creep,
which is facilitated by motion of dislocations, is considered as one of the important

148
mechanisms for olivine deformation in the upper mantle (e.g. Fei et al., 2016; Hirth and
Kohlstedt, 2003; Karato and Wu, 1993), and consequently determine the upper mantle
viscosity to a great extent. In addition, the lattice preferred orientation (LPO), or fabric, of
olivine, which is a consequence of dislocation creep, is the main reason for the upper mantle
seismic anisotropy. Since dislocation creep is influence by thermodynamic parameters, such
as P, T, water content, it is important to understand the effects of these parameters on
dislocation creep.
Among all the parameters, the effect of water on the olivine dislocation creep has been
debated recently. Deformation experiments on olivine aggregate demonstrated that the creep
rate of olivine is enhanced by water incorporation with a power of 1.2 (Hirth and Kohlstedt,
2003). On the other hand, recent diffusion experiments (Fei et al., 2016; Fei et al., 2013)
suggested a small effect on the olivine rheology based on the assumption that olivine creep is
controlled by Si diffusion. Since the asthenosphere contains certain amounts of water (Hirth
and Kohlstedt, 1996), the viscosities of the asthenosphere estimated by these two methods
differ by orders of magnitude.
Another debate on the effect of water on olivine rheology is that whether water-induced
fabric transition exists or not. Deformation experiments (Jung and Karato, 2001; Jung et al.,
2006; Katayama et al., 2004) suggested that the dominant fabric changes from A- to E- to
C-type with increasing water content, indicating different slip systems have different water
dependences. However, diffusion experiments (Costa and Chakraborty, 2008; Fei et al., 2013)
suggested that the effect of water on Si lattice diffusion in olivine is isotropic. Accordingly, it
is unlikely to have water-induced fabric transition if dislocation creep is controlled by Si
lattice diffusion. Therefore, it is essential to constrain the effect of water on olivine
dislocation creep for different slip systems.
Both deformation and diffusion techniques have limitations in determining the effect of
water on olivine dislocation creep. In one hand, strain rates in deformation experiments are in
the range of 10-6 to 10-4 s-1, which are nearly ten orders of magnitude higher than those in the
asthenosphere. The rate-limiting process of dislocation creep may change at different strain

149
rates. Therefore, the extrapolation of deformation results to natural strain rate conditions may
be problematic. In additions, the majority of deformation experiments were conducted on
polycrystalline olivine samples under water-saturated conditions, which is not the case at
most regions of the asthenosphere. The possible existence of free water in grain boundaries
may also bias the results. On the other hand, connection between dislocation creep rate and Si
self-diffusivity is rather indirect. Application of diffusion results on deformation has to base
on certain models, which need various assumptions. In addition, steady-state deformation
requires the same rates of dislocation production and annihilation. This indicates interactions
between dislocations must occur during dislocation creep, which cannot be investigated by
diffusion experiments.
For these reasons, we use dislocation recovery method in this study to study dislocation
motions. The activation of [001](100) slip system is responsible for the C-type fabric in
olivine. Deformation experiments demonstrated that C-type fabric dominates at high water
content (Jung and Karato, 2001), indicating that this slip system must have the largest water
dependence among all slip systems in olivine. Therefore, the water dependence of this slip
system represents the maximum water dependence of olivine dislocation creep. We
conducted dislocation recovery experiments to dislocations produced by the [001](100) slip
system (hereafter called c-dislocations) at various water contents at a pressure of 5 GPa and a
temperature of 1473 K to get water dependence of dislocation annihilation rate constants of
this kind of dislocations. Since annihilation rate constants are considered to be proportional to
dislocation mobility, the water dependence of rate constants should be identical to that of
dislocation motions. Our results show that the rate constants of c-dislocations increase with
water content only with a power of 0.3. Therefore, the effect of water on olivine dislocation
creep is small.

150
7.3 Experimental Procedures
Sample Preparation
Single crystals of natural olivine from Pakistan were employed in this study. The
same olivine was used in our previous studies (Wang et al., 2016; 2017). The a-axis of each
crystal was determined using a Huber single-crystal diffractometer operated by SINGLE2014
(Angel and Finger, 2011). The oriented olivine crystals were mounted in epoxy resin with the
(100) plane exposed to the surface, and then polished using diamond powder with a grain size
of 0.25 μm. The [010] and [001] directions were determined by means of electron
backscattered diffraction (EBSD). The cube with 1.5 mm edge length was shaped from the
oriented crystal along its crystallographic planes.
Hydration/dehydration experiments
The olivine cubes were hydrated or dehydrated before deformation. In dehydration
experiments, the cubes were put into a Pt basket and annealed at ambient pressure and a
temperature of 1473 K for 12 h in a CO-CO2 gas mixing furnace. The oxygen partial pressure
was controlled at 10-7.5 MPa, which was near the enstatite-magnesite-olivine-graphite
(EMOG) buffer.
Hydration experiments were conducted at a pressure of 5 GPa and a temperature of 1473
K using a Kawai-type multi-anvil apparatus at University of Bayreuth. The cell assembly is
shown in Fig. 1. A single-crystal olivine cube was loaded into a gold capsule with outer and
inner diameters of 3.7 and 3.2 mm, respectively, whose one end was sealed. A mixture of talc,
brucite and FeO powders (weight ratio 1.7:1:0.3) was loaded at the sealed end of the capsule.
This mixture gives the composition of (Mg0.9Fe0.1)2SiO4 and (Mg0.9Fe0.1)SiO3 with molar
ratio of 9:1. It was used as a water source and also to control the silica activity of the sample.
Graphite powder was used to surround the cube to prevent its mechanical damage during
compression and to constrain the oxygen fugacity inside the capsule near the EMOG buffer

151
conditions. Various water contents in the samples were obtained by varying the ratio of the
water source to graphite. Open ends of the capsules were closed and sealed by arc welding
after loading. The gold capsule was located in an MgO cylinder in a graphite stepped heater
with a ZrO2 thermal insulator. Tungsten carbide anvils with a 15 mm truncated edge length
were used to generate high pressure together with a Cr2O3-doped MgO octahedron with a 25
mm edge length as a pressure medium. Sample pressures were estimated based on calibration
against the hydraulic oil pressure using the phase transitions of Bi at ambient temperature and
Mg2SiO4 polymorphs. Temperatures were measured using a W97%Re3%-W75%Re25%
thermocouple whose junction was located near one end of the capsule. The samples were
pressurized to 5 GPa in 4 h, heated to a temperature of 1473 K at a rate of 50 K/min, and kept
at this temperature for more than 12 h. After annealing, the samples were quenched by
switching off the heating power, and decompressed to ambient pressure in 16 h. After
hydration, the samples were polished to be cubes with an edge length of 1 to 1.2 mm to
remove graphite and magnesite on the surfaces.
Figure 1. The sample assembly used in the multi-anvil hydration experiments.
Deformation experiments
Deformation experiments were conducted using a Kawai-type multi-anvil apparatus at

152
pressures of 5 GPa and temperatures of 1473. Figure 2 shows the experimental setup. The
setup is similar to that used in Wang et al., (2016) except for the following three points. One
is that olivine was oriented in the shear geometry in the [001] direction on the (100) plane.
The second one is that thin layers of talc + brucite+ FeO mixtures were put between the MgO
slice and alumina pistons in hydrous deformation experiments in order to prevent dehydration
of olivine at high temperatures. The third one is that the Pt capsule was welded.
The samples were first pressurized to a target pressure at ambient temperature for 4 h.
A target temperature was reached in 15 min, and kept constant for 15 min to sinter the
crushable alumina. The samples were then further compressed by increasing press load of 0.2
MN in 15 min for deformation. After the deformation, the samples were quenched by
switching off the heating power, and then decompressed to ambient pressure for more than 16
h.
Figure 2. The sample assembly used in the multi-anvil high-pressure deformation
experiments. The crystallographic orientation is also shown.
TEM observation
Deformed samples were fixed on glass slides and double-side polished parallel to the
(100) planes to thicknesses ranging from 23 to 35 μm. After removing olivine from the glass

153
slide, an Ar ion-milling method was used to make the sample thinner, with a voltage of 4.5
kV and incident angles of 4 to 8º from the top and bottom of the ion-bombardment, and the
total thinning time varying between 14 to 25 h depending on the thicknesses and size of each
sample. TEM observations were performed with a FEI Titan G2 80-200 S/TEM equipped
with 4 SDD energy-dispersive X-ray spectrometers, operating at an acceleration voltage of
200 kV. Dislocation microstructures were examined by dark-field (DF) and weak-beam
dark-field (WBDF) imaging and selected-area electron diffraction (SAED). We chose the
diffraction vector with g = 004 to observe the [001] dislocations and determine their
characters. c-edge dislocations would elongate in [010] while c-screws would elongate in
[001].
Recovery experiments
The rest of the deformed single crystals were cut into 4 pieces and paired into 2 groups.
If c-edge dislocations dominate, pieces in the same group shear a common (010) plane. If
c-screw dislocations dominate, pieces in the same group shear a common (001) plane. One
piece in each group was used in the annealing experiments. The other was used to determine
the dislocation density before annealing.
Recovery experiments were conducted at a pressure of 5 GPa and a temperature of 1473
K using a Kawai-type multi-anvil apparatus at University of Bayreuth. The cell assembly is
the same as that in hydration experiments. The same amounts of water source as those in the
corresponding hydration experiments were used in order to keep water contents remain
unchanged during annealing. No water source was added in anhydrous recovery experiments.
FT-IR measurements
Water contents of the samples before and after annealing were determined by
un-polarized FT-IR spectroscopy with 200 scans for each spectrum at a resolution of 1 cm−1.
Spectra were taken at the rim and center of the sample after annealing to investigate the water

154
distributions inside the sample. The light paths were perpendicular to the (010) planes of the
samples. Paterson (1982) calibration was used for calculation of the water contents in order to
compare our results with those obtained by Hirth and Kohlstedt., (2003). We emphasize that,
as is shown later, we will obtain water content dependence of dislocation annihilation rate
constant, which is independent from choice of calibration.
Measurement of dislocation density and data reduction
Dislocations were observed using the same oxidation decoration technique as Wang et al.
(2016), except for the oxidation temperature, which is 800oC. The corresponding areas away
from subgrain boundary on the common (001) or (010) plane in the initial and annealed
pieces from the same group were observed to determine the change in dislocation density
before and after annealing.
The annihilation rate constants were calculated using the second-order dislocation
recovery kinetics (Karato and Ogawa, 1982; Kohlstedt et al., 1980)
𝑘𝑘 =1𝜌𝜌𝑓𝑓− 1𝜌𝜌𝑖𝑖
𝑒𝑒, (2)
where 𝜌𝜌𝑠𝑠 and 𝜌𝜌𝑒𝑒 are the dislocation density after and before annealing, respectively, and t is
the annealing time. The k at different water contents were fitted to the power law:
𝑘𝑘 = 𝑘𝑘0𝐶𝐶OH𝑑𝑑 (3)
where k0 is a constant, COH is water content, r is the water exponent. As discussed above, this
exponent should represent that of dislocation creep.
7.4 Results
Table 1 shows recovery experimental results together with the annealing conditions.

155
Figure 3 shows TEM observations of dislocation structures after deformation without
annealing. At lower water contents (< 25 wt. ppm), [001]-elongated c-screw dislocations are
dominant, while [010]-elongated c-edge dislocations dominate at higher water contents. This
indicates dislocation motions are controlled by screw and edge dislocations at lower and
higher water contents, respectively. For this reason, the dislocation densities are counted
using the images on the (001) and (010) plane in high-water content and low-water content
samples to count c-screw and c-edge dislocations, respectively. Fig. 4 shows the decorated
dislocations before and after annealing. The decrease in dislocation density was observed
after annealing.
Table 1. Summary of experiment conditions and results.1
1 All the annealing experiments were conducted as 5 GPa, 1473 K
* Anhydrous annealing experiments, samples from anhydrous deformation experiments # Hydrous annealing experiments, sample from hydrous deformation experiments
No Water before
(wt. ppm)
Water after
(wt. ppm)
ρi
(μm-2)
ρf
(μm-2)
t
(h)
Log k ()
Z1483* 5 5 8.09±0.95 0.46±0.04 18.2 16.5 ± 0.1
Z1495* 5 7 1.31±0.16 0.66±0.04 15.5 16.9 ± 0.1
Z1675* 19 25 0.33±0.11 0.20±0.05 10 -16.3 ±0.4
Z1712# 86 91 1.91±0.1 0.88±0.09 6 -16.5 ± 0.1
Z1731# 76 75 2.54±0.05 0.53±0.11 6 16.2 ± 0.1

156
Figure 3. TEM images showing dislocation character changes with water. (a) 7 wt. ppm water.
(b) 75 wt. ppm water. Screw and edge dislocations elongate in [001] and [010] direction,
respectively.
Figure 4. Backscattered electron images of the oxidation-decorated olivine. The bright spots
and lines are expected to indicate presence of dislocations. The scale bars denote 2 μm. (a)
and (b) are dislocation structure before and after annealing at anhydrous conditions from
sample Z1483. (c) and (d) are dislocation structure before and after annealing at hydrous

157
conditions from sample Z1731.
The FT-IR spectra of samples before and after annealing were shown in Fig. 5. Water
content nearly remains constant during annealing. Moreover, the spectra take at rim and
center in the hydrous annealed sample are indistinguishable. This indicates the distribution of
water in the sample after annealing was nearly homogeneous. The water contents in the
samples are below the water solubility in olivine (Kohlstedt et al., 1996).
Figure 6 plots the logarithmic of dislocation annihilation rate constants against the
logarithmic of water contents. The fitted water exponent r is 0.3 ± 0.2. Since the water
exponents of the rate constant and dislocation creep are considered identical, we conclude
that the water effect on olivine dislocation creep is small.

158
Figure 5. FT-IR spectra after base line correction and thickness normalization to 1 cm. Top:
anhydrous annealed sample. Bottom: hydrous annealed sample. The red spectra were
obtained before annealing. The blue and black spectra were obtained after annealing at the
sample center and rim, respectively.
7.5 Discussion
Comparison with previous studies
The effect of water on olivine dislocation creep has been investigated by deformation
experiments. The experiments on olivine aggregate (e.g. Hirth and Kohlstedt, 2003; Mei and
Kohlstedt, 2000) render a water exponent of 1.2, which indicates a large effect of water. Since
these experiments did not specific the slip systems activated in their experiments, 1.2 can be
regarded as the average value of water exponent of all slip systems activated in these
experiments. Since the C-type fabric is expected to dominate at high water contents (Jung and
Karato, 2001), the water exponent of c-dislocations should be higher than 1.2. This
contradicts with present results. The possible reason is that the free water existing at grain
boundaries in these experiments lubricate the grain boundaries, and therefore enhance the
creep rate (Fei et al., 2013). This is supported by deformation experiments on olivine single
crystal at hydrous conditions, which renders the water exponent only 0.2 (Mackwell and
Kohlstedt, 1985).

159
Figure 6. Dislocation annihilation rate constants (k) in the [001](100) slip systems against
water content.
Since dislocation creep of olivine is believed to be controlled by Si diffusion at high
temperatures, the effect of water on olivine dislocation creep can be understood by studying
the effect of water on Si diffusivities in olivine. The rate constants are expected to be
proportional to the diffusivity that controls the dislocation motions with a proportional
constant 300 (Karato and Ogawa, 1982). Figure 7 compares the diffusivity calculated from
rate constants (DR) and that from previous studies on Si lattice diffusion (DSiLat, Fei et al.,
2013) and grain-boundary diffusion (DSiGB, Fei et al., 2016) at different water contents.
Diffusion data were normalized to 5 GPa and 1473 K using their activation energies and
activation volumes and 10 nm width of grain boundary is assumed when calculate DSiGB from
Fei et al., (2016). The water dependence of DR is identical to that of DSiLat
and DSiGB.
However, the absolute values differ by orders of magnitude. This indicates dislocation
annihilation is not controlled by DSiLat or DSi
GB. Hirth and Kohlstedt (2015) proposed that Si
pipe diffusion (DPipe) may control the deformation. Since vacancies, dislocations and
grainboudaries are 0-, 1-, 2-dimension defects, the structure distortion near vacancies is

160
expected to be higher than that near dislocation cores, which should be higher than that in
grain-boundaries. Therefore, it is reasonable to assume that DPipe lies between DSiLat or DSi
GB.
Thus, Si pipe diffusion may control dislocation recovery and therefore dislocation creep of
olivine.
Figure 7. Comparison of Si diffusivities in olivine with diffusivity that controls dislocation
motions estimated from dislocation recovery.
Geophysical implications
The small water exponent of olivine dislocation creep indicates water is not the reason
for the softening of the asthenosphere. Geophysical observations (e.g. Hager, 1991; Peltier,
1998) and geodynamic modellings (e.g. Becker, 2017; Craig and McKenzie, 1986) suggested
that viscosity of the asthenosphere is much lower than that of the lithosphere. Since the
asthenosphere contains more water than the lithosphere, the small viscosity of the
asthenosphere was explained by hydrous weakening of olivine (Hirth and Kohlstedt, 2003;
Karato, 1986). However, based on our study, this explanation is not possible. The water
content in olivine at the source of mid-ocean ridge basalt (MORB) is expected to be 810 ppm

161
H/Si (Hirth and Kohlstedt, 1996). Such amount of water only reduces viscosity of MORB
source mantle only by a factor 8. On the other hand, the rapid increase of temperature from
lithosphere to asthenosphere (Green and Ringwood, 1967) cause seven orders of magnitude
reduction of mantle viscosity from 60 km to 200 km, assuming the activation energy for
olivine dislocation creep is 400 kJ/mol (Wang et al., 2016). Therefore, the effect of water on
the upper mantle rheology is negligible comparing with temperature effect.
The water induced fabric transition may be impossible judging from present results.
Since r of olivine dislocation creep obtained from deformation experiments on olivine
aggregate is biased by grain boundary water, we use r from olivine single crystal deformation
experiments (Mackwell and Koholstedt, 1985), which is 0.2, to represent the average water
exponent for all slip systems in olivine. This value is identical to our result. Therefore, we
conclude that all the slip systems in olivine might have the same water dependence. Thus, the
water-induced fabric transitions are unlikely. This hypothesis needs to be checked by further
studies on the water effect on other slip systems in olivine.
7.6 Acknowledgements
We thank H. Fischer, R. Njul in BGI for the sample and assembly preparation. This
research was supported by DFG grants to TK (KA3434-3/1, KA3434-7/1 and KA3434-8/1)
and by the annual budget of BGI.
7.7 References
Angel, R., Finger, L., 2011. SINGLE: a program to control single-crystal diffractometers.
Journal of Applied Crystallography 44, 247-251.
Becker, T.W., 2017. Superweak asthenosphere in light of upper mantle seismic anisotropy.
Geochemistry, Geophysics, Geosystems.
Costa, F., Chakraborty, S., 2008. The effect of water on Si and O diffusion rates in olivine and
implications for transport properties and processes in the upper mantle. Physics of the

162
Earth and Planetary Interiors 166, 11-29.
Craig, C.H., McKenzie, D., 1986. The existence of a thin low-viscosity layer beneath the
lithosphere. Earth and Planetary Science Letters 78, 420-426.
Fei, H., Koizumi, S., Sakamoto, N., Hashiguchi, M., Yurimoto, H., Marquardt, K., Miyajima,
N., Yamazaki, D., Katsura, T., 2016. New constraints on upper mantle creep mechanism
inferred from silicon grain-boundary diffusion rates. Earth and Planetary Science Letters
433, 350-359.
Fei, H., Wiedenbeck, M., Yamazaki, D., Katsura, T., 2013. Small effect of water on
upper-mantle rheology based on silicon self-diffusion coefficients. Nature 498, 213-+.
Gose, J., Schmaedicke, E., Markowitz, M., Beran, A., 2010. OH point defects in olivine from
Pakistan. Mineralogy and Petrology 99, 105-111.
Green, D., Ringwood, A., 1967. The genesis of basaltic magmas. Contributions to
Mineralogy and Petrology 15, 103-190.
Hager, B.H., 1991. Mantle viscosity: A comparison of models from postglacial rebound and
from the geoid, plate driving forces, and advected heat flux, Glacial isostasy, sea-level
and mantle rheology. Springer, pp. 493-513.
Hirth, G., Kohlstedt, D., 2003. Rheology of the Upper Mantle and the Mantle Wedge: A View
from the Experimentalists, Inside the Subduction Factory. American Geophysical Union,
pp. 83-105.
Hirth, G., Kohlstedt, D., 2015. The stress dependence of olivine creep rate: Implications for
extrapolation of lab data and interpretation of recrystallized grain size. Earth and
Planetary Science Letters 418, 20-26.
Hirth, G., Kohlstedt, D.L., 1996. Water in the oceanic upper mantle: implications for rheology,
melt extraction and the evolution of the lithosphere. Earth and Planetary Science Letters
144, 93-108.
Jung, H., Karato, S.-i., 2001. Water-Induced Fabric Transitions in Olivine. Science 293,
1460-1463.
Jung, H., Katayama, I., Jiang, Z., Hiraga, T., Karato, S., 2006. Effect of water and stress on

163
the lattice-preferred orientation of olivine. Tectonophysics 421, 1-22.
Karato, S.-i., Wu, P., 1993. Rheology of the upper mantle: a synthesis. Science 260, 771-778.
Karato, S., 1986. Does partial melting reduce the creep strength of the upper mantle? Nature
319, 309-310.
Karato, S., Ogawa, M., 1982. High-pressure recovery of olivine: implications for creep
mechanisms and creep activation volume. Physics of the Earth and Planetary Interiors
28, 102-117.
Katayama, I., Jung, H., Karato, S.-i., 2004. New type of olivine fabric from deformation
experiments at modest water content and low stress. Geology 32, 1045-1048.
Kohlstedt, D., Keppler, H., Rubie, D., 1996. Solubility of water in the α, β and γ phases of
(Mg, Fe) 2SiO4. Contributions to Mineralogy and Petrology 123, 345-357.
Kohlstedt, D., Nichols, H., Hornack, P., 1980. The effect of pressure on the rate of dislocation
recovery in olivine. Journal of Geophysical Research: Solid Earth (1978–2012) 85,
3122-3130.
Mackwell, S.J., Kohlstedt, D.L., Paterson, M.S., 1985. The role of water in the deformation
of olivine single-crystals. Journal of Geophysical Research-Solid Earth and Planets 90,
1319-1333.
Mei, S., Kohlstedt, D.L., 2000. Influence of water on plastic deformation of olivine
aggregates 2. Dislocation creep regime. Journal of Geophysical Research-Solid Earth
105, 21471-21481.
Paterson, M., 1982. The determination of hydroxyl by infrared absorption in quartz, silicate
glasses, and similar materials. Bulletin de la Societe Francaise de Mineralogie 105,
20-29.
Peltier, W., 1998. Postglacial variations in the level of the sea: Implications for climate
dynamics and solid‐earth geophysics. Reviews of Geophysics 36, 603-689.
Wang, L., Blaha, S., Pintér, Z., Farla, R., Kawazoe, T., Miyajima, N., Michibayashi, K.,
Katsura, T., 2016. Temperature dependence of [100](010) and [001](010) dislocation
mobility in natural olivine. Earth and Planetary Science Letters 441, 81-90.

164
165
Acknowledgments
I would like to sincerely express my thanks to my supervisors Prof. Tomoo Katsura for his
patience and instruction in my study and life during my Ph.D. I also would like to appreciate
Takaaki Kawazoe for his guide and discussion during my study. I also thank Stephan Blaha,
Nobuyoshi Miyajima, Prof. Dan Frost, Tiziana Boffa Ballaran, Prof. Hans Keppler, Caroline
Bollinger, Florian Heidelbach for their instructions on experimental techniques and
discussion about the project.
I thank Joana Polednia for translating the German parts of this thesis and Kirsten Schulze
for her kind help to my family. I appreciate all BGI staff, Raphael Njul and Hubert Schulze for
preparing samples, Heinz Fischer and Uebelhack Stefan for making cell assemblies and parts,
Gerti Golner and Ulrike Trenz for help with chemicals, Stefan Keyssner, Petra Buchert and
Lydia Kison-Herzing for administrative and general helps.
I would also like to thank my families. Their supports and encouragements are always
valuable for me.

166
(Eidesstattliche) Versicherungen und Erklärungen
(§ 9 Satz 2 Nr. 3 PromO BayNAT)
Hiermit versichere ich eidesstattlich, dass ich die Arbeit selbstständig verfasst und keine anderen als die von mir angegebenen Quellen und Hilfsmittel benutzt habe (vgl. Art. 64 Abs. 1 Satz 6 BayHSchG).
(§ 9 Satz 2 Nr. 3 PromO BayNAT)
Hiermit erkläre ich, dass ich die Dissertation nicht bereits zur Erlangung eines akademischen Grades eingereicht habe und dass ich nicht bereits diese oder eine gleichartige Doktorprüfung endgültig nicht bestanden habe.
(§ 9 Satz 2 Nr. 4 PromO BayNAT)
Hiermit erkläre ich, dass ich Hilfe von gewerblichen Promotionsberatern bzw. -vermittlern oder ähnlichen Dienstleistern weder bisher in Anspruch genommen habenoch künftig in Anspruch nehmen werde.
(§ 9 Satz 2 Nr. 7 PromO BayNAT)
Hiermit erkläre ich mein Einverständnis, dass die elektronische Fassung meiner Dissertation unter Wahrung meiner Urheberrechte und des Datenschutzes einer gesonderten Überprüfung unterzogen werden kann.
(§ 9 Satz 2 Nr. 8 PromO BayNAT)
Hiermit erkläre ich mein Einverständnis, dass bei Verdacht wissenschaftlichen Fehlverhaltens Ermittlungen durch universitätsinterne Organe der wissenschaftlichen Selbstkontrolle stattfinden können.
………………………………………………………………………………………. Ort, Datum, Unterschrift


![[2013 Ahmad Lau Shariff] Temperature Pressure Dependence Membrane Permeance Process Economics Hollow Fiber Gas Separation System](https://img.dokumen.tips/doc/110x75/577cc1a91a28aba71193a2d3/2013-ahmad-lau-shariff-temperature-pressure-dependence-membrane-permeance.jpg)