Embed Size (px)
Citation preview
TEMPERATURE AND MAGNETIC FIELD DEPENDENCE OF THE SINGLE CRYSTAL ELASTIC CONSTANTS OF NICKEL
Joseph Wayne Brophy
M. S . Thesis Submitted to Iowa State University
Ames Laboratory, ERDA Iowa State University Ames, Iowa 50010
..--.-- NU1 ILC
This report was prepared as an account of work s p o ~ ~ r e d by the United States Government. Neither the United States no1 the United States Energy Research and Development Admlrdstration, nor any of their employees, nor any of theu contractors.
I subcontractors, or their employees, wkes a11y ' warmnty, express or implied, or assumes any legal liability or responsibility for the accuracy. completeness or usefulness of any information, apparatus, product or p r o m dipclosed, or represents that its use would not
1 in- privately owned rights. I -1 Date Transmitted: May 1975
PREPARED FOR THE U. S. ENERGY RESEARCH AND DEVELOPMENT ADMINISTRATION UNDER CONTRACT NO. W-7405-eng-82
DISCLAIMER
This report was prepared as an account of work sponsored by an agency of the United States Government. Neither the United States Government nor any agency Thereof, nor any of their employees, makes any warranty, express or implied, or assumes any legal liability or responsibility for the accuracy, completeness, or usefulness of any information, apparatus, product, or process disclosed, or represents that its use would not infringe privately owned rights. Reference herein to any specific commercial product, process, or service by trade name, trademark, manufacturer, or otherwise does not necessarily constitute or imply its endorsement, recommendation, or favoring by the United States Government or any agency thereof. The views and opinions of authors expressed herein do not necessarily state or reflect those of the United States Government or any agency thereof.

DISCLAIMER
Portions of this document may be illegible in electronic image products. Images are produced from the best available original document.

This repor t was prepared a s an account of work sponsored by the United States ~ o v e r n m e n t . Neither the United States nor. the United States Energy Re- search and Development Administration, nor any of the i r employees, nor any of their contractors , . sub- contractors , o r their employees, makes any war - ranty, express o r implied, o r a s sumes any legal liability o r responsibil i ty fo r the accuracy, com- pleteriess, o r usefulness of any information, apparatus , product o r process 'disclosed, o r represents that i t s use would not infringe privately owned rights.
Available from: National Technical Information Service U. S. Department of Commerce P.O. Box 1553 Springfield, VA 22 16 1
Pr ice : Microfiche ' $2. 25

iii ., , . .
TABLE OF CONTENTS
Page
INTRODUCTION
Purpose of the Investigation /
Review of the Problem and Literature Survey
EXPERIMENTAL PROCEDURE
Sample Preparation
Acoustic Measurements
RESULTS
Zero Applied ~ield Measurements
Field Dependent Measurements
DISCUSSION
Magnetic Field Depend.ence
Zero ~ield Temperature Dependence
SUMMARY \
BIBLIOGRAPHY 38
APPENDIX A 40
Pulse-Echo-Overlap System. 40
APPENDIX B 45
Crystal.Elasticity and Wave Propagation 45
ACKNOWLEDGMENTS 47

INTRODUCTION
Purpose of the Investigation
The purpose of this investigation was to apply 'state-of-
the-art' techniques to determine the single crystal elastic
constants of a ferromagnetic material, specifically nickel,
to obtain expertise in working with such materials. Supple-
mental to this was the up-grading of a pulsed.ultrasonic
apparatus to determine sound velocities; the details of the
apparatus can be found in ~ ~ ~ e n d i x A.
The data that were desired were the temperature depend-
ence of the demagnetized elastic constants and to measure, if
possible, the AE effect on single crystal elastic constants
quantitatively. The AE effect is the change in an elastic
modulus from the demagnetized state to the magnetically satur-
ated state. The effect has been thoroughly investigated in
polycrystalline samples.
Nickel was chosen for this investigation because of a
large AE effect, i t has heen reported to be as large as 30%
for polycrystalline samples (1,2), and because the existing
data on nickel are incomplete and contradictory.
Review of the Problem and Literature Survey
The unique feature of bulk ferr~ma~neticbodies is the
presence of domains of differing direction of the magnetiza-
tion vector in the demagnetized state. These domains are
separated by magnetic domain walls of finite width (3) which

can be directly observed by several techniques, such as the
Bitter technique or electron microscopy ( 4 , s ) .
It is precisely the presence of domain walls that creates
difficulties in using ultrasonic techniques to determine the
single crystal elastic constants. The domain walls interact
with the ultrasonic stress waves because the domain walls are
not static (3). The domain walls can move quite readily under
application of stress or magnetic field. In the past the
theory was that the domain walls would attempt to oscillate
sinusoidally with the same frequency as the applied oscilla-
tory stress or magnetic field (1,6,7). As long as the fre-
quency of the applied force is low enough the domain walls can
oscil.S.ate in unison with the signal, which produces a strong
attenuation effect in the signal due to energy losses as the
signal propagates through successive walls. At sufficiently
high frequencies, the domain walls can no longer follow the
period of the applied signal and the attenuation becomes less
severe.
Very recent work by Bostanjoglo (8) with thin film speci-
mens of nickel, using direct observation in an electron micro-
scope, has indicated that, contrary to the existing theories,
the domain walls do not appear to be completely coupled to
ultrasonic excitations. He finds that as the frequency of
.the excitation increases, parts of a domain wall begin to
vibrate with an amplitude about equal to the wall width with
no larger amplitudes being observed. At higher frequencies
large wall portions jumped to neighboring stable positions and
back, but that the motion was not sinusoidal. He also noted
that the positions that the walls jumped to were the same as
the ones reached under an applied static magnetic field. At
sufficiently high frequencies either the domain configurations
were changed or the domain magnetization vectors were changed.
However, the gross effects upon an ultrasonic stress wave
propagating through an unsaturated ferromagnetic sample would
appear to be the same with regards to attenuation and transit
time changes as a function of frequency.
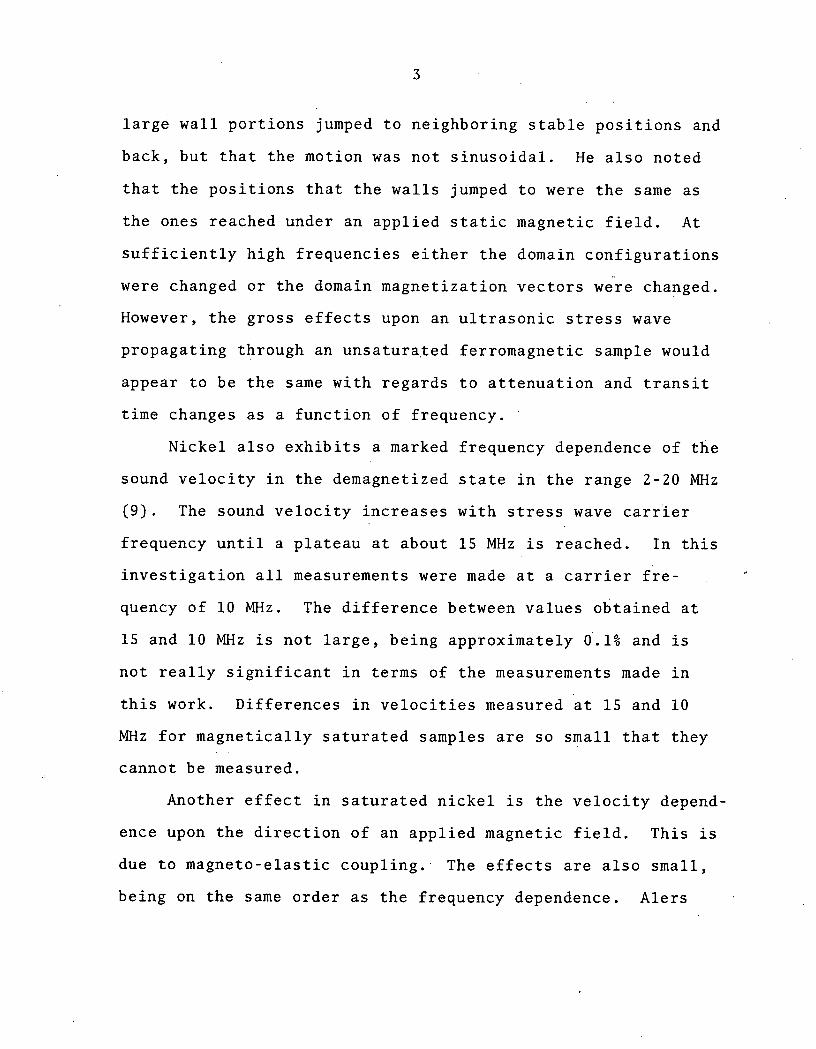
Nickel also exhibits a marked frequency dependence of the
sound velocity in the demagnetized state in'the range 2-20 MHz
(9). The sound velocity increases with stress wave carrier
frequency until a plateau at about 15 MHz is reached. In this
investigation all measurements were made at a carrier fre-
quency of 10 MHz. The difference between values obtained at
15 and 10 MHz is not large, being approximately 0.1% and is
not really significant in terms of the measurements made in
this work. Differences in velocities measured at 15 and 10
MHz for magnetically saturated samples are so small that they
cannot be measured.
Another effect in saturated nickel is the velocity depend-
ence upon the direction of an applied magnetic field. This is
due to magneto-elastic coupling.. The effects are also small,
being on the same order as the frequency dependence. Alers
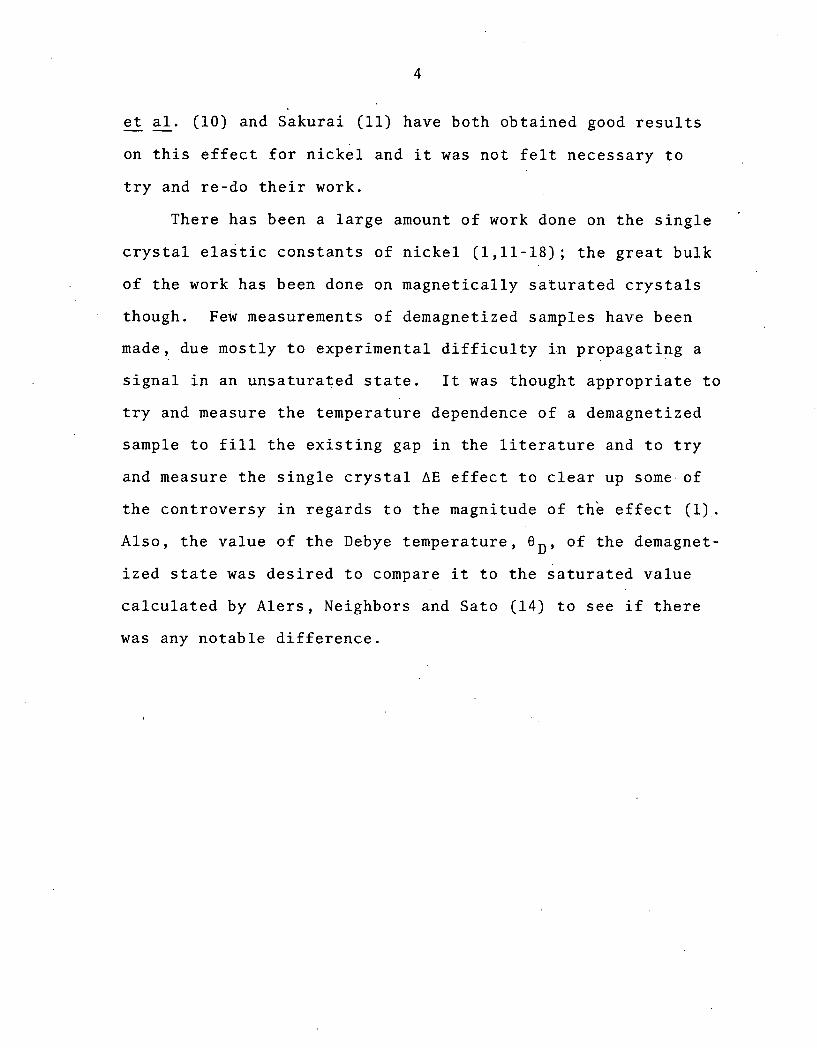
et al. (10) and Sakurai (11) have both obtained good results --
on this effect for nickel and it was not felt necessary to
try and re-do their work.
There has been a large amount of work done on the single
crystal elastic constants of nickel (1,ll-18); the great bulk
of the work has been done on magnetically saturated crystals
though. Few measurements of demagnetized samples have been
made, due mostly to experimental difficulty in propagating a
signal in an unsaturated state. It was thought appropriate to
try and measure the temperature dependence of a demagnetized
sample to fill the existing gap in the literature and to try
and measure the single crystal AE effect to clear up some.of
the controversy in regards to the magnitude of the effect (1).
Also, the value of the Debye temperature, OD, of the demagnet-
ized state was desired to compare it to the saturated value
calculated by Alers, Neighbors and Sato (14) to see if there
was any notable difference.
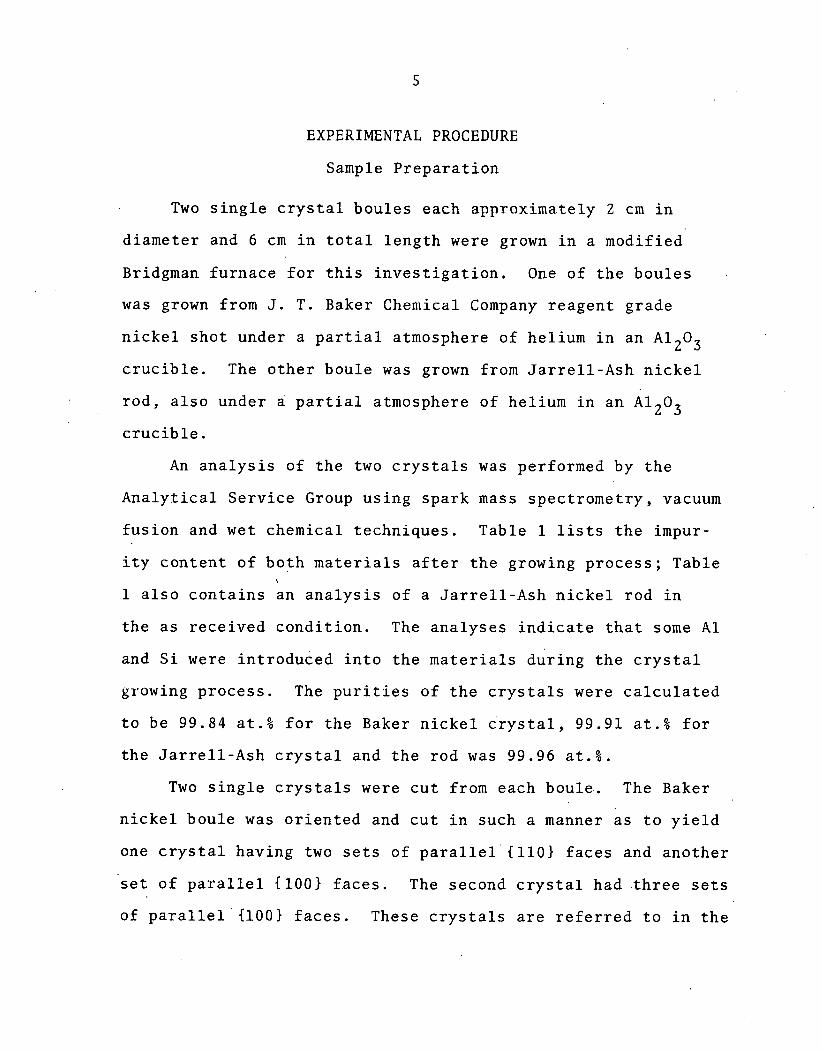
EXPERIMENTAL PROCEDURE
Sample P r e p a r a t i o n
Two s i n g l e c r y s t a l bou le s each approximately 2 cm i n
d iamete r and 6 cm i n t o t a l l e n g t h were grown i n a modif ied
Bridgman fu rnace f o r t h i s i n v e s t i g a t i o n . One of t h e bou le s
was grown from J. T . Baker Chemical Company r eagen t grade
n i c k e l s h o t under a p a r t i a l atmosphere of helium i n an A1203
c r u c i b l e . The o t h e r boule was grown from J a r r e l l - A s h n i c k e l
r o d , a l s o under a p a r t i a l atmosphere of helium i n an A1203
c r u c i b l e .
An a n a l y s i s of t h e two c r y s t a l s was performed by t h e
A n a l y t i c a l S e r v i c e Group u s i n g spa rk mass spec t rome t ry , vacuum
f u s i o n and wet chemical t e chn iques . Table 1 l i s t s t h e impur-
i t y c o n t e n t of bo th m a t e r i a l s a f t e r t h e growing p r o c e s s ; Table \
1 a l s o c o n t a i n s an a n a l y s i s of a J a r r e l l - A s h n i c k e l rod i n
t h e a s r ece ived c o n d i t i o n . The a n a l y s e s i n d i c a t e t h a t some A 1
and S i were introduCed i n t o t h e m a t e r i a l s d u r i n g t h e c r y s t a l
growing p roces s . The p u r i t i e s of t h e c r y s t a l s were c a l c u l a t e d
t o be 99.84 a t . % f o r t h e Baker n i c k e l c ' r y s t a l , 99.91 a t . % f o r
t h e J a r r e l l - A s h c r y s t a l and t h e rod was 99.96 a t . % .
Two s i n g l e c r y s t a l s were c u t from each boule . The Baker
n i c k e l bou le was o r i e n t e d and c u t i n such a manner a s t o y i e l d
one c r y s t a l having two s e t s of p a r a l l e l (1101 f a c e s and ano the r
s e t o f p a r a l l e l {1001 f a c e s . The second c r y s t a l had t h r e e s e t s
of p a r a l l e 1 ' { 1 0 0 1 f a c e s . These c r y s t a l s a r e r e f e r r e d t o i n t h e
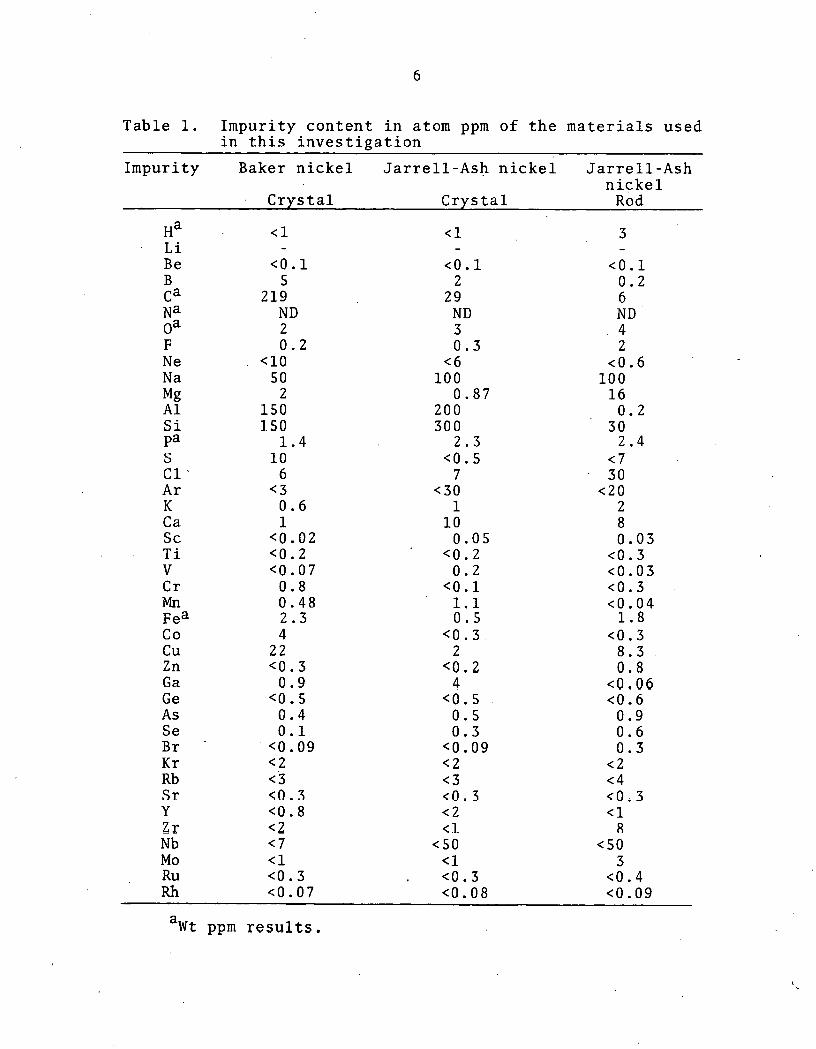
Table 1. Impurity content in atom ppm of the materials used in this investigation
Impurity Baker nickel Jarrell-Ash nickel Jarrell-Ash nickel
Crystal Crystal Rod
a Wt ppm results.
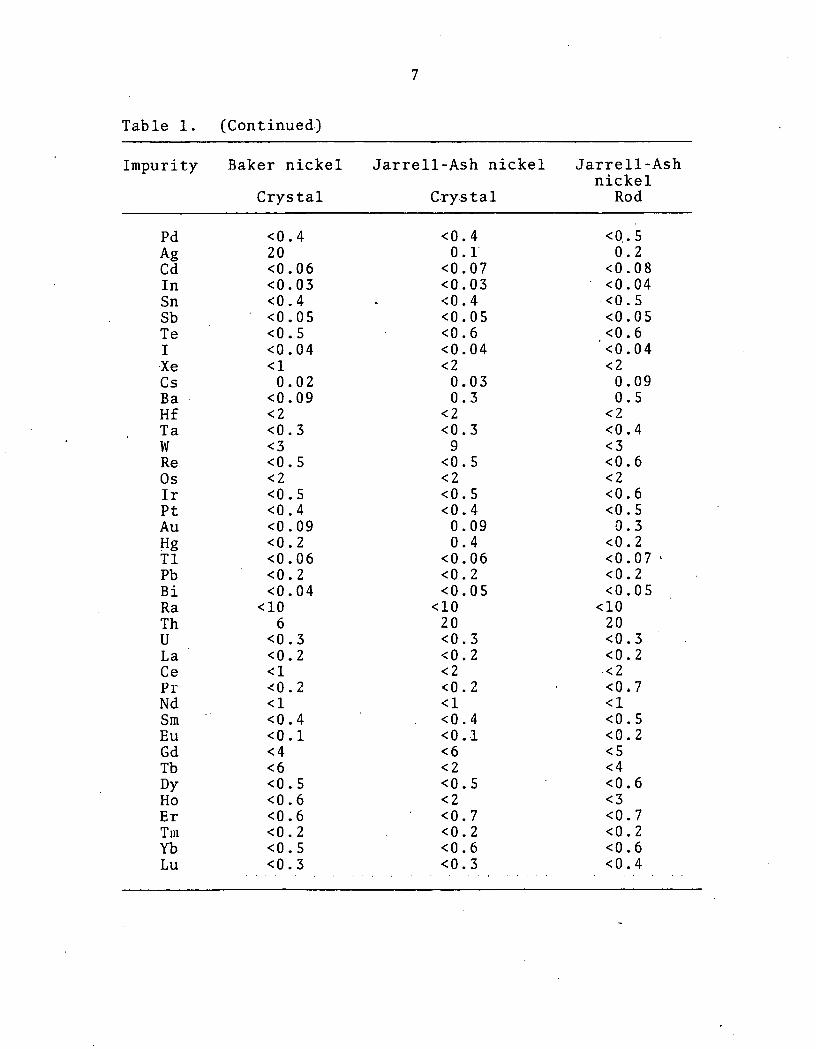
Table 1. (Continued.)
Impurity Baker nickel Jarrell-Ash nickel Jarrell-Ash nickel
Crystal C.rys t a 1 Rod
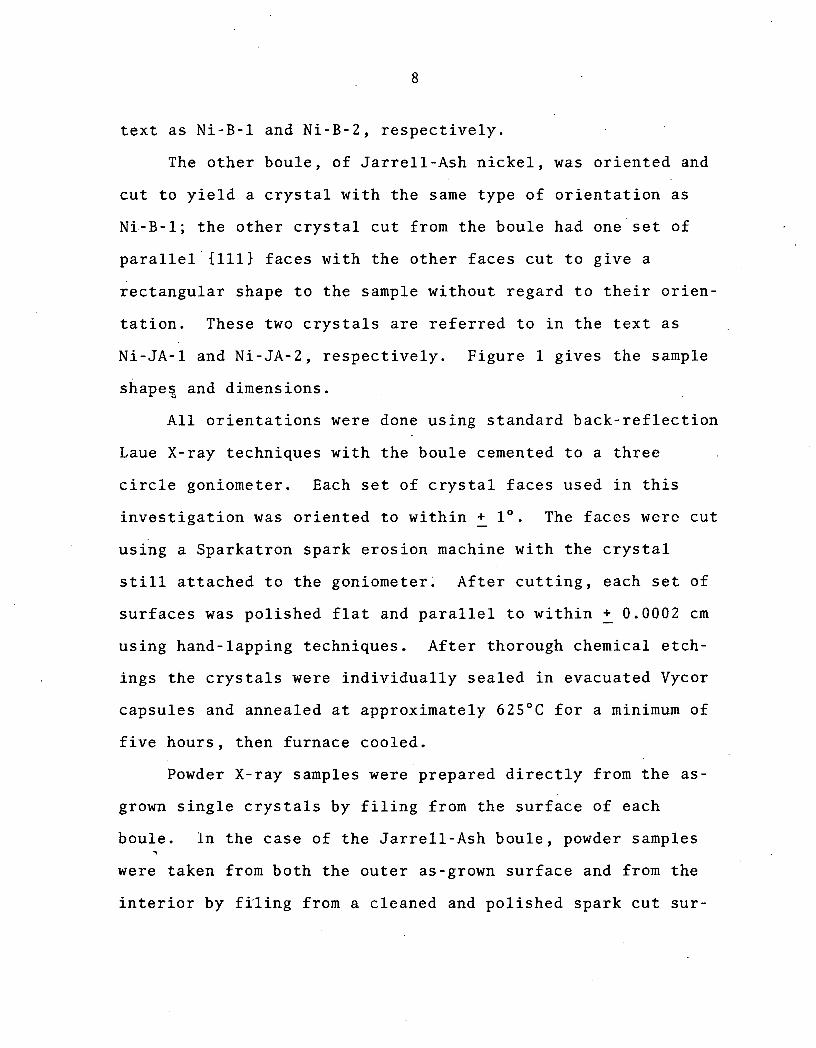
text as Ni-B-1 and Ni-B-2, respectively.
The other boule, of Jarrell-Ash nickel, was oriented and
cut to yield a crystal with the same type of orientation as
Ni-B-1; the other crystal cut from the boule had one set of
parallel'~ll1~ faces with the other faces cut to give a
rectangular shape to the sample without regard to their orien-
tation. These two crystals are referred to in the text as
Ni-JA-1 and Ni-JA-2, respectively. Figure 1 gives the sample
shape2 and dimensions.
All orientations were done using standard back-reflection
Laue X-ray techniques with the boule cemented to a three
circle goniometer. Each set of crystal faces used in this
investigation was oriented to within + lo. The faces were cut -
using a Sparkatron spark erosion machine with the crystal
still attached to the goniometer. After cutting, each set of
surfaces was polished flat and parallel to within + 0.0002 cm -
using hand-lapping techniques. After thorough chemical etch-
ings the crystals were individually sealed in evacuated Vycor
capsules and annealed at approximately 62S°C for a minimum of
five hours, then furnace cooled.
Powder X-ray samples were prepared directly from the as-
grown single crystals by filing from the surface of each
boule. In the case of the Jarrell-Ash boule, powder samples 7
were taken from both the outer as-grown surface and from the
interior by filing from a cleaned and polished spark cut sur-
[I To]
Ni- B-2
Ni-JA-I Ni- JA-2
Figure 1. Orientation and shapes of the samples used in this. investigation, . . dimensions are in cm

f a c e . The powders were s e a l e d i n evacuated Vycor c a p s u l e s and
annealed a t 600°C f o r a t l ' e a s t one and a h a l f hours and then
al lowed t o fu rnace coo l .
X-ray d i f f r a c t i o n p a t t e r n s were t aken u s i n g N i - f i l t e r e d
copper K and Ka2 r a d i a t i o n i n a 1 1 4 mm Debye-Scherrer camera. a1
The l a t t i c e parameter f o r each m a t e r i a l was ob t a ined from a
weighted l e a s t - s q u a r e s program u s i n g t h e T a y l o r - S i n c l a i r -
Nelson-Rei ly e r r o r f u n c t i o n ; t h e program was w r i t t e n by D r .
F . X . Kayser of t h e Ames Laboratory . Table. 2 l i s t s t h e l a t -
t i c e parameter a t 2S°C and t h e X-ray d e n s i t y .
Tab le 2 . L a t t i c e parameter and c o r r e c t e d d e n s i t y f o r t h e as-grown Baker n i c k e l and J a r r e l l - A s h n i c k e l c r y s t a l s . .
0
Sample No. a. (A> P (gm/cm3) A t ..% N i
p~ - - - -p - ~~ - -
a Powder sample t aken from t h e o u t e r s u r f a c e of t h e boule.
b ~ o w d e r sample t aken from t h e i n t e r i o r of t h e boule .
The d e n s i t i e s i n Table 2 have been c a l c u l a t e d by c o r r e c t -
ing t h e mass of t h e average me ta l atom i n t h e c r y s t a l b y . u s i n g
t h e a n a l y s e s g iven i n Table 1. The c o n t r i b u t i o n s due t o i n t e r -
s t i t i a l i m p u r i t i e s were n e g l e c t e d i n t h i s c a l c u l a t i o n . The
v a l u e f o r Avagadrots number used i n t h i s c a l c u l a t i o n was

Acoustic Measurements
Velocity of sound measurements were made using a modified
pulse-echo-overlap (PEO) system whose details are given in
Appendix A. Gold plated 10 MHz x and y-cut quartz transducers
were used to introduce longitudinal and shear mechanical waves
into the samples. Nonaq stopcock grease was used as the bond-
ing agent between the transducer and the sample for all tem-
peratures and propagation modes. The sample was held in a
spring loaded copper container for all measurements. Sample
dimensions were measured using a micrometer and parallelism
of the sample faces was checked by several measurements over
the face of the sample.
Samples Ni-B-1 and Ni-B-2 were used for the zero applied
field fixed point temperature data. The temperature was main-
tained by completely immersing the sample and sample holder in
the appropriate bath. The fixed temperature points were taken
at the normal boiling points of helium and nitrogen, at the
normal sublimation point of dry ice and at the ice point of
water. Sample Ni-JA-1 was used for the continuous temperature
dependence measurements without an applied field. The sample
container was non-inductively wound with a manganin resistance
heater. The temperature was controlled by an Artronix 5301
temperature controller using a Minco S209 platinum resistance
thermometer as the sensing element. The sample temperature
was determined by taping a copper-constantan thermocouple

directly to the sample and using a Newport 2400A digital
millivolt meter to read the voltage.
The usual procedure for taking temperature dependent data
was to immerse the sample in liquid nitrogen. This set the
transducer-to-specimen bond and permitted a data point to be
taken at a well determined temperature. The sample was then
placed in a glass double Dewar whose outer jacket was filled
with liquid nitrogen but whose inner chamber was filled with
dry helium gas. The sample was allowed to come to equilibrium
at the inner,chamber temperature, usually near 80 K.
Data points were then taken in 5 K intervals up to what-
ever temperature the signal became too small to measure,
usually near 250 K. The sample was then allowed to cool back
down to 80 K with spot checks taken at selected temperatures
to see if the data were consistent. During the heating and
cooling cycles the rate of temperature change was approximate-
.ly 1 K per minute. After the sample had again reached 80 K
the inner chamber of the Dewar was filled with liquid helium
and a fixed point at the normal boiling point of helium was
taken. The helium was slowly boiled off after equiiibrating
by maintaining a small current in the sample heater. After
the helium was gone the sample temperature was increased at
the rate of about 1 K per minutc with data being taken at 5 K
intervals beyond 20 K. Data were not taken between 4 K and
20 K because the sensitivity of the thermocouple was very low

in this range. Above 20 K points were taken at 5 .K intervals
up to 100 K to insure that the data coincided with previously
obtained values.
The actual sample temperature was known to only about
+ 2.0 K in the low temperature range where the sensitivity - was low and to about - + 1.0 K at higher temperatures. The tem-
perature controller held the temperature stable to approxi-
mately an order of magnitude better than the temperature was
actually known.
A Harvey-Wells Magnion electromagnet with five in,ch
diameter pole pieces with a three inch air-gap was used for
the single crystal elastic constant AE investigation. Data
were taken at room temperature (296 K) and liquid nitrogen
temperature (77 K). The room temperature values were taken
by holding the sample and sample holder in the desired orien-
tation in the center of the magnet gap with styrofoam blocks
so that the sample could not move. The 77 K data were ob-
tained by placing a quartz tube containing the sample and
liquid nitrogen between the pole pieces. The tube was small
enough in diameter so that the sample could not move when
inside it.
The magnetic field strength was measured by a Rawson
rotating coil gaussmeter. The highest field attainable with
this magnet was 14.4 KOe. although in all cases but one any BE
e.ffect observed was completed before the field reached 4.0KOe.

RESULTS
Zero Applied Field ~easurements
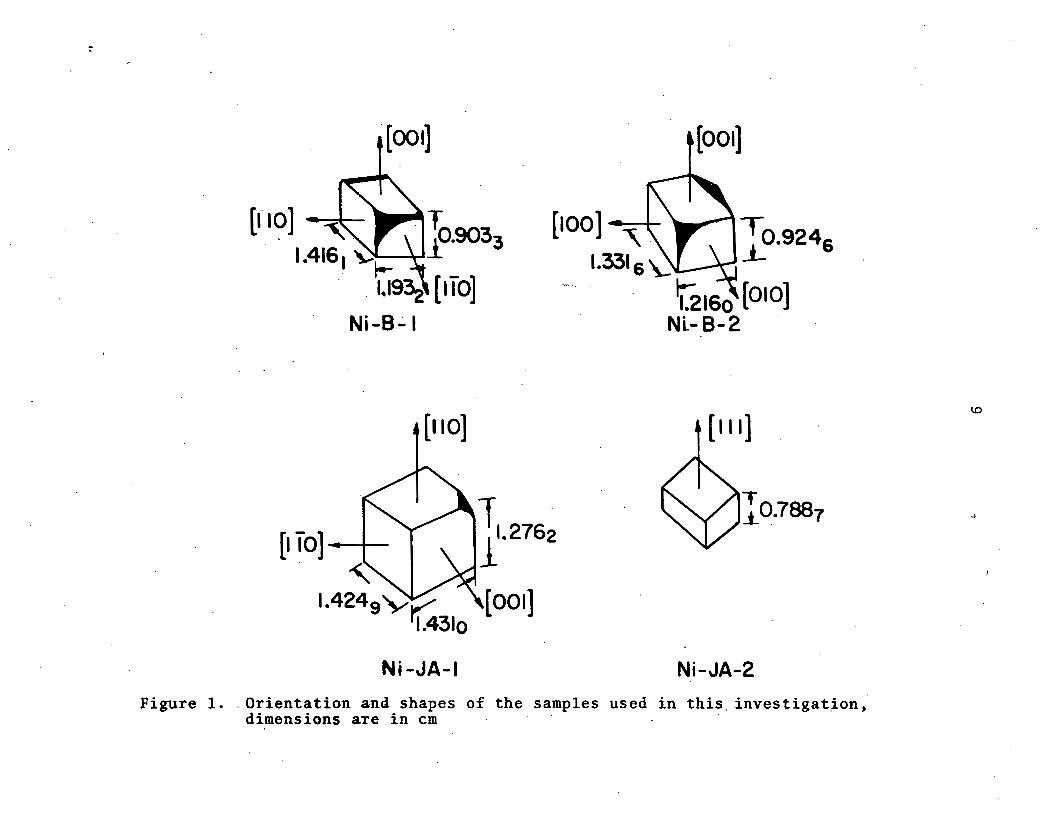
Figures 2, 3 and 4 are plots of data for the three inde-
pendent elastic modes for the [I101 propagation direction as a
function of temperature. The data in these figures have not
been corrected for thermal expansion. Figure 2 is a plot of
the longitudinal mode, 1/2(Cll+C12+2C44); Figure 3 is a plot
of the shear'. mode, C44; Figure 4 is a plot of the shear mode,
1/2(Cll-C12). Appendix B contains a brief discussion of
crystal elasticity including the possible- elastic constant
combinations available from specific stress wave propagation
directions.
Table 3 lists the experimentally determined elastic con-
stants with no thermal expansion corrections, also in Table 3
are the values of smoothed elastic constants that have been
corrected for thermal expansion using the data of Nix and
MacNair (19) for pure nickel. In Figure 3 there is an appar-
ent jump in the data near 210 K. The jump in the data is
apparently due to the fact that the sample was held at that
temperature overnight and finishing the data run the next
morning.
The reproducibility and internal consistency of the data
were extensively tested at one temperature (77 K) by measuring
all the propagation modes for all the crystals several times
after thermal cycling and bond changes. Table 4 contains the
TEMPERATURE (%) Figure 2. Nickel [I101 longitudinal mode temperature dependence in zero applied
magnetic field


Figure 4. Nickel (1101 shear mode temperature dependence in zero' applied magnetic field
0.56
0.54 CU E 0
0.52- Q) C )r Q
0.50 SY 0 - X
. 0.48- fi 0 I - - 0.46 0 V
N 0.44-
0.42
0.40
I I I 1 I I I 1 1
- - 0 O O O O O O o o o
0 ~ ~ ~ ~ 0 0 0 0 0 0
O O o 0 O O o O O
O 0 o o O o o
- O o o O o o -
- 4
- -
-
- -
I I I I I I I 1 1 0 25 50 75 100 125 150 175 200 225 250
TEMPERATURE ( O K )

Table 3 . Values of t h e raw exper imenta l d a t a t aken i n zero a p p l i e d f i e l d and va lues of the . .smo.o the.d d.at.a c.o.r.re.c.t.ed. . fo r the.rma.1. .e.xp.ans.i.o.n ,. x 1.0 dy.ne.s/.cm2
Temp. Experimental va lues Smoothed v a l u e s ' O K 1 / 2 (Cll+C12 C 4 4 1 / 2 (Cll-cl2) 1 / 2 (Cll+C12 C44 1 / 2 (Cl1-clZ)
+2c44) +2c44.)

Table 4. Data taken ,at 77 K - to determine repeatability and internal c.oa.s.i.s.t.en.cy , .zero applied magnet.ic field
-~~
Sample no. Propagation Elastic mode x1012 dyne/cm 2
d i.r e.c t.i on
Ni-B-1
Ni-B-1
Ni - JA- 1 Ni-B-1
Ni-B-1
Ni-B-1
Ni-JA-1
Ni-JA-1
Ni-B-2
Ni-B-1
Ni-B-1
Ni - JA- 1 Ni-B-1
N ~ - B - I ~ ~ i - ~ - l ~
Ni-B-2
Ni-B-2
Ni-JA-1
N ~ - J A - ~ ~ ~ i - ~ - l ~
~ i - ~ - l ~
~i - JA- la Ni-JA-2
Ni-JA-2
a C11 and C12 were calculated by solving the three simul- taneous equations obtained from the particular [110] direction of propagation.

measured v a l u e s f o r t h e v a r i o u s p ropaga t ion modes, t h e c r y s t a l
and t h e p a r t i c u l a r s e t of f a c e s used . For N i - B - 1 and N i - J A - 1
t h e r e were two p o s s i b l e s e t s of d i f f e r e n t [I101 d i r i c t i o n s and
one [OOl] d i r e c t i o n of p ropaga t ion . The measured v a l u e s of
N i - J A - 2 a r e a l s o inc luded i n t h i s t a b l e . Not a l l of t h e f a c e s
of each c r y s t a l were used because of l i m i t e d s i z e 0.r because
t h e o r i e n t a t i o n was known t o b e skewed by more t han lo .
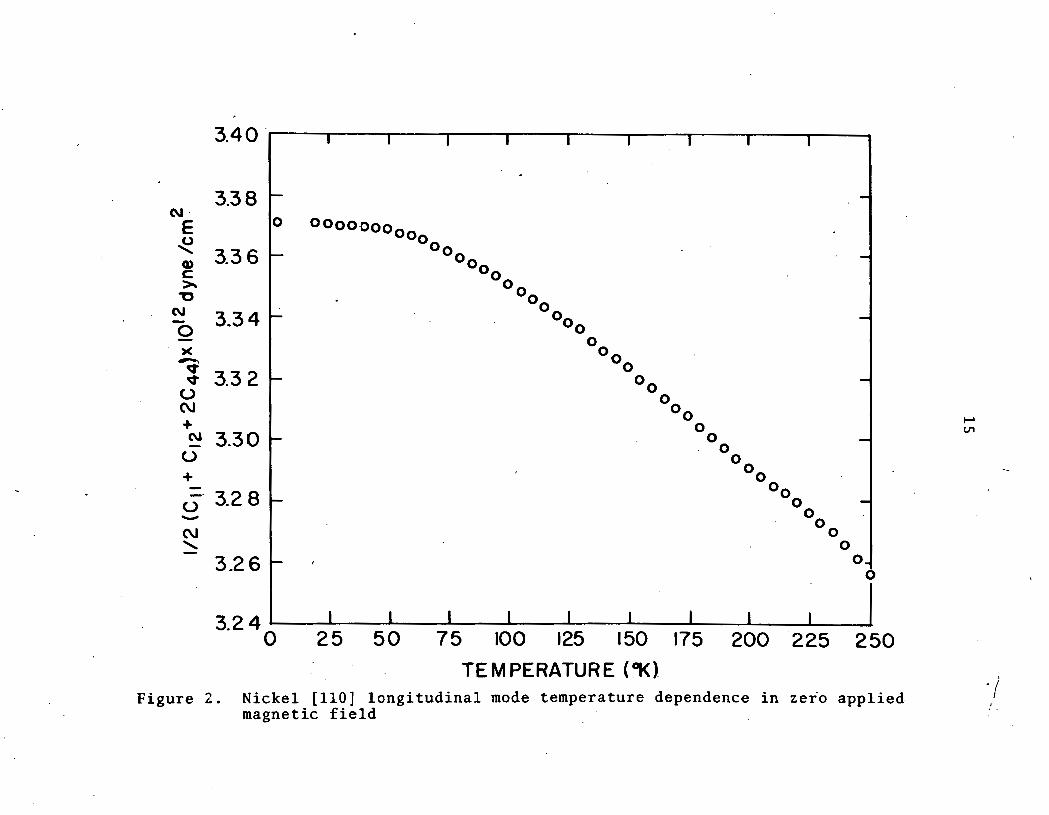
F i e l d Dependent Measurements
F igu re s 5 t h r u 10 r e p r e s e n t t h e room tempera ture magnet ic
f i e l d dependence of t h e d i r e c t l y measurable e l a s t i c modes.
Graphs o f t h e f i e l d dependence f o r waves p ropaga t ing i n t h e
[ I l l ] d i r e c t i o n a r e n o t inc luded because t h e s i g n a l ampl i tude
a t a l l f i e l d s was t o o sma l l t o a c c u r a t e l y measure. For most
of t h e samples i t was imposs ib le t o p ropaga te any s i g n a l a t
a l l a t room tempera ture w i thou t app ly ing a magnet ic f i e l d ,
approaching 1 k i l o g a u s s , consequent ly many of t h e p o s s i b l e
p ropaga t ion modes f o r v a r i o u s c r y s t a l s a r e n o t r e p r e s e n t e d .
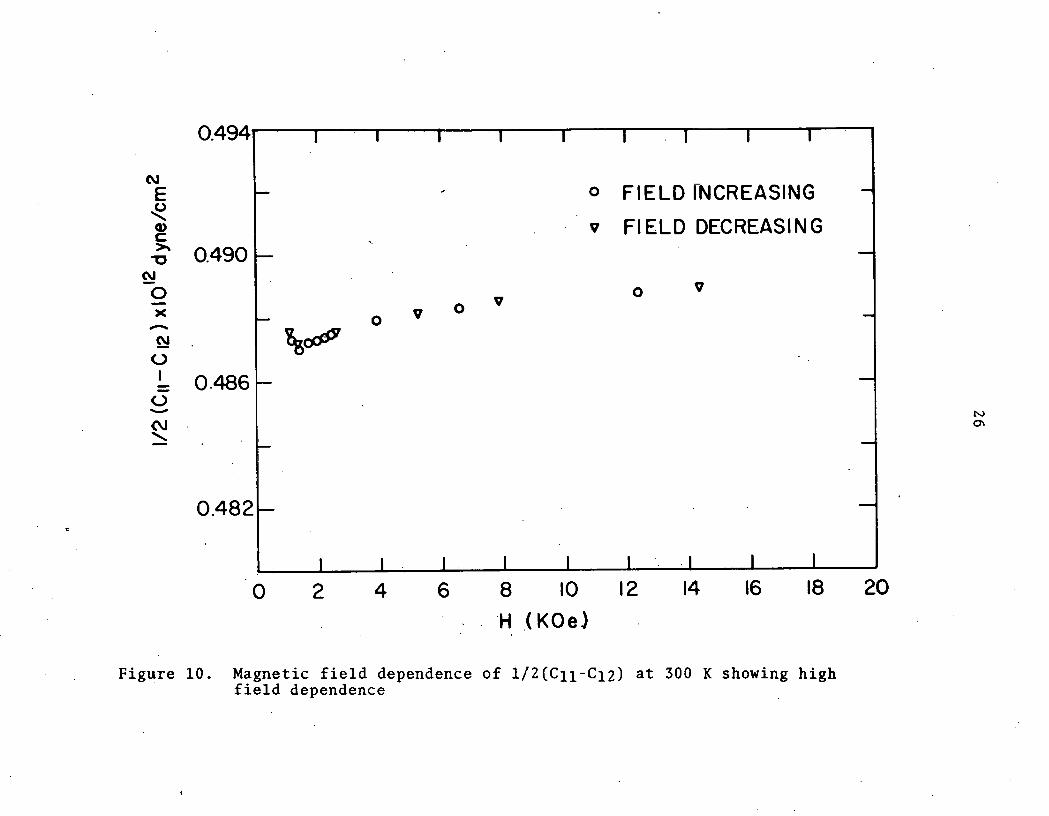
One of t h e i n t e r e s t i n g t h i n g s no ted i n t h i s i n v e s t i g a -
t i o n was t h e behavior of t h e s h e a r v e l o c i t y cor responding t o
1/2(C11-C12). I t 'was found t h a t t h e change i n sound v e l o c i t y
was v i r t u a l l y over when t h e a p p l i e d f i e l d s t r e n g t h reached 4.0
KOe f o r t h e o t h e r modes, n o t s o f o r 1/2(C11-C12). Th is mode
showed a smal l f i e l d dependence o u t t o t h e h i g h e s t f i e l d
a t t a i n a b l e w i t h t h e magnet arrangement.
Tab le 5 c o n t a i n s t h e s a t u r a t e d v a l u e s of t h e room tem-
p e r a t u r e e l a s t i c c o n s t a n t s and t h e v a l u e s r e p o r t e d by o t h e r

Figure 5. Magnetic field dependence of C11 at 300 K, propagation direction is E o o l l , HI 1 [0101
2.60
N
€ 2.56-
\
Q) C )r
u N . - 0 - * 2.52- - -
I I I I I 1 1 I I I
- o FIELD INCREASING -
v FIELD DECREASING -
- -
0 v 0 0 9
- " ' 1 0
N
0 I-'
v
0 0 0
0 0 2 . d v v
V
- H ( .KOe)
Figure 6. Magnetic field dependence of 1/2(Cll+Cl~+ZC44) at 300 K with H I 1 [OOl]
N 3.262,- E \O g
' 0 E! 0 . 3 3.258<- 3 0 N + N - 0 + - 3254 - 0 u
N 12
3.250
I I I I I I ' I I I
v A' 0
- -
o FIELD INCREASING - v FIELD DECREASING
- -
- -
- -
-
0 01 I I I I I I 1 I
0 0.4 0.8 1.2 1.6 2.0 2.4 2.8 3.2 3.6 4.0

o FIELD INCREASING v F I E LD DECREASING
Figure 7 . Magnetic f i e l d dependence of C44 a t 300 K , propagation direct ion i s [0011 , H I 1 [0101

' H ( K O e
Figure 8. Magnetic field dependence of C44 at 300 K, propagation direction is P 1 0 1 , H I I [0011
1,
1.27.
1.25
1.23
1.21
0 ' -0.4 0.8 1.2 1.6 2.0 2,.4 2.8 3.2 3.6 4.0
I I I I I 1 I I I
o FIELD INCREASING - -
v FIELD DECREASING - -
- -
- -
7 -
- - 0
I v
I I I I I I I I

t- - o FIELD FNCREASING
C v FIELD DECREASING 0.490
Figure 10. Magnetic f i e l d dependence o f 1/2(Cll-C12) a t 300 K showing high f i e l d dependence
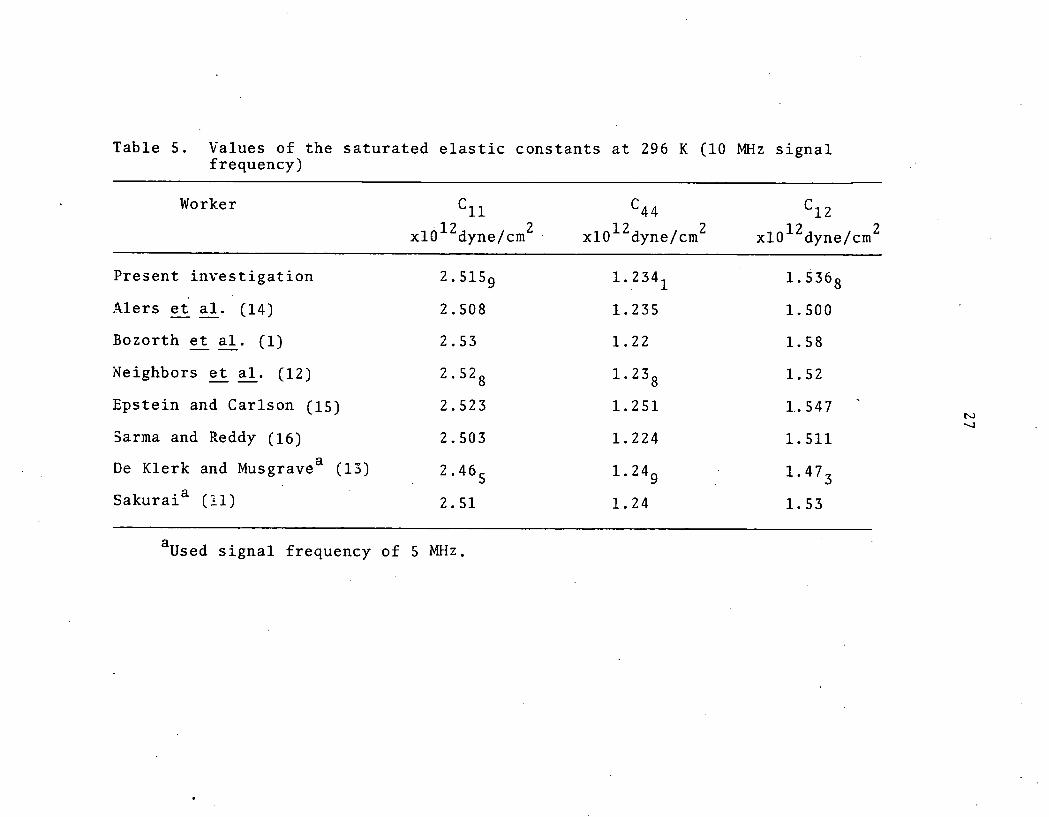
Table 5. Values of the saturated elastic constants at 296 K (10 MHz signal frequency)
Worker C44 C12
x1612dyne/cm2 , xl~'~d~ne/crn 2 x l ~ ~ ~ d ~ n e / c r n 2
Present investigation 2. 51S9 1. 2341 1.5368
-\lers et al. (14) -- 2.508
Bozorth et al. (1) -- 2.53
Neighbors et al. (12) -- 2. 5Z8
Epstein and Carlson (15) 2.523
2arma and Reddy (16) 2.503
De Klerk and ~ u s ~ r a v e ~ (13) 2. 465
sakuraia (XI) 2.51
a Used signal frequency of 5 MHz.
workers. At liquid nitrogen temperatures there was essenti-
ally no measurable single crystal AE effect, however, it was
noted that near 1 KOe a marked change in signal amplitude
occurred for all modes.
For the shear modes the magnetic field was applied
parallel to the atomic motion and perpendicular to it. No
measurable change in velocity was observed for C44, but a 0.2%
change was found in 1/2 (Cll-C12). Due to the sample holder
geometry the field could not be applied in any manner except
perpendicular to the particle motion for the longitudinal
velocity measurements. Levy and True11 (18) did attempt to
measure a single crystal AE effect for a field parallel and
a field perpendicular to a longitudinal particle motion, but
their instrument was not sensitive enough to detect the small
velocity changes expected.

DISCUSSION
Magnetic Field Dependence
The attempt to measure single crystal AE effects for var-
ious propagation modes was only partially successful. Since
pulses could not be propagated through the samples at room tem-
perature and zero applied field for most of the possible modes,
it is difficult to say anything quantitative about the effect.
Two approaches were taken to remedy the problem; for those
modes where a signal could be obtained without a field at room
temperature and for those modes where a reasonable estimate of
the demagnetized elastic constant was possible the change was
expressed as
A = [(cS-co)/c0] X 100 (1)
where cS is the particular elastic modulus at saturation and
Co is the same elastic modulus at zero applied field.
Table. 6 lists directly measured and estimated A's for the
crystals. The second approach was to fit the temperature de-
pendent, zero field data to a functional form and extrapolate
the demagnetized data to 300 K to calculate A. The data were
fit to a function of the form
where cYj is the elastic constant value at zero degrees Kelvin,
T is the temperature in degrees Kelvin, Cij is the value of
the elastic constant at any particular T and s and t are
a.dj11st.a.hle parameters. The values of s and t were found by
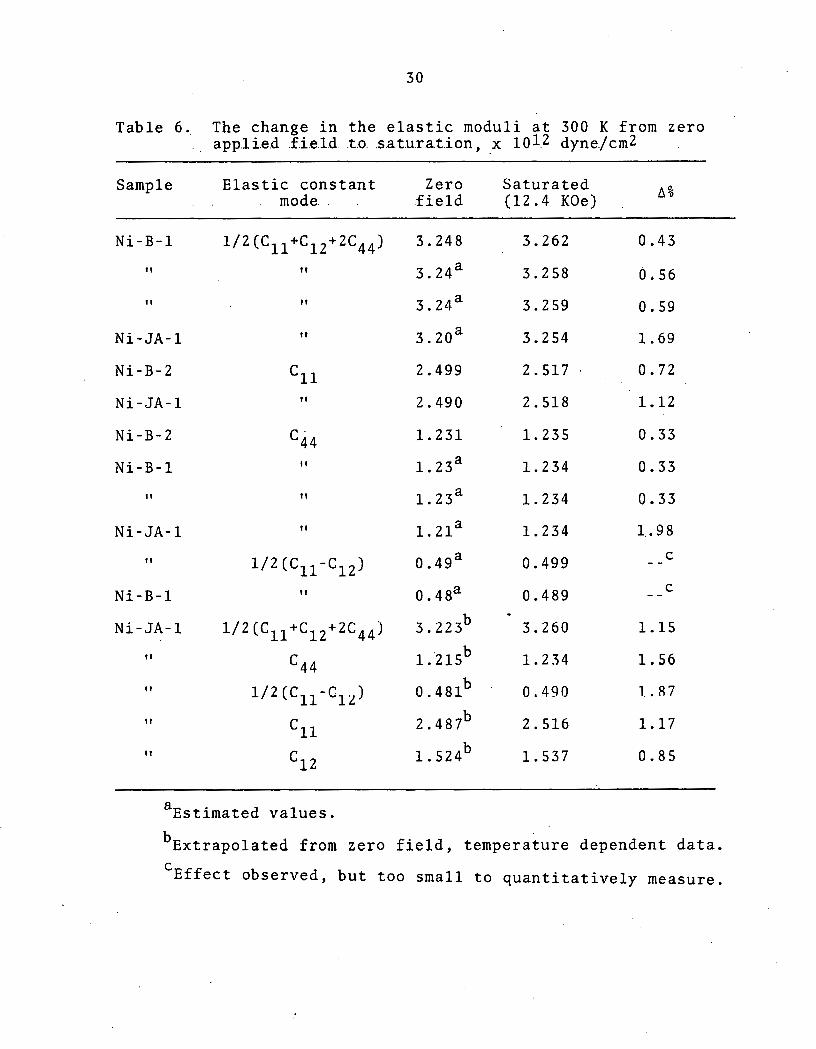
Table 6.. The change i n t h e e l a s t i c moduli a t 300 K from ze ro . , app.1.i.e.d .f.i.e.l.d .t.o. .s.a.tu.r.a.t.i.on, x 101.2 dyne./cm2
Sample E l a s t i c c o n s t a n t Zero S a t u r a t e d . . mode. . . f i e l d (12.4 KOe) A %
N i - B - 1 1 / 2 (C11+C12+2C44) 3.248 3.262 0.43
11 I t 3.24a 3.258 0.56
--
a Es t ima t ed v a l u e s .
b ~ x t r a p o l a t e d from ze ro f i e l d , t empe ra tu r e dependent d a t a . C ~ f f e c t obse rved , b u t t o o s m a l l t o q u a n t i t a t i v e l y measure.
linearizing Equation 2 and varying t in small steps until the
proper value for the slope was obtained. The linearized form ,
of the equation is;
Thus the correct slope was constrained to be -1.00 and the
intercept of the line yielded In s. The straight lines cal-
culated by varying t were fitted using a linear-least-squares
approach to obtain the slope and intercept for each t. The
data used in the computation were corrected for thermal expan-
sion. The values of the smoothed data given in Table 3 were
computed using Equation 2. The validity of Equation 2 is dis-
cussed by Varshni (20).
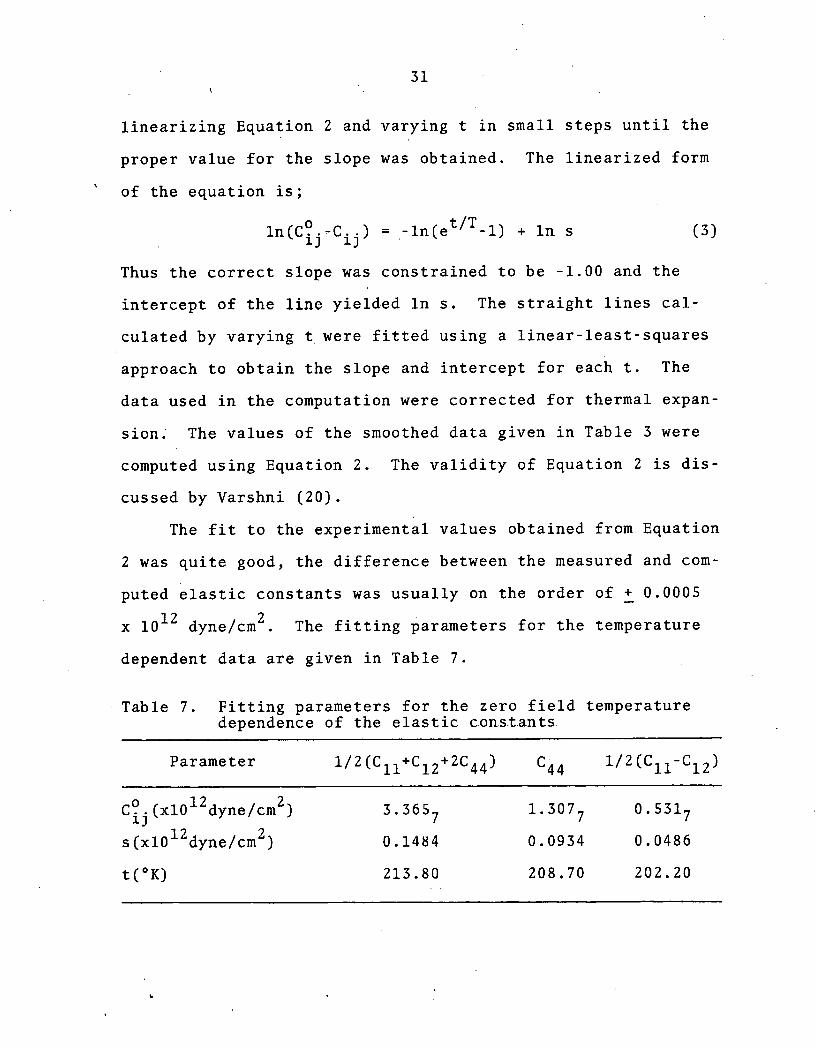
The fit to the experimental values obtained from Equation
2 was quite good, the difference between the measured and com-
puted elastic constants was usually on the order of - + 0.0005
x 1012 dyne/cm2. The fitting parameters for the temperature
dependent data are given in Table 7.
Table 7. Fitting parameters for the zero field temperature dependence of the elastic c.on.s.t.ants.
Parameter

I n Table 6 i s a l s o t h e A E e f f e c t change c a l c u l a t e d from
t h e ze ro f i e l d d a t a e x t r a p o l a t e d t o 300 K and t h e d i r e c t l y
measured s a t u r a t i o n va lues a t 300 K . The va lues f o r A
ob ta ined from t h e e x t r a p o l a t i o n tend t o be l a r g e r f o r a p a r -
t i c u l a r mode than t h e e s t i m a t e d o r d i r e c t l y measured A .
The magnitude of t h e s i n g l e c r y s t a l A E e f f e c t f o r t h e
e x t r a p o l a t e d c a s e s ag rees f a i r l y w e l l w i t h t h e d a t a of Bozorth
e t a l . ( I ) , excep t t h a t t hey f i n d t h a t t h e changes i n t h e -- s h e a r c o n s t a n t s a r e s i g n i f i c a n t l y l a r g e r t han t h a t of t h e
l o n g i t u d i n a l c o n s t a n t . They f i n d t h a t t h e changes i n t h e
s h e a r v a l u e s a r e between t h r e e and f o u r t imes a s l a r g e a s
t h e change i n t h e l o n g i t u d i n a l mode they measured. However,
one must t a k e i n t o account t h a t t h e domain c o n f i g u r a t i o n f o r
a g iven sample shape may be q u i t e d i f f e r e n t from t h a t of
ano the r ( 3 ) , s o t h a t on ly approximat ions may be made f o r t h e
r e l a t i v e change between p ropaga t ion modes of d i f f e r e n t samples.
No a t t emp t was made t o c a l c u l a t e demagnetizing f a c t o r s
f o r t h e sample geometr ies used i n t h i s i n v e s t i g a t i o n a s t h e
problem i s ve ry complex. The re fo re , t h e a c t u a l f i e l d s een by
an atom i n t h e c r y s t a l i s n o t known. However, t h e agreement
between o t h e r work, which used d i s k shaped samples ( I ) , and
t h e p r e s e n t work u s i n g roughly cub ic samples r e g a r d i n g t h e
f i e l d a t which t h e A E e f f e c t was completed i s q u i t e good.
Genera l ly t h e f i e l d a t which t h e e l a s t i c c o n s t a n t appeared t o
s t o p changing was n e a r 1 . 5 KOe. For 1/2(Cll-CI2) t h e e l a s t i c
constant showed a rapid change, as did all the other measured
modes, up to near 1.5 KOe but then instead of remaining a
virtual constant there was, a small field dependence out to
the highest fieid attainable. The significance of this is
not known.
An attempt was also made to measure the AE effect at
liquid nitrogen temperature. The magnitude of the change was
very small for a given sample. As mentioned in the previous
section a marked amplitude change occurred at this temperature
near 1.0 KOe for all propagation modes but there were virtu-
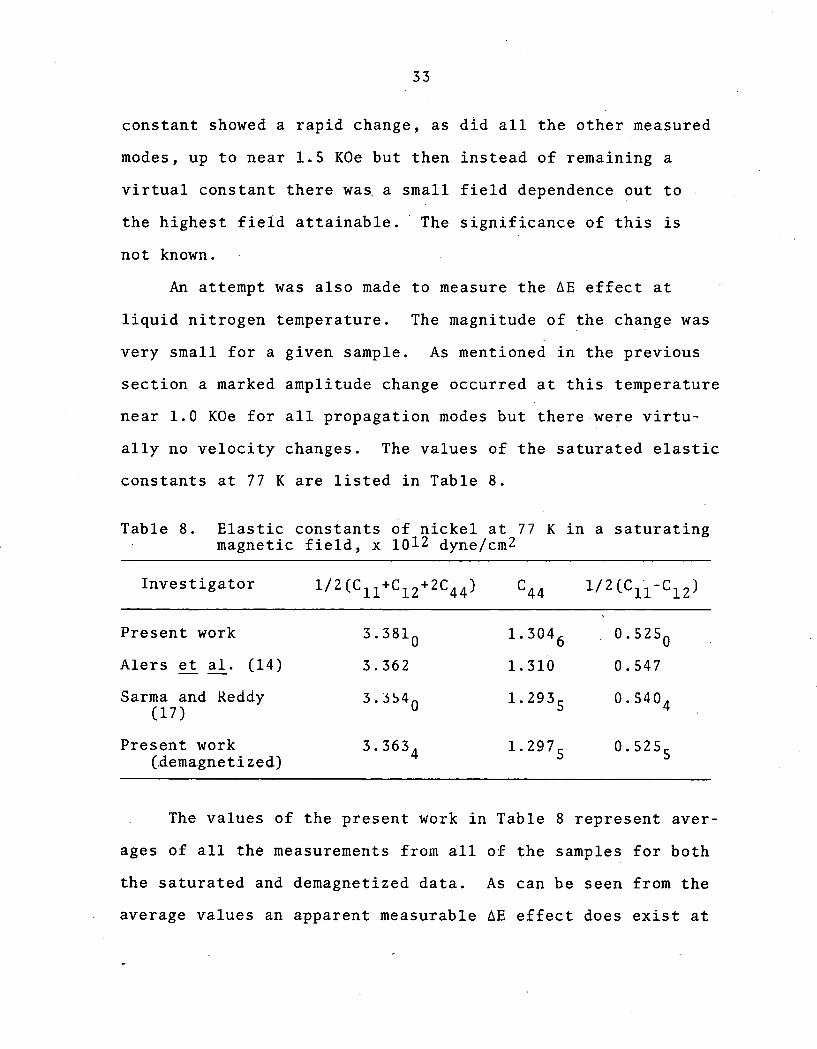
ally no velocity changes. The values of the saturated elastic
constants at 77 K are listed in Table 8.
Table 8. Elastic constants of nickel at 77 K in a saturating magnetic field, x 1012 dyne/cm2
Investigator
Present work
Alers et al. (14) -- 3 . 3 6 2
Sarma and Keddy (17)
Present work 3 . 3634 1.2975 0.5255 (.demagnetized)
The values of the present work in Table 8 represent aver-
ages of all the measurements from all of the samples for both
the saturated and demagnetized data. As can be seen from the
average values an apparent measurable AE effect does exist at

77 K but the effect for any particular measurement was small.
The uncertainty for the average values of the elastic con-
stant combinations is roughly - + 0 . 0 0 4 ~ 1 0 ~ ~ dyne/cm2, with the
largest uncertainty in 1/2(C11-C12) and the smallest uncer-
tainty in C44.
Zero Field Temperature Dependence
.The most striking difference between the present investi-
gation and the temperature dependence of the.magnetically
saturated elastic constants done by Alers, Neighbors and Sato
(14) is the difference in C12,. Even making allowances for the
AE effect the difference at all temperatures is large, being
on the order of 1.5 to 2%. The overall accuracy of the elas-
tic constants measured in this investigation is estimated to
be - + 0.5% and probably better than that at the fixed tempera-
ture points. The temperature dependent values of CI1, C44 and
C12 found in this investigation were extrapolated to the Curie
2 temperature (631 K) with the results being 2.332x10¹² dyne/cm , 1 . 069x1012 dyns/cm2 and 1 . 5 2 5 ~ 1 0 ~ ~ dyne/cm2, respectively.
The differences between the extrapolated and measured .values
of Alers -- et al. (14) are 1.30%, -3.26% and 3.11%, respectively,
which is adequate considering the length of the extrapolation.
As was mentioned in the previous section there was an
apparent "annealing" phenomenon observed in the absence of a
magnetic field. The effect was most prominent in C44, see
Figure 3 near 210 K. 'I'he effect was first noticed when the

sample was held at the same temperature for a few hours or,
more and then completing the data run. If the sample was then
cooled back down from the break in the data, the line of new
data was displaced roughly parallel to that observed previous-
ly.. The effect was looked for and found in the other shear
mode and the longitudinal mode. The magnitude of the effect
,was much smaller in the latter cases. The effect did show the
same characteristics upon cooling and heating as did C44. In
Figure 2 near 200 K and in Figure 4 near 165. K .small jumps in
the data can be seen due to holding the sample at a constant
temperature for a period of time. The data used in the fitting
function, especially for C44, was chosen to minimize this
effect.
One possible explanation is a slow rearrangement of the
domain configuration. This is proposed because the PEO con-
tinued to input stress waves into the sample throughout the
time the sample was being held at temperature. However, the
changes in velocity are quite small, being almost within the
estimated experimental error.
The bulk modulus and Debye temperature were calculated
for the demagnetized case. The bulk modulus at 300 K was cal-
culated for the demagnetized state using the extrapolated
elastic constants while the saturated state bulk modulus was
calculated from the averaged values of the saturated measure-
12 ments. The demagnetized bulk modulus at 300 K is 1.8479x10 .
dyne/cm2, while that for the saturated case is 1.8633x10¹²
dyne/cm2.
The Debye temperature was calculated from the demagnet-
ized constants using the 4.2 K values as being good 'approxi-
mations of the zero Kelvin values. The Debye temperature was
calculated using the method of Overton and Schuch (21). The
calculated temperature was found to be 471.6 K for the demag-
netized state'as.compared to 476 calculated by Alers' et -- al.
(14) from their saturated measurements.

SUMMARY
A series of nickel single crystals of different starting
material and orientation were prepared to measure the magnetic
field dependence of the single crystal elastic constants and
to measure the temperature dependence of the elastic constants
in the demagnitized state. The measurements were performed
using a pulsed ultrasonic method of determining sound wave
velocities in solids.
Three things of interest found in this investigation
were; (1) the apparent magnetic field dependence of 1/2(Cll-
C12) at high magnetic fields; (2) the large difference between
the previously considered "best" value of C12 and the value
obtained in this investigation; (3) the apparent "annealing"
effect of the elastic constants in the demagnetized state.
Measurements of quantitative values for the single crystal AE
effect were only partially successful due to signal attenua-
tion at zero applied magnetic field. Extrapolation of the
demagnetized data using Varshni's functional form (20) was
used to estimate the single crystal AE effect and to calculate
the room temperature zero applied field elastic constants and
bulk modulus.
The Debye temperature was calculated from the low temper-
ature demagnetized data and compared to the value calculated
by Alers -- et al. (14) from saturated data and no significant
difference was found.
BIBLIOGRAPHY
1. R. M. Bozorth, W. P. Mason and H. J. McSkimin, 'Be'll Sys't'em Te'ch.' J. ,' '30, - 970 (1951) .
2. R. M. Bozorth, "Ferromagnetksm," D. Van Nostrand Co., New York, N.Y., 1951, pp. 268-269.
3. C. Kittel,' Rev.' Mo'd'.' Phys., '21, 54.1 (1949). - 4. H. J. Williams and J. G. Walker, Phys. Rev., - 83, 634
(1951).
5. R. Carey and E. D. Issac, "Magnetic Domains and Tech- niques for Their Observation," Academic Press, New York, N.Y., 1966.
6. R. Becker and W; Doring, "Ferromagnetismum," Springer, Berlin, Germany, 1933.
7: W. P. Mason, Rev. Mod. Phys., 25, 136 (1953). - 8. 0. Bostanjoglo, Phys. Stat. Sol. (a), 25, K9 (1974). 9. J. De Klerk, Proc. Phys. Soc. London, - 73, 337 (1959).
10. G. A. Alers, J. R. Neighbors and H. Sato, J. phys. Chem. Solids,, - 9, 21 (1958) .
11. J. Sakurai, J. Phys. Soc. Japan, - 19, 311 (1964).
12. J. R. Neighbors, F. W. Bratten and C. S. Smith, J. Appl. Phys., 23, 389 (1952).
13. .J. De Klerk and,M. J. P. Musgrave, Proc. Phys. Soc. London, - B68, 81 (1955).
14. G. A. Alers, J. R. Neighbors and H. Sato, J. Phys. Chem. Solids, - 13, 40 (1960).
15. S. G. Epstein and 0. N. Carlson, Act'a Met., 13, 487 (1965).
-
16. V. P. N. Sarma and P. J. Reddy, Phil. Mag 27, 769 (1973).
- 9 -
17 . V. P. N. Sarma and P. J. Reddy ,' 'Phy's .' 'S'ta't . Sol'. '('a) ,' '16 , - 413 (1973).
18. S. Levy and R. True11 ,' 'Rev.' Mo'd.' 'Ph'ys . ,' '25, - 140 (1953) . 19. F. C. Nix and D. MacNair, Phys'.' 'Rev. ,' '60, - 597 (1941).
20. Y. P. Varshni ,' 'Phy's..' 'Rev.' B ,' - 2, 3952 (1970).
21. W. C. Overton and A . F. Schuch, USAEC Report LA-3615-MS, Los Alamos, New Mexico, Dec. 1966.
22. G. A. Alers, "Physical Acoustics," Vol. IV-A, W. P. Mason, Ed., Academic Press, New York, N.Y., 1965, pp. 277-297.
23. J. E. May, Jr., IRE Na'tl. Conv. Rev., - 6, Pt. 2, ,134 (1958).
24. E. P. Papadakis, 'J.' Acou's't. Soc. Amer., - 24, 1045 (1967).
25. D. H. Chung, D. J. Silversmith and B. B. Chick,"Rev'. 'Sci. In'st. ,' - 40, 718 (1969).
26. F. R. Eshelman, USAEC Report IS-2594, Ames, Iowa, Jan. 1972.
27. P. D. Waterman, Phys. Rev., - 113, 1240 (1959).
28. A. E. H. Love, "A Treatise on the Mathematical Theory of Elasticity," Dover Publications, New York, N.Y., 1944.
29. J, F , Nye, "Physical Properties of Crystals," Oxford University Press, London, England, 1957, pp. 131-138.
30. C. Kittel, " Introduction to Solid State Physics," 4th ed. , John Wiley and Sons, New York, N.Y., 1971, pp. 144- 155.
31. Y. Shirakawa, Y. Tanji, H. Moriya and I. Oguma, J. Jap. Inst. Metals Sendai, - 33, 116 (1969).
32. J. Sakurai, M. Fujii, Y. Nakamura and H. Takaki, 'J.' Phys. Soc. Japan, - 19, 308 (1964).

40
APPENDIX A
Pulse-Echo-Overlap System
It is generally accepted that the easiest and most accu-
rate way to determine the adiabatic single crystal elastic
constants is by measuring the velocity of sound in the sample.
Various electronic schemes have been devised to introduce
so.und waves in samples and to measure their velocity (22).
The ease in using the pulse-echo-overlap system (PEO)
outlined by May (23) and developed by others (24,25,26) and
the elimination of an empirical determination of the transit
time error produced by the transducer-to-specimen bond thick-
ness made the PEO the most promising for this work.
Figure A1 is a block diagram of the PEO ultrasonic system
that was constructed at this laboratory. The components of
the system are: a General Radio 1330-A bridge oscillator; a
Computer Measurements Company 7266 Counter; a General Radio
1217-B pulse generator to serve as the pulse shaper; a Hewlett-
Packard 222A pulse-delay generator; a Hewlett-Packard 18QD
oscilloscope with 1820C and 1801A plug-in modules; an Arenberg
attenuator; a frequency divider and pulsed oscillator con-
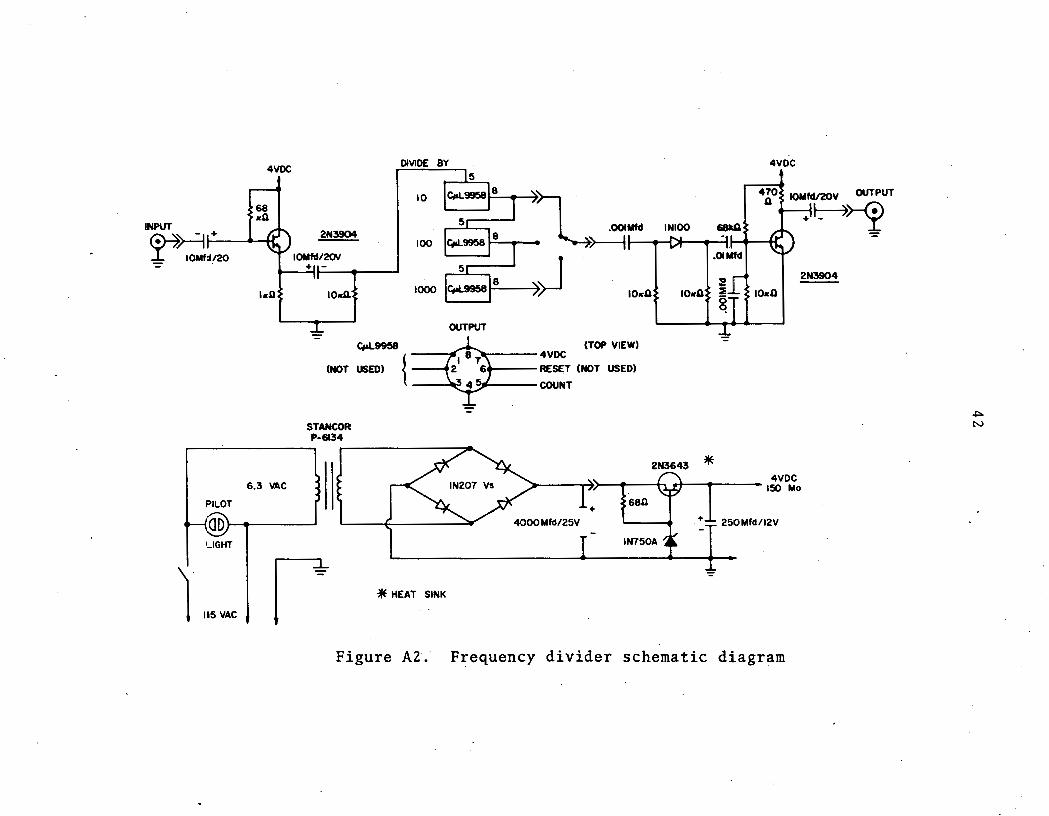
structed by the Ames Laboratory Instrumentation Group. Fig-
ures A2 and A3 show the circuit diagrams of the frequency
divider and pulsed oscillator, respectively.
The system functions by using the bridge oscillator fre-
quency as a relative time base to synchronize all the com-

COUNTER P
TRIGGER
FREQUENCY
PULSED
7 OSCILLOSCOPE * j INPUT I TRANSDUCER b
Figure A l . PEO block diagram
4vDC MVlDE BY 4VDC
INWr HI' 213904
- - IOMlj/20 IoMfd/20V
II + 1 1 -
2N3804
I KC) lo&
1 - OUTPUT - w-
(NOT USED) RESET ( W T USED)
- - STANCOR P-6134
HEAT SINK . .
Figure AZ'.' Frequency divider schematic diagram

LRCR ctcTERMlWES CUM. FREQUENCY
ALL RESISTOS I /2 WATT UQPT WHERE wOmD
Figure A3. Pulsed oscillator schematic diagram

ponents to the same repetition rate. The frequency of the
sine-wave generated by the bridge oscillator is divided by
10, 100 or 1000 by the frequency divider; the pulsed oscilla-
tor and pulse-delay generator are then synchronized together
by a -4 V spike output from the divider.
When measuring the transit time the oscilloscope is
triggered externally by thebridge oscillator and the appro-
priate portion of the oscilloscope^ trace is intensified by
the pulse-delay generator. To get an overlap, the horizontal
time base of the oscilloscope is adjusted and the final over-
lap is accomplished by adjusting the bridge oscillator fre-
quency until there is a one-to-one cycle correspondence in
each echo packet.
Generally, there is not a precise one-to-one cycle cor-
respondence even in adjacent echoes due to dispersion, of the
signal by orientation errors (27), dislocations and other
imperfections in the sample. This difficulty is taken care
of by overlapping a large number of echoes in one group and
using an average transit time which gives the group the best
cycle correspondence rather than using the transit time ob-
tained from overlapping only two adjacent echoes.
The estimated accuracy of the system is one part in ten
thousand with respect to the transit time. However, due to
uncertainties in the sample dimensions, orientation errors,
etc.,the total accuracy of the measured sound velocities is
estimated to be on the order of 0.25%.
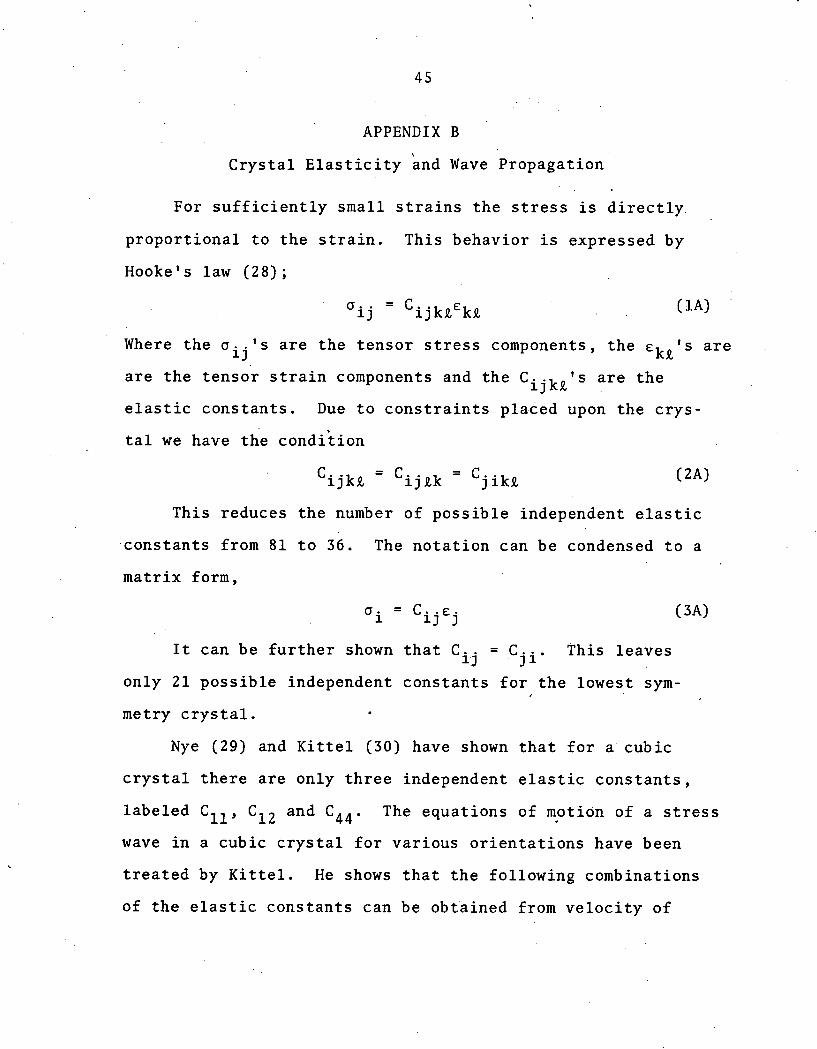
APPENDIX B
Crys ta l E l a s t i c i t y And l a v e Propagation
For s u f f i c i e n t l y small s t r a i n s t h e s t r e s s is d i r e c t l y .
propor t ional t o t h e s t r a i n . This behavior is expressed by
Hooke's law (28) ;
- ' i j - 'ijkkekk (PA)
Where the u i j t s a r e the t ensor s t r e s s components, t h e r k k t s a r e
a r e t h e t ensor s t r a i n components and t h e C i j k Q ' s a r e t h e
e l a s t i c cons tants . Due t o c o n s t r a i n t s placed upon the c rys -
t a l we have t h e condi t ion
- - - ' i jkk 'i j ek - ' j ike (2A)
This reduces t h e number of poss ib le independent e l a s t i c
cons tants from 81 t o 36. The no ta t ion can be condensed t o a
mat r ix form,
'i = C . . E
11 j ( 3A)
I t can be f u r t h e r shown t h a t C i j - - C j i . This leaves
only 2 1 poss ib le independent cons tants f o r t h e lowest sym-
metry c r y s t a l .
Nye (29) and K i t t e l (30) have shown t h a t f o r a cubic
c r y s t a l t h e r e a r e only t h r e e independent e l a s t i c cons tan t s ,
labe led C l l , C l 2 and C 4 4 . The equat ions of motion of a s t r e s s
wave i n a cubic c r y s t a l f o r var ious o r i e n t a t i o n s have been
t r e a t e d by K i t t e l . He shows t h a t t h e fol lowing combinations
of t h e e l a s t i c cons tants can be obtained from v e l o c i t y of
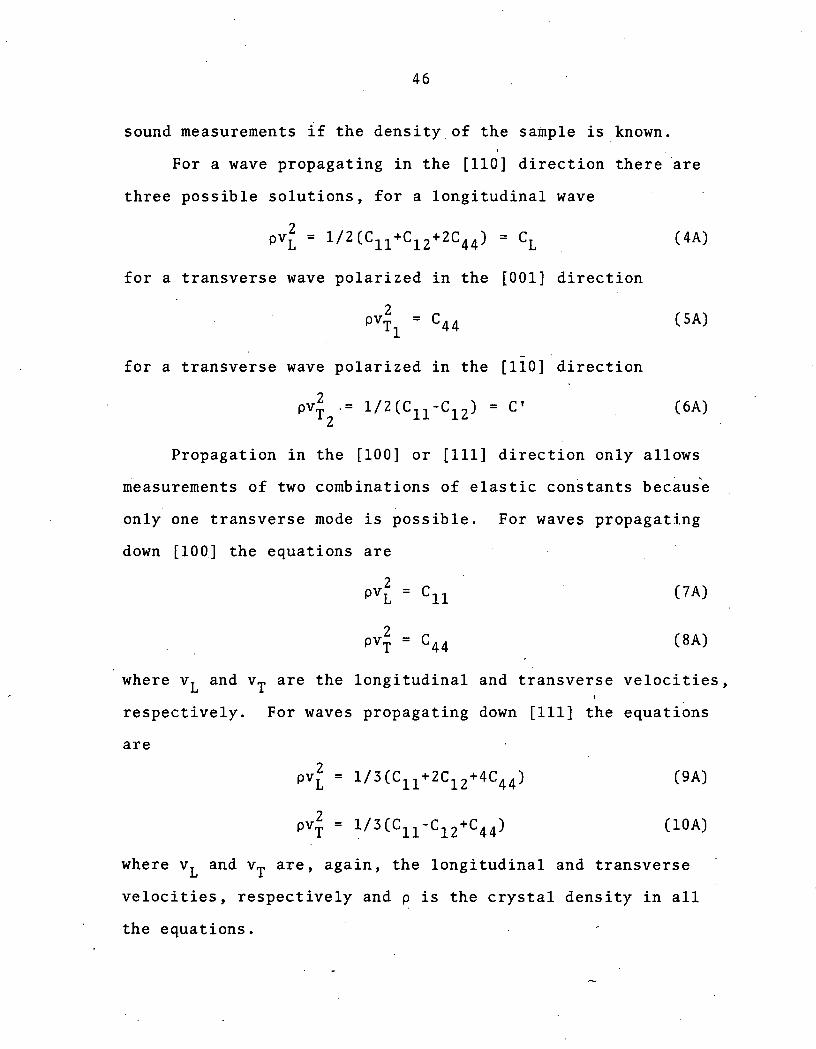
sound measurements if the density, of the sample is known.
For a wave propagating in the. [I101 direction there 'are
three possible solutions, for a longitudinal wave
2 pvL = 1/2(Cll+C12+2C44) = CL ( 4A)
for a transverse wave polarized in the [OOl] direction
for a transverse wave polarized in the [ll~] direction
Propagation in the [loo] or [Ill] direction only allows
measurements of two combinations of elastic constants becausk
only one transverse mode is possible. For waves propagating
down [loo] the equations are
2 PVL = CI1 (7A)
where vL and vT are the longitudinal and transverse velocities, i
respectively. For waves propagating down [Ill] the equations
are
where vL and vT are, again, the longitudinal and transverse
velocities, respectively and p is the crystal density in all
the equations.

1 would first like to thank Dr. F. X. Kayser for the
time and guidance he provided in this investigation; and to
thank Mr. G. L. Stowe for growing the single crystals used
in the project.
A special thanks is extended to Mr. R. Prior and Mr. G.
Holland of the Ames Lab. Instrument Group for the time and
effort to build and keep running portions of the pulse-echo-
overlap system.
I also would like to thank Dr. C. W. Chen for the gener-
ous use of.the magnet required in this investigation.