Embed Size (px)
Citation preview

Syracuse University Syracuse University
SURFACE SURFACE
Dissertations - ALL SURFACE
May 2014
Technology Adoption in Secondary Mathematics Teaching in Technology Adoption in Secondary Mathematics Teaching in
Kenya: An Explanatory Mixed Methods Study Kenya: An Explanatory Mixed Methods Study
Leonard Mwathi Kamau Syracuse University
Follow this and additional works at: https://surface.syr.edu/etd
Part of the Education Commons
Recommended Citation Recommended Citation Kamau, Leonard Mwathi, "Technology Adoption in Secondary Mathematics Teaching in Kenya: An Explanatory Mixed Methods Study" (2014). Dissertations - ALL. 122. https://surface.syr.edu/etd/122
This Dissertation is brought to you for free and open access by the SURFACE at SURFACE. It has been accepted for inclusion in Dissertations - ALL by an authorized administrator of SURFACE. For more information, please contact [email protected].

Abstract
This study examined the factors related to technology adoption by secondary mathematics
teachers in Nyandarua and Nairobi counties in the Republic of Kenya. Using a sequential
explanatory mixed methods approach, I collected qualitative data from interviews and classroom
observations of six teachers to better understand statistical results from the quantitative survey of
135 teachers, and drew on Rogers’ (2003) diffusion of innovations theory. In the initial
quantitative phase, using multiple regression analysis, I identified six explanatory variables
related to technology adoption that resulted in R square of 61.2% and adjusted R square of
59.3%. These six variables and the corresponding standardized regression coefficients (Beta) are
as follows: age of a teacher ( ), school type (.267), Internet at home and school (.245),
educational technology in general (.301), in-service training (.527), and discussions about
technology (.161). In the qualitative phase, the participants described how technology training,
technology resources, and demographics influenced their decisions to adopt technology in their
teaching. Overall, the findings revealed that secondary mathematics teachers in Kenya lacked
technology skills and technology training was low, the Internet supported early adopters in self-
training, access to learning resources, and teacher collaboration, while a lack of adequate
technology resources hampered technology adoption, the late adopters’ had negative views about
technology in learning environments and where technology was available the teachers were not
using technology for teaching mathematics. Some of the non-significant variables included
gender, education level, time, ownership of laptop computer, and computer lab. Indeed,
qualitative data revealed that time to complete the syllabus and to prepare technology-enhanced
lessons inhibited teachers’ decisions to adopt technology in mathematics teaching. Through this
study, I conclude that in-service training is the most significant factor in technology adoption

process over and above the availability of technology resources while the relationship between
school type and age of a teacher on a mathematics teacher’s technology adoption score were not
well understood. For this reason, technology training programs for teachers need to be
reevaluated to consider committing technology trainers who understand technology, training
teachers on specific mathematical software, establishing training centers near teachers’ localities,
and encouraging collaboration efforts. This study suggests recommendations for further research
to understand technology adoption in secondary mathematics teaching in Kenya.

Technology Adoption in Secondary Mathematics Teaching in Kenya: An Explanatory
Mixed Methods Study
By
Leonard Mwathi Kamau
B.Ed. (Science), Kenyatta University, 1999
M.A., Central Michigan University, 2001
Dissertation
Submitted in partial fulfillment of the requirements for the degree of
Doctor of Philosophy in Mathematics Education
Syracuse University
May 2014

Copyright © Leonard Mwathi Kamau, 2014
All Rights Reserved

v
Acknowledgement
The work on this dissertation is more than the culmination of many years of education.
The pages are a reflection of words of encouragement from many inspiring people, including my
early teachers who taught me how to read and write. I cannot mention everyone here on this page
because the list would be too long, but I take pleasure in every piece of advice, goodwill, and
best wishes that that has contributed to the success of this dissertation.
To my advisor, Joanna Osborne Masingila, and your husband, Adamson Masingila –
gracious and compassionate mentors who thoughtfully supported me to get where I am today.
Your good intentions shall be told for many generations to come. Jo, thanks for your care,
patience, guidance, and the freedom that you gave me to do research and teach. Indeed, you have
used your privileges in academia responsibly to create a better world, and you are a great teacher,
equal to none.
Thanks to the other members of my dissertation committee, Alan Foley and Declan
Quinn for guiding my research with zeal and dedication. I could have been a lonely scholar
without your counsel, thoughtful criticism, and encouraging words that kept me going. The
indelible ink on these pages is a reflection of your absolute contribution and allegiance to
education.
To my professors, you painstakingly taught me how to think, read, write, and teach
through challenging coursework. To you, Helen Doerr, thanks you so much for your dedication
in every way when I needed guidance. Thank you, too, Nick Smith, Sari Biklen, Dalia
Rodriquez, Gretchen Lopez, and Kalena Cortes.
To my colleagues and graduate students in the mathematics education seminar, thank you
for your comradeship and solidarity, and for sharing your comments and insights on this work.
And to my friends who came up in many ways to help with moral support and foresights, thank
you for coming to my rescue when I needed you.
Gratitude to the research assistants: Fredrick Odindo and Judy Kuria who dedicated their
time in this study. I also thank the mathematics teachers who participated in this study and the
school principals who facilitated data collection at their schools both in Nairobi and Nyandarua
Counties. This work could not have been completed without your dedication to education.
To my late father, James Kamau and my grandfather Leonard Mwathi Moko, I have
reached where you both wanted me to be. To my mother, Teresia Wangui, brother, and sister,
thank you for your prayers and best wishes. To my son, Ernest Kamau, I was away from you to
get an education and forever grateful for your endurance and patience. To son Calvin-James
Kamau, you were born where your father was about to complete this dissertation; you were born
at the right time. To my wife, Mary, I could not have done this without your support and prayers.
I remember many times when you advised me not to give up – the pain was all worth it.

vi
Table of Contents
Acknowledgement .............................................................................................................. v
Table of Contents ............................................................................................................... vi
List of Abbreviations ......................................................................................................... xi
List of Tables ................................................................................................................... xiii
List of Figures .................................................................................................................. xiv
Chapter 1: Introduction ................................................................................................................... 1
Overview ............................................................................................................................. 1
Designation of Terminology ............................................................................................... 3
Statement of the Problem .................................................................................................... 4
Purpose of the Study ........................................................................................................... 7
Research Questions ............................................................................................................. 8
Quantitative Research Questions ............................................................................ 8
Qualitative Research Questions .............................................................................. 8
Mixed Method Research Question.......................................................................... 8
Limitations of the Study...................................................................................................... 8
Delimitations of the Study .................................................................................................. 9
Significance of the Study .................................................................................................... 9
Theoretical Considerations ............................................................................................... 10
Summary of the Research Methodology........................................................................... 11
Definition of Terms........................................................................................................... 12
Summary ........................................................................................................................... 13
Chapter 2: A Review of the Literature .......................................................................................... 17

vii
Theoretical Perspectives ................................................................................................... 17
Technological Pedagogical Content Knowledge (TPACK) ................................. 17
Activity Theory ..................................................................................................... 20
Instrumental Approach.......................................................................................... 22
Technology Acceptance Model ............................................................................ 24
Diffusion of Innovations Theory .......................................................................... 25
Diffusion of Innovations Theory in Technology Adoption in Schools ............................ 32
Criticism of the Diffusion of Innovations Theory ................................................ 34
Rationale for Using the Diffusion of Innovations Theory .................................... 36
Debates on the Uses of Technology in Mathematics Education ....................................... 39
Characteristics of the Meaningful Use of Technology in the Classroom ......................... 43
Research on the Factors Related to the Adoption of Technology in Schools ................... 47
Socio-demographic Factors .................................................................................. 47
Teacher-related Factors ......................................................................................... 48
External Factors .................................................................................................... 56
Research on Technology Adoption in the Kenyan Schools.............................................. 59
Methodological Considerations from the Review of the Literature ................................. 64
Rationale for Applying the Quantitative Research Approach .............................. 64
Rationale for Applying the Qualitative Research Approach ................................ 66
Rationale for Applying the Mixed Methods Research Approach ......................... 68
Summary ........................................................................................................................... 69
Chapter 3: Research Methodology................................................................................................ 72
Mixed Methods Research Design ..................................................................................... 72

viii
Philosophical Debates ........................................................................................... 73
Procedural Issues in the Sequential Explanatory Design ...................................... 74
Research Questions ........................................................................................................... 77
Participants and Sample Selection .................................................................................... 78
Sample Selection for the Quantitative Phase ........................................................ 78
Sample Selection for the Qualitative Phase .......................................................... 80
Data Collection ................................................................................................................. 83
Quantitative Phase ................................................................................................ 83
Qualitative Phase .................................................................................................. 85
Data Analysis .................................................................................................................... 89
Quantitative Data .................................................................................................. 89
Qualitative Data .................................................................................................. 105
Reliability and Validity, and Credibility Issues .............................................................. 106
Reliability and Validity ....................................................................................... 106
Credibility Issues ................................................................................................ 107
Field Relations and Ethical Considerations .................................................................... 108
Summary ......................................................................................................................... 109
Chapter 4: Results and Findings ................................................................................................. 112
Research Questions ......................................................................................................... 112
Quantitative Phase: The Sequential Multiple Regression Analysis ................................ 113
Model Summary.................................................................................................. 114
ANOVA Model ................................................................................................... 117
Model Parameters ............................................................................................... 118

ix
Answering Research Question 1 ..................................................................................... 123
Research Question 1a .......................................................................................... 123
Research Question 1b ......................................................................................... 124
Conclusion .......................................................................................................... 125
Qualitative Phase: Mathematics Teachers’ Profiles ....................................................... 126
Early Adopters of Technology ............................................................................ 126
Late Adopters of Technology ............................................................................. 158
Answering Research Question 2 ..................................................................................... 190
Research Question 2a .......................................................................................... 190
Research Question 2b ......................................................................................... 194
Conclusion .......................................................................................................... 197
Summary ......................................................................................................................... 198
Chapter 5: Discussion ................................................................................................................. 200
Summary of the Findings ................................................................................................ 201
Answering Research Question 3 ..................................................................................... 202
Technology Training ........................................................................................... 202
Technology Resources ........................................................................................ 208
Demographics ..................................................................................................... 212
Statistically Non-significant Variables ............................................................... 215
Conclusion ...................................................................................................................... 216
Implications for Practice and Policy ............................................................................... 220
Limitations of the Study.................................................................................................. 228
Recommendations for Future Research .......................................................................... 230
x
Summary ......................................................................................................................... 231
References ....................................................................................................................... 235
Appendix A: A Visual Display of the Sequential Explanatory Mixed Methods Research
Design ......................................................................................................................................... 257
Appendix B: Mathematics Teachers’ Survey Questionnaire .......................................... 258
Appendix C: Semi-Structured Interview Protocol .......................................................... 268
Appendix D: Classroom Observation Protocol: Early Adopters and Late adopters ....... 270
Appendix E: *A Map of Kenya ...................................................................................... 272
Appendix F: Research Authorization in Kenya .............................................................. 273
Appendix G: Consent Form ............................................................................................ 274
Appendix H: Institutional Review Board Syracuse University ...................................... 276
Vita .................................................................................................................................. 277

xi
List of Abbreviations
AMTE: Association of Mathematics Teacher Educators
ANOVA: Analysis of variance
CAI: Computer-Aided Instruction
CBMS: Conference Board of Mathematical Sciences
CCK: Communication Commission of Kenya
CEMASTEA: Center for Mathematics Science and Technology Education in Africa.
CEPK: Computers in Education Project in Kenya
CFSK: Computers for Schools in Kenya
CK: Content Knowledge
CST: Computer Skills Training
ESP: Economic Stimulus Programme
GNI: Gross National Income
GSMA: Groupe Speciale Mobile Association
HDI: Human Development Index
ICT: Information and Communication Technology
IDRC: International Development Research Center
IMF: International Monetary Fund
ISTE: International Society for technology in Education
KCPE: Kenya Certificate of Secondary Education
KCSE: Kenya Certificate of Secondary Education
KIE: Kenya Institute of Education
KNEC: Kenya National Examinations Council
MDGs: Millennium Development Goals
M-TPACK: Mathematics Technological Pedagogical and Content Knowledge
NCATE: National Council for Accreditation of Teacher Education
NCTM: National Council of Teachers of Mathematics
NEPAD: New Partnership for Africa's Development

xii
NI3C: National ICT innovation and Integration Centre
PCK: Pedagogical Content Knowledge
SMASSE: Strengthening Mathematics And Science in Secondary Education
SPSS: Statistical Package for the Social Science
TAM: Technology Acceptance Model
TIMSS: Third International Mathematics and Science Study
TK: Technology Knowledge
TPACK: Technological Pedagogical and Content Knowledge
TPK: Technological Pedagogical Knowledge
UNSTAT: United Nations Statistics Division
WEO: World Economic Outlook

xiii
List of Tables
Table 3.1 Summary of Multicollinearity Diagnostics of the Explanatory Variables ................... 94
Table 3.2. Summary of the Variables in the Study ....................................................................... 95
Table 3.3. Cronbach’s Alpha Score for the Likert-type Scale Survey Questions ........................ 97
Table 3.4. Kolmogorove-Smirnov and Shapiro-Wilk Test for Normality of a mathematics
teacher’s technology adoption score ............................................................................................. 98
Table 3.5 Operationalization of the Variables Based on the Elements of the Diffusion of
Innovations theory ...................................................................................................................... 101
Table 3.6 Details of the Participants’ in the Qualitative Phase ................................................... 108
Table 4.1 Correlation Matrix between Variables in the Study ................................................... 115
Table 4.2 A Summary of the Sequential Regression Analysis ................................................... 116
Table 4.3 Summary of the ANOVA Model ............................................................................... 118
Table 4.4 Summary of the Model Parameters ............................................................................ 119

xiv
List of Figures
Figure 2.1: A Conceptual Model for TPACK (http://tpack.org) .................................................. 18
Figure 2.2: The Activity Theory System Diagram (Engeström, 1987) ........................................ 21
Figure 2.3: The Bell Curve (Rogers, 2003) .................................................................................. 31
Figure 2.4: Rogers' (2003) Rate of Adoption S-shaped Curve ..................................................... 31
Figure 3.1: The Missing Value Analysis ...................................................................................... 90
Figure 3.2: The Q-Q Residual Plot for the Mean-replaced Variables .......................................... 91
Figure 3.3: The Q-Q Residual Plot for the Median-replaced Variables ....................................... 92
Figure 3.4: A Scatter Plot of the Residuals versus the Predicted Mathematics Teacher’s
Technology Adoption Scores ...................................................................................................... 102
Figure 3.5: A Histogram of Bell-shaped Curve of Residuals ..................................................... 103
Figure 3.6: A Scatter Plot of the Standardized Residuals ........................................................... 104

1
Chapter 1: Introduction
Overview
Most Sub-Saharan African countries, including Kenya, are characterized by poverty, poor
infrastructure, disease, low income levels, and poor education. Many of these economic and
social problems in Africa were highlighted in the United Nations Millennium Summit held in
New York City in 2000. In this summit, world leaders agreed on goals that would support
developed and developing countries to overcome social, environmental, and economic
challenges in the world. These goals, which are popularly known as the Millennium
Development Goals (MDGs) (United Nations, 2006) are aimed at encouraging poorer countries
to support social and economic policies that could benefit their people. Education was second
among the MDG goals, setting the benchmark that both boys and girls should have access to
Universal Primary Education by 2015. This goal recognized the need for African countries and
other developing nations to have a skilled workforce in order to improve their economies, and
that education can also improve the individual well-being of their citizens, too. Since the
establishment of the MDGs, “developing countries have recently witnessed a considerable
commitment and huge investments by national governments and their partners to improve
access, retention, and the quality of education” (Nangue, 2011, p. 18). Attaining these
commitments has not been easy for many African governments.
According to the United Nations (2010), enrollment in schools has increased since 2008,
but there are still more than 69 million children not in school worldwide. Thirty-one million of
these children live in Africa. According to this report, the economic status of many African
countries cannot support basic education for all children and at the same time provide the

2
training of teachers or pay wages needed for the hiring of qualified teachers. This has led many
children to drop out of school and has lowered the quality of education for the children who stay.
The Third International Mathematics and Science Study (TIMSS) revealed that students
in developing countries perform poorly in mathematics in comparison to their counterparts in
developed countries (Mji & Makgato, 2006). For example, Mji and Makgato highlighted that
South Africa came in last in the 1995 TIMSS, and performed poorly in all of the subsequent
studies. Similar issues have been reported in Kenyan schools, where students’ performance in
mathematics has been dismal (Githua & Mwangi, 2003; Manoah, Chisikwa, Indoshi & Othuon,
2011; Yara & Wanjohi, 2011). Students’ poor performance in mathematics has been attributed to
poorly trained teachers and a lack of appropriate instructional materials. However, considering
the debates surrounding the benefits of technological advancement, particularly on the prospects
of greater economic, social, and educational gains, many developing countries are starting to
reconsider educational reforms, with a clear focus on applying technology in education (Jhurree,
2005).
One country that has embarked on tremendous educational reforms is the Republic of
Kenya; a country located in the East Africa region that recently launched a development
blueprint referred to as the Kenya Vision 2030. The Kenya Vision 2030 aims at making the
country, “a newly industrializing, middle income country providing high quality life for all its
citizens by the year 2030” (Republic of Kenya, 2007, p. 1) based on three pillars: economic,
social, and political support. Through the education sector, which falls under the social pillar
support, Kenya hopes to achieve the goals of a “globally competitive quality education, training,
and research to her citizens for development and enhanced individual well-being” (Republic of
Kenya, 2007, p. xi) by the year 2030. Consistent with these goals, one of the projects for 2012

3
was to initiate a program that would facilitate equipping students with modern technology skills.
The government, however, is aware that these goals would not be achieved without first
establishing an elaborate and a functioning national technology policy.
Thus, by the time of launching the Kenya Vision 2030, in 2006, the government of
Kenya, through the Ministry of Information, Communication and Technology, developed the
National ICT Policy that sought to “facilitate sustained economic growth and poverty reduction,
promote social justice and equity, mainstream gender in national development; empower the
youth and disadvantaged groups, stimulate investment and innovation in [technology], and
achieve universal access to [technology]” (Republic of Kenya, 2006, p. 2). In this policy, one of
the objectives related to technology in education was “encouraging the use of [technology] in
schools, colleges, universities and other educational institutions in the country so as to improve
the quality of teaching and learning” (Republic of Kenya, 2006, p. 10). The government aims to
achieve this objective by (1) promoting e-learning resources and curriculum, (2) establishing
virtual institutions and centers for technological excellence, (3) developing an affordable
technology infrastructure, and (4) developing technology content.
Designation of Terminology
Some researchers may use the term Information and Communication Technology (ICT),
as used in the Kenyan context, to refer to the various tools and devices used to transmit, process,
store, create, display, and share or exchange information by electronic means in educational
settings. This may include computer hardware and software, hand held devices, mobile phones,
and the Internet (Maftuh, 2011).For the purposes of this study; however, I am using the term
technology to refer to the same tools and devices as ICT. According to Rogers (2003),
technology “is a design for instrumental action that reduces the uncertainty in the cause-effect
4
relationships involved in achieving a desired outcome” (p. 13). Technology has two components:
the hardware and the software. The hardware aspect “[consists] of the tool that embodies the
technology as material or physical object…and [the] software aspect, [consists] of the
information base for the tool” (p. 13). Therefore, in this study I will investigate different
technology-related hardware and software; excluding paper, pencil, and the blackboard.
Additionally, I use the terms technology use to mean ways technology is used by teachers
to enhance teaching and technology integration to mean applying technology by students to learn
mathematics The International Society for Technology in Education (ISTE, 2008). In addition, I
use the term technology adoption to mean mathematics teachers’ decisions to make full use of
technology for teaching in light of Rogers’ (2003) diffusion of innovations theory that guided
this study.
Lastly, the term independent and dependent variable (outcome) can be used to provide a
bridge between regression and other statistical procedures, and the term independent variable is
mostly used in experimental research (Keith, 2006). Throughout this study I will use the term
explanatory variable instead of the term independent variable and consistently use the term a
mathematics teacher’s technology adoption score to carry the same meaning as the dependent
variable. Further, the term explanatory variables are frequently referred to as the factors
(Creswell, 2008) of technology adoption, in the research questions, and other chapters of this
study of this study.
Statement of the Problem
Research confirms that “one of the most critical concerns in examination performance in
Kenya since independence relates to the low scores registered in Mathematics examinations”
(African Population and Health Research Center [APHRC], 2010, p. 1). As a result, to respond to

5
these challenges, the government and other stakeholders have initiated efforts to reverse the trend
of poor performance of mathematics in Kenyan secondary schools by training teachers through
projects such as Strengthening Mathematics and Science in Secondary Education (SMASSE
project, 1998). This project is supported by the Japanese government through the Japanese
International Cooperation Agency (JICA) with the aim of imparting teachers with pedagogical
and ICT skills. The SMASSE project, initiated in 1998 as an in-service training for teachers
(INSET) center for mathematics education in Africa, recently widened its focus to include a
larger target area, and thus the name of the project changed to the Centre for Mathematics,
Science and Technology Education in Africa (CEMASTEA). This project was designed to reach
over 22,000 teachers and school managers (Yara &Wanjohi, 2011), yet these efforts have not
quite improved students’ performance in mathematics. The analysis for KCSE mathematics
examination results for 2009-2010, showed that in 2009 students had a mean grade of E, which is
21.1%, and similarly—a mean score of 21.8% was documented in the 2010 KCSE results
(Kenya National Bureau of Statistics [KNBS], 2012). As a consequence, two of the challenges
that remains in secondary mathematics education in Kenya today is how to improve students’
performance in mathematics and upgrade of pedagogical and ICT skills for existing teachers to
improve the quality of education. Thus, it is projected that technology adoption in the education
system might contribute significantly towards increasing students achievement in mathematics
through teacher training, reducing high student-teacher ratios, supplementing existing
instructional resources, access of online teaching and learning materials, and improvement of
classroom practice (Wims & Lawler, 2007).
The government has also been on the frontline in providing partnership environments for
local companies and schools to collaborate with software companies to implement technology in

6
schools. Such partnerships include the Nokia Educational System pilot project for delivering
mathematics content for upper primary pupils in Standard 5 to 8, the Safaricom e-learning
management platform (Safaricom Blackboard) at Starehe Boys Center, and the Samsung solar-
powered Internet and e-board for teaching (Business Daily, July 17, 2012). Other projects
include the e-limu ed-tech tablet initiative for primary school students that incorporate content
from the national curriculum and the Computers for Schools Kenya (CFSK) project, the Nepad
e-learning, Kenya Institute of Education (KIE), Economic Stimulus Programme (ESP) computer
project, and the National ICT innovation and Integration Centre (NI3C). These initiatives were
setup to improve the quality of education in Kenya (Republic of Kenya, 2007).
Evidence from other countries in the world, however, reveals that such commitments and
investments in education do not lead to technology adoption (Gulbahar, 2007). Rather,
technology adoption in educational settings is a complex process that is influenced by many
other factors such as teacher-level, school-level, and system-level factors (Balanskat, Blamire &
Kefalla, 2006). Sherry and Gibson (2002) argued that technological, individual, organizational,
and institutional factors should be considered when examining technology adoption in
educational systems.
It is discouraging to note that the existing literature does not reveal intensive research
activities in developing countries regarding the factors related to technology adoption and
mathematics teaching. The few studies that are noticeable reveal that quantitative research
methods have dominated this field and so the voices of the participants in the form of qualitative
data are not present. Thus, such studies end up reporting findings that are deficient in
understanding technology adoption in schools. Although there have been attempt to use mixed
methods research to examine factors related to technology adoption in mathematics education, I

7
did not come across studies that applied multiple regression analysis in the Kenyan context,
drawing on the diffusion of innovations theory. Therefore, in this study I used quantitative data
to provide a general picture of the research problem, followed by the qualitative data to give
insight to the statistical results by exploring the participants’ views in more depth (Creswell,
2008), drawing on Rogers’ (2003) elements of diffusion of innovations theory.
Purpose of the Study
The purpose of this study was to examine the factors related to technology adoption in
mathematics teaching in Kenya. To investigate these factors, I conducted a sequential
explanatory mixed-method study that consisted of two phases: the quantitative phase and the
qualitative phase.
In the first phase (quantitative), I used a survey questionnaire to collect data from 135
public secondary mathematics teachers in Nairobi and Nyandarua counties, in the Republic of
Kenya.. The diffusion of innovations theory explained how the explanatory variables – age of a
teacher, school type, Internet at home and school, educational technology in general, in-service
training, and discussions about technology – were related to the dependent variable –
mathematics teacher’s technology adoption score.
The second phase (qualitative) consisted of collecting qualitative data using semi-
structured interviews and classroom observations to examine to what extent the explanatory
variables were related to a mathematics teacher’s technology adoption score. In the qualitative
phase, the factors related to a mathematics teacher’s technology adoption score were explored
with early and late adopters of technology in Nairobi and Nyandarua Counties in the Republic of
Kenya. The reason for the exploratory follow-up was to help explain the statistical results.

8
Research Questions
Three research questions guided me in this examination. I have categorized them as
quantitative, qualitative, and mixed methods research questions.
Quantitative Research Questions
1. Which factors related to technology adoption:
a. best predict a mathematics teacher’s technology adoption score? How can the
quantitative relationship be explained?
b. makeup the combinations of variables that best explain a mathematics teacher’s
technology adoption score? How can the quantitative relationship be explained?
Qualitative Research Questions
2. How do the factors related to a mathematics teacher’s technology adoption score explain:
a. An early adopter’s decision to adopt or not to adopt technology?
b. A late adopter’s decision to adopt or not to adopt technology?
Mixed Method Research Question
3. In what ways do the qualitative data contribute to a more comprehensive explanation of
the statistical results from the quantitative phase of the study?
Limitations of the Study
1. Self-reporting of the survey questionnaire might have resulted in unverifiable information,
which may have affected the findings of the study.
2. The time dimension to measure the rate of technology adoption was not considered in this
study. Therefore, teachers’ experiences about technology adoption from the beginning were
not documented.

9
3. The perceptions and experiences of students, school principals, and ministry officials were
not examined, which could have led to individual-blame bias (Rogers, 2003).
4. Rogers’ (2003) adopter categories did not fit the sample data. This led to categorizing
technology adopters either as early or late adopters, which could have led to a loss of
significant information.
5. The dependent variable (a mathematics teacher’s technology adoption score) did not measure
technology enhancement (as used by the teachers) and technology engagement (as used by
the students).
Delimitations of the Study
1. The study was conducted in two Counties (Nairobi and Nyandarua) in the Republic of
Kenya.
2. Data collection was done in the 2013 school year.
3. The study focused on only one subject area—mathematics.
4. The study focused on mathematics teachers.
Significance of the Study
This research strives to complement the existing research and enrich the current
knowledge of enablers and inhibitors of technology adoption in mathematics education in Kenya.
Such findings might be beneficial to stakeholders in education such as curriculum designers,
school managers, teachers, teacher education colleges, and the government of Kenya including
other developing countries with social and economic issues similar to Kenya.
Mathematics is among the subjects in which students perform poorly in Kenya (Yara &
Wanjohi, 2011). It is projected that technology might formulate new ways of teaching
mathematics and also complement the existing instructional strategies and resources to improve

10
students’ performance (Republic of Kenya, 2007). In addition, technology evidence shows that
technology enhances students’ mathematical computational fluency, conceptual understanding,
and problem solving skills (NCTM, 2000). Thus, understanding the factors related to technology
adoption in mathematics teaching will be a fundamental step in supporting students’ learning of
mathematics.
Additionally, the government of Kenya recognizes that education, including secondary
education, is the key to securing the skilled workforce needed to achieve the goals of Kenya
Vision 2030–of a middle-income economy. In fact, the realization of the Kenya Vision 2030 is
based upon students’ success in mathematics, among other subjects. Therefore, this study
provided policy suggestions to the government of Kenya about the factors related to technology
adoption in the teaching and learning of mathematics.
Theoretical Considerations
This study drew on five bodies of literature based on technology adoption in school
settings with emphasis on teaching secondary school mathematics. The related literature is
derived from: (1) theoretical frameworks used to study technology adoption in mathematics
education, (2) the use of diffusion of innovations to study technology adoption in schools, (3)
characteristics of the actual use of technology in the classroom, (4) debates on technology uses in
mathematics education, (5) research on the factors related to technology adoption in schools, and
(6) research on technology adoption in Kenyan schools. A general conclusion from these bodies
of research is that technology adoption in teaching mathematics in Kenyan secondary schools is
barely explored.
As a consequence, this research synthesis suggests that a line of research that establishes
the factors related to mathematics teachers’ decisions to adopt or not to adopt technology in

11
Kenyan secondary mathematics classrooms needs to be established. Researchers in mathematics
education following this line of research, in general, are concentrated mostly in developed
countries with fewer studies in developing countries. Additionally, evidence suggests that even
in developed countries, educational researchers in technology studies have not fully applied
Rogers’ (2003) diffusion of innovations theory—a theory that examines how an innovation is
taken up in a society—to understand factors related to adoption of technology in mathematics
teaching. Therefore, I have used Rogers’ (2003) diffusion of innovations theory; the elements of
diffusion of innovations theory (innovations, communications channels, time, and the social
system) to examine factors related to technology adoption in mathematics teaching in Kenya.
These elements were useful during the design of the study, data collection, data analysis,
answering the research questions, and discussion of the findings.
Summary of the Research Methodology
This study utilized the sequential explanatory mixed methods research design that
incorporated data collection in two phases: the quantitative and qualitative phase. For the
quantitative phase of the study, I used knowledge and implementation stages of the innovation-
decision process to create a dependent variable—mathematics teacher’s technology adoption
score—and I used these scores and other strategies to identify the early adopters and late
adopters of technology. Six explanatory (that included two control variables) for this study came
from a large pool of variables that were consistent with the literature in technology adoption in
schools. For the qualitative phase, I categorized the participants based on the Rogers’ (2003)
adopter categorization of early adopters and late adopters.
I collected the quantitative data using survey questionnaires and the qualitative data using
semi-structured interviews and classroom observations. Data analysis involved multiple

12
regression analysis for the quantitative data, open coding, and thematic analysis for the
qualitative data. The purpose of collecting the qualitative data was to explain the statistical
results from the quantitative phase. I connect and discuss the quantitative and qualitative phases
in Chapter 5.
Definition of Terms
A mathematics teacher’s technology adoption score is a construct that refers to the
teachers’ frequency of technology use and knowledge of technology for teaching.
Adjusted R2 is a reduced value for R
2 that attempts to make an estimate of the R
2 in the
population rather than the sample.
Champion teacher/individual is a “charismatic individual who throws his or her weight
behind an innovation, thus overcoming indifference or resistance that the new idea may
provoke in an organization” (Rogers, 2003, p. 473).
Coefficient of determination (R2) measures the proportion of the variation in the dependent
variable accounted for by the explanatory variables.
Control variables are variables held constant in order to help clarify the relationship
between the dependent variable and the explanatory variables.
E-learning includes all forms of electronically enhanced teaching and learning.
Explanatory variables are independent variables used to explain or predict changes in the
dependent variable.
Hardware refers to computers, mobile phones, calculators, printers, digital and video
cameras, and projectors.
Live MathTM
is a computer algebra and graphing tool designed for mathematicians.
Mathematical achievement refers to mathematical skills measured by performance on tests.

13
Maximal variation principle is a purposive sampling procedure that seeks to select
participants from a very small sample (less than 30) with a wide range of extreme
characteristics (Creswell, 2008).
Multiple correlation coefficient R is the measure of strength of association between the
independent (explanatory) variables and one dependent variable. R can be any value from 0
to +1.
Smart board is a large display that connects to a computer or projector. They may include
Interactive Whiteboards©, Activboard©, or mobile devices.
Software refers to the programs that tell a computer what to do. These include Microsoft
Office, the Internet, programming languages, etc.
Technology adoption is the process by which teachers apply technology to their professional
work including instruction, lesson planning, and administration work.
Summary
The quality of education in many developing countries is a significant concern;
particularly for those countries in Sub-Saharan Africa, Kenya included. Since independence,
Kenya has continuously reformed its education system with the hope that one day education shall
transform the lives of its people and the economy to match those of developed countries.
Recently, the Kenyan government launched the Kenya Vision 2030 that it hopes will make
Kenya a middle income country by the year 2030. Considering that the Kenya Vision 2030
requires skilled personnel to become a reality, the government has noted that the current status of
education cannot meet its objectives. In reality, mathematics performance in schools—a subject
area positioned to support the Kenya Vision 2030—has been poor since independence. This
problem points to teachers’ lack of mathematical content and pedagogical knowledge, inadequate
14
instructional resources, and a high student-teacher ratio. To overcome this challenge, the
government and the education stakeholders have started to commit technological resources in the
hope that technology will help to overcome these challenges.
Evidence from other countries in the world, however, reveals that such initiatives do not
lead to technology adoption by teachers because the availability of technology alone does not
guarantee that teachers will adopt technology to support students’ learning. Rather, technology
adoption is a complex process that is influenced by many factors, including those at the teacher-
level, school-level, and system-level (Balanskat, Blamire & Kefalla, 2006). In this case,
researchers have indicated that to understand technology adoption in an educational system, the
extent to which these factors were related to mathematics teachers’ decisions to adopt or not to
adopt technology needs to be investigated.
A review of the literature suggests that there has not been any extensive studies in Kenya
examining how technological, individual, organizational, and institutional factors related to
mathematics teachers’ decisions to adopt technology or not adopt technology. It is also
discouraging to note that researchers from other developing countries who have investigated
technology adoption in schools have mostly used quantitative research design without taking into
account the voices of the participants through qualitative data. This study used a sequential
mixed methods research approach to collect quantitative and qualitative data to understand the
research problem.
The first phase, which was the major component, collected quantitative data from
mathematics teachers through survey instruments with the goal of identifying the factors related
to technology adoption in mathematics teaching. The second phase, which was the minor
component, collected the qualitative data using classroom observations and semi-structured

15
interviews from six mathematics teachers to build on and explain the statistically significant
variables from phase one. Data analysis procedures included multiple regression analysis for the
quantitative data, and open coding and thematic analysis for the qualitative data. Rogers’(2003)
diffusion of innovations theory explained how the explanatory variables – age of a teacher,
school type, Internet at home and school, educational technology in general, in-service training,
and discussions about technology, influenced mathematics teachers’ decisions to adopt or not
adopt technology.
Answering the research questions for this study may contribute to the body of research in
mathematics education about what may inhibit or enable teachers to apply technology in
mathematics classrooms; and provide the government of Kenya and other stake holders with a
suitable model that would support technology adoption in mathematics teaching in Kenyan
secondary education.
This dissertation is organized into five chapters. The first chapter includes an
introduction, statement of the problem, purpose, research questions, theoretical framework,
limitations and delimitations of the study, significance of the study, definition of terms, summary
of the theoretical foundation, summary of the research methodology, and a summary of Chapter
1. Chapter 2 discusses the theoretical frameworks used to study technology adoption in schools
and the related literature. Chapter 3 discusses the research methodology for the study. Chapter 4
reports the results and findings from the quantitative and qualitative phases, respectively, and
answers research questions 1 and 2. Chapter 5 summarizes the study, answers research question
three, drawing on the literature and Rogers’ (2003) diffusion of innovations theory, and makes
conclusions, practice and policy implications, limitations, and recommendations for future
research.

16

17
Chapter 2: A Review of the Literature
This literature review is a synthesis of the research on technology adoption in education,
in both developed and developing countries with a particular emphasis on mathematics teaching.
I have organized this chapter as follows: (1) theoretical perspectives, (2) diffusion of innovations
theory in technology adoption in schools, (3) characteristics of the meaningful use of technology
in the classroom, (4) debates on technology in mathematics education, (5) research on the factors
that that were related to teachers’ effective adoption of technology in schools, and (6) research
on technology adoption in the Kenyan Schools.
Theoretical Perspectives
Educational researchers have developed various competing theoretical frameworks for
technology integration in the classroom. I have identified several of these theoretical frameworks
that have been used to research about the use of technology in mathematics education: (1)
Technological Pedagogical Content Knowledge (TPACK), (2) Activity Theory, (3) Instrumental
Approach, (4) Technology Adoption Model, and (5) the diffusion of innovations theory.
Technological Pedagogical Content Knowledge (TPACK)
In 1986, Shulman developed a new way of looking at teachers’ knowledge through a
construct that he called the pedagogical content knowledge (PCK). Shulman (1986) described
the pedagogical content knowledge (PCK) as a particular content knowledge that goes beyond
knowledge of subject matter. According to Shulman, PCK in the field of teaching involves “the
most useful forms of representations of those ideas, the most powerful analogies, illustrations,
examples, explanations, and demonstrations” (p. 9). Additionally, Shulman argued that a teacher
must be aware of students’ misconceptions and how to fix them, besides being familiar with
what makes learning easy or difficult for them. Shulman also described content knowledge as the

18
organization of knowledge in the mind of the teacher that “goes beyond knowledge of facts of
concepts of a domain…but requires understanding the structures of the subject matter” (p. 9). As
a consequence, using Shulman’s conception of PCK, Mishra and Koehler (2006) developed the
TPCK theoretical framework, which was later renamed TPACK (Thompson & Mishra, 2007) to
illustrate how teachers’ understanding of technology and pedagogical content knowledge (PCK)
interact to develop effective teaching practices that incorporate technology.
Figure 2.1: A Conceptual Model for TPACK (http://tpack.org)
In their model, Mishra and Koehler described three components to knowledge: content,
pedagogy, and technology that intersect to display TPACK. These components created the
elements of the TPACK construct – pedagogical content knowledge (PCK), technological
content knowledge (TCK), technological pedagogical knowledge (TPK), content knowledge
(CK), pedagogical content knowledge (PK), technology knowledge (TK) and the technological
pedagogical and content knowledge (TPACK) (Mishra & Koehler, 2006).

19
In mathematics education, researchers using TPACK have mainly concentrated in the
United States and have focused on pre-service secondary teachers (e.g., Landry, 2010; Niess,
2006; Schimdt, Baran, Thompson, Mishra, Koehler & Shin, 2009). Significantly fewer studies
involving in-service teachers have been conducted using TPACK theoretical framework in
mathematics education (e.g., Archambault & Crippen, 2009).
However, the TPACK theoretical framework has been used by various researchers in
various educational disciplines in ICT integration. One of the strengths of TPACK theoretical
framework has been on teacher assessment and evaluation. In mathematics education, for
example, Landry (2010) developed a survey instrument for validating middle school teachers’
mathematics technological pedagogical content knowledge (M-TPACK). The study supported
teachers’ in-service training to understand the role of technology in mathematics teaching. Other
studies have also developed survey instruments to study teachers’ TPACK. For example,
Archambault and Crippen (2009) developed a survey instrument to measure TPACK for K-12
online teachers. The findings indicated that teachers felt confident about their content
knowledge, pedagogical knowledge, and pedagogical content knowledge. However, teachers felt
incompetent when it came to the domain of technology. Schimdt et al. (2009) developed a survey
instrument to measure TPACK for pre-service teachers. They claimed that the instrument could
help teacher educators in designing appropriate longitudinal studies to assess pre-service
teachers’ development of TPACK.
The TPACK theoretical framework has not been without criticism for varied reasons.
Originating from Shulman’s initial conception of PCK, several researchers have raised concern
about the relationship between content knowledge and pedagogical knowledge (McEwan & Bull,
1991; Segall, 2004). These researchers have argued that it is not easy to think about content

20
knowledge without thinking about pedagogical knowledge. This problem based on Shulman’s
notion of PCK has persisted to the TPACK theoretical framework. On one hand, the TPACK
theoretical framework looks fancy both in text and graphics; however, its complexity to
comprehend and apply it in educational settings has been faulted (Archmbault & Barnett, 2010)
because the relationship between content, pedagogy, and technology has not been clearly
understood by researchers and educational practitioners.
On the other hand, Cox (2008) highlighted that TPACK theoretical framework lacks
implementation and evaluation strategies, and the boundaries to the constructs are not
distinguishable. In fact, considering professional learning for teachers, TPACK fails to clarify
the knowledge teachers need to know about content, pedagogy, and technology (Harris, Mishra
& Koehler, 2009). In agreement, Jimoyiannis (2010) argued that TPACK needs to be rebuilt so
that the distinction between the content, pedagogy, and technology may be clarified and the role
of tool affordances and limitations of constraints are elaborated.
Activity Theory
Activity theory originated from Cultural-Historical Activity Theory (Leont’ev, 1979;
Luria 1976; Vygotsky, 1978). Cultural-Historical Activity Theory has its origin in Vygotsky’s
basic work on social development theory. According to Vygotsky, a child’s learning occurs
through interaction with other children and adults in a social context. A child’s cognitive
structure, a facilitator, and culture form the basic elements that support a child in learning
advanced concepts and ideas they cannot learn on their own. As a result, Vygotsky, Luria, and
Leont’ev formulated the concept of artifact-mediated and object-oriented action, which in recent
times, researchers in education have increasingly used to develop better teaching materials and e-
Learning environments (Rizzo, 2003). It is within this context that Engeström (1987) proposed

21
the Activity Theory framework—based on the activity system as the basic unit. Under the
activity system, Lim (2002) explained that all human activity in the activity system is a
conceptualization between the interactions of the following elements: the subject, the object, the
tools, the community, the rules, the division of labor, and the outcome.
Figure 2.2: The Activity Theory System Diagram (Engeström, 1987)
According to Lim, the activity system emphasizes individual learning using different
tools, and other individuals that support them to learn in a social context. To help us understand
Activity Theory framework in ICT integration, Cole and Engeström (1991) described three types
of interactions emerging in educational contexts resulting from ICT integration. These
interactions include those: (1) between the subject and the learning object, mediated by tools and
artifacts, (2) between the subject and the community, mediated by rules and conventions, and (2)
between the object and the community, mediated by the division of labor.
One strength of Activity Theory framework is what Engeström (1987) considered as the
principle of contradiction that exists between any two elements in an activity system. He argued

22
that these contradictions act as obstacles to successful attainment of the goals of the activity
system. However, according to Engeström (1987) these contradictions can be useful in
understanding an activity system, which can eventually be used to improve the system.
On the other hand, Activity Theory has been criticized for focusing too much on the
activity of the individual(s) (Toomela, 2008) ignoring the cognition dimension of the
individual(s). Thus, according to Toomele, the way individuals think need to be considered to
determine how the activity system works. In addition, Kuuti (1996) observed that the goals in an
activity system cannot be realized in one step, but rather through a long tedious process that
endures many phases before the outcomes can be reached. Thus, a researcher using the Activity
Theory framework cannot rely on one method only to gather data; rather varied data collection
techniques are required to illuminate how an activity system is working. This may be a tedious
and a costly process for a researcher.
Researchers using this framework have examined pedagogical, social and technological
issues in ICT integration process at the classroom level (e.g., in Turkey, Demiraslan and Usluel,
2008), and effectiveness of ICT integration in students learning (e.g., in Singapore, Divaharan &
Ping, 2010). In the United States, Anthony and Clark (2011) used Activity Theory framework to
understand mathematics teachers’ challenges and the coping strategies during the integration of
ICT in teaching.
Instrumental Approach
The Instrumental Approach was inspired by two approaches—the anthropological
approach and the theory of instrumentation (from the field of Ergonomics) (Artigue, 2002).
According to Artigue, the anthropological approach in “mathematics is seen as a human
activity… mathematical productions and thinking modes are thus seen as dependent on the social

23
and cultural contexts where they develop” (p. 248). On the other hand, the theory of
instrumentation utilizes the human activity in a technological platform by employing the notion
of “instruments” and “instrumental genesis” (Artigue, 2002). Verillon and Rabardel’s (1995)
study on learning processes involving instruments in the area of cognitive ergonomic stressed the
difference between an artifact (the material object) and the instrument (the psychological
construct): “The instrument does not exist in itself, it becomes an instrument when the subject
has been able to appropriate it for himself and has integrated it with his activity” (p. 84).
According to Artigue (2002), for an individual learner, the artifact is not valuable until it
becomes an instrument through a process of instrumental genesis. This process of instrumental
genesis is two sided.
First, it involves the process of the instrumentalisation of the artifact that transforms the
artifact for the specific learner. Second, it involves the process of instrumentation where the
artifact transforms the individual learner by shaping their cognitive development by making use
of specific set of learning tasks. Thus, according to the instrumental approach, ICT integration
involves the process of instrumental genesis.
Besides, in the process of instrumental genesis, the teacher abandons the old learning
environment – the paper-pencil method – to support students’ learning by organizing new tasks
so that learners can develop new learning techniques for conceptual understanding. For that
reason, teachers’ facilitation and intervention plays a critical role to support students’ learning in
a new technology atmosphere.
Some of the studies that have looked into technology integration in light of instrumental
approach include Billington (2009), Drijvers, Doorman, Boon, Reed and Gravemejier (2010),
and Haspekian (2005). Guin and Trouche (1999) applied the instrumental approach in their study

24
to understand the influence of a graphing calculator as an instrument in students’ learning
through instrumental genesis. They highlighted that teaching organization plays an important
role in managing tasks with an instrument. The organization process they argued cannot be
accomplished without proper coordination of a graphing calculator and paper-pencil work. The
development of mathematics tasks must involve commitment of the teacher, recognizing the
drawbacks and the benefits of the artifact, and taking into account the behavior of students.
Trouche (2004) introduced the term instrumental orchestration to refer to teachers’ role in
guiding students’ instrumental genesis. Trouche argued that instrumental orchestration is defined
by the didactic configuration (layout of the artifacts), exploitation modes, main objectives,
secondary objectives, and accounts (results), in addition to the fact that the act of instrumental
orchestration can be categorized into three levels—the artifact level, the instrument level, and the
level between the instrument and the learner.
Technology Acceptance Model
The Technology Acceptance Model (TAM) is a highly cited theoretical framework
designed by Davis (1989) based on the user acceptance of information technology in a business
work environment. The TAM theoretical framework is based on a well-established model of
human behavior psychology by Fishbein and Ajzen (1975). In 1985, Davis developed, in his
doctoral thesis, a theoretical model on the system characteristics of the user acceptance of
computer-based information systems. The model was developed with two objectives in mind: (1)
to improve our understanding of user acceptance processes, (2) provide the theoretical basis for a
practical methodology for researchers to evaluate new systems before implementation (Davis,
1986). To develop this model, Davis looked at the motivational variables that mediated between
characteristics of the system and the actual usage of the computer by an individual, how these

25
variables were related to each other, the system characteristic and the individual user, and how to
measure the individual’s motivation level. Davis (1989) remodeled this framework to incorporate
other variables – such as perceived ease of use, perceived usefulness, ICT usage, and attitudes
towards ICT. Many other researchers have also utilized and suggested additions for TAM
theoretical framework (Chuttur, 2009). The TAM model has been used by a number of
researchers in mathematics education to study ICT-usage in schools—for example, factors
affecting adoption of ICT (Cassim & Obono, 2011), perceived usefulness and the ease of use of
computers (Tarmizi, Ayub, Abu Bakar & Yunus, 2008; Tella et al., 2007), and the future
applications of computers (Teo, Luan & Sing, 2008).
Critics of TAM argue that this model does not focus on learning tasks. Dishaw and
Strong (1999) argued that a lack of task focus in the TAM framework has led to mixed findings
because information and communication technology is task oriented. In light of this, Dishaw and
Strong proposed the task-technology fit model to address this problem. In this model, the task-
technology fit construct implies that the capabilities of technology are matched to the task. Users,
on the other hand, can choose the tools and strategies that will support them to accomplish these
tasks with the least amount of effort.
Diffusion of Innovations Theory
The diffusion of innovations theory was developed by Everett Rogers in his dissertation
work in agriculture at the University of Iowa in the mid-1950s. In his literature review, Rogers
synthesized existing studies on diffusion of innovations in agriculture, marketing, education, and
medicine. He found that diffusion of innovations was a general process that did not lean towards
a particular discipline. However, he found that diffusion was influenced by who the adopters
were and the place where diffusion was taking place. In 1962, Rogers published his book about

26
diffusion of innovations. The book has since been highly cited and has remained a leading guide
on how innovations develop in a social system in both developed and developing countries.
The diffusion of innovations theory describes a process in which an innovation is
communicated through certain channels over time among members of a social system (Rogers,
2003). Rogers stated that diffusion is a special type of communication about an idea that might
work or not work. Rogers argued that adoption or rejection of new ideas lead to a social
change—a “process by which alteration and functioning occur in a social system” (p. 6). Most of
the new ideas that have been investigated in diffusion studies are technological innovations and
therefore Rogers (2003) used “innovation” and “technology” synonymously. According to
Rogers, any diffusion process is influenced by four elements: (1) innovation, (2) communication
channels, (3) time, and (4) a social system.
Innovation. An innovation, according to Rogers, is an “idea, practice or object that is
perceived to be new by an individual or other unit of adoption” (p. 12). An innovation may have
been invented many years before, but if it is new to an individual then it is an innovation. The
newness of an innovation is related in terms of the knowledge, persuasion, and decision stages of
an innovation-decision process that I will describe later in this chapter.
Not all innovations are necessarily desirable, but its desirability differs between
individuals or social systems. According to Rogers (2003), “some technological innovation
usually has at least some degree of value for its potential adopters, but this advantage is not
always clear cut to those intended adopters” (p. 14). Rogers noted that individuals are sometimes
uncertain that a new technology innovation will bring newness to replace previous practices. As
the adopter seeks to develop knowledge the new technological innovation, the individual
becomes apprehensive if the innovation will solve the perceived problems. This impels the

27
individual to seek further information to reduce uncertainty about the innovation. Consequently,
the adopter decides either to adopt or reject an innovation. Adoption or rejection of an innovation
leads to consequences. According to Rogers (2003), consequences “are the changes that occur to
an individual or to a social system as a result of the adoption or rejection of an innovation” (pp.
31-32). Rogers suggested some ways to cope with uncertainty about an innovation’s
consequences that included: trying out the innovation on trial or probationary basis, distribution
of free samples of a new idea, sponsoring demonstrations, and peer trial. In the meantime,
Rogers claimed that the consequences of an innovation can be classified as follows: (1) desirable
versus undesirable (functional or dysfunctional), (2) direct versus indirect (immediate result or
second-order result), (3) anticipated versus unanticipated (recognized or unrecognized).
Technology clusters. According to Rogers (2003), technology clusters “consists of one or
more distinguishable elements of technology that are perceived as being interrelated” (p. 249).
Thus, technology may be perceived as a set of closely related innovations such that the
boundaries between the innovations are not distinct. Rogers noted that innovations that come as a
“package” are adopted more rapidly. This study investigated closely related technologies such as
computers, mobile phones, the Internet, software applications and so on.
Perceived attributes of an innovation. Rodgers (2003) described the characteristics on an
innovation as: (1) relative advantage, which is the degree to which an innovation is perceived to
be better than the methods used before, which can be measured by economic means, social
prestige, and convenience; (2) compatibility, which is the degree the innovation is perceived as
being consistent with the present values, past experiences, and the needs of an adopter; (3)
complexity, which is the degree the innovation is perceived to be difficult; (4) trial-ability, which
is the degree an innovation can be experimented before full adoption can take place; and (5)

28
observability, which is the degree to which the results are observable. Given that an innovation
exist communication channels must be established to ensure the innovation is adopted rapidly.
Communication channels. First, the adoption rate of an innovation depends on how
individuals communicate among themselves. Rogers (2003) stated that communication is “the
process by which participants create and share information with one another in order to reach a
mutual agreement” (p. 18). Rogers argued that the process of communication involves (1)
innovation, (2) an individual or a unit with experience and knowledge of a particular innovation,
(3) another individual or a unit with no experience or knowledge of the innovation, and (4) and a
communication channel connecting these two units or individuals. The communication channels
include the mass media channel and the interpersonal channel. According to Rogers, the mass
media, including the television, radio, newspapers, and so on, are the most efficient and rapid in
creating awareness about an innovation to potential adopters. On the other hand, interpersonal
channels include face-to-face communication between two or more individuals and may also
include interactive communication over the Internet. At this point, communication through the
word of mouth is a better evaluation of an innovation than a scientific evaluation. This
communication may involve conversations between individuals who have adopted an innovation
and those who have not yet adopted.
Rogers described the role of change agent in linking flow of ideas about an innovation
from a change agency to an audience of clients. According to Rogers (2003), “change agents
would not be needed in the diffusion of innovations if there were no social or technical chasms
between the change agency and the client system” (p. 368). Thus, the role of a change agent may
be needed to enhance communication of relevant information to client base about an innovation.

29
Elaborating how the process of communication between individuals occurs, Rogers (2003)
introduced the concepts of homophily and heterophily.
Homophily and heterophily. On one hand, Rogers described homophily as “the degree to
which two or more individuals who interact are similar in certain attributes, such as beliefs,
education, socioeconomic status, and the like” (Rogers, 2003, p. 19). Rogers observed that
homophily is more effective when similar individuals live closely and share similar goals.
On the other hand, Rogers described heterophily, the opposite of homophily, as the
degree to which two or more individuals differ in certain attributes. Rogers argued that diffusion
of innovation does not occur between individuals with similar skills levels because there is no
information to exchange between them. However, diffusion of innovation occurs when there is
some degree of heterophily between two individuals in a communication process.
Time. Time is an important variable in the diffusion of innovations process (Rogers,
2003). Rogers elaborated that there are three ways in which time is involved in the diffusion of
innovation process: (1) the innovation-decision process—the time an individual progresses from
the initial knowledge acquisition through the adoption or rejection of an innovation, (2) the
innovativeness and adopter categories—how early or late an individual adopts an innovation
compared to other individuals in a system, (3) the rate of adoption—the speed an innovation is
adopted by individuals in a social system.
The innovation-decision process. Rogers (2003) conceptualized the innovation-decision
process in five main stages that include: (1) knowledge stage—adopters gain awareness, how-to
knowledge, and principles-knowledge of how and why innovation works through
communication with peers, (2) persuasion stage—adopters develop attitudes based on how they
perceive characteristics of the innovation, (3) decision stage—depending on the attitudes

30
developed, the adopters decide to accept or reject an innovation, (4) implementation stage—the
innovation is put into use, (5) confirmation stage—an adopter assesses the impact of the
innovation and seeks reinforcement for the decision already made, and (6) the re-invention stage,
where changes are made to the innovation to suit a particular social context.
Innovativeness and adopter categories. Rogers (2003) defined innovativeness as “the
degree to which an individual or other unit of adoption is relatively early in adopting new ideas
than other members of a system” (p. 22). For clarity and efficiency reasons Rogers categorized
adopters of an innovation on the basis of their innovativeness. These adopters’ categories
included (1) the innovators, (2) the early adopters, (3) the early majority adopters, (4) the late
majority adopters, and (5) the laggards. According to Rogers, the adoption rate could be modeled
so that adopters’ categories fall under a bell curve. Innovators are at the lower tail of the
distribution (2.5% of the adopting population), followed by early adopters (13.5%). The early
majorities forms a large segment of the adopting population at (34%), followed by the late
majority at 34%, and at the upper end are the laggards at (16%), at the point where diffusion of
innovation is complete (depending on the rate of adoption) (see Figure 2.3).
In addition to adopter categories described above, Rogers’ further categorized adopters
based on adopters’ characteristics such as the social economic status, personality values, and
communication behavior. Following these characteristics Rogers’ categorized the innovators,
early adopters, and early majority as early adopters while late majority and laggards were
categorized as late adopters. The current study categorized participants as either early or late
adopters.

31
Figure 2.3: The Bell Curve (Rogers, 2003)
The rate of adoption. Time plays a significant role in determining the rate of adoption of
the innovation. According to Rogers (2003), the rate of adoption is measured as “the number of
individuals who adopt a new idea in a specified period of time” (p. 221). When this information
was represented in a graphical form, the resulting distribution was an S-shaped curve (See Figure
2.4 below).
Figure 2.4: Rogers' (2003) Rate of Adoption S-shaped Curve
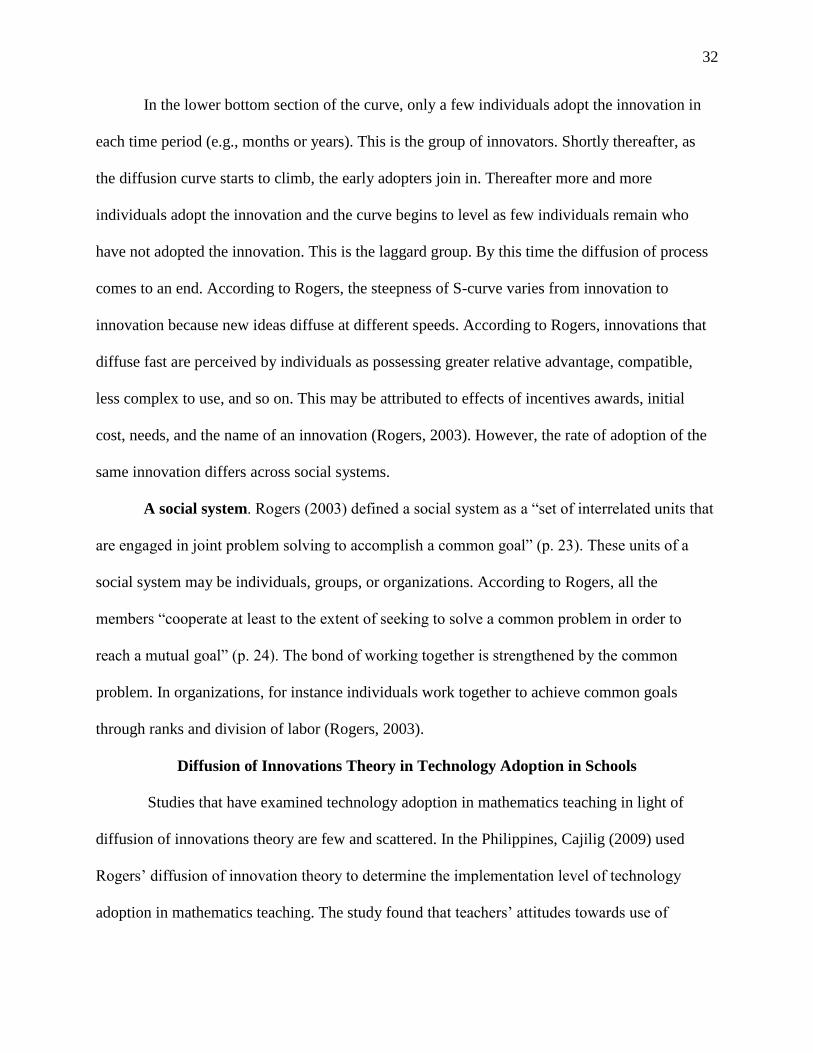
32
In the lower bottom section of the curve, only a few individuals adopt the innovation in
each time period (e.g., months or years). This is the group of innovators. Shortly thereafter, as
the diffusion curve starts to climb, the early adopters join in. Thereafter more and more
individuals adopt the innovation and the curve begins to level as few individuals remain who
have not adopted the innovation. This is the laggard group. By this time the diffusion of process
comes to an end. According to Rogers, the steepness of S-curve varies from innovation to
innovation because new ideas diffuse at different speeds. According to Rogers, innovations that
diffuse fast are perceived by individuals as possessing greater relative advantage, compatible,
less complex to use, and so on. This may be attributed to effects of incentives awards, initial
cost, needs, and the name of an innovation (Rogers, 2003). However, the rate of adoption of the
same innovation differs across social systems.
A social system. Rogers (2003) defined a social system as a “set of interrelated units that
are engaged in joint problem solving to accomplish a common goal” (p. 23). These units of a
social system may be individuals, groups, or organizations. According to Rogers, all the
members “cooperate at least to the extent of seeking to solve a common problem in order to
reach a mutual goal” (p. 24). The bond of working together is strengthened by the common
problem. In organizations, for instance individuals work together to achieve common goals
through ranks and division of labor (Rogers, 2003).
Diffusion of Innovations Theory in Technology Adoption in Schools
Studies that have examined technology adoption in mathematics teaching in light of
diffusion of innovations theory are few and scattered. In the Philippines, Cajilig (2009) used
Rogers’ diffusion of innovation theory to determine the implementation level of technology
adoption in mathematics teaching. The study found that teachers’ attitudes towards use of

33
computers in mathematics classrooms were high. However, the enthusiasm to use technology in
teaching was limited by a lack of computers and professional learning. In a study of how
mathematics teachers make decisions to integrate technology in teaching, Oncu, Delialioglu and
Brown (2003) highlighted five factors that affected teachers’ decisions during technology
adoption in their teaching: accessibility and availability, applicability, influence of colleagues,
teachers’ skills/knowledge, and students’ skills/knowledge.
Outside of mathematics education, Isleem (2003) study examined the relationships
between computer use and teacher factors that included expertise, access, attitude, support, and
teacher characteristics at Ohio public schools. The study found that teachers’ perceived expertise,
access to computers, and attitude toward computers were the significant predictors for computer
use. In-service training was recommended to increase computer use.
Similary, Bussey, Dormody and Vanleeuwen (2000) studied 310 teachers to determine
the factors that would predict the adoption of technology by secondary technology education and
industrial arts teachers in New Mexico. A survey questionnaire was developed to measure the
factors that influenced technology adoption level. Using stepwise multiple regression procedure
six explanatory variables explained 44% of variance to the level of adoption of technology.
These variables included: Perceptions of the attributes of technology education as an innovation,
influence of change agents and opinion leaders, perception of how often "optional" program
decisions were made, perception of how often "authority" program decisions were made,
teaching endorsement held, and years of teaching. The strongest predictor was teachers’
perception to the attributes of technology. They suggested that for teachers to succeed in
technology adoption, they needed to be provided with opportunities to raise their perceptions of

34
compatibility, relative advantage, trial-ability and observability, and to lower their perceptions of
complexity.
Rogers and Wallace (2011) study determined if there existed significant relationship
between the level of computer anxiety, innovativeness, and the level of technology integration in
pre-service teachers. Significant relationships were found between computer anxiety,
innovativeness, and technology integration. No significant differences were found between
certification level and innovativeness and there were no gender differences on innovativeness or
anxiety. He concluded that Rogers’ theory was found to be extremely significant in predicting
technology adoption.
Colandrea (2012) studied the factors related to the use of computers for school teachers.
The study found that knowledge of computers and positive attitudes predicted to effective use of
technology. The study also found that technology knowledge computer technology and positive
attitude were related to compatibility in traditional teaching methods. The study concluded that
teachers were positively influenced by computers and technology use was compatible with
traditional lesson delivery.
This review of the literature reveals that the diffusion of innovation theory in
mathematics education has not been sufficiently explored. This gap has contributed to a shortage
of studies upon which to build future research in the field of mathematics education. However,
despite the scarcity of research in this field, the diffusion of innovations theory has been highly
cited and accepted among researchers in many diffusion studies, except for some criticisms.
Criticism of the Diffusion of Innovations Theory
The diffusion of innovations theory has been highly accepted and used by diffusion
researchers across disciplines, private organizations, and U.S government agencies such as the

35
National Institute of Health, the Department of Agriculture, the Department of Education, and
the National Science Foundation (Rogers, 1995). However, this has not always been the case
because, as Rogers (1995) has indicated, the diffusion of innovations theory has some criticisms.
The first critique of the diffusion of innovations theory is the pro-innovation bias, which
implies that (1) all innovations need to be diffused rapidly and adopted by all members of a
social system, and (2) innovations should not be rejected or re-invented (Rogers, 2003).
According to Rogers, pro-innovation bias is caused by (1) change agents, since their goal is to
promote innovation, and (2) inadequate interrogation of unsuccessful innovation to understand
why adopters may have rejected an innovation. To overcome the pro-innovation, Rogers
suggested that: (1) an innovation should be investigated while diffusion is still underway, (2)
studies of unsuccessful innovation must draw data from similar members in a social system, and
(3) studies must understand why an innovation was accepted, rejected, or re-invented.
The second critique is what Rogers (2003) called the individual-blame bias. In this bias,
diffusion of innovations theory tends to lean towards change agents rather than the members of a
social system who adopt an innovation. In the critique of this bias, Rogers’ pointed out that late
adopters and laggards are often blamed for failure to embracing an innovation because change
agents perceive these adopters not to have followed the recommended guidelines. Several
suggestions have been made to overcome the individual-blame bias, including: (1) considering
using individuals as a unit of analysis in research studies, (2) taking precaution on change agents’
definition of a diffusion problem by keeping in mind other problems in a social system, (3)
including potential innovation adopters in the definition of a diffusion problem, and (4) including
those who create innovations, the communication channels for diffusion, and the those who
benefit in the definition of a diffusion problem (Rogers, 2003).

36
Another shortcoming of diffusion of innovations theory is how time is measured in an
innovation-decision process to study the rate of adoption of technology. According to Rogers, in
response to this problem, researchers might need to use questionnaires to ask adopters the
channels of communication they used during adoption of an innovation in addition to gathering
data at different points in time from when an innovation was first adopted. However, the rate of
technology adoption was not under investigation in the current study.
The last criticism of the diffusion of innovations theory is the social cultural conditions of
the United States where the diffusion of innovations was first conceived. In his view, Diaz-
Bordenave (1976) argued that diffusion of innovations did not address changing the social
structure in developing countries in Latin America, Africa, and Asia to address these social
cultural conditions. According to Diaz-Bordenave, the socio-economic power of individuals in
developed countries and individuals in developing countries are different, and thus, adoption of
innovations may vary greatly.
Rationale for Using the Diffusion of Innovations Theory
In the previous section, I have discussed five theoretical frameworks used to study the
use technology in mathematics teaching. First, TPACK has been used to understand teachers’
knowledge of interweaving technology and the content in teaching. TPACK has mainly been
criticized for lack of distinction between content and pedagogical knowledge. Second, activity
theory focuses on student learning using different technology tools and the kinds of support
students get from teachers. In addition, activity theory also illustrates how teachers use
technology in their teaching and the organizational supports they get from the school leadership.
Activity theory has been criticized for focusing too much on activity of an individual rather than
cognition of the individual; in addition to the tedious multi-step procedures to understand the

37
research problem. Third, the instrumental approach focuses on how teachers guide the students
in the process of instrumental genesis and how technology might transforms students’ learning.
Fourth, technology acceptance model (TAM) model was initially designed for information
management systems but education researchers have remodeled the TAM model to study
technology use in certain disciplines. However, the model has been criticized for lack of learning
tasks focus.
The current study embraced Rogers’ (2003) diffusion of innovations theory to investigate
the research problem. The diffusion of innovations theory revealed that most studies in diffusion
of innovations in K-12 settings are mostly in technology instruction. These studies have mainly
examined barriers to technology use and the factors that are related to technology use in
educational settings in general. Barely any research exists that has examined factors related to
technology adoption in secondary mathematics teaching drawing on the diffusion of innovations.
In addition, in reference to the theoretical frameworks that I discussed earlier in this
chapter, it is only the diffusion of innovations theory that can explain how technology is taken up
in an educational system, particularly from a developing country perspective where technological
innovations are in the process of being established. Therefore, Rogers’ diffusion of innovations
theory was particularly useful in understanding the (1) technological innovation and how its
attributes influenced mathematics teachers to adopt technology; (2) the innovation-decision
processes and the stages involved; (3) the innovativeness and technological needs of different
adopter categories (the early adopters and late adopters); (4) communication channels used by
individuals to share information related to technology adoption; and (5) organization unit of the
social system and how it influences technology adoption. Thus, I found Rogers’ (2003) diffusion
of innovations was useful in answering the research questions for my study.

38
Bearing these in mind, I applied the diffusion of innovations in my study from design of
the study, data collection, data analysis, and discussion of the findings. However, I had to
address several shortcomings of the diffusion of innovations theory: (1) pro-innovation bias, (2)
individual-blame bias, (3) social-cultural contexts for the diffusion of innovations theory, and (4)
the time dimension.
First to address the pro-innovation bias, I sought to study the factors related to technology
adoption in mathematics teaching in Kenya at the infancy stage. The pro-innovation bias
indicates that innovations should not be rejected and should be diffused rapidly by all members
of a social system. This indicates that there is a tendency by researchers to investigate successful
innovations and often overlook unsuccessful innovations (Rogers, 2003). This leads to knowing
too much about successful innovations and their adoptions, ignoring understanding why certain
innovations are rejected. Rogers suggested that to overcome this shortcoming a research problem
should be examined while the innovation is still underway to understand the challenges that
come in the early stages of diffusion. Therefore in studying the factors related to technology
adoption in mathematics teaching, I was trying to understand how these factors influenced early
adopters and late adopters of technology in the early stages of technology adoption in Kenyan
secondary schools.
Second, I addressed the individual-blame bias that indicates that if an innovation does not
succeed, then the late adopters are responsible for its failure. Consistent with Rogers’ (2003)
suggestions, I minimized the individual-blame bias (1) taking into account the perspectives of
early and late adopters of technology regardless of whether they had adopted technology or not,
(2) examining an array of factors related to technology adoption to establish how these factors
influenced early adopters and late adopters to adopt or not to adopt technology, and (3) studying

39
mathematics teachers as units of study as opposed to studying the schools systems. Therefore in
studying both early adopters and late adopters together I was trying to understand how factors
related to technology adoption influenced both categories of adopters to adopt or not to adopt
technology.
Third, according to Rogers (2003), the social cultural context of the United States, where
the diffusion of innovations theory was formulated, was different from developing countries.
Therefore according to Rogers, cultural importation of the diffusion of innovations may not be
valid in developing world contexts because of equality issues. I applied methodological measures
to minimize this challenge. The study applied a mixed methods approach to understand the
research problem. The quantitative phase of the current study used a survey questionnaire that
was developed for use in a developed country. To ensure that the findings from the quantitative
phase were meaningful and truthful, I collected qualitative data through interviews and
classroom observations to get an insight into how statistical results influenced technology
adoption. Thus, the mixed method research design ensured that the factors related to technology
adoption in mathematics teaching were situated within the Kenyan education context.
Lastly, according to Rogers (2003), the rate of adoption is difficult to measure because
self-reported data from participants indicating the date of adoption of an innovation may not be
accurate. Therefore, time dimension to study the rate of adoption was beyond the scope of the
current study.
Debates on the Uses of Technology in Mathematics Education
In the course of the last two decades, technology has drawn considerable attention from
the educational community because of its potential to support teaching and learning. As a matter
of fact, a sizeable amount of resources have been invested in both developed and developing

40
countries to justify the place of technology in education (Jhurree, 2005), and there is evidence to
suggest that new technologies offer convincing support to education that has not been
experienced before (Dawes, 2001).
However, the issue of technology in mathematics education has been contentious. One
group of researchers is not yet convinced that technology has any foreseeable pedagogical
benefits to students’ learning (e.g., Angrist & Lavy, 2002). Exploring these researchers’ line of
thought, the computer skills training (CST), which teaches students how to use computer
hardware or software applications, and the computer-aided instruction (CAI), which uses
software applications to teach content that is not related to technology (President’s Committee of
Advisors on Science and Technology, 1997), reveal two conflicting approaches to learning.
According to Angrist and Lavy, CST skills are undeniably useful; at least for some level of
computer literacy, however, it is the role of CAI that remains controversial. In their study,
Angrist and Lavy found that CAI in fact lowered students’ mathematics scores. As a
consequence, besides computer-aided instruction taking enormous infrastructural resources from
other educational uses, they declared that computers have no educational value to students’
learning.
While the views described by Angrist and Lavy (2002) and others can be quite useful in
understanding the role of technology in educational settings, there are other highly desirable
voices from the educational community that assert the use of technology can enhance students’
learning opportunities in multiple representation, seeing connections, data exploration, observing
patterns, and manipulating dynamic images National Council of Teachers of Mathematics
(NCTM, 2000). This reassurance has been considered by various educational bodies such as the
(ISTE, 2008), the (NCTM, 2000), the Association of Mathematics Teacher Educators (AMTE),

41
the National Council for the Accreditation of Teacher Education (NCATE, 2002), and the
Conference Board of Mathematical Sciences (CBMS, 2001). For instance, the NCTM (2000)
Standards argues that teachers should use technology to enhance students’ learning opportunities
by selecting tasks that efficiently use technology for graphing, visualizing, producing multiple
representations, and computing.
These views are also supported by researchers in the field of mathematics education who
agree that technology can have greater positive effects on students’ learning, when applied in
student-guided instruction as opposed to a teacher-directed instruction (Hong & Koh, 2002).
Along these lines, when technology is properly integrated in students’ learning, with the support
of the teacher, then technology has the potential of enriching teachers’ pedagogical goals (e.g.,
Jonassen & Reeves, 1996; Pitcher, 1998). Hong and Koh (2003) suggested that because a
constructivist approach to teaching and technology-use appear related to students’ mathematical
achievement, there is a safe promise for teachers to adopt constructivist inquiry in their
classrooms using technology. However, technology cannot substitute for poor quality teaching
neither can lack of content knowledge replace students’ understandings and skills (Mcgehee &
Griffitti, 2004). To a certain degree, technology only supplements what takes place in the
classroom (Wintz, 2009). According to Souter (2002), technologies such as graphing calculators
can be used to explore difficult problems, investigate multiple representations, and interpret
results as opposed to practice and drill of activities. Thus, a successful use of technology in the
classroom involves providing suitably structured mathematical tasks that prompt strategic use of
mathematical software by students (Ruthven, Deanny & Hennessey, 2009).
All the same, research reveals that the teacher plays a significant role in technology
adoption in the classroom. Connors and Snooks (2001) suggested that because of the efficiencies

42
provided to the learners by technology in the understanding of mathematics, teachers need to
make decisions on how to and when to integrate technology in instruction to support students in
developing wide-ranging mathematical skills and assessment of students’ learning. Thus, the key
to the success in learning mathematics is ultimately decided by the teacher and not by technology
per se (Alagic, 2003). Stryker (2000) argued that teachers are so significant in students’ learning
that even when students might have access to technology, without the support of the teachers
students are unlikely succeed on their own. Thus, teachers are critical players in the
implementation of any educational technology in schools (Lawson & Comber, 1999) because
they are the decision makers for the effective use of technology, “as with any tool, it can be used
well or poorly” (NCTM, 2000, p. 25). As such, a teacher may utilize technology tools in
different ways, such as drill and practice exercises, simulations and problem-solving activities,
and productivity tools (NCTM, 2000; Pisapia, 1994) to support students’ learning.
This discussion reveals that the debates surrounding technology adoption in mathematics
education are dominated by researchers. On one hand, there is a small group of researchers that
include Angrist and Lavy (2002) who believe that technology has no place in students’
mathematics learning for various reasons. On the other hand, there is another group of
researchers and professional bodies who hold the belief that technology can enhance students’
learning in student-guided instructions and constructivist environments as opposed to teacher
directed instruction. The latter group believes that teachers’ role in making decisions of what
students need to learn in technology-enhanced lessons remains unchallenged. However, these
researchers are cautious about the kind of instruction students are exposed to. For instance they
argue that drill and practice cannot support students’ learning of mathematics; rather students
should be subjected to mathematical tasks that are investigative and exploratory in nature. The

43
following discussion illustrates some ways that technology can be applied in the classroom to
enhance understanding and critical thinking.
Characteristics of the Meaningful Use of Technology in the Classroom
From a social constructivist perspective, Ferdig (2006) noted in a review of the literature
that technology innovation should (1) contain authentic and real-world problems, be interesting,
engaging, and meaningful to students’ learning, (2) provide students with self-regulatory roles in
the learning process, (3) provide opportunities for active participation of learning, collaboration,
and social interaction, (4) embrace instantaneous reproduction of learning materials, reflection,
and feedback, and (5) offer opportunities for students to create artifacts that display their
understandings in different ways. According to Ferdig, appropriate use of technology is
dependent on pedagogy, and the personnel involved in the students’ learning. However, the
technical design of technology may also determine whether students may succeed in learning or
not. Thus, constraints or enabling features of technology need to be understood and how they
affect students’ learning.
Such views are also supported by Doerr and Zangor (2004) in a study that found graphing
calculators acted as a constraining tool to students’ learning when students failed to make
meaningful interpretations of the tasks, and when they used graphing calculators as private tools
instead of pedagogical tools. Doerr and Zangor gave an instance where students failed to read the
content of the activity and went to try the functions of the graphing calculator. This negligence
contributed to students spending a considerable amount of time discussing objections not related
to mathematical tasks. Similarly, they noted that unlike a computer where students can share a
screen, a graphing calculator has a reduced screen, and this led the students to use the graphing
calculator as a private tool rather than a shared tool leading to a breakdown of group interactions.

44
However, the results from the study revealed different ways the students used a graphing
calculator in (1) evaluating numerical expression, estimating and rounding figures, (2)
transforming mathematical tasks, (3) gathering data, controlling phenomena, and finding
patterns, (3) finding symbolic functions, displaying data, interpreting data, and solving equations,
and (4) confirming conjectures. Doerr and Zangor suggested that the role of knowledge and
beliefs of the teacher influenced the emergence of this rich usage of the graphing calculator,
while a shared screen of the graphing calculator when it happened, supported students compare
and unify mathematical ideas.
Ruthven and Hennessy (2003) illustrated an outline of ideas about successful use of
technology in mathematics teaching in a wider project that involved a group of secondary school
teachers. The teachers indicated that technology (1) could facilitate effective working processes
and improve students’ productivity and work, (2) could be used in checking, trialing, and
refinement of students’ work, (3) could enhance the variety and appeal of classroom activities,
(4) could foster pupil independence and peer supports, (5) could help students with special needs
to overcome difficulties in writing, drawing, and graphing, and (6) could eliminate error-ridden
calculations and save time for higher-order learning activities. According to Ruthven and
Hennessey, this model can be a helpful resource tool for the teachers, prospective teachers,
teacher educators, and curriculum developers in articulating additional and alternative ideas
about successful technology use in the classroom practice.
Similarly, Garofalo, Shockey, Harper, and Drier (2000) outlined five guidelines that
reflected on what they believed to be appropriate uses of technology in mathematics teaching.
They noted that technology should (1) be introduced and illustrated in the context of meaningful
content-based activities, (2) address worthwhile mathematical and technological understanding

45
that support and facilitate conceptual development, exploration, reasoning, and problem solving
(NCTM, 2000), (3) overcome previous impractical computational constraints such as those
involving recursion and regression analysis, (4) interconnect mathematics topics and connect
mathematics to real world problems, and (5) incorporate multiple representations such verbal,
graphical, numerical, and algebraic representations of functions. According to Garofalo and
colleagues, these guidelines may have the potential to provide mathematics teachers with
opportunities to become knowledgeable and critical users of technology to support students’
learning. Similarly, Wertheimer (1990) highlighted that technology in teaching and learning of
geometry (1) motivates students in exploration, investigation, conjecturing, constructing proofs,
discovering principals, and making generalizations, (2) helps students to make connections
between different branches of mathematics, (3) provides opportunities for students to become
problem solvers of real-life mathematics rather than just solving routine problems, (4) enables
teachers to focus on students in need of extra assistance and support. According to Wertheimer,
presence of technology in the classroom frees the teacher for more individualized support of
students learning in addition to providing opportunities for students to collaborate and create
exciting and nurturing classroom environment.
According to a research reported during the five year period from 2003 to 2008 at the
annual conferences of the International Group for the Psychology of Mathematics Education
(PME), the Computer Algebra Systems (CAS) can improve students’ attitudes and develop
mathematical reasoning particularly in (1) generating, testing, and improving conjectures, (2)
developing awareness and intuition, (3) exploration of conjectures, (4) providing non-judgmental
feedback, and (5) developing students’ confidence in mathematics learning.

46
Drawing on NCTM (2002) technology principal that emphasizes equal access for
technology to all students, Mcgehee and Griffitti (2004) suggested that technology when used
well within mathematical tasks that are rich in graphing, computing, and visualizing then
students are promoted to think and reason. Technology is also important in implementing the
five principal strands (problem solving, reasoning and proof, communication, connections and
representations). In light of this, Mcgehee and Griffitti contended that having more than one
technology tool in the classroom is important because it provides the teacher with opportunities
to choose rich mathematical tasks that address the principle strands; although using one
particular technology is a good place to start with. But based on their views, incorporating
technology in the classroom requires support beyond the classroom walls because teachers need
to be provided with technology tools and opportunities to learn technology and how to
effectively apply it in teaching mathematical concepts. Thus, technology tools and in-service
training may give teachers opportunities to improve their pedagogical skills on how and what
students learn about mathematics.
In summary, this section highlighted various meaningful ways technology that could be
used to support students learning. There are many ways technology can used in the classroom
such as transforming mathematical tasks, gathering data, confirming conjectures, checking,
trialing, supporting students with special needs, exploring multiple representation, and providing
opportunities for collaboration and problem solving. However, evidence shows that meaningful
use of technology in the classroom can be influenced by many factors among them constraining
and enabling features of technology, teachers’ knowledge, and teacher’ beliefs among others.
The following section is a synthesis of the literature of some of the factors related to technology
adoption in schools.

47
Research on the Factors Related to the Adoption of Technology in Schools
This section synthesizes the research on the factors related to technology adoption in
schools with a particular emphasis on mathematics teaching. I have grouped these factors based
on three themes: (1) socio-demographic factors, (2) teacher-related factors, and (3) external
factors. I will discuss each of these themes and conclude with a discussion of their implications
on the current study.
Socio-demographic Factors
Research reveals that teachers' socio-demographic factors are related to technology
adoption in schools. Kumar, Rose and D'silva (2008) surveyed mathematics, English and science
teachers from 65 Malaysian secondary schools to understand how their technology usage was
related to age, gender, and teaching experience. The findings revealed that teachers' demographic
factors such as age and gender were related to teachers' computer usage. Kumar et al. suggested
that teachers need to be mentored and equipped with technology skills.
On age for instance, a study by Cavas, Cavas, Karaoglan and Kisla (2009) found that
teacher attitudes regarding technology use differed by age. Younger teachers below 25 years had
positive attitudes towards technology and attitudes decreased with age increment. Similar
findings were reported by Ocak (2005) who found that older teachers had negative attitudes
towards technology adoption. There is also evidence to suggest that younger teachers are more
internet literate compared to older teachers (Liang & Chao, 2002).
However, other studies in the literature indicate that younger teachers are not doing so
well in technology adoption. Such studies include Lau and Sim (2008) who found that elderly
respondents aged above 45 years made more frequent use of ICT in schools compared to
teachers aged 45 years and below and Chio (1992) who reported that older teachers has more

48
positive attitudes toward computer use in education than young teachers. Rana (2013) found that
younger teachers scored lower compared to older teachers on potential to technology use.
Similar inconsistencies have been reported on studies about the relationship of gender on
technology adoption. Some studies have found no significant differences in teachers' attitude
towards technology adoption with respect to their gender (Rana, 2013). While other studies have
revealed that males tended to show higher perceived efficacy in using ICT in learning and
teaching, as opposed to females who believed that ICT could benefit mathematics pedagogy
more (Lau & Yuen, 2013). Similarly, Ocak (2005) found that female teachers had negative
attitudes towards technology adoption.
In sum, clearly, there been differing findings across studies on how age and gender
influences technology adoption. In some studies, older teachers have been found to embrace
technology while others indicate younger teachers are more technologically skilled in adopting
technology, and others showing no significant differences. The same applies to how gender
influences technology adoption with some studies indicating male teachers as more likely to
adopt technology compared to female teachers while others find no significant differences. These
findings point towards further research in this area and extensive technology training programs
that cuts across gender and age groups.
Teacher-related Factors
In this section, I discuss teacher-related factors. These factors include teachers’
technology knowledge (including pedagogical knowledge), professional development, and time.
Technology knowledge. One of the key factors linked to teachers’ success in technology
adoption in education is the teachers’ technology knowledge. Effective teaching might not be
realized without adequate subject-related knowledge for technology adoption (Divaharan &

49
Ping, 2010). In Nigeria, Tella, Tella, Toyobo, Adika and Adeyinka (2007) investigated
secondary school teachers’ perceived ease of use of technology, and its perceived usefulness of
technology in the lessons. A survey of 700 teachers was conducted, comprised of private
secondary school teachers in Ibadan city. The study found that despite teachers’ positive attitudes
towards technology in teaching and learning, 33.8 % lacked expertise with technology, 21.5%
had insufficient knowledge of appropriate educational software, and 25.8% lacked the
knowledge to evaluate the use and the role of technology in teaching and learning. The study
recommended that employers of teachers and teachers themselves need in-service training that
would encourage teachers and students to engage themselves in active learning using technology.
Teachers’ effective knowledge for technology adoption may give students opportunities
to develop conceptual skills. Rodrigo (2003) sought to determine technology-based pedagogical
goals for teachers in Metro Manila schools in the Philippines. In the study, the population
consisted of public and private primary and secondary schools within Metro Manila. The region
had approximately 1,000 primary schools and 550 secondary schools; 20% of primary schools
and high schools were sampled for the mail-in questionnaire, while 5% of the 20% were sampled
for case studies. The findings revealed that few primary schools and secondary schools made use
of technology for creative learning purposes. Technology was primarily used to teach computer
literacy and programming.
Similarly, in Vietnam, Peeraer and Petegem (2011) examined 783 educators in five
teacher education institutions on their access to technology and their intensity of use. Data were
collected using a questionnaire. The study found that access to computers was not a barrier to
technology integration; however, personal ownership of a computer implied that computer usage
was for purposes other than teaching. Sixty-three percent of teacher educators were found to use

50
word processing for document production, and another 55% used technology for presentation, as
opposed to engaging students in conceptual learning. These findings implied that technology was
primarily used to support teacher-directed instruction, presentation, and drill and practice.
Mathematics teachers have been found to use technology to teach drill and practice. In
Missouri in the United States, Manouchehri (1999) studied 180 middle and high school
mathematics teachers with the goal of understanding factors that influenced their decisions
regarding computer use in their classrooms. The participants were asked to offer instances of
computer use, the benefits of computer use to students’ learning and the curriculum, and the type
of computer assignments they used with students. The findings revealed overwhelming evidence
that teachers used computers at the middle and high school levels for drill and practice. In
addition, teachers reported a lack of conviction pertaining to the usefulness of computers for
students’ learning. This problem was attributed to teachers’ lack of technology and pedagogical
knowledge.
Teachers’ technology knowledge and skills may be an indicator of their success regarding
technology adoption. In Malaysia for example, Keong, Horani and Daniel (2005) investigated
the most common technology applications used by teachers and how teachers used technology in
their lessons. The study showed that 71.1% of the respondents used word processing, 19.8% used
graphical applications, 17.1 % used simulation programs, 12.6 % used desktop publishing, and
6.3 % used Java applets. About 71.7% of the respondents said that they used technology
infrequently or had never used technology in their classrooms. Further, 40.5% used technology
as presentation tools and 8.1% for graphical visualizing tools. These findings implied that,
although teachers were technology literate, the level of technology adoption in the classroom was
limited. Consistent with these results, in Turkey, Demiraslan and Usluel (2008) found that

51
teachers used the Internet and PowerPoint to teach their classes instead of higher-order thinking
technology applications.
In a similar study, Forgasz (2002) aimed to understand how computers were being used
in mathematics classrooms. She developed a questionnaire and administered it to 96 grade 7–10
teachers, drawn from a representative sample of co-educational secondary schools in Victoria,
Australia. The findings revealed that spreadsheets and word processing were the computer
software most highly used by teachers, more so than mathematics-specific software. It was found
that to cope with this challenge, nearly all teachers indicated the desire to participate in in-service
training to refine their technology skills, gain confidence, and become familiar with
mathematics-related technology software.
Indeed, professional learning has been found to support teachers in guiding students’
learning. Lavicza and Papp-Vargas (2010), in a study of secondary teachers who used smart
board in Hungary, found that teachers valued integrating smart board in their mathematics
lessons. One teacher noted that “[Using technology in the classroom] can greatly interest
students in general and using mathematical software can be quite visual and useful, but when
they can work it on their own is even more inspiring” (p. 8). This implied that as students worked
on mathematical tasks, there was little doubt that smart boards had the potential to support
learners in developing their problem solving, reasoning, and mathematical thinking skills.
However, teachers’ technology knowledge alone may not always bring effective learning
to students. Dexter, Anderson and Becker (1999) examined the use of computers by teachers,
and their perceptions on the impact of computers on classroom practice. The data were drawn
from 47 teachers from 20 K-12 schools across three states in the United States. Drawing on a
constructivist model, the findings revealed three categories of teachers: non-constructivists, weak
52
constructivists, and substantial constructivists. Dexter et al. categorized 32 out of the 47 teachers
as constructivist teachers (i.e., weak plus substantial constructivists). The teachers who adopted
constructivist practices felt that reflective teaching, experience, courses taken, and the culture of
the school supported them in becoming more effective teachers, and computers alone, they
reported, did not change their practice.
On the other hand, teachers’ motivations, beliefs, and attitudes towards technology
adoption may be related to how teachers use technology in the classroom. Sang, Valcke, van
Braak and Tondeur (2009) conducted a survey of 820 primary school teachers in China to study
how teachers’ technology motivation and attitudes were related to computer use in their teaching.
The findings revealed that all these variables were correlated with technology integration. For
example, motivation was positively correlated with technology attitudes at example, as
teachers’ positive attitudes toward technology increased, their motivation level increased.
Motivation was found to have a direct effect on technology usage. Comparable findings were
reported by Karsenti, Villeneuve and Goyer (2006), Kumar, Rose and D’silva (2008), and Teo,
Luan and Sing (2008).
In Turkey, Yıldırım (2000)) noted that it is difficult for a teacher who has negative
attitude towards technology to encourage students to use computers at all, let alone using them
for instructional purposes. Thus, no matter how sophisticated software might be, its usefulness to
the students may depend on the teacher’s positive attitude (Huang & Liaw, 2005). Similarly, in
South Africa, Cassim and Obono (2011) examined the factors that influenced technology
adoption in the teaching of word problems in mathematics. The data were collected through a
questionnaire-based survey of 102 teachers from 36 schools in the Republic of South Africa. The
53
study found that adoption of technology was low in the teaching of word problems, which was
associated with teachers’ awareness, attitudes, and perceptions of technology integration.
In summary, evidence shows that teachers’ knowledge of technology contributes to how
teachers integrate technology in teaching. These studies show that teachers mostly use
technology for their own productivity. In addition, when they use technology in class work, it is
mostly for teacher-directed instruction such as PowerPoint, Internet searches, or for technology
literacy, as opposed to developing students’ higher-order thinking skills. In light of this,
inadequate technology knowledge regarding educational software and how to select good
mathematical tasks, and negative attitudes and beliefs limit how teachers integrate technology in
the classroom. However, professional learning has been suggested as one way to equip teachers
with technology and pedagogical knowledge.
Professional development. Professional learning is known to equip teachers with
content and pedagogical knowledge that facilitate effective teaching and learning. Gülbahar
(2007) illustrated how a technology planning process was developed in a private school in
Turkey. One hundred and five teachers, 25 administrative staff, and 376 students participated in
this study. The study revealed that, although teachers and administrators felt competent in
technology use (56%), 50% had participated in professional training, 69% were competent in
word processing, 12% were competent in educational software, and 21% could use technology
for instructional purposes. On the other hand, 57.1% had never used a calculator in class, while
64.8% used printed material in class. Fifty percent of these teachers indicated that they had
participated in professional learning courses in technology use. This implied that the technology
knowledge that teachers receive in professional learning courses and workshops need
(Archmbault & Barnett, 2010) to be examined.

54
Without doubt, the need for in-service training for teachers has been highly sought and
recognized by teachers and schools. Evidence shows that in-service training learning may
support teachers in gaining knowledge, skills and confidence for technology adoption in their
classrooms (Ertmer & Ottenbreit-Leftwich, 2010). Hartsell, Herron, Fang and Rathod (2009)
investigated how a four-week in-service training workshop for mathematics teachers helped
strengthen K-12 teachers’ knowledge, skills, and instructional applications of technology in
mathematics education. Data collection involved four different questionnaires that asked teachers
to report their knowledge, skills, and confidence on technology adoption in mathematics
teaching. At the end of the training workshop, a technology assessment test was used to assess
the effectiveness of the training session. The findings revealed that the workshop improved the
teachers’ technology skills for graphing calculators and other software programs, and increased
their overall confidence in teaching different math topics.
In summary, evidence shows that teachers fail to integrate technology in teaching
because of limited technology and pedagogical knowledge, which is also related to low
confidence levels among teachers. However, evidence also shows that in-service training
supports teachers in gaining confidence and knowledge for technology integration.
Time. Strict curricula requirements have been reported to limit teachers’ time during
technology adoption. For example, Lim and Khine (2006) examined the strategies used by
teachers to manage the barriers to technology adoption in four schools–two primary schools and
two junior colleges–in Singapore. Data collection involved classroom observations and face-to-
face interviews with teachers, heads of technology departments, and school principals. The study
found that: (1) teachers had difficulty in completing a technology-mediated lesson within a fixed
period of time, (2) a large amount of time was needed to prepare technology adoption lesson

55
plans, and (3) teachers were reluctant to use technology because they felt that they could teach
their students better and faster through traditional teacher-centered lessons.
Similarly, in the United States, Anthony and Clark (2011) examined five middle school
mathematics teachers’ challenges in technology adoption of a laptop program and how they
addressed the challenges that they encountered. Through interviews, the teachers were asked: (a)
if they integrated technology in their teaching, (b) to describe how they integrated technology in
their lessons, (c) what they perceived to influence their decisions on technology integration, and
(d) what conditions would support their efforts for technology integration. Drawing on the six
components of activity theory (object, subject, mediating artifacts, rules, community, and
division of labor), the study found that the teachers struggled to: (1) integrate technology in their
lessons; (2) finish the curriculum on time; and (3) improve students’ standardized mathematics
scores. To cope with this challenge, the teachers prolonged the completion time of the syllabus
and met the students after school hours for extra support. Other studies have reported time as a
barrier to technology integration (e.g., Divaharan & Ping (2010) in Turkey; Wanjala, Khaemba
& Mukwa (2011) in Kenya).
In summary, availability of time has been reported to affect teachers’ decisions during
technology integration. Teachers lack time to (1) attend technology training, (2) finish
technology-mediated lessons, (3) prepare technology-oriented lesson plans, and (4) complete the
traditional curriculum when technology is used in teaching. The time factor has also been
reported to influence a teacher’s teaching style (i.e., teacher-centered or student-centered
instruction). These findings imply that adjusting the school timetable, reducing the curriculum
load to enable teachers to receive opportunities to learn, and teacher collaboration during lesson
plan-making may support teachers in coping with the time factor.

56
External Factors
These are factors that a teacher is not able to manage. These factors include the school
curriculum, technology infrastructure and resources, technical and school support, and society
and culture.
School curriculum. An elaborate technology curriculum maps and guides how teachers
use technology in teaching. Ogwu and Ogwu (2010) examined the views of primary school
teachers in South Central Botswana concerning instructional utilization of technology. Two
hundred and sixty teachers from 24 public primary schools participated in the study. The
findings revealed that most teachers (77%) did not use technology in their teaching. The teachers
attributed their failure to use technology in their teaching to poor interpretation of the curriculum
and an overloaded curriculum. These teachers gave suggestions that were directed at the
government and curriculum planners to provide human and technology resources that would
support them in improving teaching and learning.
According to Rodrigo (2003), curricular goals should move towards using technology in
order to improve student motivation and performance. In a study of elementary teachers’
concerns about implementation of a new technology-based mathematics curriculum in Cyprus,
Chrysostomou and Mousoulides (2009) described mathematics teachers’ positive beliefs about
their self-efficacy, organization of teaching, and effectiveness of a new technology-based
curriculum. This implied that teachers were most likely to embrace and implement the new
technology curriculum in mathematics classrooms. Thus, during implementation of a new
technology curriculum, equipping teachers with technology knowledge is critical in building
teacher confidence to influence how they continue to embrace effective teaching styles using
technology.

57
School support. A lack of hardware and software has been documented as one of the
greatest obstacles to technology adoption in schools in many developing countries. In Turkey,
for example, Akbaba-Altun (2006) examined issues related to integrating computer technologies
into a centralized education system. Data were collected from 17 school principals, 15 computer
coordinators, and 150 elementary education supervisors through a survey and semi-structured
interviews. The findings revealed that limited technology resources and infrastructure and
incompetent personnel were the main variables making technology adoption difficult to
implement in the classrooms. Akbaba-Altun recommended that policymakers should develop
and implement a comprehensive technology vision and mission in order to reduce the challenges
of technology implementation at the school level and throughout the whole country.
School support is considered a factor that influences teachers’ effective adoption of
technology in the classroom (Wanjala, Khaemba & Mukwa, 2011). Demiraslan and Usluel
(2008) examined issues in the technology adoption process at the classroom level with a group of
Turkish primary school teachers, students, and technology coordinators. They observed 15
lessons with the aim of establishing the extent of technology availability and use; the type of
lesson activities; how students were grouped in the technology classroom, the learning content,
the role of the teacher, and the innovative uses of technology in the classroom. Data analysis
revealed that administrations in some schools did not provide opportunities for teachers’
professional development; lacked coordinated regulation of technology integration; and students
did not have access to technology tools. These findings suggested that school leadership plays a
significant role in the implementation of technology adoption in schools.
Technical support for teachers is important when new technological innovations are
introduced in schools and when computers break down. In Ghana, Agyei and Voogt (2011)

58
found that teachers’ perceived lack of technical support was a barrier to technology integration.
Other studies have also indicated that teachers encounter challenges in technology adoption due
to lack of technical support (e.g., Kumar, Rose & D’silva, 2008; Lim & Khine, 2006; Teczi,
2011).
In summary, the findings from these studies show that a lack of technology infrastructure
and resources inhibits teachers from adopting technology in the classroom. In addition, in
schools where technology is available, inaccessibility to technology and lack of technical support
reportedly limited teachers from using technology in the classroom. Thus, school administrations
need to involve teachers in the development of technology visions, plans, and technical expertise,
and to provide opportunities for professional learning.
Society and culture. Teachers’ perceptions of morality, society, and culture might
influence technology adoption in education. Albirini (2006) examined how Syrian high school
teachers’ perceptions of technology adoption were influenced by their national culture. Although
the study found that teachers had an overall positive opinion on the presence of computers in
Syria, there was notable apprehension among the teachers on the culturally inappropriate
material found on the Internet and its moral consequences for Syrian students. In this regard, the
participants proposed locally made computers and application software that would address
students’ needs while still adhering to the moral and ethical codes of the Syrian culture.
Similarly, in Saudi Arabia, Al-Oteawi (2002) found that teachers avoided using the
Internet for fear that students could access morally inappropriate materials. From this
perspective, teachers did not approve the Internet as a tool for teaching and learning “because of
the concerns of the evil aspects of the Internet” (p. 258). Thus, there is a need to develop
instructional software that is compatible with different world cultures.

59
In summary, teachers from some non-Western countries appear to have negative
perceptions about the use of the Internet in the classroom. This implies that technology made for
teaching and learning in different regions of the world may positively influence how teachers
integrate technology in teaching.
Research on Technology Adoption in the Kenyan Schools
This section reports the research on technology adoption in Kenyan schools. With regard
to the status of technology adoption in Kenyan secondary schools, the Aga Khan Academy, a
private school in Nairobi, embraced computer technology in 1983 when it received five
computers and the necessary hardware and software from the Aga Khan Foundation through
Computers in Education Project in Kenya (CEPK) (International Development Research Centre
[IDRC], 1991). Teachers in this project reported the importance and the efficiency of this
computer project. One teacher reported that “my students enjoy the computer classes because of
the marvel of using this innovation for the first time...I have also noticed that their concentration
on their studies has improved by almost l00%” (IDRC, 1991, p. 26). As a result, the Aga Khan
Foundation, with funding help from IDRC, set up a second phase that introduced computers to
four public secondary schools in Nairobi, and others across the country, like Moi High School
Kabarak, and Coast Girls Secondary School. However, the success of this project was not
without problems; among them high student-teacher ratios, scarcity of time to use computers,
frustrations among students trying to learn computers for the first time, high import custom duty
on computer resources, anxiety among school staff because of a lack of computer knowledge and
training, and the high cost of computers. However, the CEPK project was a success story, which
laid a foundation for other schools such as Starehe Boys Center, and Braeburn schools to begin
using computers and other types of technologies in classrooms (Webuyele, 2003). Since then,

60
computer use in Kenyan schools, particularly in the private schools, has grown tremendously –
although at a slower than desired pace.
In a study that used a cross sectional descriptive survey, Kiptalam and Rodriguez (2010)
looked at the utilization of the Internet among teachers and students in 11 connected rural and
urban secondary schools in Kenya. The findings revealed that the use of the Internet and its
integration in teaching and learning in secondary education was increasing among the students
and teachers as a means of communication and for information searching. In addition, Internet
access rates for teachers and students were observed to be much higher in educational institutions
that had made effective ICT investments in education. Evidence from the study showed that
teachers were integrating ICT in sciences, mathematics, English, and music. Teachers who used
the Internet for communication was higher at 79.3% for urban-based teachers compared to 60%
of rural-based teachers. The study showed that about 44% of the teachers had over six years of
using computers, while 11% had less than one year using computers. There also appeared to be a
gender disparity with more male teachers having more experience in computer use than female
teachers. This study suggested that ICT and its technologies are still at their infancy in Kenya,
and that there is urgent need for incorporating ICT training for pre-service and in-service training
for teachers.
Studies show that the need for in-service training for teachers has been highly sought, and
recognized by teachers and schools. Wanjala, Khaemba and Mukwa (2011) examined the factors
that are significant in in-service training that contribute to efficacy of secondary school teachers’
use of ICT in their instruction. This study was conducted in the Bungoma district, Western
province, Kenya. The findings showed that few teachers integrated ICTs in different content
areas. For in-service training learning, most teachers were found to use trial and error in their

61
ICT integration and referred to their course work completed at the universities and training
colleges to help them in ICT integration. The study also found that teachers had limited access to
computer hardware, lacked the knowledge and skills to integrate ICT, lacked time to integrate
ICT into their subjects, lacked the appropriate subject content software, lacked support from
administrators, and had negative attitudes towards ICT. To overcome these challenges, Wanjala,
Khaemba and Mukwa made several suggestions for improving initial teacher training on ICT
integration, in-service training on ICT integration, funding ICT implementation, and redesigning
the school curriculum.
There are claims that ICT cannot transform learning for students if school leaders are not
ICT literate. Makhanu (2010) aimed to understand the ICT literacy level among secondary
school principals in the Western province of Kenya. In this study involving 188 secondary
school principals, a survey was done to gather quantitative data, and subsequently open-ended
questions, semi-structured interviews, and observations were used to collect qualitative data. The
study found that (1) secondary school principals had fair access to the internet with 41.98%
access rate, however, principals lacked ICT knowledge and skills and consequently many did not
integrate ICT into their leadership responsibilities; (2) the social demographic features that
influenced ICT literacy were age, experience, level of education, level of ICT training, and
distance of the school from an urban center; and (3) there was a relationship between the school
principals’ level of ICT knowledge and the school performance. For instance, the challenges
faced by school principals in their attempt to become ICT literate correlated negatively with
school performance. Makhanu recommended that the Ministry of Education should give priority
in supplying electricity infrastructure computer resources, and principals must be involved in
teachers’ in-service training and training in ICT.

62
Similarly, Webuyele (2003) examined teachers’ and administrators’ perceptions and
experiences towards computer use in Kenya. Data were collected from nine computer-using
teachers, 10 non-computer-using teachers, two school administrators, four Ministry of Education
administrators, and two administrators from a teacher training college. The researcher used focus
groups to collect data, where the participants were asked open ended questions about their views
on computer use in Kenya. The results suggested that (1) computer-using teachers, non-
computer-using teachers, and administrators acknowledged that the use of computers in
classrooms was a worthwhile experience with benefits that outnumbered the obstacles, and (2)
computer-users spoke positively about their experiences of using computers, while the non-
computer-users expressed disappointment and resentment at the lack of ICT training. This study
revealed a weakness in pre-service training programs. Webuyele suggested the need to provide
pre-service and in-service training programs on ICT integration skills, and develop a revised
national plan to implement ICT in schools.
In a similar study, Momanyi, Norby and Strand (2006) conducted a study to find out if
Kenyan educators in primary, secondary and tertiary institutions were aware of the profound
impact technology had on student learning and achievement. A questionnaire survey was mailed
to principals or head teachers of schools to complete. Consistent with Webuyele and Makhanu’s
findings, the study indicated that the schools that lacked computer resources and teachers were
incompetent in the use of educational computer applications in the content they were teaching.
These researchers also found that most of the Kenyan educators understood that computers could
help their students learn more relevant information.
Lastly, calculators can be used to support students in learning mathematical concepts.
However, evidence shows that teachers and students encounter challenges when using these tools

63
in the classrooms. Ochanda and Indoshi (2011) aimed to establish teachers’ challenges and the
benefits that may result from the use of scientific calculators in the teaching and learning of
mathematics in the Emuhaya district in Kenya. The study used a descriptive survey design. The
participants were 44 mathematics teachers, two Quality Assurance and Standards Officers, 24
head teachers and 1,680 Form four students drawn from 24 secondary schools. The study found
that teachers reported that scientific calculators had great potential in developing students’
conceptual understanding of mathematics. Most of the students (67.14%) reported that they
lacked basic training on the basic skills of how to use a scientific calculator. The difficulties
students encountered by students were attributed to the teacher-centered way of teaching, and
teachers’ unpreparedness, which led to ineffective teaching and learning of mathematics. The
study recommended in-service training for teachers to help teachers reflect on their teaching and
acquire effective teaching skills, and that the Ministry of Education provides scientific
calculators to all learners.
The findings from the studies in this section revealed that (1) teachers’ and
administrators’ understood the benefits of using computers to support student learning, (2)
several constraints inhibited teachers from integrating technology in their classrooms, including
teachers who lacked the necessary technology integration training, lacked technology resources
and infrastructure, and lacked time, (3) social demographic features such gender, age,
experience, and education level were related to technology integration, (4) there is lack of
institutional support for teachers during technology adoption, and (5) school principals who
lacked technology skills to integrate technology in their school leadership responsibilities.
Suggestions to overcome these challenges included improved initial teacher training on
technology integration, continuous professional development, redesigning curricula goals, and

64
the funding of technology implementation. Most importantly there is evidence to suggest that
there is little research documented in Kenya on the factors related to technology adoption in
mathematics teaching.
Methodological Considerations from the Review of the Literature
This section gives a justification for using survey research design and qualitative case
studies for the current study. Methodologically, the quantitative research studies revealed that
most studies that investigated factors related to technology use followed a descriptive survey
research design, and findings were reported in terms of percentages and frequency of technology
use. However, studies on socio-demographic factors such as age, gender, teaching experience
that followed a survey research design, data analysis was conducted using either multiple
regression or analysis of variance. The findings on the socio-demographic factors were reported
based on statistical significance or non-significance of the multiple regression coefficients (β),
the correlation coefficient (r), or test of hypotheses. With regard to the studies that followed
qualitative research approaches factors related to technology were reported based on themes or
based on participants’ perceptions of how certain factors influenced their decisions to adopt or
not to adopt technology. With respect to mixed methods research, one study was reviewed and
the findings were reported based on descriptive statistics such mean and median, and correlation
coefficient (r). Clearly, there is little research in both developed and developing countries that
has investigated technology adoption in mathematics teaching using both quantitative and
qualitative research designs.
Rationale for Applying the Quantitative Research Approach
The review of the literature suggests that survey research design has dominated research
on the factors influencing teachers’ decisions to use or not to use technology in education. The

65
survey research has been extensively used by researchers in education because (1) large samples
can be studied and statistically significant variables can be used to generalize the findings to a
whole population; (2) the self-administered instruments are less costly to administer, particularly
when electronic mail is used to reach participants (Fowler, 2009); (3) Creswell (2008) pointed
that cross-sectional survey design has the advantage of measuring practices and provides
information within a short amount of time unlike a longitudinal survey design, which may take a
long time to complete; and he added that (4) participants can be asked extensive categories of
questions to better address an array of research foci. Most of the research studies in this literature
review that used survey design employed descriptive statistics such as the mean, standard
deviations, and percentages, which does not reveal the underlying relationship between variables.
Luckily, multiple regression analysis is a statistical procedure that not only explains
relationship between variables but can also predict future observations using significance tests
(Miles & Shevlin, 2001). Keith (2006) highlighted that multiple regression analysis has several
advantages over other statistical procedures because: (1) it uses both categorical and continuous
explanatory variables, (2) it can incorporate multiple explanatory variables, and (3) it is
appropriate both for experimental and non-experimental research. In fact, multiple regression
subsumes most of the quantitative methods taught in education (Henson, 2010) such as ANOVA.
There are few studies in the literature that employed multiple regression analysis such as
studies by Kumar, Rose, and D’Silva (2008) who used survey research design and multiple
regression analysis to examine the socio-demographic factors related to mathematics teachers’
usage of computers, and a study by Cassim and Obono (2011) that used the multiple regression
analysis procedures to examine the factors related to technology adoption in the teaching of word
problems. Nevertheless, researchers in these two studies failed to consider the interplay between

66
level of technology adoption and factors related to technology adoption such as school support,
in-service training, and knowledge of technology among others. Rather, they focused on socio-
demographic factors such as age, gender, teachers’ awareness, attitudes, and perceptions of
technology usefulness. This review of the literature did not come across a published study in
Kenya that examined the factors related to technology adoption in mathematics teaching using
survey research design and multiple regression analysis. Therefore this study used survey
research design to collect quantitative data and multiple regression analysis to analyze these data.
However, multiple regression analysis has strict conditions that must be met before the analysis
can be conducted (Keith, 2006). The current study has completely discussed these issues in
chapter three.
Rationale for Applying the Qualitative Research Approach
Evidence disclosed that there is limited research that has examined factors related to
technology adoption in mathematics teaching in developing countries. However, there is
evidence to suggest that qualitative techniques have been used to some extent by researchers to
examine the factors related to technology adoption in schools. Some of these studies include
those of Lim and Khine (2006), Makhanu (2010), Webuyele (2003), Demisraslan and Usluel
(2008) among others. These studies applied data collection techniques such as interviews and
classroom observations for individual participants or focus groups. These data sources were
converged in the analysis process to give a unique comparison of data that helped the researchers
to understand the whole phenomenon of technology use in schools. According to Baxter and
Jack (2004), this convergence adds strength to the findings as the various strands of data are
braided together to promote a greater understanding of the case and the rigor of collecting data
from numerous sources are quite attractive.

67
Thus the current study, applied semi-structured interviews and classroom observation
research techniques to collect data from mathematics teachers in several school contexts. The
rationale for applying these techniques was to ensure that I achieved a holistic understanding of
the factors related to technology adoption in mathematics teaching. According to Esterberg
(2002) an-depth understanding of the use of technology in mathematics teaching must involve
qualitative case study approaches that are based on understanding social processes in context,
while exploring the meanings of social events for those who are involved in them.
Qualitative case study is a research approach that facilitates exploration of a phenomenon
within its context using a variety of data sources (Baxter & Jack, 2008), which allows the issue
under investigation to be examined and understood, not through one lens, but through multiple
lenses. According to Yin (2003), case studies are used for explaining, describing or exploring
events or phenomenon in everyday contexts in which they occur. A case study is therefore a type
of ethnography involving an in-depth exploration or a bound system (Creswell, 2008) where a
researcher may focus on an activity, event, process, or individuals (Stake, 1995) to study an
issue. According to Yin (2003), a case design should be considered when the focus of the study
is to answer “how” and “why” questions, when you cannot manipulate the behaviors of those
involved in the study, and when one would like to understand the underlying contextual
conditions believed to be relevant to the study.
In this regard, studying the factors related to technology adoption in mathematics
teaching in schools using case study methods was appropriate because the case would not be
considered without the school setting, the mathematics content, the students, the school policy,
and the classroom settings. It is only within these settings that I was able to gain a
comprehensive understanding of the factors that influenced teachers’ decisions to adopt

68
technology or not to adopt. The quantitative phase yielded statistically significant variables,
which revealed how variables were related to technology adoption. Qualitative data gave the
meaning and insight as to how and why the variables were statistically significant or non-
significant.
However, according to Bogdan and Biklen (2007) case studies have faced criticism
because of a lack of generalizability and sampling issues. First, on the issue of generalizability
they argued that the dependence on small samples can make the findings impossible to
generalize. Generalizability requires larger samples sizes but the quantitative component of the
current study addressed this challenge by collecting a sample size of 135 teachers. Second, in
qualitative research it is costly and prohibitive and almost impossible to study all cases of the
phenomenon (Oppong, 2013). This challenge requires a researcher to select a small sample that
in the end may result to unbiased findings. In this regard, the current study applied maximal
sampling procedures to identify participants for the qualitative phase of the study (discussed
later). Additionally, the participants’ numerical scores from quantitative phase were considered,
along with whether the school had technology and related infrastructure, and whether the teacher
was willing to participate in the study. Other issues that I considered while selecting teachers
were gender, age, and school type. This ensured that a group of participants had minimal
partiality.
Rationale for Applying the Mixed Methods Research Approach
Evidence from the literature suggests that mixed method research design has not been
fully utilized to understand technology adoption in mathematics teaching. The literature revealed
that descriptive survey research design has dominated studies in this field with exception of a
few qualitative studies. According to Creswell (2008), a mixed methods study can be useful in

69
understanding a phenomenon in several ways. First, the results from quantitative data can be
generalized to a whole population, while qualitative data from interviews can offer actual words
people say that may be used to explain a complex situation. Second, qualitative data can be used
to develop a survey instrument or identify variables used in collecting quantitative data. Third, a
researcher may first collect quantitative data, followed by qualitative data. Of the mixed methods
studies reviewed, none found that used qualitative data to explain quantitative results in
understanding factors related to technology adoption in secondary mathematic teaching in
Kenya. Thus, I conducted this study using a mixed methods research design. I have provided a
detailed perspective of the mixed methods research in Chapter 3.
Summary
This chapter presented a review of the literature related to technology adoption in
mathematics teaching. I have summarized the main sections of the chapter providing some detail
about the important issues.
First, I discussed the literature on Technology Pedagogical Content Knowledge
(TPACK), activity theory, instrumental approach, Technology Acceptance Model TAM), and the
diffusion of innovations theory. Included in the discussion was a critic for each of these
theoretical perspectives.
Second, I presented the rationale for using diffusion of innovations in my study—how the
elements of diffusion (Innovation, communication channels, time, and social system) applied in
designing the study, collecting data, data analysis, and interpretations of the findings. I also
highlighted the disadvantages of the diffusion of innovation theory and explained how I
overcame each of the challenges.

70
Third, I discussed the debates surrounding the uses of technology in mathematics
education. The debates are generated by researchers and professional bodies; centered on the
arguments for or against the uses of technology for student learning in mathematics education. I
also highlighted the meaningful ways technology could be used to support students’ learning.
The literature indicated useful ways technology could support students’ learning of mathematics,
such as conjecturing, gathering data, exploration, and collaboration.
Fourth, there are many enabling and constraining factors related to mathematics teachers’
decisions to apply or not apply technology in the classroom practice. These factors are identified
as socio-demographics such as age and gender; teacher-related technology knowledge,
professional development, time; external such as school support, school curriculum, and society
and culture.
Fifth, I synthesized the literature on technology adoption in Kenyan schools. Evidence
indicated that there is little research in mathematics education related to technology adoption in
mathematics teaching. Other evidence showed limited technology training for teachers,
relationship of the socio-demographics on technology adoption, and a lack of technology
resources among others.
Lastly, I discussed the methodological considerations from the literature focusing on
quantitative, qualitative, and mixed methods research. The literature revealed that the survey
research design has dominated research on factors related to technology adoption. Data analysis
in some studies focused mainly on descriptive statistics and limited inferential data analysis
procedures. There was also evidence of a substantial number of qualitative studies and only a
few mixed methods studies on technology adoption in the area of mathematics teaching. This
evidence provided the rationale for applying mixed methods research and multiple regression
71
procedures in the current study. The next chapter discusses the research methodology for the
study.

72
Chapter 3: Research Methodology
The purpose for this study was to determine the factors related to technology adoption in
mathematics in Kenyan secondary schools. I collected primary data for the study using
quantitative research methods and I used qualitative data to gain insights into the statistical
results. According to Creswell and Plano Clark (2006), this type of study uses the explanatory
sequential mixed methods research design. Chapter 3 includes a description of the mixed
methods research design; restatement of the research questions; participants and sample
selection; data collection procedures; data analysis procedures; reliability, validity and credibility
issues; and field relations and ethical considerations.
Mixed Methods Research Design
This study employed a mixed methods research design that used a sequential explanatory
approach. The rationale for using a sequential explanatory approach was based on the
understanding that the quantitative data and their subsequent statistical analysis provide a general
understanding of the research problem (Creswell & Plano Clark, 2006). The qualitative data and
their analysis refine and explain the statistical results by exploring participants’ views in more in-
depth (Creswell, 2003).
Despite the flourishing of the mixed methods research since the 1970s and the 1980s, the
debate for or against combining qualitative and quantitative research methods in a single study
(Sale, Lohfeld & Brazil, 2002) has continued to elicit controversies among the proponents of the
quantitative and qualitative research paradigms (Johnson & Onwuegbuzie, 2004). According to
Creswell (2011), these controversies range from “defining and describing mixed methods, to
philosophical debates, and on into the procedures for conducting a study” (p. 269). As a
consequence, the following sections will highlight (1) the philosophical debates surrounding

73
quantitative, qualitative, and mixed methods research designs, and (2) the procedural issues
surrounding sequential explanatory mixed methods research design.
Philosophical Debates
With respect to philosophical debates, the post-positivism worldview is often associated
with quantitative research approaches; the constructivism worldview is associated with
qualitative research approaches; and pragmatic worldview is associated with mixed methods
research. On one hand, according to Creswell and Plano Clark (2006) post-positivism claims for
knowledge are based on cause-effect thinking, identifying variables to interrelate, observations
and measuring variables, and testing of theories. On the other hand, constructivism claims for
knowledge are based on participant views that are shaped by social interactions and participants’
own personal histories. According to Creswell and Plano Clark philosophically oriented writers
ask whether it is possible to mix post-positivist and constructivist worldviews where researchers
adhere to rigid paradigm boundaries.
Recent controversies involving mixing quantitative and qualitative research approaches
were highlighted by Howe (2004), who described the peripheral role played by qualitative
research in mixed methods research. According to Howe, mixed-method research favors
quantitative research by elevating quantitative-experimental research in the “methodological
hierarchy” (p. 53). Similar views were highlighted by Denzin and Lincoln (2005), who argued
that mixed-method research has taken qualitative research out its “natural home” (p. 9). They
argued that in the natural home, participants become active participants in qualitative research,
where their voices can be heard. However, according to Creswell and Plano Clark (2006), there
are many uses of qualitative data in mixed-method research, and there are no instances when
qualitative research has been undermined.

74
Thus, this study was based on the assumption that it is possible to mix qualitative and
quantitative research methods at the same time honor different paradigm perspectives. Creswell
(2003) asserted that the main reason for combining both quantitative and qualitative methods is
to provide a better understanding of a research problem. He argued that, “pragmatism opens the
door to multiple methods, different world views, and different assumptions as well as different
forms of data collection and analysis in the mixed methods study” (p. 12). Thus, I believed that
pragmatism was the best philosophical worldview suited for this study.
Understanding how quantitative and qualitative research methods work is important in
mixed methods research design. Researchers using the mixed-method research methodology
need to have an elaborate knowledge of the fundamental principle of mixed methods research
(Johnson & Turner, 2003). This principle acknowledges that all research methods are subject to
weaknesses and strengths. In this regard, Johnson and Turner argued that when this principle is
used in data collection, it means that, “data collection methods should be combined so that they
have different weaknesses and that the combination used by the researcher may provide
convergent and divergent evidence about the phenomenon being studied” (p. 299). Thus, the
eventual goal of the mixed methods research is to draw on the strengths while minimizing the
weaknesses of both the quantitative and qualitative research methods within a single study (John
& Onwuegbuzie, 2004). Despite this, mixed methods research comes with the challenges of
determining the procedures of the quantitative and qualitative data collection and analysis
(Ivankova, Creswell & Stick, 2006).
Procedural Issues in the Sequential Explanatory Design
A sequential explanatory mixed methods design fit well with the purpose of this study. A
sequential explanatory design two-phased mixed methods research strategy was used where

75
qualitative data helped to explain or build on quantitative results (Creswell, Plano Clark et al.,
2003). The sequential explanatory design was choosen based on the fact that the variables for the
study were largely well known in the literature and statistical techniques were needed to identify
these variables in the Kenyan context. Then the qualitative data were needed to give light on the
statistical results from the quantitative phase. However, I had to deal with the procedural issues
of priority, implementation, and integration of the quantitative and qualitative research
approaches (Ivankova, Creswell & Stick, 2006; Creswell, 2003).
Priority. Priority refers to the decision of giving more attention to either quantitative
data or qualitative data (or both) (Creswell, 2003). For instance, in the sequential explanatory
design, priority is given to the to the quantitative approach because quantitative data collection
comes first representing a major aspect of the study, while a smaller qualitative component
follows in the second phase of the study (Ivankova et al., 2006). However, priority of what phase
comes first might change either before data collection, during data collection, or during data
analysis depending on the goals of the study and the research questions to be addressed (Morgan,
2008). This implies that in a sequential explanatory design, the qualitative phase may turn out to
be the main component of the study, as opposed to the quantitative phase.
In the present study, I gave priority to the quantitative approach. The goal of the study
was to identify the variables related to technology adoption; those that best predicted and
explained mathematics teacher’s technology adoption score. Analysis of the survey instruments
revealed that the data were reliable and with few data problems such as missing values and
outliers and therefore data could safely be analyzed using multiple regression procedures to
answer the research questions. The qualitative phase of the study involved exploring and
explaining statistical results obtained from the multiple regression analysis. I conducted six cases

76
studies of mathematics teachers through interviews and classroom observations to enhance a
deeper understanding of each explanatory variable. I converted the semi-structured interviews
and classroom observation notes into to word documents to ease analysis. I then analyzed the
transcribed data using open coding procedures in order to identify themes and categories across
all the six cases that could give insight to the quantitative results.
Implementation. Implementation refers to whether the qualitative or quantitative data
comes first, second, or concurrently in the data collection (Creswell, 2003). In the sequential
explanatory design, a researcher first collects quantitative data, and the qualitative data is
collected in the second phase of the study with the intention of explaining the results from the
quantitative phase.
I collected the quantitative data using self-administered survey instruments. The goal was
to identify potential explanatory variables that could best predict and explain technology
adoption in mathematics teaching, develop research questions, to select participants, and to
develop an interview protocol for the qualitative phase. I then collected and analyzed qualitative
data to help explain why some explanatory variables were statistically significant or non-
significant or contradictory predictors of technology adoption in mathematics teaching.
Integration. Integration refers to when the data are linked – during the design phase of
the study, data collection, data analysis, or during interpretation of the findings (Tashakkori &
Teddlie, 1998). In the sequential explanatory design, a researcher connects the quantitative and
qualitative phases when designing research questions for the qualitative phase, while selecting
participants based on the statistical results, when developing interview protocols, and when
interpreting the findings (Creswell, 2003).

77
In the present study, I connected both the quantitative and qualitative phases at four
stages. The first connection occurred during the design phase of the study when creating research
questions for the qualitative phase based on the results of the quantitative phase. The second
connection occurred during data collection when I was selecting participants for the qualitative
phase from the ones who had completed the survey instrument based on their numerical scores.
The third connection was when developing an interview protocol for collecting qualitative data
based on the results of the multiple regression analysis. The fourth connection of data occurred
when I answered qualitative and mixed methods research questions for the study. While the
qualitative research question gave a comparative description for early and late adopters, the
mixed methods research question gave a careful interpretation of the findings to elaborate the
extent and the ways the results from the quantitative and qualitative phases related or
contradicted each other in understanding the research problem drawing from the literature and
Rogers’ theory.
Research Questions
Three types of research questions guided me in this examination: quantitative, qualitative,
and mixed methods research questions. I have listed the questions below by type.
The quantitative research questions are:
1. Which factors related to technology adoption:
a. best predict a mathematics teacher’s technology adoption score? How can the
quantitative relationship be explained?
b. makeup the combinations of variables that best explain a mathematics teacher’s
technology adoption score? How can the quantitative relationship be explained?
The qualitative research questions are:

78
2. How do the factors related to a mathematics teacher’s technology adoption score explain:
a. An early adopter’s decision to adopt or not to adopt technology?
b. A late adopter’s decision to adopt or not to adopt technology?
Mixed methods research question:
3. In what ways do the qualitative data contribute to a more comprehensive explanation of
the statistical results from the quantitative phase of the study?
Participants and Sample Selection
Sample Selection for the Quantitative Phase
The selection of the participants and the sample size for the study depended largely on
the goals of the study and the choice of the multiple regression analysis procedures. I used a
random sampling procedure (Babbie, 1990) to select teachers for this study from Nairobi and
Nyandarua Counties (see the Map of Kenya, Appendix E). I chose these two centers (one urban,
one rural) to reduce the cost of the study and increase efficiency in data collection.
The sample size for the quantitative phase needed to be addressed beforehand because
multiple regression analysis requires a large number of observations depending on the
explanatory variables in the study. Thus, to select a suitable sample size for the study, I
employed the following considerations: (1) a favorable sampling error, and (2) a statistical data
analysis technique. Fowler (2009) developed the criteria for choosing sampling errors and
confidence levels in survey research. Using these criteria, I chose a sampling error of 4% and a
confidence level of 95% for this study in order to yield a sample size of at least 100 participants.
However, multiple regression analysis requires that the number of participants meet a certain
threshold. In light of this, Green (1991) suggested a formula to select a suitable sample size
required for a multiple regression analysis: “n>104+m, regression where n is the sample size, and

79
m is the number of explanatory variables. One hundred thirty five mathematics teachers from 33
secondary schools in Nairobi County and six secondary schools in Nyandarua County were
presented with a 28-item survey questionnaire to complete. From a total of 135 questionnaires, I
discarded seven questionnaires because they had a large number of missing data or the
participants did not complete the survey questionnaire in accordance to the guidelines I had put
in place. The remaining 128 questionnaires were entered into the SPSS statistical program for
analysis. Thus, the data were dependable for multiple regression analysis procedures.
The statistical analysis revealed that mathematics teachers taught in national schools
(21.1%), county schools (45.3%), district schools (29.7%) and community schools (3.9%). In
addition, participants reported that their schools were located in rural (3.2%), suburban (26%),
and urban (56.7%) areas. Class sizes ranged from fewer than 25 students (0.8%), 26-40 students
(28.5%), and more than 40 students (68.3%). Teachers were employed by different bodies
ranging from Teachers’ Service Commission (TSC) (71.8%), local authority teacher (4.8%),
parents teachers’ association (PTA) and board of governors teacher (23.8%). About 61.7% of
these teachers were male and 38.3% were female. Teacher ages ranged between 20-30 years
(29.1%), 31-40 years (28.3%), 41-50 years (34.6%), and 51-60 years (7.9%). The education
levels for these teachers ranged from mathematics teachers with a college diploma (19.7%),
bachelor’s degree (63.8%), and graduate degree (14.2%). Teaching experience data for these
teachers indicated that most of teachers had 10 or fewer years in the classroom teaching (53.3%),
some had 11-20 years (29.1%), and the rest had above 20 years (17.5%). The time spent using
technology in hours per week outside the classroom varied from less than one hour (45.9%), 1-4
hours (32%), and more than 5 hours (22.2%). Regarding instructional style, these teachers

80
reported using teacher-directed instruction (15.8%), evenly-balanced between teacher-directed
and student-directed teaching styles (47.5%), and student-centered teaching style (36.6%).
Sample Selection for the Qualitative Phase
According to Rogers, the percentages of innovators, early adopters, early majority, late
majority, and laggards are 2.5%, 13.5%, 34%, 34%, and 16%, respectively. The participants in
my study classified themselves as: innovators (5.1%), early adopters (11.9%), early majority
(25.4%), late majority (4.2%), and laggards (53.4%). This indicated that the level of technology
adoption among the participants was very low. Accordingly, participants’ self-classification in
this study did not fit Rogers’ (2003) adopter categories. Similarly, the goodness-of-fit test of the
sample data did not fit Rogers’ categorization of participants. Therefore this self-classification of
participants could not be applied in this study.
However, Rogers had another way for the categorization of innovation adopters. He
categorized innovators, early adopters, and early majority as early adopters and late majority and
laggards as late adopters. According to him, it was more efficient to classify members of a
system on either being early or late adopters because each category consists of individuals with a
similar degree of innovativeness (Rogers, 2003). For instance, he noted that characteristics of
innovators and early adopters are similar to the characteristics of early knowers of technology in
terms of education and social economic status, personality, and communication behavior. The
following discussion highlights the (1) maximal variation sampling strategy for selecting early
and late adopters of technology and (2) characteristics of early and late adopters.
Maximal variation sampling strategy. According to Creswell (2008), the maximal
variation sampling strategy is a purposeful sampling procedure for selecting participants in
which “the researcher samples cases or individuals that differ on some characteristics or trait” (p.

81
214). Participants can differ in age, gender, education level, or location (e.g., rural or urban).
Then the researcher identifies the participants based on certain characteristics. In my study, I
used maximal variation sampling to select early and late adopters of technology based on these
criteria: (1) mathematics teacher’s technology adoption score, (2) willingness to participate in the
study, (3) school with technology resources and infrastructure, and (4) demographic
characteristics such as gender.
Mathematics teacher’s technology adoption score. A mathematics teacher’s technology
adoption score was the sum of question 1 (frequency of technology use) and question 6
(knowledge of technology) from the survey instrument. The scale had a total of 132 points,
which I converted to a percentage score. A high score ranged from 80-100%, a medium score
ranged from 60-79%, and a low score was below 60%. I categorized the high scorers are early
adopters and medium and low scorers as late adopters. Based on these criteria I recruited three
early adopters and four late adopters of technology.
Willingness to participate in the study. In compliance with the ethical considerations and
respect for participants I ensured that the participants consented to be interviewed. Therefore, the
participants who scored satisfactorily but did not wish to be interviewed were left out from the
study. When I contacted some teachers during the initial stages, some teachers were interested to
participate in the study. However, when I called them on their mobile phone some of them did
not answer my calls while others kept on promising that they would meet me for an interview but
they never did. Therefore, I gave up on such participants.
School had substantial technology resources. While some teachers might have scored
satisfactorily on a mathematics teacher’s technology adoption score and they were willing to
participate in the study, I ensured that the participants taught in schools that had technology

82
resources and infrastructure. That enabled me to know whether teachers had adopted technology
or not and the rationale behind their decisions. One late adopter from Nyandarua County was left
out from the study because the school did not have technology resources.
Demographic characteristics. To get multiple perspectives mathematics teachers about
technology adoption I needed to include different categories of teachers in the study based on
gender, age, and locality (rural or urban). In the initial stage of participant selection, I recruited
four male teachers from Nairobi County. However, to avoid researcher partiality, the maximal
variation sampling strategy was useful in selecting mathematics teachers based on gender and
location (rural, suburban, or urban).
Characteristics of early and late adopters. The early adopter category consisted of
three participants who had adopted technology in their teaching – Mr. Hamisi, Mr. Gatimu, and
Mr. Musyoka. I changed their real names to protect their identity. Hamisi and Gatimu used
technology when I observed them teaching mathematics. However, Musyoka, who was an “ICT
champion teacher”, did not use technology when I observed him teaching because the school
projector was broken. However, he told me he had adopted technology in his teaching. An ICT
champion teacher in Kenya is considered to have basic technology skills and is appointed by the
Ministry of Education to train other teachers about technology adoption in the classroom.
Musyoka had 11 years teaching experience, while Gatimu had 19 years and Hamisi 22 of
teaching experience. Gatimu taught in a national school, while both Hamisi and Musyoka taught
in county schools. In sum, (1) all three teachers had graduate degrees, (2) their teaching
experience averaged 18 years, (3) they were leaders at their schools either as head of
mathematics or examination department, and (4) their age averaged between 40 and 50 years, (4)
likely to male teachers.

83
The late adopter category consisted of four mathematics teachers who had not adopted
technology in their mathematics classroom practice – Ms. Shiro, Mr. Awiti, Ms. Amina, and Mr.
Annan. On one hand, Shiro, Awiti, and Annan had some basic knowledge of technology and had
also positive perceptions of technology towards students’ learning. I classified these three
teachers as “sluggish adopters”. Shiro taught mathematics in a national school, she had 20 years
teaching experience, and she had a graduate degree in statistics. Awiti was the least experienced
among the three teachers with five years of teaching experience. He taught mathematics and
geography in a national school, and had a bachelor’s degree. Mr. Annan had a bachelor’s degree,
11 years of teaching experience in mathematics and chemistry, taught in a district school, which
did not have technology resources, and he was an ICT champion teacher in Nyandarua County. I
subsequently, dropped him from the study. On the other hand, Amina had limited knowledge of
technology and revealed negative perceptions of technology on students’ learning. I grouped this
teacher in a category I called the “non-adopter”. Amina had a bachelor’s degree, taught
mathematics in a national school, and 14 years of teaching experience. In sum, (1) all teachers
except one had no graduate degrees, (2) their teaching experience averaged 13 years, (3) all
teachers except two had leadership roles at schools either as head of mathematics or examination
departments, (4) their average age was between 30-40 years, and (5) both genders.
Data Collection
This section describes quantitative and qualitative data collection procedures for the
study. I will describe these procedures in each phase.
Quantitative Phase
Research design. I employed a cross-sectional survey research design to collect
quantitative data. Data collection involved distributing: copies of the cover letter introducing the

84
study, the informed consent form, the research permit, and paper-based survey instruments to
mathematics teachers in secondary schools in Nairobi and Nyandarua Counties. To achieve a
response rate of 70% and above, a research assistant and I presented the survey instrument (see
Survey Instrument, Appendix B) to mathematics teachers in Nairobi County and Nyandarua
County, respectively. We collected the questionnaires from these schools in the two regions after
the teachers had completed.
Survey Questionnaire. I developed the survey questionnaire for the current study by
adapting previously developed instruments, including those of Litchy (2000), Sahin and
Thompson (2006), Senaidi, Lin, and Poirot (2009), and Srisurichan (2012). The survey
instrument for this study had three parts: Section A, B, and C (see Survey Instrument, Appendix
B).
Section A. Section A had two questions. Question 1 was a Likert-type scale that had 10
items and asked teachers how frequently they used technology in their classroom teaching
activities. Question 2 asked the teachers to identify their technology-based innovation decision
process.
Section B. Section B had 12 questions that addressed mostly the factors related to
technology adoption in the classroom activities and other information. Question 3 asked teachers
about in-service training they had received. Question 4 asked the teachers about how their school
had supported them to adopt technology in the classroom. Question 5 asked teachers about the
availability of certain technological resources, supports, and facilities. Question 6 asked the
teachers about their level of technological knowledge and awareness on certain educational
software. Question 7 asked the teachers if they agreed or disagreed about how certain barriers
limited them from adopting technology. Question 8 asked teachers their perceptions on the
85
characteristics of technology in educational settings. Question 9 asked the teachers to classify
themselves based on how they used technology for instructional purposes. Question 10 asked
teachers to identify the personal technologies they owned. Question 11 asked teachers the
number of hours they spent using technology. Question 12 asked teachers about their
instructional styles. Question 13 asked teachers about their collaborative efforts on technology
use. Question 14 asked teachers how they had acquired technology skills.
Section C. Questions 15 to 28 focused on teachers’ socio-demographic information such
as gender, school type, age, and teaching experience.
Concluding this section, it is important to note that Questions 1, 3, 4, 6, 7, 8, 13, and 14
were Likert-type scale questions (ordinal responses). For instance, for Question 4 I asked the
teachers to rate how strongly they agreed or disagreed about the school support. The items were
coded as “strongly disagree”=1, “moderately disagree”=2, “slightly disagree”=3, “slightly
agree”=4, “moderately agree”=5, and “strongly agree”=6. In addition, Questions 2, 5, 9, 10, 11,
12, and all socio-demographic questions were intended to collect nominal data (see Appendix B).
I conducted appropriate dummy coding procedures (Keith, 2006) (discussed later in this chapter)
for some of the variables in this study.
Qualitative Phase
Research design. I conducted qualitative case studies of six mathematics teachers to gain
a broader perspective of the statistical results from the quantitative phase. The qualitative data
collection techniques involved classroom observations and semi-structured interviews of
mathematics teachers at six secondary schools. In the following discussion, I present a brief
description of the (1) research sites, (2) classroom observations procedures, and (3) interview
procedures.

86
Research sites. The following discussion briefly describes the schools where I conducted
the classroom observations and the interviews. All the schools that I conducted the study are
publicly funded schools. These schools were as follows: Simba High School, Kifaru High
School, Chui High School, Mawingu High School, Twiga High School, and Satima High School.
Simba High School. Simba High School is a boarding national school located in Nairobi
County. This school admits the best students in the Kenya Certificate of Primary Examination
(KCPE) and it is considered one of the best schools in Kenya. The school has a history of
educating many prominent Kenyans who are experts across many fields. The school has
adequate technology resources facilities that include: a computer lab for the students, two smart
boards; one in the library and one to be used by teachers for instructional purposes. Mr. Gatimu
taught at this school and I observed him teach three lessons.
Kifaru High School. Kifaru High school is a day county school located in Nairobi
County. The school admits students of average ability. However, Kifaru High is located in a low-
economic status locality and therefore some students have discipline problems at the school. Mr.
Hamisi taught at this school and I observed Hamisi teach two lessons; one that he used
technology and another that he never used technology.
Chui High School. Chui High school is a day county school located in Nairobi County.
The school mostly educates students whose parents work for the government. The school was
built recently compared to Kifaru and Simba High Schools, which are much older. Class sizes
ranged from 40 to 50 students. The classrooms and school administration are housed under the
same building together with a computer lab for students with 20 computers. I observed Mr.
Musyoka teach two lessons. He never used technology in any one of them because the projector
was broken.

87
Mawingu High School. Mawingu is a boarding national school located in Nairobi
County. This school admits top KCPE students. The school is located in a serene part of the city.
The school has a stand-alone computer department that is well equipped with computers for
students’ learning and the department of mathematics has about 80-100 graphing calculators. I
observed Ms. Shiro and Ms. Amina each teach two classes that never used technology.
Twiga High School. Twiga High is a national boarding school. It is located in a serene
part of the Nairobi County. The school has elaborate new buildings and facilities. Twiga High
admits some of the top KCPE students. The school has a Kamau and a computer lab with over 60
computers. Teachers too have access to computers and the Internet in their offices. I observed
Mr. Awiti teach two classes that he never used technology.
Satima High School. Satima High School is boarding district school located in
Nyandarua County. The school had electricity but no technology resources. The class sizes
ranged from 35-60 students. I observed that most teachers had their own laptops for personal use.
Mr. Annan taught at this school since he began his teaching career. I interviewed him but I did
not observe him teach because the school lacked technology resources.
Classroom observation. I observed at least two lessons for each of the six participant
teachers. The purpose of the classroom observations sessions was to provide supplemental data
for the study, in addition to generating interview questions and probes. When possible, I
conducted brief pre-observation and post-observation conferences with the participants to
illuminate the teachers’ instructional strategies before, during, and after the lesson. The pre-
observation conference asked teachers about the goals for the lesson, the learning difficulties
they anticipated from students, how and why they planned to use or not use technology in
teaching, and how they assessed students’ understandings. The post-observation conference
88
asked teachers if they had achieved the goals of the lesson, the challenges, successes and failures,
and things that they would change in the future. I planned to use a classroom observation
protocol guide for the classroom observations; however, I did not find it useful for this study and
therefore I ended up not using it. During the observations, I wrote field notes about the lesson
launch, the teacher, the students, technology tools (if there were any that were used), the tasks,
the challenges students were facing, the questions asked in class by the teacher and the students,
and the social dynamics that occurred in the classroom. I used these data to reconstruct
classroom dynamics during data analysis. Spradley (1980) noted that the process of observation
is funnel shaped in that the initial observations start with broad questions, familiarizing with their
settings and participants, directing attentions to the people, behaviors and feelings, generating
research questions, and then focusing on certain elements for theory building. (Classroom
observation data is reported in chapter 4).
Semi-structured interviews. Following the classroom observations, I conducted semi-
structured interviews “probing areas that were too sensitive to explore in the early research”
(Taylor & Bogdan, 1998, p. 81). Some questions touching on the school or the government
officials required confidentiality to protect the teacher. Such information required that I I had to
interview the teacher rather than ask the teacher to reveal such information on the survey
questionnaire. Thus, I audiotaped each participant for a period not exceeding 60 minutes using an
interview protocol framed on the quantitative results, gathering data about participants’
experiences and perceptions regarding students’ learning, technology tools and other learning
artifacts, and the factors that influenced them to use or not to use technology in mathematics
teaching. In addition, I probed the participants on how they answered particular items on the

89
survey questionnaire and the statistically significant variables from the data analysis (see Semi-
structured Interview Protocol, Appendix C).
Data Analysis
This section reports the data analysis procedures for the quantitative and qualitative
phases. First, I will discuss the quantitative data analysis, followed by a discussion on the
qualitative data analysis.
Quantitative Data
Data examination. In order to eliminate any conceivable errors in the data set, I
conducted data cleaning procedures for the data in three steps. The first step involved ensuring
that all the survey questionnaires were entered into the SPSS correctly by visual examination of
the data set.
Secondly, I checked all the data using bar graph exploration and I replaced all the data
that had incorrect values and extreme values. For instance, if a case had been coded as a “4” in
the column assigned for gender, I deleted that value and entered the correct value a “1” or a “2”.
Lastly, I discarded seven questionnaires that had a large amount of missing data or the
participant did not follow the required guidelines to complete the questionnaire.
The problem of missing values in a data set may have serious implications for statistical
analysis. Figure 3.1 revealed that 25 participants (19.53%) out of the 128 participants had fully
completed the questionnaire. Twenty-six variables (18%) of 150 variables were fully completed,
and 5.22% of all of the values in the data set were missing.
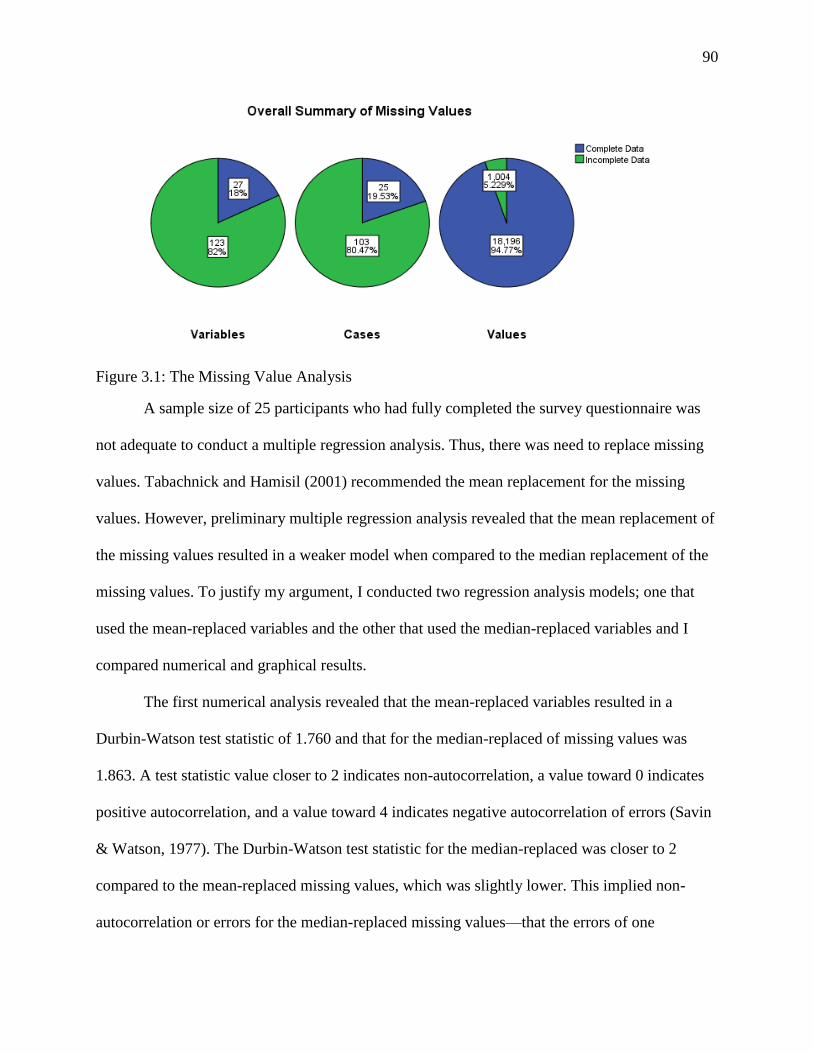
90
Figure 3.1: The Missing Value Analysis
A sample size of 25 participants who had fully completed the survey questionnaire was
not adequate to conduct a multiple regression analysis. Thus, there was need to replace missing
values. Tabachnick and Hamisil (2001) recommended the mean replacement for the missing
values. However, preliminary multiple regression analysis revealed that the mean replacement of
the missing values resulted in a weaker model when compared to the median replacement of the
missing values. To justify my argument, I conducted two regression analysis models; one that
used the mean-replaced variables and the other that used the median-replaced variables and I
compared numerical and graphical results.
The first numerical analysis revealed that the mean-replaced variables resulted in a
Durbin-Watson test statistic of 1.760 and that for the median-replaced of missing values was
1.863. A test statistic value closer to 2 indicates non-autocorrelation, a value toward 0 indicates
positive autocorrelation, and a value toward 4 indicates negative autocorrelation of errors (Savin
& Watson, 1977). The Durbin-Watson test statistic for the median-replaced was closer to 2
compared to the mean-replaced missing values, which was slightly lower. This implied non-
autocorrelation or errors for the median-replaced missing values—that the errors of one

91
participant were different from the errors of the other participants indicating the observations
were independently selected (Miles & Shelvin, 2001).
The second numerical analysis involved a test for normality of residuals of the mean-
replaced and median-replaced variables. The Shapiro-Wilk test for normality indicated that the
mean-replaced had p-value=.370 > 0.05 while that of median-replaced values p-
value=0.956>0.05. These p-values indicate that the mean-replaced missing values slightly
differed from normality when compared to the median-replaced missing values.
Graphically, Figure 3.2 shows a Q-Q plot of residuals of the multiple regression analysis
of the mean-replaced variables, which is not perfectly normally distributed. Normally distributed
residuals should lie on the diagonal line.
Figure 3.2: The Q-Q Residual Plot for the Mean-replaced Variables
However, Figure 3.3 shows that the Q-Q plot of residuals for the median-replaced
missing values has a near perfect normality, except for two outliers that do not seem to influence
the data. Thus, there is evidence to suggest that the median-replaced missing values was a better
regression model compared to the mean-replaced missing variables. Therefore, I chose to use the
data set with the median-replaced missing values for this dissertation.
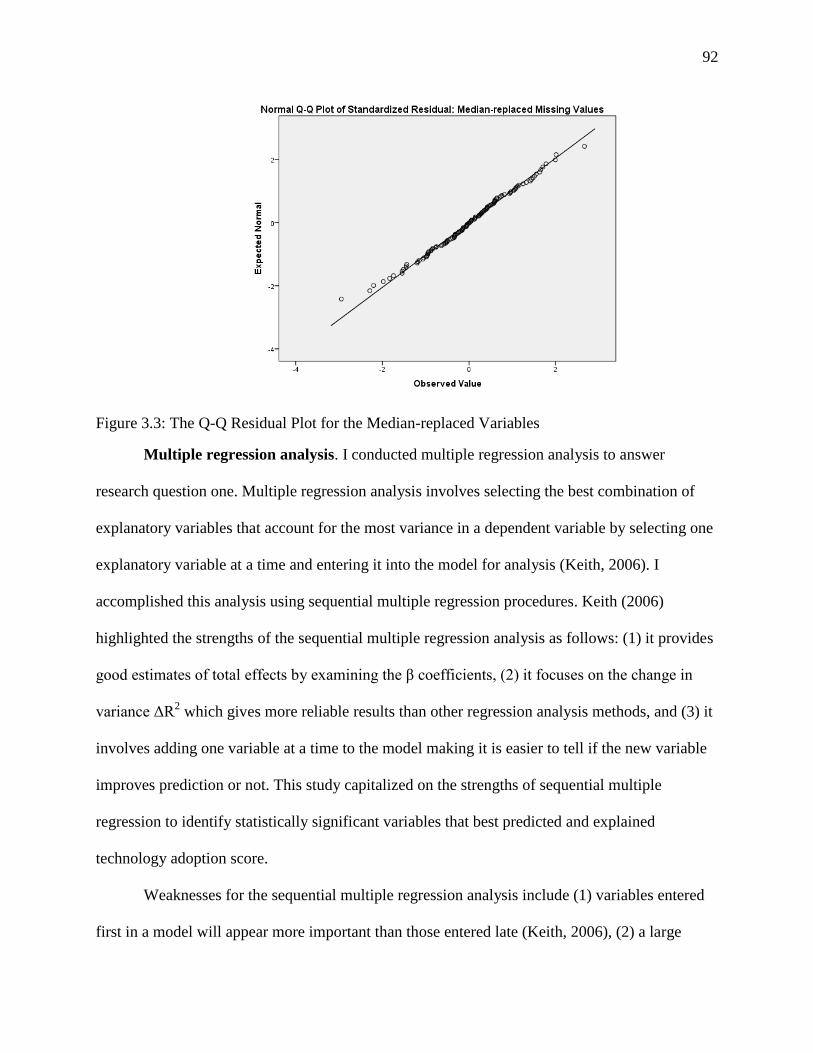
92
Figure 3.3: The Q-Q Residual Plot for the Median-replaced Variables
Multiple regression analysis. I conducted multiple regression analysis to answer
research question one. Multiple regression analysis involves selecting the best combination of
explanatory variables that account for the most variance in a dependent variable by selecting one
explanatory variable at a time and entering it into the model for analysis (Keith, 2006). I
accomplished this analysis using sequential multiple regression procedures. Keith (2006)
highlighted the strengths of the sequential multiple regression analysis as follows: (1) it provides
good estimates of total effects by examining the β coefficients, (2) it focuses on the change in
variance ΔR2 which gives more reliable results than other regression analysis methods, and (3) it
involves adding one variable at a time to the model making it is easier to tell if the new variable
improves prediction or not. This study capitalized on the strengths of sequential multiple
regression to identify statistically significant variables that best predicted and explained
technology adoption score.
Weaknesses for the sequential multiple regression analysis include (1) variables entered
first in a model will appear more important than those entered late (Keith, 2006), (2) a large

93
number of observations are required to obtain stable results (e.g., some researchers have
recommended the number of observations be 50 plus the number of explanatory variables), and
(3) failure to address the problem of multicollinearity (discussed in the following section) may
significantly affect the interpretation of the results. This study overcame the challenges of
sequential multiple regression analysis by using the demographic variables as control variables
(discussed later in this section), an adequate sample size comprising of 128 participants, and
ensuring limited multicollinearity issues for the variables in the study, respectively.
Diagnosing data problems. Before the analysis of the data, I conducted regression
diagnostics to spot any problems with the data (Keith, 2005) such as multicollinearity and
outliers. The following discussion highlights these two issues.
Multicollinearity. Multicollinearity occurs when several explanatory variables become
highly correlated or when one explanatory variable is a linear combination of the other
explanatory variables causing problems estimating multiple regression coefficients and other
parameters. I used a tolerance test to measure the degree at which each explanatory variable was
independent of the other explanatory variables. Tolerance measures range from zero (no
independence from other variables) to one (complete independence) (Keith, 2005). The results of
my tolerance test showed that all of the explanatory variables had tolerance values closer to one
indicating that the variables were independent of each other. Table 3.1 below shows a summary
of the multicollinearity diagnostic of the variables in the study.

94
Table 3.1
Summary of Multicollinearity Diagnostics of the Explanatory Variables
Variable Label Tolerance
Age of a teacher (Q16) .949
School type (Q18) .915
Internet at home and school (Q26b) .929
Educational technology in general (Q5h) .910
In-service training (Q3) .807
Discussions about technology (Q2i) .893
Other data screening procedures. Identification of the outliers and influential
observations is not easily accomplished when there is more than one explanatory variable (Ryan,
1997). In fact, according to Cousineau and Chartier (2010), the issue of outliers in a data set is so
complex that up to now there is no single solution to the problem of outlier detection has been
identified. They suggested deleting extreme cases, but again, they argued that doing so may end
up removing too many observations from the data set to the point where statistical analysis may
no longer be possible. They pointed that outliers should be encountered with respect to the
dependent variable or the explanatory variables and that not all outliers influence the regression
line. With this in mind, I used box plots to detect outliers and replaced them with the mean
(Tabachnick & Hamisil, 2001) for mathematics teacher’s technology adoption score.
Additionally, I omitted explanatory variables that had high p-values ( ), failed to
meet the multiple regression assumptions and other requirements such as low tolerance values,
and small change in R-squared. Lastly, I excluded the explanatory variables that had statistically
non-significant correlation coefficients with the dependent variable from the regression analysis.
Variables. The multiple regression procedure determined the types of variables I selected
for this study (see Table 3.2). I selected one dependent (mathematics teacher’s technology

95
adoption score), and six explanatory variables that included two control variables. The following
discussion highlights how I selected the dependent variable and the explanatory variables.
Table 3.2.
Summary of the Variables in the Study
Variable Name Code Variable Label
Technology_adoption_score_(Q1&6) Square root (Sum of
Q1and 6 (132 points))
A mathematics
teacher’s
technology
adoption score
Age_of_a_teacher_(Q16) “Above 40 years”=0,
“40 years and
below”=1
Age of a teacher
School_type_(Q18) “National/county
school”=1,
“District/community
school”=0
School type
Internet_ at_home_and_school_(Q26b) 0=”elsewhere”,
1=”Both school and
home”
Internet at home
and school
Educational_technology_in_general_(Q5h) “yes”=1, “No/not
sure”=0
Educational
technology in
general
In-service_training_(Q3) Sum of Likert-type
scale (50 pts.)
In-service training
Discussion_about_technology (Q2i) “does not apply”=0,
“applies”=1
Discussions about
technology
Dependent variable. The dependent variable was a sum of two Likert-type scale
questions: Question 1 (Frequency of technology use) that asked participants how frequently they
used technology software related to mathematics teaching, and Question 6 (Knowledge of
technology) that asked the participants about their awareness and familiarity with certain
mathematical technologies. I selected these two scales based on Rogers’ (2003) innovation-
decision process knowledge stage (question 6) and implementation stage (Question 1).

96
However, I failed to include the decision and confirmation stages in the current study
because it was not possible to capture participants’ exact moment of decision and confirmation to
adopt technology. Additionally, I omitted the persuasion stage (Question 8 in the questionnaire)
because the explanatory variable failed to give a satisfactorily multiple regression model when
analyzed together with knowledge and implementation stages. Therefore, I conducted this study
using the knowledge and the implementation stages. According to Rogers (2003), the knowledge
stage involves (1) information on the existence of an innovation, (2) information how to use an
innovation properly, and (3) the principles underlying how an innovation works. The
implementation stage is slow and a time consuming process that may see the adopter apply the
innovation on a daily basis or once in a while (Rogers, 2003). Thus, the knowledge and
implementation stages were consistent with knowledge of the teacher and frequency of use in the
survey instrument, respectively. In that sense, these questions asked participants to give a
response about their knowledge and frequency of use of the following educational technologies:
Microsoft Office, graphing calculators, dynamic statistical software, dynamic geometry software,
computer algebra systems, the Internet, interactive whiteboards, and educational technologies in
general.
Before analyzing data for the study, I checked for reliability of the Likert-type scales for
Questions 1 and 6. According to Cronbach (1951), a coefficient alpha score equal to or
exceeding 0.70 indicates a strong reliability statistic on a scale of 0 to 1. Table 3.3 shows that all
Likert-type questions had Cronbach Alpha greater than 0.70.
Following this, I scored frequency of technology use (10 items) based on how the
participants responded to the question. The items scores ranged from “never”=1 (implying that a
participant did not use technology) to “daily”=6 (implying a participant used technology on daily

97
basis). The total possible number of points was 60 points on this question. Similarly, the
knowledge scale had 12 items that I rated as “unfamiliar”=1 to “expert”=6. I summed the scores
from this question so that the total possible score was 72 points.
Table 3.3.
Cronbach’s Alpha Score for the Likert-type Scale Survey Questions
Question Alpha Score
1 .870
3 .839
5 .816
6 .945
7 .859
8 .910
13 .877
14 .747
I summed Question 1 and 6 so that participants could score 132 points and I named the
new variable the Mathematics teacher’s technology adoption score. This variable was slightly
skewed from the right and therefore it did not meet the normality test. I transformed the variable
using the square root property to ensure the variable was less skewed. Normality of a
mathematics teacher’s technology adoption score ensured the variable met the underlying
assumption for the multiple regression analysis in addition to improving the overall statistical
model. In addition, Table 3.4 shows the Kolmogorove-Smirnov p=.176>.05 and the Shapiro-
Wilk p=.449>.05 tests of normality for a mathematics teacher’s technology adoption score after
transformation, which implies that the dependent variable passed the normality test.

98
Table 3.4.
Kolmogorove-Smirnov and Shapiro-Wilk Test for Normality of a mathematics teacher’s
technology adoption score
Kolmogorov-Smirnov Shapiro-Wilk
Statistic Df Sig. Statistic df Sig.
0.072 128 .176 .990 128 .449
Explanatory variables. Explanatory variables in this study were derived from the
literature. Demographic variables had been studied by Cassim and Obono (2011), Teczi (2011),
Makhanu (2010), and Ocak (2005); technology resources had been studied by Demiraslan and
Usluel (2008), Tezci (2010), and Lime and Khine (2006); technology training were reported by
Momanyi, Norby and Strand (2006), Gülbahar (2007), Archmbault and Barnett (2010), and
Wanjala, Khaemba and Mukwa (2011).
Before running statistical procedures to find the most appropriate explanatory variables
for the study, I conducted a reverse-coding of the items on Questions 8q and 8r that were
negatively worded to ensure the items did not have more scores than positively worded items.
Secondly, the results of the reliability test for all Likert-type scale items indicated a Cronbach
alpha score well above 0.70. The higher the alpha score is, the more reliable the test is. Usually
0.70 and above is acceptable (Nunnally, 1978) and therefore the scales were appropriate for use
in the statistical analysis. Following this, I summed the Likert-type scale Questions 3, 4, 7, 8, 13,
and 14 to create six new continuous explanatory variables.
Further, I conducted the dummy coding procedures for the categorical variables to create
dichotomous variables. Dummy coding of categorical variables is a procedure that enables
comparison of a reference variable with other variables in a multiple regression analysis (Keith,
2006). If a categorical variable is entered as an explanatory variable in the regression model, the

99
analysis would treat the variable as a continuous variable and the result would be wrong (Miles
& Shevlin, 2001).
In a multiple regression analysis, β is the slope of line that reflects on the amount of
change of the dependent variable for every one-unit change in the explanatory variable.
However, for this to be true, the explanatory variable must be a continuous variable. When the
explanatory variable is categorical, it is important to manipulate the variable in order to have
interpretable β coefficients. This could be done through dummy coding (Keith, 2006). For
example, in this survey, I asked the participants to select their age category from the list: “20-30
years”=1, “30-40 years”=2, “40-50 years”=3, “50-60 years”=4, and “None”=5. If a participant
chose a “1” and another participant chose a “4”, regressing these two data with a mathematics
teacher’s technology adoption score could have resulted in an ambiguous interpretation of β with
“4” appearing to have more weight than “1”.
Dummy coding helped me to overcome this challenge. In this example, I had five
treatment levels and therefore I needed five dummy variables to define each level. If a participant
chose the 30-40 years category, their age would recoded as “1” and “0” for all other levels the
participant did not choose. If a person, choose “5”, their age was recoded as “1” and “0” for all
dummy variables and so on.
In short, I recoded all the categorical variables as “membership”=1 (reference group) and
“non-membership”=0 before including them in the multiple regression model. Following this, I
identified 27 explanatory variables but I carefully eliminated variables that had high p-values and
those that contributed insignificant change in R-square to the multiple regression model. Further,
I removed the variables that had multicollinearity issues, in particular those that had low
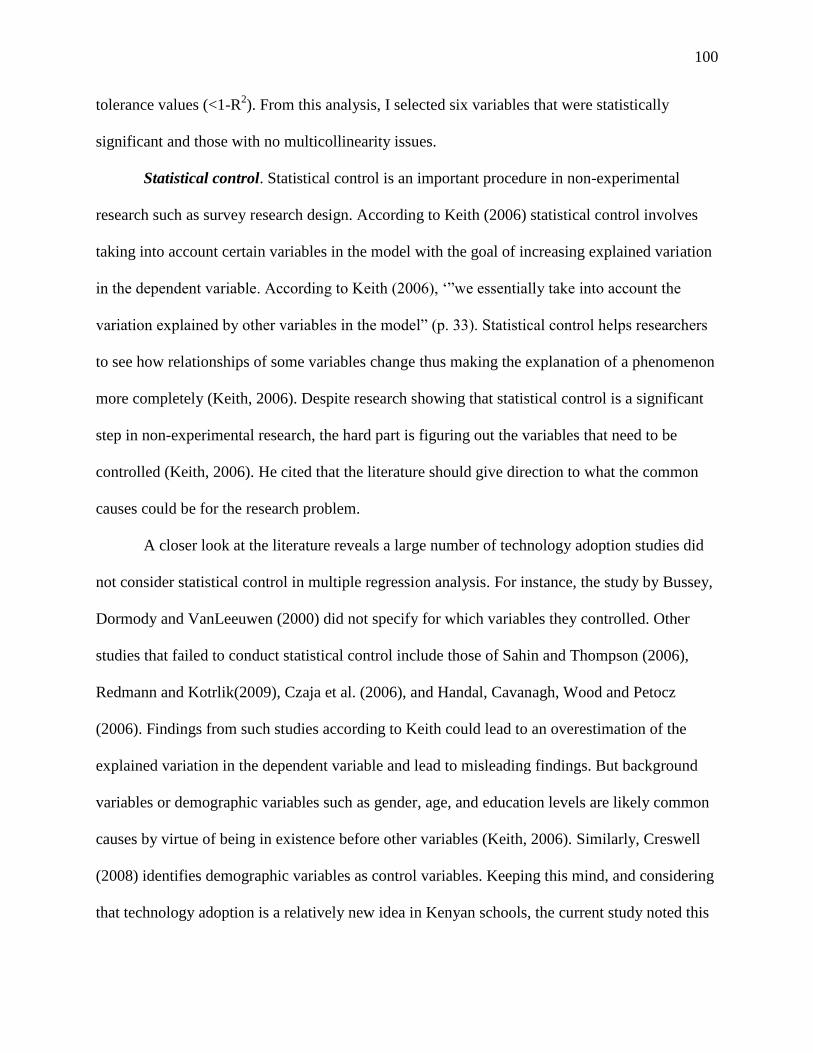
100
tolerance values (<1-R2). From this analysis, I selected six variables that were statistically
significant and those with no multicollinearity issues.
Statistical control. Statistical control is an important procedure in non-experimental
research such as survey research design. According to Keith (2006) statistical control involves
taking into account certain variables in the model with the goal of increasing explained variation
in the dependent variable. According to Keith (2006), ‘”we essentially take into account the
variation explained by other variables in the model” (p. 33). Statistical control helps researchers
to see how relationships of some variables change thus making the explanation of a phenomenon
more completely (Keith, 2006). Despite research showing that statistical control is a significant
step in non-experimental research, the hard part is figuring out the variables that need to be
controlled (Keith, 2006). He cited that the literature should give direction to what the common
causes could be for the research problem.
A closer look at the literature reveals a large number of technology adoption studies did
not consider statistical control in multiple regression analysis. For instance, the study by Bussey,
Dormody and VanLeeuwen (2000) did not specify for which variables they controlled. Other
studies that failed to conduct statistical control include those of Sahin and Thompson (2006),
Redmann and Kotrlik(2009), Czaja et al. (2006), and Handal, Cavanagh, Wood and Petocz
(2006). Findings from such studies according to Keith could lead to an overestimation of the
explained variation in the dependent variable and lead to misleading findings. But background
variables or demographic variables such as gender, age, and education levels are likely common
causes by virtue of being in existence before other variables (Keith, 2006). Similarly, Creswell
(2008) identifies demographic variables as control variables. Keeping this mind, and considering
that technology adoption is a relatively new idea in Kenyan schools, the current study noted this

101
shortcoming in the literature and considered demographic variables for statistical control. Table
3.5 shows the operationalization of the variables in the study based on Rogers (2003) diffusion of
innovations theory.
Table 3.5
Operationalization of the Variables Based on the Elements of the Diffusion of Innovations theory
Rogers’ (2003)
Element of
Diffusion
Variable Description
Time Mathematics Teacher’s
Technology adoption
score
Age of a teacher
Knowledge and implementation
stages of the innovation-decision
process
Early and later adopters
Social system School type Organization unit
Communication In-service training The internet
Roles of the change agent and
clients
Homophily and heterophily
Centralized and decentralized
system
Discussions about
technology
Homophily and heterophily
Innovation Educational technology
in general
Internet at home and
school
Attributes of innovation (relative
advantage, compatibility,
complexity, trialibility,
observability)
Diagnosing violations of the assumptions. Most statistical tests require that certain
assumptions to be satisfied before a statistical procedure can be conducted. Multiple regression is
one such statistical procedure that requires four assumptions to be met. These assumptions are:
(1) linearity—the relationship between the explanatory variables and the dependent variable
should be linear; (2) normality—errors are normally distributed; (3) homoscedasticity—variance
of errors around the regression line will be consistent across the independent variable; and (4)
independence of errors—errors of one participant should be different from those of the other

102
participant (Keith, 2005). When these assumptions are violated the results might not be
trustworthy (Tabachnick & Hamisil, 2001).
Linearity. When the assumption of linearity in regression analysis is violated, then all the
estimates from the multiple regression analysis including change in R-square, the regression
coefficients, standard errors, tests of significance could be biased and may not give the true
values of the population (Keith, 2005). To check for the assumption of linearity between the
dependent variable and the explanatory variables a plot of predicted residuals as a function of
standardized residuals revealed a linear relationship between the variables. Figure 3.4 shows a
scatter plot of residuals of no pattern, which indicates a linear relationship between the
dependent variable and the explanatory variables.
Figure 3.4: A Scatter Plot of the Residuals versus the Predicted Mathematics Teacher’s
Technology Adoption Scores

103
Normality of errors. Non-normality of errors can compromise estimation of the
coefficients and also result in too wide or too narrow confidence intervals, which may be caused
by the presence of outliers (Miles & Shevlin, 2001). Additionally, the p-values for the
Kolmogorove-Smirnov and Shapiro-Wilk test for normality were p=.200 and p>.729
respectively, which implies that the residuals are normally distributed. Figure 3.5 reveals a
histogram with a bell-shaped curve of residuals indicating that errors follow a normal
distribution reasonably well.
Figure 3.5: A Histogram of Bell-shaped Curve of Residuals

104
Homoscedasticity. Homoscedasticity means that the variance of the errors around the
regression line is fairly consistent across levels of the dependent variable (Keith, 2005). When
this assumption is violated heteroscedasticity is indicated, and a plot of the standardized errors
against the predicted variable are not uniformly distributed along a horizontal line (i.e., creating a
funnel shape or bow-tie pattern). Figure 3.6 showed a scatter plot from my data where the
variance of errors around the regression line was consistent across the independent variables
because the residuals were randomly scattered along the horizontal line, indicating an even
distribution of errors around the mean.
Figure 3.6: A Scatter Plot of the Standardized Residuals
Independence of errors. Violation of the assumption of independence of errors affects the
standard of errors, which may report underestimated standard of errors and thus label variables
as statistically significant when they are not (Keith, 2005). The Durbin-Watson test statistic

105
(1.863) (discussed earlier) indicated that the errors were not correlated. Thus, there was evidence
to suggest that the errors of one participant were different from the errors of the other
participants (Miles & Shelvin, 2001).
In sum, diagnosis of the assumptions of the multiple regression analysis showed that
there were not violations of linearity, normality of errors, independence of errors, and
homoscedasticity. Therefore, it was safe to carry out the multiple regression analysis for this
study.
Qualitative Data
I converted the field notes generated through classroom observations and audio
interviews into Word documents for qualitative data analysis using open coding (Glaser &
Strauss, 1967). By qualitative data analysis, I mean a process of systematically searching and
arranging the interview transcripts, field notes, and other materials to come up with findings
(Bogdan & Biklen, 2007). Taylor and Bogdan (1998) asserted that data analysis is an ongoing
process that involves coding the data, developing descriptions and themes from the data,
connecting the related themes, understanding the data in-context, and reporting the findings. I
coded the text data to identify themes using the Creswell (2008) criteria of coding data, which
involved identifying code words from the text data, then grouping similar codes, and looking for
redundant codes with the intention of reducing the codes to a smaller, more manageable number.
Using this refined list, I went back to the data to find if there were any emerging codes, and then
reduced the codes to common themes supported by evidence. I identified the following themes
from the data analysis: technology training, availability of educational technology and
infrastructure, time, perceived benefits, teacher characteristics, the Internet, and collaboration.

106
Lastly, I build a portrait of each individual teacher based on these themes and described
his or her classroom experiences with or without technology in detail, guided by the interview
questions, and observation data. At this stage, I also embarked on reading and understanding the
literature and the diffusion innovations theory to help me to understand teachers’ perspectives
(Taylor & Bogdan, 1998).
Reliability and Validity, and Credibility Issues
Reliability and Validity
The analysis of the survey questionnaire revealed that the instrument was stable. The
Cronbach’s (1951) Alpha scores for the Likert-type scale questions were all greater than 0.70,
which indicated the instrument was reliable. This implied that the results of this study could be
replicated in a similar setting using equivalent research methodology.
I established validity in three ways: the content, the criterion-related, and the construct
validity. Content validity showed the extent of representation of all the possible instrument items
relating to technology adoption by evaluating the objective of the instruments, the wording, and
the level of difficulty of the items. To ensure that content validity was up to standard, I
conducted a pilot study of the survey instrument at Syracuse University among Kenyan graduate
students. These students had teaching experiences in Kenyan secondary schools and they
understood the context of the study. The students suggested rewording of some of the items and
some additional information to the survey questionnaire.
The criterion-related validity determined whether the scores from the instrument
indicated effective explanation of the actual survey results. I established the criterion-related
validity by comparing the questionnaire’s consistency results to existing instruments that
measured factors influencing effective technology adoption in schools. One such instrument was

107
used by Srisurichan (2012) in a study that found that availability of technology and in-service
training were related to computer usage. Srisurichan also found that class size, school support,
and instructional style were not related to teachers’ computer usage. My findings were consistent
with the findings of her study. Clearly, there is evidence to suggest that the findings in the
current study may be truthful and accurate. I then determined whether the construct validity was
legitimate; whether the scores were significant, meaningful, useful, and had purpose (Creswell,
2008). For example, considering the construct validity, a teacher who was greatly limited by a
certain factor was likely not to use technology in teaching. I discarded completed survey
questionnaires that revealed such inconsistencies.
Credibility Issues
To report credible and dependable findings, I utilized Guba and Lincoln’s (1989)
framework for trustworthiness. Using this framework, first, I used semi-structured interview data
to confirm or to reject evidence provided in the survey questionnaire. During the interviews I
asked mathematics teachers why they had filled some responses in certain ways. Second, I also
used the field notes, transcripts, and memos to cross-check and confirm correct data
interpretation. In addition, I used triangulation of data, member checking, and external audit
(Creswell, 2008) to ensure the findings were accurate and up to date. In the case of triangulation
of data, data from multiple sources (survey data, classroom observation data, and interview data).
This data provided information and evidence to support each theme. Member checking involved
sending transcripts to some participants in the study to check for accuracy of the information.
External auditors involved the dissertation advisor and the dissertation committee who read the
final document to check on research methodology, credibility, themes, interpretations, and bias
issues (Creswell, 2008).

108
Field Relations and Ethical Considerations
Data collection involved studying individual human beings and therefore the Institutional
Review Board (IRB) of a Syracuse University based in the United States evaluated my study, as
well as the Ministry of Education in Kenya. The research assistant who worked with me was also
approved by the IRB to conduct this study. Bogdan and Biklen (2007) highlighted that it is the
participants’ rights to: (1) know about the research interests; (2) give the researcher permission to
proceed with the study; (3) get a written consent; and (4) not to be lied to or recorded without
their knowledge and consent. As such, all the participants were provided with the necessary
information about the study.
Data collection through the survey questionnaire and semi-structured interviews were
susceptible to breaking the promise of confidentiality. I reminded the participants they were free
to give me only the information that they felt was not sensitive about themselves, the school, or
the government. However, to reduce the risk of confidentiality, I delinked the identity of the
teacher from the completed survey questionnaires using a participant’s mobile phone number and
a numeral as opposed to a participant’s name or school. In addition, I used pseudonyms to
identify the participants and the schools in the second phase of the study (See Table 3.6). Lastly,
I ensured safekeeping of all files in this study.
Table 3.6
Details of the Participants’ in the Qualitative Phase
Name of Teacher** Name of High School** Years of Teaching Experience
Gatimu Simba High School 19
Hamisi Kifaru High School 22
Musyoka Chui High School 11
Shiro Mawingu High School 20
Awiti Twiga High School 5
Amina Mawingu High School 14
Annan* Satima High School 11

109
*Annan was not included in the current study because the school lacked technology
resources and infrastructure
**All names of the teachers and the schools are pseudonyms to protect the participants
To extend my gratitude to the participants I compensated the seven teachers who
participated in the qualitative phase of the study with a monetary remuneration of $15 dollars per
teacher for the time spent during the semi-structured interviews. In Kenya the minimum wage is
approximately $3 dollars in a day. Therefore, compensating a teacher for $15 dollars for one
hour may be considered as generous. Lastly, I am in compliance with the American
Psychological Association’s (APA) recommendations that asks researchers to destroy data within
five years after data analysis and report writing are completed; in addition to reporting honest
and accurate findings in a simple language that does not falsifying research findings.
Summary
This chapter discussed the research methods used to accomplish the objectives of the
study. The chapter included the discussion about: (1) the mixed methods research, (2)
participants and sample selection, (3) data collection procedures, (4) data analysis, (5) reliability,
validity and credibility issues, and (6) field relations and ethical considerations.
First, I represented the philosophical debates surrounding the mixed methods research.
These debates are centered on the protagonists of quantitative and qualitative research on either
side. However, there are louder voices from qualitative researchers who argue that mixed
methods research undermines the qualitative paradigm and elevates the quantitative research
methods. I also presented the procedural issues in the sequential mixed methods research with a
discussion on priority, implementation, and integration issues. On priority, my study gave the
quantitative data more priority compared to qualitative data. On implementation, quantitative
data collection came first and I used qualitative data to explain quantitative results. Lastly, I
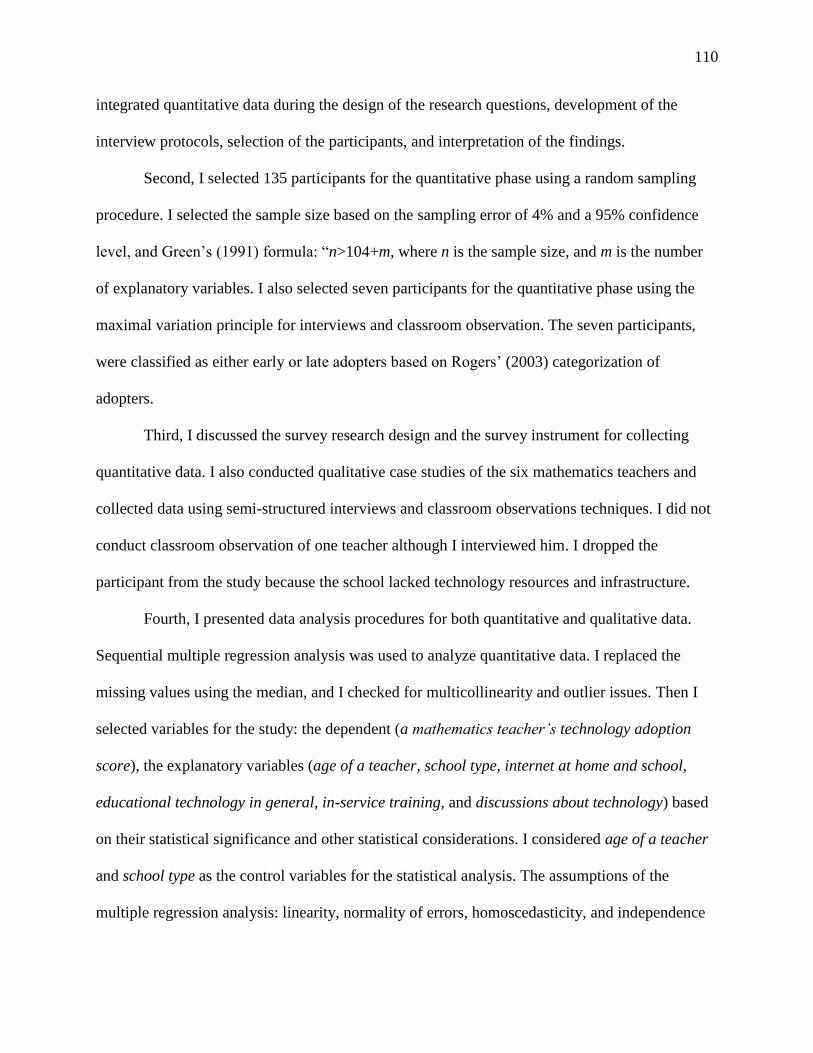
110
integrated quantitative data during the design of the research questions, development of the
interview protocols, selection of the participants, and interpretation of the findings.
Second, I selected 135 participants for the quantitative phase using a random sampling
procedure. I selected the sample size based on the sampling error of 4% and a 95% confidence
level, and Green’s (1991) formula: “n>104+m, where n is the sample size, and m is the number
of explanatory variables. I also selected seven participants for the quantitative phase using the
maximal variation principle for interviews and classroom observation. The seven participants,
were classified as either early or late adopters based on Rogers’ (2003) categorization of
adopters.
Third, I discussed the survey research design and the survey instrument for collecting
quantitative data. I also conducted qualitative case studies of the six mathematics teachers and
collected data using semi-structured interviews and classroom observations techniques. I did not
conduct classroom observation of one teacher although I interviewed him. I dropped the
participant from the study because the school lacked technology resources and infrastructure.
Fourth, I presented data analysis procedures for both quantitative and qualitative data.
Sequential multiple regression analysis was used to analyze quantitative data. I replaced the
missing values using the median, and I checked for multicollinearity and outlier issues. Then I
selected variables for the study: the dependent (a mathematics teacher’s technology adoption
score), the explanatory variables (age of a teacher, school type, internet at home and school,
educational technology in general, in-service training, and discussions about technology) based
on their statistical significance and other statistical considerations. I considered age of a teacher
and school type as the control variables for the statistical analysis. The assumptions of the
multiple regression analysis: linearity, normality of errors, homoscedasticity, and independence

111
of errors were checked and met. I also presented the open coding data analysis procedures for
qualitative data. The main purpose of the qualitative data was to explain statistically significant
variables from the quantitative phase of the study. The following themes emerged from the
quantitative data: technology training, availability of educational technology and infrastructure,
time, perceived benefits, teacher characteristics, the Internet, and collaboration. I applied these
themes in laying out the teachers’ profiles in chapter 4.
Lastly, I checked for reliability and validity of the quantitative data, and credibility issues
for the qualitative data. I also presented field relations and ethical considerations of the data such
as the confidentiality promise and compensation for the participants. The following chapter
discusses the results of the study and answers the research questions.

112
Chapter 4: Results and Findings
The main objectives of this study were to examine (1) the factors related to technology
adoption in mathematics teaching in Kenya, (2) how the factors related to technology adoption
influenced technology adoption for different categories of technology adopters in mathematics
teaching, and (3) how the qualitative data helped illuminate the quantitative results. First, I
collected quantitative data using survey questionnaires to identify variables that were related to
the mathematics teacher’s technology adoption score. Secondly, I collected qualitative data to
give insight to the statistical results from the quantitative phase. Chapter 4 reports the results and
findings for the study and is organized as follows: (1) research questions, (2) the results of the
multiple regression analysis, (3) answering research Question 1, (4) mathematics teachers’
profiles, and (5) answering research Question 2.
Research Questions
Three types of research questions guided me in this examination: quantitative, qualitative,
and mixed methods research questions. I have listed the questions below by type.
The quantitative research questions are:
1. Which factors related to technology adoption:
a. best predict a mathematics teacher’s technology adoption score? How can the
quantitative relationship be explained?
b. makeup the combinations of variables that best explain a mathematics teacher’s
technology adoption score? How can the quantitative relationship be explained?
The qualitative research questions are:
2. How do the factors related to a mathematics teacher’s technology adoption score explain:
a. An early adopter’s decision to adopt or not to adopt technology?
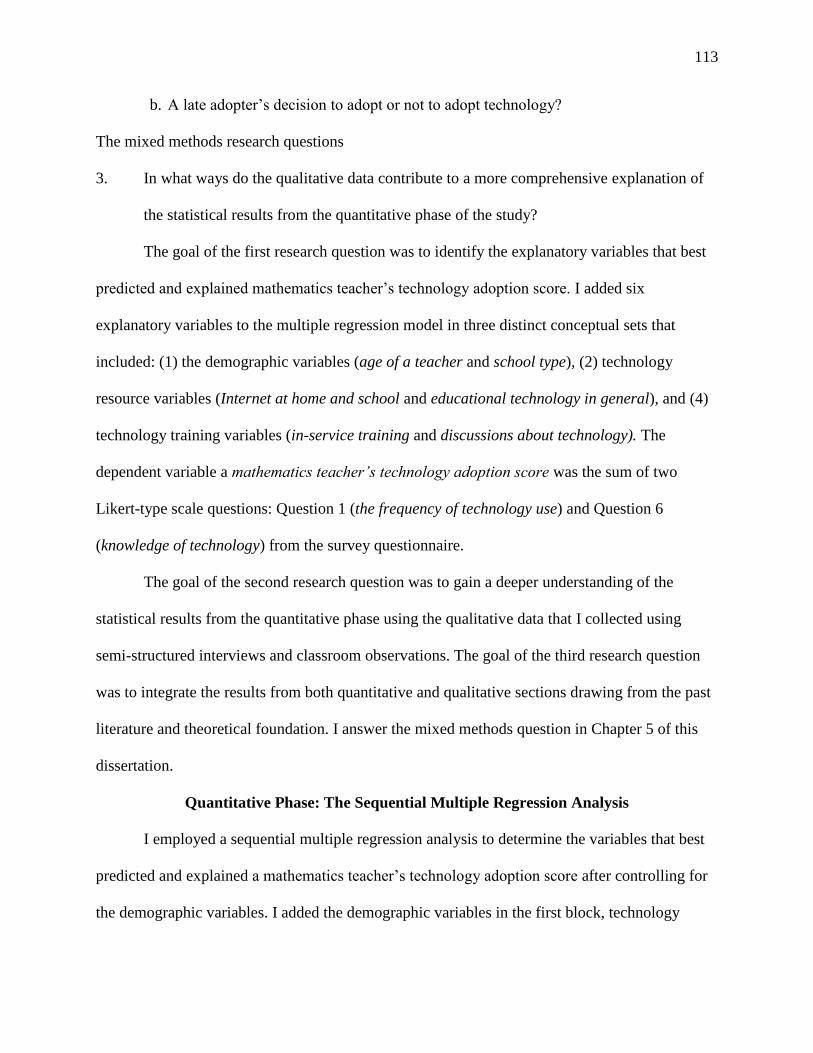
113
b. A late adopter’s decision to adopt or not to adopt technology?
The mixed methods research questions
3. In what ways do the qualitative data contribute to a more comprehensive explanation of
the statistical results from the quantitative phase of the study?
The goal of the first research question was to identify the explanatory variables that best
predicted and explained mathematics teacher’s technology adoption score. I added six
explanatory variables to the multiple regression model in three distinct conceptual sets that
included: (1) the demographic variables (age of a teacher and school type), (2) technology
resource variables (Internet at home and school and educational technology in general), and (4)
technology training variables (in-service training and discussions about technology). The
dependent variable a mathematics teacher’s technology adoption score was the sum of two
Likert-type scale questions: Question 1 (the frequency of technology use) and Question 6
(knowledge of technology) from the survey questionnaire.
The goal of the second research question was to gain a deeper understanding of the
statistical results from the quantitative phase using the qualitative data that I collected using
semi-structured interviews and classroom observations. The goal of the third research question
was to integrate the results from both quantitative and qualitative sections drawing from the past
literature and theoretical foundation. I answer the mixed methods question in Chapter 5 of this
dissertation.
Quantitative Phase: The Sequential Multiple Regression Analysis
I employed a sequential multiple regression analysis to determine the variables that best
predicted and explained a mathematics teacher’s technology adoption score after controlling for
the demographic variables. I added the demographic variables in the first block, technology

114
resources variables in the second block, and technology training in the third block. The following
section discusses the results of the multiple regression analysis. I organized this section as
follows: (1) the model summary, (2) the ANOVA model, and (3) the model parameters, and (4)
answering research question one.
Model Summary
Before the analysis of the data, I first conducted a preliminary examination of the data to
ensure there were no violations of the assumptions of linearity, normality of errors,
homoscedasticity, and independence of errors. In addition, data problems such as missing values,
multicollinearity, and outliers, if any, were identified and rectified. The section on model
summary consists of multiple correlation, correlation coefficient, R square, R square change, and
adjusted R square.
Multiple correlation. According to Cohen (1988), a multiple correlation R=.70 is
considered larger than typical, R=.51 is considered large, R=.36 is considered medium, and
R=.10 is considered small. The multiple correlation coefficient between a mathematics teacher’s
technology adoption score and all the explanatory variables in model was R=.782. This value
was large based on Cohen’s convention, which imply a strong linear association between a
mathematics teacher’s technology adoption score and the six explanatory variables. In this study,
the multiple correlation coefficient between a mathematics teacher’s technology adoption score
and the demographic variables was R=.390, which was medium, while that for technology
resources variables and demographic variables was R=.566 which was large according to
Cohen’s interpretation.
Correlation coefficient. Table 4.1 shows a summary of the correlation matrix of the
variables in the study. Davis (1971) suggested a criterion for interpreting correlation effect sizes:

115
a coefficient between .01 to .09 as negligible association, .10 to .29 as low association, .30 to .49
moderate association, and .50 to .69 as substantial association, and .70 or higher as very strong
association. Consistent with Davis’ interpretation of the correlation effect sizes, the correlations
between the explanatory variables and a mathematics teacher’s technology adoption score ranged
from low association r=.225, p<.05 to strong association r=.696, p<.001. This implies that the
explanatory variables were significantly correlated with the mathematics teacher’s technology
adoption score, an indication that the explanatory variables were suitably correlated with the
dependent variable for examination through multiple regression analysis. In addition, there is low
association between the explanatory variables, which is a good thing because multicollinearity is
not a likely problem in this study.
Table 4.1
Correlation Matrix between Variables in the Study
Variable Name
A mathematics
teacher’s technology
adoption score
(Q1&6)
Q16 Q18 Q26b Q5h Q3
Age_of_a_teacher_(Q16) -.286*
School_type_(Q18) .225* .130
Internet_at_home_and_school_(Q
26b)
.314** -.014 .105
Educational_technology_in_gener
al_(Q5h)
.356** -.072 .004 .133
In-service_training_(Q3) .696** -.162 .133 .240* .275*
Discussions_about_technology
_(Q2i)
.333** -.024 .229* .117 -.021 .240*
Note: *p-value<0.05 and ** p-value<0.001, two tailed significant test
R square, R square change, and adjusted R square. R square (R2), also known as the
coefficient of determination is the proportion of the variation explained by the explanatory
variables on the dependent variable while R square change (ΔR2) is the amount of variation
explained by each explanatory variable on the dependent variable (Keith, 2006). Cohen (1988)

116
defined small, medium, and large effect sizes for values of R square. He defined small effect as
R2=.02, medium effect as R
2=.13, and large effect as R
2. The results in Table 4.2 suggest that the
overall regression model indicated had R2=.612, which is a large effect according to Cohen’s
conventions.
Table 4.2
A Summary of the Sequential Regression Analysis
Model Summary
Block R Adjusted F Statistic Sig. Durbin-
Watson
1 .390 .138 .152 .152 11.189 .000 1.863*
2 .566 .298 .320 .169 15.253 .000
3 .782 .593 .612 .291 33.276 .000
*Durbin-Watson statistic test for independence of errors
Adjusted R square (Radj) is a reduced value for R squared which attempts to make an
estimate of the value of R square (same here and below) in the population rather than the sample
(Miles & Shevlin, 2001). The problem with R square is that it continues to increase even for the
statistically insignificant variables that have nothing to explain on the dependent variable (Keith,
2006). However, adjusted R square is used to make this correction because its value increases or
decreases depending on whether an addition of extra explanatory variables has any statistically
significance explanatory or prediction power on the model (Ryan, 1997), thus, adjusted R square
is always less than R squared in a regression model. Thus, the overall regression model resulted
in adjusted R square of .593, which was slightly lower than R square. The following discussion
reports the results of R square, R square change, and adjusted R square for the multiple
regression model.
When I added age of a teacher and school type in the first block, the resulting model
revealed a statistically significant increase in explained variation (R2=.152, ΔR
2=.152,

117
R2
adj=.138, F[2,125]=11.189, p<.001) or 15.2% increase in explained variation on mathematics
teacher’s technology adoption score. When I added technology resources variables in the model,
the model significantly increased the explained variation (R2=.320, ΔR
2=.169, R
2adj=.298,
F[2,123]=15.253, p<.001) or 16.9% increase in explained variation in mathematics teacher’s
technology adoption score. Lastly, adding technology training variables to the regression model
the result indicated a statistically significant increase in explained variation (R2=.612, ΔR
2=.291,
R2
adj=.593, F[2,123]=33.276, p<.001) or 29.1% increase in explained variation on mathematics
teacher’s technology adoption score.
These results imply that the demographic variables contributed 15.2%, technology
training 16.9%, and technology training 29.1%. The overall model resulted in R square value of
61.2% compared to the adjusted R square value of 59.3%. Clearly, both values did not differ
significantly, which suggested that a mathematics teacher’s technology adoption score was fully
measured by the explanatory variables in the multiple regression model. The information in this
model implied that the regression equations were all statistically significant.
ANOVA Model
Table 4.3 shows the results of the ANOVA model for each of the three groups of
variables (demographic, technology resources, and technology training). The results show that all
the variables in the three blocks significantly explained and predicted mathematics teacher’s
technology adoption score; (F[2,125]=11.189, p<.001), block two (F[2,123]=14.497, p<.001),
and block three (F[6,121]=31.776, p<.001). In sum, the multiple regression model was
statistically significant.

118
Table 4.3
Summary of the ANOVA Model
ANOVA Model Summary
Block Sum of Squares df Mean Square F Sig.
1 Regression 23.831 2 11.915 11.189 .000
Residual 133.113 125 1.065
Total 156.944 127
2 Regression 50.283 4 12.571 14.497 .000
Residual 106.660 123 .867
Total 156.944 127
3 Regression 96.011 6 16.002 31.776 .000
Residual 60.933 121 . 504
Total 156.944 127
Model Parameters
In this section, I report the results of the multiple regression analysis based on the
unstandardized regression coefficient b, standardized regression coefficient β, 95% confidence
interval, and the statistical significance. The results in Table 4.4 indicate that the 95% confidence
intervals for all the six explanatory variables did not include zero and therefore the true
population parameter was within the confidence intervals. This implies that the six predictors
could accurately predict future technology adoption scores.
However, there are other ways of judging how explanatory variables could be related to
the dependent variable. Keith (1999) suggested the magnitude of effects beta’s (β) below .05 as
too small, β’s above .05 as small, those above .10 as moderate, and those above .25 are large.
Clearly, the magnitude effects for all the explanatory variables were large except for discussion
about technology which was moderate.

119
Table 4.4
Summary of the Model Parameters
Parameters
Variables Unstandardized
Coefficients (b)
95%
Confidence
Interval for (b)
Standardized
Coefficient
Beta (β)
t Sig.
Demographics
Constant 7.360 [6.959, 7.761] .000
Age of a teacher -0.783 [-1.185, -.382] -.321 -3.589 .000
School Type 0.626 [0.241, 1.012] .267 3.215 .002
Technology Resources
Constant 6.881 [6.480, 7.281] .000
Internet at home and
school
0.549 [0.214, 0.884] .245 3.244 .002
Educational technology
in general
0.698 [0.353, 0.1043] .301 4.003 .000
Technology Training
Constant 5.377 [4.931, 5.823] .000
In-service training 0.073 [0.060, 0.098] .527 8.366 .000
Discussions about
technology
0.306 [0.095,0.629] .161 2.686 .008
Demographic variables. The first block of variables indicates that all of the
demographic variables in the model were important in the multiple regression analysis. A focus
on the standardized beta coefficients from the analysis, the three blocks demographic variables
were significant predictors of mathematics teacher’s technology adoption score. In block one age
of a teacher (b=-0.783, β=-.321, p<.001) and school type (b=0.626, β=.267, p<.05) significantly
predicted mathematics teacher’s mathematics teacher’s technology adoption score. These results
suggest that for every increase in one standard deviation of age of a teacher, a predicted
mathematics teacher’s technology adoption score would decrease by .321 standard deviations
holding other variables constant. Age of a teacher was a categorical variable that I coded as “40
years and below”=1 and “Above 40 years”=0, which implied that a teacher aged above 40 years
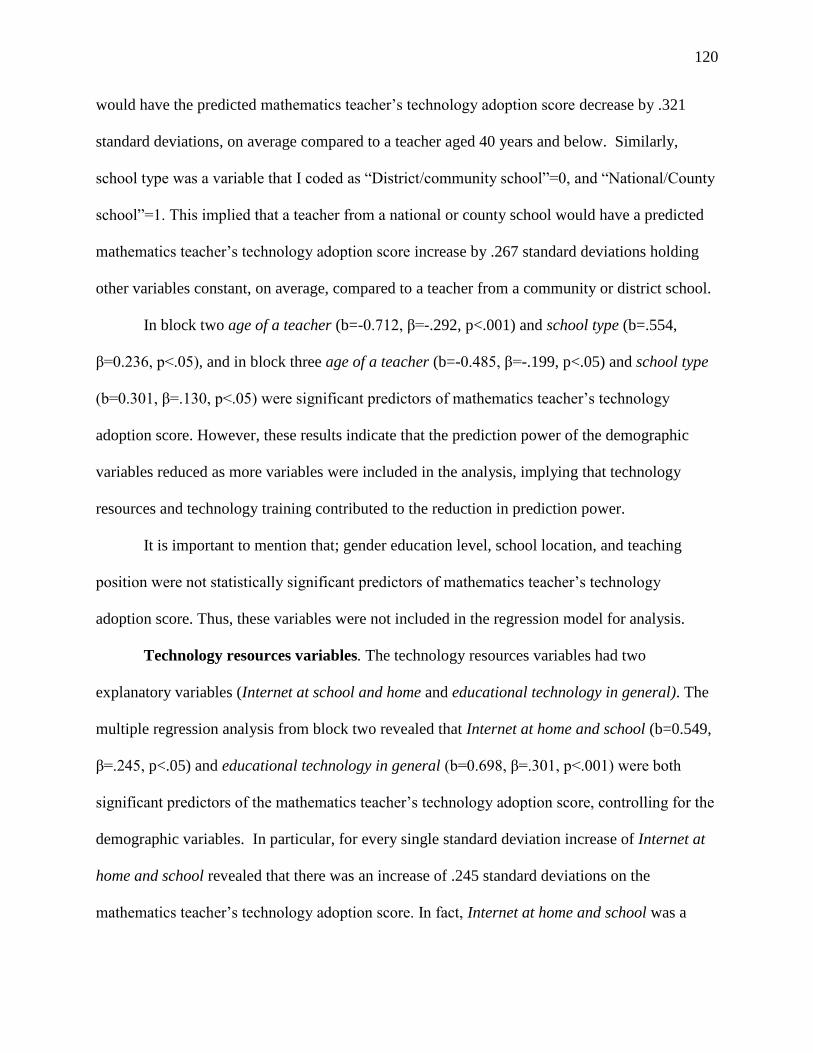
120
would have the predicted mathematics teacher’s technology adoption score decrease by .321
standard deviations, on average compared to a teacher aged 40 years and below. Similarly,
school type was a variable that I coded as “District/community school”=0, and “National/County
school”=1. This implied that a teacher from a national or county school would have a predicted
mathematics teacher’s technology adoption score increase by .267 standard deviations holding
other variables constant, on average, compared to a teacher from a community or district school.
In block two age of a teacher (b=-0.712, β=-.292, p<.001) and school type (b=.554,
β=0.236, p<.05), and in block three age of a teacher (b=-0.485, β=-.199, p<.05) and school type
(b=0.301, β=.130, p<.05) were significant predictors of mathematics teacher’s technology
adoption score. However, these results indicate that the prediction power of the demographic
variables reduced as more variables were included in the analysis, implying that technology
resources and technology training contributed to the reduction in prediction power.
It is important to mention that; gender education level, school location, and teaching
position were not statistically significant predictors of mathematics teacher’s technology
adoption score. Thus, these variables were not included in the regression model for analysis.
Technology resources variables. The technology resources variables had two
explanatory variables (Internet at school and home and educational technology in general). The
multiple regression analysis from block two revealed that Internet at home and school (b=0.549,
β=.245, p<.05) and educational technology in general (b=0.698, β=.301, p<.001) were both
significant predictors of the mathematics teacher’s technology adoption score, controlling for the
demographic variables. In particular, for every single standard deviation increase of Internet at
home and school revealed that there was an increase of .245 standard deviations on the
mathematics teacher’s technology adoption score. In fact, Internet at home and school was a

121
categorical variable that I had coded as “Internet at home or school or none”=0, and “Internet
both at home and school”=1. This statistical analysis indicates that the predicated mathematics
teacher’s technology adoption score would increase by an average of .245 standard deviations
holding other variables constant, for having Internet access both at home and school compared to
a teacher who had the Internet either at home or school or had no Internet access. Second,
educational technology in general was a statistically significant predictor of the mathematics
teacher’s technology adoption score, which implied that for every standard deviation increase in
educational technology in general there was an increase of .301 standard deviations on the
mathematics teacher’s technology adoption score. In light of this, I coded educational technology
in general as “None/not sure”=0 (implying there was no educational technology resources or not
sure), and “Yes”=1 (implying there was educational technology at school). Thus, a teacher who
had access to educational technology resources at school increased the predicted mathematics
teacher’s technology adoption score by .301 standard deviations on average, compared to a
teacher who did not have access to technology or was not sure there was educational technology
at the school.
In block three when all variables were included in the model, Internet at home and school
(b=0.286, β=.128, p<.05) and educational technology in general (b=0.422, β=.182, p<.05) were
both statistically predictors of mathematics teacher’s technology adoption score. However, both
variables indicted a decreased unique contribution to the model holding other variables constant.
This discussion revealed that both Internet at home and school and educational
technology in general were statistically significant predictors of mathematics teacher’s
technology adoption score. However, the prediction power of these two explanatory variables
declined as more variables were included in the model, which implied that other variables

122
accounted for this decline. There was evidence to suggest that educational technology in general
had a stronger relative impact in a mathematics teacher’s technology adoption score compared to
Internet at home and school. Therefore, availability of educational technology in general at
school was a better predictor of technology adoption compared to accessing the Internet at home
and at school. However, not all technology resources were statistically significant. Computer
labs, ownership of laptops and smartphones, mathematical software were not statistically
significant predictors of technology adoption score.
Technology training variables. The teacher-related variables comprised a set of three
variables. These variables included in-service training and discussions about technology. I report
the results for these explanatory variables based on their relative impact on the mathematics
teacher’s technology adoption score, taking into account the impact of other variables in the third
block of the multiple regression analysis.
In the third block, in-service training was a statistically significant predictor of a
mathematics teacher’s technology adoption score (b=0.079, β=.527, p<.001). In-service training
was a continuous variable and thus for each standard deviation increase in in-service training, a
mathematics teacher’s technology adoption score increased by .527 standard deviations once
other variables were taken into account. Discussions about technology was a statistically
significant predictor of a mathematics teacher’s technology adoption score (b=0.362, β=.161,
p<.05). In fact, one standard deviation increase of discussions about technology resulted in an
increase of .161 standard deviations on the mathematics teacher’s technology adoption score. I
coded discussions about technology as “Does not apply”=0 (no confirmation of discussion about
technology with colleagues) and “Apply”=1 (confirmation of discussion about technology with
colleagues). This implies that mathematics teachers who confirmed discussing about technology

123
with other colleagues resulted in an increase of .161 standard deviations on mathematics
teacher’s technology adoption score, compared to other mathematics teachers who did not
discuss about technology with colleagues.
In sum, the technology training variables in the study were significant predictors of the
mathematics teacher’s technology adoption score. In-service training of teachers on technology
appears to be the strongest predictor of technology adoption scores while the least significant in
this category is discussions about technology. However, other ways teachers learn technology,
such as self-taught and computer courses, were not statistically significant predictors of
technology adoption and therefore I excluded them from the regression model.
Answering Research Question 1
The study applied sequential multiple regression analysis to understand six explanatory
variables that resulted in the best statistical model. Two of these variables – age of a teacher and
school type – acted as control variables.
Research Question 1a
Focusing on the relationship between each explanatory variable and the mathematics
teacher’s technology adoption score, all of the six variables significantly predicted the
mathematics teacher’s technology adoption score. Increasing one unit of each of the six
explanatory variables led to a percentage change a mathematics teacher’s technology adoption
score as follows: in-service training (β=.527), age of a teacher (β=-.321), educational
technology in general (β=.301), school type (β=.267), Internet at home and school (β=.245), and
discussions about technology (β=.161).
These findings suggest that technology training for all mathematics teachers, regardless
of the schools where they teach need to be considered as a priority during the implementation of

124
technology in schools. To be included in this bracket is the group of mathematics teachers aged
above 40 years. Pre-service teacher programs also need to include technology training to ensure
that younger teachers leave college equipped with technology skills for teaching mathematics.
Providing technology resources such as the Internet and educational technology were
significant predictors of technology adoption scores. The results also suggest that providing of
technology resources to schools and encouraging teachers to discuss with colleagues about
technology may lead to technology adoption. Also national and county schools appear to be
ahead of district and community schools in technology adoption in mathematics teaching.
These findings revealed that there was evidence to suggest that the in-service training of
mathematics teachers was the best predictor of technology adoption in the classroom teaching in
Nairobi and Nyandarua Counties. However, teachers aged above 40 years appear to decrease a
mathematics teacher’s technology adoption score by a significant amount, which suggests that
this group of teacher need to be considered for technology training. There is also evidence to
show that availability of educational technology in general might significantly increase
mathematics teacher’s technology adoption score. Overall, the six explanatory variables taken
together predicted a mathematics teacher’s technology adoption score to a statistically significant
level.
Research Question 1b
These results suggest the variables related to technology adoption could be grouped into
three categories based on their contribution to explained variation on a mathematics teacher’s
technology adoption score –technology training variables (ΔR2=29.1%), technology resources
variables (ΔR2=16.9%), and demographic variables (ΔR
2=15.2%). Thus technology training

125
variables contributed the largest R square change on mathematics teacher’s technology adoption
score, followed by technology resource variables, and demographic variables.
Besides training of mathematics teachers, the results also imply that the availability of
technology resources such as computerized classrooms and mathematical software, and access to
the Internet both at home at school need to be prioritized. The results indicated that having the
Internet at home and school could be a significant step towards technology adoption when
compared to teachers’ accessing the Internet either at home or at school or having none.
Demographic variables also contributed a statistically significant amount of explained
variation on technology adoption but to a lesser extent when compared to technology training
and technology resources variables. Despite the demographic variables acting as control
variables for this analysis, results indicated that age of a teacher and school type are important
during the implementation of technology in schools. The demographic variables suggest that
training of teachers aged more than 40 years and providing technology resources to district and
community schools could significantly increase technology adoption in mathematics teaching.
Overall, there was evidence to suggest that the six explanatory variables in the model
taken together accounted for 61.2% of the explained variation on the mathematics teacher’s
technology adoption score. This implies that 61.2% of variation in a mathematics teacher’s
technology adoption score can be explained by demographics, technology resources, and
technology training variables. Importantly, the model resulted in 59.3% estimated value of R
square.
Conclusion
This section I reported the results of the multiple regression analysis. The report included
the model summary, the ANOVA model, the model parameters, and answering of research

126
question one. The findings indicated that in-service training, educational technology in general,
discussions about technology, Internet at home and school, school type, and age of a teacher as
the best predictors of mathematics teacher’s technology adoption score. The best combination of
variables based on the amount of explained variation in a mathematics teacher’s technology
adoption score ranged from small to large as follows: technology training, technology resources,
and demographic variables. The next section reports the findings of the qualitative phase where
mathematics teachers’ profiles are described in detail.
Qualitative Phase: Mathematics Teachers’ Profiles
This section lays down profiles of six mathematics teachers based on whether the teacher
is (1) early adopter or (2) late adopter of technology. The early adopters of technology are
Gatimu, Hamisi, and Musyoka. The late adopters of technology are Shiro, Awiti, and Amina.
Early Adopters of Technology
This part describes the profiles of three mathematics teachers: Gatimu, Hamisi, and
Musyoka. I have discussed each teacher’s profile based on (1) perceived and observed
pedagogical practices, and (2) themes emerging from the data.
Gatimu. Teacher Gatimu had been teaching for 19 years since 1994. He graduated with a
Bachelor’s degree in Physics and Mathematics without a teaching qualification. However, he
went on to get his first job as an untrained high school teacher. But after five years in the
teaching profession he went to study for a postgraduate diploma in education and thereafter a
master’s degree in educational administration. After his master’s degree, he was sent to teach
mathematics at Simba High—a national school. He was the head of examination department.
Gatimu was the only mathematics teacher I observed who had adopted technology nearly on a
daily basis in his classroom activities.

127
Gatimu’s perceived and observed pedagogical practices. Gatimu told me that his
teaching philosophy was about “imparting knowledge” to students. According to him, his goal
was to make students understand what he was talking about and why they were learning
mathematics. For instance, he told me that sometimes students asked him why they were learning
certain mathematics concepts and where they could apply that knowledge in real life. In such
instances he told me he would need to know what to tell the students.
According to Gatimu, his teaching style involves giving students a few examples
followed by some exercises for students to complete. He told me that, “you give them a question
they try because it is a build-up of a lower form” (Gatimu, Interview Data, Lines 29-30). He
implied that he expected students to have some basic knowledge from lower classes of certain
mathematical concepts that could help them work on more challenging mathematics problems.
When I observed Gatimu teach using technology, there was evidence to support his argument.
In one of the lessons I observed him apply technology, he was teaching three-dimensional
geometry with the goal of finding the angle between a plane and plane projections. Using a smart
board, Gatimu pulled an oblique pyramid figure that did not have a perpendicular height. He
started by teaching the sine rule and cosine rule concepts. After about ten minutes he gave
students a problem to complete that asked them to find the angle between two planes and two
projections. Although most of the students had difficulties understanding the problem, I observed
that the teacher encouraged the students to show their work and use different approaches in
solving the problem. The teacher walked around the class giving students hints such as “extract
the triangle”. With this support, most students successfully obtained the correct answers to the
problem. Such was a typical mathematics lesson in which Gatimu applied technology. The
rationale of using technology was to support the students visualizing angle properties,

128
projections, and planes. However, I observed that the students were not actively engaged in these
lessons and the teacher played the role of telling the students as they sat listening and watching
what the teacher was accomplishing using the smart board.
Gatimu was enthusiastic adopting technology in teaching mathematics but he did not use
technology as he would have wanted to because not all the classrooms had the infrastructure to
support technology adoption. The school had two smart boards; one was located in the school
library and the other one was located in a medium-sized hall where he taught two groups of
students with different learning abilities—one weak and one strong group of students. He stated
that “these students would always fail to show work and write answers only” (Observation
Notes, lines 37-39). Thus, he kept on emphasizing to the students to show their work all the time.
He noted, “they are lazy in representing mathematics concepts; they ignore graphs and showing
work” (Gatimu, Observation Comments, lines 61-69). According to him students do not draw
smooth curves because they think it is time consuming.
Themes emerging from the data. This part describes the major themes that emerged from
the data. These themes include technology training, availability of educational technology and
infrastructure, time, perceived benefits, teacher characteristics, the Internet, and collaboration.
However, not all the themes are evident across all the cases.
Technology training. When I asked Gatimu whether he had acquired technology skills,
first he told me that he had taken some computer courses during his postgraduate diploma studies
but, according to him, the courses were meant to meet the program requirements and not
necessarily for improving technology skills for teaching. Then he told me he had attended the
Centre for Mathematics, Science and Technology Education in Africa (CEMASTEA) training
program. However, he felt he did not benefit because “you were crowding in one computer; ten

129
people in one computer so there is only one who had the touch and it is those who know”
(Gatimu, Interview Data, line 98-99). According to Gatimu, because of the lack of computers for
training at the center he felt that he did not benefit during the training.
He told me that the technology skills he had were self-taught from the Internet. He stated,
“I have trained myself. You just go to the Internet, for example, if you have something you want
to check, you go to the Internet, you Google. You check.” (Gatimu, Interview Data, line 105-
106). When I asked him if he was knowledgeable in mathematical software for teaching he told
me he was not. He reported, “I use Excel but I cannot say that I am very good. I am not very
good because I keep on consulting … I am trying to, but I have forgotten something” (Gatimu,
Interview Data, lines 357-360). In one of our post-conference interviews, he was not sure there
was a graphing tool on the smart board. After checking with him we found a graphing tool on the
left hand side of the KAMAU that he had not used before. He was glad we found it.
Emphasizing how limited technology skills had affected his teaching, he told me about
how the Internet had supported him in accessing instructional resources. However, he was scared
he could get accused of plagiarism. To overcome such challenges, he told me that he would like
to be trained in using mathematical software. He said, for instance, “if I am talking on reflection,
I would like to have a way, if I am talking inflective rectangle, through line , I have a way
of reflecting it. Maybe it is software developer or something like that” (Gatimu, Interview Data,
lines 112-114). He implied that training would make him effective because he would be able to
develop his own instructional materials and students would see him make and correct mistakes,
as opposed to the readily available materials from the Internet that he cannot edit. He told me
how the videos from the Internet played fast and the students could barely visualize what was

130
happening. As a result, the students were not able to draw graphs on their own because they
never observed the teacher drawing.
According to Gatimu, technology training should be made mandatory for teachers, and
certification issued as evidence of training. He also told me that teachers need to be reimbursed
when they spend money on technology training: “If you used KES 50,000 and you bring a
certificate, we reimburse back. That way, teachers will be encouraged in training. Again, it
should be from a recognized university or a college. That way after capacity building, ICT
integration will become very easy” (Gatimu, Interview Data, Lines 334-337). He gave me
examples where other government ministries sponsored their employees to go to the university to
study, and books and tuition fees were paid for them. But in the teaching profession, “there is
none like that. You go for masters, you pay for yourself and you support yourself. There should
be incentives” (Gatimu, Interview Data, lines 366-368). According to him, supporting teachers
with funds during the training could encourage them to seek more skills that are required to
adopt technology in the teaching and learning of mathematics.
Gatimu told me that time is a hindrance for technology training for mathematics teachers.
During the holidays, he told me that teachers would want to relax after working for three months.
He suggested that training should be made flexible so that “if they also want to train over the
holiday, like those who are doing their master’s degree during their holiday programs. Then
those who want to train in the evening should do like that” (Gatimu, Interview Data, line 349-
352). According to Gatimu, teachers would be free to get training at a convenient time.
Additionally, he suggested that starting many training centers across the country would ensure
that teachers attend training any time of the year when they want.

131
Availability of educational technology and infrastructure. When I asked Gatimu whether
his school had supported him to adopt technology, he told me that his school had two smart
boards. According to him, there was one KAMAU in the library that had not been put into good
use. He noted, “if it was put on this side [in a classroom], it could be put in good use. There is a
very high demand. You want to use it, another teacher has booked it” (Gatimu, Interview Data,
lines, 131-132). He implied that accessing the KAMAU from the library would waste a lot of
time because that would make the teacher change classrooms. In addition, he thought that smart
boards were too expensive and there was no need to put up more at the school. He suggested
instead that:
Every class should have a screen and a desktop, a projector, LCD, and a desktop. So that
every teacher, even those who have phobia using computer can go, maybe a topic, like
just display it there. If it is a question, you display, then we encourage everybody to use
technology. Or maybe the school can buy a laptop for every teacher, not free per se, but a
place where you are given a computer worth KES 50,000, then you pay it. That way you
cannot keep it in the house. (Gatimu, Interview Data, lines 323-329)
Gatimu’s views were reaffirmed by nearly all the participants who participated in the interviews
about the type of the classroom setting they would wish to have, where technology was available
without having the students leave the classroom. To him, this would eliminate the frustrations
that teachers went through in accessing the smart boards and the computer department.
He told me about the frustrations he had gone through in his efforts to seek technical
support from the computer department. He told a story about a philanthropic individual who had
donated a technology system for examination but the computer department was not supportive of
the initiative. Because of this, Gatimu had to take the initiative himself as the head of

132
examinations. He stated, “They were told I am in charge of exams so I introduced the system to
him. So I got some training and the system is here with us. So the IT [computer department] is
not supportive” (Gatimu, Interview Data, lines 140-141). This suggested the computer
department was a hindrance to technology adoption at the school. He implied that the computer
department is seen as the backbone of school technology implementation because the department
is expected to have the technical support and manpower to handle technology issues. According
to him, he thought that the computer department was overrated and all matters related to
technology should not be left to them.
When I observed Gatimu teach using technology, there was evidence of a general lack of
technological infrastructure and educational resources at the school. Although the school has two
KAMAUs, the students did not have access to a technology classroom where they could engage
in constructive learning activities. Now with the computer department coming into the picture,
there was evidence that challenges of accessing technological resources for teaching and learning
mathematics were beyond Gatimu’s control.
Time. Teacher Gatimu felt that he did not have enough time to prepare technology-
enhanced lessons. He felt that graphing software was time consuming. He noted, “for you to
have that confidence to use it, you must use it before you go to class ... sometimes you don't have
time to prepare and you just go to the board and tell the boys to draw” (Gatimu, Interview Data,
lines 73-76). He implied that graphing software requires time to prepare the lesson and if a
teacher does not have adequate skills to use it, then the teacher may ask students to draw by
hand. Regarding this, he told me of a teacher who was using the technology at his school and
students complained they did not want him to use technology because he did not quite
understand the technology and it was wasting a lot of time. In light of this, he told me that in

133
such a scenario the teacher would have to create time to prepare technology-enhanced lessons,
and know the approaches and the strategies to use. He noted, “if you have a lesson at 2 pm you
need to be in the lab 10-20 minutes before. You switch on the screen, you prepare, you research,
you get your materials ready before time. Then it is time consuming” (Gatimu, Interview Data,
line 188-190). Gatimu implied that it takes a lot of time to prepare a technology-enhanced lesson.
Perceived benefits. According to Gatimu, his goal for using technology was to support
students in understanding difficult mathematics topics, such as three-dimensional geometry,
longitude and latitudes, and loci. When I asked him how technology helped on such topics he
stated, “in bringing in the real world. If you go to school and ask them, this loci and ask them
what is in a day-to-day life, they won’t tell you” (Gatimu, Interview Data, lines 49-50).
According to him, students cannot conceptualize some mathematical ideas; they have to
visualize them. He noted, “after now showing how we get the loci, we describe the loci, then you
bring the video of the road. How it has [inaudible], there they will see the same. Then the railway
line … so it helps” (Gatimu, Interview Data, lines 51-53). Gatimu implied that some
mathematics concepts are difficult for students to visualize in ordinary circumstances; however,
technology makes it easy for the students to see these ideas clearly.
Gatimu felt that technology gave a “third eye” to his students, beyond what the ordinary
blackboard can do. He said that on the blackboard, “you are telling them it is a cuboid, or a
pyramid … you try to bring the vertex in the middle … there it does not work, but if it is drawn
using technology, you just display the diagram and use it” (Gatimu, Interview Data, lines 58-60).
This implied that technology presented the information accurately and effectively compared to
the ordinary blackboard.

134
Indeed, Gatimu thought that technology was an efficient tool that had enabled him to get
things done quickly. He noted, “I can come here at 8 am, I have a class at 8:20 am and I have
revision questions for the boys. I just prepare, print, they share 15 [copies], I have 37 [students].
So if I have 15 [copies], they can share comfortably” (Gatimu, Interview Data, lines 269-271).
Gatimu implied that technology enabled him to prepare his class in 20 minutes and have the
worksheets ready for the students. As he narrated to me, he looked visibly irritated by certain
teachers who were not making efforts to learn technology. He described the frustration he was
undergoing as the head of examination because teachers were not meeting his expectation of
submitting electronic copies of their examinations; instead they still relied on handwritten
reports.
Gatimu felt that technology would help him to get organized and create time to do other
things. He stated, “When I bought the laptop, I used to pay somebody to type questions for me.
You take Kenya Literature Bureau (KLB) or one of the things – those test papers at the back –
you pay somebody to type. You don't have time …” (Gatimu, Interview Data, lines 229-231). He
implied when he was starting to use his new laptop he did not have time to type documents, but
with time technology had enabled him get organized and that had saved him a lot of time. He
told me he has so much time now to do other things unlike before when he could not get enough
time. He told me when he needs a topic, he has many questions in the folders and that he only
needs to modify them to use.
He also felt that technology would eventually improve the coverage of mathematics
content faster than before. He told me that if each student had a computer and the teacher was
controlling the lesson, “you just point here and you tell the students do this, click here, you see
the rotation here. Then you also give a test online that maybe after this time it will expire, so it

135
increases speed of working” (Gatimu, Interview Data, lines 219-221). He implied that a lesson
can move faster and even have time for students to do a test.
Teacher characteristics. According to Gatimu, the age of a teacher plays a big role in
determining technology adoption. He told me as the head of the examination department, “when
I put a notice on evaluations system, the young Turks are there just entering the marks. In fact,
they are coming with marks in soft copies in Excel, just show them to import and they are there
working” (Gatimu, Interview Data, lines 254-256). According to him, younger teachers were
more enthusiastic about technology while working on the examination system but when older
teachers come to work on the system, they were not as efficient. About the older teachers, he
noted, “if I had set a password for him or her, they have forgotten. You have to reset it, you have
to show every step. It is a big challenge” (Gatimu, Interview Data, lines 257-259). He was
describing the challenges older teachers experience when using technology.
On gender, he told me that female teachers were embracing technology but not as quickly
as male teachers. However, he felt it is a matter of attitude. He stated, “now there is a lady with a
laptop; that lady is in ICT, business, and math. I don't think there is somebody else who has a
computer. Let’s say in terms of ICT we are lagging behind” (Gatimu, Interview Data, lines 377-
379). He implied that technology adoption was not necessarily a gender issue, but an issue of
attitude.
The Internet. Gatimu told me that he had a department modem that he used to access the
Internet. He noted that he has one from the school, and he bought his own for his personal use.
He told me the school’s Internet is very slow and it was only used by the computer department
and that was why he had his own modem.
136
Gatimu used the Internet to download videos, and other information from online for his
teaching. He stated, “if I am preparing a lesson and I want a definition, I just Google. I prepare
here so that it saves time” (Gatimu, Interview Data, lines 175-176). When I observed his class he
showed me a huge collection of videos he had downloaded from the Internet for teaching
mathematics. To him, it saves time because “if it is, let’s say rotation, you just put it there and
the students will see it. If it is opening of common solids, you just click, they see how” (Gatimu,
Interview Data, lines 178-180). He implied that Internet videos shortens time that a teacher
would need to demonstrate a mathematics concept when compared to using the blackboard to do
the same work.
Hamisi. Hamisi graduated with a bachelor’s degree in meteorology more than two
decades ago. Thereafter, he completed a post-graduate teaching diploma in mathematics and
physics. Hamisi had taught at four different schools for the last 22 years, including ten years at
Kifaru High School where he was the head of the mathematics department and the coordinator of
the mathematics curriculum. His duties included guiding curriculum implementation,
documentation, and ensuring completion of the syllabus in good time. Hamisi was also in charge
of the examinations department at the school where he coordinated the smooth running of all
examinations with other teachers.
I observed Hamisi teach two lessons, one where he used technology and one where he did
not. In each lesson, there were about 40 students. The following discussion highlights Hamisi’s
experiences and perceptions of technology in teaching and learning mathematics.
Hamisi’s perceived and observed pedagogical practices. When I asked Hamisi to talk
about his teaching philosophy, he told me that his teaching philosophy was centered on students’
excellence in education. He stated, “it becomes very unfortunate when you have given your best

137
and the results are not reflective” (Hamisi, Interview Data, lines 25-26). Hamisi implied that his
teaching philosophy was constructed based on whether his students had succeeded in school or
not. He told me that his school performance had not been good for two reasons: first, the school
was transformed from a day school six years ago and the “transition mentality” from a day
school to a boarding school had taken long to get established. Secondly, he told me that most of
the students who had enrolled at Kifaru High School came from poor families who lived in the
locality. As such, Hamisi felt that teachers at the school had to spend a lot of time dealing with
discipline issues other than supporting students’ learning.
When I asked Hamisi about his teaching style, he told me that he had tried to practice
student-centered approach but that had not worked for him because his school had minimal
instructional resources to facilitate satisfactory teaching practices. He stated, “you like them to
do, but if you remember in my class there is a question I gave and the students started moving.
This was because of the ratio of the books. It is supposed to be one to one” (Hamisi, Interview
Data, lines 58-61). Hamisi implied there were very many students who did not have textbooks in
the class and that inhibited him from practicing student-centered approach. In fact, when I
observed Hamisi’s lesson where he did not apply technology, I noted that, “the class was
disorganized and students were not well prepared to learn. Lack of books and geometrical sets
revealed a deeper problem within the school, particularly, in the provision of learning resources
to the students” (Hamisi, Classroom Observation Notes, lines 30-34). Evidence of inadequate
instructional resources was also apparent when I observed him apply technology in his second
lesson. The students were congested in a small room that did not have enough seats and desks. I
felt that a lack of adequate learning resources could have obstructed Hamisi’s teaching goals.

138
Themes emerging from the data. In this section, I discuss the following factors related to
technology as perceived by Hamisi: technology training, availability of educational technology
and infrastructure, time, teacher characteristics, the Internet, perceived benefits, and
collaboration.
Technology training. When I asked Hamisi how he had learned about technology, he told
me that he received some training during his undergraduate and graduate studies after he
completed computing courses like SPSS and Spectrum as program requirements. In addition, he
told me he had attended training through teacher training programs: “I have also taken several
initiatives by attending some empowerment courses in terms of technology, in two weeks, three
weeks during the holiday, some courses entirely on ICT and integration in schools” (Hamisi,
Interview Data, Lines 77-80). According to Hamisi, he felt he had benefited from the technology
training provided through these programs.
I asked him about the technology applications he learned during the training that were
related to mathematics and he stated:
What they wanted people to learn is the use of email, and e-learning topics from the
Internet. They were also exposing teachers to the new curriculum that KIE [Kenya
Institute of Education] is developing about the e-material and use them in the classroom.
There was an element of the Kamau and how to use it, projector, using the LCD, those
are the things we learned there and we felt it was very useful. (Hamisi, Interview Data,
lines 199-200)
I observed Hamisi teach one of his classes where he used a LCD projector and CD-ROMs to
teach a topic in optimization, latitude and longitude. He observed that, “when the teacher used
technology, initially he asked the students if anyone was willing to come forward and operate the

139
projector” (Hamisi, Observation Notes, lines 42-45). Hamisi appeared to not be confident. I
attributed his lack of confidence to limited technology skills. I observed that there were no
worksheets for the students and the teacher depended on the video from a CD-ROM to teach the
class. I concluded that technology was used for illustration purposes only.
That aside, Hamisi alleged that although he had experienced good technology training at
the Strengthening of Mathematics and Science in Secondary Education (SMASSE) project, many
teachers had negative attitudes towards the training during the initial training sessions. He noted
that, “the people, who are teaching you, are the same people you are with in the field. Why
should I be taught by my colleague whom I think I am even more competent than, in that angle?”
(Hamisi, Interview Data, lines 206-209). Hamisi implied that the technology instructors were not
qualified to train teachers on technology adoption because the trainers were their fellow teachers
in the schools and their qualifications were known by these teachers. Secondly, he told me that
the teachers were feeling abused because the teachers were not compensated the cost of attending
the training. He stated that the teachers knew the Ministry of Education officials were getting
compensated, but they were not. Therefore, some teachers withdrew from the training. However,
that changed “when the cry was heard, the ministry changed, they were able to foot maybe your
out-of-pocket services – the issue of transport – people now cooled down” (Hamisi, Interview
Data, lines 217-219). After this time, the training was open to teachers and they could train when
they wanted to. Thirdly, he told me that certification after the training was not recognized by the
teacher employer for promotion despite teachers dedicating a lot of time during the training, and
for that reason teachers lacked the self-drive to attend technology training offered to them. Thus,
the initial negative perceptions towards SMASSE still persist, although currently there is more
technology being incorporated into the training, unlike before.

140
Hamisi told me that he felt his colleagues across the country were not well prepared to
use technology. He stated, “but I know my colleagues have a problem and not one not two, so
even across the country, that training of teachers to be ICT compliant is important. That is what I
need to say” (Hamisi, Interview Data, lines 295-298). Hamisi noted that because of the dynamic
nature of knowledge, there is a need for teachers to embrace technology, to be trained about the
use of other technologies they are not knowledgeable about. He gave me an example from when
he bought his mobile phone and he realized that he could download information for personal use.
He stated, “if I can be able to download the whole physics syllabus content, then I will be able to
teach my boys even more effectively than the way I am doing today” (Hamisi, Interview Data,
lines 302-304). Hamisi implied that teachers need to be enlightened on the need to adopt
technology in their classroom practices so that they would appreciate a changing world.
Hamisi told me that even as the debate to train teachers on technology skills rages on,
“the very first people who should be trained I think are the managers so that they can appreciate
the usefulness of the same” (Hamisi, Interview Data, lines 242-243). He implied that some
school managers lack adequate technology skills and therefore they are not aware the about the
priority technologies that teachers need.
Availability of educational technology and infrastructure. During the interview with
Hamisi, he told me that he had the necessary technology skills and what the school had not
provided him with was the necessary technology equipment for teaching mathematics. He told
me there is a general lack of knowledge from the school managers on the technology that
teachers need. He stated, “this school of ours, surely it can afford five laptops so that at one time
when you are teaching four classes every teacher goes with a laptop. But they are not ready to do
that, they say it is an expensive affair” (Hamisi, Interview Data, lines 247-249). Hamisi

141
suggested that before introducing technology to schools all teachers need to be equipped with
technology skills. He gave me an instance of how he had constantly asked the school to buy a
flash disk for him rather than a CD-ROM for his teaching needs but nothing was being done. He
lamented that, “if the managers could understand why the flash disk [and not the CD-ROM],
they could easily get it for you … they are not expensive” (Hamisi, Interview Data, lines 270-
271). He told me he had his own flash disk, but that was for his own personal use.
According to Hamisi, availability of the Internet was another challenge that his school
had not committed to provide to teachers. He stated, “the Internet element, the school needs to
provide, not this business, a week there is Internet, next week there is none. If the school can
invest a little bit, that whenever you want to access it, there is no limitation” (Hamisi, Interview
Data, lines 272-275). According to him, this made the teachers to keep borrowing expensive
Internet modems, an option that does not accomplish teachers’ instructional goals.
Hamisi’s school generally lacked technology infrastructure. The classrooms lacked
electricity power supply. He noted, “if you have a computer there, you need power. If you need
to take those LCD [projector] there, you need power. There is no power apart from the lighting;
the socket one is not there at the moment” (Hamisi, Interview Data, lines 282-284). In addition,
when I observed him teach using technology there was a general lack of facilities, such as desks
and computers for the students. Students were seated crowded in one corner of the room so that
they could have a better view of the screen.
Hamisi stated that he would like to see a situation where technology would take over
students’ learning and his role would be to facilitate learning. In such a scenario, he noted that,
“when you are there, you just put an input where, you know you cannot ask a computer a
question, but they can ask you that point that we saw there, how it is going” (Hamisi, Interview

142
Data, line 311-313). He implied that he looks forward to the moment when there will be a well-
established computer system, when desks will be available for the students, and when students
will be able to interact on the Internet. When such a time comes, he told me that the teachers’
roles would be to guide students and support learning. He added that, “you can even have a
system whereby like say there is a computer room, from this lesson of mine I can prepare a
lesson, from here post it in their classroom and they can even interact. I don't have to move”
(Hamisi, Interview Data, lines 323-325). Hamisi was referring to the use of the Internet for
online learning. He told me that he had experienced this type of learning during his graduate
studies when his instructor used e-mail to communicate with the students despite being out of the
country. At that time he came to understand that technology has a role to play in students’
learning. He wondered, “why are the Japanese doing so well in mathematics … as opposed in
Kenya where mathematics is a dilemma. I would like to think that technology is playing a great
role” (Hamisi, Interview Data, lines 333-336). According to him, the Japanese students were
managing to excel in mathematics compared to the Kenyan students because of technology used
in teaching and learning.
Hamisi noted that for technology adoption to succeed in Kenyan schools, affirmative
action need to be declared so that “every school to have a well-equipped computer lab and
trained manpower because from there will be innovation taking place” (Hamisi, Interview Data,
lines 398-399). He also suggested that funds should be set aside that “has nothing to do with the
normal recurrence expenditure in the ministry of education. No, like the way they are putting
aside a fund for the youth and women” (Hamisi, Interview Data, lines 401-403). According to
Hamisi, the funding for technology implementation should be applied uniformly to all regions
across the country.
143
Time. Hamisi had a lot of school obligations during the school term. He told me that had
to balance many things as the head of mathematics department besides aiming to complete the
syllabus as early as possible. When I asked him at what point he would complete the syllabus, he
stated:
We are trying; we are actually, in the last two topics. Our objective as a school, we say
that we clear the syllabus by the end of July, that is, by end of next month. But we still
need to improve on that. If we can clear the syllabus by the first term of the year, in form
4 that would even be better, if possible if circumstances allow. (Hamisi, Interview Data,
lines 140-144)
According to Hamisi, the intention of completing the syllabus early was to support the students
in understanding of mathematics topics that students perceive as challenging before sitting for
the national examinations. He noted:
We usually give them ample time – “give us what you exactly want”. They tell us, ‘go to
loci, go to probability, go to matrices, or go to vector analyses”. What we do, we don't
now teach again. Now we shall give those questions on those areas. In the process of
answering those questions they will be able to revise on what they could have missed
during the time we were delivering the topic. (Hamisi, Interview Data, lines 161-165)
Hamisi implied he aimed to complete the syllabus early than scheduled to enable the students to
have time to revisit difficult topics on areas that they did not understand well. Students then were
required to answer questions on those topics.
Although Hamisi never mentioned how extra responsibilities at the school delayed his
goals of preparing for technology lessons, other participants like Shiro and Musyoka told me

144
how these extra responsibilities at the school hindered them in adopting technology. In fact,
when I observed Hamisi use technology in class, he had not prepared for his lesson:
When I observed the teacher use technology, initially he asked the students if anyone was
willing to come forward and operate the projector. He appeared tense. But the students
were shy. However, there were some students who had knowledge of technology and
they set up the lesson with the teacher. (Hamisi, Observation Notes, lines 42-48).
Teacher characteristics. When I asked Hamisi whether gender is related to technology
adoption, he agreed that he does not know any female teacher who has taken a leading role in
technology adoption and he noted that the field is dominated by male mathematics teachers. On
the flipside, he stated, “it depends on the exposure one gets and the attitudes. Like here, I am the
only male teacher in mathematics. The rest are female and they are doing well in technology and
they are also catching up” (Hamisi, Interview Data, lines 408-411). Therefore according to
Hamisi, technology adoption is a matter of attitude and the extent of exposure and not
necessarily a gender issue.
The Internet. When I asked Hamisi how he used his mobile phone he told me that he used
it to “Google” and to communicate. He illustrated how he used his phone to answer geography
questions for his son who was in grade six. He stated:
The other day he was asking me the formation of an ox-bow lake in geography and I had
very little knowledge about it. I just Google for him and give the answer and he asked me
things to do with physics measurement and whatever, conversions, Google gives the
answer. (Hamisi, Interview Data, lines 88-91)
He noted that Internet on mobile phone was a tool that had made work easier for him at home
when he has to help his son with homework and at school when he wants a concept in the

145
content areas that he teaches. He told me that his mobile phone and his modem supported him to
get information from the Internet when the school Internet was down.
Perceived benefits. When I asked Hamisi how he thought technology would be related to
students’ learning, he told me that he thinks technology will change students’ attitudes about
difficult concepts in mathematics. He noted, “If somebody thinks it is impossible, it is going to
be impossible. But if they change their attitude and think it is going to be possible, then things
will be working” (Hamisi, Interview Data, lines 342-343). He implied that technology can help
students visualize abstract concepts and get a real life picture of mathematics concepts. He
stated:
If you draw a circle on the board, it becomes very difficult to draw the spherical one.
You have to do it in a circle form, but students are supposed to visualize it in a spherical
form. But with the [technology], that picture is brought right in their face. (Hamisi,
Interview Data, lines 346-349)
He mentioned the lesson I had observed and how technology helped students to visualize the
distance concept. He noted:
But you know that technology can show them easily. Like if you are flying from here, it
will take this time. If you move over here, it takes this time and the distance is the same.
That becomes more real. That becomes more fun; it changes their attitude. It will make
them love the subject. (Hamisi, Interview Data, lines 353-356)
When I observed Hamisi teach using technology, I concluded that his purpose in using
technology was for illustration purposes. Although technology was used in this class, I felt that it
did not have much impact on students’ learning because the students were not engaged in tasks

146
related to the topic. However, for visualization and aesthetic purposes, the display played a
significant role.
Collaboration. Within the school, Hamisi told me that the school administration was
encouraging teachers to collaborate and create teams that would support them to adopt
technology. He noted that teachers had responded well to this call. To describe this, he told me of
a female teacher who had taken a lot of initiative to learn technology through the help of the
technical support staff at the school and she was succeeding. He told me that some schools were
ahead of others in technology adoption. He noted, “even when it comes to exams, the exams are
all computerized; you don't just write exams in paper, you type it yourself. You post it, you
analyze it from my laptop and then we agree” (Hamisi, Interview Data, lines 382-384).
In addition, he said that outside school he had colleagues who he was collaborating with.
He stated, “Anything I want, I will get from them, like exams they just post to me. I give it to my
boys … Wednesday this week I was doing a practical that was posted to me” (Hamisi, Interview
Data, lines 371-373). According to Hamisi, a teacher only need to identify the content area and
topic and other teachers respond through the Internet and share past examinations and other
learning materials.
Musyoka. Teacher Musyoka graduated with a bachelor’s degree in mathematics and
physics in the year 2000 and a master’s degree thereafter. By the time of this interview, he had
12 years of teaching experience that included five years as the head of the mathematics
department and the mathematics and physics teacher at Chui High School. He is also involved in
the Ministry of Education as an ICT champion teacher where he supervised six secondary
schools in his constituency focusing on training teachers to adopt technology in teaching and
learning. Musyoka taught mathematics to three different groups of students that included Form I,
147
III, and IV. The number of students in the three groups ranged from 40 to 50 students per class.
He told me that he had used technology to teach mathematics, but during the time I observed his
classroom, he did not use technology because the projector was broken. The following
discussion highlights Musyoka’s experiences and perceptions of technology in teaching and
learning mathematics.
Musyoka’s perceived and observed pedagogical practices. Musyoka told me that his
teaching philosophy is grounded in “learning how they learn”. He told me that he finds ways of
looking back and adjusting his instructional approaches accordingly to suit his students’ learning
needs. He found this approach challenging: “finding ways of making them learn is what interests
me … so that makes me a reflective practitioner. I have to find a way of looking back to what I
have done and being able to adjust them accordingly” (Musyoka, Interview Data, lines 34-37).
According to Musyoka, reflection and adjustment of teaching practice is guided by “what others
say” about the practice of teaching. He noted, “currently the emphasis is we move from being
teacher-centered, that is what was seen before … to interactions between our teachers and
students, and move to learner-centered” (Musyoka, Interview Data, lines 39-41). He felt that a
student-centered approach to learning was the best for him. He told me that he was making
efforts to practice this type of learner-centered approach in his teaching because he had realized
that this teaching method enabled students to become independent learners: “they become
independent; they don’t depend on anyone. They can learn on their own and therefore they are
able to learn everything, apart from the subject I teach. This is something I have picked from my
class” (Musyoka, Interview Data, lines 50-53).
Musyoka noted how technology had changed his teaching approach. He stated, “my
pedagogy cannot remain the same because I have a new tool that enables facilitation of learning

148
and therefore I have one or another to change from an instructor telling, telling everything”
(Musyoka, Interview Data, lines 357-360). Therefore, he needed learn how to use technology,
how to facilitate, and how to make technology be understood by others. He went on to tell me
that technology also guides “how to approach a particular concept because there are a number of
options, such as photographs, simulations, videos … sometimes using them for different session,
section, unit, makes me change, I cannot approach things the same way” (Musyoka, Interview
Data, lines 366-370). However, Musyoka noted that he had tried to cope with limited technology
skills and that this had caused him to delay how he had planned to implement technology in his
instructional goals.
Themes emerging from the data. In this section, I discuss the six themes from the data as
perceived by Musyoka. These themes include: technology training, availability of educational
technology and infrastructure, time, teacher characteristics, the Internet, and perceived benefits
of technology.
Technology training. Related to the training of teachers and how CEMASTEA had
handled the training of mathematics and science teachers, Musyoka told me that he was
dissatisfied with how the training program had been carried out. He told me that teachers
developed negative attitudes towards technology because “the employer used strong words ‘if
you don’t attend, it is equivalent to forsaking your job’. So people went there, but grudgingly”
(Musyoka, Interview Data, lines 188-193). According to Musyoka, that statement angered
teachers and when these trainings were started, teachers were coerced to attend the training
sessions. Thus, even though the teachers would go for the training, they were demoralized and
they developed negative attitudes towards the training.
149
Musyoka noted that teachers were not paid well and therefore they found the need to take
extra responsibilities that did not come with compensation. He stated, “teachers want to see what
monetary benefit ‘will I gain from this training’ and when they discover there is none, they
forget anything in the training. But the training is intended that it will make the teacher better
pedagogically” (Musyoka, Interview Data, lines 194-198). According to Musyoka, despite the
good intentions of equipping the teachers with classroom skills back at the schools, teachers
refused to implement the skills they had learned and they continued with the traditional ways of
teaching mathematics. He noted that teachers would say, “after all, everybody is going on with
their business as they have known how to, so why am I to do things a little different? Let me
continue with my normal life” (Musyoka, Interview Data, lines 202-204). Musyoka saw this
rigidity of not wanting to adjust to something new and different as the reason that the training of
mathematics teachers had lagged behind. In fact, he lamented that during the trainings that he
had conducted as an ICT champion teacher, “fewer attended the training and so forth ... some
have, some have done nothing after the training and so forth … but those were the people”
(Musyoka, Interview Data, lines 23-25) from about 10 to 20 schools. From Musyoka’s
experiences as an ICT champion teacher, there was evidence that despite teachers getting trained
on technology skills, they most likely were not implementing technology in the classroom.
One interesting point that was also mentioned by the other teachers interviewed was the
limited skills for the trainers. He told me that:
Most of the fellows who do the training are fellow teachers who are known by some of
these teachers and if they are known, some of them are known, even their grades are
known, their qualifications are known by their peers and their peers wonder which

150
authority these fellows or expertise these fellows carry to come and tell us what they are
telling us. (Musyoka, Interview Data, lines 207-212)
These trainers, according to Musyoka, had no idea what technology was about: “they think that
training teachers on Excel, Word – that will be sufficient for integrating technology in the
classroom” (Musyoka, Interview Data, lines 226-228). Musyoka saw that the technology skills
needed for adopting technology must be above skills in using Microsoft Office. When trainers
teach limited technology integration skills to teachers, then teachers would not find any benefits
of training. The technology trainers, according to Musyoka, were their fellow teachers who had
little or no qualifications to train mathematics teachers in technology. In fact, Musyoka stated
that the trainers had not carried themselves as exemplary teachers because during the discussions
with teachers, “they tell teachers something and when they have their normal discussion, they
would tell them ‘these things we were saying just for saying’ [laughs]. But they don’t themselves
practice what they are talking about” (Musyoka, Interview Data, lines 213-216). Thus, these
trainings, according to Musyoka, had remained a theoretical venture, whereas that was not what
they were intended to be.
Lastly, Musyoka noted that after the training the teachers were not mentored to ensure
they overcame the challenges that come with technology. He stated:
If the teachers are engaged further in class, in school, so that they have someone they are
walking with towards a particular pedagogical concept, which they need to work on, it
will enhance the program. But since that seems not to be there, follow-up seems not to be
there it disappears. (Musyoka, Interview Data, lines 218-222)
He implied that the technology implementation programs in schools were not pulling through
because teachers were not mentored after the training. According to Musyoka, the training

151
sessions are very short, often during school holidays, and teachers had no time to reflect on the
skills they had learned.
Availability of educational technology and infrastructure. When I asked Musyoka how
his school had supported him to integrate technology in mathematics teaching, he stated, “to
some extent there is infrastructure. Because there is infrastructure, at least I can use the
infrastructure in my own way” (Musyoka, Interview Data, lines 241-242). According to him, the
school did not have most of the educational technology he needed for his classroom activities.
He told me that he had purchased his own technology tools to use for educational purposes
because small things that one may ask from the school may take too long to be provided. He
noted, “Something I can do on my own, without involving somebody else, becomes easier to do
them than when I involve others” (Musyoka, Interview Data, lines 245-246). Musyoka implied
that having his own technology tools was convenient because the school would not provide such
technology when he needs it.
Musyoka stated that the school’s Internet service was down and the school was looking to
have it restored. But to ensure his work did not stop, he used his mobile phone to access the
Internet. When I observed his class, Musyoka had a smart phone that he used to record classroom
lessons so that he could reflect on his lesson at his free time. In fact, he sent me an e-mail
attachment of some previous class recordings he had saved on his cell phone that he wanted me
to listen to just in case I needed more data for my research.
In addition to smartphone, Musyoka owns a laptop and an Internet modem that he uses
for his classroom teaching. He noted, “basically all my lessons I have done on my laptop.
Though the school has its laptops in all cases, I don't think I have used the school's [laptop]. I

152
have used my own” (Musyoka, Interview Data, lines 395-397). I asked him why he does not use
the school’s laptop, and he stated:
One of the reasons that I have not used the school computer is it is not sufficient for all of
us. And the schools will give priority to the secretary to do the administrative duties with
it rather than for learning purposes. So it cannot be available for all of us. It is seems like
it is not enough, so we are competing for it. (Musyoka, Interview Data, lines 399-403)
According to Musyoka, the limited availability of technology resources was a problem that had
created competition of resources among the teachers and the administration. He went on to tell
me that the computer studies department was a hindrance to technology adoption. He stated:
I think the idea of bringing computers into the computer lab has also brought a wrong
impression; these computers are for teaching mathematics but they are seen as they are
for teaching computer studies. One subject instead of all subjects, which again is an error
and the teacher is committed to say he is in charge of this room and when the teacher is
not here, the room is locked and to access one has to really explain. (Musyoka, Interview
Data, lines 403-409)
Musyoka saw that there was a problem of accessing the computer lab due to the perception that
computers were meant for the computer studies department. The computer lab personnel
controlled the users of the computers at the lab. According to Musyoka, that was the reason he
had his own laptop so that he did not have to explain to anyone if he needed to use the computer
lab.
Musyoka told me that the issue of local digital content that was user friendly to Kenyan
mathematics teachers was required. He noted, “we may have presentations from elsewhere,
which therefore may discourage teachers from using other sources however open they are, but if
153
they don't sufficiently address my content and I want to make something I can quickly use, that
may not be very useful” (Musyoka, Interview Data, lines 468-472). Musyoka saw digital content
from elsewhere that does not fit the local curricula could discourage teachers from using
technology. He implied that local digital content may be required to encourage teachers to adopt
technology in the classroom.
Lastly, he told me that the infrastructure needs to be upgraded to keep pace with current
technological innovations because, “some of the machines we have cannot carry out something
because they are based on an older an outdated technology, so to say” (Musyoka, Interview Data,
lines 473-475).
Time. Musyoka was an ICT champion teacher, he had many obligations, and being the
head of the mathematics department left him with little time to prepare for technology-enhanced
lessons. He noted,
Preparation of these technology lessons takes time, which time I don't have. So you are
loaded with a lot of which you are in charge to look at. Therefore, technology sometimes
is missing given that we have begun working with technology as adults. So it comes as a
strange thing. (Musyoka, Interview Data, lines 315-319)
According to Musyoka, learning technology as an adult had brought challenges because more
time was required to prepare for technology-enhanced lessons. This challenge, added to the
responsibilities at schools, had made him lack time for technology lessons.
Teacher characteristics. Musyoka told me that along with mathematics teachers’ lack of
exploration on technology adoption strategies and phobia of technology, there was a general
tendency of being “very conservative”. He stated:

154
We want to do things the way we know how to do and technology has not been there,
and we also teach our subjects because we learned them in school, so we basically teach
like how our teachers taught us. And because we excelled with how the teachers taught
us, we think anybody would pass with how my teacher taught me and that is why because
my teacher never used the computer, never used technology, I have no business using
technology. (Musyoka, Interview Data, lines 375-381)
According to Musyoka, he thought that despite teachers having access to technology, rigidity to
change was a main reason why teachers had not adopted technology. To him, the beliefs of
wanting to stick to the old ways of teaching may hamper technology adoption.
The Internet. When I asked Musyoka how his smart phone had been useful to him as a
mathematics teacher, he stated:
It has been useful in very many ways - very many actually. I have had the opportunity to
look for out information from the Internet on how to use GeoGebra for particular concept
and my phone has helped to get that information by getting online. The same has enabled
me to prepare items in Google form where learners have participated in answering
questions online. And it has been because of my phone. The same has enabled me to
prepare lessons using Prezi software. It is the phone that has enabled me to do that.
(Musyoka, Interview Data, lines 270-276)
Musyoka implied that his smart phone had been useful in his classroom teaching, such as getting
online information. Besides he also used his smart phone to record his lessons. He told me that
when he gets time he listens to his lessons and reflects on how things went during his lesson with
the goal of making improvements where necessary.

155
Although the school Internet at Musyoka’s school had been down for some time; during
the time of this interview, he told me that he used his smart phone, Internet modem, and his
laptop to access the Internet anywhere. He noted through these tools, “you can see the teacher is
being able to be supported by getting information on how to manipulate particular aspects of
software in order to make learning richer. That is one way the Internet is a good resource is an
advantage” (Musyoka, Interview Data, lines 296-300). Musyoka saw the Internet as a rich
instructional resource for accessing downloadable learning materials where he was able to access
mathematical software, like GeoGebra, to use for his lessons.
In addition, he told me that the Internet was a major contributor to teaching and learning
mathematics because it enabled teacher-teacher collaboration and teacher-students collaboration
using “some services online, like doing Google groups; you cannot do them offline. You do them
online” (Musyoka, Interview Data, lines 302-303). He suggested that such a free service
enhances the teaching and learning of mathematics by bringing the convenience of shortening
the distance between different groups. He stated, “one sits at their convenience [own place] … to
access others or members of groups they are in, or the teachers for that matter. Discussions can
go on and assist other people because people comment on particular parts of that course”
(Musyoka, Interview Data, lines 305-308). He told me that this kind of collaboration can
accelerate team work and ensure teachers learn from each other, regardless of distance. In
addition, teachers would support students through the Internet faster and efficiently more so as
students would on their own.
Perceived benefits. When I asked Musyoka how he thought technology would support
student-centered learning, he stated;

156
In many ways … number one, technology concretizes what we call abstract learning.
There are some ideas that are difficult for a learner, which may require somebody else to
explain and visualize. But just an explanation by somebody else may not be clear to
them. However, if they are able to work with technology, manipulate some of those
technologies like a simulation, it is easy for the learner to see for themselves and
therefore the idea becomes concrete for them without remaining abstract. (Musyoka,
Interview Data, lines 55-61)
Musyoka implied that technology supports students to understand mathematics by way of
visualizing ideas. He told how recently he had used photographs in class when he was teaching
the concept of similarity. Musyoka reported that he picked photographs of boys and girls
separately and displayed them to the class. He asked the students what they were thinking about
the photographs. He told me that the students were excited to participate and that they were able
to make connections to similarity. Similarly, he told me that at one time students were working
on the concept of rotation and it was very easy for them to see and describe rotation about a point
and the angle of rotation using photographs.
When I asked Musyoka, if the Kenya Certificate of Secondary Education could be a
hindrance to technology adoption in mathematics, he claimed:
If a teacher focuses sometimes on thinking about examinations, they are likely to be
distracted and think technology does not work smoothly, but if one has to integrate, that
is using technology smoothly as if it is part of the material that should be taken to class, it
does not hinder. For me, it enhances coverage actually faster. In some cases, I have used
technology and covered a larger content in a shorter period of time until I have to take
time to assess … just take a break. (Musyoka, Interview Data, lines 103-109)
157
According to Musyoka, some concepts take a long time to teach before students understand but
with some display of technology that might shorten the time required to cover such topics. Thus,
Musyoka views technology as an enhancement tool that improves a lesson by making concepts
clearer aesthetically, and shortens time needed to teach a concept, and there is time to assess how
things went during the lesson. He felt that the teachers who get caught up in thinking about
students passing examinations are distracted from using technology to benefit students’ learning.
Musyoka had used a number of technologies for instructional purposes. When I asked
him about the technologies he had used, he stated:
I have used a number of technologies. GeoGebra is quite dynamic for maths and it is
actually useful in many instances because one of the things with GeoGebra is it can be
manipulated. It can also be animated … animations are particularly very impressive to
students. And when students see some motions it becomes more interesting. (Musyoka,
Interview Data, lines 112-116)
According to Musyoka, GeoGebra had enabled him to do animations and do manipulations. In
addition, he noted that he had also used Encarta software for graphical purposes. He stated: “I
have also used Encarta for graphical purposes … display of graphs. Some of the graphical
concepts we handle in class require that the teacher also displays a graph and has to be smooth”
(Musyoka, Interview Data, lines 116-117). He maintained that graphing on the blackboard has
limited space and does not have many options to choose from. He implied that technology has
options like color, font size, and unlimited graphing space and that makes students enjoy learning
mathematics. Musyoka also noted that technology saved him time and helps him draw smoother
curves than chalk and blackboard that would take long time to draw before a discussion can be
initiated. He also added that technology “can change graphs quickly, from one function to

158
another or from one equation to another and comparison is possible” (Musyoka, Interview Data,
lines 129-130).He implied that technology enables quick transition from one representation of
mathematical ideas to another.
Late Adopters of Technology
Shiro. Shiro had been a mathematics teacher at Mawingu High School since the year
2002, although she had taught at other schools from 1993 to 2002. She had a bachelor’s degree
in education, mathematics and chemistry option, and a master’s degree in statistics. She did not
use technology in mathematics lessons despite having substantial technological resources for
teaching and learning mathematics at her school. She told me she was aware of the benefits of
technology, but she would not implement it until late. The following is a discussion with Shiro
based on her views about technology in mathematics teaching.
Shiro’s perceived and observed pedagogical practices. When I asked Shiro what
motivated her everyday classroom practice she stated, “the students’ discussions; if the students
are receptive and they are willing to communicate … but if the concept is not sinking in,
sometimes I get a bit demoralized. I don't know how to simplify it” (Shiro, Interview Data, lines
10-11). Shiro noted that she enjoyed teaching and the feedback she got from her students
motivated her to keep going. She told me that she had different types of students each year and
changed her instructional approaches to suit their learning needs.
When I asked about her teaching style, she stated that she likes to balance between
teacher-directed and student-centered instructional approaches. She noted, “I feel that if it is
teacher directed, I will not be able to know if the child is getting what I am saying. Lecture
method, you know, the child is left with the problem” (Shiro, Interview Data, lines 222-224). Her

159
perception was that the lecture method leaves many unanswered questions for the learner, and if
some things are not corrected and clarified that is not helpful to the learner in the long run.
During my first classroom observation session in Shiro’s class I learned that her goal of
the lesson was to complete a revision question to prepare the students for an examination that
was coming up the following day. The teacher asked the students if they had any questions and if
they had any challenges in solving the given problems. The teacher dictated the following
question to the students: “A motorist travels from Eldoret to Nairobi, a distance of 300km. He
left Eldoret at 11am. It took 1.5hrs from Eldoret to Nakuru, which is halfway between Nairobi
and Eldoret. Draw a distance time graph. Find the average time” (Shiro, Observation Notes,
lines 12-16). I observed that the teacher did not solve this problem for the students, but guided
the students to solve the problem. A student volunteered to work on this problem on the
blackboard and she received support from the teacher and the students. The whole class noticed
and corrected any mistakes.
During my observations of Shiro’s classes, I noticed that students were enthusiastic,
jovial, and ready to learn mathematics. When I asked her how she had managed to get her
students to this level of excitement and motivation, she noted, “I guess …, you know, I
remember when I started teaching, they used to say that science teachers are very stone faced
[laughs], that they never smile, and all that” (Shiro, Interview Data, line 75-76). According to
Shiro, she managed to change this belief and ensured that her students enjoyed her mathematics
lessons. She noted that sometimes when she makes mistakes she jokes about it, and “they feel
free, even when they make a mistake; they are not shy. I try to make them know that we all learn
by making mistakes. They become freer. They feel secure” (Shiro, Interview Data, lines 79-82).

160
In this way, no student laughs at another student when they are struggling. She stated that she
had managed to create a learning community where strong students support weaker students.
When I observed Shiro’s class, I realized that students appeared confident when
interrogating other students’ work. I asked her during the interview how that worked for her
students and she told me that working in groups had enabled them to become better students. She
stated, “they need to go into groups and, you know in this group, I have arranged - this is a
strong child or average - so they can try to help one another (Shiro, Interview Data, lines 98-99).
Accordingly, she had tried to extend students’ group work outside the class for students to
support each other. However, these groups did not work as well as she would have liked. Shiro
attributed this to lack of time. She told me that students had complained to her that other subjects
hinder them from working effectively because they did not have the time. However, she also put
blame on herself and other teachers because they had not taken serious initiatives to follow up on
the students’ groups outside the classrooms. She suggested, “that may be the other way I can do
it … maybe in a lesson that is set aside for discussion, but I have never done it. I know it works”
(Shiro, Interview Data, lines 107-109). This discussion revealed that Shiro was an enthusiastic
teacher who was committed to her students’ learning. However, technology was not part of her
instructional goals.
Themes emerging from the data. In this section, I discuss the following themes as
perceived by Shiro: technology training, availability of educational technology and
infrastructure, time, teacher characteristics, the Internet, and perceived benefits.
Technology training. Shiro told me that she had received one in-service training session
on the use of technology at the CEMASTEA. She described the training as not very helpful: “It
was not that …, let me say it was not that, really expansive, but ..., let me say quite a number of

161
things I had already known even before” (Shiro, Interview Data, lines 29-30). According to
Shiro, the in-service training session was not different from the technology skills she had
acquired during her master’s degree program. She told me the training at CEMASTEA was not
initially intended for technology training because the training was dealing with teaching
methodologies and strategies to teach high school mathematics. However, she noted, “they
actually gave us those websites, but it is not like we really used them, but they just gave us. You
can go to this site and download this and that. But I did not use it actually” (Shiro, Interview
Data, lines 50-52). According to Shiro, despite the training she received she did not implement
the skills in the classroom.
When I asked who does the technology training sessions at the CEMASTEA, she told me
that “the training is done by other teachers who are like us, who were trained early. Now who
trained them? Actually, I cannot tell because the people who also trained them are also teachers
and some of them are heads of departments” (Shiro, Interview Data, line 148-151). Regarding
this, she told me that one of the senior teachers at her school was also a trainer. This teacher,
according to her, did not qualify to train teachers on technology skills. Shiro felt that the training
on technology was not as successful when compared to other in-service training sessions that did
not involve technology. Shiro did not think the trainers were qualified to train the teachers
considering they are fellow colleagues. Other participants in this study expressed these same
sentiments.
When I asked her about her technology skills and how she used in them in the classroom,
she told me that “unless Excel to add and subtract, what else? Or maybe PowerPoint to present.
But Word … unless typing and also typing the mathematical equations signs and all that” (Shiro,

162
Interview Data, line 162-163). Shiro felt that she did not have sufficient technology skills for
classroom use and thus does not use technology in her classes.
Availability of educational technology and infrastructure. When I asked Shiro what
technological resources she would like to have in her classroom, she told me that “maybe more
laptops and projectors. We only have one projector and I think each department has a laptop.
And you know I can go to class and I have a math class and another teacher has a math class.
There is that … maybe additional laptops” (Shiro, Interview Data, lines 144-146). According to
Shiro, the school had one projector and every department had a laptop. Amina, another
participant, also raised this issue, although in a different way. Amina stated that it would be
difficult for her to adopt technology in the classroom because she would need to move
technology equipment from class to class. She suggested that classrooms should be equipped
with technology.
Time. When I asked teacher Shiro if she gives class projects to her students she stated,
“No, as I was saying because of the syllabus – we cover the syllabus during the term, so not
unless we tell them to do a topic on their own – when they are going for holiday, you give them
an extra topic they cover from the textbook” (Shiro, Interview Data, lines 139-141). This,
according to Shiro, reveals how difficult it is to complete the school syllabus on time. She
implied that the syllabus has no projects. From her perspective, there was always a rush to
complete the syllabus because of the national examinations, and thus time was a limiting factor
for her to apply technology in her lessons.
Shiro noted that the 8-4-4 system of education in Kenya focuses on examinations. She
asked, “why waste so much time doing this when I can do it in a shorter time? And again the
syllabus, after all the exam will come like this. They will not be asked in ICT. KNEC [Kenya

163
National Examination Council] will not test that” (Shiro, Interview Data, lines 193-197). Shiro
felt that students would fail the exam if she did not complete the syllabus on time. She indicated
that it would be a waste of time adopting technology to cover the same topic she was required to
cover within a stipulated period of time. Some other participants in this study shared these
perspectives. The participants faulted the system of education for failing to provide them with
the option of giving quality education to the students.
In the survey questionnaire, Shiro noted that computerization of the mathematics
curriculum would eliminate the barriers of technology. When I asked what she meant by this, she
stated, “not the whole curriculum to be computerized, but some fields like the ones I am talking
about – three dimensions, those that are abstract. If they can become computerized, they would
become easier” (Shiro, Interview Data, lines 229-231). Shiro thought that computerizing some
topics in mathematics curriculum that were considered difficult for the students would enable her
to adopt technology in teaching mathematics due to the technology enabling students to
understand the ideas more quickly.
Perceived benefits. When I asked Shiro what she thought about students’ perceptions of
technology, she noted that students are very positive because they are always excited about new
things. However, she told me about the complaints from the computer studies department “that
that some students would go to the Internet. Sometimes he shows how to attach files and such
kind of things they start going to Facebook, you know, those kinds of things. There is that
problem” (Shiro, Interview Data, lines 116-118). According to Shiro’s perceptions, students’
access to prohibited Internet sites during class period is a problem. This view is consistent with
teacher Awiti’s perspective that during a lesson students are likely to access websites that are not
related to the lesson.

164
I asked Shiro about how she would have taught a lesson on linear motion that I had
observed her teach if she used technology. She stated:
If I would show them velocity – that these two objects are moving at a constant velocity –
so you know it is not accelerating it is moving at constant velocity. So anyway, I guess
there must be something in technology to show them, or even when it is accelerating, to
show them the speed is increasing but the acceleration is constant. They cannot see the
acceleration is constant; it is like drawing a line like this. They can see. I think this would
help them. Constant circles are more or less the same. (Shiro, Interview Data, lines 89-
95)
Shiro was hesitant when I asked her this question and she was not sure what to say.
However, from what I concluded, she had the knowledge of mathematics and was aware of the
difficult concepts that students struggled with. She told me that she would use technology to help
her students visualize these ideas. In addition, when I asked her how technology adoption in
mathematics lessons would change her students, she stated:
It will change them in the way they view issues. There are some things that look abstract,
and they will look okay. When you are talking about gradient and slope, you are seeing
such kind of things. Maybe when you are rotating and they can see. (Shiro, Interview
Data, lines 172-175)
Again, she described visualization of ideas as another aspect of technology that would help her
students to learn mathematics. When I asked her how she thought technology would change her
as a teacher, she told me the technology would make a teacher more prepared. She noted:
I think the teacher will now be getting more prepared in the lesson better. Because I can
tell you, you know I have told you, I have taught for 20 years. Now tell me I go to class
165
and I ask which topic and I go [laughs]. I will not sit to decide, I will approach it this
way. But when I have the ICT with me, I have to make sure things are working, and this
is how I am going to approach it, you know … Maybe it will just make us better
prepared. (Shiro, Interview Data, Lines 177-182)
Shiro implied that 20 years of teaching was a long time and that she was a very experienced
teacher in terms of pedagogical and content knowledge. She also implied that without technology
she would not need to prepare a lesson, because she has taught all of the curriculum and has a
repertoire of lessons. However, if technology was now available for her to use, she would need
to decide how to approach the lesson. Shiro explained how difficult it can be to teach some
topics without technology. She stated:
I am imagining when you are trying to draw that 3-D on the board it is not coming out.
You are telling them this is a rectangle, only that it is not right. You know when you are
drawing a pyramid you cannot draw it as a rectangle. But they have to do it as rectangle.
You know you are trying to go with something in class – teaching models. You can do
longitude and latitude, the plane, the North Pole, them seeing that if this is 20 degrees
west and this 160 degrees east is the same longitude. Such topics become very easy for
them [with technology]. (Shiro, Interview Data, line 185-191)
Shiro felt that teaching these topics using technology would make the work easier for the teacher
because students will be understanding concepts more clearly.
Teacher characteristics. The results of the analysis of the quantitative data showed that
male mathematics teachers are most likely to use technology compared to female mathematics
teachers in Kenya. When I asked Shiro if she agreed with that statement, she stated, “I think I
would agree in the sense that I find men more interested in what is happening, but us [women]

166
we are more contented. I find that it is very hard to be investigative. I think it is true” (Shiro,
Interview Data, lines 122-124). Shiro agreed that male teachers were most likely to use
technology in classroom compared to female teachers.
The Internet. When I asked Shiro if she had access to the Internet, she told me that she
uses the Internet for communication for private turoring, but not for teaching and learning at
Mawingu High School. She said that she is always on Facebook and checking her email.
According to her, “the school is equipped with the computers, the Internet is there. I am able to
browse when I want. I do it in the staffroom; there are four computers” (Shiro, Interview Data,
lines 71-72). In addition, Shiro was assigned the extra responsibility of registering students for
the Kenya Certificate of Secondary Examination (KCSE) using the Internet.
Shiro stated that she was familiar with online technologies for teaching mathematics:
Mostly we use Khan Academy. There is a website. The other I use is Google and I type in
the topic I want and I print. If I want geometry, I want transformation … I have so many
papers that I have downloaded. I don't key in on a particular website, but I get quite a
number of questions. But mostly I use them with those students [those she tutors during
holidays] (Shiro, Interview Data, lines, 36-40).
Shiro noted that she does use technology with International General Certificate of Secondary
Education (IGCSE) students that she tutors during holidays. She does not use these technologies
at Mawingu High School. However, she noted that these technologies can be good in introducing
a mathematics topic.
Awiti. Awiti graduated with a Bachelor of education degree in mathematics and
geography in 2008. After his graduation, he taught for a short time in a rural school until he came
to Nairobi where he had been teaching at Twiga High School for the last three years. In a typical

167
week during the school term, Awiti taught about 23 lessons, which included four geography
classes from Form one to Form four, and a Form one mathematics class. He noted that the
Ministry of Education recommends that a teacher teach 28 lessons per week; for him 23 lessons
were manageable. Besides being a classroom teacher, Awiti was also the school’s soccer coach,
patron for the journalism club, and the master of ceremony at the school on occasions. The
following discussion highlighted important views on how Awiti felt about technology adoption
in mathematics teaching.
Awiti’s perceived and observed pedagogical practices. Awiti stated that he believed in
assigning students a lot of homework questions to practice, besides making every effort to
complete the syllabus as early as possible to prepare his students for the national examination.
When I asked him about his teaching style, he stated, “basically, I always try to get attention on
the board and the best method that works is basically the lecture method where you explain and
you give them a chance to respond” (Awiti, Interview Data, line 31-33). This teaching style was
evident when I observed him teach the concept of ratio, rates, and proportion. He began the
lesson giving notes to the students, followed by examples, and then exercises for students to
practice in class. As the students worked on these problems individually, Awiti walked around
the class checking students’ work. Thereafter, he gave students opportunities to go to the
blackboard and work on mathematics problems. He insisted that students needed to explain their
answers to the class.
Awiti felt that peer teaching for students covering certain topics may indeed support
students in understanding mathematics. He told me that he does this because his language might
be advanced for his students, and that students may not understand everything he says. He stated:

168
“but when they sit together, two or three, they are able to understand each other” (Awiti,
Interview data, lines 44-45).
In addition, Awiti also believes in teacher collaboration in the classroom. This way,
certain teachers who are experts in teaching certain topics may work with students of other
teachers. He noted, “we do that at least three times a week, sometimes I invite him [a teacher] to
take a topic in my class and then I can take a topic in his class. We do a lot of interaction”
(Awiti, Interview Data, lines 227-232).
Awiti stated that his personal teaching goals include: (1) completing the syllabus as early
as possible, (2) giving students a lot of work to practice, (3) peer teaching for students, and (4)
teacher collaboration to support weak students and learn from expert teachers. Awiti also
believes in the lecture method teaching style where he leads the lesson, then partitions the lesson
in instances when students can work on mathematics problems on the blackboard.
Emerging themes from the data. In this section, I discuss the following factors related to
technology: technology training, availability of educational technology and infrastructure, time,
teacher characteristics, the Internet, perceived benefits, collaboration.
Technology training. By the time of this interview, Awiti had not yet received
technology training on using technology related to mathematics teaching. However, he told me
that when an interactive white board was installed at his school, he was trained on how to use it,
in addition to getting some training on digital literacy. When I asked him why he had not yet
trained at the CEMASTEA, he told me that his school had not been invited to participate in the
training. He stated that there is a conflict about the location of the school in terms of the county
government, and the educational officers had not resolved this conflict. That aside, in his
opinion, Awiti believed that the government had done minimal technology training for secondary

169
school teachers. He stated, “basically, I doubt if they [CEMASTEA] use [technology]. Basically,
they encourage the use of models – use of pyramid models, especially the use of three-
dimensional geography” (Awiti, Interview Data, line 70-72). I observed that Awiti had some
teaching models lying on the table in his office. When I asked him if he used the models, he
noted, “they help students to visualize more of the content. You can imagine you are trying to
draw on the blackboard and you are telling the students perpendicular height; it is a bit difficult
for us. They are for the teacher to demonstrate” (Awiti, Interview Data, lines 77-82).
Following up on this, Awiti told me that one reason that technology had not been
embraced in the Kenyan secondary schools is because most of the Kenyan government
employees were not conversant with technology. He stated, “we have just moved from our
government offices doing [things] manually and [with] analogue where you have a secretary and
an old typewriter and therefore, being agents of the government, very few people understand
computers” (Awiti, Interview Data, lines 235-238). Likewise, Awiti felt that the Kenyan teachers
were not ready to take up technology in the classroom because they had inadequate technological
skills. To address this problem, he said he would challenge the government to consider:
A top-down approach – train, integrate it in teacher curriculum. When you are training
the teachers, can you integrate [technology] in teaching mathematics so that mathematics
teachers, as they leave the school they can be able to, one, develop the content
themselves; two, they can be able to use technology themselves, so first of all they would
start with university, and they impart knowledge into them. Those who are in the field,
they should roll out the in-service training” (Awiti, Interview Data, lines 300-305).
Building on this, Awiti felt that the teachers graduating from the universities to teach
mathematics in secondary schools were not well equipped to use technology in the classroom. As

170
such, technology training could start at the universities. Reflecting on how teachers are prepared
at the universities, he noted:
Most of our presentations, we do manually, from the university. In the math curriculum
they just put one or two units; computer, but basically the content that they give is for a
computer science student and mostly it is very oral in form of a lecture. So that you never
dealt with a computer unless you have yours. Most of the young people who are coming
from the university are not equipped, mathematically they are not. They can use
[technology], yes, but mathematically they cannot. (Awiti, Interview Data, lines 357-363)
Awiti insisted that technology training for mathematics teachers should start during teacher
training programs and lecturers should also use technology. He stated that it is very difficult for
pre-service teachers to adopt technology in mathematics teaching coming from the universities
with limited technological skills. According to him, a pre-service teacher may have technological
skills but those skills are not related to mathematics teaching. Additionally, these teachers when
they go to the schools are already struggling with other pedagogical issues. He noted:
[a pre-service teacher has] been taught how to plan for a lesson, but practically it is on
paper. He has been trying here and there managing these times, following the schemes of
work, covering [the syllabus]; that requires a lot of time, [and] is a bit of a challenge. So
he does not know how to balance all that. Again, if you introduce a new concept in
[technology], I think it will be a struggle for him. (Awiti, Interview Data, lines 407-412)
That is what he called the balancing act. These challenges further complicate younger teachers’
decisions to use technology in mathematics teaching at the secondary schools. When I asked
Awiti how he had grown as a mathematics teacher since he started teaching, he noted:

171
You know at the university we would do advanced calculus, complex analysis – most of
which we do not apply here. Mostly you don’t use it in daily life, and also you don’t
teach it. So that all that disappears, but this guy has gone so advanced, very fast
knowledge, but now that fast content that he knows here (points to head), areas of
difficulty to this young learner – he does not have that. (Awiti, Interview data, lines 382-
395)
Awiti felt that the advanced content courses in undergraduate mathematics courses do not matter
so much. According to him, the most important thing is for teachers to understand the
mathematics that students learn at high school and the areas of difficulty that students encounter.
He stated that a pre-service teacher would need at least two years of teaching experience to
become a better teacher, and introducing technology during this “trial” period would be a
struggle for the teacher.
Availability of educational technology and infrastructure. Awiti’s school had a computer
lab that was used by students to study computer as a subject. He told me that until recently the
school had very few computers and some were very old and not functioning, and this
complicated the teaching and learning of the computer lessons. For this reason, the lab became
very unpopular among the students and the teachers as well. The students were not motivated
and thus “they opted for other subjects like music and other options like agriculture and
business” (Awiti, Interview Data, lines 101-102). He told me that improved after a donation of
60 computers from a benevolent organization.
Awiti implied that the old computers were not that bad. In Kenya, he noted, there were so
many schools that did not have computers and he suggested that if somebody donated such
computers to these schools to some extent that would support teaching and learning. According

172
to Awiti, “investing more in the provision of computers for schools and hardware is required for
teaching math” (Awiti, Interview Data, lines 313-314) in Kenyan secondary schools. Awiti noted
that there was a general lack of digital content for educational purposes:
Very few materials are being produced for educational purposes so that even the heads
and teachers don’t know what there is. We are not able to use them because, one, they are
not there, and two, we don’t have enough resources so we will not start going to invest in
the unknown. (Awiti, Interview Data, lines 251-255)
Awiti noted, “you try to check, especially the Kenyan curriculum; if you look for what others
have done, it is difficult so that you have very few points of reference … that you can base your
work and time involved in preparation” (Awiti, Interview data, lines 133-135). He felt that in
schools mathematics teachers and technology experts can develop digital-content materials and it
should be made mandatory for the teachers to adopt. Awiti stated that a lack of digital learning
materials would probably make teachers spend more time preparing a lesson because there
would no point of reference.
In addition, in the mathematics content area, for example, Awiti noted that for some of
the software that they have been trained on, “most of the concepts that were there were for lower
grades of students, like the younger ages, like drawing curves. We want very accurate curves,
those ones would draw a bit inaccurate curves” (Awiti, Interview Data, lines 137-142). He
suggested that teachers need to be trained on some “special software” to make work easier, for
instance, the abstract areas in graphing:
Graphing, when you are using visual, is better than blackboard because you will be able
to label correctly but then, personally, I don’t know how to draw a graph if I insert it …

173
somewhere here, real life and you wanted to draw a graph. I don’t know how to
accurately plot and draw a graph. (Awiti, interview data, lines 143147)
When I interviewed Awiti in his office, he tried to show me the challenges he had encountered
trying to copy-paste a video to Microsoft Word on his computer. When I asked him what
software he was familiar with he replied, “the basic Microsoft Word. I don’t know any other
apart from this software I have worked with that can do mathematical programs. And you realize
that this is a bit clumsy, you cannot insert a video that is not done by using Windows” (Awiti,
Interview data, lines 150-152). Because of these challenges he told me that he does not use
technology in his classroom activities.
Awiti’s school had a computer lab and he also had access to the lab for his mathematics
class as long as it was not in use by other teachers and students. However, he told me there was
an impression among the teachers that the computer lab was for the computer department. He
stated, “the computer lab is used for the computer subject. Computer is compulsory in Form one
and two … so the computer lab is mostly for computer students” (Awiti, Interview Data, lines
86-88). Other participants also mentioned their computer departments as being a hindrance to
technology adoption in mathematics teaching.
Time. Awiti noted that Kenyan mathematics teachers had not embraced technology for
many reasons. One thing that had worked against teachers is the focus on the results of the
national examination:
If my students don’t perform well because I was planning to teach them well [using
technology], then I am regarded as a failure. You might use technology and you know
quality-wise these students can do a lot, but in the exam you did not get that A, that other
174
students who got an A … are regarded as better students than these ones who know a lot
all around. (Awiti, Interview Data, lines 241-242)
Awiti stated that at the end of the day schools try to excel in exams more than quality teaching:
“focusing on exams, you can imagine, you are told to teach the syllabus, and complete a Form
four syllabus of about 12 topics by term one. You really need to rush” (Awiti, Interview Data,
lines 435-438). He implied that time was not available to do other things besides finishing the
syllabus.
Awiti did not use technology in mathematics teaching at all because he felt that there was
no time for preparing technology-integrated lessons: “It is a bit difficult; it is easier when you are
doing texts than when dealing with numbers, inserting fractions; you are a bit slow in doing that”
(Awiti, Interview data, lines 120-122). However, he noted that he uses technology in teaching
geography: “Basically, I use it more for geography, geography, like doing photography work;
that one I use it a lot … I use it mostly, explaining some of these concepts is a bit difficult so
viewing them would be easier” (Awiti, Interview Data, lines 109-113).
Before I observed the class that Awiti taught, I had an opportunity to talk with another
teacher who taught business studies and mathematics. This teacher told me that the use of
technology in mathematics teaching will not be possible because the syllabus is very long and it
needs to shorten to facilitate the use technology in the classroom. The teacher asked me to look
at the IGCSE syllabus to see how well technology had been incorporated in mathematics
teaching. He alleged that geography and other non-mathematics courses could use technology,
but there was no time to put numbers and formulas for the KAMAU and at the same time finish
the lesson on time. Awiti confirmed this when he told me that there was no time for technology
use in mathematics teaching.

175
Teacher characteristics. When I asked Awiti whether the age of a teacher is a limiting
factor to technology use, he stated, “Yes, yes. The older are usually unreceptive to change. I have
observed that through teaching. In fact, like the training we had here, anyone who wants to be
trained on computers? No, they don’t want that time—the older teachers” (Awiti, Interview data,
lines 346-349). He felt that older teachers are preoccupied with other things in life and they
would not be willing to get newer ideas. He compared older teachers with younger teachers who
he thinks are very innovative, explorative, eager to learn new concepts, and therefore likely to
adopt technology as compared to older teachers. However, he did not think that younger teachers
fresh from the university were well equipped with technology skills for teaching mathematics.
He noted that because the government had stopped employing new teachers, there were more
older teachers in schools than had been: “The older generation is more and more in schools and
the younger generation are very few” (Awiti, Interview Data, lines 421-422). Awiti stated that
government only fills the gaps left when a teacher leaves the profession, thus, increasing the
number of older teachers in schools. He felt that with the increasing population and the need for
technology adoption in education, the government has to be forced to employ new teachers.
Awiti thought in-service training was the solution to this problem. He felt that teachers
below the age of 40 were willing to get trained on technology, but “those above 40 are not
willing to learn, will refuse” (Awiti, Interview data, lines 427-428). He saw the solution to this
challenge is to “do some in-service, introduce it, implement it, and make it mandatory to
curriculum” (Awiti, Interview data, line 430). In this way, he noted, “if you don’t do it, you don’t
qualify to be a teacher. You are not offering what is required of you; you must make it
mandatory compulsory for them to be able to use it” (Awiti, Interview Data, lines 431-433).

176
Perceived benefits. When I asked Awiti how he felt about the benefits of computer-based
instruction in mathematics teaching, he stated that he had some reservations about the use of
technology in the mathematics classrooms. He believed in a “50-50 approach [half of the time]”
where there was no break from the manual way of instruction. He told me that mathematics
requires a lot of explanation and contact during instruction. According to Awiti, it is possible that
in a technology-integrated lesson a student may find a concept that is abstract, and most likely
the student would veer off from the lesson to start doing other things that are not related to
mathematics learning. He also felt that technology makes students omit a lot of work when they
use calculators either in the examinations or for class assignments. He stated, “most of them feel
‘if I can key in the values and give me the correct answer then why should I struggle, showing
how I worked it.’ So it is a big problem we are facing currently” (Awiti, Interview Data, line
284-286).
In addition, in his school students were not allowed to use the Internet. According to
Awiti, “if they were allowed, they might, I believe they would, also increase their knowledge
ability and widen their scope of learning” (Awiti, Interview Data, lines 185-187). Elaborating
why the Internet was controlled for students, he told me that the school did not have software
that limited websites that students could access and thus they were only allowed to use the
Internet when a teacher wanted to illustrate something. He told me that he was aware “of the
negative information [students] can get from [the Internet], which needs a lot control” (Awiti,
lines 195-196).
Awiti noted that he liked technology because he had seen how it made work easy for
people. He gave me an analogy how architects do not draw with pencil anymore because they
use technology and that makes their work very easy. He noted, “I believe that if I can be able to

177
manipulate things using technology, then why should I struggle to manually use the chalk and
dust and the paraphernalia, if you can be able to do that personally?” (Awiti, Interview Data,
lines 262-265). In addition to this, he also thought that “graphing using visual [technology] is
better than blackboard because you will be able to label correctly” (Awiti, Interview Data, lines
143-146).
The Internet. Teacher Awiti told me that although he had a mobile phone, he did not use
it to access the Internet because his school had fast and reliable cable Internet. However, he told
me he did not use the KAMAU technology at his school for mathematics teaching, but he used
the Internet on the computer to “download more practice questions from the Internet” (Awiti,
Interview Data, line 115). He also used the Internet in browsing, and for social media. In fact,
when I interviewed him I observed that he had a Facebook account that he used to keep in touch
with his friends.
Awiti stated that the Internet has a bigger role to play in the sharing of knowledge in a
school community. He noted, “If I can be able to network the computers, I will simply tell the
students ‘Can we go to the open a certain folder?’ and I place an assignment there” (Awiti,
Interview Data, line 177-181). Elaborating on this, Awiti stated that in some curricula he had
seen online exams and assignments for students. He even illustrated to me how it was possible to
find a child aged 12 years, who could type documents, and use the Internet to get online content
on their own. Awiti felt that this actually could increase the scope of learning for a student. He
thought that the Kenyan system of education needed to change from the exam-oriented type of
system to one that embraces quality education for all students.
Related to the work of a teacher, he believed that the Internet was an “area that clears up
some of the abstract concepts. If I dedicate myself into researching into it, then it will make some

178
of the concepts easier” (Awiti, Interview Data, lines 181-183). Awiti stated that the Internet will
make students become more knowledgeable and thus the teacher will need to do more research
including online courses to go beyond what students know.
Awiti noted that through the Internet, “I can share a concept I taught. Another teacher can
do that – place it there and they can also be able to benefit from the content that has been done
by somebody” (Awiti, Interview Data, lines 178-180). For instance, he stated that he knew of a
teacher who was very good in doing graphs using technology, though he had not had time to go
and learn from him. He stated, “I don't know how he was doing his graphs. There is a graph he
forwarded to me that he had drawn very, very well; that one I would have loved to learn” (Awiti,
Interview Data, lines 156-157). According to Awiti, the Internet may enable teachers to
collaborate online by sharing mathematics content and ideas for teaching mathematics.
Summary. In this section I have discussed Awiti’s perspectives on the Internet, the
efficiency of technology, and a comprehensive technology implementation policy. It is very clear
that Awiti viewed the Internet as a teaching and learning resource, particularly in downloading
practice exams, teacher collaboration, sharing of knowledge, and research. However, Awiti felt
that Internet control may be necessary to control inappropriate content that students may access
from the Internet. Awiti also views technology as an efficient tool that can support him make
work easier and support students’ visualizing of mathematics concepts.
Amina. Amina graduated in 1998 with a bachelor’s degree in education, mathematics,
and chemistry option. She got her first job in 1999 to teach at a girls’ school in the Coastal region
of Kenya. She worked there until 2006 when she was employed at the Mawingu High School – a
girls’ school also. When I first met Amina, she talked of how proud she was because her
students from the 2012 school year had scored straight A’s in the national examination. The

179
following discussion highlights important views on how Amina feels about technology adoption
in mathematics teaching.
Amina’s perceived and observed pedagogical practices. During my interview with
Amina she stated how she worked hard to become a lawyer and how she sadly missed the
admission into law school by one point because she did not pass her English examination at a
high enough level. She was then admitted to a university to prepare for a career in teaching. She
stated, “I was so sad. I felt the worst thing, ‘Now a teacher!’ So I decided, ‘Fine, this is what you
want me to do? Go for it!’ … I decided in the classroom, ‘I can mold this life’” (Amina,
Interview Data, lines 29-35). According to Amina, she did not want to become a teacher. She
was forced by circumstances beyond her control and she had no choice but to accept it.
When I asked what her teaching philosophy was, she stated that she has learned to
motivate her students to overcome social and life challenges so that the students could exceed
expectations and become self-reliant citizens. According to her, she had a great passion for the
girl child in mathematics learning “because it will open doors” (Amina, Interview Data, line 10-
11) for her. According to Amina, success in mathematics may lead to great careers for these
students.
She described the type of students she gets from primary schools: “They are great
children. They got A’s in primary [on the Kenya Certificate of Primary Education exam]; I want
them to leave this school with an A” (Amina, Interview Data, lines 43-44). Amina noted that
students are lucky to be in that school, “in case they forget who they are” (Amina, Interview
Data, line 48). She stated that most of the students in this school come from poor families and
they need support to become successful in school. She mentioned prominent Kenyans who had
graduated from Mawingu High School in the past and now they dominate numerous professional

180
fields in the country. She attributed the success of the former students to the high academic
standards offered by Mawingu High School. She stated, “When they arrive in Form one I ask
them, ‘What do you want to become?’ Then they say, ‘Surgeon, analytical engineer, lawyer,’ just
the professional jobs” (Amina, Interview Data, line 35-40). Amina stated that she guides her
students to ensure that they achieve their goals in life. She teaches them well how to succeed.
She noted that she loved teaching mathematics and that is why she had voluntarily taken part in
the interview. In essence, her students were the driving force that had sustained her in the
teaching profession and that she would want them to become successful in life.
She also told me that she teaches her students good character: “I tell them, ‘I want two
grades, one A of grade and one A of character because if you only have one A of academic grade
then the other grade will destroy this other one’” (Amina, Interview Data, lines 44-47). Amina
noted that she emphasized discipline because “Math is about discipline; when a class is
indiscipline the most affected subject is math. Any class I teach, the level of discipline is very
high” (Amina, Interview Data, lines 98-101). According to Amina, her main goal is to teach
mathematics and also take time to advise and guide her students for them to become successful
in life. This is consistent with what I observed in her two mathematics classes that she taught;
students were jubilant to see their teacher that morning and they all stood up, greeted her, and
they welcomed her for the math lesson. She appeared to have good rapport with her students.
Amina stated that she had managed to convince her students that mathematics is the
“master key” in life. She noted that they have a saying in other classes to “run away from math at
your risk” (Amina, Interview Data, line 66). According to Amina, when students look at her they
think she is their future. Amina noted that prominent institutions are awash with exemplars
where professionals use mathematics:

181
I give them an example of IEBC [Independent Electoral and Boundaries Commission],
and the lawyer who was defending IEBC had to have knowledge in statistics whereby he
could defend the statistics. He could come and say “This is it.” That is a lawyer. Some
students here say, “I don't need math in law.” Here is a very open case where a lawyer
needs math” (Amina, Interview Data, lines 66-72).
This is one example of the real life stories Amina tells her students. She told me that when she is
teaching mathematics she tells stories to her students to get their attention, to develop a
relationship with them, and to relate mathematics to real-life situations. She noted, “Math is quite
detailed, and I tell them these careless mistakes will kill a pregnant woman who is giving birth. If
you make a mistake, the woman will die and the child. We cannot allow you to be a
mathematician, to be a careless doctor” (Amina, Interview Data, lines 73-76). According to
Amina, mathematics requires a meticulous mind that requires a good mastery of details.
In the class setting, Amina told me that she had a classroom representative for some time
now so that whether she goes to class or not, mathematics learning does not stop. She told me
when she delays coming to class, “that child stands up and corrects the work, finds out where it
is difficult and they do the problem on the board. They present themselves and the class goes on”
(Amina, Interview Data, lines 86-90). According to Amina, she intends to make mathematics
learning as learner-centered as possible. When I observed her teaching, I noted that she rarely
completed a mathematics problem for the students because students do most of the problems.
She attributed this to the strong academic abilities of her students. As she described this to me,
she reminded me that there are many ways students can solve a mathematics problem: “I let them
beat me [compete with me] so they come up with formulas and all solutions so that makes it easy
for me. At least I give them the foundation they can learn” (Amina, Interview Data, lines 94-95).

182
She stated that her goal was to completely implement these ideas into her classroom practice. I
can confirm this from when I observed her teach one of the lessons. She let the students work on
the problems on the blackboard and kept on probing them to explain their procedures. Amina
noted that if she lets her students explain their ideas on the blackboard, then she “creates”
teachers, the class becomes more united, and students do not rely on her to learn mathematics.
When I asked her if her teaching style has had any relationship on the performance of
students’ performance in mathematics, she responded in the affirmative:
I have been able to prove to them that math is not difficult. So if it is not difficult, it must
be passed. So in their mind they know, “I cannot fail math; it is easy.” Second, they know
that math is a master key. A master key opens or locks all doors. If they fail, they fail;
they have locked all doors, and if they fail math they know I am about to lock my future.
(Amina, Interview Data, lines 106-110)
Early in the interview Amina had noted me that about 76% of the students at Mawingu High
School scored straight As in the 2012 KCSE results in mathematics. That is exemplary with
regards to any standards and I can confirm this was true from my conversation with the head of
mathematics department and the results that were posted on the school’s notice board.
Summary. This section highlighted teacher Amina’s instructional goals. These goals
included: (1) supporting students to overcome social and life challenges, (2) students’ peer
teaching, (3) performance of mathematics in the national examination, and (4) teaching
mathematics as a subject relevant in the students’ career goals.
Emerging themes from the data. In this section, I discuss the following factors related to
technology: technology training, availability of educational technology and infrastructure, time,
teacher characteristics, perceived benefits, and policy.

183
Technology training. Amina has attended and received professional training at
CEMASTEA since the time of her first teaching job, over 10 years ago. She noted, “There is this
government project, Strengthening of Mathematics and Science in Secondary Education
(SMASSE), that is trying to teach others how to teach math and using computer. It has been
there for a while; sometimes we go during the holidays” (Amina, Interview Data, lines 124-127).
Amina stated that she had received training on technology during the school holidays, where she
has trained to use “PowerPoint, how to use YouTube, to get some questions, drawing of graphs”
(Amina, Interview Data, lines 128-129). Despite having been trained, I did not see her using
technology during the lessons that I observed.
She told me that the kind of training Kenyan teachers get from the government had been
received with disapproval by the teachers:
We have told them that it cannot work. They know. Can I speak the truth? Because some
people are eating [benefitting financially] from SMASSE, the project would rather go on
but not achieve its objectives. We have told them the mean of mathematics [of students’
exam scores] before SMASSE was 2.0; 10 years after SMASSE is still at 2.0. The project
has failed. Why continue and there is no improvement. It is because it is funded and there
is ... money! So that it continues even with very negative teachers. They have not won us
in their project and therefore cannot be implemented. (Amina, Interview Data, lines 206-
213)
She added that during these training sessions, she sometimes would go to sign-in, or walk out of
the training sessions to talk to a friend. Amina appeared visibly irritated when she described her
training experiences. According to her, these sessions were held during the holidays when she
wanted to be with her family or tutoring struggling students in mathematics to gain extra income.

184
She stated that many Kenyan students have difficulties in mathematics and sciences and it is
during the holiday sessions that teachers help these students and the parents pay them some
stipend:
So when you call us for an in-service where we are not earning, and we are also
underpaid, we are about to go on a strike again [Kenyan teachers went on strike June
through July 2013], then you are telling me to go for an in-service when I can teach there
and get KES 10,000 per day, I will be negative. So, I would rather be left alone [laughs].
That is a way of taking the money away from me and the salary I get; I deserve a holiday.
I don't want projects; we don't earn a single cent and they are being forced on us. (Amina,
Interview Data, lines 221-227)
She stated that teachers need to be well compensated when they attend these sessions, and take
the teachers to high-end hotels (where they take everyone else), and bring qualified facilitators
who are well trained.
She told me the facilitators who had trained them before were selected through nepotism
and they had no clue about technology. When I asked her whether the facilitators she was
referring to were technology trainers, Amina stated, “Yes, they are not trained themselves; some
are total blackouts. So when they come, they don't know what to do. They start depending on the
same teacher to tell them what to do, so we don't take it seriously” (Amina, Interview Data, lines
236-238). According to Amina, because the trainers were not well equipped with technology
skills, they depended on the teachers attending the training for support. She added, “At the same
time, we have the challenges of the principals and the head teachers who are also not computer
literate. Then the chairman of the district committee, they have no idea what we are talking –
math taught using computers” (Amina, Interview Data, lines 260-263). Amina stated that a

185
senior teacher in her school was among the trainers at CEMASTEA during the school holidays
and she was aware the teacher did not have adequate technological skills to qualify to be a
trainer. Shiro had discussed a concern about the qualifications of the trainers also. For these
reasons, Amina stated that she did not have any motivation for going to the trainings, and if she
went it was only for appearance.
Availability of educational technology and infrastructure. When Amina described why
she had not used technology to teach mathematics despite having some training on technology
use, she stated, “there is no projector and there are not enough computers” (Amina, Interview
Data, line 130). When I observed her teaching, the classroom did not have any technological
resources or infrastructure. She stated that there were 20 lessons per day and the school has 25
classrooms; Amina noted that it would require enormous resources from the school to acquire
computers for these classrooms.
During the time I was at this school, I realized that the school had a huge computer lab. I
asked Amina if she knew what went on in there and she stated:
Well, we have never even bothered. I hear that they teach computer literacy and it is
mainly for the computer department, and maybe they would not want any other
department to interfere. Because you bring some information in a flash disk and they
bring virus and they complain and I don't know what … To avoid all that, stick to your
piece of chalk and textbook. So going there, starting to request and they also have
[inaudible] because every class learns computer in this program, so it is like every lesson
there is computer; when will the math teacher now come in? (Amina, Interview Data,
lines 155-162)

186
From Amina’s perspective, the computer department at her school was a hindrance to technology
adoption for mathematics teaching. First, she noted that the lab is very busy because all students
in the school are required to take a computer class in the lab. Second, there are fears of people
infecting the computers with viruses from flash disks and this makes them to stay away from
using the computer lab.
Amina, in reference to a government project that aimed at implementing laptops in
primary schools, provided an interesting view of rural schools and how they may end up
struggling with technology adoption;
There is no electricity in this country, leave alone power, food, and some areas, not all
areas, there are no schools. Children are learning under a tree. Where there are
classrooms, there are no windows. Where will these computers be stored with insecurity
in this country? When they see that you are taking computers to the room, thieves, no
electricity, nothing. (Amina, Interview Data, lines 240-245)
Thus, Amina saw a huge challenge for technology adoption in the Kenyan schools. She
wondered how primary school teachers who most likely had not seen a computer before would
embrace technology in teaching. According to her, there was a need to ensure all schools had
electricity, secured classrooms where computers can be installed, and teachers trained to use
computers.
Time. Amina gave me varied reasons why she had not adopted technology in her
classroom activities, some that I will discuss later in this chapter. But one thing she stated was
that, “the main reason why we don't bother, and me as a person, is because Kenyan National
Examination Council (KNEC) does not require me to do it. And KNEC cannot measure whether
I used a computer or not. You will just see the A’s [Mawingu High School] has got” (Amina,

187
Interview Data, lines 150-153). Amina does not see the need to use computers because the
students at her school do well in mathematics and the examination body in Kenya does not
require that teachers use technology in mathematics teaching. Building on this, Amina noted,
“the exam comes from the Kenya examination council. It has nothing to do with computer. After
all, I will be measured with the A’s I get. How I get them, the end justifies the means. And I have
been getting A’s without computers” (Amina, Interview Data, lines 145-147). Additionally,
although her school encouraged teachers to use technology in the classroom, she told me that
teachers were aware that it is not necessary to adopt technology in teaching because KNEC does
not examine it.
Amina stated that even though technology may be available at her school there is
basically no time to set it up. She noted, “I have 28 lessons in a week so before you set the
projector and you do, that is time for the other class. Then with all that, then you carry from this
one. Sometimes I have six to six lessons. Unless now it is a room where teachers – this one
comes, they go, this one comes they go – then carrying it the same number of classes and
lessons” (Amina, Interview Data, line 130-135). According to Amina, carrying all the technology
from class to class and setting up it would be difficult because she had many lessons in a day. In
Kenyan schools, the students stay in the classroom and the teachers move for different lessons.
She suggested that a classroom having the technology ready and working would benefit all the
teachers and save time. She also mentioned that finishing the syllabus using computers could
take a long time: “Finishing the syllabus using the computer will take forever” (Amina,
Interview Data, Lines 226-257).
Even without using technology, when I observed Amina teach the second lesson, she
struggled to finish the lesson because of time. She did not use technology and the lesson was

188
scheduled to be 40 minutes. I observed that she was quick to clean the board when most of the
students had not quite finished writing the solution to a previous problem that was written by a
student. She appeared to be in hurry. At around 10:40 am the bell rang, but Amina was still
dictating a question to the students. Amina drew two circles and the students seated next to me
wondered what she was drawing. I observed that there was just no time to finish and summarize
her second lesson. Amina’s perspectives on time that she expressed during the interview coincide
with what I observed during her second lesson.
Teacher characteristics. Amina stated that despite many challenges that prompt teachers
to not use technology, a lack of interest in technology also inhibits teachers from adopting
technology: “I am going to be very sincere; the interest is not there. You know this better. I have
not seen anybody with interest. The saying that you cannot teach an old dog a new trick; we are
not old but it is hard” (Amina, Interview Data, lines 136-137). According to Amina, it is not age
alone that hinders teachers from using technology, but also that teachers do not like new things:
“I would rather stick to my book, go teach, just stick to the old methods of walking in the class
having nice time, stories, teach, go, and [the] main one is where will they use it?” (Amina,
Interview Data, lines 139-143).
Perceived benefits. Amina felt that technology was a hindrance to students’ learning. She
told me that students would not think anymore if they used technology to learn mathematics:
Just key in and the computer does it for you. That, according to us, there is no learning.
The child does not know how to draw a graph. The computer is telling you this is what it
looks like. Filling the table, the child must know if learning must take place. This is
another way of learning math. The equation, the computer solves it for you. So how will
the child learn, and these are teenagers, once they know there is a loophole for just keying

189
information and everything is done for them, they will never learn, and math is not easy
and children don't like math. If they can get a loophole, if I take them to the computer and
the table is drawn for them, then makes a green paper or white and they fill the table the
two are not [inaudible] so, … the child is interested in the way it looks and going about it
… unless now the testing in math changes; math is about method. (Amina, Interview
Data, lines 166-177)
According to Amina, if a student used technology to learn mathematics, technology cannot
explain the process; the most important aspect of mathematics is not just answering a question
but how to do the problem. According to her, a teacher, unlike a computer, has an opportunity to
ensure a student completes mathematics problems and the teacher can find out who is “doing”
and who is not “doing”, the proportion of students doing the problems, and the proportion not
doing the problems. She noted, “Because it is that skill of doing that makes them good doctors,
that thing of just being tough, being careful that this is negative and this was positive, that is
what they will transfer in their progression in their daily life. It is not tap, tap ...” (Amina,
Interview Data, lines 184-187). She noted that this was the reason she did not bother about
adopting technology in her teaching profession.
I asked Amina if she had discussed issues about technology with her students. She told
me that she had discussed with students and it was exciting. However, she was not able to
explain to me in detail, as she stated, “maybe due to lack of exposure, I don’t know what I am
saying” (Amina, Interview Data, line 192-193). Amina’s professed lack of exposure to
technology implied to me a limited understanding of how students would benefit from using
technology to learn mathematics. In addition, she added that technology lacked the aspect of
explaining mathematics procedures. She noted, “I will require them even do it manually to tell

190
me why, show me how” (Amina, Interview Data, lines 201-202). Thus, according to Amina the
student should learn how to do, whereas if they used technology everything will be done for
them. Thus, she would require her students to show how and why even after using technology.
During my initial visits to Mawingu High School, to introduce myself as a researcher and
a doctoral student in the United States, there was excitement among the mathematics teachers
because they thought I could train them on how to use graphing calculators they had acquired
from the US, which they did not know how to use. However, that did not happen and when I
asked Amina about these graphing calculators, she stated, “they [her colleagues] don’t want
advanced ones because they will draw graphs for them” (Amina, Interview Data, lines 272-273).
She told me that these graphic ones will do everything for the students but if they needed them
for leisure, then the teachers would take them to the students, not for learning mathematics.
Answering Research Question 2
This section answers the following qualitative question: How do the factors related to
technology adoption influence: (a) the early adopters’ decisions to adopt or not to adopt
technology and (b) the late adopters’ decisions to adopt or not to adopt technology? The
quantitative phase revealed six explanatory variables related to technology adoption in
mathematics teaching in Kenya. The results revealed that the predictive power of explanatory
variables on technology adoption ranged from most significant to least significant in the
following order: in-service training, age of a teacher, educational technology in general, school
type, Internet at home and school, and discussions about technology.
Research Question 2a
The early adopters of technology had an average teaching experience of 18 years. They
all had graduate degrees. One of them taught in a national school and the other two taught in

191
county schools. They had all adopted technology for their professional work and personal life.
Regarding students’ learning, these teachers felt that technology could help their students
understand difficult mathematics topics like three dimensional geometry, longitude and latitudes,
and loci. Hamisi noted, “With the [technology], that picture is brought right in their face”
(Hamisi, Interview Data, lines 346-349). These teachers believed that technology enhances
visualization of concepts for students and bring reality in mathematics.
In-service training. These teachers acquired their technology training mostly during their
undergraduate or graduate studies and through the government training programs (e.g., through
CEMASTEA). However, they mentioned that despite the technology skills they had acquired,
they still felt unprepared to adopt technology in their teaching. They noted that the type of
government training they had acquired was below their expectations because technology trainers
were not qualified, and teachers were trained on technology skills they already knew or they
could learn by themselves like Microsoft Office, email, and the Internet. None of the three
teachers had been trained on technology skills for mathematical software such as Geometer’s
Sketchpad™ or computer algebra systems; however, if they used it then it was learned from the
Internet. Regarding technology training, these teachers had learned technology by themselves.
Gatimu stated, “I have trained myself. You just go to the Internet, for example, if you have
something you want to check, you go to the Internet, you Google. You check” (Gatimu,
Interview Data, line, line 105-106). To cope with the lack of training, the early adopters had
taught themselves the skills they needed to use technology for mathematics teaching by asking
colleagues or through the Internet.
Age of a teacher. The early adopters had an average age above 40 years and an average
of 18 years teaching experience. Despite the quantitative results showing that a mathematics

192
teacher’s technology adoption score was lowered by teachers aged above 40 years, these findings
imply that age of a teacher signal contradictory findings.
School type. The quantitative results revealed that teachers from the national and county
schools were more likely to use technology compared to teachers from the district and
community schools. Among the three teachers who had adopted technology, one was from a
national school and the other two were from county schools. I could not find a teacher to
interview who used technology at the district and community schools.
Educational technology in general. The three early adopters agreed that there was a
general lack of educational technologies at their schools. These teachers alleged that the
computer departments at their schools were a hindrance to technology adoption in mathematics
teaching. In most cases, these teachers had no access to the computer lab and thus they could not
use technology in their teaching. However, all the teachers had acquired personal Internet
modems, smart phones, and laptops to use for educational purposes. Musyoka stated, “Basically,
all my lessons I have done on my laptop. Though the school has its laptops in all cases, I don't
think I have used the school's [laptop]; I have used my own” (Musyoka, Interview Data, lines
395-397). These teachers noted that there was a need to equip their classrooms with projectors
and computers to ensure they had access to technology when they needed it.
Internet at home and school. Internet was playing a big role in supporting these teachers
to adopt technology in their lessons. These teachers did not perceive the Internet as a hindrance
to students’ learning. Each of the three teachers used online videos from YouTube™ to
download mathematics clips for their students and one teacher was familiar with Geogebra™
dynamic software. Despite limited collaboration efforts among the teachers in terms of
technology adoption, the Internet played a significant role in enabling these teachers to

193
collaborate with teachers from other schools to share examinations and teaching and learning
materials. One of the teachers, Hamisi, stated, “Anything I want I will get from them, like exams.
They just post to me, I give it to my boys. I tell them ‘This is a paper from …’ Like Wednesday
this week I was doing a practical that was posted to me” (Hamisi, Interview Data, lines 371-373).
These teachers used mobile phone and Internet modems to get information when their school
Internet was down. Hamisi noted that he used his smart phone to access information for his son:
“I just Google for him and give the answer. He asked me things to do with physics measurement
and whatever, conversions – Google gives the answer” (Hamisi, Interview Data, lines 88-91).
The teachers used the Internet to learn about technology and search for instructional materials
and other information.
Discussions about technology. Formal discussion with colleagues on technology was not
going on within their schools for these three early adopters. However, there was collaboration
using the Internet to share instructional resources through social media, email, and Google Docs
with teachers mainly from other schools.
The analysis of these data show that the early adopters of technology are coping with the
challenge of the lack of technology skills by training themselves through the Internet, which they
are also using to collaborate with teachers from other schools. Where educational resources are
not available, the early adopters have also used their funds to acquire laptops, Internet modems,
and smart phones. The early adopters perceive technology as a tool that can support students’
learning. Regarding time, these teachers perceived that technology can enable them to finish a
topic faster and they also felt that technology-enhanced lessons require time to plan.
Demographically, the early adopters were from either national or county schools, had many
years of teaching experience, and were in leadership positions in their schools.

194
Research Question 2b
The late adopters consisted of two types of teachers: sluggish adopters and non-adopters.
On average, both groups of adopters had 13 years of teaching experience. The sluggish adopters
(Shiro and Awiti) had some knowledge about technology but they had issues that were holding
them from adopting technology for classroom purposes. They used technology for social media
and e-mail. Shiro did use technology for private tutoring and Awiti used technology in teaching
geography. They both had positive attitudes about student learning through using technology and
they valued how technology adoption could support students’ learning in visualizing difficult
concepts, such as three-dimensional geometry. Shiro noted that technology “will change them
[students] in the way they view issues. When you are talking about gradient and slope, you are
seeing such kind of things. Maybe when you are rotating and they can see” (Shiro, Interview
Data, lines 172-175). These teachers taught at two different national schools. Although Awiti
agreed that technology was beneficial to students’ learning, he noted that he believed in a “50-50
approach [half of the time]” where there is no break from the manual way of instruction. Awiti
saw that the Internet can “clear up” some abstract concepts for the learners.
Despite her training on technology skills at the CEMASTEA, Amina revealed herself as a
teacher who had no technology skills. She also had negative attitudes of technology related to
students’ learning. She stated, “The child does not know how to draw a graph; the computer is
telling you this is what it looks like”. She perceived technology as a hindrance to students’
learning. She believed that, unlike a computer, a teacher has the opportunity to ensure a student
completes mathematics problems and the teacher can find out who is doing and who is not doing;
the proportion of students doing the problems, and the proportion not doing the problems. She
taught at a national school.

195
In-service training. Regarding the issue of technology training, Awiti was the least
experienced teacher among the three late adopters. He had not attended technology training as
opposed to Shiro and Amina who had been trained at the CEMASTEA. Speaking from the
perspective of a pre-service teacher, Awiti thought technology training should start at the
university level going downward to primary schools. Shiro and Amina had interesting
perspectives on the kind of technology training they both had received at the CEMASTEA.
According to Shiro, the training she had received was not different from what she already knew.
She noted that the teachers at the training were given some websites that she ended up never
using. In addition, she stated, “the training is done by other teachers who are like us, who were
trained early. They are trained trainers” (Shiro, Interview Data, line 148-149). According to
Amina, these trainers are “total blackouts”, implying they did not have the knowledge to train
teachers. Therefore, Amina and Shiro were demotivated and did not have interest to participate
in training. These teachers only had the skills using Microsoft Office and the Internet. Of interest
is the large number of graphing calculators at Shiro’s and Amina’s school they had not used
because they did not know how to use them. Similarly at Awiti’s school, there was a Kamau that
he had not used because he thought it would take too much time to type in mathematics
equations and formulas, and again he was not familiar on how to paste graphs on word
document. Thus, technology training was very low for these teachers.
Age of a teacher. The three late adopters of technology had an average of 13 years
teaching experience. These teachers had an average age of between 30 and 40 years. Awiti had
only five years teaching experience. As younger teacher I expected he would embrace
technology in mathematics teaching but that was not the case. Again there were inconsistencies
in quantitative and qualitative data about the age of a teacher and technology adoption.

196
School type. These three teachers taught in two different national schools. The analysis of
these data indicate that despite these teachers having access to technology resources, they were
not using technology for mathematics teaching.
Educational technology in general. Regarding the availability of education technology
infrastructure, all three late adopters taught in national schools. I expected that the teachers
would have all the technological resources that they needed to teach mathematics. However,
Shiro and Amina told me that their school had only one projector and a laptop for every
department and there was no technology in the classrooms except scientific calculators used by
the students. Therefore, if they wanted to use technology in their lessons they would have to
carry laptops and projectors to their classes and there was not time for that. Shiro and Amina
noted how the computer department denied other teachers access to the computer lab. Awiti
confirmed that the computer lab was meant for computer studies. Thus, computer departments
and the lack of adequate technology resources in the classroom hindered these teachers’
intentions to adopt technology. Awiti noted that there was a lack of digital software in Kenyan
schools for teaching mathematics: “Basically, we don’t know any mathematical software that can
be used to make work easier” (Awiti, Interview Data, lines 141-142). Unlike the early adopters,
who owned personal technologies to help them overcome the challenges of limited educational
technologies, late adopters did not have personal technologies to support in them in adopting
technology in the classroom.
Internet at home and school. Awiti and Shiro used the Internet for Facebook and e-mail,
which might have involved collaboration with colleagues, and to download examination papers
and other online activities. Of interest is that Awiti used the Internet to teach geography and
Shiro accessed YouTube™ videos for private tutoring to earn extra income. Amina had not tried

197
to adopt technology in her teaching and was not planning to do that until the time when
technology was going to be tested as part of the national examination. As the non-adopter,
Amina used the Internet for social media and email. Thus, Internet was rarely used to support
teaching mathematics by late adopters.
In conclusion, the late adopters did not show ways of coping with barriers to technology
adoption. They did not use technology for their lessons despite some of the schools where they
taught having technology available. The sluggish adopters thought technology could support
students’ learning but they were hesitant due to the perception that inappropriate content from
the Internet would distract students from learning. The only non-adopter did not think that
technology would support students’ learning. The late adopters had limited technology skills
compared to the early adopters. They also thought they could not adopt technology in
mathematics teaching because the time that was needed to prepare lessons was not adequate and
there would not be time to complete the syllabus in time for the final examinations. This group of
mathematics teachers was more likely to include female mathematics teachers, teachers with
bachelor’s degrees, and recent graduates.
Conclusion
The qualitative section reported the findings from interviews and classroom observations
data. The early adopters of technology are limited by lack of adequate technology training and
lack of technology resources related to mathematics teaching. The Internet plays a significant
role to support early adopters in self-training and sharing of information with other teachers. The
early adopters indicated that lack of time was also a limiting factor because of the demand of
finishing the syllabus early to prepare students for the national examination.

198
The late adopters are limited mainly by a lack of technology training but even where
technology was available, these teachers were not using technology to teach mathematics
because they had developed negative perceptions about technology on students’ learning. The
demands of completing the school syllabus in time for the national examinations inhibited these
teachers from adopting technology.
The teachers who had adopted technology were in national and country schools, their
average age ranged between 40 and 50 years, had an average 18 years of teaching experience,
and had significant leadership roles at their schools. The late adopters of technology were found
across all school types, had an average age between 30 and 40 years, had an average teaching
experience of about 12 years, and did not have significant leadership roles within the school.
Summary
This chapter presented the results of the quantitative and qualitative data coinciding with
the first two research questions for the study. I present a summary of these two sections below.
The first part of the chapter laid out the results of the quantitative data that I analyzed
using sequential multiple regression procedures to answer the first research question. The results
revealed six explanatory variables that significantly predicted mathematics teacher’s technology
adoption score. The variables are as follows: in-service training (β=.527), age of a teacher
( ), educational technology in general (β=.301), school type (β=.267), Internet at home
and school (β=.245), and discussions about technology (β=.161). Thus, in-service training is the
best predictor of a mathematics teacher’s technology adoption score and discussions about
technology is the least significant variable. In addition, all the constants in each block were
statistically significant.

199
The results also found some variables were not statistically significant predictors of
mathematics teacher’s technology adoption score. These variables were as follows: gender,
education level, time, computer labs, ownership of laptops, school location (rural or urban), and
principal’s subject major.
The quantitative results also revealed that the best combination of variables related to
technology adoption can be grouped based on the amount of explained variation in the dependent
variable as follows: technology training variables (in-service training and discussions about
technology) (ΔR2=.291), technology resources variables (Internet at home and school and
educational technology in general) (ΔR2=.169), and demographic variables (age of a teacher and
school type) (ΔR2=.152). Evidence revealed that the technology training variables had a larger
explained variation in the mathematics teacher’s technology adoption score, compared to the
technology resources variables and the demographic variables.
For the qualitative phase, I analyzed the data using open coding and creating teacher
profiles. The following themes emerged from the data: technology training, availability of
educational technology and infrastructure, time, perceived benefits, teacher characteristics, the
Internet, and collaboration. These themes helped to explain the variables in the study. Both early
and late adopters of technology considered technology training as a priority area of need for
them. They indicated that they lacked technology training resources and the trainers were not
technically skilled to train them. They also indicated that educational technology in general was
needed at the schools to enable them to integrate technology and that the computer department
was also a hindrance to their efforts to adopt technology. These two groups differed in two ways:
First, where technology resources were not available, early adopters used their own technology
resources for teaching while late adopters did not. Second, the early adopters used technology at
200
any opportunity where technology was available, but the late adopters did not because they
thought it would take too much time, or it would not help students to learn mathematics. The
Internet played a significant role in helping early adopters to access learning resources on-line
and as a tool for self-training. It served both early and late adopters as a tool through which to
discuss technology with teachers from other schools.
Other results such as lack of convincing evidence from qualitative data and quantitative
data on age of a teacher and school type, statistically non-significant results, are discussed in
chapter 5. Chapter 5 also presents a discussion of the results and findings in answer to research
question three, as well as the implications and recommendations for future research.
Chapter 5: Discussion
The aim of this study was to examine the factors related to technology adoption among
mathematics teachers in Kenyan secondary schools. To understand these factors, I collected
quantitative data followed by qualitative data and drew on an explanatory mixed methods
research design. For the quantitative phase, mathematics teachers from Nyandarua and Nairobi
Counties completed a self-administered survey questionnaire between March and June 2013. The
goal of the quantitative data analysis was to identify the variables that best explained and
predicted mathematics teachers’ technology adoption using multiple regression analysis. For the
qualitative phase, I collected data using semi-structured interviews and classroom observations
from a subset of participants who had completed the survey questionnaire. The goal of the
qualitative data analysis was to get a deeper understanding of the statistical results from the
quantitative phase. This chapter is organized as follows (1) a summary of the findings from both
the quantitative and qualitative phases, (2) answering research question three drawing from the
qualitative data, related literature, and Rogers’ (2003) diffusion of innovations theory, (3)

201
conclusions, (4) implications for practice and policy, (5) limitations of the study, and (6)
recommendations for future research.
Summary of the Findings
The quantitative data analysis related to research question one revealed six explanatory
variables related to a mathematics teacher’s technology adoption score. I have listed these
explanatory variables and their corresponding change in standard deviations in the dependent
variable: in-service training (.527), age of a teacher (-.321), educational technology in general
(.301), school type (.267), Internet at home and school (.245), and discussions about technology
(.161). Thus, in-service training is the best predictor of a mathematics teacher’s technology
adoption score and discussions about technology is the least relative important predictor.
Further results revealed that the best combination of variables related to technology
adoption can be grouped based on the amount of change in the explained variation in the
dependent variable as follows: technology training variables (in-service training and discussions
about technology) ΔR2=.291), technology resources variables (Internet at home and school and
educational technology in general) (ΔR2=.169), and demographic variables (age of a teacher and
school type) (ΔR2=.152). The evidence revealed that the technology training variables had a
larger explained variation in a mathematics teacher’s technology adoption score, compared to the
technology resources variables and the demographic variables.
On the contrary, I found that the presence of computer labs for students, the gender of a
teacher, teachers’ education levels, school location (urban or rural), and time were not
statistically significant predictors of a mathematics teacher’s technology adoption score. The
qualitative phase of the study did not dwell on these variables; however, in the next section I
shall briefly elaborate these findings when appropriate.

202
The qualitative data analysis provided evidence to support the quantitative results. The
qualitative data analysis showed that the early and late adopters of technology lacked adequate
technology training and adequate technology resources. However, the qualitative data
contradicted the quantitative data in two instances. First, the quantitative results showed that
teachers above 40 years of age were limited in technology adoption, while the qualitative
findings told a different story. Second, the quantitative results showed teachers from national and
county schools had adopted technology; however, the qualitative findings indicated that was not
necessarily the case. The following discussion helps answer the mixed-method research question.
Answering Research Question 3
This section answers research question three by offering a comparison of the findings
from the quantitative and qualitative phases based on the related literature and Rogers’ (2003)
diffusion of innovations theory. Research question three is as follows: In what ways do the
qualitative data contribute to a more comprehensive explanation of the statistical results from the
quantitative phase of the study? To answer this research question, I will focus on: technology
training (in-service training and discussions about technology), technology resources (Internet at
home and school and educational technology in general), and demographics (age of a teacher and
school type) to get a deeper understanding of the research problem.
Technology Training
The quantitative results showed that one standard deviation increase in in-service training
increased a mathematics teacher’s technology adoption score by .527 standard deviations. In-
service training had the strongest predictive power for technology adoption. This implied that if
teachers were equipped with technology skills, the predicted mathematics teacher’s technology
adoption score would increase by .527 standard deviations holding other variables constant.

203
Similarly, the quantitative data revealed that discussions about technology adoption increased
technology adoption by .161 standard deviations holding other variables constant. This implies
that teachers who discussed technology with colleagues were more likely to increase the rate of
technology adoption compared to teachers who did not discuss technology with colleagues.
Overall, when I grouped these variables into one variable they both contributed a statistically
significant change in explained variation of 29.1% on mathematics teacher’s technology
adoption score.
In-service training. In a study conducted by Muller and colleagues’ (2008), the findings
revealed that in-service training and the continuing support of good practice were among the
greatest determinants of successful technology adoption. In my study, the qualitative findings
revealed that early adopters and late adopters lacked adequate skills to adopt technology, and the
findings agree that technology training would be needed to enable teachers to adopt technology
in mathematics teaching. These findings mirror those of Forgasz (2002) who found that the
teachers in her study indicated the desire to participate in technology training to gain knowledge
of mathematics-related software. Consequently, early adopters in my study used technology to
support teacher-directed instruction and presentation (Peeraer & Petegem, 2011) as opposed to
applying technology to support students’ conceptual understanding. Similarly, the late adopters
of technology developed negative perceptions of technology related to supporting students’
learning, which was a reflection of their lack of knowledge on the usefulness of technology to
students’ learning (Manouchehri, 1999). According to Ertmer and Ottoenbreit-Leftwich (2010),
technology training may support teachers in gaining knowledge, skills and confidence for
technology adoption in their classrooms.

204
The findings also suggest that both early adopters and late adopters had not been trained
adequately on mathematical software for teaching mathematics. Instead, my study revealed
spreadsheets and word processing were the most widely used computer software by teachers,
more so than mathematics-specific software. Similarly, a study by Gulbahar (2007) in Turkey
found that most teachers were competent with word processing applications and the Internet,
with very few teachers having skills in using educational software. Other studies revealed similar
findings (Demiraslan & Usluel, 2008; Keong, Horani & Daniel, 2005).
The findings in my study suggest that in-service training of teachers on technology may
be related to teachers’ early decisions for adopters during the technology adoption process.
According to Rogers (2003), the innovation-decision-process begins when an individual
becomes aware of an innovation’s existence and gains understanding of how it functions. Thus,
the innovation-decision process is “essentially an information-seeking and information-
processing activity in which an individual is motivated to reduce uncertainty … of an
innovation” (p. 172). During this process, an individual encounters such questions as what, how,
and why about an innovation. The findings from my study suggest that mathematics teachers had
not been made aware to a great depth about the technology available to them to teach
mathematics. This may have been due to the role of the technology trainers (change agents) who,
according to Rogers, play a significant role in bringing knowledge and awareness about the
existence of an innovation to clients (in this case, teachers). Rogers argued this happens when
change agents fail to understand how an innovation works, which is most important to the
clients, as they make decisions about adopting an innovation.
Consistently, the early and late adopters in my study alleged that the type of technology
training they had experienced at the CEMASTEA had something to do with the trainers

205
designated to train them. The teachers said that trainers of technology were their fellow
colleagues who also taught at their schools. This is what Rogers called homophily – the degree to
which individuals are similar in certain attributes such as education. According to Rogers’ (2003)
homophily “occurs when similar individuals belong to the same groups, live and work together
and share similar interests … [C]ommunication of new ideas is likely to have greater effects in
terms of knowledge gain, attitude formation and change, and overt behavior change” (p. 19). But
according to Rogers homophily can be a barrier to the flow of innovations within a system. He
implied that “homophilous could cause diffusion of an innovation to spread horizontally rather
than vertically, within a system” (p.307). When the diffusion does not occur vertically the
adoption of an innovation may significantly slow down. Rogers suggested that an ideal change
agent can be homophilous with his or her clients in social characteristics but heterophilous (the
degree to which two individuals are different) with regard to technical competence about the
innovation being diffused. In my study the participants indicated that technology trainers had less
technology expertise to influence mathematics teachers’ innovation-decision processes.
According to Rogers (2003), change agents should be aware of their clients’ needs and
adapt their change programs to them. He wrote, “change projects that ignore clients’ felt needs
often go awry or produce unexpected consequences” (p. 375). When adequate levels of
knowledge to use innovation are not obtained prior to the trial and adoption of an innovation,
rejection of the innovation is likely to occur (Rogers, 2003). However, Rogers insisted that
clients should never be allowed to pursue their needs completely on their own since they might
commit errors and dismiss priorities. This implies that the change agents should not relinquish
their roles on shaping the needs of the clients. In addition, Rogers, “personal acceptability of the
change agent is as important as, or more important than, technical expertise” (p. 384). Thus,

206
teachers in my study suggested that technology training should be handled by people who
understand technology as opposed to fellow teachers who likely do not know significantly more
about technology than the teachers they are training.
My participants suggested that more training centers need to be established in their
localities so that they have options to decide on their training needs and to attend training events
at more convenient times and places. This is what Rogers (2003) called a decentralized diffusion
system. According to Rogers, “centralization has usually been found to be negatively associated
with innovativeness … top leaders are poorly positioned to identify operational-level problems
or to suggest relevant innovations to meet these needs” (p. 412). Under a decentralized diffusion
system, users feel a sense of control in making key decisions such as the problems to be
addressed, the innovations that best meet these needs, how to seek information about an
innovation and from what source, as well as how much to modify an innovation as they
implement it to meet their local needs (Rogers, 2003), including time management.
The participants indicated that incentives and recognition of their efforts to learn
technology would significantly motivate them to attend technology training. According to
Rogers (2003) one way to increase the degree of relative advantage of new ideas is to offer
incentives in terms of cash or other forms of incentives. Rogers suggests that “while innovations
are often in form of financial payments, they may also take the form of some commodity or
object that is desired by the recipient” (p. 237). Such rewards are likely to change behavior and
enhance adoption of innovation. In my study, the participants suggested that such incentives can
be in the form of compensation to cover technology training expenses, certification and
recognition after training, tuition credits for higher education, or grants to purchase technology.

207
Rogers (2003) pointed that some incentives are designed to secure adoption of a new idea
by early adopters and after a certain period when diffusion process becomes spontaneous, the
incentive may be withdrawn. On one hand, the findings of my study indicated that to overcome
inadequate technology skills the early adopters of technology had embarked on “self-training”
strategies, using personal technology tools such as laptops, the Internet modems, projectors, and
smart phones. Using these tools the early were able to access online instructional resources such
as exams, videos, and worksheets and to collaborate with teachers from other schools.
Consistent with Rogers’s suggestion, such early adopters can be recognized through incentives
so that they continuously participate in the diffusion process. On the other hand, the late adopters
had not embraced technology despite having access to technology resources at their schools for
lack of understanding regarding how technology could be used as an alternative instructional
strategy. Withholding of incentives may eventually change manifested behavior towards a new
idea and lead to significant positive outcomes on technology adoption process (Rogers, 2003).
Discussions about technology. The qualitative data revealed that there are minimal
discussions going on within the schools about technology adoption; however, teachers blamed
the school managers for not encouraging such discussions. This study suggests that school
leaders had failed to influence teachers to collaborate within the schools, particularly about the
way the computer department had handled technology adoption. The findings indicate that early
adopters of technology are using technology to collaborate with other teachers from schools
other than their own.
Collaboration through the Internet has played a significant role for the diffusion of certain
innovations in recent times, including technology (Rogers, 2003). According to Morgan, Parr
and Fuhrman (2011), teacher collaboration can strengthen teacher camaraderie and teamwork

208
and offer many benefits to teachers and students. One of the hurdles impeding secondary
teachers from collaborating is a lack of time (Delnero & Montgomery, 2001). However, the
Internet has provided a means for individuals to interact and communicate using tools such as
wikis, email and social networking sites such as Facebook and Twitter within a short time period
(Morgan & Parr, 2009). This finding is consistent with Rogers’ assertion that “the Internet allows
people to reach many other people in a one-to-many process” (p. 215), thus greatly speeding up
an innovation’s rate of adoption. Rogers argued that most individuals do not evaluate an
innovation based on scientific evidence; rather, they rely on subjective evaluation from other
individuals similar to themselves who have already adopted the innovation. In fact, transfer of
new ideas occurs most frequently between two individuals who are similar or homophilous
(Rogers, 2003). According to Rogers, when “people share common meanings and mutual
subcultural language are alike in social and personal characteristics, the communication of new
ideas is likely to have greater impact in terms of knowledge gain, attitude formation and change”
(p. 19). Thus, mathematics teachers who share similar attributes could end up communicating
through the Internet or through face-to-face exchanges to understand technology adoption.
Similar perspectives were provided by Oncu et al. (2008) who reported that teachers were
influenced by colleagues to use technology. They found that the fact that some teachers were
using technology gave some teachers encouragement and reassurance to adopt technology. They
concluded that teachers who have adopted technology in teaching should be given opportunities
to guide their colleagues.
Technology Resources
The quantitative data revealed that availability of the Internet at home and at school was a
predictor of a mathematics teacher’s technology adoption score. The result indicated for every
209
one standard deviation increase in Internet at home and school, there was a .245 standard
deviations increase in the predicted mathematics teacher’s technology adoption score. Similarly,
the quantitative phase of this study indicated that for every one standard deviation increase in
educational technology in general increased a mathematics teacher’s technology adoption score
by .301 standard deviations. This result suggests that the availability of educational technology
resources plays a significant role in mathematics teachers’ innovation-decision process to adopt
technology. When I combined the two variables the result indicated explained variation change
of 16.9% in the mathematics teacher’s technology adoption score.
Internet at home and school. The qualitative data revealed that both early adopters and
late adopters used technology for communication on email and Facebook. However, the early
adopters went a step further to use the Internet as a medium to download videos on YouTube,
use Geogebra, and collaborate with teachers from other schools. However, of more importance is
the way the early adopters used the Internet for self-training on technology. Recent findings have
established that having a computer at home resulted in a favorable attitude about technology use
(Cajilig, 2009). This implies that a teacher who has Internet both at home and at school might
have greater opportunities to learn and use technology and accessibility to technology is thus not
a problem.
Additionally, Whattananarong (2004) found that Internet-based classroom instruction
was more effective compared to traditional instruction in terms of summarizing students’ work,
referencing sources of students’ work and reducing the time taken to cover topics. According to
Rogers (2003), the Internet greatly speeds up an innovation’s rate of adoption.
I found that late adopters did not fully embrace the Internet as a medium of instruction.
The findings suggested that the sluggish adopters believed that the Internet was harmful to

210
students’ learning and the only non-adopter believed that technology is not useful for students’
learning. The sluggish adopters used technology in ways not related to mathematics teaching at
their schools. Instead they used technology to access social media and to teacher other subjects
or did not use technology at all despite its availability.
Educational technology in general. In my study, the early and late adopters suggested
that classrooms should be equipped with technology facilities such as projectors and computers
to enable them to fully adopt technology. This finding is consistent with previous studies, such as
Akbaba-Altum (2006), who examined issues related to technology adoption in Turkey and found
that technology resources were the main barriers of technology adoption by teachers. Similarly,
Inan and Lowther (2010) found that availability of technology was related to technology use.
There was a strong relationship between technology adoption and the number of computers
available in the classroom (Becker & Ravitz, 2001). In my study, the early adopters were found
to own laptops, smart phones, projectors, and Internet modems to support them in adopting
technology in teaching. Such findings are consistent with Khambari, Moses, and Luan (2009)
who found that owning laptops helped teachers gain confidence, have increased mastery of
technology skills, and have improved quality of instructional materials.
The early adopters had adopted technology in their teaching because they felt it was
beneficial to them and their students. According to Rogers’ (2003) notion of perceived attributes
of technology, the early adopters had recognized that technology had relative advantages and that
technology was compatible with their classroom needs. Rogers asserted that “the greater the
perceived relative advantage of an innovation, the more rapid its rate of adoption will be … and
relative advantage is positively related to its rate of adoption” (p. 15). As individuals pass
through the innovation-decision process they look for information about an innovation in order

211
to ascertain its usefulness. Similarly, according to Rogers, compatibility of an innovation is
positively related to its rate of adoption. The early adopters recognized that technology met their
teaching needs and that technology was compatible with their values and beliefs about students’
learning and classroom past experiences.
However, for the late adopters of technology, they did not recognize technology as
having relative advantages to their teaching, or they believed that technology was not compatible
with their teaching processes. This suggests that the availability of technology did not guarantee
technology adoption (Cuban et al., 2001) among the late adopters. The late adopters in the
current study perceived that technology did not save them time in completing the syllabus, did
not prepare students to sit for the national examination, and most of all technology did not add
value to students’ learning.
Additionally, both early and late adopters felt technology was complex to use even where
it was available. According to Rogers (2003), complexity of an innovation is negatively related
to its rate of adoption. Data analysis revealed that teachers who found technology complicated to
use did not use it. This problem was implicated to lack of adequate technology training.
The department of computer studies at schools was also found to be a barrier to
technology adoption among the early and late adopters. The teachers did not have free access to
technology resources in the department of computer studies, an opportunity for which they
wished to. In consideration to Rogers’ attributes of triability (to experiment) and observability (to
view) of an innovation, my participants did not have opportunities to experiment with technology
or watch exemplar teachers try out technology in the computer department. On triability, Rogers
assert that “the personal trying of an innovation is one way for an individual to give meaning to
an innovation and to find out how it works under one’s own conditions” (p. 258). The

212
mathematics teachers’ lack of access to the computer lab created a barrier for them to try new
ideas that could lead to full-scale adoption of technology. Regarding observability Rogers argued
that, “the easier it is for individuals to see the results of an innovation, the more likely they are to
adopt” (p. 16). Mathematics teachers did not have opportunities to observe and try certain
technology applications for classroom practice.
Demographics
The age of a teacher was related to technology adoption. A one standard deviation
increase in the age of a teacher decreased the predicted mathematics teacher’s technology
adoption score by .321 standard deviations holding other variables constant. This indicated that
younger teachers, 40 years of age or less, were more likely to adopt technology compared to
teachers who were more than 40 years old. Similarly, quantitative results showed that one
standard deviation increase in the school type variable increased the predicted mathematics
teacher’s technology adoption score by .267 standard deviations holding other variables constant.
This implies that mathematics teachers from the national and county schools were more
innovative in terms of technology adoption in mathematics teaching compared to teachers from
the district and community schools. When I combined these two variables there was a 15.2%
change in explained variation on mathematics teacher’s technology adoption score.
Age of a teacher. Older teachers may not be as quick to explore new technologies as
younger teachers (Broady, Chan & Caputi, 2008). This may also be a result of younger teachers
being more likely to join the teaching profession having more technology skills compared to
their predecessors (Nicklin, 1992). These results mirror those of Ocak (2005) who found that
teachers in the higher age groups experienced low confidence when compared to teachers in the
lower age groups who favored using computers more efficiently. A study by Cavas, Cavas,

213
Karaoglan and Kisla (2009) found that teacher attitudes regarding technology use differed by
age. Teachers below the age of 25 had positive attitudes towards technology and attitudes
decreased with age increment. Similar findings were reported by Ocak (2005) who found that
older teachers had negative attitudes towards technology adoption. There is also evidence to
suggest that younger teachers are more Internet literate compared to older teachers (Liang &
Chao, 2002).
However, other studies in the literature indicate the contrary. Such studies include Lau
and Sim (2008), who found that respondents above the age of 45 made more frequent use of
Information and Communication Technology (ICT) in schools compared to teachers aged 45
years and below, and Chio (1992), who reported that older teachers have more positive attitudes
toward computer use in education than young teachers. Rana (2013) found that younger teachers
scored lower compared to older teachers on potential to use technology.
These findings are contradictory. This literature indicates that older teachers have
embraced technology, while other studies indicate younger teachers are more technologically
skilled and more likely to adopt technology for classroom teaching. My study revealed similar
inconsistencies as seen in both the quantitative data and the qualitative data. As I have
mentioned, the quantitative results revealed that younger teachers scored higher on the
mathematics teachers’ technology adoption score compared to older teachers. However, the
qualitative data indicated that the early adopters were older teachers who had embraced
technology in the classroom and the late adopters were a group of relatively younger teachers
who had not embraced technology in the classroom practice.
Rogers (2003) elaborated such inconsistencies; he suggested that there was no difference
between early adopters and late adopters in terms of age. According to Rogers as many as half of

214
the diffusion studies show no relationship between age and innovativeness. He wrote, “a few
[studies] found that early adopters are younger, and some indicate they are older” (p. 288). This
implies the relationship between age and technology innovation is not yet understood and further
research may be required to particularly to examine how age influences mathematics teachers’
attitudes of technology across different age groups.
School type. Indeed, the qualitative data analysis show that teachers who adopted
technology in mathematics teaching were from national and county schools. During the time of
collecting data for this study, only one teacher was available for interview but not for classroom
observation from district or community schools. The lack of teachers available in this context is a
result of schools lacking technology resources and having fewer technologically skilled teachers
compared to the national and county schools. I expected that the national and county schools
would have advanced technology resources and infrastructure compared to the district and
community schools, which was the case. National schools and county schools are larger in size,
have better school facilities, and most of them were established at an earlier time compared to
the district and community schools that are most likely to be found in rural areas. In
consideration to Rogers’ (2003) theory, the size of an organization has been found to be related
to innovativeness. Large organizations tend to have members who possess relatively high
knowledge and expertise and more uncommitted resources are available. However, this study
demonstrates contrasting results because the late adopters of technology who came from the
nationals had not adopted technology despite the schools being privileged in having some
technological resources and infrastructure.

215
Statistically Non-significant Variables
Both early and late adopters felt that a lot of time was required to prepare technology
enhanced lessons at the expense of completing the school syllabus to get the students ready for
the national examination. Similar findings were reported in the literature by Lim and Khine
(2006). They found that teachers indicated that large amounts of time were required to prepare
technology lessons, and as a consequence, teachers turned to traditional ways of teaching to save
time. Similarly, Anthony and Clark (2011) found that teachers who used technology to teach
mathematics struggled to finish the syllabus on time, and this resulted in teaching after class
hours to cover the syllabus. Despite this, early adopters in my study felt that if teachers created
time for planning, then technology was in a position to create effective lessons for their students.
Additionally, they also indicated that technology lessons require shorter time allotted to explain
concepts and move on to assessing students’ learning and to teaching more difficult concepts.
Demographic variables reported in the literature, such as gender, were not statistically
significant in this study. Similar findings were reported by Norris, Sullivan, Poirot, and Soloway,
(2003) who found that gender was not a predictor of technology use. However, other studies
such as Ocak (2005), Cassim and Obono (2011), and Teczi (2011) revealed that gender was
related to technology adoption. Other variables that were not statistically significant predictors of
technology adoption in this study included teacher’s educational level, students’ computer labs,
and school location (urban or rural). Teaching experience was related to age of a teacher, and to
avoid multicollinearity issues, I chose to use the age of a teacher as an explanatory variable for
my study because qualitative data consistently reported how a teacher’s age influenced
technology adoption.

216
Conclusion
On the quantitative data, the best predictors of a mathematics teacher’s technology
adoption score were: in-service training, discussions about technology, Internet at home and
school, educational technology in general, age of a teacher, and school type. In addition,
technology training (in-service training and discussions about technology), technology resources
(Internet at home and school, educational technology in general), and demographics (age of a
teacher and school type) contributed statistically significant explained variation in a mathematics
teacher’s technology adoption score. The overall regression model contributed 61.2% explained
variation in the mathematics teacher’s technology adoption score. The adjusted R square was
59.3%.
On the qualitative data, the findings revealed that both early and late adopters (1) lacked
technology training especially training related to mathematics teaching, (2) were trained be
individuals who did not understand technology, (3) suggested decentralization of training centers
to teachers’ localities to accommodate their time and training needs, (4) they had limited pre-
service training on educational technology, (5) they need to be mentored after training, (6) lacked
adequate technology resources, and (7) the computer department was a barrier that inhibited
teachers from experimenting with technology and also observing knowledgeable teachers apply
it.
For early adopters, they perceived technology as having relative advantage to them and to
their students. These teachers made efforts to collaborate and share knowledge with other
teachers from within or outside their schools to learn technology skills for teaching. Teachers
used the Internet to access information online, instructional resources, self-training, and also for
collaboration. The findings also indicated that the early adopters had their own personal laptops,
217
smart phones, projectors, and Internet modems, which played significant roles in supporting
them to adopt technology in teaching. The early adopters were likely to be male teachers, with
graduate degrees, from the national or country schools, and older with more years in teaching
than late adopters.
Late adopters did not make significant efforts to self-train on technology skills or to learn
from colleagues through discussions and collaborations. I found that some teachers did not use
technology despite schools having computers and technology for teaching mathematics because
they felt: there was not enough time to prepare technology lessons and complete the syllabus
early to prepare students for the national examinations, it was difficult to use technology, and the
Internet could have moral consequences on their students. Late adopters of technology taught
across all types of schools including national, county, district, and community schools with or
without technology. The late adopters were likely to include both genders, younger and less
teaching experience compared to early adopters, not necessarily in leadership at the schools, and
had only a bachelor’s degree.
Methodologically, the current study revealed that past studies that used only quantitative
methods to study technology adoption might have reported flawed findings because the studies
failed to reveal inconsistencies that might occur in the findings. In light of this, the use of
qualitative data to explain quantitative results offered the best research methodology because the
qualitative data revealed inconsistencies that the quantitative data could not reveal on its own,
particularly those related to demographic factors. The demographic data revealed inconsistent
findings. On one hand, the quantitative data analysis showed the teachers from the national
schools were leading in technology adoption while the qualitative findings revealed that
mathematics teachers in some national schools and country schools did not apply technology in

218
mathematics despite having technology. Such findings are consistent with Rogers’ (2003)
organization innovativeness, which indicates that having access to an innovation does not imply
using it. On the other hand, quantitative data revealed that younger mathematics teachers 40
years and younger were likely to adopt technology in teaching compared to teachers who were
older than 40 years. The literature revealed that such inconsistencies exist. In terms of age,
Rogers’ (2003) diffusion of innovations theory noted that early adopters were not different from
late adopters.
I conclude that future studies investigating factors related to technology adoption in
mathematics teaching should embrace mixed methods research so that quantitative and
qualitative data can be compared and contrasted. In addition, my study found that the median
replacement of missing values resulted in a better multiple regression model compared to the
mean replacement of missing values.
The survey instrument used in this study was evaluated using statistical procedures and
results compared to past studies and were found to be reliable and valid. Therefore, the current
study predicted reliable and valid variables related to technology adoption in mathematics
teaching in Nyandarua and Nairobi Counties. This implies that the survey instrument could be
reliably applied in similar contexts to study factors related to technology adoption in
mathematics teaching. However, the instrument needs to be polished to include more issues that
are related to technology adoption in the Kenyan school context.
Theoretically, the diffusion of innovations theory offered a reliable lens to examine
factors related to technology adoption. Despite the knowledge and implementation stages in the
innovation-decision process revealing a suitable prediction model in the current study, the
persuasion stage did not give a suitable prediction model. According to Rogers, persuasion

219
involves developing favorable or unfavorable attitudes towards the innovation based on relative
advantage, compatibility, and complexity. When the adopter becomes unsure about how the new
idea functions he or she seeks opinion from others to know of his or her thinking about the
innovation. However, he notes that “personality variables associated with innovativeness have
not yet received much research attention, in part because of difficulties in measuring personality
dimensions in diffusion studies” (p. 289). This implies persuasion involves feelings and mental
interpretation of a new idea, which are not well understood by researchers. My study suggests a
teacher who had become aware of the existence of technology and how it functions, and who had
also put that technology into use, will be persuaded to embrace technology in their teaching.
However, mathematics teachers still need to be mentored and encouraged to apply technology in
their classrooms.
Similarly, the decision and confirmation stages in the technology innovation process were
not included in this study because it was not apparent when a teacher had made a decision or
confirmation to apply technology in the teaching. This study puts the stages described by Rogers
(2003) into focus about whether the stages should occur in a sequential order during the study of
technology adoption in mathematics teaching, and whether some stages are relevant at all.
Therefore, the current survey instrument may need improvement to facilitate further
investigations of the innovation-decision stages in the Kenyan school context.
However, four elements of the diffusion of innovations – the innovation, communication
channels, time (excluding rate of adoption), and the social system – adequately justified the
existence of the factors related to technology adoption in mathematics teaching. Thus, this study
concludes that Rogers’ (2003) diffusion of innovations was significant in predicting and
explaining technology adoption in mathematics teaching in Kenya (Rogers &Wallace, 2011).
220
Implications for Practice and Policy
Implications for practice and policy touch on six main areas: Enhancing classroom uses
of technology, providing technology training, providing technology infrastructure and resources,
providing time and modifying the school curriculum, adopting technology plans for schools, and
reassessing the goals of the Kenya Vision 2030.
Enhancing classroom uses of technology. Teachers in this study demonstrated
inadequate capabilities to use technology for mathematics teaching that suggests teachers lacked
understanding about how to apply technology in mathematics teaching. However, the data
indicate that teachers who use technology were willing to adopt technology in teaching to the
extent that when technology was not available, these teachers use their own technology tools for
classroom instruction.
I believe that such uses of technology will only result in haphazard adoption of
technology across schools, which will not meet the goals technology was meant to achieve. If
teachers have had to purchase technology for themselves, then they may need to be supported
through grants and other incentives so that every teacher usage of technology can be properly
accounted for. There were also instances where teachers failed to use technology despite its
availability. On the one hand, late adopters of technology indicated there was a lack of time to
apply technology and they had little understanding of how technology could transform students’
learning. On the other hand, the early adopters mainly used technology to gather online learning
materials, to present and to illustrate lessons. This suggests that teachers used technology to
support teacher-directed lessons. But according to Garofalo, Shockey, Harper, and Drier (2000)
technology uses in the classroom should facilitate conceptual development, exploration,

221
reasoning, and problem solving, while also facilitating the incorporation of multiple
representations of mathematical ideas.
I argue that through training Kenyan teachers can alter how they think about technology
and how they use it in their classroom. I believe that the skills gained through technology
training can support teachers to teach mathematics in environments where students can explore
difficult problems and investigate multiple representations as opposed to using such tools for
illustration, practice, drill activities, and teacher-centered activities such as document production,
and presentation. If mathematics teachers are afforded opportunities to make meaningful use of
technology, students might change how they view mathematics, particularly as technology may
assist them to think critically, investigate situations, make generalizations, and see patterns. I
suggest that the kind of technology knowledge needed by Kenyan teachers at the moment is the
knowledge that will change how students feel about learning mathematics.
Providing technology training. The current study shows that in-service training of
mathematics teachers is a significant factor that influences whether teachers apply technology or
not in mathematics teaching. The data indicates that the need for technology training for Kenyan
teachers is required to refine teachers’ technology skills, technology pedagogical knowledge,
perceptions, attitudes, and confidence to adopt technology.
The training that I am suggesting would involve certified technology courses at the
universities or teacher training colleges paid for by the Ministry of Education. Currently, Kenyan
teachers go for training during school holidays, which I believe provides too short of a time to
train teachers who have no prior encounters with technology, to understand it and know how to
apply it in mathematics teaching. Thus, I suggest that training of teachers should take adequate

222
full-time study leave. After the training, teachers can be given opportunities to practice in the
classrooms and to attend conferences and workshops to broaden their technology skills.
During these trainings, the technology trainers must be individuals knowledgeable on
research involving students’ learning in technological environments. Revolutionary thinkers and
researchers in the field of mathematics education who are experts in technology adoption need to
be involved in such trainings to guide teachers on the best practices to apply technology in their
lessons. In such situations, the current technology trainers should act as tutors leading group
discussions about the pros and cons of teaching with technology. These discussions should aim
at broadening teachers’ knowledge and absolve fears of technology. The discussions should also
encourage sharing of technology problems and successes that are unique in other content areas,
which can be replicated in mathematics teaching.
Technology training for mathematics teachers should not rely solely on Microsoft Office
or Internet skills. Rather, technology training should include cutting-edge mathematical software
such Geometer’s Sketchpad™, computer algebra systems, Fathom©, and other mathematical
dynamic software. Mathematics teachers should also be given opportunities to learn and develop
technology informed lesson plans and curriculum for the mathematics taught at secondary
schools.
The training of teachers should go beyond training centers and should follow the teachers
in the classroom after the training. At the schools, in which they work, teachers should be
assigned mentor teachers and technical support to follow up and support them during the
technology implementation process. Such a training program should give teachers a sense of
entitlement and accomplishment of having the opportunity to practice what they learned during
the training without feeling abandoned. Progressively, through such support teachers have the

223
opportunity to practice the skills needed to achieve the goal of engaging students in constructive
learning using technology.
Experimenting with technology and campaigning for its use in schools can take a long
time. To overcome such challenges, teachers should be given opportunities to showcase their
technology skills through symposiums of technology lessons within the school or nearby
schools. Such opportunities should reward and recognize teachers who have made
improvements, especially older teachers and female teachers who could be struggling or
unwilling to adopt technology. When teachers see the efficiencies of technology they may
change their attitudes towards technology.
The leading personnel at the Ministry of Education involved in decision making in
technology adoption must be knowledgeable individuals who are qualified through merit. Such
individuals must be familiar with the global trends on technology adoption in education and
teacher training models used in other developing countries. In addition, technology trainers must
be individuals with university qualifications in information technology in addition to having
advanced knowledge in mathematics education. I believe that education leaders across all levels
of education should be individuals who understand why and how technology can benefits
students’ learning.
In sum, government agencies such as TSC, CEMASTEA, NI3C, and pre-service teacher
programs in public universities need to consider rewarding teachers who successfully complete
technology training. Kenyan mathematics teachers need to feel valued and recognized.
Government agencies need to recognize teachers who successfully complete technology training
programs with a certification and a salary increment. More incentives might be offered to
teachers who continue to apply technology in their lessons after the training. Such initiatives can

224
motivate and encourage other teachers to attend training to learn technology. However, these
engagements cannot be successful without adequate technology resources at the schools and the
training centers.
Provide infrastructure and technology resources. The findings revealed that teachers
mostly have challenges in applying technology in their lessons because of the lack of technology
resources. There is evidence to suggest that the department of computer studies is a hindrance to
teachers’ efforts to use technology at the schools. It is evident from the data that computer labs,
which are under the supervision of the department of computer studies, need to be liberalized so
that mathematics teachers can access the technology without feeling threatened. This would
imply that the roles of the department of computer studies need to change so that it’s not seen by
teachers as a blockade to technology adoption. On the other side, classrooms should also be
equipped with technology resources so that teachers can plan their lessons from their offices and
retrieve them during the lesson. This can save time for the teachers who could have several
lessons in a day in different classrooms.
This study indicated that teachers who had access to the Internet at home and at school
were more likely to adopt technology than teachers who either had technology at home or school
or had none. Teachers used the Internet for accessing online materials, collaboration with
colleagues, and self-training. This indicates that there is evidence that the Internet is a significant
learning resource for mathematics teachers at the moment. Therefore, the government should
subsidize the Internet to make it cheaper and accessible at homes and schools.
The teachers who used technology had acquired laptops and smart phones for teaching
and personal use. Because not all teachers can afford technology, teachers should be given
incentives and subsidies to buy personal technology so as to encourage technology adoption in

225
mathematics teaching and to ensure uniformity. According to Rogers (2003), incentives can be
paid to individuals in order to encourage behavioral change and increase the degree of relative
advantage of a new idea.
Lastly, technology resources may support in reducing high student-teacher ratio. With
high large class sizes above 50 students for one teacher, that leaves the teacher with no choice
but to practice teacher-centered approaches in the classroom. Technology may play a significant
role in supporting individualized teaching. In this I mean, some math classes can be taught in a
computer lab where students can engage in exploration of mathematics concepts and the teacher
could facilitate the lesson as needed. This would help free up the time a teacher would spend in a
traditional class dictating notes and writing on the blackboard. But this could mean that more
time is created and also ease the burden the school curriculum imposes on the teachers and the
students.
Providing time and modifying the school curriculum. One of the concerns that
hindered teachers from using technology was the lack of time they needed to prepare for
technology-enhanced lessons. Teachers suggested that the school curriculum needed to be
modified to include technology integration. Current school curriculum in Kenya is not digitized
and does not reflect how technology can be used to teach mathematics. I believe that a
mathematics school curriculum that does not have proper guidelines on how technology can be
applied in the classroom may lead to wasted time as teachers must search themselves for learning
resources on the Internet. Therefore, for successful adoption of technology in mathematics
teaching, a curriculum with technology integrated into it is required. In addition, the lessons
should be extended from the current 40 minutes to about one hour to create time for students to
explore with technology.

226
The current school curriculum at Kenyan schools makes teachers feel burdened because
of the extra demands beyond the classroom. If teachers feel burdened by extra responsibilities,
then they may not create time to adopt technology, especially; considering that the participants
indicated that they are underpaid. I suggest that the government commits itself to employing
more teachers so that teachers have fewer responsibilities outside the classroom.
The national examinations are also hampering technology adoption because school
managers ask teachers to complete the syllabus early to prepare students to pass the KCSE.
Teachers fear being condemned if students fail the exams, and this makes them rush through the
syllabus regardless of whether students understand the content. In such instances, teachers would
not have opportunities to adopt technology in their teaching. Thus, the Ministry of Education
should promote a non-exam oriented system of education where students are evaluated
throughout their four years of learning. This could remove the burden of completing the syllabus
early and easily allow time for technology adoption.
Adopting technology plans for schools. The findings from this study indicated that the
national and county schools are ahead in technology adoption compared to the district and
community schools. This gap between these schools can be attributed to the fact that technology
adoption in Kenyan secondary school is just beginning and many structures are not yet in place.
Therefore, schools without adequate facilitates are being left behind in technology adoption as
they struggle to build more classrooms and put up infrastructure for technology adoption. That
aside, even well-equipped schools with substantial technology resources appear to have in place
an uncoordinated technology adoption plans.
This requires that schools develop technology plans to facilitate effective technology
adoption. School managers need to lead in formulating technology plans based on research and

227
successful models. Such plans might include knowing the skills that students will need to acquire
using technology, funding sources of technology resources, technology resources, technical
support, teachers’ training needs, and structure and delivery of lessons. Technology planning
committees must involve all education stakeholders including parents, students, teachers, and
technical experts so that all concerns and issues are addressed in advance. When all education
stakeholders are encouraged to participate in decision making at the schools, then technology
adoption is likely to occur.
Reassessing the educational goals of the Kenya Vision 2030. The main objective of
Kenya Vision 2030 of making Kenya a middle-income country by the year 2030 is hedged on
education, and particularly students’ success in mathematics learning. The current study reveals
that the implementation of Kenya Vision 2030 is at risk of failing to meet its objectives if the
current status of technology adoption in schools is not addressed urgently. Technology training
for teachers is low and poor, and there are not adequate resources to teach mathematics.
On the one hand, the government is not prioritizing technology training for teachers and
equipping schools with technology. On the other hand, the majority of teachers have limited
understanding about how technology can be used in the classroom to support students’ learning.
This calls for radical changes in the way technology training of mathematics teachers at both pre-
service and in-service levels is being handled. The government needs to commit significant
amounts of financial resources to equip schools with technology resources.
That said, the findings from this study are likely to generate heated conversations
between ministry of education officials on one hand, and researchers in education on the other
hand. Such conversations are not unusual in Kenyan society because many economic and social
policies in Kenya are politically motivated, which is the reason why historically most educational

228
reforms failed to achieve the goals they were intended to accomplish. However, the
recommendations from this study are based on research evidence, the literature, and the Rogers
(2003) theory and therefore my caution is that political ambitions should not to guide the
implementation of these findings. Rather, elaborate and careful action plans should be initiated to
support technology training for teachers and equipping schools with technological resources. I
suggest that the National ICT Innovation and Integration Centre (NI3C) be involved in the
implementation of the findings from this study because its goals are directly intended to support
the success of the Kenya Vision 2030.
I conclude that if elaborate measures are not taken as a matter of urgency, students’ poor
performance of mathematics is not likely to change soon, large class problems will continue to
persist, the goal of providing quality education to all Kenyans will not be possible, and the
Kenya Vision 2030 shall thus remain a dream.
Lessons for other developing countries. The Kenyan social and economic situation is
similar to other developing countries, particularly those from the sub-Saharan Africa. Thus, the
findings from this study might be valuable to these countries. The statistical model developed in
this study clearly describes the steps that may need to be taken to raise technology adoption in
mathematics teaching and this model could be replicated in other developing countries. The
findings in this study may also be used to develop educational policies for technology adoption
in schools more so for countries that have similar prosperity plans as Kenya.
Limitations of the Study
In this section I will discuss four limitations of my study. First, the survey questionnaire
for this study borrowed items from other technology adoption studies from developed countries.
The questionnaire might have failed to capture all the variables that might be related to

229
mathematics teachers’ adoption of technology in the Kenyan school context. Second, the survey
questionnaire was self-administered and therefore some of the responses could not be verified.
This may have impacted the final results of the study. Third, a mathematics teachers’ technology
adoption score did not establish the frequency of technology use based on technology
enhancement (used for mostly teaching purposes) and technology engagement (used for
engaging students in learning). This construct could be improved for future research.
Second, according to Rogers (2003), time is a significant element in the diffusion of
innovation process. However, time is a methodological adversary of the research on diffusion of
innovations because it is hard to measure the rate of technology adoption from when individuals
decided to adopt an innovation, particularly when survey instruments are used to collect data.
Rogers claimed that through using a survey instrument “the investigator can only measure time
through respondents’ recalls; a possibly weak reed on which to base the measurement of such an
important variable” (p. 127). Rogers also noted that there are alternative methods to collecting
data to measure time more accurately such as field experiments, case studies, and longitudinal
panel studies. The current study did not follow any of these alternative methods to collect data.
For this reason, the rate of technology adoption was omitted in the current study, and therefore
the past history of the technology experiences of these teachers was not established.
Third, technology adoption in the Kenyan education system is in its infancy; therefore,
Rogers’ (2003) distribution of adopter categories did not fit the sample data. This made it
difficult to assign teachers to each of the five categories of adopters: innovators, early adopters,
early majority, late majority, and laggards. Because I was careful to not report flawed results, I
collapsed the five adopter categories into early and late adopters. This might have failed to yield
precise reports about technology adoption in mathematics teaching in Kenya.

230
Lastly, the current study did not seek the views of students and school managers on
factors related to technology adoption. In short, the individual blame-bias was not adequately
addressed. Rogers (2003) suggested that to exonerate late adopters from the blame of failed
innovation, creators of innovations, communication channels and the beneficiaries of an
innovation need to be included and examined to understand a research problem. Therefore, the
findings may have failed to capture all the factors related to technology adoption in the Kenyan
education context.
Recommendations for Future Research
1. Future research should focus on the technology training of mathematics teachers and their
technological and pedagogical knowledge in classroom settings.
2. Future research should focus on in-service technology programs for mathematics teachers,
particularly on technology knowledge for trainers. This investigation should focus on the role
of the CEMASTEA and the NI3C in the training of mathematics teachers in Kenya.
Similarly, examination is needed of technology training in the pre-service teacher education
programs at the public universities and diploma teachers’ colleges. This would focus on
technology skills that pre-service teachers bring to the secondary school classrooms and how
their skills impact technology adoption in mathematics teaching in Kenya.
3. There is a need to investigate how the Internet is assisting teachers in the classroom to
support students’ learning in mathematics.
4. The role of the computer departments in technology adoption in Kenyan secondary schools
needs to be explored.
5. Future research should address teachers’ beliefs, time, attitudes, and collaboration for how
they may influence technology adoption in Kenyan secondary schools.

231
6. Inconsistent findings from the literature and the current study suggest that the relationship
between the demographic factors and technology adoption in mathematics teaching, are not
well understood. The role of the mean and median replacement of the missing values in
multiple regression models need to be investigated further.
7. Investigations are needed on the role of the diffusion of innovation theory in technology
adoption in mathematics teaching (particularly the innovation-decision stages, adopter
categories, and how the time element is related to the rate of technology adoption).
8. Develop a technology adoption model for Kenyan schools that is based on the elements of
the diffusions of innovations theory. Particularly, making improvements on mathematics
teachers’ technology adoption score to include technology enhancement (used mostly for
teaching purposes) and technology engagement (used for engaging students in learning).
9. Lastly, further research would be needed to interview teachers who do not have technology
to see how they perceive what would support them in adopting technology.
Summary
First, this chapter summarized the study and the major results and findings. Evidence
from this study showed technology training and technology resources stands out as the most
significant factors that may speed up the technology adoption process in mathematics teaching in
Kenyan secondary schools. The demographic factors revealed contradicting findings.
Second, I answered research question three—the mixed methods research question—
based on the statistically significant explanatory variables that predicted the model and by
drawing on the literature and Rogers (2003) (namely, his elements of diffusion: innovation,
communication, time, and social system). I summarize this discussion as follows: (1) teachers
stated the challenges that influenced their technology training, which include lack of training on

232
mathematical software skills, the issue of their technology trainers lacking technology skills,
setting up of training centers at the teachers’ localities, and lack of incentives and recognition. I
drew on the literature and Rogers’ (2003) innovation-decision processes. The research of Rogers
allowed for analysis of the earliness or lateness of knowing an innovation, the role of the change
agents and their homophily and heterophily characteristics, decentralized training systems, and
incentives and recognition, respectively, to understand technology training of mathematics
teachers; (2) the findings indicated that discussions about technology (collaboration) may
facilitate technology adoption. The literature also showed how the face-to-face discussions and
the Internet could play significant roles in supporting teachers to discuss technology adoption.
Based on Rogers’ theory, I also provided insights on the role of the Internet as a communication
channel, and how homophily and heterophily characteristics of individuals influence how
teachers discuss technology; (3) I briefly gave a comparison from the literature about how the
Internet has been instrumental in classroom practice, and I compared how the early and late
adopters had used the Internet for instructional and personal uses; (4) on educational technology
in general, the study revealed that availability of technology resources influences technology
resources; however, because technology innovation does not guarantee technology adoption, I
used the diffusion of innovations theory’s characteristics of innovation—relative advantage,
complexity, compatibility, trialibility, and observability—and their influence on the early and
late adopters of technology to elaborate on this variable; (5) my study showed that the age of a
teacher revealed contradictory findings and made conclusions based on Rogers’ (2003)
considerations about age on an innovator; and (6) I compared the national and county schools to
the district and community schools in terms of size, resources, and teacher competence. I made
conclusions based on Rogers’ elaboration of the organizational unit. Lastly, I also discussed
233
some statistically non-significant variables such as time and gender based on the literature and
Rogers’s theory.
Third, I discussed the main conclusions from the study based on the main findings of the
study. I discussed methodological issues, and I reviewed how Rogers’ (2003) diffusion of
innovations theory contributes to my dissertation.
Fourth, I discussed the implications of the study based on practice and policy. The main
issues include: enhance classroom uses of technology, provide technology training, provide
technology resources, provide time and modify the school curriculum, adopt technology plans
for schools, and reassess the educational goals for the Kenyan Vision 2030.
Fifth, I highlighted the limitations of the study. These limitations resulted from: the
survey questionnaire, the time dimension of the rate of technology adoption, the failure of the
data to match the Rogers’ (2003) diffusion of innovations categories of adopters, and the
individual-blame bias.
Lastly, I highlighted future research work that could be undertaken. These areas include
investigations of (1) the classroom uses of mathematical technologies, (2) in-service
(CEMASTEA and NI3C) and pre-service teacher training programs on technology training, (3)
the role of the Internet in mathematics teaching, (4) the role of the computer department in
technology adoption, (5) the influence of beliefs, time, attitudes, and collaboration on technology
adoption, (6) demographic information on technology adoption, and (7) the mean and median
replacement of the missing variables in multiple regression models on technology adoption, and
(8) the role of the diffusion of innovation theory (in particular, the innovation-decision stages,
adopter categories and time in measuring the rate of technology adoption) in Kenyan secondary

234
schools, and interview teachers who have no technology to document their views on what they
need to succeed in technology adoption.

235
References
Abu Bakar, K., Tarmizi, R., Ayub, A., & Yunus, A. (2009). Effect of utilizing Geometer’s
Sketchpad on performance and mathematical thinking of secondary mathematics
learners: An initial exploration. International Journal of Education and Information
Technologies, 1(3), 20-27.
African Population and Health Research Center (APHRC). (2010). A Policy Brief. Nairobi:
African Population and Health Research Center. Retrieved from
http://www.aphrc.org/insidepage/page.php?app=downloads&articleid=762
Agyei, D. D., & Voogt, J. M. (2011). Exploring the potential of the will, skill, tool model in
Ghana: Predicting prospective and practicing teachers’ use of technology. Computer &
Education, 56 (1), 91-100.
Akbaba-Altun, S. (2006). Complexity of integrating computer technologies in education in
Turkey. Educational Technology & Society, 9(1), 176–187.
Alagic, M. (2003). Technology in the mathematics classroom: Conceptual orientation. Journal of
Computers in Mathematics and Science Teaching, 22(4), 381-399.
Albirini, A. (2006). Cultural perceptions: The missing element in the implementation of ICT in
developing countries. International Journal of Education and Development using
Information and Communication Technology, 2(1), 49–65.
Al-Oteawi, S. (2002). The perceptions of Administrators and teachers in utilizing information
technology in instruction, administrative work, technology planning and staff
development in Saudi Arabia. Doctoral Dissertation, Ohio University.
Al-Senaidi, S., Lin, L., Poirot, J. (2009). Barriers to adopting technology for teaching and
learning in Oman. Computers & Education, 53(3), 575–590.

236
Angrist, J., & Lavy. V. (2002). New evidence on classroom computers and pupil learning.
Economic Journal, 112, 735-765.
Anthony, A. B., & Clarke, L. M. (2011). Examining dilemmas of practice associated with the
integration of technology into mathematics classrooms serving urban students. Urban
Education, 46(6), 1300–1331.
Archambault, L. M., & Barnett, J. H. (2010). Revisiting technological pedagogical content
knowledge: Exploring the TPCK framework. Computers & Education, 55(4), 1656-1662.
Archambault, L., & Crippen, K. (2009). Examining TPACK among K-12 online distance
educators in the United States. Contemporary Issues in Technology and Teacher
Education, 9(1), 71-88.
Artigue, M. (2002). Learning mathematics in a CAS environment: The genesis of a reflection
about instrumentation and the dialectics between technical and conceptual work.
International Journal of Computers for Mathematical Learning, 7(3), 245–274.
Babbie, E. (1990). Survey Research Methods. Belmont: Wadsworth Press.
Balanskat, A., Blamire, R., & Kefalla, S. (2006). The ICT impact report: A review of studies of
ICT impact on schools in Europe. Retrieved from
http://insight.eun.org/ww/en/pub/insight/misc/specialreports/impact_study.htm
Baxter, P., & Jack. S. (2008). Qualitative case study methodology: Study design and
implementation for novice researchers. The Qualitative Report, 13(4), 544-559.
Becker, H. J., & Ravitz, J. L. (2001). Computer use by teachers: Are Cuban’s predictions
correct? Paper presented at the Annual Meeting of the American Educational Research
Association, Seattle, WA.

237
Billington, M. (2009). Establishing didactical praxeologies: teachers using digital tools in upper
secondary mathematics classrooms. Paper presented in WG9, Cerme6 conference, 28
January–1 February 2009, Lyon, France.
Bogdan, R. C., & Biklen, S. K. (2007). Qualitative Research for Education: An Introduction to
Theories and Methods. (5th ed.). Needham Heights, Mass.: Allyn & Bacon.
Broady, T., Chan, A., & Caputi, P. (2008). Comparison of older and younger adults’ attitudes
towards and abilities with computers: Implications for training and learning. British
Journal of Educational Technology, 41(3), 473-485.
Bussey, J. M., Dormody, T. J., & VanLeeuwen, D. (2000). Some factors predicting the adoption
of technology education in New Mexico Public Schools. Journal of Technology
Education, 12(1), 4-17.
Cajilig, N. G. (2009). Integration of information and communication technology in mathematics
teaching in Metro Manila Public secondary schools, Education Quarterly, 67 (1), 79-91.
Cartas, R. A. (1998). The relationship between technology use by classroom teachers and factors
which promote innovation adoption. (Doctoral dissertation). University of Southern
California, California.
Cassim, K. M., & Obono, S. D. (2011). On the factors affecting the adoption of ICT for the
teaching of word problems. Proceedings of the World Congress on Engineering and
Computer Science, San Francisco, USA.
Çavaş, B., Çavaş, P., Karaoğlan, B., & Kısla, T. (2009). A study on science teachers' attitudes
toward information and communication technologies in education. The Turkish Online
Journal of Educational Technology-TOJET, 8(2), 20-32.
238
CEMASTEA project (2012). CEMASTEA strategic plan 2009-2013. Ministry of Education.
Republic of Kenya. Retrieved from
http://www.education.go.ke/Documents.aspx?docID=1409
Chio, Y. K. (1992). Attitudes toward and knowledge of microcomputers used for instruction
among commercial high school teachers in Korea. Unpublished EDD dissertation.
University of Georgia. AAT 9316322.
Chrysostomou, M., & Mousoulides, N. (2009). Teachers’ beliefs about the adoption of new
technologies in the mathematics curriculum. Proceedings of CERME, 6, pp. 1270-1279.
Chuttur, M.Y. (2009). Overview of the technology acceptance model: origins, developments and
future directions. Sprouts: Working Papers on Information Systems, 9(37), 1-23.
Retrieved from http://sprouts.aisnet.org/785/1/TAMReview.pdf
Coffland, D. A., & Strickland, A. W. (2004). Factors related to teacher use of technology in
secondary geometry instruction. Journal of Computers in Mathematics and Science
Teaching, 23(4), 347-365.
Cohen, J. (1988). Statistical power analysis for the behavrioural sciences (2nd
ed.). Hilldale, NJ-
Erlbaum.
Colandrea, J. L. (2012). The diffusion of computer-based technology in K-12 schools: Teachers'
perspectives. (Order No. 3518848, Fordham University). ProQuest Dissertations and
Theses, 142. Retrieved from
http://search.proquest.com/docview/1034280724?accountid=14214. (1034280724).
Cole, M., & Engeström, Y. (1991). A cultural-historical approach to distributed cognition. In G.
Salmon (Ed.) Distributed cognition, Cambridge: Cambridge University Press.

239
Conference Board of the Mathematical Sciences (CBMS). (2001). The mathematical education
of teachers. Providence, RI: American Mathematical Society.
Connors, M.A., & Snook, K.G. (2001). The effects of hand-held CAS on student achievement in
a first year college core calculus sequence. The International Journal of Computer
Algebra in Mathematics Education, 8(2), 48-59.
Cousineau, D., & Chartier, S. (2010). Outliers detection and treatment: A review. International
Journal of Psychological Research, 3(1), 58–67.
Cox, S. (2008). A conceptual analysis of technological pedagogical content knowledge.
Unpublished doctoral dissertation. Provo, UT: Brigham Young University.
Creswell, J. W. (2003). Research design: Qualitative, quantitative, and mixed method
approaches (2nd
ed.). Thousand Oaks, California: Sage Publications.
Creswell, J. W. (2008). Educational research: Planning, conducting, and evaluating
quantitative and qualitative research (3rd ed.). Upper Saddle River, NJ: Pearson
Education.
Creswell, J. W., & Plano Clark, V. L. (2006). Designing and conducting mixed methods
research. Thousand Oaks, CA: Sage.
Creswell, J. W., Plano Clark, V. L., Gutmann, M. L., & Hanson, W. E. (2003). Advanced
mixed methods research designs. In A. Tashakkori & C. Teddlie (Eds.), Handbook of
mixed methods in social and behavioral research (pp. 209-240). Thousand Oaks, CA:
Sage.
Cronbach, L. J. (1951). Coefficient alpha and the internal structure of tests. Psychometrika, 16,
297-334.

240
Cuban, L., Kirkpatrick, H., & Peck, C. (2001). High access and low use of technologies in high
school classrooms: Explaining an apparent paradox. American Educational Research
Journal, 38(4), 813–834.
Czaja, S. J., Charness, N., Fisk, A.D., Hertzog, C., Nair, S.N., Rogers, W.A., & Sharit, J. (2006).
Factors predicting the use of technology: Findings from the Center for Research and
Education on Aging and Technology Enhancement (CREATE). Psychology and Aging,
21, 333-352.
Davis, F. D. (1986). A technology acceptance model for empirically testing new end-user
information systems: Theory and results. (Doctoral dissertation). Retrieved from
http://hdl.handle.net/1721.1/15192
Davis, F. D. (1989). Perceived usefulness, perceived ease of use, and user acceptance of
information technology. MIS Quarterly, 13(3), 319-340.
Davis, J. A. (1971). Elementary survey analysis. Englewood Cliffs, NJ: Prentice–Hall.
Dawes, L. (2001).What stops teachers using new technology? In M. Leask (ed.), Issues in
teaching using ICT (pp. 61-79), London: Routledge Falmer.
Delnero, J., & Montgomery, D. (2001). Perceptions of work among California agriculture
teachers. Journal of Agricultural Education, 42(2), 56-67
Demiraslan, Y., & Usluel, Y. (2008). ICT integration in Turkish schools: Using activity theory to
study issues and contradictions. Australasian Journal of Educational Technology, 24(4),
458-474.
Denzin, N. K., & Lincoln, Y. S. (2005). Introduction: The discipline and practice of qualitative
research. In N. K. Denzin & Y. S. Lincoln (Eds.), Handbook of qualitative research (pp.
1-32). Thousand Oaks, CA: Sage.

241
Dexter, S., Anderson, R. E., & Becker, H. J. (1999). Teachers’ views of computers as catalysts
for changes in their teaching practice. Journal of Research on Computing in Education,
31(3), 221-239.
Díaz-Bordenave, J. (1976). Communication of agricultural innovations in Latin America.
Communication Research, 3(2), 135–154.
Dishaw, M., & Strong, D. (1999). Extending the technology acceptance model with task-
technology fit constructs. Information and Management, 36(1), 9-21.
Divaharan, S., & Ping, L. C. (2010). Secondary school socio-cultural context influencing ICT
integration: A case study approach. Australasian Journal of Educational Technology,
26(6), 741-763.
Doerr, H., & Zangor, R. (2000). Creating meaning for and with the graphing
calculator. Educational Studies in Mathematics. 41(2), 143–163.
Drijvers, P., Doorman, M., Boon, P., Reed, H., & Gravemeijer, K. (2010). The teacher and the
tool: Instrumental orchestrations in the technology-rich mathematics classroom.
Educational Studies in Mathematics, 75, 213–234.
Engeström, M. Y. (1987). Learning by expanding: An activity-theoretical approach to
developmental research. Helsinki, Orienta-Konsultit.
Engeström, Y. (1991). Developmental work research: Reconstructing expertise through
expansive learning, in Nurminen, M.I., Weir, G.R.S. (Eds.), Human jobs and computer
interfaces, Elsevier Science Publishers, Amsterdam.
Ertmer, P., & Ottenbreit-Leftwich, A. (2010). Teacher technology change: How knowledge,
confidence, beliefs, and culture intersect. Journal of Research on Technology in
Education, 42(3), 255–284.

242
Esterberg, K. G. (2002). Qualitative methods in social research. Boston: McGraw Hill.
Ferdig, R. E. (2006). Assessing technologies for teaching and learning: Understanding the
importance of technological pedagogical content knowledge. British Journal of
Educational Technology, 37(5), 749-760.
Fishbein, M., & Ajzen, I. (1975). Belief, attitude, intention, and behavior: An introduction to
theory and research. Reading, MA: Addison-Wesley.
Forgasz, H. J. (2002).Teachers and computers for secondary mathematics. Education and
Information Technologies, 7(2), 111–125.
Fowler, F.J. (2009). Survey Research Methods, (2nd
ed.). Thousand Oaks, CA: Sage
Garofalo, J., Shockey, T., Harper, S., & Drier, H. (2000). The Impact project at Virginia:
Promoting appropriate uses of technology in mathematics teaching. Virginia
Mathematics Teacher, 25(2), 14-15.
Githua, B. N., & Mwangi, J. G. (2003). Student mathematics self-concept and motivation to
learn mathematics: relationship and gender differences among Kenya’s secondary school
students in Nairobi and Rift valley province. International Journal of Educational
Development, 23(5), 487–499.
Gravemeijer, K. (2010). Realistic mathematics education theory as a guideline for problem-
centered, interactive Mathematics Education. In Sembiring, R. K., Hoogland, K., & Dolk,
M., (Eds.), A decade of PMRI in Indonesia, Bandung, Utrecht: APS International.
Green, S. B. (1991). How many subjects does it take to do a regression analysis? Multivariate
strategic decision processes. Academy of Management Journal, 35, 515-542.
Guba, E. G., & Lincoln, Y. S. (1989). Fourth generation evaluation. Newbury Park: Sage.

243
Guin, D., & Trouche, L. (1999). The complex process of converting tools into mathematical
instruments. The case of calculators. International Journal of Computers for
Mathematical Learning, 3(3), 195–227.
Gülbahar, Y. (2007). Technology planning: A roadmap for successful technology integration in
schools. Computers & Education, 49, 943-956.
Handal, B., Cavanagh, M., Wood, L., & Petocz, P. (2011). Factors leading to the adoption of a
learning technology: The case of graphics calculators. Australasian Journal of
Educational Technology, 27(2), 343-360.
Harris, J., Mishra, P., & Koehler, M. (2009). Teachers’ technological pedagogical content
knowledge and learning activity types: curriculum-based technology integration
reframed. Journal of Research on Technology in Education, 41(4), 393–416.
Hartsell, T., Herron, S., Fang, H., & Rathod, A. (2009). Effectiveness of professional
development in teaching mathematics and technology applications. Journal of
Educational Technology Development & Exchange. 2(1), 53-64.
Haspekian, M. (2005). An ‘‘Instrumental Approach’’ to study the integration of a computer tool
into mathematics teaching: The case of spreadsheets. International Journal of Computers
for Mathematical Learning, 10, 109–141.
Hong, K. S., & Koh, C. K. (2002). Computer anxiety and attitudes toward computers among
rural secondary school teachers: A Malaysian perspective. Journal of Research on
Technology in Education, 35(1), 27-48.
Howe, K. R. (2004). A critique of experimentalism. Qualitative Inquiry, 10(1), 42-61.
Huang, H. M., & Liaw, S. S. (2005). Exploring user's attitudes and intentions toward the web as
a survey tool. Computers in Human Behavior, 21(5), 729-743.

244
IDRC (International Development Research Centre). (1991). Empowerment through knowledge:
the strategy of the International Development Research Centre. IDRC, Ottawa, ON,
Canada.
Inan, F. A., & Lowther, D. L. (2010). Factors affecting technology integration in K-12
classrooms: a path model. Educational Technology Research and Development, 58(2),
137–154.
International Society for Technology in Education (ISTE). (2008). National educational
standards for teachers, (2rd Ed.) Eugene, OR: Author.
Isleem, M I. (2003). Relationships of selected factors and the level of computer use for
instructional purposes by technology education teachers in Ohio public schools: a
statewide survey (Doctoral dissertation, The Ohio State University, 2003). ProQuest
Digital Dissertations. (UMI No. AAT 3124087)
http://search.proquest.com/docview/305303761?accountid=14214. (305303761)
Ivankova, N., Creswell, J., & Stick, S. (2006). Using mixed methods in sequential explanatory
design: From theory to practice. Field Methods, 18(3), 3-20.
Jackiw, N. (1995). The Geometer’s Sketchpad. Emeryville, California: Key Curriculum Press,
1995.
Jhurree, V. (2005). Technology integration in education in developing countries: Guidelines to
policy makers. International Education Journal, 6(4), 467-483.
Jimoyiannis, A. (2010). Designing and implementing an integrated technological pedagogical
science knowledge framework for science teachers’ professional development.
Computers and Education, 55(2010), 1259 – 1269.

245
Johnson, R. B., & Onwuegbuzie, A. J. (2004). Mixed methods research: A research paradigm
whose time has come. Educational Researcher, 33(7), 14-26.
Johnson, R. B., & Turner, L. A. (2003). Data collection strategies in mixed methods research. In
A. Tashakkori & C. Teddlie (Eds.), Handbook of mixed methods in social and behavioral
research (pp. 297-319). Thousand Oaks, CA: Sage.
Jonassen, D.H., & Reeves, T. C. (1996). Learning with technology: Using computers as
cognitive tools. In D.H. Jonassen (Ed.), Handbook of research for educational
communications and technology (pp. 693-719). New York: Macmillan.
Karsenti, T., Villeneuve, S., & Goyer, S. (2006). The impact of motivation on prospective
teachers’ use of information and communication technologies (ICTs). In C. Crawford et
al. (Eds.), Proceedings of Society for Information Technology and Teacher Education
International Conference 2006 (pp.1659 – 1666). Chesapeake, VA: AACE.
Keith, T. (2006). Multiple regression and beyond. Pearson Allyn & Bacon.
Keong, C. C., Horani, S., & Daniel, J. (2005). A study on the use of ICT in mathematics
teaching. Malaysian Online Journal of Instructional Technology (MOJIT). 2(3), 43-51.
Khambari, M. N. M., Moses, P., & Wong, S. L. (2009). Laptop ownership and use among
educators: Reflections from school teachers in Malaysia. International Journal of
Instruction, 2(2), 47–72
Kiptalam, G. K., & Rodrigues, A. J. (2010). Internet utilization: A case of connected rural and
urban secondary schools in Kenya. International Journal of Computing and ICT
Research, 4(1), 49 - 63.

246
KNBS (Kenya National Bureau of Statistics (2012). Statistical abstract 2011. Nairobi: Kenya
National Bureau of Statistics. Retrieved from:
http://www.knbs.or.ke/Examination%20Analysis.php
Kumar, N., Rose, R., & D'Silva, J. (2008). Predictors of technology deployment among
Malaysian teachers. American Journal of Applied Sciences, 5(9), 1127-1134.
Kuuti, K. (1996). Activity theory as a potential framework for human-computer interaction
research. In Nardi (Ed.), Context and consciousness: Activity theory and human computer
interaction. (pp. 17-44). Cambridge, MA: MIT Press.
Landry, G. A. (2010). Creating and validating an instrument to measure middle school
mathematics teachers’ technological pedagogical content knowledge (TPACK) (Doctoral
dissertation, University of Tennessee - Knoxville). Retrieved from
http://trace.tennessee.edu/utk_graddiss/720
Lau, B.T., & Sim, C. H. (2008). Exploring the extent of ICT adoption among secondary school
teachers in Malaysia. International Journal of Computing and IT Research, 2(2) 19-36.
Lau, W. W. F., & Yuen, A. H. K. (2013). Educational technology training workshops for
mathematics teachers: An exploration of perception changes. Australasian Journal of
Educational Technology, 29(4), 595-611.
Lavicza, Z., & Papp‐Varga, Z. (2010). Integrating GeoGebra into KAMAU‐equipped teaching
environments: Preliminary results. Technology, Pedagogy and Education, 19(2), 245-
252.
Lawson, T., & Comber, C. (1999). Superhighways technology: personnel factors leading to
successful integration of information and communications technology in schools and
colleges. Journal of Information Technology for Teacher Education, 8(1), 41-53.
247
Leontõev, A. (1979). The problem of activity in psychology. In J. Wertsch (ed.), The concept of
activity in Soviet psychology (pp. 37-71). Armonk, New York: M.E. Sharpe.
Liang, M. T. L., & Chao, J. Y. G. (2002). Investigating into the Internet Literacy of Elementary
and Junior High School Teachers in Taiwan. World Transactions on Engineering and
Technology Education, 1(1), 129-131.
Lichty, M. (2000). The innovation-decision process and factors that influence computer
implementation by medical school faculty. Doctoral Dissertation, Instructional
Technology, Wayne State University, UMI ProQuest Digital Dissertations, 9966157.
Lim, C. P., & Khine, M. S. (2006). Managing teachers’ obstacles to ICT integration in Singapore
schools. Journal of Technology and Teacher Education, 14(1), 97–125.
Luria, A. (1976). Cognitive development: its cultural and social foundations. Cambridge,
Harvard University Press.
Maftuh, B. (2011). Innovation of classroom teaching and learning through lesson study.
Presented at Tsukuba International Conference: Tsukuba University, Japan, and 17-20
February 2011. Retrieved June 15, 2012 from
http://www.criced.tsukuba.ac.jp/math/apec/apec2011/19-20/06_BunyaminMaftuh-
paper.pdf.
Makhanu, E. S. (2010). Principals’ literacy in information and communication technology
(ICT): Towards improving secondary school performance in Kenya. (Unpublished
doctoral dissertation). University of South Africa, Pretoria.
Manoah, S., Chisikwa, F., Indoshi, L., & Othuon, O. (2011). Influence of attitude on
performance of students in mathematics curriculum. Educational Research, 2(3), 965-
981.
248
Manouchehri, A. (1999). Computers and school mathematics reform: Implications for
mathematics teacher education. Journal of Computers in Mathematics and Science
Teaching, 18(1), 31-48.
McEwan, H., & Bull, B. (1991). The pedagogic nature of subject matter knowledge. American
Educational Research Journal, 28(2), 316–334.
McGehee, J., & Griffith, L. K. (2004). Technology enhances student learning across the
curriculum. Mathematics Teaching in the Middle School, 9(6), 344-349.
Miles, J., & Shevlin, M. (2001). Applying regression and correlation: A Guide for Students and
Researchers. Sage: London.
Mishra, P., & Koehler, M. J. (2006). Technological pedagogical content knowledge: A
framework for teacher knowledge. Teachers College Record, 108(6), 1017–1054.
Mji, A., & Makgato, M. (2006). Factors associated with high school learners' poor performance:
A spotlight on mathematics and physical science. South African Journal of Education,
26(2), 253–266.
Momanyi, L., Norby, R., & Strand, S. (2006). The need for integration of technology in K-12
school settings in Kenya, Africa. AACE Journal, 14(2), 154-177.
Morgan, C. Parr, B., & Fahrman, N. (2011). Enhancing collaboration among math and career and
technical education teachers: Is technology the answer? Journal of Career and Technical
Education, 26 (2), 89.
Morgan, C., & Parr, B. (2009). Using technology to increase collaboration between career tech
and core subject teachers. Techniques, 84 (8), 48-52.
Morgan, M. (2008). More productive use of technology in the ESL/EFL classroom. The Internet
TESL Journal, 14(7). Retrieved from: http://iteslj.org/Articles/Morgan-Technology.html

249
Morse, J. M. (1991). On funding qualitative proposals [Editorial]. Qualitative Health
Research, 192, 147-151.
Mueller, J., Wood, E., Willoughby, T., Ross, C., & Specht, J. (2008). Identifying discriminating
variables between teachers who fully integrate computers and teachers with limited
integration. Computers and Education, 51, 1523-1537.
Nangue, R. C. (2011). Guidelines for the successful integration of ICT in schools in Cameroon.
(Unpublished master’s thesis). Nelson Mandela Metropolitan University, South Africa.
National Council for Accreditation of Teacher Education (NCATE) (2002). Professional
standards for the accreditation of schools, colleges, and departments of education .
Washington, DC: Author.
National Council of Teachers of Mathematics (NCTM) (2000). Principles and standards for
school mathematics. Reston, VA.
Nicklin, J. L. (1992). Teacher’s use of computers stressed by education colleges. The Chronicle
of Higher Education, 38(43), 15-17.
Niess, M. L. (2006). Guest editorial: Preparing teachers to teach mathematics with technology.
Contemporary Issues in Technology and Teacher Education, 6(2), 195-203.
Norris, C., Sullivan, T., Poirot, J., & Soloway, E. (2003). No access, no use, no impact: Snapshot
surveys of educational technology in K-12. Journal of Research on Technology in
Education, 36(1), 15-27.
Nunnally, J. C. (1978). Psychometric theory (2nd
ed.). New York: McGraw Hill.
Ocak. M. A. (2005). Mathematics teachers’ attitudes toward the computers. The Turkish Online
Journal of Educational Technology, 4(3), 82-89.

250
Ochanda, J. P., & Indoshi, F. C. (2011). Challenges and benefits of using scientific calculators in
the teaching and learning of Mathematics in secondary school education. Journal of
Media and Communication Studies, 3(3), 102-111.
Ogwu, E. N., & Ogwu, F. J. (2010). Technologies and utilization in schools: Its implications to
learning. Journal of Technology Integration, 2(1), 49-57.
Oncu, S. Delialioglu, O., & Brown, C. (2008). Critical components for technology integration:
How do instructors make decisions? The Journal of Computers in Mathematics and
Science Teaching, 27(1), 19-46.
Oppong, S.H. (2013). The problem of sampling in qualitative research. Asian Journal of
Management Sciences and Education, 2(2), April 2013.
Peeraer, J., & Van Petegem, P. (2011). ICT in teacher education in an emerging developing
country: Vietnam’s baseline situation at the start of ‘The Year of ICT’. Computers &
Education, 56, 974–982.
Pisapia, J. (1994). Teaching with technology: Exemplary teachers. Research Brief #6. (ERIC
Document Reproduction Service No. ED 411 359). Richmond, VA: Metropolitan
Educational Research Consortium.
Pitcher, N. (1998). Educational software in mathematics: Developing and using a mathwise
module, International Journal of Mathematical Education in Science & Technology,
29(5), 709–20.
President’s Committee of Advisors on Science and Technology (1997). Report to the president
on the use of technology to strengthen K-12 education in the United States.
http://www.whitehouse.gov/wh/eop/ostp/nstc/pcast/k-12.html

251
Rana, N. (2013). A study to assess teacher educators' attitudes towards technology integration in
classrooms. MIER Journal of Educational Studies, Trends and Practices, 2(2), 190-205.
Redman, D., & Kotrlik, J. (2009). Family and consumer sciences teachers’ adoption of
technology for use in secondary classrooms. Journal of Family & Consumer Sciences
Education, 27 (1), 29–45.
Republic of Kenya. (2006). National Information & Communications Technology (ICT) strategy
for Education and Training. Nairobi: Government Printer.
Republic of Kenya. (2007). Kenya Vision 2030; A competitive and prosperous Kenya. Nairobi:
Government Printers.
Rizzo, A. (2003). Activity centered in-service training and teachers’ take-up of ICT. IFIP
Working Conference: ICT and the Teacher of the Future, St. Hilda’s College, The
University of Melbourne, Australia, URL: http://dl.acm.org/citation.cfm?id=857129
Rodrigo, M.T. (2003). Tradition or transformation? An evaluation of ICTs in metro Manila
schools. Information Technology for Development, 10(2), 95–123.
Rogers, E. M. (1995). Diffusion of innovations. New York: Free Press.
Rogers, E. M. (2003). Diffusion of innovations (5th
ed.). New York: Free Press.
Rogers, K. R., & Wallace, J, D., (2011). Predictors of technology integration in education: A
Study of anxiety and innovativeness in teacher preparation. Journal of Literacy and
Technology, 12(2).
Ruthven, K., & Hennessy, S. (2003). Successful ICT use in secondary mathematics—a teacher
perspective. Micromath, 19(2), 20–24.
252
Ruthven, K., Deaney, R., & Hennessy, S. (2009). Using graphing software to teach about
algebraic forms: A study of technology-supported practice in secondary-school
mathematics. Educational Studies in Mathematics, 71(3), 279-297.
Ruthven, K., Hennessy, S. & Brindley, S. (2004). Teacher representations of the successful use
of computer-based tools and resources in teaching and learning secondary English,
Mathematics and Science. Teaching and Teacher Education, 20(3), 259-275.
Ryan, T. P. (1997). Modern regression methods. New York: John Wiley & Sons, Inc.
Sahin, I. & Thompson, A. (2006). Using Rogers’ theory to interpret instructional computer use
by COE faculty. Journal of Research on Technology in Education, 39 (1), 81–104.
Sale, J. Lohfeld, L., & Brazil, K. (2002). Revisiting the quantitative-qualitative debate:
implications for mixed-methods research. Quality & Quantity, 36, 43-53
Sang, G., Valcke, M., Van Braak, J., & Tondeur, J. (2009). Factors support or prevent teachers
from integrating ICT into classroom teaching: A Chinese perspective. Proceedings of the
17th International Conference on Computers in Education (pp. 808-815). Hong Kong:
Asia-Pacific Society for Computers in Education.
Savin, N. E., & White, K. J. (1977). The Durbin-Watson test for serial correlation with extreme
sample sizes or many regressors, Econometrica, 45 (1977), 1989-1996.
Schmidt, D. A., Baran, E., Thompson, A. D., Mishra, P., Koehler, M. J., & Shin, T. S. (2009).
Technological Pedagogical Content Knowledge (TPCK): The development and
validation of an assessment instrument for pre-service teachers. Journal of Research on
Technology in Education, 42(2), 27.
Segall, A. (2004). Revisiting pedagogical content knowledge: the pedagogy of content/the
content of pedagogy. Teaching and Teacher Education, 20(5), 489–504.

253
Sherry, L., & Gibson, D. (2002). The path to teacher leadership in educational
technology. Contemporary Issues in Technology and Teacher Education [Online
serial], 2(2). Available: http://www.citejournal.org/vol2/iss2/general/article2.cfm
Shulman, L. S. (1986). Those who understand: Knowledge growth in teaching. Educational
Researcher, 15, 4–14.
SMASSE project. (1998). Strengthening mathematics and science in secondary education
project. Ministry of Education Science and Technology. Republic of Kenya.
Souter, M. T. (2002). Integrating technology into the mathematics classroom: An action research
study. Action Research Exchange, 1(1). Retrieved from:
http://chiron.valdosta.edu/are/Artmanscrpt/vol1no1/souter_am.pdf
Spradley, J. P., (1980) Participant Observation. New York: Holt. Rinehart and Awiti.
Srisurichan, R. (2012). Teachers' accounts of successful technology integration in teaching
mathematics. (Doctoral Dissertation), University of Wisconsin-Madison, Madison.
Stake, R. E. (1995). The art of case study research. Thousand Oaks, CA: Sage.
Stryker, C. (2000). Teaching successful telecourses. Bozeman, MT, National Teachers
Enhancement Network: Montana State University.
Tabachnick, B. G., & Hamisil, L. S. (2001). Using multivariate statistics (4th ed.). Boston, MA:
Allyn and Bacon.
Tarmizi, R., Ayub, A., Abu Bakar, K., & Yunus, A. (2008). Instructional efficiency of utilization
of autograph technology vs handheld graphing calculator for learning algebra.
International Journal of Education and Information Technologies, 2(3). 184-193
Tashakkori, A., & Teddlie, C. (1998). Mixed methodology: Combining qualitative and
quantitative approaches. Thousand Oaks, CA: Sage.

254
Taylor, S. J., & Bogdan, R. C. (1998). Introduction to qualitative research methods: A guidebook
and resource (3rd
ed.). New York: Wiley.
Tella, A., Tella, A., Toyobo, O. M., Adika, L. O., & Adeyinka, A. A. (2007). An assessment of
secondary school teachers’ use of ICTs: Implication for further developments of ICT’s
use in Nigerian secondary schools. The Turkish Online Journal of Educational
Technology, 6(3), 5-17.
Teo, T., Luan, W.S., & Sing, C. C. (2008). A cross-cultural examination of the intention to use
technology between Singaporean and Malaysian pre-service teachers: An application of
the Technology Acceptance Model (TAM). Educational Technology and Society, 11 (4),
265–280.
Tezci, E. (2011). Turkish primary school teachers’ perceptions of school culture regarding ICT
integration. Educational Technology Research and Development, 59(3), 429-443.
Thompson, A. D., & Mishra, P. (2007). Breaking news: TPCK becomes TPACK! Journal of
Computing in Teacher Education, 24(2), 38, 64.
Toomela, A. (2008). Activity theory is a dead end for methodological thinking in cultural
psychology too. Culture and Psychology, 14, 289-303.
Tostensen, A., & Scott, J. G. (1987). Kenya: Country study and Norwegian aid review. Nairobi:
The CHR Michelsen Institute.
Trouche, L. (2004). Managing complexity of human/machine interactions in computerized
learning environments: Guiding students’ command process through instrumental
orchestrations. International Journal of Computers for Mathematical Learning, 9, 281–
307.

255
United Nations. (2006). The Millennium Development Goals Report. Retrieved from
http://mdgs.un.org/unsd/mdg/Resources/Static/Products/Progress2006/MDGReport2006.
pdf.
United Nations. (2010). The Millenium Development Goals Report. Retrieved from
http://www.un.org/millenniumgoals/pdf/MDG%20Report%202010%20En%20r15%20-
low%20res%2020100615%20-.pdf
Ve´rillon, P., & Rabardel, P. (1995). Cognition and artifacts: A contribution to the study of
thought in relation to instrumented activity. European Journal of Psychology of
Education, 10, 77–103.
Vygotsky, L. (1978). Mind in society: the development of higher psychological processes.
Cambridge, Harvard University Press.
Wabuyele, L. C. (2003). Understanding teachers‟ and administrators perceptions and
experiences towards computer use in Kenyan classrooms: A case study of two schools
(Doctoral dissertation). Ohio University, Athens. Retrieved from
http://etd.ohiolink.edu/view.cgi?acc_num=ohiou1071169942
Wanjala, M. M. S., Khaemba, E. N., & Mukwa, C. (2011). Significant factors in professional
staff development for the implementation of ICT education in secondary schools: A case
of schools in Bungoma District. International Journal of Curriculum and Instruction,
1(1), 30 – 42.
Wertheimer, R. (1990). The geometry proof tutor: An “intelligent” computer-based tutor in the
classroom. Mathematics Teacher, 83(4), 308-317.
Whattananarong, K. (2004). An experiment in the use of mobile phones for testing at King
Mongkut’s Institute of Technology North Bangkok, Thailand. Proc. International

256
Conference on Making Education Reform Happen: Learning from the Asian Experience
& Comparative Perspectives, Bangkok, Thailand.
Wims, P., & Lawler, M. (2007). Investing in ICTs in educational institutions in developing
countries: An evaluation of their impact in Kenya. International Journal of Education
and Development using ICT, 3(1), 5-22.
Wintz, P. (2009). Making quality education accessible to all through technology: A case study on
accelerating quality delivery of the mathematics curriculum by re-tooling mathematics
classrooms with only one computer, International Journal of Education and
Development using Information and Communication Technology, 5(3), 72-84.
Yara, P., Wanjohi, C. (2011). Performance determinants of Kenya Certificate of Secondary
Education (KCSE) in mathematics of secondary schools in the Nyamaiya Division,
Kenya. Asian Social Science, 7(2), 107-112.
Yıldırım, S. (2000). Effect of an educational computing course on pre-service and in-service
teachers: A discussion and analysis of attitudes and use. Journal of Research on
Computing in Education, 32(4), 479–495.
Yin, R. K. (2003). Case study research: Design and methods (3rd ed.). Thousand Oaks, CA:
Sage.

257
Appendix A: A Visual Display of the Sequential Explanatory Mixed Methods Research
Design
Phase Procedure Result
Quantitative data
collection
Cross-sectional Survey
(N=128)
Random sampling procedure
Numeric data
Quantitative data
analysis
Quantitative data analysis
(SPSS 20.0)
Data coding, cleaning, dummy
coding
Missing value analysis
Multiple regression analysis
Descriptive statistics
Total effects
Explained variance
F-Statistic
t-statistic
p-values
Case selection Maximal variation sampling
(N=6)
Qualitative data
collection
Pre-observation interview
Classroom observation
Post-observation interview
Semi-structured interviews
Textual data
Qualitative data
analysis
Open coding
Thematic analysis
Within case and across case
analysis
Data triangulation
Teacher profiles
Codes and themes
Results Answer research Question 1
(Quantitative)
Answer research question 2
(Qualitative)
Statistical Results
Narratives
Discussion Answer research question 3
(mixed methods)
Comparison from the literature
and Rogers (2003) diffusion of
innovations theory
Summary of the study
Conclusion
Implications
Limitations
Recommendation for
future research

258
Appendix B: Mathematics Teachers’ Survey Questionnaire
Thank you for considering completing this survey questionnaire. The survey instrument will not take more than 20
minutes of your time. I will request that you kindly take some time and fill this survey out honestly and accurately.
The results will go a long way towards improving secondary mathematics teaching in Kenya.
Clarification: The terms “technology” and “educational technology” used throughout the survey refer to an array of
computer-based tools in current mathematics classrooms that might prove helpful in advancing student learning.
These tools include, but are not limited to, software (e.g., Word, PowerPoint, Excel, Dynamic/Interactive Geometry
Software, Computer Algebra Systems), hardware (e.g., graphing calculators, interactive whiteboards, mobile
phones, computers), and Internet applications/activities requiring high speed algorithms or other processes using
computerized data.
Section A: Technology Adoption Level
1. Frequency of technology use: Please circle the number that indicates how often you have integrated each of
the following technologies in your classroom teaching activities.
Nev
er
On
ce o
r tw
ice
a te
rm
On
ce o
r tw
ice
a
mo
nth
On
ce o
r tw
ice
a w
eek
3-4
tim
es a
wee
k
Dai
ly
a. Word (or equivalent software) 1 2 3 4 5 6
b. PowerPoint (or equivalent software) 1 2 3 4 5 6
c. Excel (or equivalent software) 1 2 3 4 5 6
d. Graphing Calculators 1 2 3 4 5 6
e. Dynamic Statistics Software 1 2 3 4 5 6
f. Dynamic/Interactive Geometry Software 1 2 3 4 5 6
g. Computer Algebra Systems 1 2 3 4 5 6
h. The Internet 1 2 3 4 5 6
i. Interactive Whiteboards 1 2 3 4 5 6
j. Educational technology in general 1 2 3 4 5 6
k. Other (specify) 1 2 3 4 5 6
2. Technology-based Innovation-decision process: Deciding to adopt a new product, procedure, or instructional
strategy is seen as a process that occurs over time. The following statements are designed to determine where
you are in this process with regard to using computer technologies for instruction. Please select all of the
statements that apply to you. NB: Select only those that apply to you.

259
_____I am previewing computer-based programs to incorporate in my course. (P)
_____I read brochures from companies marketing computer-based learning programs. (K)
_____I evaluate student learning using computer-based instruction (C)
_____I will use computer-based instruction on a trial basis during the coming year (D)
_____I am planning to attend a workshop on effective instructional methods for computer-based technologies (I)
_____I think about how computer-based instruction might be implemented in my course (P)
_____I have observed demonstrations of computer equipment and programs for mathematics education (K)
_____I am developing compute-based programs for the coming year (D)
_____I discuss the pros and cons of computer-based learning programs with my colleagues (K)
_____I have integrated computer-based instruction into my normal curriculum planning activities (C)
_____I have thought about attending a profession conference dealing with computer-based applications (P)
_____I encourage my colleagues to consider computer technologies for instruction (I)
_____I am evaluating with colleagues who are using computer-based instruction in mathematics education (P)
_____I evaluate students’ attitudes towards computer-based instruction (C)
_____I have decided not to use computer based applications for instruction next year (D)
_____I am using computer based learning programs in my instruction (I)
_____I understand how computer-based learning programs function or work (K)
_____I have secured funding to support my efforts with computer-based programs (I)
_____I read journal articles about-computer-based applications in my area of specialization (K)
_____I will use computer based instructional programs during next academic year. (D)
_____I recognize the benefits and limitations of using computers for instruction (C)
_____I have secured the technical assistance I need to effectively implement computer-based technologies (I)
_____I am considering the advantages and disadvantages of computer-based instruction (P)
_____I am supportive of efforts to provide quality computer-based instruction (C)
Section B: Factors Influencing Technology Adoption
3. In-service training: To date, how much in-service training have you received on the use of the following
technologies?
No
ne
Ro
ug
hly
On
ce
a t
erm
Ap
pro
xim
ate
ly
on
ce a
m
on
th
Ab
ou
t o
nce
a
wee
k
Nea
rly
dail
y
a. Word (or equivalent software) 1 2 3 4 5
b. PowerPoint (or equivalent software) 1 2 3 4 5
c. Excel (or equivalent software) 1 2 3 4 5
d. Graphing Calculators 1 2 3 4 5
e. Dynamic Statistics Software 1 2 3 4 5
f. Dynamic/Interactive Geometry Software 1 2 3 4 5
g. Computer Algebra Systems 1 2 3 4 5
h. The Internet 1 2 3 4 5
i. Interactive Whiteboards 1 2 3 4 5

260
j. Educational technology in general 1 2 3 4 5
k. Other (Specify) 1 2 3 4 5
4. School support: Please circle the number that indicates your level of agreement with each
of the following statements about school support.
Str
on
gly
Dis
ag
ree
Mo
der
ate
ly
Dis
ag
ree
Sli
gh
tly
Dis
ag
ree
Sli
gh
tly
Ag
ree
Mo
der
ate
ly
Ag
ree
Str
on
gly
Ag
ree
a. My school encourages the implementation of instructional
technology.
1 2 3 4 5 6
b. My school encourages the development of technology-based
instructional materials.
1 2 3 4 5 6
c. My school enhances the use of instructional technology by
providing me with needed material and equipment.
1 2 3 4 5 6
d. My school places importance on technology-based
instruction.
1 2 3 4 5 6
e. My school provides technical support to teachers 1 2 3 4 5 6
f. My school provides enough opportunities for teachers to
meet and share ideas about the use of instructional
technology with one another.
1 2 3 4 5 6
g. My school provides adequate technology-based teacher
professional development.
1 2 3 4 5 6
h. My school encourages teachers to observe exemplary
teachers in technology-based instruction within or between
schools.
1 2 3 4 5 6
i. My school provides a great deal of opportunity to try
various computers for instructional purposes.
1 2 3 4 5 6
5. Availability of technology resources: Indicate the availability of the following technology
resources for mathematics teachers at your school.
Yes
No
Not
Sure
a. Office (e.g., Word, PowerPoint, Excel) or equivalent software 1 2 3
b. Graphing Calculators 1 2 3
c. Dynamic Statistics Software 1 2 3

261
d. Dynamic/Interactive Geometry Software 1 2 3
e. Computer Algebra Systems 1 2 3
f. The Internet 1 2 3
g. Interactive Whiteboards 1 2 3
h. Educational technology in general 1 2 3
i. Instructional Facilities 1 2 3
j. Student computer labs 1 2 3
k. Technology-equipped classrooms 1 2 3
l. Technical support 1 2 3
m. Technology facilities in general 1 2 3
6. Knowledge of technology: Please read the descriptions and circle the number that best describes your level of
familiarity with each of the following technologies.
1) Unfamiliar: I have no experience with the technology.
2) Newcomer: I have attempted to use the technology, but I still require help on a regular basis.
3) Beginner: I am able to perform basic functions in a limited number of the technology’s applications.
4) Average: I demonstrate a general competency in a number of the technology’s applications.
5) Advanced: I have acquired the ability to competently use a broad spectrum of the technology.
6) Expert: I am extremely proficient in using the technology.
Un
fam
ilia
r
New
com
er
Beg
inn
er
Av
era
ge
Ad
va
nce
d
Ex
per
t
a. Word (or equivalent software) 1 2 3 4 5 6
b. PowerPoint (or equivalent software) 1 2 3 4 5 6
c. Email 1 2 3 4 5 6
d. Excel (or equivalent software) 1 2 3 4 5 6
e. Graphing Calculators 1 2 3 4 5 6
f. Dynamic Statistics Software 1 2 3 4 5 6
g. Dynamic/Interactive Geometry Software 1 2 3 4 5 6
h. Computer Algebra Systems 1 2 3 4 5 6

262
i. The Internet on mobile phone 1 2 3 4 5 6
j. The Internet on computers 1 2 3 4 5 6
k. Interactive Whiteboards 1 2 3 4 5 6
l. Educational technology in general 1 2 3 4 5 6
7. Perceived barriers: Please rate how the following barriers would limit you from integrating technology in
mathematics teaching at your school?
Do
es
no
t li
mit
Sli
gh
tly l
imit
So
mew
ha
t li
mit
Gre
atl
y l
imit
s
a. Amount of time required to learn about technology 1 2 3 4
b. Amount of time required to use technology in a mathematics lesson 1 2 3 4
c. Network/Internet connection problems while on campus 1 2 3 4
d. Lack of current hardware and/or software 1 2 3 4
e. Lack of technology support in classrooms or labs 1 2 3 4
f. Lack of access to technology-enhanced classrooms or labs 1 2 3 4
g. Lack of necessary technical knowledge to use technology 1 2 3 4
h. Lack of teaching knowledge specific to the technology-enhanced
environment
1 2 3 4
i. Lack of models/examples of effective uses of technology 1 2 3 4
j. Difficulty keeping up with changes in technology 1 2 3 4
k. Negative side effects of the Internet on moralities and traditions of
Kenyan people
1 2 3 4
l. Lack of a computerized mathematics curriculum 1 2 3 4
m. No computerized textbooks for of mathematics curricula 1 2 3 4
8. Perceived characteristics of technology: Please circle the number that indicates the extent to which you agree
or disagree with the following statements.

263
The use of Technology in the classroom…...
Str
on
gly
Dis
agre
e
Mo
der
atel
y D
isag
ree
Sli
gh
tly
Dis
agre
e
Sli
gh
tly
Ag
ree
Mo
der
atel
y A
gre
e
Str
on
gly
Ag
ree
a. Is an effective tool for all students 1 2 3 4 5 6
b. Increases academic achievement (e.g., grades). 1 2 3 4 5 6
c. Promotes the development of students’ interpersonal skills
(e.g., ability to relate or work with others).
1 2 3 4 5 6
d. Improves student learning of critical concepts and ideas. 1 2 3 4 5 6
e. Helps accommodate students’ personal learning styles. 1 2 3 4 5 6
f. Promotes the development of communication skills (e.g.,
writing and presentation skills).
1 2 3 4 5 6
g. Motivates students to get more involved in learning activities. 1 2 3 4 5 6
h. Promotes student collaboration. 1 2 3 4 5 6
i. Could be learned by students on their own, outside of school. 1 2 3 4 5 6
j. Is a valuable instructional tool. 1 2 3 4 5 6
k. Eases the pressure on me as a teacher. 1 2 3 4 5 6
l. Makes teachers feel more competent as educators. 1 2 3 4 5 6
m. Gives teachers the opportunity to be learning facilitators
instead of information providers.
1 2 3 4 5 6
n. I have had a great deal of opportunity to try various computers
for instructional purposes.
1 2 3 4 5 5
o. Fits well with the way I like to teach. 1 2 3 4 5 6
p. Enhances my professional development. 1 2 3 4 5 6
q. Is difficult for me because I cannot keep up with frequent
changes in technology
1 2 3 4 5 6
r. Is difficult to use while teaching mathematics 1 2 3 4 5 6
9. Types of technology adopters: Please mark with an “X” the response below that best describes your computer
use for instructional purposes. (Please choose only one response)

264
Type of adopters Best of me
(Choose ONLY one )
I was using computer technology for instructional purposes before most teachers in my
school knew what it was or before the school purchased equipment.
I was one of the first teachers in my school to use computer technology for instructional
purposes when the school first purchased equipment.
I was not one of the first teachers in my school to begin using computer technology, but
used it ahead of most of my colleagues.
I used computer technology for instructional purposes late than most of my colleagues.
I was among the latest teachers at my institution using computer technology for
instructional purposes
I have not used computer technology at all for instructional purposes
10. Personal ownership of a technology device: Indicate if you own any of the following technology devices
Technology Device No Yes
a. Tablet device (e.g., iPad, Xoom, Galaxy) 1 2
b. Smart phone ( e.g., iPhone, Blackberry, Droid phone) 1 2
c. Cellphone (not "smart phone") 1 2
d. Audio player (audio-only mp3 player such as iPod Shuffle) 1 2
e. Video player (e.g., video-capable iPod such as iTouch) 1 2
f. Laptop computer/mini-laptop, Tablet e.g., ipad 1 2
g. Digital camera or digital video camera (NOT part of cellphone) 1 2
h. e-Book reader (e.g., Kindle, Nook) 1 2
i. Other (please specify) 1 2
11. Hours: On average, how many hours per week do you spend using various educational technologies outside the
classroom (including for lesson preparation and personal use)?
o None
o Less than 1 hour

265
o 1 hour or more, but less than 3 hours
o 3 hours or more, but less than 5 hours
o 5 hours or more, but less than 10 hours
o 10 hours or more
12. Instructional style: Which best describes your typical instructional style (Please check only one):
o Largely teacher-directed (e.g., teacher-led discussion, lecture)
o More teacher-directed than student-centered
o Even balance between teacher-directed and student-centered activities
o More student-centered than teacher-directed
o Largely student-centered (e.g., cooperative learning, discovery learning)
13. Collaboration: Do you collaborate for effective adoption of technology strategies with:
Nev
er
Ra
rely
So
met
ime
s Oft
en
Ver
y
Oft
en
a. Colleagues 1 2 3 4 5
b. Students 1 2 3 4 5
c. Technology experts 1 2 3 4 5
d. Teachers in the field 1 2 3 4 5
e. Administration 1 2 3 4 5
f. Colleagues outside the Faculty of Education 1 2 3 4 5
g. Family or friends 1 2 3 4 5

266
14. Ways of acquiring technology skills
Indicate the best answer, that describes how you have learned
your technology skills
Nev
er
Rar
ely
So
met
imes
Oft
en
Ver
y O
ften
a. Computer Courses 1 2 3 4 5
b. Self-taught 1 2 3 4 5
c. Technology Workshops at my school 1 2 3 4 5
d. Colleagues 1 2 3 4 5
e. Your students 1 2 3 4 5
f. Pre-service teacher program 1 2 3 4 5
g. In-service teacher program 1 2 3 4 5
Section C: Demographic Data
15. What is your gender
o Male
o Female
16. Please choose the category that best indicates your age group
o 20-30 years
o 31-40 years
o 41-50 years
o 51-60 years
o Other (please specify)____________
17. What type of community does your school serve?
o Largely rural
o Largely suburban
o Largely urban
18. What type of school do you teach?
o National school
o County school
o District school
o Community school
o Other(please specify)___________
19. Indicate your level of education:
o Teacher college diploma
o Bachelor’s degree
o Master’s degree
o Doctorate (Ph.D. or Ed. D)
o Other (please specify)_____________
20. Your current teaching position:
o TSC mathematics teacher

267
o Local authority mathematics teacher
o PTA board of governors mathematics teacher
21. Your number of years of full-time high school mathematics teaching completed ___________(e.g.,
if this is your first year, write ‘0’; if last year was your first, write ‘1’; and so on)
22. Average class size for the mathematics class (es) that you most commonly teach is approximately _________
students per class.
23. What is your school principal’s subject major?
o Arts
o Sciences
o Mathematics
24. Where do you have a computer?
o Home___________
o School______________
o Both_______________
o I don’t have__________
25. Where do you usually use a computer?
o Home________________
o School_______________
o Both_______________
o I do not use it___________
26. Do you have access to the Internet? Yes__________ No _________
If yes please specify where:
Home_________ School_________ Both_________ I do not use it_________
27. Do you have computers in your classroom? Yes_________ No ______________
If yes, how many computers are in your classroom? _____________computers
28. Is there a computer lab for the students? Yes__________ No___________
If yes, how many computers are there? ______________computer(s)

268
Appendix C: Semi-Structured Interview Protocol
Interview Questions for teachers: Adopters
1. How long have you been teaching?
2. How many years have you been teaching at this school?
3. Where and how did you learn about various technologies?
4. Has your level of education influenced how you adopt technology for instruction in
mathematics teaching?
5. How has teaching experience influenced you to adopt technology in mathematics teaching?
6. How long have you taught in your current position in this school? How has that position
influenced you how you to adopt technology in mathematics teaching?
7. How has your typical instructional style influenced how you adopt technology in
mathematics teaching?
8. How has professional learning (in-service training) supported you in adopting technology in
mathematics teaching?
9. Do you feel the time you spend using technology outside the classroom influence you on
how you use technology to teach mathematics? If yes, in which ways? If no, why not?
10. How has the school leadership supported you in the process of using technology in your
classroom?
11. Is it possible for a teacher without teaching experience to see the impact of using technology
by attending a technologically enabled class? If yes what would they learn from the
experience? If no, explain.
12. Is it possible for an instructor to try technology before adopting it in the actual classroom
setting? If Yes, how? If no, explain.
13. How has the availability of technology resources in your school enabled you or inhibited you
from adopting technology in your class?
14. To what extent do you feel your knowledge of technology enables your or inhibits you to
adopt technology in the classroom teaching?
15. Did you receive any instructions about effective adoption of technology before using it in
your classroom? If yes, what are you some of the advantages of using technology compared
to other methods you have used in mathematics teaching? If no, how did you gain the skills
to use technology you use in your classroom?
16. Is it possible for an instructor to combine technology with other methods of teaching in a
classroom? If yes, in which ways? If no, why not?
17. How does time influence your decisions to adopt technology in your teaching profession?
18. What are the barriers that inhibit you from using technology in your teaching? How do you
think you can overcome these barriers?
19. Do you think owning a technology device plays any part in influencing a teacher to use
technology or not in their teaching profession? If you, how? If not, why?
20. Do you collaborate with other people in learning how to use technology in teaching? Who do
you collaborate with? How is the collaboration like?
Interview Questions for Teachers: non-adopters
1. How long have you been teaching?
2. How many years have you been teaching at this school?

269
3. Have you ever considered using technology in your teaching profession?
4. Do you think teachers’ experience might influence whether they adopt technology or not in
mathematics teaching?
5. How long have you taught in your current position in this school? How has that position
influenced you how you to adopt technology in mathematics teaching?
6. How has your typical instructional style influenced you adopt technology in mathematics
teaching?
7. What is your view on professional learning (in-service training) in the use of technology in
mathematics teaching?
8. Do you feel the time you spend using technology outside the classroom might influence you
how you use technology to teach mathematics? If yes, in which ways? If no, why not?
9. How has the school leadership been supportive to teachers in process of using technology in
your classroom?
10. Have you ever seen or been in a class where the instructor uses technology? If yes what did
you learn from the experience? If no, what would you expect to learn if you had such an
opportunity?
11. Have you ever tried technology or wished you could try using technology in a classroom? If
yes, what did you learn? If no, what are your expectations from such an experience?
12. Does the availability of technology resources in your school inhibit you from adopting
technology in your class? If so, how? If not, explain why?
13. To what extent do you feel your knowledge of technology inhibits you to adopt technology in
the classroom teaching?
14. Do you think using technology in your teaching profession to you? To the students? If so
what are the advantages? If not, what are the reasons?
15. Is it possible for an instructor to combine technology with other methods of teaching in a
classroom? If yes, in which ways? If no, why not?
16. How does time influence your decisions to use technology in your teaching profession?
17. What are the barriers that inhibit you from using technology in your teaching? Do these
barriers play any part in your decision not to adopt technology?
18. Do you think owning a technology device plays any part in influencing a teacher to adopt
technology their teaching profession? If so, how? If not, why not?
19. Do you collaborate with other people in learning how to use technology in teaching? Who do
you collaborate with? How is the collaboration like?
20. What else would you say about technology in a classroom?

270
Appendix D: Classroom Observation Protocol: Early Adopters and Late adopters
*Pre-Observation Conference
Take me through, step by step, what you are planning to do when I observe your class. How do
you anticipate your students will respond to technology adoption during this lesson? (Early
Adopters only)
What strategies do you think they will use?
What will be easy, and what will be difficult?
1. Is there anything in particular that you are hoping to happen in class? How will that be
accomplished?
Actual Classroom Observation
1. Describe the structure of the lesson that you observe. What is happening in the classroom?
What is the teacher doing?, and the students doing?
2. How do the teachers and the students interact? Try to capture examples of the type of
questions teachers ask students and how students respond, as well as the questions students
ask teachers and the teachers’ responses.
3. Do the students have an opportunity to interact with one another? Is so, how do they interact?
Do they work on a task as a group? Do they provide feedback to one another?
4. Is the technology being used part of the mathematical tasks? If that is so, how, and for what
purpose? Is the teacher or students experiencing difficulties in their use of the technology?
Are they able to trouble shoot?
5. What other resources are used by the teacher? (e.g., visual aids, blackboard, worksheets etc.).
What other technologies are being used in the lesson?
6. What else does the teacher do? What else do the students do?
**Post-observation Interview
1. How do you feel things went during the observed lesson?
How did things compare to what you expected?
Did anything surprise you?
Were there any ways you felt challenged during this lesson?
2. Now I would like you to walk through your lesson and ask questions about specific parts.
(Use field notes to review lesson, inserting questions about particular aspects of the lesson).
Typical probes
o The selection for tasks/examples/representations
o Reasons for teacher moves during the different parts of the lesson, especially
related to student thinking
o Impressions of how students were thinking about the various tasks
3. How did the technology influence your teaching of this lesson? (Early adopters only)
My Reflection of the Lesson

271
Please reflect on the lesson and complete the following questions as soon as possible after
observation.
1. What is the teachers overall approach to classroom instruction (facilitator, classroom
manager in control, teacher as co-learner, etc.?)
2. Did the students seem to be clear on the procedure of the activity or confused?
3. What components of the lesson/task did students seem enthusiastic about? Include specific
examples of student comments and actions to illustrate.
4. How did the students respond to the technology used? Did they seem bored, interested, and
engaged?
5. Was there something about technology that seemed difficult for the teacher of students to do?
Did any glitches with the technology impede the process of the lesson? (adopters)
6. What other reflects do you think about the lesson?
*This protocol is adapted from (1) http://www.intel.com/content/dam/doc/design-
guide/education-cloud-computing-design-toolkit-guide.pdf and from
**http://www.jstor.org/stable/pdfplus/10.5951/jresematheduc.42.1.0002.pdf?acceptTC=true

272
Appendix E: *A Map of Kenya
*Source: http://www.geographicguide.com/africa-maps/kenya.htm
Nyandarua
County
Data Collection
Center 1
Nairobi
County
Data Collection
Center 2

273
Appendix F: Research Authorization in Kenya

274
Appendix G: Consent Form
Syracuse University
Mathematics Education Program
Consent Form
My name is Leonard Kamau, and I am a student at Syracuse University. I am inviting you
to participate in a dissertation study. Your involvement in the study is voluntary, so you may
choose to participate or not. This sheet will explain the study to you and please feel free to ask
questions about the research if you have any. I will be happy to explain anything in detail if you
wish.
I am interested to studying the extent of technology adoption secondary mathematics
teaching in Kenya. Because you are a secondary school teacher, I would like to give you a
survey questionnaire for you to complete. In addition, if you are selected for the second phase of
the study, I plan to observe your classroom and have an interview with you that will last not
more than one hour. I will record the interview and late make transcriptions from the recordings.
All information will be kept private and confidential. All articles written about this study or
presentations made using data from this study will adopt pseudonyms for you, your class, and
your school to conceal your identity.
The benefit of this study is that you will help us to understand how to improve teaching
and learning of mathematics using technology. This information will be helpful to the
government of Kenya in the implementation of the Kenya Vision 2030 in addition to helping
researchers better understand how technology use can be used to improve teaching and learning
of mathematics.
The risk to you for participating in this study is that you may feel uncomfortable being
interviewed or recorded or talking about some of the questions during the interview. If at any
time, you no longer wish to continue, you have the right to withdraw from the study, without
penalty.
On one hand, five participants who complete the survey questionnaires will be selected
through a raffle draw and each awarded mobile phone airtime Ksh.1000 each. On the other hand,
I will select five participants for qualitative phase of the study and I will compensate each
participant for their time during the semi-structured interview with $15. The participants will be
compensated for the part they will complete. In light of this, even of if a participant might
withdraw half-way through the study, I will pro-rate their compensation to recognize the time
and effort put prior to their withdrawal.
I will use the following procedures to minimize risks during this study: (a) gaining
voluntary permission to participate in the study, (b) providing pseudonyms for you, the class, and

275
the school (c) providing permission for withdrawal from the study at any time, (d) keeping data
in a locked cabinet, and (e) destroying the audiotapes at the end of the study.
You may ask any questions, concerns or complaints regarding this research and you can
contact Leonard Mwathi Kamau through Email: [email protected], Phone: (315) 3955614. If
you have any questions about your rights as a research participant, concerns, or complaints that
you wish to address to someone other than the investigator or if you cannot reach the
investigator, please contact the Syracuse University Institutional Review Board at 315-443-3013.
All of my questions have been answered, I am over the age of 18 and I wish to participate
in this research study. I have received a copy of this consent form.
I (please check one)
___ I agree to complete the survey questionnaire
___I do not agree complete the survey questionnaire
I (please check one)
___I agree to be audiotaped
___I do not agree to be audiotaped.
_________________________________________
Printed name of participant
_______________________________________ _________________________
Signature of participant Date
Leonard Mwathi Kamau
Print name of Investigator
_________________________________________ _________________________
Signature of investigator Date
Joanna O. Masingila [email protected] 315-443-1483
Investigator’s Advisor Advisor’s email address Advisor’s phone
276
Appendix H: Institutional Review Board Syracuse University

277
Vita
Name of the Author: Leonard Mwathi Kamau
Degrees Awarded:
Bachelor of Education Science (Mathematics), 1999, Kenyatta University, Kenya
Master of Arts (Mathematics), 2001, Central Michigan University, USA
Teaching Experience:
Graduate Assistant, Central Michigan University, 1999-2001
Teaching Assistant, Syracuse University, 2009-2014
Publications:
Kamau, L.M. (2014). The future of ICT in Kenyan schools from a historical perspective: A
review of the literature. Journal of Education and Human Development, 2(2).
Conferences:
Kamau, L.M. (2012). Secondary pre-service teachers’ understanding of the concept of inverse
function. Poster session presented at the research pre-session of the annual meeting of the
National Council of Teachers of Mathematics, Philadelphia, PA.
Kamau, L. M. (2013). Secondary pre-service teachers’ proficiency in linking inverse functions
using different representations. Paper presented in the proceedings at the International
Conference on Education, Kenyatta University Conference Centre, Nairobi, Kenya.
Professional Development:
Future Professoriate Program (2011-2012) at Syracuse University
Awards and Recognition:
Robert M. Exner Prize 2013 winner for excellence in the Ph.D. Qualifying
Examination

278
Outstanding Teaching Assistant award (2013) for excellence in classroom
teaching at Syracuse University
Doctoral Prize (2014) for superior achievement in the PhD dissertation