Embed Size (px)
Citation preview
Mathematics and Science inSecondary SchoolsThe Deployment of Teachers and Support Staffto Deliver the Curriculum
Helen Moor, Megan Jones, Fiona JohnsonKerry Martin and Elizabeth CowellNFER
and
Chris BojkePharMerit
Research Report RR708
RESEARCH

Research Report No 708
Mathematics and Science in Secondary Schools
The Deployment of Teachers and Support Staff to Deliver the Curriculum
Helen Moor, Megan Jones, Fiona Johnson
Kerry Martin and Elizabeth Cowell NFER
and
Chris Bojke PharMerit
The views expressed in this report are the authors’ and do not necessarily reflect those of the Department for Education and Skills. © NFER Trading Limited 2006 ISBN 1 84478 656 0
Contents Executive Summary i Introduction 1 PART ONE Deployment in mathematics 13Chapter 1 Who is teaching mathematics 14 Key findings 14 1.1 Introduction 15 1.2 Who is teaching mathematics in one in five
secondary schools? 16
1.3 The qualifications of heads of mathematics departments and mathematics teachers
20
1.4 Characteristics of heads of mathematics departments and mathematics teachers
35
1.5 Concluding comments 41 Chapter 2 The staffing of mathematics lessons 42 Key findings 42 2.1 Introduction 43 2.2 Decision making regarding the deployment of
teachers to classes 43
2.3 The deployment of teachers to mathematics classes
46
2.4 Strategies for alleviating staff shortages 54 2.5 Concluding comments 58 Chapter 3 The contribution of support staff in
mathematics departments 59
Key findings 59 3.1 Introduction 60 3.2 Numbers of support staff 60 3.3 Tasks undertaken by support staff 61 3.4 Satisfaction with support staff 62 3.5 Developing the contribution of support staff 64 3.6 Concluding comments 67 Chapter 4 Views of support staff working with
mathematics departments 69
Key findings 69 4.1 Introduction 70 4.2 Characteristics of support staff working with
mathematics departments 70
4.3 Tasks undertaken by support staff working with 75
mathematics departments 4.4 Professional development of support staff
working with mathematics departments 78
4.5 Concluding comments 80 Chapter 5 Professional satisfaction of mathematics
teachers, heads of department and support staff
82
Key findings 82 5.1 Introduction 84 5.2 Professional satisfaction and intention to
remain in teaching amongst mathematics teachers and heads of department
84
5.3 Factors associated with satisfaction and likelihood of staying in teaching amongst teachers and heads of departments
92
5.4 Meeting teachers’ professional development needs 98
5.5 Professional satisfaction amongst support staff working with mathematics departments 100
5.6 Concluding comments 103 PART TWO Deployment in science 105Chapter 6 Who is teaching science 106 Key findings 106 6.1 Introduction 108 6.2 Who is teaching science in one in five
secondary schools? 109
6.3 The qualifications of heads of science departments and science teachers 113
6.4 Characteristics of heads of science departments and science teachers
132
6.5 Concluding comments 137 Chapter 7 The staffing of science lessons 138 Key findings 138 7.1 Introduction 139 7.2 Decision making regarding the deployment of
teachers to classes 139
7.3 The deployment of teachers to science classes 141
7.4 Strategies for alleviating staff shortages 151 7.5 Concluding comments 154
Chapter 8 The contribution of technicians and support staff in science departments
155
Key findings 155 8.1 Introduction 156 8.2 Numbers of science technicians 156 8.3 Tasks undertaken by science technicians 156 8.4 Number of other support staff working with
science departments 158
8.5 Tasks undertaken by other support staff 159 8.6 Satisfaction with science technicians and
support staff 160
8.7 Developing the contribution of support staff 162 8.8 Concluding comments 164 Chapter 9 Views of technicians and other support staff
working with science departments 165
Key findings 165 9.1 Introduction 166 9.2 Characteristics of technicians working with
science departments 166
9.3 Tasks undertaken by technicians working with science departments 171
9.4 Supporting other departments 173 9.5 Professional development of technicians
working with science departments 174
9.6 Views of other support staff working with science departments
177
9.7 Concluding comments 179 Chapter 10 Professional satisfaction of science teachers,
heads of department and support staff 180
Key findings 180 10.1 Introduction 182 10.2 Professional satisfaction and intention to
remain in teaching amongst science teachers and heads of department
182
10.3 Factors associated with satisfaction and likelihood of staying in teaching amongst teachers and heads of department
191
10.4 Meeting the professional development needs of teachers 196
10.5 Professional satisfaction amongst technicians and other support staff working with science departments
198
10.6 Concluding comments 201 PART THREE Economic analysis: an overview 203

11.1 Introduction 204 11.2 The distribution of teachers per capita across
England 205
11.3 The role of teacher income in determining supply and the distribution of supply 212
11.4 Overall conclusion of economic analysis 214 CONCLUSION 216 APPENDIX Economic analysis 221 1 Introduction 222 2 Data considerations 223 3 The distribution of teachers per capita across
England 228
4 The role of teacher income in determining supply and the distribution of supply 263
5 Final conclusion 270 REFERENCES 272

Acknowledgements We would like to express our sincere thanks to those schools involved in the pilot stage of the research and to staff in the case-study schools for accommodating visits by the research team and for giving up their valuable time to talk to us. We would also like to thank the survey sample schools, in particular, the departmental heads, teachers and support staff who completed the questionnaires. Special gratitude is also extended to colleagues at the Department for Education and Skills, the Training and Development Agency for Schools, the Royal Society of Chemistry, the Institute of Physics, The Royal Society and Comberton Village College, who together formed the Steering Group for the study. Their guidance, support and good counsel was invaluable in enabling us to carry out this research. We are also very grateful to our colleagues at the NFER, including Simon Rutt, one of the project statisticians, and Keren Beddow from Research Data Services for administering the surveys to teachers and departmental heads. Equally, we would like to convey our thanks to Debbie Banks and Jennie Harland for their assistance with the survey. We very much appreciate the guidance and project direction of Kay Kinder and John Harland. Finally, we would like to thank Hilary McElderry and Julie Thompson for their valuable support.
Executive Summary i
Executive Summary This summary sets out in brief the findings of a study examining deployment in mathematics and science departments in one in four maintained secondary schools in England. The research was conducted by the National Foundation for Educational Research (NFER) on the behalf of the Department for Education and Skills (DfES) during the academic year 2004–2005. The evidence was collected via: • a postal questionnaire to departmental heads and teachers of mathematics and
science • a postal and telephone survey of support staff who assisted in these departments
and • case-study visits to 12 departments, deemed by their local authority to exemplify
good deployment practices in mathematics and science. Deployment in mathematics 1 Who is teaching mathematics Analysis was undertaken that considered all teachers who taught mathematics, both those based in the department and those who were principally teachers of other subjects. According to departmental heads’ responses, more than three-quarters were mathematics specialists (i.e. had a degree in maths or a degree incorporating some maths or had studied maths as part of initial teacher training – ITT). The remaining 24 per cent were either non-specialists or were predominately teachers of other subjects. An examination of the qualifications of the 3,220-strong teacher sample revealed that the proportion of non-specialists teaching mathematics was not distributed evenly across schools. Schools with lower than average GCSE results had higher proportions of the least qualified teachers (i.e. those without a post-A-level qualification in mathematics). This was also the case in schools with higher than average numbers of pupils eligible for free school meals (FSM) and those with higher numbers of pupils with special educational needs (SEN). 2 The staffing of maths lessons Analysis was undertaken to ascertain how deployment varies by year group / course and ability grouping. Regarding the deployment of teachers by year group, the key difference was apparent at AS/A2-level where a much greater amount of the time was taught by teachers with a degree in maths than was the case in key stages 3 and 4. In terms of the teachers without a post-A-level qualification in mathematics, they taught the subject across key stage 3 and key stage 4. On the basis of this teacher sample, they delivered upwards of 10 per cent of the mathematics time from Year 7 to Year 11.

ii Executive Summary
Teachers’ qualifications in mathematics emerged as a key determinant of the ability groups they taught. Teachers with no post-16 qualifications in mathematics tended to be deployed to teach low ability groups throughout key stages 3 and 4. In contrast, teachers with a degree in mathematics were most likely to be allocated to teach high ability groups. This was the case throughout key stages 3 and 4, though was especially so in Year 9 and at GCSE. Almost one-third of mathematics departmental heads responded that their department had experienced ‘a great deal’ of difficulty with regards to shortages of maths-specialist teaching staff and almost three-fifths had experienced shortages ‘quite a lot’ or ‘a great deal’. 3 The contribution of support staff to mathematics
departments Analysis highlighted the value of those support staff (e.g. teaching assistants, administrative assistants) who were based solely in the department. This occurred in only a minority of mathematics departments (30 per cent). However, where this was the case, both mathematics teachers and departmental heads were significantly more satisfied with the amount and quality of in-class and administrative support they received. There was also an association between satisfaction and the presence of maths-dedicated support staff who were regarded as specialists in the subject itself, either through background or training. However, only 10 per cent of departments in the sample registered having such support staff. Several of the ‘good practice’ mathematics departments visited for the case-study phase of the research employed support staff who worked exclusively with their department. 4 The views of support staff working with
mathematics departments In total, 136 support staff working with mathematics departments were surveyed as part of the research. Seventy per cent of these respondents had a qualification in mathematics / numeracy equivalent to GCSE grade C or above. Less than half (43 per cent) held qualifications of this level or above in English. Thus, whilst admittedly a small sample, three-fifths of these support staff did not possess sufficient qualifications to be eligible for higher level teaching assistant (HLTA) status. In addition to the departmental advantages as stated above, there was evidence that being based in one department was also of benefit to the support staff themselves. The maths-dedicated support assistants surveyed were significantly more satisfied overall than those working across the school and also had access to greater professional
Executive Summary iii
development opportunities. Further, in terms of the tasks undertaken, maths-dedicated support staff were significantly more likely to support the learning of groups in class, to carry out marking and to perform administrative tasks. 5 Professional satisfaction among mathematics
teachers and departmental heads Amongst teachers and heads of department, most respondents emerged as either neutral or broadly satisfied with regard to their satisfaction with working life, though a significant minority of about one-fifth of teachers and one-quarter of departmental heads were dissatisfied. Satisfaction was slightly lower amongst heads of department than amongst teachers of maths, but despite this departmental heads were significantly more likely than teachers to believe that they would still be working in teaching in five years’ time. Areas of particular dissatisfaction were related to workload (especially for heads of department) and pupil behaviour. Further, when multiple regression analysis was carried out to ascertain what school- department- and individual-level factors were independent predictors of satisfaction, among the significant predictors for both teachers and departmental heads were:
• school attainment level (higher attainment was associated with greater satisfaction)
• time teaching maths (longer teaching maths was associated with lower satisfaction)
• shortages of maths-specialist teaching staff (more shortages were associated with lower satisfaction).
Levels of satisfaction amongst support staff were high. Their greatest areas of dissatisfaction were with pay, professional development and career progression, whilst they were content with their working hours and conditions. Deployment in science 6 Who is teaching science According to departmental heads’ responses, eight per cent of those teaching science were non-specialists or were principally teachers of other subjects. This is a much smaller proportion than the corresponding figure for mathematics (24 per cent) However, there was an imbalance between the school sciences in teachers’ qualifications. Overall, 44 per cent of science teachers held a specialism in biology in contrast to one-quarter with a specialism in chemistry and one-fifth with a specialism in physics. Further, physics specialists, as well as constituting the smallest group of the three, had also attained lower degree classes on average.

iv Executive Summary
Teachers with a degree in the school sciences, and in particular, in chemistry or physics tended to be more strongly represented in schools with an age-range of 11–18 years. For example, one-quarter of 11–16 schools did not have any physics specialists. Schools with higher than average GCSE results and lower than average numbers of pupils eligible for free school meals tended to have a higher proportion of teachers with a science degree. 7 The staffing of science lessons Analysis was undertaken to ascertain how deployment of teachers varies by year group / course and science. The lower numbers of teachers with a degree in physics or chemistry compared with those holding a biology degree meant that in this sample they taught smaller proportions of science time in each year of key stage 3 and for single award, double award, applied science and other key stage 4 science courses. This would inevitably mean students receiving less exposure to specialists in physics particularly and also chemistry, which could perhaps affect their perceptions of these sciences and possibly militate against their selecting these sciences for further study. In terms of double award science, the biology element was best served regarding the proportion of teachers who taught this and had specialised in this science. In the 2,756-strong science teacher sample, around two-thirds of those teaching the biology element of double award science had a biology degree or had qualified to teach this at ITT. In contrast, of those teaching double award chemistry, two-fifths had studied chemistry at degree level or by ITT. The figures were lower still for physics. Indeed, here physics specialists were actually outnumbered by the proportion of staff who taught double award physics yet held no qualifications at post-16 level or above in the subject (no A-level in physics or above). In this sample, the vast majority of the teaching time in each of A-level biology, chemistry and physics – around 90 per cent – was taken by those with a degree in the particular science or who had specialised in this as part of their ITT. None the less, this still left around 10 per cent of the time (13 per cent in A-level physics) – not an insignificant amount – to be taught by those who either held no qualifications at post-16 level or above in the science or whose highest qualification in the science was itself A-level. 8 The contribution of support staff in science
departments All but one of the heads of science surveyed recorded having at least one science technician working with their department. Heads’ of department and teachers’ satisfaction ratings for the amount and quality of technical assistance received were consistently higher than those for in-class and administrative support.
Executive Summary v
Heads of department were asked to report if there were any support staff (other than technicians) working only within the science department. The majority (80 per cent) recorded that, save technicians, they did not have any support staff attached solely to their department. As was the case with mathematics, analysis revealed that where departments had dedicated support staff, departmental heads were significantly more satisfied with the amount and quality of in-class support and administrative support their department received. 9 The views of technicians and support staff
working with science departments As part of the research, the experiences and perceptions of 187 science technicians were collected. The views were also sought of 42 other support staff who worked with the science department (e.g. teaching assistants and departmental assistants). The majority of science technicians (80 per cent) had a qualification in science equivalent to GCSE grade C or above. Of the other support staff, the most frequently held highest qualification in science was O-level grades A-C or passes with just under one-third of respondents (14) citing this. On the whole, the majority of technicians (around 70 per cent) rarely or never carried out learning support tasks in the science department. None the less, where technicians were keen to take on further roles or duties in the science department, the most frequent response was for a greater involvement with pupils. Several of the ‘good practice’ case-study science departments deployed technicians to demonstrate experiments or work with groups or individuals in class. One in three technicians had never been included in either the science department or whole-school development/training sessions. Just over three-quarters of technicians (77 per cent), however, reported that they had attended professional development/training sessions specifically for their role or about science in general. 10 Professional satisfaction in science Around two-fifths of science teachers and heads of department were broadly satisfied with their professional lives, whilst around one-quarter were dissatisfied. The majority of both groups were either neutral or somewhat positive about their work. Heads of science departments were more likely than teachers to believe that they would still be working in teaching in five years’ time, despite reporting similar levels of overall satisfaction with their professional life. As was the case in mathematics, the amount of work required again appears to be a considerable source of dissatisfaction for teachers, and particularly for heads of department. High levels of dissatisfaction with pupil behaviour were also seen amongst both groups. Further, in multiple regression analyses, which examined a number of possible predictors of overall satisfaction simultaneously, departmental

vi Executive Summary
shortage of science-specialist staff emerged as a strong and significant independent predictor of overall professional dissatisfaction for both teachers and heads of departments. 11 Economic analysis An economic analysis of teacher numbers per capita across England and in particular across Government Office Region and schools with differing levels of pupil FSM eligibility was undertaken. This showed that although the numbers of teachers per capita in mathematics and science subjects across England and the various sub-groups are relatively even, consideration of the specialisation and nature of those teachers reveals a different pattern. Specialised staff per capita are relatively and consistently far more scarce in relatively deprived areas and also in areas in which employees with these specialisations have a higher expected non-teaching salary. Furthermore, in geographical areas that have higher non-teaching salaries, the relationship between deprivation and a lower supply of specialist teachers appears most pronounced. Similarly, the relationship between supply and deprivation is most pronounced in those disciplines that have the higher external salaries (mathematics, chemistry and physics). The economic analysis corroborated findings that many schools are using non-specialists or teachers of other subjects to make up for the shortfall of scarce specialists. The relationship is such that those schools with high FSM levels in areas which have higher non-teaching salaries are more likely to use higher numbers of non-specialist teachers and teachers who mainly teach other subjects to teach mathematics and science. 12 Conclusion Analysis presented in this report shows the negative impact of shortages of specialist teaching staff on the job satisfaction of teachers and departmental heads. This is in addition to the inequity between schools in the qualifications of staff teaching mathematics and science, and on top of the associations between pupil performance and teachers’ qualifications, as referenced in the Smith Inquiry and the Roberts Report and in research on physics in schools and colleges (Smithers and Robinson, 2005). Thus, staffing and deployment in these subjects represents an area of continuing need. There has already been action and support to attempt to ameliorate the situation (e.g. Golden hellos, diversification of routes into teaching, enhanced professional development opportunities). None the less, given the evidence from this study of 25 per cent of maintained secondary schools in England, the key question to emerge is: what more can be done to increase specialist teaching capacity in mathematics and science?
Introduction 1
Introduction This report presents findings from a survey of the deployment patterns of teachers and support staff in mathematics and science departments in maintained secondary schools in England. The research was conducted by the National Foundation for Educational Research (NFER) on behalf of the Department for Education and Skills (DfES). After the following introduction to the background and rationale for this investigation, this introduction will go on to describe:
• the aims and objectives of the study • the research methodology • the structure of the report.
Background The ways in which school leaders deploy staff to deliver the curriculum in mathematics and science subjects in secondary schools is of interest and concern given reports of difficulties in recruiting and retaining specialist mathematics and science teachers in schools (e.g. GB. Parliament. HoC. Education and Skills Committee, 2004). In his Inquiry, Professor Smith (DfES, 2004a) highlighted concerns about the supply of specialist mathematics teachers and about the current infrastructure to support mathematics teachers. Both these concerns were reported to contribute to a decline in the take up, and achievement in, post-16 mathematics. In addition, the Government’s 10-year investment framework for science and innovation outlines a comprehensive set of measures to enhance the teaching and learning of science, technology and engineering throughout the education system. Integral to this is the supply of appropriately qualified teachers (HM Treasury et al., 2004). In setting up the Smith Inquiry in July 2002, the Government recognised an urgent need to improve the mathematical skills of the general population. There were concerns about:
• the relatively low numbers of school pupils continuing mathematics post-16 through to the age of 19 and beyond
• the declining trend in the number of students obtaining degrees in disciplines with substantial mathematical content; and
• the under-supply of appropriately qualified teachers of mathematics, exacerbated by the high demand in other sectors of the economy for the skills of mathematically qualified graduates (see also the Roberts Review).
The Smith Inquiry identified the shortage of specialist mathematics teachers teaching mathematics as ‘the most serious problem we face in ensuring the future supply of

2 Introduction
sufficient young people with appropriate mathematical skills’. The Inquiry estimated a shortfall of around 3,400 specialist mathematics teachers, noted a lack of clarity on numbers of teachers teaching mathematics who hold no post-A-level qualification in the subject, and drew attention to the numbers of teachers qualified to teach mathematics, who do not teach mathematics (25 per cent). These findings prompted, in particular, the recommendation that the DfES undertake a review of school-level resource management of qualified mathematics teachers in England. In response to this recommendation, and as part of the investment framework for Science and Innovation (HM Treasury, 2004), a core strand being the enhancement of the teaching and learning of science, technology and engineering, the DfES has commissioned this research to survey and report on schools’ staff deployment practices when delivering the curriculum in mathematics and science. Teacher supply, recruitment and retention There has been increasing concern, both in England (DfES, 1998) and worldwide (Eurydice, 2002a and b; UNESCO, 2002, 20041), of shortages in teacher supply, and of problems recruiting and retaining teachers. Estimates suggest that another 15 – 35 million teachers are needed, on top of the 60 million teachers in the world currently (UNESCO, 20041). In England, there has been a considerable body of research investigating teacher recruitment and retention. In Initial Teacher Training (ITT) and the early years of teaching, research has largely investigated why prospective teachers are drawn to the profession, and issues of retention in initial teacher education (see e.g. Edmonds et al., 2002; Chambers and Roper, 2002; Smithers and Robinson, 2001; Hutchings et al., 2000; Whitehead and Postlethwaite, 2000; Whitmuir, 2000; and more generally, Menter et al., 2002). In terms of recruitment and retention once teachers have joined the profession, as well as looking at the extent of the problem, research has investigated factors contributing to teachers’ decisions to leave the profession, such as workload and pay (e.g. Smithers and Robinson, 2001, 2003) and patterns of turnover and wastage (e.g. Smithers and Robinson, 2004, 2005). Over the course of 2003-2004, the House of Commons Education and Skills Committee undertook an inquiry into teacher retention and recruitment in secondary education in response to concerns about systemic problems in the teaching workforce in secondary schools (GB. Parliament. HoC. Education and Skills Committee, 2004). Rather than finding evidence of endemic problems with retention and recruitment, the Committee found that there were a number of specific problems that pose ‘very real difficulties for those schools which are affected’. Such problems included retention and recruitment in challenging schools; the incapacity of schools facing persistent labour market difficulties to offer higher levels of pay to attract candidates; shortages
1UNESCO (2004). http://portal.unesco.org/education/en/ev.php-URL_ID=32260&URL_DO=DO_TOPIC&URL_SECTION=201.html

Introduction 3
of teachers in some subjects and the numbers of teachers in secondary school teaching outside their subjects and the reasons why they are doing so. In England, the Government invested in a number of strategies designed to improve teacher recruitment and retention. The Green Paper, Teachers: Meeting the Challenge of Change (DfES, 1998), drew out a number of proposals that have since been carried through, including training bursaries of £6,000, ‘golden hellos’ (one-off payments of £4,000, recently increased to £5,000 for mathematics teachers) for shortage subjects, tuition fee remission, repayment of student loans, fast tracking and a diversification of routes into teaching. The effect of these incentives has been some improvement in recruitment. In 2003–04, 18,080 trainee secondary teachers were recruited to ITT courses, a 25 per cent increase over 2000–01 (DfES, 2004b). However, there were still shortages in targets for recruitment in the shortage subjects of mathematics, physical science, modern foreign languages and religious education such that the House of Commons Education and Skills Committee reporting on teacher retention and recruitment on the 21st September, 2004 recommended that problems with recruitment and retention in shortage subjects be closely monitored (GB. Parliament. HoC. Education and Skills Committee, 2004). The Ofsted 2002/3 subject report for science reported on difficulties in the supply of teaching staff in science departments across England:
The overall picture is one of departments in increasing difficulty, especially in recruiting and retaining suitably qualified science teachers. As reported previously, this imposes great strains on heads of science departments in particular and detracts from their function as leaders and strategic planners.
(Ofsted, 2004b) As the Roberts Review pointed out, Government targets relating to the recruitment and training of science teachers apply only to science teachers overall, and not for teachers of biology, chemistry and physics. As a result, published figures may mask shortages in particular specialisms (Roberts, 2002). The Roberts Review presents data showing that over 75 per cent of the teachers teaching physics at key stage 3 did not study for a physics-oriented degree and moreover, that nearly 40 per cent of those teachers did not have an A-level in physics. Dillon et al. (2000), in a study into the professional needs and views of science teachers in England, found that 66 per cent of teachers teaching physics at Key Stage 4 and 51 per cent of those teaching chemistry did not hold a related degree. In addition, the school vacancy position in science is higher than for any other subject (DfES, 2005), with maths in second place. In a report on trends in teacher supply in chemistry, commissioned by the Royal Society of Chemistry, Smithers and Robinson (2004) found that the number of chemistry teachers was found to have halved since 1984 and there had been a drop of 40 per cent in terms of teachers with a qualification in chemistry. The proportion of science teacher trainees in chemistry was found to have declined from 30 per cent to 18 per cent with two-thirds of training places in chemistry being filled by graduates

4 Introduction
from a range of subjects. The pattern for physics was found to be similar, but with nearly a quarter of places being filled by engineering and technology graduates. A further study by Smithers and Robinson (2005) reported that in 27 per cent of state secondary schools one in four or fewer of the teachers of physics had studied the subject to any level at university. Further, for mathematics, Ofsted reported that in the academic year 2002–03, problems with the staffing of mathematics departments in secondary schools, in particular the match of teachers and support staff to the demands of the mathematics curriculum, was considered to be unsatisfactory in one school in eight.
In too many schools, staffing is inadequate as a result of vacancies or lack of specialist mathematicians. Even in some schools where there is a full quota of mathematics teachers, rapid turnover is detracting from developmental work and absorbing much of the time available to heads of department.
(Ofsted 2004a) There is concern about the qualifications of those teaching mathematics in secondary schools. Figures from the Secondary Schools Curriculum and Staffing Survey 2002 (DfES, 2003) reveal that 41 per cent of mathematics teachers hold a degree in mathematics (including specialism at teacher training) as their highest qualification in the subject. A joint group from The Open University, King’s College London and National Association of Mathematics Advisors (NAMA) carried out a survey in the academic year 2001–2 to ascertain the qualification and training of teachers of secondary mathematics in England. They found a decline in the proportion of teachers of mathematics with mathematics qualification since 1996 (Johnston-Wilder, et al., 2003). Further, 24 per cent of mathematics teachers surveyed were found to have a ‘weak’ or ‘nil’ qualification in mathematics based on Cockcroft’s (1982) categorisation. The survey further showed fragmented mathematics departments with large numbers of part-time teachers. Making up the shortfall of mathematics specialist teachers with mathematics graduates may not be possible – the Smith Inquiry presented data showing that in order to fill all the allocated ITT training places in mathematics for 2004–05, it would require that 40 per cent of the output of UK maths graduates take up a place (Smith, 2004, p. 46). This seems an unlikely eventuality, and as a result the Inquiry suggests that other measures, such as the current programme of enhancing mathematics ITT for non-maths graduates, should be pursued. Deployment of mathematics and science teachers in secondary schools Given the current shortfalls in mathematics and science specialist teachers in secondary schools, it follows that, in those schools where staffing is an issue in these departments, heads of departments and headteachers must be coping with teacher shortages and employing strategies to ensure delivery of the curriculum. Smithers and

Introduction 5
Robinson (2000) found that some of the strategies used by headteachers in response to staff shortages included using other school staff (e.g. support staff, teaching assistants, technicians), modifying the curriculum, increasing group sizes, reducing non-contact time for teachers and an increase in teachers teaching outside their subject specialism. Indeed, in a later study into school staffing, Smithers and Robinson (2003) report that 42.3 per cent of secondary schools surveyed cited ‘more teaching outside subject’ as a consequence of staff shortages, a strategy found to be of concern and in need of further information by the Education and Skills Committee Inquiry (GB. Parliament. HoC. Education and Skills Committee, 2004). In the case of mathematics, Willis (2002) found that one mathematics lesson in seven was taught by a teacher not qualified to teach mathematics. Similarly, Roper (2002) researched the expertise and deployment of mathematics teachers in secondary schools as part of a study into the potential for recruitment of science and mathematics undergraduates into teaching, and estimated that 14 per cent of mathematics teachers (in a sample of more than 500 individual teachers) did not hold an appropriate qualification (i.e. a degree, or other post-A-level qualification, and/or teaching qualification with mathematics as a major component) to teach mathematics. In a study of science teachers, Dillon et al. (2000) reported that among teachers teaching Key Stage 4 science topics, 39 per cent of those teaching biology did not have a degree in the subject (26 per cent did not have an A-level), neither did 51 per cent of those teaching chemistry (13 per cent with no A-level) and 66 per cent of those teaching physics (29 per cent with no A-level). Teacher shortages and pupil attainment The shortages of specialist mathematics and science teachers, difficulties in recruiting and retaining teachers and strategies employed to deliver the curriculum have implications for mathematics and science teaching and learning. More specifically, there are serious implications for pupil attainment. The Smith Inquiry noted with concern Her Majesty’s Chief Inspector of Schools’ view in 2001/2 that shortages of specialist teachers in mathematics was having an adverse effect on pupils’ performance. This view was supported by data from an OECD study, presented in SET for Success (Roberts, 2002). Of the head teachers surveyed in the UK for this OECD study, almost one-third felt that a shortage or inadequacy of teachers was hindering the learning of pupils in mathematics, and almost one-quarter in science, compared with around ten per cent in OECD countries. Further, research examining teacher deployment and student outcomes in physics found that teachers’ expertise in physics as measured by qualification was the second most powerful predictor of pupil achievement in GCSE and A-level physics after pupil ability (Smithers and Robinson, 2005). Attainment at Key Stage 4 is vital to the supply of individuals studying mathematics and science post-16. For example, fewer than 15 per cent of pupils who achieve mathematics GCSE grade C or above continue to A-level. In order to increase the future supply of mathematics and science specialists in secondary schools, the quality
6 Introduction
of teaching and learning is regarded as of the greatest importance and a key way to tackle that is in the professional development of those teaching mathematics and science (see e.g. Roberts, 2002; Smith, 2004; DfES, 2004a). Continuing Professional Development The Smith Inquiry identified the infrastructure required to support mathematics teachers effectively, particularly in terms of their professional development, as a critical area of concern. The Inquiry recommended that formal responsibility for and entitlement to fully funded Continuing Professional Development (CPD) should be introduced into the professional conditions of service for teachers of mathematics in schools and colleges. Further, additional remuneration should be linked to successful completion of accredited CPD activities. The Roberts Review similarly made recommendations aimed at improving science teachers’ take up of science-related CPD in order to improve science teachers’ understanding of, and ability to teach, all areas of science. The DfES have committed to establishing National Centres of Excellence for the teaching of science and for mathematics (the contract for the latter was awarded Autumn 2005) in order to address the continuing professional development of teachers of these subjects. In September 2004 the Government also appointed a chief advisor for mathematics to ‘champion’ the subject at all levels. In the case of mathematics and science teachers, more needs to be known about how schools support their mathematics and science teachers in terms of their professional development. Evidence from research into the area of mathematics and science teachers’ professional development needs and experiences suggests that training in specific subject areas is of concern to teachers. In the Open University (2003) survey of teachers of mathematics, 17.7 per cent identified ‘subject knowledge’ as a significant training need and in Dillon et al.’s study of science teachers, focus group discussion with science teachers revealed that ‘realistic ideas about how to teach particular topics as well as materials to support their teaching’ (2000, para.2.31) would enhance their INSET and their CPD. To sum up, given the concerns raised in the literature with regard to the staffing of mathematics and science in secondary schools in England, research into who presently is teaching the curriculum in these subjects, how schools manage and deploy staff and how schools support their mathematics and science teachers, is an important area of investigation. It is to the aims and methodology of the current study that we now turn. Aims and objectives The aim of this research was to investigate how teachers and support staff are deployed within school to deliver the curriculum in mathematics and science. In doing so, the study addressed the following issues.
Introduction 7
• How deployment varies across year groups, key stages, ability groups and in the case of science, teaching of the individual science subjects.
• How resources are allocated across schools to the mathematics and science departments.
• The issues schools face regarding the deployment of mathematics and science teachers.
• Staff development in school –how the school supports its mathematics and science teachers.
• Details of who is teaching mathematics and science subjects in secondary schools, including qualifications, experience, contract type, motivation to teach, job satisfaction and aspirations for the future.
Research methodology Two methods of data collection were employed, namely: Questionnaire surveys: a questionnaire survey despatched to heads of
mathematics and science departments from a representative sample of maintained secondary schools in England
a questionnaire survey to teachers of mathematics and sciences from a representative sample of maintained secondary schools in England a questionnaire survey to support staff working in or with mathematics and science departments.
Case studies: case studies of six maths departments and six science
departments to highlight examples of deployment practice.
Further details of both methods shall be presented below. The questionnaire surveys In his Inquiry, Professor Smith expressed reservations regarding the small-scale nature of some recent research into the survey of teachers of mathematics. The following approach to the questionnaire surveys was designed in order to generate a robust evidence base from which to draw findings. The heads of department and teacher questionnaire survey samples It was intended that the survey of heads of department and teachers would include 40 per cent of all maintained secondary schools in England. To this end, an initial sample
8 Introduction
of 1,350 schools of 3,139 maintained secondary schools in England was drawn to be representative of the following (in order of stratification):
• Government Office Region, to ensure a geographical spread across England • age range of school, to ensure the sample includes schools up to 16 and
schools up to 18 so deployment at GCSE and at AS/A2 level can be examined • size of schools, on the basis of pupil numbers.
This sample was subsequently reduced to 1,292 schools after 51 schools were withdrawn by their LEAs or had closed down, and a further seven were used in piloting so needed to be excluded. Questionnaire design Four survey instruments were devised:
• head of mathematics department questionnaire • head of science department questionnaire • mathematics teacher questionnaire • science teacher questionnaire.
The teacher questionnaires were four pages long and the head of department questionnaires were each eight pages in length. The instruments were piloted in early January 2005 in the mathematics and science departments of six schools. The piloting sample comprised the following: Location
• two London schools • one city school outside London • one small city school • two schools from market towns / rural locations
Age range
• three schools with an age range of 11–16 • three schools with an age range of 11–18.
Once the piloting was completed and the surveys had been re-drafted in the light of comments from the 12 departments, further piloting was undertaken in seven schools, which were then removed from the questionnaire survey sample.
Introduction 9
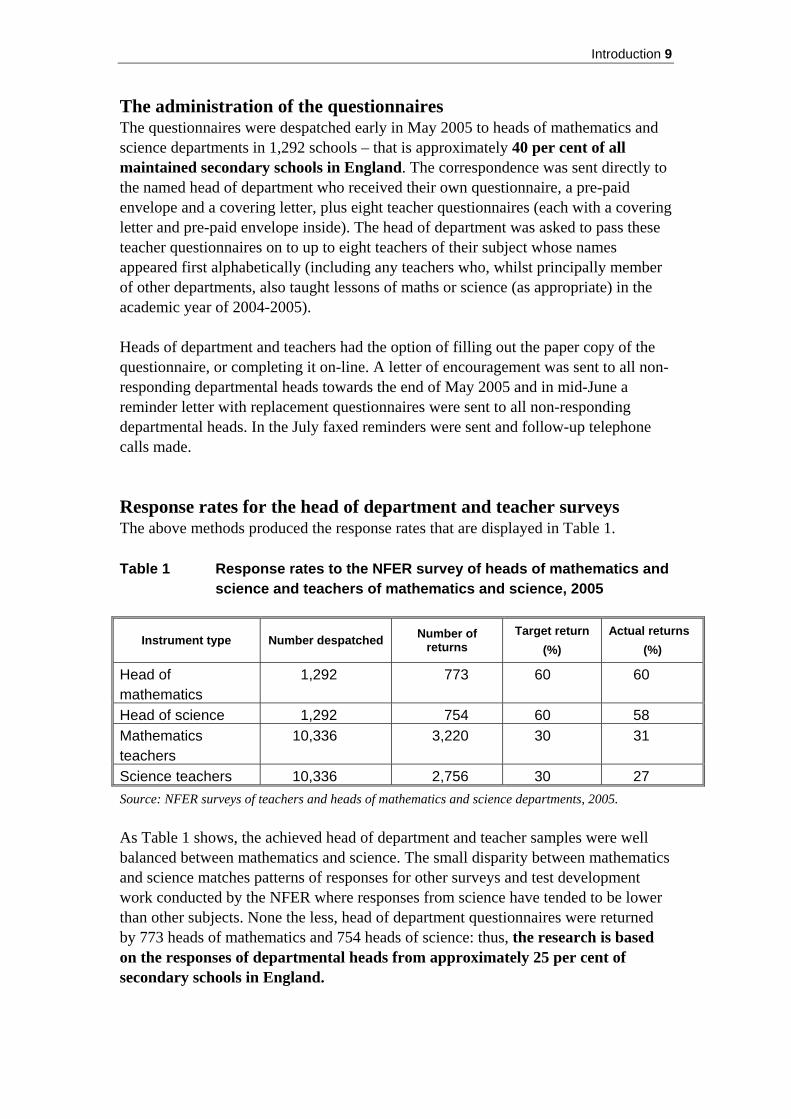
The administration of the questionnaires The questionnaires were despatched early in May 2005 to heads of mathematics and science departments in 1,292 schools – that is approximately 40 per cent of all maintained secondary schools in England. The correspondence was sent directly to the named head of department who received their own questionnaire, a pre-paid envelope and a covering letter, plus eight teacher questionnaires (each with a covering letter and pre-paid envelope inside). The head of department was asked to pass these teacher questionnaires on to up to eight teachers of their subject whose names appeared first alphabetically (including any teachers who, whilst principally member of other departments, also taught lessons of maths or science (as appropriate) in the academic year of 2004-2005). Heads of department and teachers had the option of filling out the paper copy of the questionnaire, or completing it on-line. A letter of encouragement was sent to all non-responding departmental heads towards the end of May 2005 and in mid-June a reminder letter with replacement questionnaires were sent to all non-responding departmental heads. In the July faxed reminders were sent and follow-up telephone calls made. Response rates for the head of department and teacher surveys The above methods produced the response rates that are displayed in Table 1. Table 1 Response rates to the NFER survey of heads of mathematics and
science and teachers of mathematics and science, 2005
Instrument type Number despatched Number of returns
Target return (%)
Actual returns (%)
Head of mathematics
1,292 773 60 60
Head of science 1,292 754 60 58 Mathematics teachers
10,336 3,220 30 31
Science teachers 10,336 2,756 30 27 Source: NFER surveys of teachers and heads of mathematics and science departments, 2005. As Table 1 shows, the achieved head of department and teacher samples were well balanced between mathematics and science. The small disparity between mathematics and science matches patterns of responses for other surveys and test development work conducted by the NFER where responses from science have tended to be lower than other subjects. None the less, head of department questionnaires were returned by 773 heads of mathematics and 754 heads of science: thus, the research is based on the responses of departmental heads from approximately 25 per cent of secondary schools in England.
10 Introduction
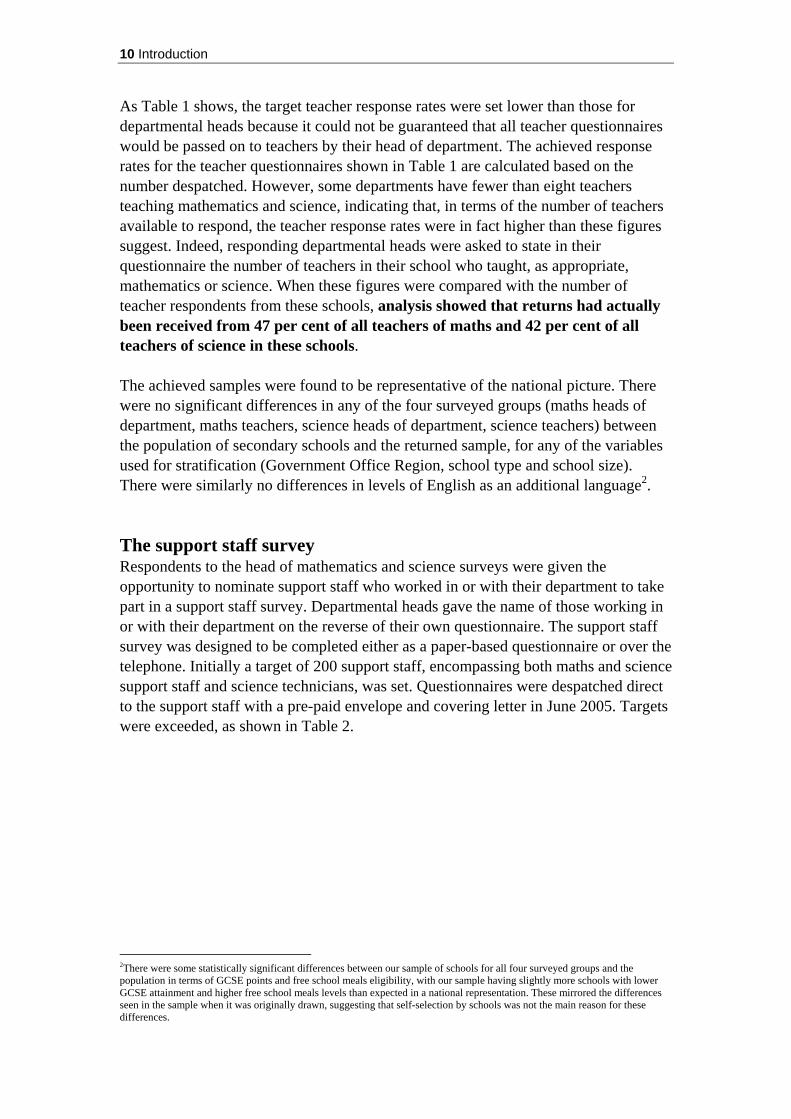
As Table 1 shows, the target teacher response rates were set lower than those for departmental heads because it could not be guaranteed that all teacher questionnaires would be passed on to teachers by their head of department. The achieved response rates for the teacher questionnaires shown in Table 1 are calculated based on the number despatched. However, some departments have fewer than eight teachers teaching mathematics and science, indicating that, in terms of the number of teachers available to respond, the teacher response rates were in fact higher than these figures suggest. Indeed, responding departmental heads were asked to state in their questionnaire the number of teachers in their school who taught, as appropriate, mathematics or science. When these figures were compared with the number of teacher respondents from these schools, analysis showed that returns had actually been received from 47 per cent of all teachers of maths and 42 per cent of all teachers of science in these schools. The achieved samples were found to be representative of the national picture. There were no significant differences in any of the four surveyed groups (maths heads of department, maths teachers, science heads of department, science teachers) between the population of secondary schools and the returned sample, for any of the variables used for stratification (Government Office Region, school type and school size). There were similarly no differences in levels of English as an additional language2. The support staff survey Respondents to the head of mathematics and science surveys were given the opportunity to nominate support staff who worked in or with their department to take part in a support staff survey. Departmental heads gave the name of those working in or with their department on the reverse of their own questionnaire. The support staff survey was designed to be completed either as a paper-based questionnaire or over the telephone. Initially a target of 200 support staff, encompassing both maths and science support staff and science technicians, was set. Questionnaires were despatched direct to the support staff with a pre-paid envelope and covering letter in June 2005. Targets were exceeded, as shown in Table 2.
2There were some statistically significant differences between our sample of schools for all four surveyed groups and the population in terms of GCSE points and free school meals eligibility, with our sample having slightly more schools with lower GCSE attainment and higher free school meals levels than expected in a national representation. These mirrored the differences seen in the sample when it was originally drawn, suggesting that self-selection by schools was not the main reason for these differences.
Introduction 11
Table 2 Response rates to the NFER survey of support staff working in or with mathematics and science departments, 2005
Support staff Target number of responses Actual number of responses
Maths support staff 100 136 Science support staff 30 42 Science technicians 70 187 Source: NFER surveys of mathematics and science support staff and science technicians, 2005. The case studies NFER made contact with 26 local authorities (LAs) in order to discuss departments in their authority considered examples of good practice in the deployment of teachers and support staff to deliver the curriculum in either mathematics or science. As a result of these discussions, 15 departments were approached and 12 departments from 11 schools agreed to take part in the research. The sample of case-study schools included the following: Location
• two inner-London departments(mathematics and science) • two outer-London departments (mathematics and science) • two large city departments (mathematics and science – same school) • two large towns (mathematics and science) • four market towns / rural locations (mathematics and science)
Age range • six schools with an age range of 11–16 • five schools with an age range of 11–18
Gender
• three single sex girls’ schools • eight mixed-sex schools.
Case-study visits were made during the summer term in 2005 and in each case-study department, interviews were conducted with the head of department, up to three teachers, any support staff working with the department as appropriate, and where possible, with the headteacher.
12 Introduction
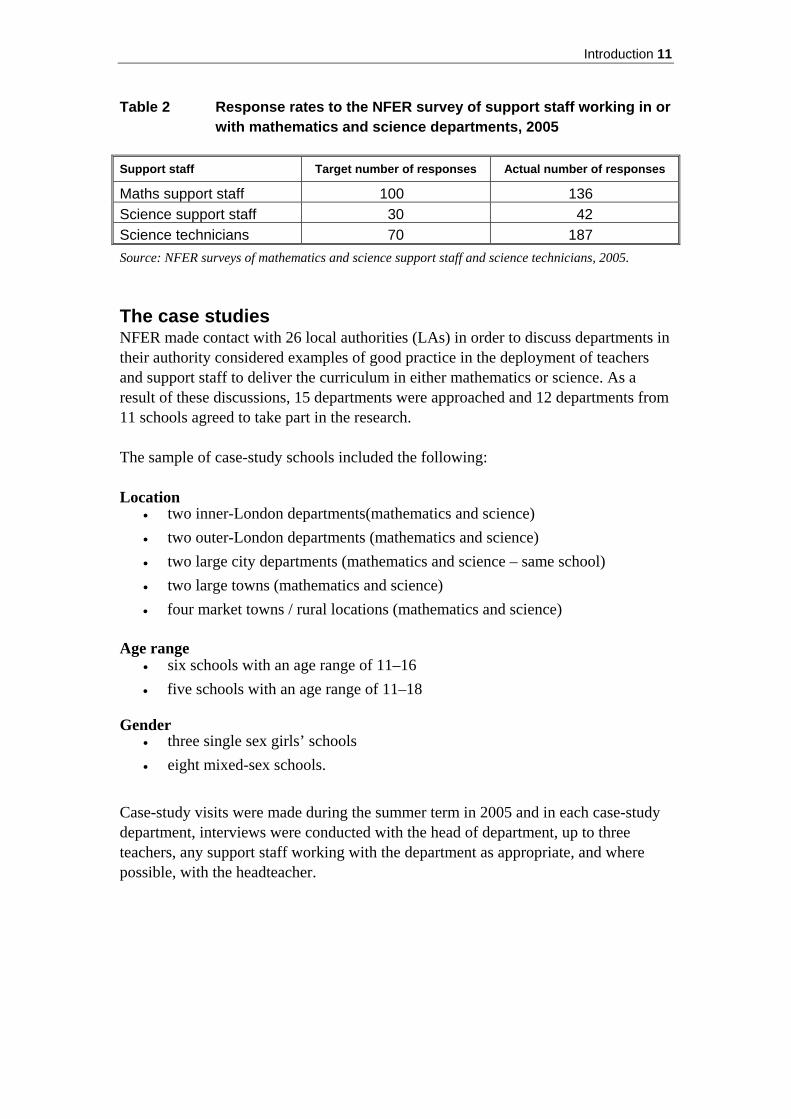
Structure of the report Following this introductory section, there are three further parts to the report, a conclusion and an appendix. Part One Deployment in mathematics
Who is teaching mathematics, the staffing of mathematics lessons, the contribution of support staff, the views of support staff, and professional satisfaction.
Part Two Deployment in science
Who is teaching science, the staffing of science lessons, the contribution of support staff and technicians, the views of support staff and technicians, and professional satisfaction.
Part Three Economic analysis: an overview
A summary of the measurement of the geographical distribution of mathematics and science teachers and compensating wage differentials.
Conclusion Appendix Economic analysis: appendix
A full discussion of the measurement of the geographical distribution of mathematics and science teachers and compensating wage differentials.
Part One 13
PART ONE Deployment in mathematics

14 Deployment in mathematics
1 Who is teaching mathematics
Key findings • Analysis was undertaken that considered all teachers who taught mathematics,
both those based in the department and those who were principally teachers of other subjects. According to departmental heads’ responses, more than three-quarters were maths specialists (i.e. had a degree in maths or a degree incorporating some maths or had studied maths as part of ITT). The remaining 24 per cent were either non-specialists or were predominately teachers of other subjects.
Mathematics teachers and departmental heads • Analysis of survey responses from the entire sample of 3,220 mathematics
teachers and 773 departmental heads revealed that:
• 42 per cent of maths teachers and 53 per cent of heads of department held a degree in mathematics
• 16 per cent of teachers and 19 per cent of departmental heads held a B.Sc or BA with QTS or B.Ed in mathematics
• 18 per cent of teachers and 15 per cent of departmental heads held a PGCE in mathematics, but held a degree in another subject
• six per cent of both maths teachers and heads of department held a Cert.Ed in mathematics
• four per cent of teachers and two per cent of heads of department held another post-A-level maths qualification (principally overseas teachers)
• 14 per cent of mathematics teachers and five per cent of heads of department held no post-A-level qualification in mathematics.
• Schools with lower than average GCSE results, higher than average numbers of
pupils eligible for free school meals or with higher numbers of pupils with special needs tended to have a higher proportion of teachers without a post-A-level qualification in mathematics.
• Overall, more than half of heads of mathematics departments (57 per cent) had
held this role for less than five years. Schools in the lowest band regarding GCSE achievement or with higher levels of pupils with special educational needs had the largest representation of heads of mathematics departments with less than five years’ experience.

Part One 15
1.1 Introduction This chapter uses the evidence from the surveys of departmental heads and mathematics teachers in order to consider the question: who is teaching mathematics in secondary schools in England? Chapter 1 begins by drawing on information provided by heads of mathematics in their questionnaires. These respondents were asked to give details of the specialisms of all the teachers who were members of the mathematics departments. They were also asked, in addition to those in their department, whether other teachers who were principally members of other departments also taught mathematics. Their responses provide evidence of the specialisms and experience of all the teachers who teach maths in the survey sample schools. Following this, the chapter moves on to data from the survey of 3,220 maths teachers and 773 departmental heads on their qualifications in mathematics. The distribution of the samples in terms of the highest post-A-level qualification in mathematics is presented, with some additional information on each of the qualification categories. Further detail of the characteristics of the heads of mathematics departments and mathematics teachers are then relayed, including: gender; age; length of time in teaching and teaching mathematics; any previous career; any other roles in the department or school as a whole; and contract type. The purpose of this chapter is to ascertain who is teaching mathematics. As will be shown, those teaching the subject were not always specialists in maths and were not always teachers who were members of the mathematics department. None the less, throughout this chapter, and elsewhere in the report, the terms ‘maths teacher’ or ‘teacher of maths’ are used to refer to any teacher who teaches the subject regardless of whether it is their subject specialism or whether it is their main teaching subject. The term ‘maths specialist’ is reserved for those who have university qualifications in the subject, either at degree level or above or for their ITT. Whilst much of the discussion in this chapter focuses on qualifications, it should be noted that teachers’ qualifications do not necessarily always equate with the quality of teaching. The structure of Chapter 1 is outlined below. Section 1.2 Who is teaching mathematics in one in five secondary schools?
• the composition of mathematics departments • the number of departments using teachers who principally teach
other subjects to also teach mathematics • all teachers teaching mathematics
Section 1.3 The qualifications of the heads of mathematics departments and mathematics teachers • qualification bands • the distribution of qualification bands by background variables

16 Deployment in mathematics
• degree class
Section 1.4 The characteristics of heads of mathematics departments and mathematics teachers • gender • age • length of time in teaching and teaching mathematics • careers prior to teaching • other roles in the department/school • contract type
Section 1.5 Concluding comments 1.2 Who is teaching mathematics in one in five
secondary schools? The analysis presented in section 1.2 is based on data supplied by heads of mathematics regarding the teachers who were timetabled to teach mathematics in their schools. Of the 773-strong sample of maths heads of department, 618 provided complete details in their questionnaire and as a result, the findings presented in this section are based on the responses of this subsample. Therefore, whilst departmental heads from one in four secondary schools actually returned questionnaires, the evidence in this section (1.2) relates to who is teaching mathematics in 20 per cent of all maintained secondary schools in England. The data from this sub-sample is also used in the economic analysis set out in Part 3 and the Appendix, which gives national projections of the numbers and specialisms of the teachers of maths. In their questionnaire, departmental heads were asked to give details of all teachers who taught maths. Thus, from this, a picture can be built of all those teaching the subject in these schools. In order to establish who teaches mathematics, departmental heads were first asked in their questionnaire about the teachers who were members of the maths department – their responses to this are relayed in section 1.2.1. Heads of department were then invited to give details of any teachers who mainly taught other subjects or were principally members of other departments but who also taught mathematics as a timetabled lesson during the academic year 2004–2005 – section 1.2.2 sets out the findings from this inquiry. Section 1.2.3 then draws together the details of those in the maths department and those brought in from other subjects in order to ascertain the specialisms and experience of all those teaching mathematics. 1.2.1 The composition of mathematics departments This section examines the data provided by 618 departmental heads regarding the composition of their mathematics departments. In their questionnaire, departmental heads were asked to state the number of teachers in their department, including themselves, who taught mathematics as a timetabled lesson. The responses revealed

Part One 17
the following about the composition of the mathematics departments in one in five secondary schools:
• the numbers of teachers within departments ranged from two teachers (five departments) to 16 teachers (two departments)
• the mean number of teachers in these mathematics departments was eight • overall, 8 per cent of teachers in these maths departments were newly
qualified teachers (NQTs) • around 43 per cent of these departments had NQTs. The vast majority of
departments with NQTs (70 per cent) had one, although departments also reported up to five NQTs
• 4 per cent of teachers in these maths departments had trained overseas • around one-fifth of these maths departments employed teachers who had
trained overseas. The vast majority of departments with overseas trained teachers (62 per cent) had one, although departments also reported up to six.
Heads of department were also asked to state the approximate size of the mathematics departmental budget (e.g. the funds used for costs of equipment, photocopying, professional development). Budgets ranged from £700 to £21,000, with the median being £4,600 and varied according to the relative coverage of the department. 1.2.2 Departments that are using teachers who principally
teach other subjects to also teach mathematics This section examines the data provided by the 618 departmental heads in order to start to consider a question that has frequently been raised in the literature surrounding teacher shortages, retention and recruitment: in the light of persistent shortages of teachers in subjects such as mathematics, how many teachers are teaching outside their specialist area? (e.g. GB. Parliament. HoC. Education and Skills Committee, 2004). In their questionnaire, departmental heads were asked to state the number of teachers who mainly teach other subjects or were principally members of other departments who taught mathematics as a timetabled lesson in the academic year 2004–2005. They were further asked to specify the main teaching subjects of those teachers. Responses from departmental heads in the sample schools revealed that:
• more than half (58 per cent) of these maths departments used teachers from other subjects to teach mathematics
• these teachers from other subjects accounted for 13 per cent of the total number of teachers taking mathematics classes3
• in two-fifths (46 per cent) of these departments, one teacher from another department was deployed
3This figure is based on the 4,747 teachers who are based in mathematics departments in the 618 sample schools plus 683 teachers who were teaching maths but were based in other departments.

18 Deployment in mathematics
• in nine out of ten (91 per cent) of these departments, up to three teachers from other departments were also teaching mathematics.
Departments used teachers from a wide range of other subjects. The most frequently cited were science, PE, special educational needs and ICT (see Table 1.1). Table 1.1 Main teaching subjects of teachers from other departments used
to teach mathematics.
Teachers who are principally members of other departments who teach maths Main teaching subject
% Science 31 PE 25 SEN & alternative curriculum 25 ICT 16 Business studies 10 Geography 9 Technology 8 English 6 History 5 Modern Foreign Languages 5 Music 4 RE 3 Psychology 2 Economics 1 Engineering <1 Other subject 10 Invalid 1 Base: 360 Multiple response question: respondents were able to state more than one subject, therefore percentages do not sum to 100 Source: NFER survey of heads of mathematics departments, 2005. 1.2.3 All teachers teaching mathematics Based on the responses from departmental heads, section 1.2.1 gave details of teachers within mathematics departments and section 1.2.2 set out numbers of teachers who, whilst principally members of other departments, also taught mathematics in the sample schools. In this section, we take these two groups together to acsertain the specialisms and experience of all those teaching mathematics in 20 per cent of secondary schools in England. In their questionnaire, departmental heads were asked to state the number of teachers within their department (including themselves) who held a degree in mathematics; a degree incorporating some mathematics; had specialised in mathematics at initial teacher training (ITT); had a non-maths related degree; and who had any other qualification. Their responses to these inquiries are presented in Figure 1.1 together with the proportion of those from other departments who teach maths.
Part One 19
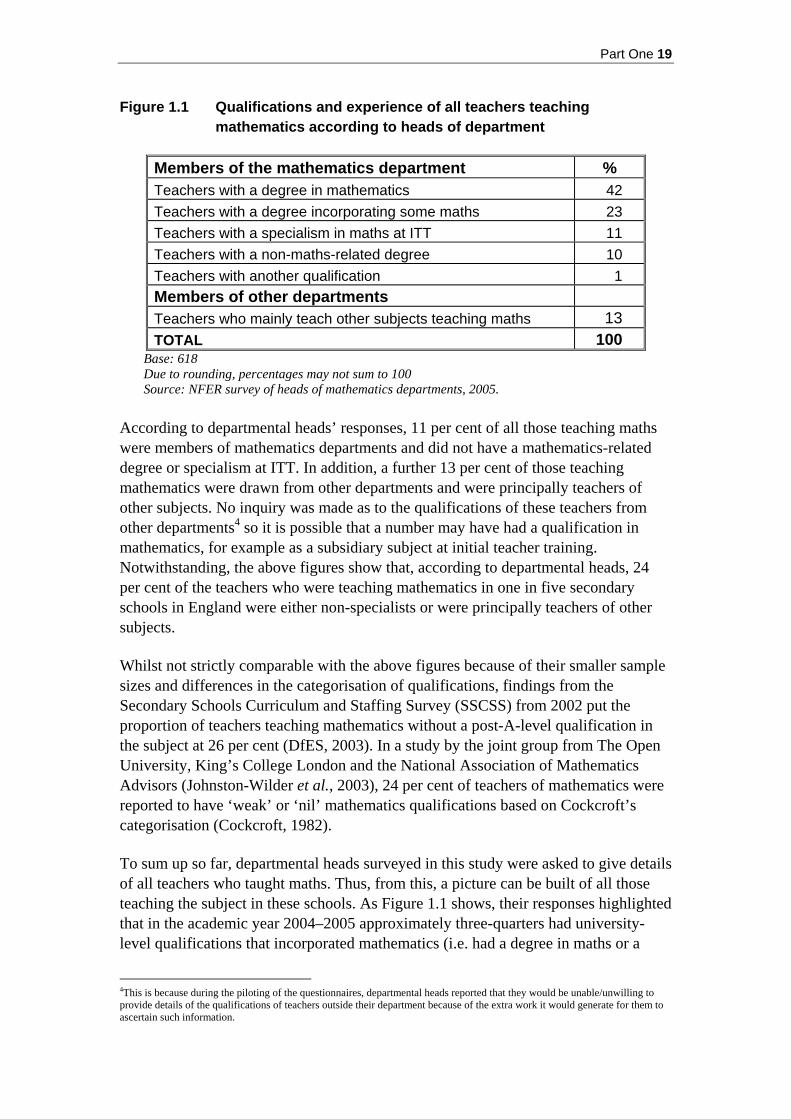
Figure 1.1 Qualifications and experience of all teachers teaching mathematics according to heads of department
Members of the mathematics department % Teachers with a degree in mathematics 42 Teachers with a degree incorporating some maths 23 Teachers with a specialism in maths at ITT 11 Teachers with a non-maths-related degree 10 Teachers with another qualification 1 Members of other departments Teachers who mainly teach other subjects teaching maths 13 TOTAL 100
Base: 618 Due to rounding, percentages may not sum to 100 Source: NFER survey of heads of mathematics departments, 2005.
According to departmental heads’ responses, 11 per cent of all those teaching maths were members of mathematics departments and did not have a mathematics-related degree or specialism at ITT. In addition, a further 13 per cent of those teaching mathematics were drawn from other departments and were principally teachers of other subjects. No inquiry was made as to the qualifications of these teachers from other departments4 so it is possible that a number may have had a qualification in mathematics, for example as a subsidiary subject at initial teacher training. Notwithstanding, the above figures show that, according to departmental heads, 24 per cent of the teachers who were teaching mathematics in one in five secondary schools in England were either non-specialists or were principally teachers of other subjects. Whilst not strictly comparable with the above figures because of their smaller sample sizes and differences in the categorisation of qualifications, findings from the Secondary Schools Curriculum and Staffing Survey (SSCSS) from 2002 put the proportion of teachers teaching mathematics without a post-A-level qualification in the subject at 26 per cent (DfES, 2003). In a study by the joint group from The Open University, King’s College London and the National Association of Mathematics Advisors (Johnston-Wilder et al., 2003), 24 per cent of teachers of mathematics were reported to have ‘weak’ or ‘nil’ mathematics qualifications based on Cockcroft’s categorisation (Cockcroft, 1982). To sum up so far, departmental heads surveyed in this study were asked to give details of all teachers who taught maths. Thus, from this, a picture can be built of all those teaching the subject in these schools. As Figure 1.1 shows, their responses highlighted that in the academic year 2004–2005 approximately three-quarters had university-level qualifications that incorporated mathematics (i.e. had a degree in maths or a
4This is because during the piloting of the questionnaires, departmental heads reported that they would be unable/unwilling to provide details of the qualifications of teachers outside their department because of the extra work it would generate for them to ascertain such information.

20 Deployment in mathematics
degree incorporating some maths or had studied maths as part of ITT). The remaining 24 per cent were either non-specialists in mathematics or were principally teachers from other departments. This evidence provided by heads of department also forms the basis of an economic analysis, presented in Part 3 and the Appendix. This analysis takes the figures presented in Figure 1.1 and projects these to a national level to consider the equity of the distribution of maths teachers across the country. When the numbers in Figure 1.1 were modelled to give a national projection, it was predicted that across 3,072 schools5, there are 27,445 teachers teaching mathematics of whom 21,126 were maths specialists (including 11,652 who have a degree in maths). This leaves 6,319 teachers (23 per cent of the total) who do not have a mathematics-related degree or specialism at ITT or are primarily teachers of other subjects. 1.3 The qualifications of heads of mathematics
departments and mathematics teachers In addition to the questions posed to departmental heads regarding all teachers who taught maths (the findings from which were set out in section 1.2 above), the questionnaire surveys to teachers and head of departments sought information on each respondent’s individual qualifications. This section presents the qualifications that teachers and department heads reported that they held. When interpreting the findings in this section, it is important to bear in mind that the data from the teacher survey refers only to those who returned a teacher questionnaire rather than to all maths teachers. This is in contrast to the figures from heads of department in section 1.2 which do relate to all those teaching maths. The teacher survey sample was, however, sizable and constituted approximately 47 per cent of all those teaching mathematics in the sample schools (or over 10 per cent of maths teachers in England based on the national projections above)6. This section begins by presenting the qualifications that teachers and department heads reported they held in terms of their highest post-A-level qualification in mathematics. There were seven qualification bands:
1. Degree in mathematics 2. B.Sc or BA with QTS or B.Ed in mathematics 3. Cert Ed incorporating mathematics 4. PGCE incorporating mathematics 5. Other post-A-level mathematics qualification 6. A-level mathematics qualification 7. No post-16 qualification in mathematics.
5This is approximately 98 per cent of all maintained secondary schools in England. 6The responses from departmental heads in this section are based on the full sample of 773. Thus, they are drawn from 25 per cent of all maintained secondary schools.

Part One 21
It then moves on to consider in more detail the subjects, types of qualification and the initial teacher training subjects, if applicable, in the teacher and departmental samples for each category. Then, this section examines the distribution of qualification types by background variables including Government Office Region, age range, GCSE attainment, level of free school meals and level of special educational needs in the school. Finally, degree class achieved by those in the teacher and departmental heads sample are relayed. While this section analyses qualifications in terms of the highest-post-A-level qualification in mathematics held by mathematics teachers and heads of department, and these categories are then used elsewhere in Part 1 as a tool in further analyses, it should be stated that in no way should these categories be taken to represent a judgement as to the requisite or desired qualifications to enable a teacher to be qualified to teach mathematics. Instead they provide a useful and workable definition of qualifications in mathematics that make no comment on whether the teacher who holds them is ‘qualified’ to teach mathematics. Table 1.2 shows the breakdown of the samples of teachers of mathematics and mathematics heads of department in terms of their mathematics qualifications. The teachers and heads of department are counted once against their highest qualification in mathematics. For example, if an individual holds a degree and a PGCE in mathematics, they are included in the figures for ‘degree in maths’; if an individual holds a PGCE in mathematics but a degree in another subject, they are counted against ‘PGCE incorporating maths’. Table 1.2 Highest post-A-level qualification held by mathematics teachers
and heads of department
Teachers of mathematics
Heads of mathematics departments Highest qualification in mathematics
N % N % Degree in maths 1,335 42 413 53 B.Sc or BA with QTS or B.Ed in maths 524 16 144 19 Cert Ed incorporating maths 193 6 47 6 PGCE incorporating maths 583 18 114 15 Other post-A-level maths qualification 140 4 18 2 A-Level maths 189 6 22 3 No post-16 maths qualification 251 8 14 2 No response 5 <1 1 <1 TOTAL 3,220 100 773 100
Due to rounding, percentages may not sum to 100 Source: NFER surveys of teachers of mathematics and heads of mathematics departments, 2005.
Table 1.2 shows the following.
• More than half of the heads of mathematics departments (53 per cent) and just over two-fifths of mathematics teachers (42 per cent) in the sample have a degree in mathematics.
22 Deployment in mathematics
• Just over one-sixth (16 per cent) of the mathematics teacher sample and almost one-fifth (19 per cent) of heads of mathematics departments held a B.Sc or BA with QTS or B.Ed in mathematics.
• Almost one-fifth (18 per cent) of mathematics teachers and 15 per cent of heads of mathematics departments in the sample have a PGCE in mathematics, but hold a degree in another subject.
• In total, one in seven (14 per cent) mathematics teachers and one in 20 (5 per cent) heads of department in the sample did not hold a post-A-level qualification in mathematics.
The above figures suggest some degree of difference between the proportion of teachers in the teacher survey sample with no post-A-level qualification in maths (14 per cent) and figures reported by departmental heads in section 1.2.3. Although the categorisation of the qualifications is not identical, as section 1.2.3 showed, departmental heads reported that 24 per cent of the teachers teaching maths in their schools were non-specialists or were principally teachers of other subjects. Whilst teachers know their qualification better than the departmental head, this difference may principally be explained by the self-selection of the respondents to the teacher survey. Thus, whilst the figures from heads of department in section 1.2.3 refer to all teachers teaching maths, in contrast those in Table 1.2 relate only to teachers who returned a teacher questionnaire. That is approximately 47 per cent of all those teaching mathematics in the sample schools. Further, analysis showed that these teachers in the teacher survey sample largely (though not solely) taught maths for the majority of their time. This suggests that those who do teach maths but mainly teach other subjects – 13 per cent of all teachers of maths– were underrepresented in the teacher sample, presumably because they had less investment in returning a questionnaire and may have been less likely to receive one from their head of department. However, the 14 per cent of mathematics teachers who reported no post-A-level qualification in mathematics above does match the 14 per cent of mathematics teachers not properly qualified to teach mathematics estimated by Roper (2002) reported in the Smith Inquiry findings (2004, p. 26), though Roper’s sample also included independent schools. The figure of 14 per cent of those teaching mathematics who held no post-A-level qualification in the subject, comprised six per cent of the sample of teachers who held an A-level qualification in mathematics and eight per cent of the teacher sample who held no post-16 mathematics qualification. Three per cent of those department heads in the sample without a post-A-level qualification in mathematics did hold an A-level in the subject, leaving the heads of 14 mathematics departments (two per cent) who held no post-16 qualification in mathematics. This section has established the overall composition of the sample of mathematics teachers and heads of department in terms of their highest post-A-level qualification in mathematics, revealing that the largest proportion of mathematics teachers and heads of department hold a degree in mathematics as their highest post-A-level qualification.

Part One 23
The following sections move on to set out each of the qualification in mathematics categories in more depth, providing more detailed explanation of the types of qualification and subjects in each category. Frequencies are presented as a proportion of the 3,220-strong sample of mathematics teachers or 773 heads of mathematics departments. 1.3.1 Degree in mathematics This section disaggregates the ‘degree in mathematics’ category represented by 42 per cent of mathematics teachers and 53 per cent of heads of mathematics departments in the samples. Table 1.3 displays the degree subject for those teachers and heads of department who fell into the ‘degree in mathematics’ category. As well as first degrees, it also shows the numbers of masters level and PhD degrees in mathematics and in numerate subjects* held by teachers and heads of department in this category. Table 1.3 Type of degree in mathematics held by mathematics teachers
and heads of department whose highest post-A-level qualification in the subject was a degree
Teachers of mathematics
Heads of mathematics departments Type of degree in mathematics
N % N % BA/BSc Mathematics 767 24 253 33 BA/BSc Maths & numerate subject 268 8 72 9 BA/BSc Mathematics & science 72 2 25 3 BA/BSc Mathematics & education 49 2 10 1 BA/BSc Mathematical sciences 29 1 1 <1 BA/BSc Mathematics & non-numerate subject
99 3 31 4
MA/MSc Mathematics 76 2 22 3 MA/MSc Numerate subject* 27 1 6 1 DPhil/PhD Mathematics 15 <1 7 <1 DPhil/PhD Numerate subject 10 <1 0 0 TOTAL 1,335 42% 413 53% *Numerate subjects included: economics, accountancy, business studies, computer science / ICT, physics, engineering Multiple response question: respondents could state more than one subject therefore percentages do not sum to 42 and 53 Source: NFER surveys of teachers of mathematics and heads of mathematics departments, 2005. Table 1.3 shows that:
• overall, almost a quarter of the teacher sample (24 per cent) and one-third of the head of department sample (33 per cent) held a degree in mathematics as a sole subject
• fewer than five per cent of the mathematics teacher sample and heads of mathematics departments held a higher degree in mathematics.
Further analysis was undertaken in order to ascertain details of the initial teacher training undertaken by these teachers and departmental heads in the samples who held
24 Deployment in mathematics
a degree in mathematics. This revealed that almost one-third of mathematics teachers and almost two-fifths of heads of mathematics departments held a degree in mathematics and had trained in mathematics at initial teacher training. A further eight per cent of the mathematics teacher sample and 10 per cent of the heads of mathematics departments held degrees in mathematics and had specialised at initial teacher training in mathematics with another subject, most commonly PE, ICT, economics or science. This leaves a further 3 per cent of teachers and four per cent of departmental heads who held a degree in mathematics and currently taught mathematics, but who had not specialised in mathematics at initial teacher training. 1.3.2 B.Ed/QTS in mathematics We turn now to consider teachers and heads of department whose highest post-A-level qualification in mathematics was B.Ed or QTS in mathematics. Overall, 16 per cent of mathematics teachers and 19 per cent of heads of mathematics in the samples held a B.Ed or a BA/B.Sc with QTS in mathematics as their highest post-A-level qualification in mathematics. Mathematics teachers The 16 per cent of teachers in this category comprises 11 per cent of mathematics teachers who held a B.Ed or BA/B.Sc with QTS in mathematics where mathematics had been their specialism at initial teacher training and five per cent who held a B.Ed or BA/B.Sc with QTS in mathematics and had trained in mathematics with another subject (most commonly PE, ICT or science). Heads of mathematics departments The figure of 19 per cent is made up of 12 per cent of heads of department who held a B.Ed or BA/B.Sc with QTS in mathematics where mathematics had been their specialism at initial teacher training. The category includes a further seven per cent who had trained in mathematics with another subject. Again, this was most commonly PE, ICT or science. 1.3.3 PGCE incorporating mathematics Overall, in the samples 18 per cent of mathematics teachers and 15 per cent of heads of department held a PGCE incorporating mathematics as their highest post-A-level qualification in mathematics. These teachers held degrees in subjects other than mathematics. Table 1.4 displays the degree subject and type of degree held by teachers with a PGCE in mathematics.
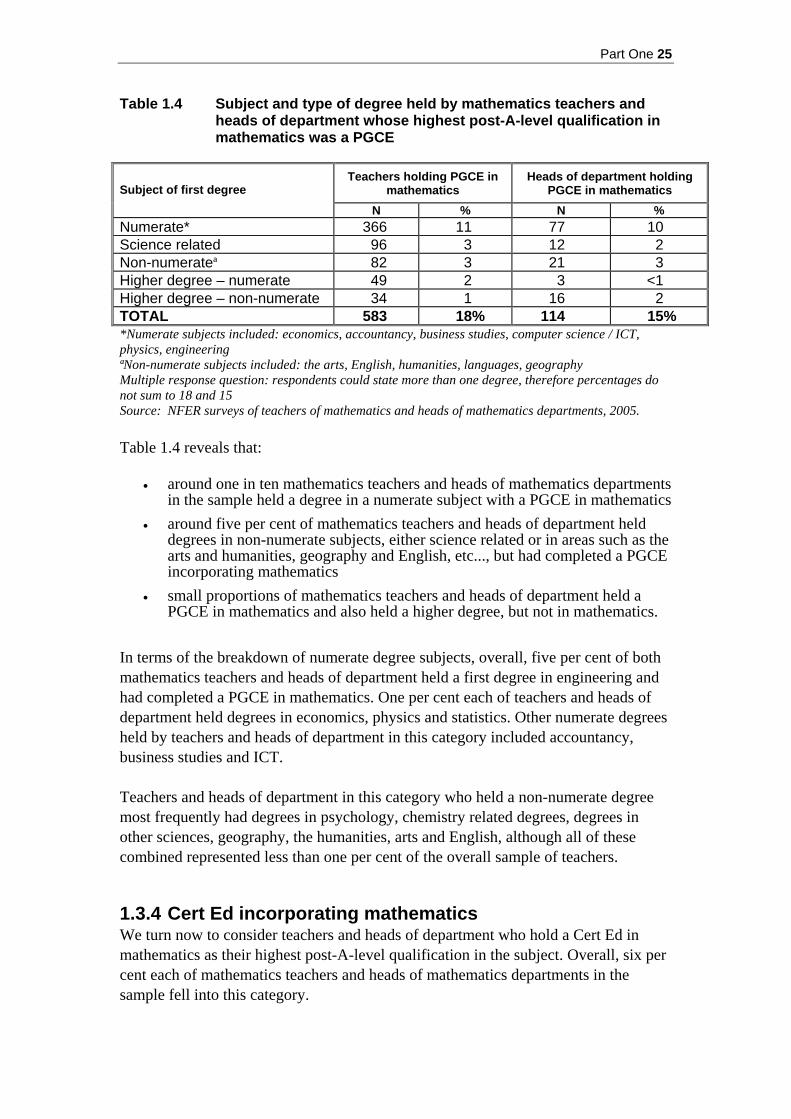
Part One 25
Table 1.4 Subject and type of degree held by mathematics teachers and heads of department whose highest post-A-level qualification in mathematics was a PGCE
Teachers holding PGCE in
mathematics Heads of department holding
PGCE in mathematics Subject of first degree N % N %
Numerate* 366 11 77 10 Science related 96 3 12 2 Non-numerateª 82 3 21 3 Higher degree – numerate 49 2 3 <1 Higher degree – non-numerate 34 1 16 2 TOTAL 583 18% 114 15% *Numerate subjects included: economics, accountancy, business studies, computer science / ICT, physics, engineering ªNon-numerate subjects included: the arts, English, humanities, languages, geography Multiple response question: respondents could state more than one degree, therefore percentages do not sum to 18 and 15 Source: NFER surveys of teachers of mathematics and heads of mathematics departments, 2005. Table 1.4 reveals that:
• around one in ten mathematics teachers and heads of mathematics departments in the sample held a degree in a numerate subject with a PGCE in mathematics
• around five per cent of mathematics teachers and heads of department held degrees in non-numerate subjects, either science related or in areas such as the arts and humanities, geography and English, etc..., but had completed a PGCE incorporating mathematics
• small proportions of mathematics teachers and heads of department held a PGCE in mathematics and also held a higher degree, but not in mathematics.
In terms of the breakdown of numerate degree subjects, overall, five per cent of both mathematics teachers and heads of department held a first degree in engineering and had completed a PGCE in mathematics. One per cent each of teachers and heads of department held degrees in economics, physics and statistics. Other numerate degrees held by teachers and heads of department in this category included accountancy, business studies and ICT. Teachers and heads of department in this category who held a non-numerate degree most frequently had degrees in psychology, chemistry related degrees, degrees in other sciences, geography, the humanities, arts and English, although all of these combined represented less than one per cent of the overall sample of teachers. 1.3.4 Cert Ed incorporating mathematics We turn now to consider teachers and heads of department who hold a Cert Ed in mathematics as their highest post-A-level qualification in the subject. Overall, six per cent each of mathematics teachers and heads of mathematics departments in the sample fell into this category.

26 Deployment in mathematics
The six per cent of mathematics teachers in this category comprised of two per cent who just stated maths as their specialism for their Cert Ed and four per cent who reported that they had trained in mathematics in conjunction with another subject, most commonly PE, but also science and geography, amongst others. In terms of the six per cent of heads of department in this category, three per cent just stated mathematics as their Cert.Ed specialism, and a further three per cent completed their Cert Ed in mathematics with another subject, again most commonly PE but with the same range of subjects as teachers holding a Cert Ed. 1.3.5 Other post-A-level qualification in mathematics Overall, four per cent of mathematics teachers and two per cent of heads of mathematics departments held some other type of post-A-level qualification in mathematics, representing a small proportion of both samples. Teachers in this category included those who had trained overseas and who held an overseas qualification in mathematics or teaching mathematics (one per cent) and teachers who had entered teaching through other routes. These routes, in order of frequency, included: the Graduate Teaching Programme (GTP) (one per cent of teachers); Teach First; teachers who had obtained QTS through another route; School Centred Initial Teacher Training (SCITT) schemes; licensed teachers; and those who entered teaching through completing a degree (in a subject other than mathematics) followed by a probationary period teaching mathematics. 1.3.6 No post-A-level qualification in mathematics This section moves on to discuss the 14 per cent of teachers and five per cent of heads of mathematics departments in the samples who did not hold a post-A-level qualification in mathematics. Table 1.5 presents the broad categories of degree subject held by teachers and heads of departments who fell into this category.

Part One 27
Table 1.5 Degree subjects of mathematics teachers and heads of department who hold no post-A-level qualification in mathematics
Mathematics teachers Heads of mathematics department Degree subject N % N %
Numerate* 74 2 13 2 Science related 74 2 7 1 Non-numerateª 125 4 11 1 TOTAL 1440 14% 136 5% *Numerate subjects included: economics, accountancy, business studies, computer science / ICT, physics, engineering ªNon-numerate subjects included: the arts, English, humanities, languages, geography 1The totals here relate to the overall number of teachers with no post-A-level qualification in maths. Not all teachers in this category held a degree as some had entered teaching through alternative routes e.g. Cert Ed, therefore percentages do not sum to 14 and 5 Source: NFER surveys of teachers of mathematics and heads of mathematics departments, 2005. Table 1.5 reveals that of those in the maths teacher sample without post-A-level qualifications in mathematics, more held degrees in non-numerate subjects than in numerate subjects. Further analysis was undertaken to determine the subject at initial teacher training of those teachers who were teaching mathematics but held no post-A-level qualification in the subject. The most common subjects were PE and science. Other subjects included geography, English and business studies. The investigation into the qualifications of mathematics teachers and heads of mathematics departments above has shown that overall, a degree in mathematics was the most frequent qualification type and a degree in mathematics as a sole subject was held by almost one-quarter of mathematics teachers and one-third of heads of mathematics departments. Of those teachers who held no post-A-level qualification in mathematics, more held degrees in non-numerate subjects than in numerate subjects. 1.3.7 The distribution of qualification bands by background
variables This section moves on to consider where the differently qualified mathematics teachers in the sample are teaching mathematics in terms of the Government Office Region, the age-range of the school, schools’ GCSE attainment, the level of free school meals eligibility and the levels of pupils with special educational needs in the school. A number of tables are presented in this section, each showing the disaggregation of mathematics teachers only (heads of mathematics departments are not included in this section). Table 1.6 presents a cross-tabulation of the highest post-A-level qualification in mathematics categories by the Government Office Region.

28 Deployment in mathematics
Table 1.6 The teacher sample’s highest post-A-level qualifications in mathematics by Government Office Region
Government Office Region
North East North West Merseyside
Yorkshire & Humber
East Midlands
West Midlands Eastern London South East South West
Highest post-A-level qualification in mathematics
% % % % % % % % % Degree in maths 37 43 38 45 40 41 47 39 39 B.Sc or BA with QTS or B.Ed in maths
19 17 19 15 18 15 10 16 21
Cert Ed incorporating maths
8 5 8 8 7 6 5 5 5
PGCE incorporating maths
21 19 25 18 16 14 18 17 19
Other post-A-level maths qualification
3 2 1 4 4 7 9 6 3
A-Level maths or no post-16 maths qualification
12 14 9 10 15 18 12 18 14
TOTAL 100 100 100 100 100 100 100 100 100 Base: 3,204 Due to rounding, percentages may not sum to 100 Source: NFER survey of teachers of mathematics, 2005.

Part One 29
Table 1.6 reveals that the London Government Office region had the largest proportion of teachers whose highest post-A-level qualification in mathematics was a degree: 47 per cent of teachers in this region held a degree in mathematics compared with 37 per cent in the North East region. The South East and Eastern regions had the largest proportions of teachers who held no post-A-level qualification in mathematics and these regions and London had the highest proportion of teachers who held ‘other’ post-A-level qualifications in mathematics, such as an overseas qualification or schemes such as the Graduate Training Programme and Teach First. Table 1.7 presents the mathematics qualifications bands cross-tabulated by the age-range of the schools in which the teachers in the sample taught. *The ‘other’ category includes schools with 14-18 or 11-14 age ranges. Table 1.7 The teacher sample’s highest post-A-level qualifications in
mathematics by the age range of the school
11 – 16 11 – 18 *Other Highest post-A-level qualification in mathematics % % % Degree in maths 31 47 47 B.Sc or BA with QTS or B.Ed in maths 20 14 15 Cert Ed incorporating maths 8 5 5 PGCE incorporating maths 20 18 17 Other post-A-level maths qualification 4 5 3 A-Level maths 7 6 4 No post-16 maths qualification 10 6 9 TOTAL 100 100 100 Base: 3,201 *The ‘other’ category includes schools with 14-18 or 11-14 age ranges Due to rounding, percentages may not sum to 100 Source: NFER survey of teachers of mathematics, 2005. Table 1.7 reveals that teachers with a degree in mathematics tended to be more strongly represented in schools with an age range of 11 – 18 years. In these schools, almost half (47 per cent) of the teachers had a degree in maths compared with almost a third (31 per cent) in schools for 11-16 year olds. This may well be related to the fact that A-level is taught in 11-18 schools and tends to be taught more frequently by teachers with a degree in the subject (see Chapter 2). Tables 1.8 – 1.10 present teachers in each of the mathematics qualification categories cross-tabulated with the GCSE achievement band of the school, the level of free school meals (FSM) eligibility in the school and the level of pupils with special educational needs in the school respectively.

30 Deployment in mathematics
Table 1.8 The teacher sample’s highest post-A-level qualifications in mathematics by the GCSE achievement band of the school
GCSE achievement band (Total GCSE point-score 2002)
Lowest Band
2nd Lowest band
Middle band
2nd Highest
band Highest
band Highest qualification in mathematics
% % % % %
Degree in maths 31 39 41 47 54 B.Sc or BA with QTS or B.Ed in maths
17 18 18 14 13
Cert Ed incorporating maths 7 6 6 5 5 PGCE incorporating maths 17 18 20 20 17 Other post-A-level maths qualification
6 5 4 4 3
A-Level maths 7 6 5 5 6 No post-16 maths qualification 14 9 6 4 3 TOTAL 100 100 100 100 100 Base: 3,149 Due to rounding, percentages may not sum to 100 Source: NFER survey of teachers of mathematics, 2005. Table 1.9 The teacher sample’s highest post-A-level qualifications in
mathematics by level of eligibility for Free School Meals in the school
% Eligible Free School Meals 2002
Lowest 20%
2nd Lowest
20% Middle
20% 2nd
Highest 20%
Highest 20%
Highest qualification in mathematics
% % % % %
Degree in maths 56 49 38 38 35 B.Sc or BA with QTS or B.Ed in maths
14 16 18 16 17
Cert Ed incorporating maths 4 5 6 8 5 PGCE incorporating maths 14 18 19 17 19 Other post-A-level maths qualification
2 3 4 6 5
A-Level maths 9 4 6 5 9 No post-16 maths qualification
1 5 9 10 10
TOTAL 100 100 100 100 100 Base: 3,188 Due to rounding, percentages may not sum to 100 Source: NFER survey of teachers of mathematics, 2005.
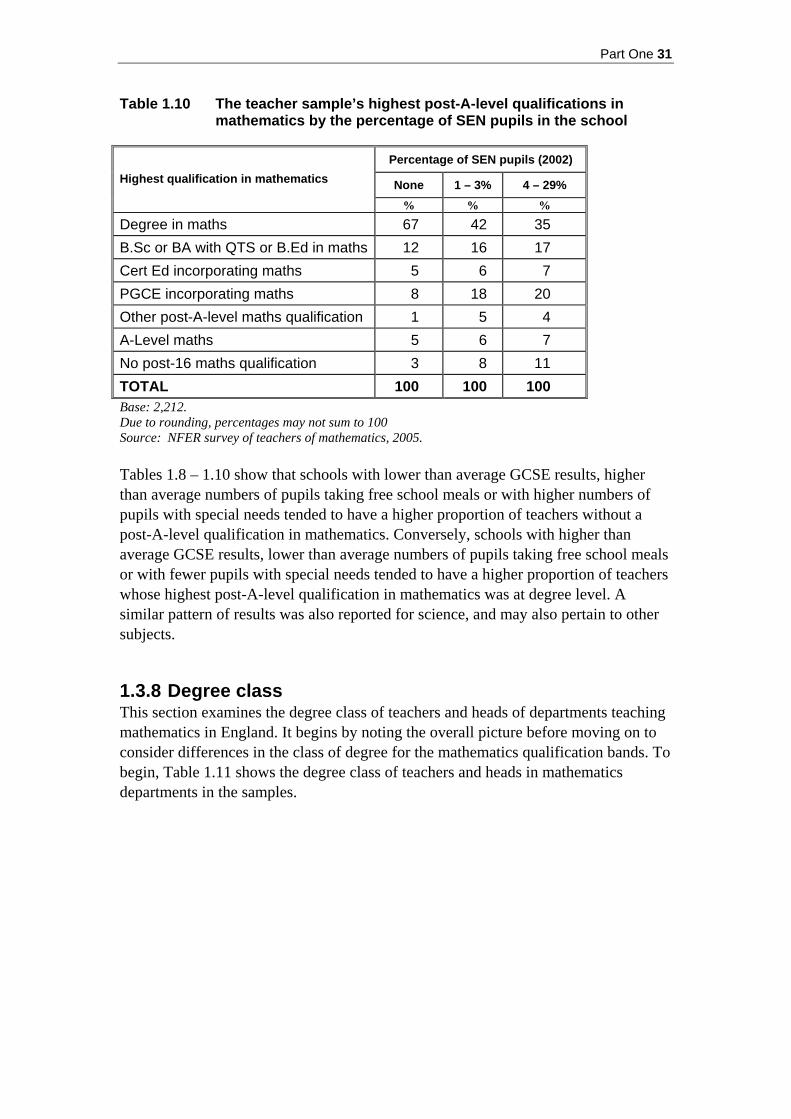
Part One 31
Table 1.10 The teacher sample’s highest post-A-level qualifications in mathematics by the percentage of SEN pupils in the school
Percentage of SEN pupils (2002)
None 1 – 3% 4 – 29% Highest qualification in mathematics
% % %
Degree in maths 67 42 35 B.Sc or BA with QTS or B.Ed in maths 12 16 17 Cert Ed incorporating maths 5 6 7 PGCE incorporating maths 8 18 20 Other post-A-level maths qualification 1 5 4 A-Level maths 5 6 7 No post-16 maths qualification 3 8 11 TOTAL 100 100 100 Base: 2,212. Due to rounding, percentages may not sum to 100 Source: NFER survey of teachers of mathematics, 2005. Tables 1.8 – 1.10 show that schools with lower than average GCSE results, higher than average numbers of pupils taking free school meals or with higher numbers of pupils with special needs tended to have a higher proportion of teachers without a post-A-level qualification in mathematics. Conversely, schools with higher than average GCSE results, lower than average numbers of pupils taking free school meals or with fewer pupils with special needs tended to have a higher proportion of teachers whose highest post-A-level qualification in mathematics was at degree level. A similar pattern of results was also reported for science, and may also pertain to other subjects. 1.3.8 Degree class This section examines the degree class of teachers and heads of departments teaching mathematics in England. It begins by noting the overall picture before moving on to consider differences in the class of degree for the mathematics qualification bands. To begin, Table 1.11 shows the degree class of teachers and heads in mathematics departments in the samples.

32 Deployment in mathematics
Table 1.11 Degree class held by mathematics teachers and heads of department
Mathematics teachers Heads of mathematics departments Class of degree
N % N % 1st 261 8 58 8 2nd 123 4 23 3 2(i) 766 24 161 21 2(ii) 804 25 208 27 3rd 290 9 98 13 Ordinary 58 2 27 3 Other 138 4 40 5 No response 780 24 158 20 TOTAL 3,220 100 773 100 Due to rounding, percentages may not sum to 100 Source: NFER surveys of teachers of mathematics and heads of mathematics departments, 2005. Table 1.11 shows that overall, around one-third of mathematics teachers and heads of mathematics departments reported that they had obtained a 2(i) degree or higher, and two-fifths of mathematics teachers and almost half of heads of mathematics departments declared that they held a degree of 2(ii) or lower. Less than one in ten of the teachers and departmental heads had a first class degree. Tables 1.12 and 1.13 presents an analysis of teachers’ and departmental heads’ highest post-A-level qualification by degree class, in order to ascertain whether teachers and heads of department holding a degree in mathematics tended to have a better class of degree than those with degrees in other subjects. In these tables, only those teachers and heads of department who responded to the question concerning degree class on their questionnaires are considered. Thus, the figures quoted relate to a sub-sample of 2,440 mathematics teachers and 615 heads of department.

Part One 33
Table 1.12 The teacher sample’s highest post-A-level qualification in mathematics by degree class
Degree Class Highest post-A-level qualification in mathematics
1st 2nd 2(i) 2(ii) 3rd Ordinary Other
Degree in maths % 14 5 29 30 15 2 6 B.Sc or BA with QTS or B.Ed in maths % 12 5 36 32 7 4 6 Cert Ed incorporating maths % 9 13 22 25 6 13 13 PGCE incorporating maths % 5 5 33 40 13 2 4 Other post-A-level maths qualification % 13 8 38 20 6 2 14 No post-A-level maths qualification % 7 6 31 41 7 2 6 Base: 2,440 Due to rounding, percentages may not sum to 100 Source: NFER survey of teachers of mathematics, 2005.
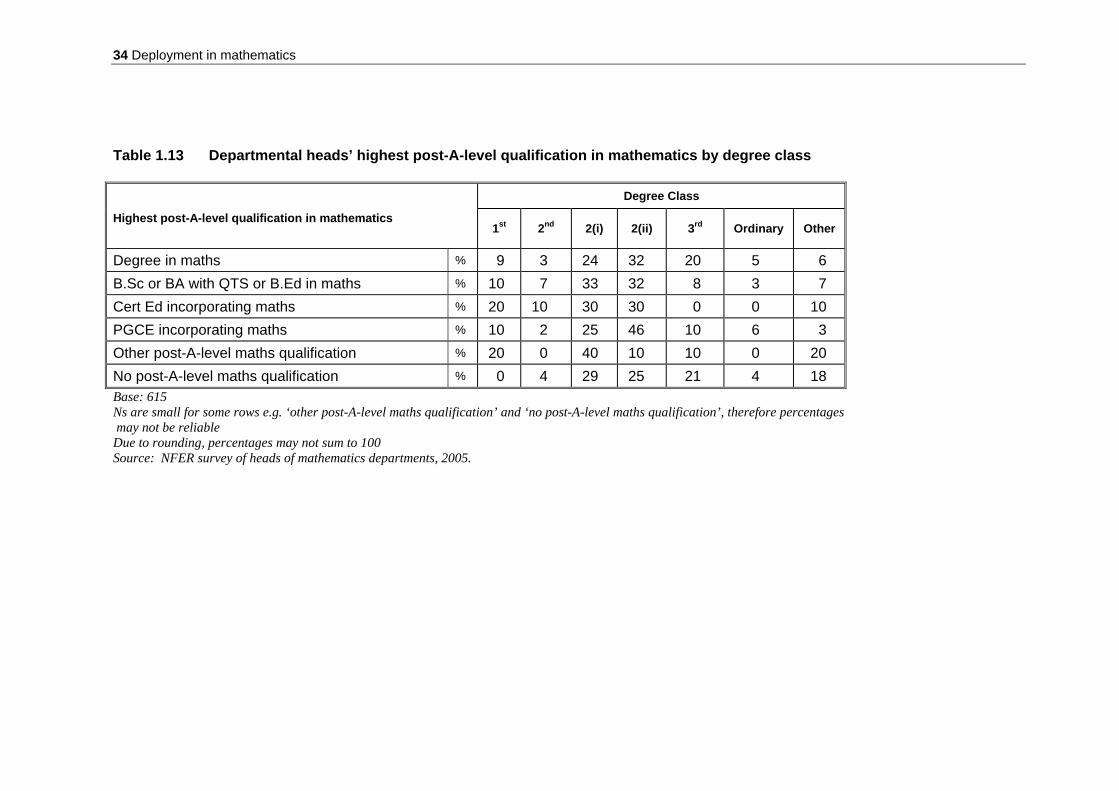
34 Deployment in mathematics
Table 1.13 Departmental heads’ highest post-A-level qualification in mathematics by degree class
Degree Class
Highest post-A-level qualification in mathematics 1st 2nd 2(i) 2(ii) 3rd Ordinary Other
Degree in maths % 9 3 24 32 20 5 6 B.Sc or BA with QTS or B.Ed in maths % 10 7 33 32 8 3 7 Cert Ed incorporating maths % 20 10 30 30 0 0 10 PGCE incorporating maths % 10 2 25 46 10 6 3 Other post-A-level maths qualification % 20 0 40 10 10 0 20 No post-A-level maths qualification % 0 4 29 25 21 4 18 Base: 615 Ns are small for some rows e.g. ‘other post-A-level maths qualification’ and ‘no post-A-level maths qualification’, therefore percentages may not be reliable Due to rounding, percentages may not sum to 100 Source: NFER survey of heads of mathematics departments, 2005.

Part One 35
Tables 1.12 and 1.13 show the following.
• Almost half of mathematics teachers compared with one-third of heads of department with a degree in mathematics held at least a 2(i) degree. This means that in this sample the majority of heads of department with a degree in mathematics held a degree of 2(ii) or lower.
• More than half of the teachers with B.Ed/QTS in mathematics held a 1st, 2nd or 2(i) degree, suggesting that these teachers tended to have a better degree classification than those with a degree in maths or those with a PGCE in maths (but with a degree in another subject).
• Almost three-fifths of mathematics teachers and more than two-thirds of heads of mathematics departments in the PGCE in mathematics category held a degree of 2(ii) or lower.
Extrapolating to the sample of 3,220 mathematics teachers and heads of 773 mathematics departments as a whole, we can deduce the following information.
• Around one-sixth of mathematics teachers (13 per cent) and heads of mathematics departments (17 per cent) held at least a 2(i) degree in mathematics.
• Almost one-fifth of mathematics teachers and one-third of heads of department held a degree in mathematics of 2(ii) or lower.
1.4 Characteristics of heads of mathematics
departments and mathematics teachers This section moves on to consider the characteristics of the heads of mathematics departments and mathematics teachers in the survey samples, including:
• gender • age • length of time in teaching and teaching mathematics • any previous career • other roles in department/school • contract type.
1.4.1 Gender Of the 771 heads of mathematics departments who responded to the question on gender on the questionnaire, just over half were male (53 per cent). The converse was true of the sample of 3,210 teachers who responded to this question where the largest proportion of teachers was female (55 per cent).

36 Deployment in mathematics
1.4.2 Age Mathematics teachers spanned a wide age-range from the youngest at 21 to the eldest at 66 years of age. The majority of heads of department were aged between 30 and 59 and were evenly spread across these three decades. While one-fifth of teachers were aged under 30, more than half of teachers were aged over 40 and almost one-third were over 50, suggesting an ageing profile of mathematics teachers in line with data from the Secondary Schools Curriculum and Staffing Survey (SSCSS) and reported as an area of concern in the Smith Inquiry (2004, pp. 33-34). However, this did not differ substantially from the age profile of all teachers (DfES, 2005). Table 1.14 Age range of mathematics teachers and heads of department in
the samples
Mathematics teachers Heads of mathematics departments Age range
N % N % Under 25 150 5 1 <1 25-29 444 15 26 4 30-39 749 25 221 31 40-49 779 26 240 33 50-59 857 28 232 32 60+ 57 2 5 <1 TOTAL 3,036 100 725 100
184 mathematics teachers and 48 heads of department made no response to this question Due to rounding, percentages may not sum to 100 Source: NFER surveys of teachers of mathematics and heads of mathematics departments, 2005. Table 1.15 provides a breakdown of the age profile of mathematics teachers by the highest post-A-level qualification in maths. In this sample, teachers with a degree in mathematics were more or less evenly spread across the decades from 20–60 years of age. In contrast, maths teachers with no post-A-level qualification in the subject tend to be older, with almost three-quarters of these teachers aged over 40. Table 1.16 gives the age by highest qualification in maths breakdown for heads of mathematics departments in the sample. As would be expected, the majority of departmental heads holding the certificate in education in mathematics are aged over 50 years old. Departmental heads with a degree in mathematics are roughly spread equally across the decades from 30–60.
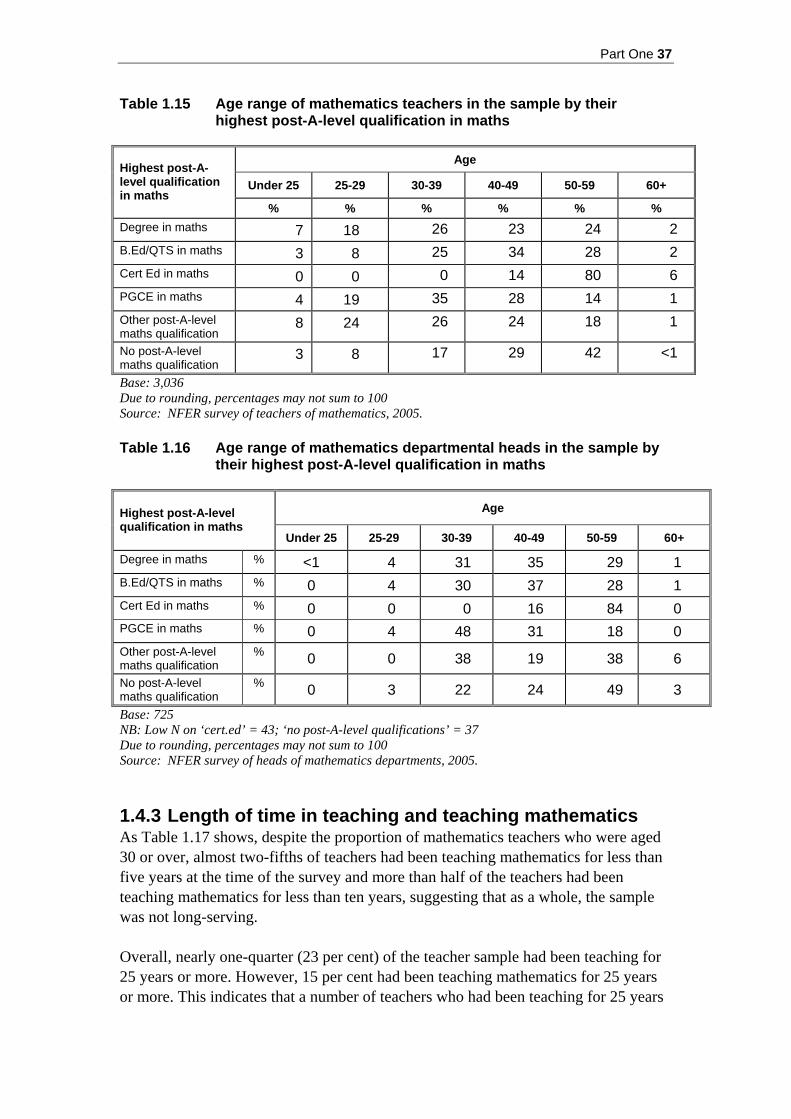
Part One 37
Table 1.15 Age range of mathematics teachers in the sample by their highest post-A-level qualification in maths
Age
Under 25 25-29 30-39 40-49 50-59 60+ Highest post-A-level qualification in maths
% % % % % % Degree in maths 7 18 26 23 24 2 B.Ed/QTS in maths 3 8 25 34 28 2 Cert Ed in maths 0 0 0 14 80 6 PGCE in maths 4 19 35 28 14 1 Other post-A-level maths qualification
8 24 26 24 18 1
No post-A-level maths qualification
3 8 17 29 42 <1
Base: 3,036 Due to rounding, percentages may not sum to 100 Source: NFER survey of teachers of mathematics, 2005. Table 1.16 Age range of mathematics departmental heads in the sample by
their highest post-A-level qualification in maths
Age Highest post-A-level qualification in maths
Under 25 25-29 30-39 40-49 50-59 60+
Degree in maths % <1 4 31 35 29 1 B.Ed/QTS in maths % 0 4 30 37 28 1 Cert Ed in maths % 0 0 0 16 84 0 PGCE in maths % 0 4 48 31 18 0 Other post-A-level maths qualification
% 0 0 38 19 38 6 No post-A-level maths qualification
% 0 3 22 24 49 3 Base: 725 NB: Low N on ‘cert.ed’ = 43; ‘no post-A-level qualifications’ = 37 Due to rounding, percentages may not sum to 100 Source: NFER survey of heads of mathematics departments, 2005. 1.4.3 Length of time in teaching and teaching mathematics As Table 1.17 shows, despite the proportion of mathematics teachers who were aged 30 or over, almost two-fifths of teachers had been teaching mathematics for less than five years at the time of the survey and more than half of the teachers had been teaching mathematics for less than ten years, suggesting that as a whole, the sample was not long-serving. Overall, nearly one-quarter (23 per cent) of the teacher sample had been teaching for 25 years or more. However, 15 per cent had been teaching mathematics for 25 years or more. This indicates that a number of teachers who had been teaching for 25 years

38 Deployment in mathematics
or more had been qualified as a teacher for more time than they had been teaching mathematics, suggesting that some of these teachers had moved into teaching mathematics subsequent to having been a qualified teacher in another subject. Table 1.17 Length of time mathematics teachers have been teaching and the
length of time they have been teaching mathematics
Time spent in teaching Time spent teaching mathematics Length of time
N % N % 0–5 years 998 32 1,120 38 5 years, 1 month–10 years 540 17 536 18 10 years, 1 month–15 years 309 10 313 11 15 years, 1 month–20 years 246 8 263 9 20 years, 1 month–25 years 302 10 255 9 25 years, 1 month or more 719 23 443 15 TOTAL 3,114 100 2,930 100 106 mathematics teachers did not respond to ‘time in teaching’; 290 mathematics teachers did not respond to ‘time teaching mathematics’ Due to rounding, percentages may not sum to 100 Source: NFER survey of teachers of mathematics, 2005. Table 1.18 presents the length of time that heads of departments had been teaching and the length of time that they had been heads of mathematics departments. Overall, more than half of heads of mathematics departments (57 per cent) had been in this post for less than five years. One-quarter (25 per cent) of heads of department had managed a department for more than ten years. Table 1.18 Length of time heads of mathematics departments have been
teaching and the length of time they have been heads of department
Time spent in teaching Time as head of department Length of time
N % N % 0–5 years 28 4 421 57 5 years, 1 month–10 years 160 21 140 19 10 years, 1 month–15 years 149 20 84 11 15 years, 1 month–20 years 93 12 62 8 20 years, 1 month–25 years 117 15 19 3 25 years, 1 month or more 215 28 19 3 TOTAL 762 100 745 100 11 heads of department did not respond to ‘time spent in teaching’ question; 28 did not respond to ‘time as head of department’ question Due to rounding, percentages may not sum to 100 Source: NFER survey of heads of mathematics departments, 2005. As can be seen from Table 1.19, schools in the lowest band of GCSE attainment had the largest representation of heads of mathematics departments with less than five

Part One 39
years’ experience. At almost one-third, this was nearly twice the proportion of heads of department with more than ten years’ experience in these schools. Table 1.19 Length of time heads of mathematics have been heads of
department by the GCSE achievement band of the school
Length of time as head of department
0-5 years 5 yrs, 1 month – 10 years More than 10 years
GCSE Achievement band Total GCSE point-score 2002
N % N % N % Lowest band 130 32 35 26 31 17 2nd lowest band 94 23 29 21 49 27 Middle band 71 17 34 25 32 18 2nd highest band 63 15 18 13 33 18 Highest band 51 13 20 15 34 19 TOTAL 409 100 136 100 179 100 Base: 724 49 no response Due to rounding, percentages may not sum to 100 Source: NFER survey of heads of mathematics departments, 2005. As with the GCSE attainment of schools, there were significant differences in the distribution of experienced and less-experienced heads of mathematics departments in schools with varying levels of SEN pupils. Table 1.20 reveals that less-experienced heads of department were represented within schools with a higher proportion of SEN pupils more than twice as frequently (34 per cent) than heads of department with more than ten years’ experience of the role (16 per cent). Table 1.20 Length of time heads of mathematics have been heads of
department by the percentage of SEN pupils in the school
Length of time as head of department
0-5 years 5 yrs, 1 month – 10 years More than 10 years
Percentage of SEN pupils
N % N % N % None 11 4 1 1 10 8 1 – 3 % 176 62 65 70 102 76 4 – 29% 95 34 27 29 22 16 Base: 509 Due to rounding, percentages may not sum to 100 Source: NFER survey of heads of mathematics departments, 2005. 1.4.4 Careers before teaching mathematics The older age profile of teachers of mathematics, coupled with the fact that many have been teaching for less than ten years may be related to the trend in this group for having a career prior to entering teaching.

40 Deployment in mathematics
Indeed, more than two-fifths (42 per cent) of mathematics teachers surveyed had had another career prior to entering teaching. Of those teachers who had had a career before teaching, the largest proportions had joined the teaching profession from accountancy (22 per cent), engineering (17 per cent) and IT-related industries (10 per cent). By contrast, a smaller proportion of the mathematics heads of department had had a career prior to entering the teaching profession – closer to one third (32 per cent). As with mathematics teachers, the majority came from the accounting (26 per cent) and engineering sectors (16 per cent). 1.4.5 Other roles in department/school More than half of heads of department responding to the questionnaire reported that they held no other roles or responsibilities in their school. Of the 45 per cent of heads of department who held extra responsibilities, one-fifth held more senior management roles within the school such as an assistant or deputy headship, being a member of the senior management team or being a senior teacher; one-third had pastoral responsibilities, mainly as a form tutor but also as head or deputy head of year; and more than half held other whole-school roles including administrative, extra-curricular and teaching and learning-related roles. In contrast, more than two-thirds of teachers of mathematics also held some extra roles or responsibilities within the school. The most frequently cited other responsibilities held by mathematics teachers were in the area of pastoral care: one-fifth of teachers in this category were form tutors and 14 per cent were either heads or deputy-heads of year. Almost one-third of teachers with extra responsibilities held whole-school responsibilities and more than one-quarter held extra responsibilities within the mathematics department, usually related to a curriculum phase, such as Key Stage 3 coordinator. In total, three per cent of departmental heads in the sample and two per cent of the teachers were Advanced Skills Teachers (ASTs). 1.4.6 Contract type Teachers and departmental heads were asked to state whether their contract was temporary, supply or permanent and full time or part-time. The following findings are based on the samples of 3,220 mathematics teachers and 773 heads of department.
• Overall, 93 per cent of mathematics teachers in the sample were on permanent contracts, 5 per cent held temporary contracts and 2 per cent were supply teachers.
• Just over one in ten of the mathematics teachers (11 per cent) were part-time.
• 94 per cent of the departmental heads held permanent contracts and 6 per cent stated that they were a temporary or acting head of department.

Part One 41
To sum up the characteristics of mathematics teachers and heads of mathematics departments, we have seen an ageing profile of teachers and heads of departments. However, half of the teachers had been teaching for less than ten years and the majority of heads of department had experience of this post for less than five years. A large proportion of teachers had had a career prior to teaching, which may explain the relationship between their age and experience. 1.5 Concluding comments Based on responses from departmental heads, almost one-quarter of the teachers deployed to teach mathematics were either non-specialists or were principally teachers of other subjects. However, this overall figure for the qualifications of mathematics teachers masks inequity in staffing between schools. Thus, the least qualified teachers were most often found in the lowest attaining schools, those serving areas of socio-economic deprivation and those with an 11-16 age range. Whilst not suggesting that teachers’ qualifications necessarily equate with the quality of teaching, these findings would suggest the need for a continued focus on attracting as many maths specialists as possible to the profession. Further, given the proportion of non-specialists currently teaching maths, professional development may be needed for these teachers in order to consolidate and extend their subject knowledge. This seems especially the case when, as Chapter 5 will show, furthering maths subject knowledge and skills was reported to be the foci of professional development least often across the departments in the sample. Additionally, given the inequity in the staffing of mathematics that exists between schools, the data raises questions as to how a better balance can be achieved in order to ensure that all pupils, regardless of the school they attend, have a more equal chance of receiving specialist teaching. Indeed, we will see further evidence of inequity when we examine how the deployment of teachers varies according to ability grouping in the next chapter.
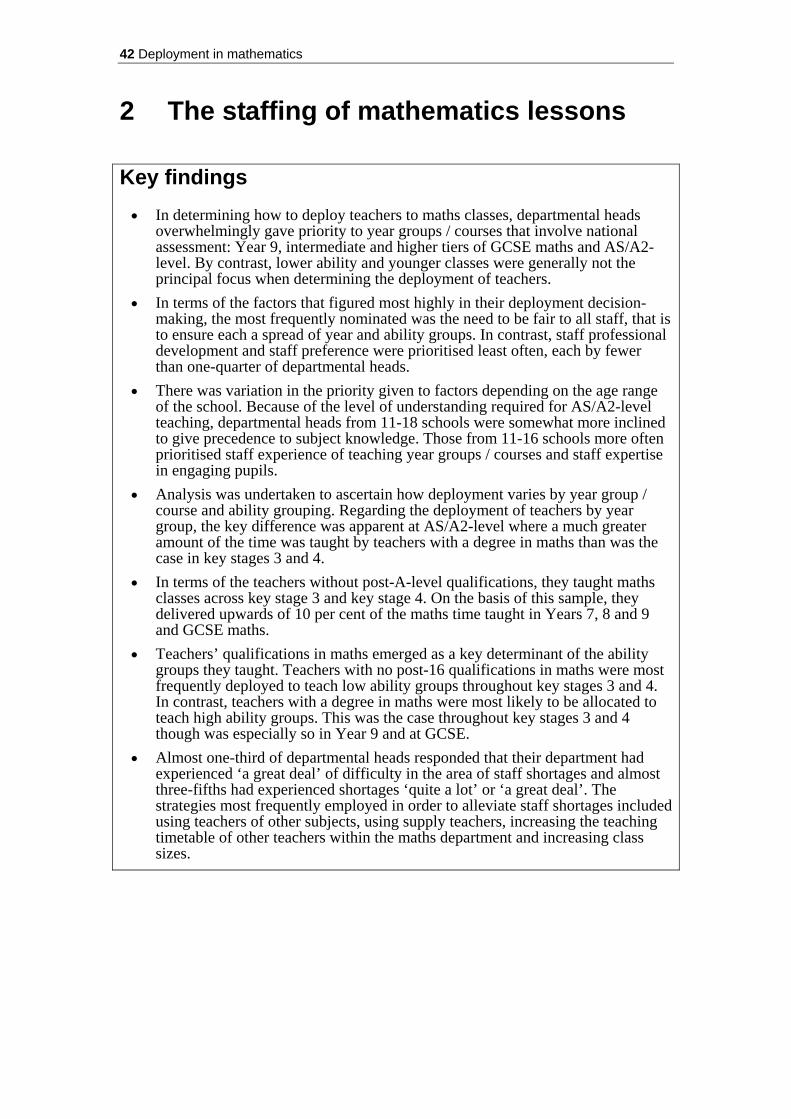
42 Deployment in mathematics
2 The staffing of mathematics lessons Key findings
• In determining how to deploy teachers to maths classes, departmental heads overwhelmingly gave priority to year groups / courses that involve national assessment: Year 9, intermediate and higher tiers of GCSE maths and AS/A2-level. By contrast, lower ability and younger classes were generally not the principal focus when determining the deployment of teachers.
• In terms of the factors that figured most highly in their deployment decision-making, the most frequently nominated was the need to be fair to all staff, that is to ensure each a spread of year and ability groups. In contrast, staff professional development and staff preference were prioritised least often, each by fewer than one-quarter of departmental heads.
• There was variation in the priority given to factors depending on the age range of the school. Because of the level of understanding required for AS/A2-level teaching, departmental heads from 11-18 schools were somewhat more inclined to give precedence to subject knowledge. Those from 11-16 schools more often prioritised staff experience of teaching year groups / courses and staff expertise in engaging pupils.
• Analysis was undertaken to ascertain how deployment varies by year group / course and ability grouping. Regarding the deployment of teachers by year group, the key difference was apparent at AS/A2-level where a much greater amount of the time was taught by teachers with a degree in maths than was the case in key stages 3 and 4.
• In terms of the teachers without post-A-level qualifications, they taught maths classes across key stage 3 and key stage 4. On the basis of this sample, they delivered upwards of 10 per cent of the maths time taught in Years 7, 8 and 9 and GCSE maths.
• Teachers’ qualifications in maths emerged as a key determinant of the ability groups they taught. Teachers with no post-16 qualifications in maths were most frequently deployed to teach low ability groups throughout key stages 3 and 4. In contrast, teachers with a degree in maths were most likely to be allocated to teach high ability groups. This was the case throughout key stages 3 and 4 though was especially so in Year 9 and at GCSE.
• Almost one-third of departmental heads responded that their department had experienced ‘a great deal’ of difficulty in the area of staff shortages and almost three-fifths had experienced shortages ‘quite a lot’ or ‘a great deal’. The strategies most frequently employed in order to alleviate staff shortages included using teachers of other subjects, using supply teachers, increasing the teaching timetable of other teachers within the maths department and increasing class sizes.

Part One 43
2.1 Introduction Chapter 1 of this report set out the qualifications of the teachers who currently teach mathematics lessons in a sample of one in four secondary schools in England. This section now considers how these teachers are deployed to teach the various year groups and ability groups in terms of the qualifications that they hold. To this end, this chapter sets out the year groups and key factors that are prioritised in departmental heads’ decision-making on the deployment of staff to mathematics classes. It then moves on to consider how this translates into practice by examining the teaching timetables of our sample in order to ascertain how deployment varies according to year group and ability group at Key Stage 3, type of course and level at Key Stage 4 (for example, entry-level maths, GCSE maths – foundation tier, intermediate tier, higher tier) and at AS/A2-level. The chapter then concludes by considering the sample’s experience of shortages of mathematics-specialist teaching staff and the strategies used to remedy such shortages. Thus, the chapter is structured as follows: Section 2.2 Decision-making regarding the deployment of teachers to classes Section 2.3 The deployment of teachers to mathematics classes Section 2.4 Strategies for alleviating staff shortages Section 2.5 Concluding comments 2.2 Decision-making regarding the deployment of
teachers to classes In order to understand the way in which decisions are made regarding the allocation of available teachers to the various maths classes, heads of mathematics departments were invited to answer the following in their questionnaires:
‘In determining how to deploy teachers to teach maths classes, please select from the list the four year groups / courses that tend to be given the highest priority in your decision making.’ ‘In determining how to deploy teachers to teach maths classes, please select from the list the three factors that tend to be given the highest priority in your decision-making.’
Table 2.1 and Table 2.2 set out the findings from these inquiries. Both tables first show the responses from all of the heads of maths departments in the sample, then the results are presented for the departmental heads working in 11-16 schools and then those from 11-18 schools.

44 Deployment in mathematics
Table 2.1 The year groups and courses given the highest priority in
departmental heads’ decision-making when deploying teachers to maths classes
The figures show the percentage of heads of department nominating each year
group / course for the overall sample and then for 11-16 and 11-18 schools
Heads of maths: all sample schools
Heads of maths: 11-16 schools
Heads of maths: 11-18 schools
Year group / course given the highest priority in the deployment of staff
N % N % N % Year 7 175 23 104 32 61 16 Year 8 97 13 64 20 23 6 Year 9 661 86 316 97 303 80 GCSE maths foundation 219 28 136 42 59 16 GCSE maths intermediate 693 90 307 95 331 87 GCSE maths higher 684 89 293 90 337 89 Other key stage 4 maths 29 4 17 5 12 3 AS/A2-level maths 396 51 5 2 337 89 Other post-16 maths 25 3 2 <1 18 5 No response 16 2 10 3 5 1 TOTAL 773 100 325 100 381 100
Multiple response question: heads of department could select up to four year groups, therefore percentages may not sum to 100 Source: NFER survey of heads of mathematics departments, 2005.
Table 2.2 The factors given the highest priority in departmental heads’
decision-making when deploying teachers to maths classes The figures show the frequency and percentage of heads of department
nominating each factor for the overall sample and then for 11-16 and 11-18 schools
Heads of maths: all sample schools
Heads of maths: 11-16 schools
Heads of maths: 11-18 schools
Year group / course given the highest priority in the deployment of staff
N % N % N % Need to be fair to all staff (spread of year / ability groups) 537 70 224 69 264 69
Staff subject knowledge 521 67 203 63 268 70 Staff experience of teaching year groups / courses 488 63 218 67 234 61
Staff expertise in engaging pupils 435 56 204 63 194 51
Staff professional development 177 23 71 22 95 25
Staff preference 158 20 55 17 81 21 No response 16 2 8 3 6 2 TOTAL 773 100 325 100 381 100
Multiple response question: heads of department could select up to three factors, therefore percentages do not sum to 100 Source: NFER survey of heads of mathematics departments, 2005.

Part One 45
The tables reveal the following about departmental heads’ decision-making regarding the deployment of available teachers to maths classes. Overwhelmingly, priority was given to year groups / courses that involve national assessment, though the precise focus differed according to the age range of the school. In 11-18 schools in the survey sample, the vast majority of heads of department – almost 90 per cent – indicated that they gave precedence to AS/A2-level groups and higher tiers of GCSE maths, then intermediate GCSE groups. Departmental heads from 11-16 schools almost unanimously gave highest priority to Year 9 followed by the intermediate then higher tiers of GCSE maths. This reflects the rationales given by several of the heads of department in 11-16 schools interviewed for the case-study phase of the research who, when discussing how they allocated teachers to classes, relayed how those on the cusp of achieving level 5 or higher in Year 9 national assessment, D/C borderline groups at GCSE and high attaining GCSE classes would be prioritised because these were ‘critical’ to published school attainment statistics. By contrast, lower ability and younger classes were generally not the principal focus when determining the deployment of teachers. A minority of departmental heads responded that they gave precedence to the foundation tier of GCSE and the early years of key stage 3, though Year 7 – as pupils’ introduction to maths at secondary level – did figure higher in decision-making than Year 8. In both 11-16 and 11-18 schools, these courses and year groups were not often prioritised, though this was especially the case in 11-18 schools. As Table 2.2 presents, when asked to select the three factors that figured most highly in their decision-making regarding the teachers to deploy to classes, the composition of teachers’ own timetable was most frequently identified. The need to be fair to all staff, that is to ensure a spread of year and ability groups, was nominated by 70 per cent of the sample overall, was the top factor among departmental heads in 11-16 schools and was a close second for heads of department in 11-18 schools. Also commonly cited overall were factors associated with the skills the teacher would bring to the class: staff subject knowledge, experience of teaching year groups / courses and expertise in engaging pupils. In contrast, whilst the need to be fair to all was the most frequently endorsed factor by the sample overall, other factors focussed on the teachers themselves – their professional development and their preference – were prioritised least often, each by fewer than one-quarter of departmental heads. As was the case with the differing priority given to year groups, there was variation according to the age range of the school in the factors that figured predominately in departmental heads’ deployment decision-making. In particular, departmental heads from 11-18 schools were somewhat more inclined to give precedence to subject knowledge. This was the most frequently identified factor by heads of department in

46 Deployment in mathematics
these schools, which, according to the case-study data, was because of the level of understanding required for AS/A2-level teaching. Those from 11-16 schools more often prioritised staff experience of teaching year groups / courses and staff expertise in engaging pupils. Having established the year groups / courses and factors that feature most predominately in departmental heads’ decision-making on deployment, we will now consider how this translates into practice by examining the teaching timetables of our sample. 2.3 The deployment of teachers to mathematics
classes Chapter 1 of this report set out the qualifications of 3,220 teachers of maths and 773 head of departments, and earlier in this chapter departmental heads’ decision-making regarding the deployment of teachers to classes was discussed. We will now examine the year groups and courses that the teachers in the survey sample taught in order to examine whether there were any differences in how staff with the various qualifications were allocated to teach year groups and courses. This analysis was undertaken by inviting teachers in their questionnaires to state, as appropriate, the number of periods per week7 they taught to each of:
• key stage 3: Year 7, Year 8, Year 9 • key stage 4: GCSE maths, entry / certificate-level maths, other key
stage 4 maths • post-16 maths: AS/A2-level, further maths, other post-16 maths courses
For the purposes of the analysis, the periods spent teaching each year group / course were converted into time spent teaching in minutes (by multiplying the number of periods by the length of periods). This established the length of time per week that each teacher respondent spent teaching each year group / course. By summing all responses for, say, Year 7, we could ascertain the total length of time that the teacher sample spent teaching Year 7. This figure was then disaggregated by qualification band, that is teachers’ highest maths qualification (as set out in Chapter 1). This was repeated for all year groups and courses. From this, we have been able to determine – for our sample – firstly the proportion of time taught by teachers with the various qualifications and secondly how deployment varies by year group / course. For example, do those teachers without post-A-level qualifications in maths tend to be allocated to certain year groups? Do teachers who hold a degree in maths teach more GCSE and A-level courses?
7Teachers in schools operating 6-day or 10-day timetables etc... were asked to state the number of periods taught over the 6 days or 10 days, etc., as appropriate. When analysis was undertaken of their timetable data, their figures were calculated to give proportionately the number of periods they would have taught over a 5-day period.

Part One 47
Table 2.3 presents the results of this analysis for the sample of teachers overall. Tables 2.4-2.5 then set out the findings split by the age range of the school because, as section 2.2 showed, deployment priorities differed as heads of department allocated staff across five year groups in 11-16 schools and across seven year groups in 11-18 schools.

48 Deployment in mathematics
Table 2.3 The proportion of time taught to each year group / course by teachers’ highest post-A-level qualification in
mathematics: overall sample
Proportion of time taught to each year group / course
Year 7 Year 8 Year 9 GCSE Entry Level A-level Further maths
Highest post-A-level qualification in mathematics
% Teachers overall in category
% % % % % % (% Degree in maths 42 39 40 41 42 30 66 73 B.Sc or BA with QTS or B.Ed in maths 16 16 17 17 17 19 13 10 Cert Ed incorporating maths 6 6 6 6 7 9 2 <1 PGCE incorporating maths 18 20 20 19 20 20 15 13 Other post-A-level maths qualification 4 5 6 5 4 3 2 1 A-Level maths or no post-16 maths qualification 14 13 11 12 10 19 2 2 No response <1 <1 <1 <1 <1 0 0 0 TOTAL 100 100 100 100 100 100 100 100
Base: 2,945 Due to rounding, percentages may not sum to 100 Source: NFER survey of teachers of mathematics, 2005.
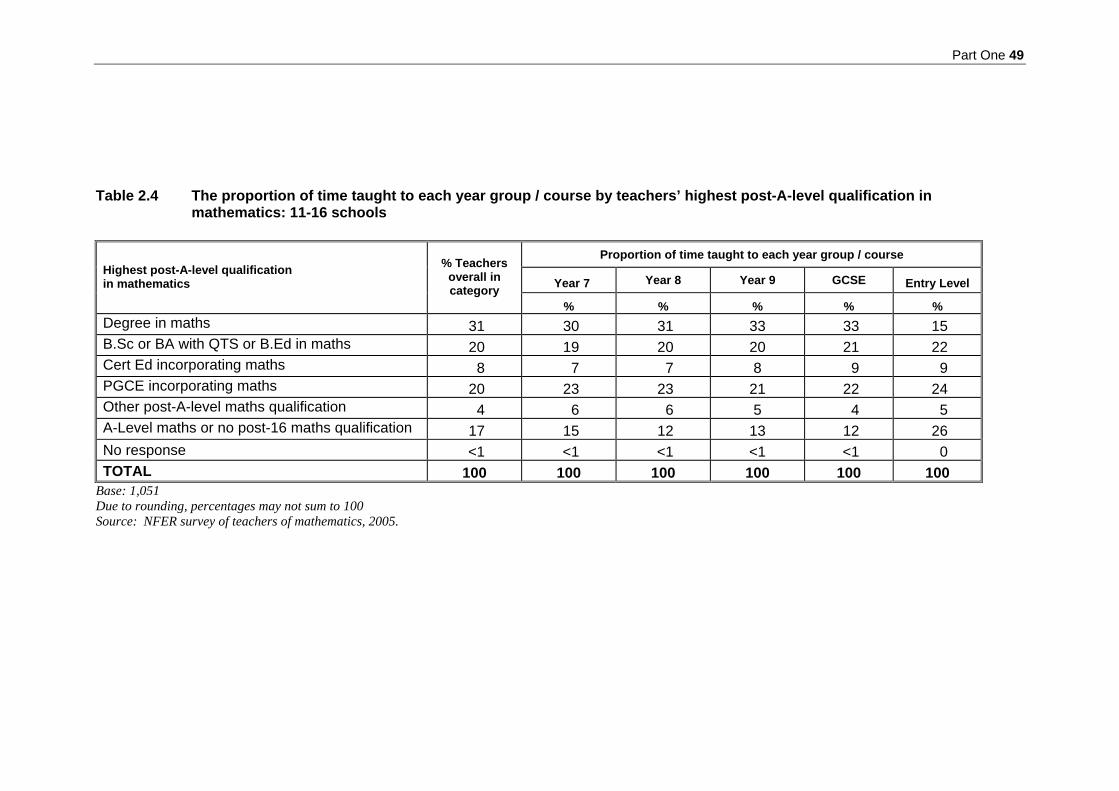
Part One 49
Table 2.4 The proportion of time taught to each year group / course by teachers’ highest post-A-level qualification in
mathematics: 11-16 schools
Proportion of time taught to each year group / course
Year 7 Year 8 Year 9 GCSE Entry Level Highest post-A-level qualification in mathematics
% Teachers overall in category
% % % % % Degree in maths 31 30 31 33 33 15 B.Sc or BA with QTS or B.Ed in maths 20 19 20 20 21 22 Cert Ed incorporating maths 8 7 7 8 9 9 PGCE incorporating maths 20 23 23 21 22 24 Other post-A-level maths qualification 4 6 6 5 4 5 A-Level maths or no post-16 maths qualification 17 15 12 13 12 26 No response <1 <1 <1 <1 <1 0 TOTAL 100 100 100 100 100 100
Base: 1,051 Due to rounding, percentages may not sum to 100 Source: NFER survey of teachers of mathematics, 2005.

50 Deployment in mathematics
Table 2.5 The proportion of time taught to each year group / course by teachers’ highest post-A-level qualifications in
mathematics: 11-18 schools
Proportion of time taught to each year group / course
Year 7 Year 8 Year 9 GCSE Entry Level A-level Further maths
Highest post-A-level qualification in mathematics
% Teachers overall in category
% % % % % % % Degree in maths 47 45 46 46 47 46 65 73 B.Sc or BA with QTS or B.Ed in maths 14 15 15 16 16 15 15 11 Cert Ed incorporating maths 5 6 6 5 6 10 2 <1 PGCE incorporating maths 18 18 17 17 18 14 15 13 Other post-A-level maths qualification 5 6 6 5 5 2 2 <1 A-Level maths or no post-16 maths qualification 12 11 10 11 9 13 2 3 No response <1 <1 <1 <1 <1 0 0 0 TOTAL 100 100 100 100 100 100 100 100
Base: 1,631 Due to rounding, percentages may not sum to 100 Source: NFER survey of teachers of mathematics, 2005.
Part One 51
2.3.1 Deployment by year group Examination of the tables reveals the following about the deployment of teachers to year groups. The second column of all of the tables shows the proportion of the samples holding each of the maths qualification types. Examining this against the figures for time, it can be seen that at key stages 3 and 4 (except entry level) the proportion of time taught by each of the qualifications bands is very roughly in line with percentage of sample to hold this qualification. For example, those with B.Ed/QTS in maths constitute 16 per cent of the overall sample, and about 16 per cent of the time taught by the teacher sample to each year group was taken by this band. This means that those with a degree in maths, i.e. the largest qualification band, taught the largest amount of the time for each year group / course (save entry/certificate-level maths). This was especially the case for AS/A2-level maths and further maths. Here, in fact, substantially more of the time was taught by teachers with a degree – in our overall sample, they taught two-thirds of the AS/A2-level time. This would reflect the priority given to AS/A2-level and the focus on subject knowledge in 11-18 schools in departmental heads’ decision making regarding deployment. In terms of teachers without post-A-level qualifications in maths, they taught each year group of key stage 3 and key stage 4 courses, teaching upwards of 10 per cent of the time in this sample. As Table 2.3 shows, there was a slightly greater concentration in Year 7 (especially for those with no post-16 qualification in maths), but slightly less concentration at GCSE and much less so at AS/A2-level. None the less, although tiny proportions, there were still teachers taking AS/A2-level classes with no A-level or no post-A-level qualification in the subject themselves. Chapter 1 revealed that in terms of qualifications, those with a degree in maths were more strongly represented in 11-18 schools, and that teachers without post-A-level qualifications in maths were found in greater numbers in 11-16 schools. As Tables 2.4 and 2.5 show, this was reflected in the analysis of teaching time, and there were some stark differences in the amount of time taught by teachers with the various qualifications throughout key stages 3 and 4 according to the age range of the school. Using GCSE as an example, in 11-16 schools one-third of the time that our teacher sample spent with GCSE classes was taken by teachers with a maths degree. In contrast, in 11-18 schools, almost half the time that the teacher sample spent teaching GCSE mathematics was taught by those with a degree in the subject. To sum up so far, in terms of the deployment of teachers by year group, the key difference was apparent at AS/A2-level where a much greater amount of the time was taught by teachers with a degree in maths than was the case in key stages 3 and 4. Teachers with no post-A-level qualifications in maths were spread across key stages 3 and 4. They were not, as might have been the case, allocated predominately to teach Year 7 or Year 8 with a smattering of teaching elsewhere. On the basis of this evidence, the deployment of staff in terms of their qualifications did not appear to vary substantially by year group until AS/A2-level.

52 Deployment in mathematics
However, in contrast, when we look at teachers’ qualifications by the ability groups they teach, this does emerge as a more influential determinant of deployment at key stages 3 and 4. The first clue of this is evident in Tables 2.3 and 2.4, with teachers without post-A-level qualifications in maths delivering upwards of 20 per cent of the total time that was taught to entry-level/certificate-level classes. This section will now move on to consider how deployment varies by ability grouping in greater depth. 2.3.2 Deployment by ability grouping In their questionnaires, teachers were asked to indicate, as appropriate, the ability groupings (mixed ability, low, mid, high) they taught for each year of key stage 3 and to state the tiers of GCSE mathematics that they taught: low, intermediate, high. Analysis revealed that teachers with no post-16 qualification in maths did teach all ability groups from Year 7 to GCSE. However, the greatest proportion was deployed to teach low ability classes in each year of key stage 3 and also at key stage 4. This was particularly the case when teaching GCSE where around three-fifths of those without post-16 maths qualifications had been allocated to teach GCSE foundation level. That is not to say, however, that low ability groups at key stage 3 and foundation tier GCSE were most often taught by teachers with no-post-16 qualification. Table 2.6 takes all the teachers in the sample who teach low ability maths groups and splits the data in terms of the qualification of these staff. This shows that around 10 per cent of the teachers taking low ability groups had no post-16 qualifications in maths. None the less, compare this table with Table 2.7 which shows the percentage of the teachers taking high ability groups and it can be seen that proportionately more teachers with no post-16 qualifications in maths were deployed to teach low ability groups. Teachers with a degree in maths were most likely to be allocated to teach high ability groups. This was the case throughout key stages 3 and 4 though was especially so in Year 9 and at GCSE. For example, as shown in Table 2.7:
• half of the teachers deployed to teach the higher tier of GCSE maths had a degree in the subject
• in contrast, 38 per cent of those teaching foundation tier had a maths degree.
Part One 53
Table 2.6 The proportion of teachers who teach low ability for each year group / course by teachers’ highest qualifications in maths
Year group / course taught
Year 7 Low ability
Year 8 Low ability
Year 9 Low ability
GCSE Foundation tier
Highest post-A-level qualification in mathematics
% Teachers overall in category
% % % % Degree in maths 42 37 38 39 38 B.Sc or BA with QTS or B.Ed in maths 16 18 17 16 16
Cert Ed incorporating maths 6 6 7 6 7
PGCE incorporating maths 18 19 18 18 20 Other post-A-level maths qualification 4 5 6 5 4
A-Level maths 6 5 5 6 5 No post-16 maths qualification 8 10 9 10 8
TOTAL 100 100 100 100 100 Base: Y7 = 805; Y8 = 936; Y9 = 975; GCSE foundation: 1640 Due to rounding, percentages may not sum to 100 Source: NFER survey of teachers of mathematics, 2005. Table 2.7 The proportion of teachers who teach high ability for each year
group / course by teachers’ highest qualifications in maths
Year group / course taught
Year 7 High ability
Year 8 High ability
Year 9 High ability
GCSE Higher tier
Highest post-A-level qualification in mathematics
% Teachers overall in category
% % % % Degree in maths 42 40 41 48 51 B.Sc or BA with QTS or B.Ed in maths 16 18 18 18 17
Cert Ed incorporating maths 6 6 7 6 5
PGCE incorporating maths 18 20 20 17 19 Other post-A-level maths qualification 4 5 5 4 3
A-Level maths 6 6 5 4 3 No post-16 maths qualification 8 5 3 3 1
TOTAL 100 100 100 100 100 Base: Y7 = 745; Y8 = 795; Y9 = 903; GCSE foundation: 1224 Due to rounding, percentages may not sum to 100 Source: NFER survey of teachers of mathematics, 2005.
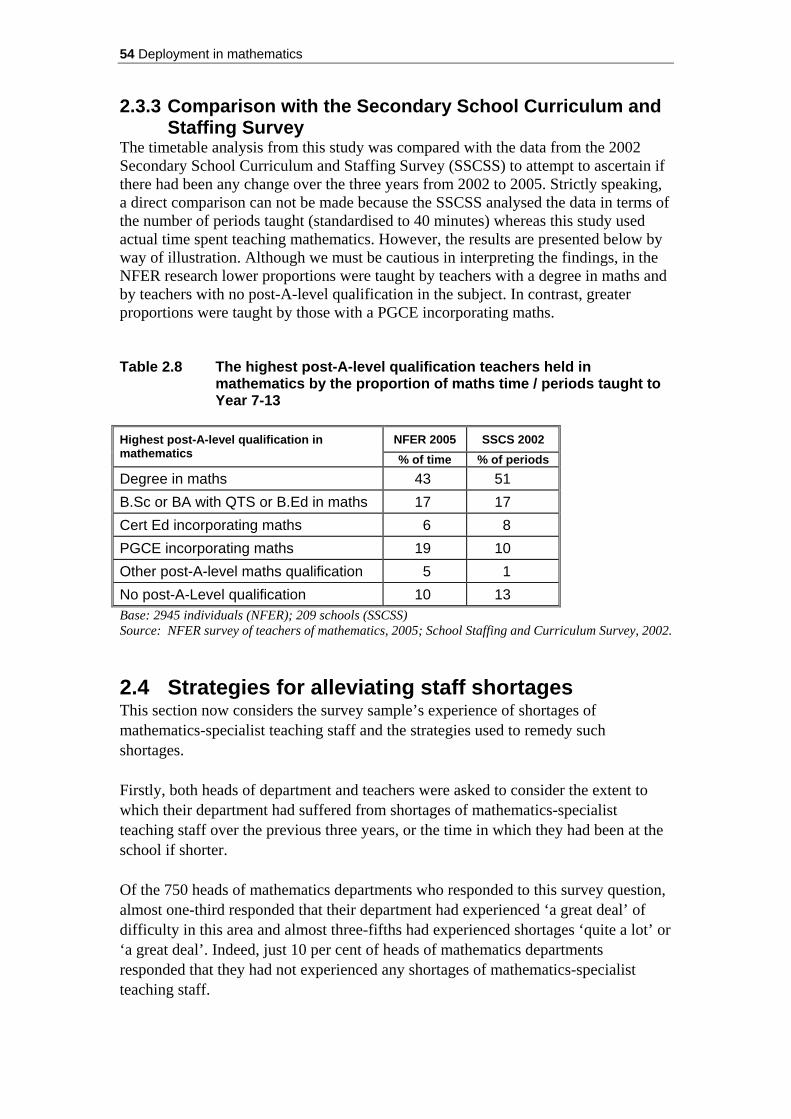
54 Deployment in mathematics
2.3.3 Comparison with the Secondary School Curriculum and Staffing Survey
The timetable analysis from this study was compared with the data from the 2002 Secondary School Curriculum and Staffing Survey (SSCSS) to attempt to ascertain if there had been any change over the three years from 2002 to 2005. Strictly speaking, a direct comparison can not be made because the SSCSS analysed the data in terms of the number of periods taught (standardised to 40 minutes) whereas this study used actual time spent teaching mathematics. However, the results are presented below by way of illustration. Although we must be cautious in interpreting the findings, in the NFER research lower proportions were taught by teachers with a degree in maths and by teachers with no post-A-level qualification in the subject. In contrast, greater proportions were taught by those with a PGCE incorporating maths. Table 2.8 The highest post-A-level qualification teachers held in
mathematics by the proportion of maths time / periods taught to Year 7-13
NFER 2005 SSCS 2002 Highest post-A-level qualification in
mathematics % of time % of periods Degree in maths 43 51 B.Sc or BA with QTS or B.Ed in maths 17 17 Cert Ed incorporating maths 6 8 PGCE incorporating maths 19 10 Other post-A-level maths qualification 5 1 No post-A-Level qualification 10 13 Base: 2945 individuals (NFER); 209 schools (SSCSS) Source: NFER survey of teachers of mathematics, 2005; School Staffing and Curriculum Survey, 2002. 2.4 Strategies for alleviating staff shortages This section now considers the survey sample’s experience of shortages of mathematics-specialist teaching staff and the strategies used to remedy such shortages. Firstly, both heads of department and teachers were asked to consider the extent to which their department had suffered from shortages of mathematics-specialist teaching staff over the previous three years, or the time in which they had been at the school if shorter. Of the 750 heads of mathematics departments who responded to this survey question, almost one-third responded that their department had experienced ‘a great deal’ of difficulty in this area and almost three-fifths had experienced shortages ‘quite a lot’ or ‘a great deal’. Indeed, just 10 per cent of heads of mathematics departments responded that they had not experienced any shortages of mathematics-specialist teaching staff.
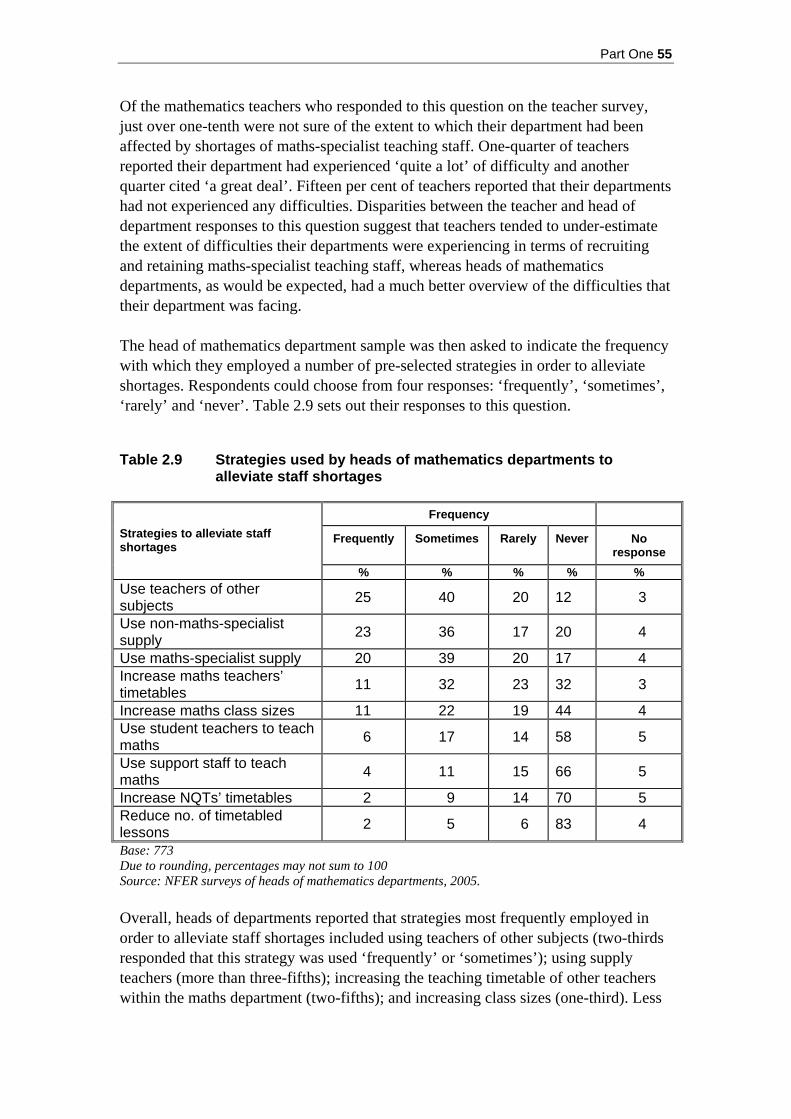
Part One 55
Of the mathematics teachers who responded to this question on the teacher survey, just over one-tenth were not sure of the extent to which their department had been affected by shortages of maths-specialist teaching staff. One-quarter of teachers reported their department had experienced ‘quite a lot’ of difficulty and another quarter cited ‘a great deal’. Fifteen per cent of teachers reported that their departments had not experienced any difficulties. Disparities between the teacher and head of department responses to this question suggest that teachers tended to under-estimate the extent of difficulties their departments were experiencing in terms of recruiting and retaining maths-specialist teaching staff, whereas heads of mathematics departments, as would be expected, had a much better overview of the difficulties that their department was facing. The head of mathematics department sample was then asked to indicate the frequency with which they employed a number of pre-selected strategies in order to alleviate shortages. Respondents could choose from four responses: ‘frequently’, ‘sometimes’, ‘rarely’ and ‘never’. Table 2.9 sets out their responses to this question. Table 2.9 Strategies used by heads of mathematics departments to
alleviate staff shortages
Frequency
Frequently Sometimes Rarely Never No response
Strategies to alleviate staff shortages
% % % % % Use teachers of other subjects 25 40 20 12 3
Use non-maths-specialist supply 23 36 17 20 4
Use maths-specialist supply 20 39 20 17 4 Increase maths teachers’ timetables 11 32 23 32 3
Increase maths class sizes 11 22 19 44 4 Use student teachers to teach maths 6 17 14 58 5
Use support staff to teach maths 4 11 15 66 5
Increase NQTs’ timetables 2 9 14 70 5 Reduce no. of timetabled lessons 2 5 6 83 4
Base: 773 Due to rounding, percentages may not sum to 100 Source: NFER surveys of heads of mathematics departments, 2005. Overall, heads of departments reported that strategies most frequently employed in order to alleviate staff shortages included using teachers of other subjects (two-thirds responded that this strategy was used ‘frequently’ or ‘sometimes’); using supply teachers (more than three-fifths); increasing the teaching timetable of other teachers within the maths department (two-fifths); and increasing class sizes (one-third). Less

56 Deployment in mathematics
frequently used strategies included using support staff to take classes (15 per cent); increasing NQTs’ timetables (11 per cent) and reducing the timetabled number of mathematics lessons for pupils (7 per cent). Respondents were also given the opportunity to report any ‘other’ strategies that they had employed in order to alleviate staff shortages. The range of strategies reported here by the heads of 39 mathematics departments included using non-qualified teachers in seven cases, exploiting links with Initial Teacher Training institutions (five cases), recruiting overseas teachers, rotating staff, reducing the number of courses offered by the department, team teaching and using members of the senior management team to teach mathematics.

Part One 57
Case study Strategies used in case-study mathematics departments to alleviate staff shortages
‘Growing your own teachers’ Two 11–16 case-study departments had encouraged their teaching assistants to become teachers of mathematics. With support from the head of department and the rest of the teaching staff, these teachers took low ability classes to begin with, and were continuing to study for QTS whilst teaching. Recruiting ASTs One 11–16 school, faced with shortages in the mathematics department, recruited mathematics teachers with the view to training them as ASTs.
‘It was a way to attract members of staff that are of good calibre and obviously they [the school] didn’t have to pay because it’s supplemented through the DfES’ (AST mathematics, 11–16 school). Achieving specialist status ‘Where we’ve tried for Government initiatives or opportunities towards maths and science, it’s with that [alleviating staff shortages] in mind – these are the very hardest teachers to find and to keep. So we applied to become a specialist school for science and mathematics, which would mean that most of the new resources that are bought could go into science and mathematics. We put up a new building to house the maths department and the reason was obvious – that people would want good facilities, and there was a good chance that we would be able to teach the subject well and create some stability in the staffing and it seems to have done just that’ (headteacher, 11–18 school). Prioritising high ability groups ‘When we had long-term illness with a member of staff, where s/he had high ability groups, and the members of staff in the department lost their free periods to cover for other classes or were taken from their class to teach those groups. You can argue for and against it, but as a consequence, our SAT results were at a reasonably good level given the difficult situation and it was probably the best we could do in those circumstances (mathematics teacher, 11–16 school). Raise the profile of the department One 11–18 school has become involved with the lead inspector at their LEA. Through working on the key stage 3 numeracy strategy and getting involved with summer schools, the department has raised its profile within the LEA and is seen as an dynamic place to work, particularly within its links with Initial Teacher Training institutions. Pre-emptive strikes ‘I start as early as December every year. I try to second-guess the market. I second-guess what the teachers will turn out to do. Sometimes I get it slightly wrong. I’d rather err on the side of having too many, rather than too few teachers. And so last year, I had one too many mathematicians in the end and we’ve had a totally stable department this year, with nobody leaving’ (headteacher, 11–18 school). Using Senior Management Team (SMT) to cover classes ‘We’ve had to have the SMT taking some of their time out to get people in front of a class’ (head of department, 11–16 school).
58 Deployment in mathematics
2.5 Concluding comments The previous chapter showed that there was inequity in mathematics staffing between schools, in that the least qualified teachers were most often found in the lowest attaining schools, those serving areas of socio-economic deprivation and those with an 11-16 age range. This chapter has documented how this was reflected in teaching time. For example, compared with 11-18 schools, in 11-16 schools smaller proportions of the maths time at key stages 3 and 4 was taught by teachers with a degree in the subject. In addition to inequity between schools, imbalance was also evident within schools: for example, in terms of the deployment of teachers to ability groupings. Teachers with no post-16 qualifications in mathematics were most frequently deployed to teach low ability groups throughout key stages 3 and 4. In contrast, those with a maths degree were more likely to be allocated to AS/A2-level and high ability groups at Year 9 and GCSE. As was stated in Chapter 1, such findings prompt questions as to how a more even distribution of staffing can be achieved in order to ensure that all pupils, regardless of their attainment level and the school they attend, have a more equal chance of receiving specialist teaching. This seems especially important when, as the Introduction documented, concerns have been expressed about the adverse effect of shortages of specialist teachers in mathematics on pupil performance.

Part One 59
3 The contribution of support staff in mathematics departments
Key findings
• The vast majority of the heads of mathematics surveyed indicated that their department received in-class support from support staff (four per cent of mathematics departments did not receive any in-class support). However, whilst in-class support might have been available to the department overall, it was not always available to every class: one in four maths teachers reported receiving no in-class support.
• Those in receipt of in-class support rated their level of satisfaction with both the amount and quality of support received. Around two-fifths of departmental heads and teachers of mathematics were broadly satisfied with the amount received. Their ratings of the quality of in-class support were higher with just over half of maths heads and nearer three-fifths of maths teachers registering satisfaction.
• Compared with in-class support, fewer maths departments and teachers were in receipt of administrative assistance, and those who did receive such support recorded less satisfaction with the amount available.
• The majority (69 per cent) of departmental heads did not have any support staff attached solely to their department. These maths-dedicated support staff were rarely perceived to be specialists in the subject in terms of their background or training.
• Analysis revealed that where departments had dedicated support staff, both maths teachers and departmental heads were significantly more satisfied with the amount and quality of in-class support and administrative support they received.
• There was also an association between satisfaction and the presence of maths-dedicated support staff who were regarded as specialists in the subject itself, either through background or training. The heads of those department where such support staff worked were significantly more satisfied with the quality of in-class support they received.
60 Deployment in mathematics
3.1 Introduction This section looks at the contribution of support staff working in mathematics departments (e.g. teaching assistants, learning support assistants, departmental assistants). The discussion draws on survey data from heads of mathematics departments and teachers of mathematics. The main themes of this chapter are outlined below: Section 3.2 Numbers of support staff Section 3.3 Tasks undertaken by support staff Section 3.4 Satisfaction with support staff Section 3.5 Developing the contribution of support staff Section 3.6 Concluding comments 3.2 Numbers of support staff Almost all the heads of mathematics surveyed indicated that their department received some in-class support from support staff (just four per cent of these departments did not receive any such support) and the majority of departments also received administrative support. In most cases, these support staff were not based in the maths department. As Table 3.1 shows, 69 per cent of departmental heads recorded that they did not have any support staff attached solely to their department. Where departments did have support staff working exclusively in their department, these maths-dedicated support staff were rarely perceived to be specialists in the subject in terms of their background or training. Just one-third of the departments with maths-dedicated support staff – 10 per cent of the sample overall – had support staff that were perceived to be specialists in maths as a discipline.

Part One 61
Table 3.1 Number of mathematics departments with support staff working only in mathematics
Number of
mathematics departments
Percentage of mathematics departments Support staff working only in mathematics
N % No support staff attached only to mathematics 534 69 1 member of support staff attached only to mathematics 177 23 2 members of support staff attached only to mathematics 43 6 3 or more members of support staff attached only to mathematics
10 1
No response 9 1 TOTAL 773 100 Due to rounding, percentages may not sum to 100 Source: NFER survey of heads of mathematics departments, 2005.
3.3 Tasks undertaken by support staff This section moves on to look at the range and frequency of tasks carried out by support staff working with mathematics departments. Departmental heads were asked to rate how often (‘frequently’, ‘sometimes’, ‘rarely’ or ‘never’) support staff carried out a range of tasks in their department. Table 3.2 details their responses. Table 3.2 Head of departments’ ratings of the amount of support
mathematics departments received from support staff
Frequently Sometimes Rarely Never No responseType of support
% % % % % Supporting the learning of an individual in class
55 34 9 3 <1
Supporting the learning of a small group in class
28 41 22 8 1
Preparing resources 19 27 27 26 1 Administrative tasks 18 23 21 37 1 Providing behaviour management support in class
8 33 35 23 1
Managing the class whilst the teacher works with individuals
1 7 29 62 1
Marking 1 5 14 78 1 Base: 773 Due to rounding, percentages may not sum to 100 Source: NFER survey of heads of mathematics departments, 2005.
The tasks most frequently carried out by support staff were those related to providing in-class support, including supporting the learning of an individual (89 per cent recording frequently or sometimes) as well as small groups (69 per cent recording frequently or sometimes). The frequency of administrative tasks (including the preparation of resources) undertaken by support staff varied. Along with marking,
62 Deployment in mathematics
managing the class whilst the teacher worked with individuals was a task unlikely to be carried out by support staff. In total, 59 respondents (8 per cent) indicated that support staff carried out other tasks in addition to those listed. Of those who provided details, the most frequently cited tasks included taking groups outside the class (8 respondents) and preparing displays of pupils’ work (7 respondents). Other tasks (those receiving five responses or less) included: taking whole classes; cover supervision and team teaching. 3.4 Satisfaction with support staff This section considers both departmental heads and mathematics teachers’ satisfaction with the assistance received from support staff. In the questionnaire, both heads of department and teachers were firstly asked if they received in-class and administrative support. Heads of maths were asked to respond considering their department overall while teachers were invited to answer based on their own individual experience. We considered departmental heads’ responses to this in section 3.2 but they are referenced again here in order to show the difference between their experience and that of teachers. The vast majority of the heads of maths indicated that their department received in-class support from support staff: just four per cent of departments received no such support. However, whilst in-class support might have been available to the department overall, it was not always available to every class. Among the mathematics teachers in the sample, nearly one-quarter reported receiving no in-class support. Compared with in-class support, fewer maths departments and maths teachers were in receipt of administrative assistance: 16 per cent of the heads of maths indicated that their department did not receive any administrative support from support staff, with 24 per cent of maths teachers registering receiving no support of this type. Those respondents who were in receipt of support from support assistants were asked to rate their satisfaction on a 5-point scale from 1 = very dissatisfied to 5 = very satisfied. Views on the amount and quality of in-class and administrative support were both probed, and the results are presented in Tables 3.3 and 3.4.

Part One 63
Table 3.3 Heads’ of department satisfaction ratings of the assistance their department receive from support staff
Ratings of satisfaction on a scale of 1-5
% of respondents
Support
N 1 Very
dissatisfied
2 3
4 5 Very
satisfied
Amount of in-class support 7 21 36 26 10
Quality of in-class support
745 4 13 32 36 15
Amount of administrative support 22 28 22 17 10
Quality of administrative support
652 16 18 23 23 19
Due to rounding, percentages may not sum to 100 Source: NFER survey of heads of mathematics departments, 2005. Table 3.4 Mathematics teachers’ satisfaction ratings of the assistance they
receive from support staff
Ratings of satisfaction on a scale of 1-5 % of respondents
Support
N 1 Very
dissatisfied
2 3
4 5 Very
satisfied
Amount of in-class support 6 19 33 28 13
Quality of in-class support
2,513 4 11 25 37 24
Amount of administrative support 14 26 30 19 11
Quality of administrative support
2,454 9 16 28 29 18
Due to rounding, percentages may not sum to 100 Source: NFER survey of mathematics teachers, 2005.
In terms of satisfaction, around two-fifths of departmental heads and maths teachers in receipt of in-class support were broadly satisfied with the amount received (giving a rating 4 or 5 on the 5-point scale). Their ratings of the quality of in-class support were higher, with just over half of mathematics heads and nearer three-fifths of teachers giving ratings of 4 or 5 out of 5. Compared with in-class support, ratings for the amount of administrative support received were lower. Of those who were in receipt of such administrative assistance, less than one-third of maths heads and teachers were satisfied with the amount received. As noted earlier, less than one in three departmental heads reported having support staff that worked solely with their department. However, analysis revealed that where

64 Deployment in mathematics
departments had such maths-dedicated support, both mathematics teachers and departmental heads were significantly more satisfied with the amount and quality of in-class and administrative support they received. For example, just over two-thirds of heads of departments with maths-dedicated support staff were generally satisfied with the quality of in-class support they received, in contrast to 45 per cent of those without such dedicated support. This finding (although to a lesser extent) was mirrored by maths teachers with a difference of ten percentage points in the ratings of teachers in departments with and without maths-dedicated support (67 per cent and 57 per cent registering satisfaction respectively). There was also an association between satisfaction and the presence of maths-dedicated support staff who were regarded as specialists in the subject itself, either through background or training. The heads of those departments where such support staff worked were significantly more satisfied with the quality of in-class support they received. However, there were no significant differences in satisfaction ratings for teachers of maths in this regard. 3.5 Developing the contribution of support staff In total, 567 heads of maths (73 per cent) made suggestions as to how they would like to see the role of support staff develop in their departments. Four broad themes emerged:
• the need for support staff to be dedicated solely to the maths department or at least to be more closely involved with the department
• a greater quantity of support staff time • increased administrative assistance from support staff • higher calibre of support staff including their general skills and knowledge.
The first of these themes (the need for support staff to be dedicated solely to the maths department or at least to be more closely involved with the department) was identified by nearly one-quarter of heads of maths. In particular, 15 per cent of respondents specifically expressed a desire for maths-dedicated support staff; indeed, this was the most frequently cited area of development. This may not be surprising: as previously highlighted in Section 3.4, heads of department were significantly more satisfied with the amount and quality of support they received when they had access to support staff who worked only in their department. Enabling support staff to attend departmental meetings; greater liaison between support staff and mathematics departments and greater departmental control over the deployment of support staff were other nominations for developing contributions. The second theme related to the need for a greater quantity of support staff time (20 per cent of respondents) in learning assistance, both in and out of class. In this respect, heads of department felt that support staff’s contribution could be further developed by them taking groups and whole classes as well as greater provision of
Part One 65
individual support of specific pupil types (such as, pupils with special educational needs, English as an additional language, and gifted and talented pupils). The third theme was the need for more administrative assistance from support staff (15 per cent of respondents). This included more support in the areas of data entry, preparing resources and displays of pupils’ work. Finally, these heads of department noted the need for a higher calibre of support staff in terms of their skills and knowledge (14 per cent of respondents). With respect to increased knowledge, the following areas for development were noted: increased subject, curriculum and teaching knowledge and more specifically, increased ICT knowledge. Just over one-tenth of respondents suggested that they would like to see support staff with greater skills in the area of behaviour management.

66 Deployment in mathematics
Case study Mathematics-dedicated support staff
In one fully-staffed mathematics department, there were two members of support staff attached solely to the department with their highest qualification in maths being O-levels/GCSEs. The head of department felt that having maths-dedicated support has been ‘invaluable’ to the department. Four specific approaches were highlighted as being important with respect to the use of support staff in this department. Linked to specific departments For the last two years, support staff worked exclusively within the maths department. This was felt to have enabled those staff to develop expertise in the subject area as well as enabling them to feel part of a team.
‘They are able to develop better and they can develop a bit of expertise in the lessons in what they’re going to be called upon to do … I think it certainly helps for them to have a sense of being members of a team and to take a bit of pride in displays and things like that, in their local department’ (headteacher). Support staff roles Support staff worked mainly with lower sets, providing support for individuals and groups in class. They also provided administrative support to the department and carried out lower school marking. On one occasion a member of support staff took a lesson for an absent teacher in conjunction with a cover supervisor, which was felt to be very successful. Support staff training Support staff working in the maths department attended a variety of training courses specifically for support staff and also attended some relevant internal training for maths teachers. Both the support staff and the teachers they aided felt that it had been useful to have training focusing on latest practice for teaching e.g. methods of adding up and subtracting.
‘I think the fact that they are based in maths is really helpful, because it means that they take part in our training. When we have maths meetings they’ll stay, so it means when they are in the room, they know how the lessons work. So they’ve seen the lesson plan, they know exactly what’s going on. They are more helpful because they can see where [the lesson is] going’ (mathematics teacher).
Contracts All support staff working within the department were employed on a permanent contract and were paid for the whole year.

Part One 67
Case study Deploying support staff to raise achievement
One case-study mathematics department has deployed teaching and support staff as a means of raising achievement in ‘critical’ year groups. This 11-16 school has prioritised Year 9 and Year 11 to raise achievement amongst borderline pupils and gifted and talented pupils. Using intervention assistants This school has allocated funding from the key stage 3 national strategy to employ two intervention assistants to work with key stage 3 pupils. The mathematics department is able to control the deployment of these intervention assistants within the department as well as train them to support the mathematics department and this has had an impact on pupils’ achievement.
‘We get funding from the Secondary Strategy and we use some of the funding to employ teaching assistants to work with pupils at Year 9, and they also work with Year 7 pupils who we believe will be capable of achieving level 5, so we give extra support to pupils in Years 7, 8 and 9. We could have spent [the funding] on resources that might never get used, so at least employing a member of staff is being proactive. They can work with kids and because they are able to withdraw pupils from classes, it gives the teacher a smaller class to work with and it pushes the weaker pupils in the class and the more able pupils in those classes … This year for maths we got 62 per cent level 5s and above, last year 54 per cent and the year before that 48 per cent so over three years it’s made a 14 per cent increase for these crucial classes. They’ve [intervention assistants] really had an impact in the maths department’ (head of department).
‘We teach them [intervention assistants] techniques about how to support pupils to get a level 5. They get a weekly planning meeting with the teachers they work with so they don’t come to the lesson blind rather they get an idea what work we are covering for a week. That’s done regularly, and they develop resources that they can use with the pupils to support their learning such as card sorting activities, ICT work.’ (head of department). Deploying a learning mentor The department makes use of a learning mentor who is responsible for gifted and talented pupils in the school and works with pupils from Year 7 to Year 11. A particular focus of the work is Years 10 and 11, working with pupils who are predicted GCSE grade A and who might achieve A*. Good practice regarding the use of support staff ‘Using the lead teaching assistants for developing resources, that’s good practice, as is working with pupils after school in their learning for a maths club. They do the administration tasks for the department, which frees up teachers’ time to do more planning. Using behaviour coordinators frees up my time as head of department so I can monitor and evaluate staff by doing learning walks [observations of teachers while the behaviour coordinator takes the departmental head’s class] or deal with behavioural issues in different classes’ (head of department).
3.6 Concluding comments Analysis presented in this chapter has highlighted the value of those support staff (e.g. teaching assistants, administrative assistants) who work exclusively in the department. Whilst this occurred in only a minority of maths departments, where it was the case, it

68 Deployment in mathematics
led to increased satisfaction among departmental heads and teachers with regard to the in-class and administrative support received. Furthermore, there was an association between satisfaction and the presence of dedicated support staff who were regarded as specialists in the subject. In addition, we will see in the following chapter that being based in one department was also of benefit to the support staff themselves. Thus, there was strong evidence in favour of having a member of support staff attached solely to the mathematics department in all schools – preferably an assistant who had a background in the subject or who could be offered professional development to advance their knowledge and skills. This is discussed further in the following chapter, where current policy developments from the Training and Development Agency for Schools (TDA) and the DfES are set out.

Part One 69
4 Views of support staff working with mathematics departments
Key findings
• Of the 136 respondents, one in five (21 per cent) worked only in maths departments. Just over half of the overall sample (55 per cent) worked full-time and less than half (44 per cent) were paid for the whole year (including school holidays).
• Long term experience of support work was not greatly in evidence. Around three-quarters of respondents reported that they had spent ten years or less working in education as a support assistant at the time of the survey.
• Seventy per cent of respondents had a qualification in maths / numeracy equivalent to GCSE grade C or above. Less than half (43 per cent) held qualifications of this level or above in English.
• There were no significant differences found in the highest level of mathematics qualification between those support staff working only in maths departments and those working across the school.
• Maths-dedicated support staff were significantly more likely to support the learning of groups in class and carry out marking than those working across departments. They were also significantly more likely to carry out administrative tasks.
• These support staff were also significantly more likely to have been included in maths department professional development/training sessions than those who were deployed across the school.
70 Deployment in mathematics
4.1 Introduction This section draws on survey data from 136 support staff working with mathematics departments. The structure of this chapter is outlined below. Section 4.2 Characteristics of support staff working with mathematics
departments Section 4.3 Tasks undertaken by support staff working with mathematics
departments Section 4.4 Professional development of support staff working with
mathematics departments Section 4.5 Concluding comments Before moving on to the findings, it is necessary to establish how many of the sample of support staff worked only in the maths department and how many were deployed across the school. Chapter 3 highlighted the associations between maths-dedicated support staff and departmental heads’ and teachers’ satisfaction with the amount and quality of the assistance received. Therefore, in order to understand how their roles and experiences differed, at various points in this chapter we have analysed the data according to whether respondents were based solely in the maths department or whether they worked in this and other departments. In this sample of 136 support staff, one in five (21 per cent) worked only in the mathematics department of their schools. Given the sample size of 136, the findings in this section should be regarded as illustrative rather then representative of support staff working in or with mathematics departments nationwide. 4.2 Characteristics of support staff working with
mathematics departments This section considers the characteristics of support staff working with mathematics departments including:
• gender/age • job title • contacted hours • length of time in current role • previous careers • line management • qualifications.
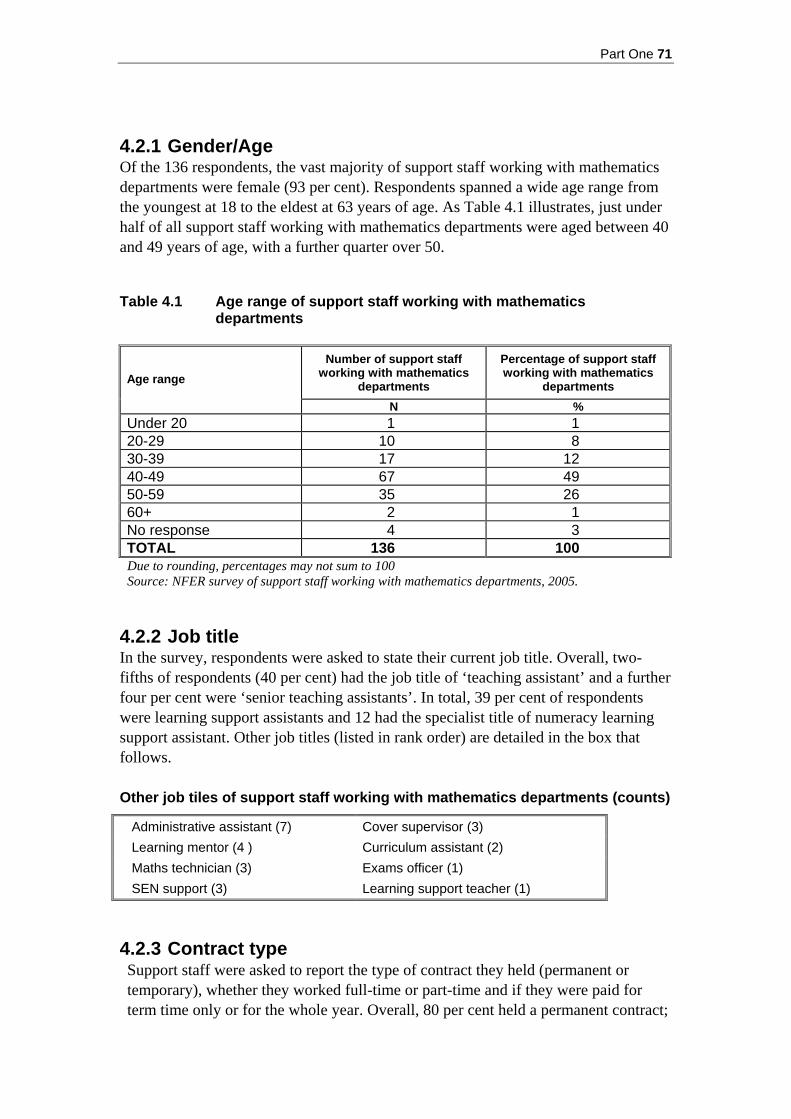
Part One 71
4.2.1 Gender/Age Of the 136 respondents, the vast majority of support staff working with mathematics departments were female (93 per cent). Respondents spanned a wide age range from the youngest at 18 to the eldest at 63 years of age. As Table 4.1 illustrates, just under half of all support staff working with mathematics departments were aged between 40 and 49 years of age, with a further quarter over 50.
Table 4.1 Age range of support staff working with mathematics
departments
Number of support staff working with mathematics
departments
Percentage of support staff working with mathematics
departments Age range
N % Under 20 1 1 20-29 10 8 30-39 17 12 40-49 67 49 50-59 35 26 60+ 2 1 No response 4 3 TOTAL 136 100 Due to rounding, percentages may not sum to 100 Source: NFER survey of support staff working with mathematics departments, 2005.
4.2.2 Job title In the survey, respondents were asked to state their current job title. Overall, two-fifths of respondents (40 per cent) had the job title of ‘teaching assistant’ and a further four per cent were ‘senior teaching assistants’. In total, 39 per cent of respondents were learning support assistants and 12 had the specialist title of numeracy learning support assistant. Other job titles (listed in rank order) are detailed in the box that follows. Other job tiles of support staff working with mathematics departments (counts)
Administrative assistant (7) Cover supervisor (3) Learning mentor (4 ) Curriculum assistant (2) Maths technician (3) Exams officer (1) SEN support (3) Learning support teacher (1)
4.2.3 Contract type Support staff were asked to report the type of contract they held (permanent or temporary), whether they worked full-time or part-time and if they were paid for term time only or for the whole year. Overall, 80 per cent held a permanent contract;

72 Deployment in mathematics
one in five (20 per cent) held temporary posts. Just over half of the sample (55 per cent) worked full-time. Less than half (44 per cent) of the support staff population were paid for the whole year (including holidays), with the remainder paid term-time only.
4.2.4 Length of time in current role In the survey, support staff were asked to report the approximate length of time they had spent:
• working in their current role at their school • supporting the mathematics department at their school • working overall as a support assistant.
As Table 4.2 shows, around three-quarters of respondents reported that they had spent ten years or less working in education as a support assistant at the time of the survey. Nearly three-fifths of support staff had been working in their current role for five years or less, with nine per cent working with mathematics departments for ten years or more. Table 4.2 Length of time support staff reported working in their current
role, supporting the mathematics department and working as a support assistant overall
Working in current
role Supporting the
mathematics department Working in education as a support assistant Length of time
N % N % N % 0–5 years 80 59 92 68 56 41 5 years 1 month –10 years 39 29 23 17 44 32 10 years 1 month –15 years 16 12 12 9 31 23 15 years 1 month or more 0 0 0 0 5 4 No response 1 <1 9 7 0 0 TOTAL 136 100 136 100 136 100 Due to rounding, percentages may not sum to 100 Source: NFER survey of support staff working with mathematics departments, 2005.
4.2.5 Previous careers The older age profile of support staff (as noted earlier) may be related to the trend in this group for having a career prior to working as a support assistant. In total, 88 per cent of respondents had had another career prior to that of their current role as support staff. Of these respondents, the largest proportions had careers in the areas of finance (24 per cent), administration (23 per cent) and pre-school (14 per cent). All previous careers respondents cited are listed below.
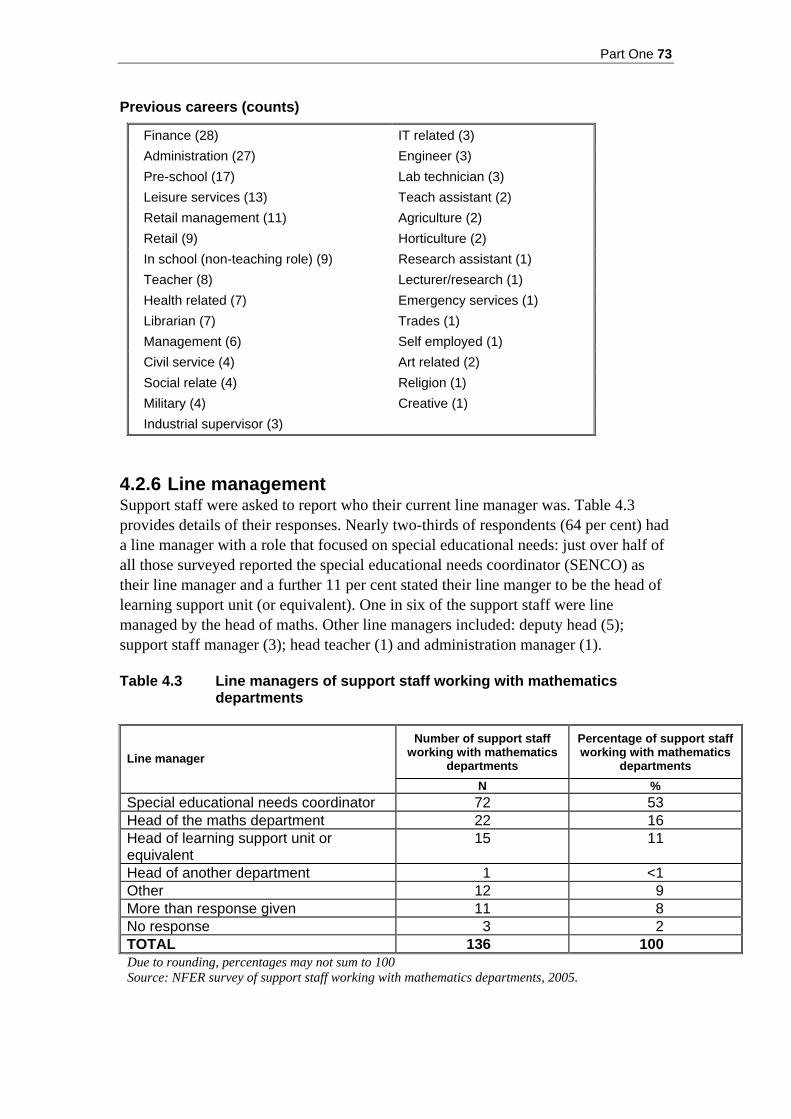
Part One 73
Previous careers (counts)
Finance (28) IT related (3) Administration (27) Engineer (3) Pre-school (17) Lab technician (3) Leisure services (13) Teach assistant (2) Retail management (11) Agriculture (2) Retail (9) Horticulture (2) In school (non-teaching role) (9) Research assistant (1) Teacher (8) Lecturer/research (1) Health related (7) Emergency services (1) Librarian (7) Trades (1) Management (6) Self employed (1) Civil service (4) Art related (2) Social relate (4) Religion (1) Military (4) Creative (1) Industrial supervisor (3)
4.2.6 Line management Support staff were asked to report who their current line manager was. Table 4.3 provides details of their responses. Nearly two-thirds of respondents (64 per cent) had a line manager with a role that focused on special educational needs: just over half of all those surveyed reported the special educational needs coordinator (SENCO) as their line manager and a further 11 per cent stated their line manger to be the head of learning support unit (or equivalent). One in six of the support staff were line managed by the head of maths. Other line managers included: deputy head (5); support staff manager (3); head teacher (1) and administration manager (1). Table 4.3 Line managers of support staff working with mathematics
departments
Number of support staff working with mathematics
departments
Percentage of support staff working with mathematics
departments Line manager
N % Special educational needs coordinator 72 53 Head of the maths department 22 16 Head of learning support unit or equivalent
15 11
Head of another department 1 <1 Other 12 9 More than response given 11 8 No response 3 2 TOTAL 136 100 Due to rounding, percentages may not sum to 100 Source: NFER survey of support staff working with mathematics departments, 2005.

74 Deployment in mathematics
4.2.7 Qualifications The support staff surveyed were asked to indicate which types of qualification they held, as well as the highest qualification they held in maths. Tables 4.4 and 4.5 provide details. Table 4.4 Qualifications held by support staff working with mathematics
departments
Number of support staff working with
maths departments
Percentage of support staff working with
maths departments Qualification type
N % No qualifications 4 3 CSE 57 42 GSCE grades D-G 10 7 GCSE grades C or above 50 37 O level grades A-C or passes 81 60 A/AS level 54 40 NVQ Level 1 6 4 NVQ Level 2 22 16 NVQ Level 3 29 21 NVQ Level 4 5 4 Degree 29 21 Higher degree or postgraduate course 6 4 Other 50 37 TOTAL 136 100 Multiple response question: support staff indicated all the qualifications that they held, therefore percentages do not sum to 100 Source: NFER survey of support staff working with mathematics departments, 2005.
Table 4.5 Highest qualification in maths held by support staff working with
mathematics departments
Qualification type Number of support staff working with
maths departments
Percentage of support staff working with
maths departments
N % No qualifications in maths 10 7 CSE 23 17 GSCE grades D-G 4 3 GCSE grades C or above 34 25 O level grades A-C or passes 38 28 A/AS level 17 13 Degree 6 4 No response 4 3 TOTAL 136 100 Due to rounding, percentages may not sum to 100. Source: NFER survey of support staff working with mathematics departments, 2005.

Part One 75
As Table 4.5 shows, 70 per cent of respondents had a qualification in maths / numeracy equivalent to GCSE grade C or above. The most frequently cited highest qualification in maths held by the support staff was O levels (grades A-C or passes), with just over one-quarter identifying this as their highest qualification in the subject. Seven per of support staff working with mathematics department had no qualifications in the maths / numeracy. Whilst there were no significant differences found in the highest level of mathematics qualification between those support staff working only in maths department and those working across departments, all of those support staff working solely in maths did have some form of qualification in the subject: i.e. none of these respondents was amongst those with no maths qualifications. As it is expected that all Higher Level Teaching Assistant (HLTA) candidates will have achieved a qualification in mathematics/numeracy and English/literacy equivalent to at least Level 2 of the National Qualifications Framework (GCSE A-C grades or equivalent), in the survey support staff were further asked to report if they had a qualification in English / literacy equivalent to GCSE grade C or above. In contrast to the 70 per cent who held a qualification in mathematics at this level, less than half (43 per cent) held the necessary level of qualification in English for HLTA status. Half of respondents reported having other qualifications relevant to their current role. The box below provides details of their other qualifications in rank order and shows the most common was a teaching assistant-related qualification. Other qualifications related to current role (counts)
NVQ teaching assistant (18) PGCE (3) BTEC teaching assistant (13) Other teaching qualification (3) Teaching assistant qualification (care and guidance)(12)
Certificate of education (2)
Dip/cert SEN (5) Other (2) CLANSA certificate (5) Health and safety qualification (1) HLTA status (4) Other teaching assistant qualification (1) IT qualification (4) Degree other (1)
4.3 Tasks undertaken by support staff working with
mathematics departments This section considers the tasks undertaken by support staff, including:
• the frequency with which support staff carry out a range of learning support tasks
• the frequency with which support staff carry out a range of administrative tasks
• any other duties and responsibilities support staff would like to have in the mathematics department.
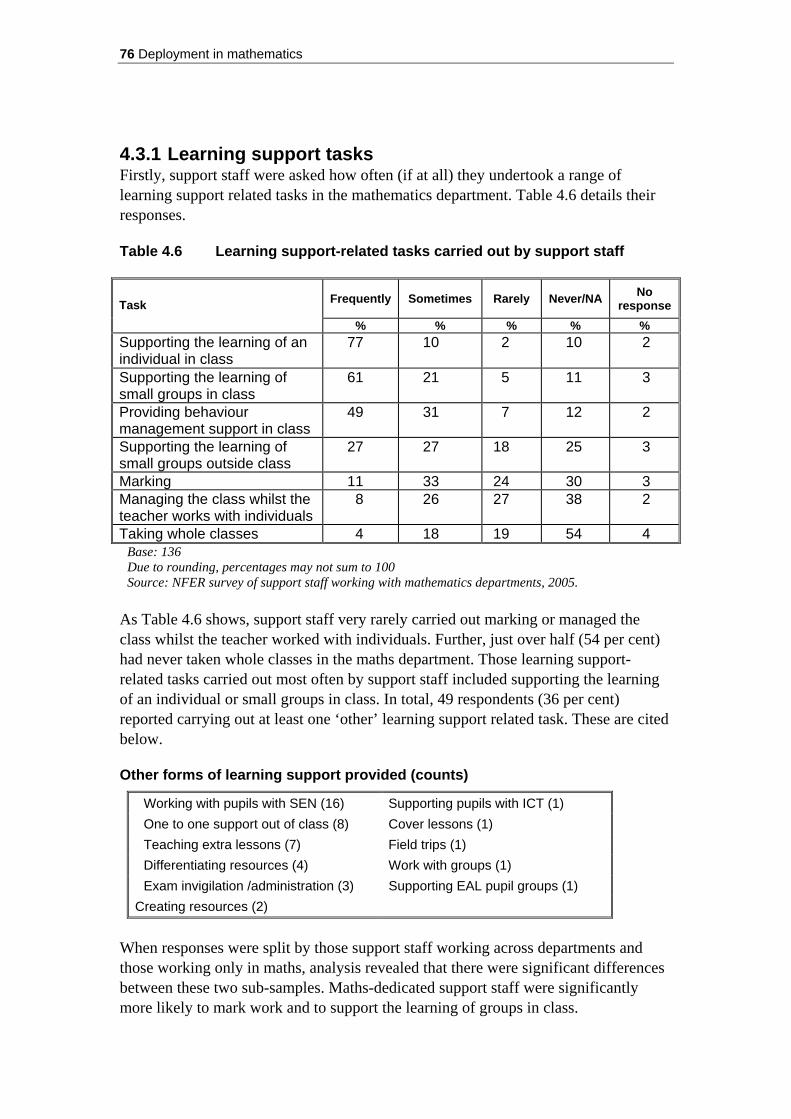
76 Deployment in mathematics
4.3.1 Learning support tasks Firstly, support staff were asked how often (if at all) they undertook a range of learning support related tasks in the mathematics department. Table 4.6 details their responses. Table 4.6 Learning support-related tasks carried out by support staff
Frequently Sometimes Rarely Never/NA No response Task
% % % % % Supporting the learning of an individual in class
77 10 2 10 2
Supporting the learning of small groups in class
61 21 5 11 3
Providing behaviour management support in class
49 31 7 12 2
Supporting the learning of small groups outside class
27 27 18 25 3
Marking 11 33 24 30 3 Managing the class whilst the teacher works with individuals
8 26 27 38 2
Taking whole classes 4 18 19 54 4 Base: 136 Due to rounding, percentages may not sum to 100 Source: NFER survey of support staff working with mathematics departments, 2005.
As Table 4.6 shows, support staff very rarely carried out marking or managed the class whilst the teacher worked with individuals. Further, just over half (54 per cent) had never taken whole classes in the maths department. Those learning support-related tasks carried out most often by support staff included supporting the learning of an individual or small groups in class. In total, 49 respondents (36 per cent) reported carrying out at least one ‘other’ learning support related task. These are cited below. Other forms of learning support provided (counts)
Working with pupils with SEN (16) Supporting pupils with ICT (1) One to one support out of class (8) Cover lessons (1) Teaching extra lessons (7) Field trips (1) Differentiating resources (4) Work with groups (1) Exam invigilation /administration (3) Supporting EAL pupil groups (1)
Creating resources (2)
When responses were split by those support staff working across departments and those working only in maths, analysis revealed that there were significant differences between these two sub-samples. Maths-dedicated support staff were significantly more likely to mark work and to support the learning of groups in class.

Part One 77
4.3.2 Administrative support Support staff were asked how often (if at all) they undertook a range of administrative tasks in the mathematics department. Table 4.7 details their responses. Table 4.7 Administrative support-related tasks carried out by support staff
Frequently Sometimes Rarely Never/NA No response Task
% % % % % Preparing resources for teachers 30 36 19 15 0 Preparing, issuing and maintaining equipment and materials
22 24 16 37 1
Prepare displays of pupils' work 21 15 25 38 2 Inputting pupil data for teachers 19 15 16 48 2 Stocktaking and ordering supplies and equipment
15 9 9 65 2
Base: 136 Due to rounding, percentages may not sum to 100 Source: NFER survey of support staff working with mathematics departments, 2005.
Table 4.7 shows support staff were least likely to carry out tasks such as stocktaking and ordering supplies/equipment (74 per cent citing ‘rarely’ or ‘never’) and most likely to prepare resources for teachers (66 per cent indicating ‘frequently’ or ‘sometimes’). When responses were split by those support staff working only in the mathematics department and those working across the school, it showed that the former were significantly more likely to carry out all of the administrative tasks listed. For example, 69 per cent of maths-dedicated support staff reported that they frequently or sometimes inputted pupil data for maths teachers in contrast to only 17 per cent of those support staff working across departments. 4.3.3 Other duties and responsibilities support staff would like
to undertake In the survey, support staff working with maths departments were asked: ‘In addition to the duties you currently undertake, please state the other duties or responsibilities you would like to carry out in the maths department.’ In total, 51 support staff gave an answer to this. Their most frequent response was the opportunity to deliver lessons (15 respondents). Others included: opportunities to carry out more one-to-one work (seven responses), more SEN work (six responses), planning of lessons (five responses), marking and creating resources (four responses each). This would suggest a desire amongst some support staff working with the mathematics department to carry out more duties to directly support teaching and learning. However, around one in 12 reported that they did not want to undertake any other additional duties or responsibilities in the maths department

78 Deployment in mathematics
4.4 Professional development of support staff working with mathematics departments
This section looks at the professional development opportunities previously and currently being undertaken by support staff working in the mathematics department including:
• arrangements for performance reviews/appraisals • qualifications being currently undertaken • inclusion in professional development that takes place within the maths
department for teachers • participation in professional development that takes place within the schools
overall for teachers • training sessions specifically on maths • areas in which support staff would find it useful to receive some professional
development to help them in their role in the maths department.
4.4.1 Arrangements for performance reviews/appraisals In the survey, support staff were asked if they received a performance review or appraisal and if they had the opportunity to discuss their training and development needs. In total, 71 per cent of support staff received an annual review or appraisal and 83 per cent indicated that they were able to discuss training or development needs. The members of staff with whom respondents most frequently discussed such needs included: the SENCO (54 respondents), line manager (26 respondents) and head of department (23 respondents). 4.4.2 Qualifications being currently undertaken Support staff were asked if they were currently undertaking, planning to undertake, already held or had no plans to undertake any of the following: teaching assistant qualifications; HLTA status; teaching qualification and other qualifications. Table 4.8 Support staff’s plans to undertake further qualifications
Currently undertaking
Planning to
Already hold
No plans
No ResponseQualifications
% % % % % Teaching assistant qualifications
6 10 29 40 16
Higher level teaching assistant (HLTA) status
5 22 4 52 17
Teaching qualification 2 11 5 60 23 Other qualification 10 15 1 40 33 Base:136 Due to rounding, percentages may not sum to 100 Source: NFER survey of support staff working with mathematics departments, 2005.

Part One 79
As Table 4.8 shows, the largest proportions of support staff who responded had no plans to undertake any other qualifications. Just under one-quarter were planning to work towards HLTA status. In total, 33 support staff cited ‘other’ types of qualification that they were currently undertaking, planning to undertake or already held. These are listed in rank order in the box. Interestingly, perhaps, only eight respondents were seeking to gain a qualification in maths. Other qualifications sought by support staff (counts)
Degree unspecified (6) Further/high degree (1) Teaching assistant related qualifications (5) Learning support qualification (1) ICT related qualifications (5) Pastoral related qualification (1) GCSE maths (3) A-level maths (1) Degree maths (3) GCSE science (1) Teaching qualification (3) Other maths qualification (1) Other qualification (2)
4.4.3 Professional development opportunities Support staff were asked to rate how often (‘always’, ‘sometimes’, ‘rarely’ or ‘never’) they were included in training sessions that took place within the mathematics department for teachers, and also to indicate their participation in professional development/training sessions that took place at whole-school level. Table 4.9 details the responses. Table 4.9 Support staff participating in mathematics department and
whole-school professional development
Always Sometimes Rarely Never Type of professional development/training sessions % % % % Maths department professional development/training sessions
23 24 17 36
Whole-school professional development/ training sessions
50 36 7 8
Base: maths department: 130; whole school: 134 Due to rounding, percentages may not sum to 100 Source: NFER survey of support staff working with mathematics departments, 2005.
Table 4.9 shows that the vast majority (86 per cent) of support staff had been included ‘sometimes’ or ‘always’ in the whole-school professional development/training sessions that took place for teachers. A lower proportion, two-thirds, reported being included ‘sometimes’ or ‘always’ in professional development/training sessions held in the maths department. Further analysis revealed that those support staff working only in mathematics departments were significantly more likely to have been included in maths department professional development/training sessions than those support staff working across departments. For example, 79 per cent of the maths-dedicated support staff were included ‘always’ or ‘sometimes’ in maths

80 Deployment in mathematics
department professional development/training sessions in contrast to only 36 per cent of support staff who worked in the maths department and others. Further, support staff were asked to report if they had received any professional development/training sessions specifically on maths. Just over half (55 per cent), reported that they had. The most common focus of this training was the maths curriculum and subject knowledge. Additional analysis revealed that there were no significant differences in the likelihood of participating in maths-specific training between those support staff working only with mathematics department and those working across the school. Support staff were also asked if there were any specific areas in which they would find it useful to receive some professional development / training to help them in their role in the mathematics department. Just under half of respondents (48 per cent) answered in the affirmative. Further details on the specific areas for development / training are listed in rank order in the box. Areas for development / training that support staff would like (counts)
Training on SEN (12) Behaviour management (6) Teaching skills (12) Qualifications (3) Subject knowledge (11) Communication skills (1) ICT Skills (10) Equipment handling (1) More training generally (9) Assessment (1) Curriculum knowledge (8)
4.5 Concluding comments The previous chapter of this report highlighted the value of maths-dedicated support staff to the departmental head and teachers. The evidence presented here has identified possible reasons for this. For example, compared with those working across the school, support staff based only in the mathematics department were significantly more likely to support the learning of groups in class, to carry out marking and to perform administrative tasks. Analysis also showed that, in addition to the departmental benefits, being attached solely to the maths department was advantageous for support staff themselves, in terms of their access to professional development opportunities (and their overall job satisfaction as Chapter 5 will show). This evidence lends support to the TDA’s pilot to develop the specialist HLTA role in mathematics and science in secondary schools. In addition, the findings back up the DfES’s undertaking to recruit, train and support mathematics-specialist HLTAs to enable every secondary school in England to recruit at least one by 2007/8. This study does, however, suggest an area of potential challenge here. Whilst admittedly a small sample, three-fifths of the support staff currently working with maths departments and surveyed for this research did not possess sufficient qualifications to be eligible for HLTA status. Notwithstanding, there was interest in this in the maths support staff

Part One 81
sample, with almost one-quarter registering an intention to work towards attaining this status.

82 Deployment in mathematics
5 Professional satisfaction of mathematics teachers, heads of department and support staff
Key findings
• Most respondents emerged as either neutral or somewhat positive with regard to their working life, but a significant minority of about one fifth of teachers and one quarter of heads of department were dissatisfied. Patterns of responses were very similar between the maths teachers and heads of departments with teachers responding marginally more positively than heads of department.
• Despite giving lower satisfaction ratings, heads of department were significantly more likely than teachers to believe that they will still be working in teaching in five years’ time.
• The amount of work required appears to be a considerable source of dissatisfaction for teachers, and particularly for heads of department. High levels of dissatisfaction with pupil behaviour were also seen amongst both groups.
• Teachers’ level of maths qualification was associated with satisfaction with their teaching timetable. Those without a maths degree (and particularly those without any post-A-level maths qualification) reported less satisfaction with their timetable.
• Departmental factors associated with professional satisfaction for teachers and heads of department were:
• shortages of maths specialist teaching staff. More shortages were associated with lower satisfaction
• the presence of maths-dedicated support staff in the department. This type of support was associated with greater satisfaction
• heads of department prioritising the professional development needs of staff when deploying staff to cover the timetable. Prioritising professional development was associated with higher levels of satisfaction amongst heads of department.
• When multiple regression analysis was carried out to see what school- department- and individual-level factors were independent predictors of satisfaction (not due to intercorrelations between these and other background variables) significant predictors of overall satisfaction amongst teachers were:
• school attainment level (higher attainment was associated with more satisfaction)
• time teaching maths (longer teaching maths was associated with lower satisfaction)
• age (greater age was associated with lower satisfaction) • holding an overseas or other unusual post-A-level qualification
(associated with lower satisfaction) • shortages of maths-specialist teaching staff (more shortages were
associated with lower satisfaction).

Part One 83
Similarly, amongst heads of department significant independent predictors of satisfaction were:
• school attainment level (higher attainment was associated with more satisfaction)
• time in teaching (longer time in teaching was associated with lower satisfaction)
• shortages of maths-specialist teaching staff (more shortages were associated with lower satisfaction)
• maths dedicated support staff (having dedicated maths support staff was associated with greater satisfaction)
• deployment of staff for teacher professional development (prioritising professional development when deploying staff to cover the timetable was associated with greater satisfaction).
• Just over one-third of heads of maths felt they had been able to meet the professional development needs and interests of staff in their department. On the whole, ratings were clustered around the centre of the response scale; suggesting that departments where staff needs are fully met are unusual, as are departments unable to meet staff needs at all. The most frequently cited focus of professional development was national strategies.
• Levels of satisfaction amongst support staff were very high. Their greatest areas of dissatisfaction were with pay, professional development and career progression, whilst they were very happy with their working hours and conditions. Support staff working exclusively with maths departments were more satisfied overall than those working with several departments.

84 Deployment in mathematics
5.1 Introduction This chapter examines levels of professional satisfaction, intention to remain in teaching and professional development amongst maths teachers, heads of department and support staff working with maths departments. Individual- and school-level factors which are associated with professional satisfaction are also addressed, including the effects of different approaches to staff deployment. A failure to retain a proportion of teachers within the profession has been identified as a significant factor contributing to teacher shortages (Smithers and Robinson, 2004). Similarly, enhancing the working experience of maths teachers through investment in their support, professional development and remuneration, is a key aspect of government strategy to both a recruit and retain teachers of mathematics (DfES, 2004a). Identifying the most significant areas of dissatisfaction amongst the staff of mathematics departments, together with factors which contribute to these, may have the potential to assist with teacher retention strategies at a local and national level. The structure of this chapter is as follows: Section 5.2 Professional satisfaction and intention to remain in teaching
amongst teachers and heads of departments Section 5.3 Factors associated with satisfaction and likelihood of staying in
teaching among teachers and heads of department Section 5.4 Meeting the professional development needs of teachers Section 5.5 Professional satisfaction amongst support staff working in
mathematics departments Section 5.6 Concluding comments 5.2 Professional satisfaction and intention to remain
in teaching amongst mathematics teachers and heads of department
Teachers and heads of department were asked to indicate their level of satisfaction with a number of aspects of their working life on a scale ranging from 1 (very dissatisfied) to 5 (very satisfied). They were also asked to give an overall rating of their professional satisfaction on a similar scale, and to indicate how likely they were to be continuing working in teaching in five years’ time, on a scale from 1(very unlikely) to 5 (very likely). 5.2.1 Overall professional satisfaction The responses of teachers and heads of department to the item regarding overall satisfaction are given in Table 5.1.
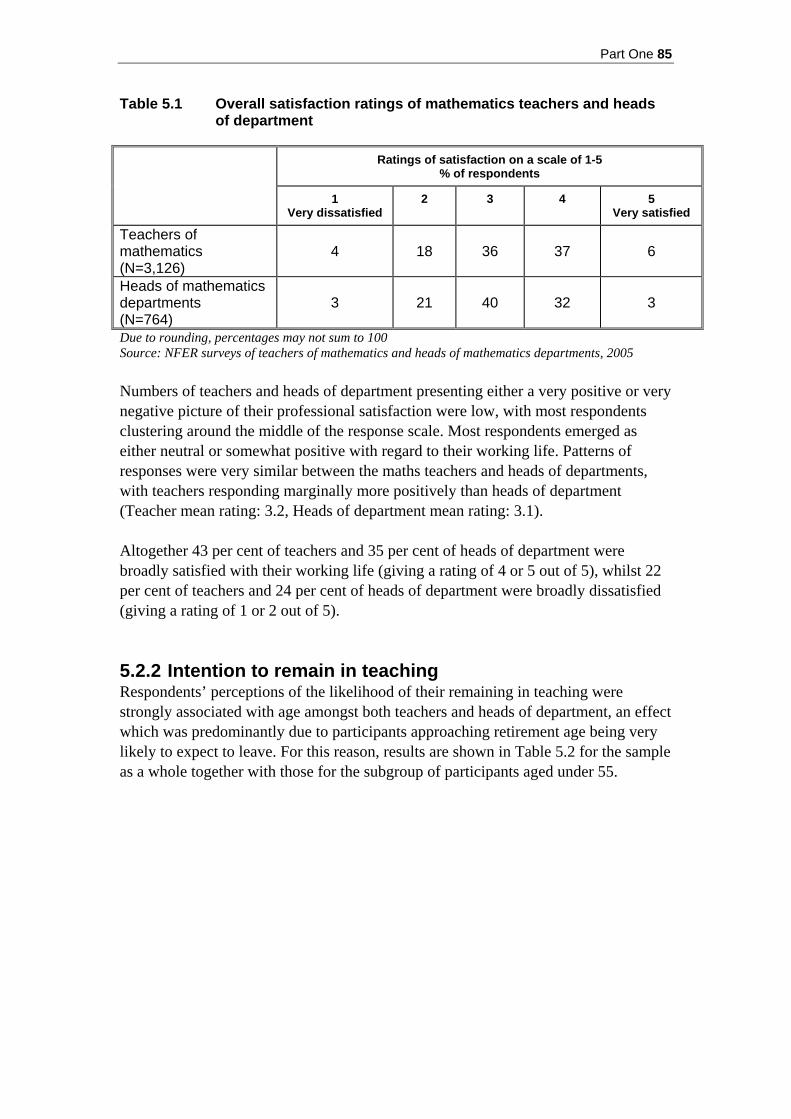
Part One 85
Table 5.1 Overall satisfaction ratings of mathematics teachers and heads of department
Ratings of satisfaction on a scale of 1-5
% of respondents
1 Very dissatisfied
2 3 4 5 Very satisfied
Teachers of mathematics (N=3,126)
4 18 36 37 6
Heads of mathematics departments (N=764)
3 21 40 32 3
Due to rounding, percentages may not sum to 100 Source: NFER surveys of teachers of mathematics and heads of mathematics departments, 2005 Numbers of teachers and heads of department presenting either a very positive or very negative picture of their professional satisfaction were low, with most respondents clustering around the middle of the response scale. Most respondents emerged as either neutral or somewhat positive with regard to their working life. Patterns of responses were very similar between the maths teachers and heads of departments, with teachers responding marginally more positively than heads of department (Teacher mean rating: 3.2, Heads of department mean rating: 3.1). Altogether 43 per cent of teachers and 35 per cent of heads of department were broadly satisfied with their working life (giving a rating of 4 or 5 out of 5), whilst 22 per cent of teachers and 24 per cent of heads of department were broadly dissatisfied (giving a rating of 1 or 2 out of 5). 5.2.2 Intention to remain in teaching Respondents’ perceptions of the likelihood of their remaining in teaching were strongly associated with age amongst both teachers and heads of department, an effect which was predominantly due to participants approaching retirement age being very likely to expect to leave. For this reason, results are shown in Table 5.2 for the sample as a whole together with those for the subgroup of participants aged under 55.

86 Deployment in mathematics
Table 5.2 Ratings of likelihood of working in teaching in five years’ time, amongst mathematics teachers and heads of department
Ratings of likelihood of remaining in teaching on a scale of
1-5 % of respondents
1 Very unlikely
2 3 4 5 Very likely
All respondents (N=3,197) 20 11 17 19 34 Teachers of
mathematics Aged under 55
(N=2,614) 12 11 18 21 37
All respondents (N=770) 20 7 10 20 43 Heads of
mathematics departments Aged under 55
(N=619) 10 7 11 22 50
Due to rounding, percentages may not sum to 100 Source: NFER surveys of teachers of mathematics and heads of mathematics departments, 2005 Although the majority of both teachers and heads of department aged under 55 felt that they were likely to remain in teaching for the next five years at least (rating 4 or 5 out of 5), a large minority gave lower ratings (41 per cent of teachers and 28 per cent of heads of department). Heads of department were significantly more likely to be strongly committed to their teaching career than teachers, perhaps because their career was more established, or because it would be more difficult for them to move to a job of similar status and pay outside teaching. 5.2.3 Satisfaction with specific aspects of working life Mathematics teachers and heads of mathematics departments were asked to indicate their level of satisfaction with a number of specific aspects of their working life. These were:
• their teaching timetable • managing their workload • the hours they worked • the amount of non-contact time they received • pupil behaviour and attitudes • professional development opportunities available to them • opportunities for career progression • freedom to teach subjects in the way they chose • their pay • the level of resources allocated to the maths department • the support they received from their head of department (only asked of those
in the teacher sample) • the contribution of teachers within the maths department (only asked of those
in the head of department sample)

Part One 87
• the support they received from the school senior management team (only asked of those in the head of department sample).
The percentage of teachers and heads of department giving each response to these survey items are shown in Table 5.3, whilst the percentage of respondents indicating that they were satisfied with each aspect of their work (giving a rating of 4 or 5 out of 5) is illustrated in Figure 5.1.
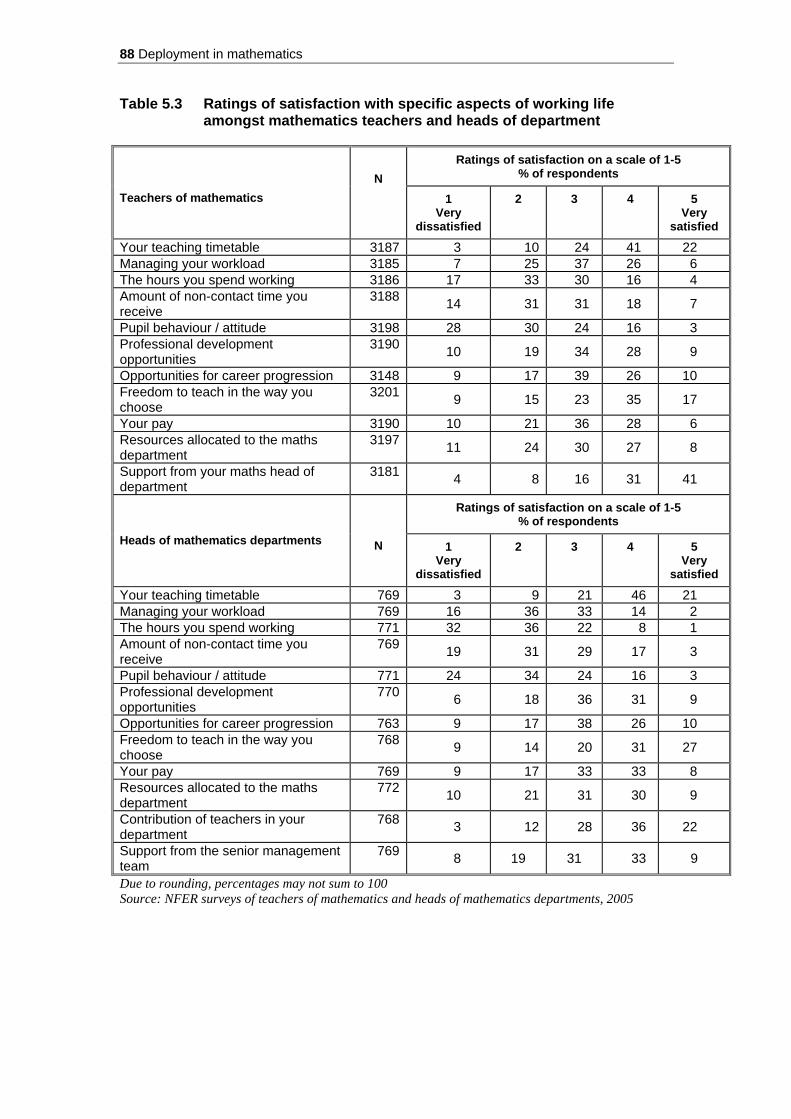
88 Deployment in mathematics
Table 5.3 Ratings of satisfaction with specific aspects of working life amongst mathematics teachers and heads of department
Ratings of satisfaction on a scale of 1-5
% of respondents Teachers of mathematics
N
1 Very
dissatisfied
2 3
4 5 Very
satisfied
Your teaching timetable 3187 3 10 24 41 22 Managing your workload 3185 7 25 37 26 6 The hours you spend working 3186 17 33 30 16 4 Amount of non-contact time you receive
3188 14 31 31 18 7
Pupil behaviour / attitude 3198 28 30 24 16 3 Professional development opportunities
3190 10 19 34 28 9
Opportunities for career progression 3148 9 17 39 26 10 Freedom to teach in the way you choose
3201 9 15 23 35 17
Your pay 3190 10 21 36 28 6 Resources allocated to the maths department
3197 11 24 30 27 8
Support from your maths head of department
3181 4 8 16 31 41
Ratings of satisfaction on a scale of 1-5 % of respondents
Heads of mathematics departments
N 1 Very
dissatisfied
2
3
4
5 Very
satisfied
Your teaching timetable 769 3 9 21 46 21 Managing your workload 769 16 36 33 14 2 The hours you spend working 771 32 36 22 8 1 Amount of non-contact time you receive
769 19 31 29 17 3
Pupil behaviour / attitude 771 24 34 24 16 3 Professional development opportunities
770 6 18 36 31 9
Opportunities for career progression 763 9 17 38 26 10 Freedom to teach in the way you choose
768 9 14 20 31 27
Your pay 769 9 17 33 33 8 Resources allocated to the maths department
772 10 21 31 30 9
Contribution of teachers in your department
768 3 12 28 36 22
Support from the senior management team
769 8 19 31 33 9
Due to rounding, percentages may not sum to 100 Source: NFER surveys of teachers of mathematics and heads of mathematics departments, 2005

Part One 89
Figure 5.1 Percentage of mathematics teachers and heads of department indicating satisfaction with aspects of their working life.
0 10 20 30 40 50 60 70 80 90 100
Support from SMT (HOD only)
Teachers' contribution (HOD only)
Support from HOD (teachers only)
Departmental resources
Pay
Freedom to teach
Career progression
Professional development
Pupil behaviour
Non-contact time
Working hours
Workload
Timetable
Percentage satisfied (rating 4 or 5 out of 5)
Teachers Heads of Department

90 Deployment in mathematics
If ratings of 4 or 5 out of 5 are taken to represent satisfaction, teachers registered the highest levels of satisfaction with:
1. Support from their head of department (72 per cent give a rating of 4 or 5) 2. Their teaching timetable (63 per cent give a rating of 4 or 5) 3. Their freedom to teach in the way they choose (52 per cent give a rating of 4
or 5). Areas given the lowest ratings were:
1. Pupil behaviour (19 per cent give a rating of 4 or 5) 2. Working hours (20 per cent give a rating of 4 or 5) 3. Amount of non-contact time (25 per cent give a rating of 4 or 5).
Thus, the amount of work required of teachers appears to be generally a source of dissatisfaction, with less than one in three teachers satisfied with their workload, and less than one in four satisfied with the hours they work and the amount of non-contact time they receive, whilst factors related to departmental support and organisation are generally sources of satisfaction. The satisfaction of heads of department was similar in many respects to that of teachers. Areas of working life given the highest satisfaction ratings were:
1. Their teaching timetable (67 per cent give a rating of 4 or 5) 2. Contribution of teachers in their department (58 per cent give a rating of 4 or
5) 3. Their freedom to teach in the way they choose (58 per cent give a rating of 4
or 5). Areas given the lowest ratings were:
1. Working hours (9 per cent give a rating of 4 or 5) 2. Workload (16 per cent give a rating of 4 or 5) 3. Pupil behaviour (19 per cent give a rating of 4 or 5).
Dissatisfaction amongst heads of department with the amount of work required of them was even more pronounced than amongst the teachers; fewer than one in ten heads of department were satisfied with their working hours. They also showed high levels of dissatisfaction with pupil behaviour but were largely happy with their timetables, the contribution of staff within their department and their freedom to teach their subject in the way they chose. These findings on teacher satisfaction corroborate those of Sturman (2002) whose study of quality of working life in teachers found that work-related stress and workload were the greatest sources of dissatisfaction for many teachers, whilst most were happy with their responsibilities and levels of support they received.

Part One 91
5.2.4 Associations between satisfaction with specific areas of working life and overall satisfaction and intention to remain in teaching
The associations between each of these specific facets of satisfaction and overall satisfaction and intention to stay in teaching were examined in order to establish which factors contributed most to overall job satisfaction and commitment to stay in the profession. All individual satisfaction ratings were positively associated with global measures of satisfaction and likelihood of remaining in teaching. These associations were significant at the p<0.05 level in all cases except for associations between heads’ of department likelihood of remaining in teaching and satisfaction with the contribution of teachers in their department. Associations with the intention to leave were generally less strong than with overall satisfaction, since an intention to leave teaching might be expected to be based on a range of factors, some of which are unrelated to professional satisfaction. The strongest associations are shown in Table 5.4. Table 5.4 Associations between ratings of satisfaction with specific areas
of working life and overall professional satisfaction and intention to remain in teaching
Mathematics teachers Mathematics heads of department Overall satisfaction associated with: 1. Pupil behaviour (correlation (r)=.52) 2. Managing workload (r=.50) 3. Teaching timetable (r=.48) 4. Freedom to teach (r=.46) 5. Career progression (r=.44)
Overall satisfaction associated with: 1. Support from SMT (r=.55) 2. Managing workload (r=.51) 3. Career progression (r=.46) 4. Teaching timetable (r=0.45) 5. Professional development (r=.44)
Likelihood of remaining in teaching associated with: 1. Pupil behaviour (r=.28) 2. Managing workload (r=.24) 3. Teaching timetable (r=.24) 4. Working hours (r=.22) 5. Freedom to teach (r=.22)
Likelihood of remaining in teaching associated with: 1. Support from SMT (r=.19) 2. Managing workload (r=.17) 3. Working hours (r=.17) 4. Professional development (r=.16) 5. Teaching timetable (r=.16)
All correlations (Spearman’s rho) positive and significant at p<0.01 Source: NFER surveys of teachers of mathematics and heads of mathematics departments, 2005 In many cases, the most significant areas of satisfaction were similar for teachers and heads of department. Satisfaction with workload, with working hours and with their teaching timetable was an important factor for both groups, as was opportunities for career progression. In addition, support from the senior management team and
92 Deployment in mathematics
opportunities for professional development were very important to heads of department, whilst pupil behaviour featured prominently for teachers. Case study Measures to enhance teacher retention
One case-study school has identified improving retention as a possible means of addressing difficulties in maintaining a fully staffed mathematics department. This 11–18 school has prioritised measures to ensure teacher satisfaction, and has had only minimal loss of staff in recent years. A range of approaches have been employed: Giving staff extra responsibilities and promotions where possible ‘It is not entirely a coincidence that maths teachers just happen to have more promotion than anybody else’ (headteacher).
‘Take the Year 8 leader – that’s an unpaid appointment but it is an opportunity to develop, and a stake in the department, so even our youngest member of the department is responsible for something that they can claim as their own’ (head of department). Improving departmental facilities ‘When the opportunity came to put up a new building I decided it should house the maths department. People want good facilities and it was a good chance to teach the subject well and create some stability in the staffing’ (headteacher). Ensuring a positive departmental atmosphere and ethos ‘I think one of the reasons people stay here is because it is a very supportive department. You can come out of a lesson and say “Oh, that was just awful!” without feeling that someone is writing down “Can’t manage their class…”.’ (mathematics teacher). Providing extra professional support Professional support particularly appreciated by the staff includes:
• an extra member of support staff working only in the maths department
• use of cover supervisors to ensure staff do not lose non-contact time to cover classes for sick colleagues
• departmental banks of teaching resources accessible to all staff
• a ‘safe room’ system to ensure that teachers have access to behaviour management support at all times.
5.3 Factors associated with satisfaction and
likelihood of staying in teaching amongst teachers and heads of department
This section examines the extent to which individual -, department- and school-level factors are associated with ratings of satisfaction and likelihood of remaining in teaching amongst mathematics teachers and heads of department.

Part One 93
5.3.1 Associations between individuals’ mathematics qualifications, and professional satisfaction and likelihood of remaining in teaching
The professional satisfaction of teachers and heads of department was examined in terms of whether they held a degree in maths. Generally, associations were small. Amongst teachers, in the case of all satisfaction ratings, those respondents that had a maths degree rated their satisfaction more highly than those with no maths degree. The greatest differences between those with and without a maths degree were in satisfaction with:
• their teaching timetable (61 per cent of those without a degree and 67 per cent of those with a degree were satisfied, i.e. rating 4 or 5 out of 5)
• their likelihood of staying in teaching (50 per cent versus 55 per cent) • their freedom to teach in the way they choose (51 per cent versus 55 per cent) • their departmental resources (34 per cent versus 38 per cent).
Amongst heads of department, those holding a maths degree gave higher satisfaction ratings for:
• their teaching timetable (63 per cent of those without a degree and 70 per cent of those with a maths degree were satisfied, i.e. rating 4 or 5 out of 5)
but lower satisfaction ratings for:
• support from the senior management team (45 per cent versus 40 per cent) • overall satisfaction (37 versus 33 per cent) • professional development opportunities (41 per cent versus 38 per cent).
Satisfaction with the teaching timetable was the area of satisfaction most closely linked with qualifications in both survey groups. There was a suggestion that those teachers with no post-A-level maths qualification were particularly dissatisfied with their timetables. Fifty four per cent of the teachers with no post-A-level qualifications were satisfied with their teaching timetable, compared with 62 per cent of the teachers with a post-A-level qualification in the subject. 5.3.2 School-level and department-level factors associated
with satisfaction and likelihood of staying in teaching A number of school - and department-level factors were examined in terms of their associations with teacher satisfaction and likelihood of staying in teaching. These included:
• extent of specialist staff shortages in the maths department • the presence of support staff working only with the maths department

94 Deployment in mathematics
• heads of departments’ priorities when deploying teachers to cover the timetable.
The following sections discuss each of these three factors in turn. Associations with the extent of teacher shortages It was hypothesised that the extent to which a department was affected by specialist teacher shortages would be associated with satisfaction ratings and likelihood of remaining in teaching, such that satisfied teachers and heads of department would rate their departments less affected by shortages. This was found to be the case. Correlations were carried out between ratings of teacher shortages and ratings of satisfaction, and of all the ratings of satisfaction with specific aspects of working life described in section 5.2.3, only satisfaction with pay, amongst heads of department, was not associated with perceptions of staff shortages in their departments. In each case, respondents in departments with more staff shortages were less positive about their working life. The five areas of working life satisfaction most closely linked to staff shortages for both teachers and heads of department can be seen in Table 5.5. All associations are negative indicating that increasing shortages are associated with decreasing satisfaction. Table 5.5 Associations between shortages of maths-specialist teaching
staff and satisfaction with areas of working life amongst mathematics teachers and heads of department
Top 5 associations in rank order
Mathematics teachers Mathematics heads of department
Staff shortages linked to lower satisfaction with: 1. Pupil behaviour (correlation(r)=-.19) 2. Workload (r=-.16) 3. Teaching timetable (r=-.16) 4. Resources allocated to the maths department (r=-.16) 5. Working hours (r=-.16)
Staff shortages linked to lower satisfaction with: 1. The contribution of teachers in the department (r=-.30) 2. Working hours (r=-.23) 3. Pupil behaviour (r=-.21) 4. Workload (r=-.19) 5. Non-contact time (r=-.19)
All correlations (Spearman’s rho) negative and significant at p<0.01 Source: NFER surveys of teachers of mathematics and heads of mathematics departments, 2005 These findings suggest that staff shortages may have a detrimental effect on many aspects of working life for both teachers and heads of department, with particular impact on workload-related concerns. Satisfaction amongst heads of department seems to be particularly strongly linked to staff shortages. For example, of those respondents who said that their departments had not been affected by staff shortages at all, 45 per cent of teachers and 30 per cent of heads of department were satisfied with their workload, whilst amongst those who reported the highest levels of

Part One 95
shortages, these numbers reduced to 25 per cent of teachers and nine per cent of heads of department (see Figure 5.2).
Figure 5.2 Levels of satisfaction with workload amongst respondents reporting varying degrees of staff shortage in their departments
0
10
20
30
40
50
60
Not at all A little Quite a lot A great deal
Department affected by shortages
% S
atis
fied
Teachers
Heads of department
There was also a significant association between specialist staff shortages and likelihood of remaining in teaching amongst teachers, although not amongst heads of department. Of those teachers who said that they were unlikely to remain in teaching (rating 4 or 5 out of 5) 30 per cent said that their department had been affected ‘a great deal’ by staff shortages, whilst of those who said they were likely to remain (rating 1 or 2 out of 5), 23 per cent had been similarly affected. Associations with the use of support staff working only with the maths department A factor that was found to have a positive effect on some aspects of satisfaction amongst heads of departments was the presence of maths-dedicated support staff in the department. Those departmental heads who had support staff working only within maths were more satisfied overall, more satisfied with the support they received from their senior management team and more satisfied with the amount of non-contact time they received. For example, 21 per cent of heads of departments with dedicated support staff were dissatisfied with the support they received from their senior management team, compared with 30 per cent of those with no dedicated support staff. It appears that the provision of departmental support staff may be a significant component of perceived SMT support, since it is a type of provision highly valued by heads of department (see also Chapter 3).
96 Deployment in mathematics
Associations with head of department’s deployment priorities The deployment priorities of their head of department when allocating teachers to classes were examined in terms of their associations with teachers’ and heads of departments’ satisfaction with their working life. Heads of department were asked to indicate which three factors from the following list they prioritised when allocating teachers to classes:
• staff subject knowledge • staff preference • staff professional development • staff experience of teaching year groups/courses • staff expertise in engaging pupils • need to be fair to all staff (spread of year/ability groups).
Overall, professional satisfaction amongst heads of department was significantly associated with two of the deployment priorities. It was positively associated with the consideration of staff professional development needs, such that 29 per cent of satisfied heads of department prioritised staff development in deployment, compared with nine per cent of dissatisfied heads of department. Overall satisfaction was negatively associated with prioritising teacher subject knowledge, with 63 per cent of satisfied heads of department and 73 per cent of dissatisfied heads of department prioritising teacher subject knowledge. 5.3.3 Factors independently associated with overall
satisfaction: multiple regression analysis In order to establish whether associations between professional satisfaction and teacher subject specialism, staff shortages and maths-dedicated support staff are independent of other aspects of variation between schools and departments, a multiple regression was carried out which examined the overall satisfaction ratings of teachers and heads of department, whilst controlling for the effects of the other variables in the model. Two similar analyses were run, one for teachers and another for heads of departments. Variables were entered into the multiple regression in four stages:
1. Backgound information about the school a. Geographical location (Government Office Regions) b. School size (small/medium/large) c. School age range (age range up to 16/ up to18) d. Attainment (GCSE points band, 2002).

Part One 97
2. Individual respondent characteristics a. Gender of respondent b. Age c. Time teaching maths (maths teachers)/ total time in teaching (Heads of
department) d. Respondent’s level of maths qualification.
3. Maths department characteristics
a. Departmental shortages of maths-specialist teaching staff* b. Maths-dedicated support staff (yes or no)*.
4. Approach to deployment
a. Head of department’s deployment priorities*. * These questions were only included in the head of department survey. In the teacher multiple regression, the response give by each teacher’s head of department was used. Results of maths teacher multiple regression Of the school background variables, only attainment was significantly associated with overall teacher satisfaction, such that teachers in schools with a higher GCSE points score were more satisfied than those in schools with a lower points score. When individual teacher characteristics were added into the model, respondents’ age and length of time teaching maths were both significant negative predictors of satisfaction, with older teachers and those who had taught maths for a longer period of time recording lower satisfaction ratings. With regard to teacher qualifications, only those in the ‘other post-A-level’ qualification in maths group differed significantly from those with no post-A-level qualification. This group was mainly composed of teachers who had studied and / or trained overseas and they recorded the lowest levels of satisfaction of any group. When departmental factors were added into the model, teacher shortages emerged as a significant negative predictor of satisfaction, such that teachers in departments experiencing shortages were less satisfied. No deployment approaches were significant predictors in the final stage of the model. Hence, factors that were significant, independent predictors of overall satisfaction for maths teachers in the final stage of the model were:
• school attainment level (positive) • time teaching maths (negative) • age (negative) • other post-A-level qualification in maths (negative) • shortages of maths-specialist teaching staff (negative).
Results of maths head of department multiple regression In the head of department multiple regression, only school attainment was a significant predictor of satisfaction in the first stage of the analysis, with heads of department in school with a higher GCSE points score reporting higher levels of
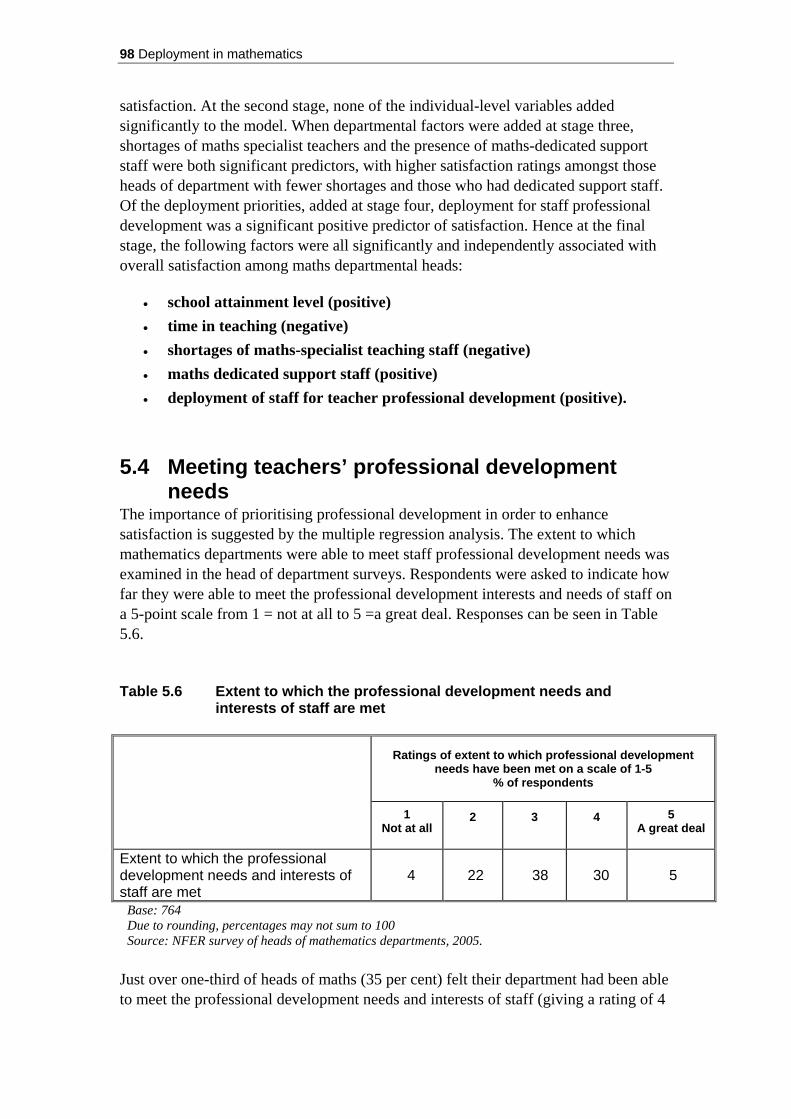
98 Deployment in mathematics
satisfaction. At the second stage, none of the individual-level variables added significantly to the model. When departmental factors were added at stage three, shortages of maths specialist teachers and the presence of maths-dedicated support staff were both significant predictors, with higher satisfaction ratings amongst those heads of department with fewer shortages and those who had dedicated support staff. Of the deployment priorities, added at stage four, deployment for staff professional development was a significant positive predictor of satisfaction. Hence at the final stage, the following factors were all significantly and independently associated with overall satisfaction among maths departmental heads:
• school attainment level (positive) • time in teaching (negative) • shortages of maths-specialist teaching staff (negative) • maths dedicated support staff (positive) • deployment of staff for teacher professional development (positive).
5.4 Meeting teachers’ professional development needs
The importance of prioritising professional development in order to enhance satisfaction is suggested by the multiple regression analysis. The extent to which mathematics departments were able to meet staff professional development needs was examined in the head of department surveys. Respondents were asked to indicate how far they were able to meet the professional development interests and needs of staff on a 5-point scale from 1 = not at all to 5 =a great deal. Responses can be seen in Table 5.6. Table 5.6 Extent to which the professional development needs and
interests of staff are met
Ratings of extent to which professional development needs have been met on a scale of 1-5
% of respondents
1 Not at all
2 3 4 5 A great deal
Extent to which the professional development needs and interests of staff are met
4 22 38 30 5
Base: 764 Due to rounding, percentages may not sum to 100 Source: NFER survey of heads of mathematics departments, 2005.
Just over one-third of heads of maths (35 per cent) felt their department had been able to meet the professional development needs and interests of staff (giving a rating of 4

Part One 99
or 5). On the whole, ratings were largely clustered around the centre of the response scale: few heads of department gave responses at the extremes of the scale, suggesting that departments where staff needs are fully met are unusual, as are departments unable to meet staff needs at all. Heads of department were also asked to indicate what had been the focus of teachers’ professional development in their department in the past year. Five possible foci were listed:
• National Strategies • examination board / syllabus requirements • maths subject knowledge and skills • information and communications technology • whole-school priorities.
There was also an opportunity for heads of department to add ‘other’ professional development foci to the list. Responses can be seen in Table 5.7. Table 5.7 Focus of professional development experienced by teachers of
mathematics
Frequently
Sometimes
Rarely
Not this school year
No response Focus of professional
development % % % % %
National strategies 46 40 8 6 1 Whole-school priorities 35 43 15 6 1 Examination board / syllabus requirements 19 52 19 9 1
Information Communications Technology 16 49 23 11 1
Furthering maths subject knowledge and skills 10 44 28 17 2
Other 3 2 1 1 94 Base: 773 Due to rounding, percentages may not sum to 100 Source: NFER survey of heads of mathematics departments, 2005.
National strategies were found to be the most frequent focus of professional development experienced by teachers of maths. In total, 86 per cent of departmental heads reported this area to be the focus of teachers professional development ‘frequently’ or ‘sometimes’. Furthering maths subject knowledge and skills was reported to be the foci of professional development least often. There were 35 responses to ‘other’. Of those who provided details, the other areas of professional development most commonly cited were behaviour management (seven responses) and assessment (five responses).

100 Deployment in mathematics
Case study Prioritising professional development
The mathematics department in one successful secondary school in the south east of England has prioritised their internal professional development and support for new and less experienced teachers. The mathematics department is fully staffed and the head of department feels that ensuring the teachers are well trained and supported is an essential part of the department’s retention strategy. The school is a specialist maths and science college and this status brings some extra professional development funding to the maths department, but there is a recognition of the ‘opportunity costs’ of CPD spending, and optimum value is derived from money spent on CPD by ensuring that there are good internal structures for the sharing of skills and knowledge between staff. The following three specific approaches were highlighted as being important to the professional development of staff in this department. Regular internal training staff meetings There is a programme of induction training meetings for all new staff and NQTs in their first year at the school. The department also regularly holds training meetings for all staff at which individuals who have attended external courses will cascade relevant skills and knowledge to other members of the department. Deployment for professional development: assigning staff to classes When assigning teachers to particular classes, the head of this department prioritises the professional development needs of teachers. ‘An important thing is where staff have particularly requested something which will be developmental for them. One colleague has asked this year to teach higher tier GCSE because they’ve never taught that before’ (head of department). Deployment for professional support: paired teaching at A-level Staff members teaching A-Level classes for the first time are always ‘paired’ with a more experienced A-level teacher teaching a parallel class.
‘For example, next year we have an NQT who will be teaching A-level statistics for the first time paired with one of the two co-deputy heads of mathematics who’s a statistics teacher. Pairing allows joint planning, discussion and sharing of resources. It’s important, especially when you’re doing A-level that teachers don’t feel ashamed to ask if they don’t understand a mathematical point, especially when they’re just teaching it for the first time (head of department).
5.5 Professional satisfaction amongst support staff
working with mathematics departments The professional satisfaction of support staff working with maths departments was also examined. In a question similar to that on the teacher surveys, support staff were asked to rate their satisfaction with several aspects of their working life, together with their overall level of satisfaction, on a 5-point scale on which a rating of 1 corresponded to ‘very dissatisfied and a rating of 5 to ‘very satisfied’. They were also asked how likely they were to still be working as a support assistant in education in five years’ time.

Part One 101
5.5.1 Support staff: overall satisfaction Overall levels of satisfaction amongst support staff working in maths departments are shown in Table 5.8. On the whole, satisfaction ratings amongst support staff were very high, with over 70 per cent rating their satisfaction at 4 or 5 out of 5, and less than one per cent reporting that they were very dissatisfied. Table 5.8 Ratings of overall satisfaction with working life amongst support
staff working with mathematics departments
Ratings of satisfaction on a scale of 1-5 % of respondents
1
Very dissatisfied 2 3
4 5
Very satisfied
Support staff working in maths departments
1 4 24 46 24
Base: 135 Due to rounding, percentages may not sum to 100 Source: NFER survey of support staff working in mathematics departments, 2005 5.5.2 Intention to remain working as a support assistant in
education As was the case with teachers, the subgroup of respondents aged under 55 was analysed separately. Table 5.9 below shows the ratings of the likelihood of staying in teaching for all support staff, and for those aged under 55. Table 5.9 Ratings of likelihood of working as a support assistant in
education in five years’ time
Likelihood of continuing to work as support assistant on a scale of 1-5
% of respondents
1 Very unlikely
2 3
4 5 Very likely
All respondents (N=136) 19 13 22 17 29 Support staff
working in maths departments
Aged under 55 (N=96) 18 13 22 18 30
Due to rounding, percentages may not sum to 100 Source: NFER survey of support staff working in mathematics departments, 2005. Around one-third of support staff aged under 55 years felt that they were unlikely to still be doing similar work in five years’ time, whilst almost half felt it was likely that they would continue working as a support assistant in education.

102 Deployment in mathematics
5.5.3 Satisfaction with specific aspects of working life Specific aspects of working life for support staff that were examined in the survey were:
• the tasks and duties undertaken • managing general workload • professional development and training opportunities • opportunities for career progression • pay • hours of work • support received from line manager.
Responses to these items can be seen in Table 5.10 and Figure 5.3. Table 5.10 Support staff satisfaction with specific areas of working life
Ratings of satisfaction on a scale of 1-5 % of respondents
N 1
Very dissatisfied
2 3 4 5 Very
satisfied
The tasks and duties undertaken 136 2 1 16 49 31
Managing general workload 136 1 5 13 50 32 Professional development and training opportunities 133 8 14 40 27 11
Opportunities for career progression 134 17 16 36 20 10
Pay 136 32 28 24 10 6 Hours of work 135 4 3 13 42 37 Support received from line manager 136 7 12 15 27 40
Source: NFER survey of support staff working in mathematics departments 2005
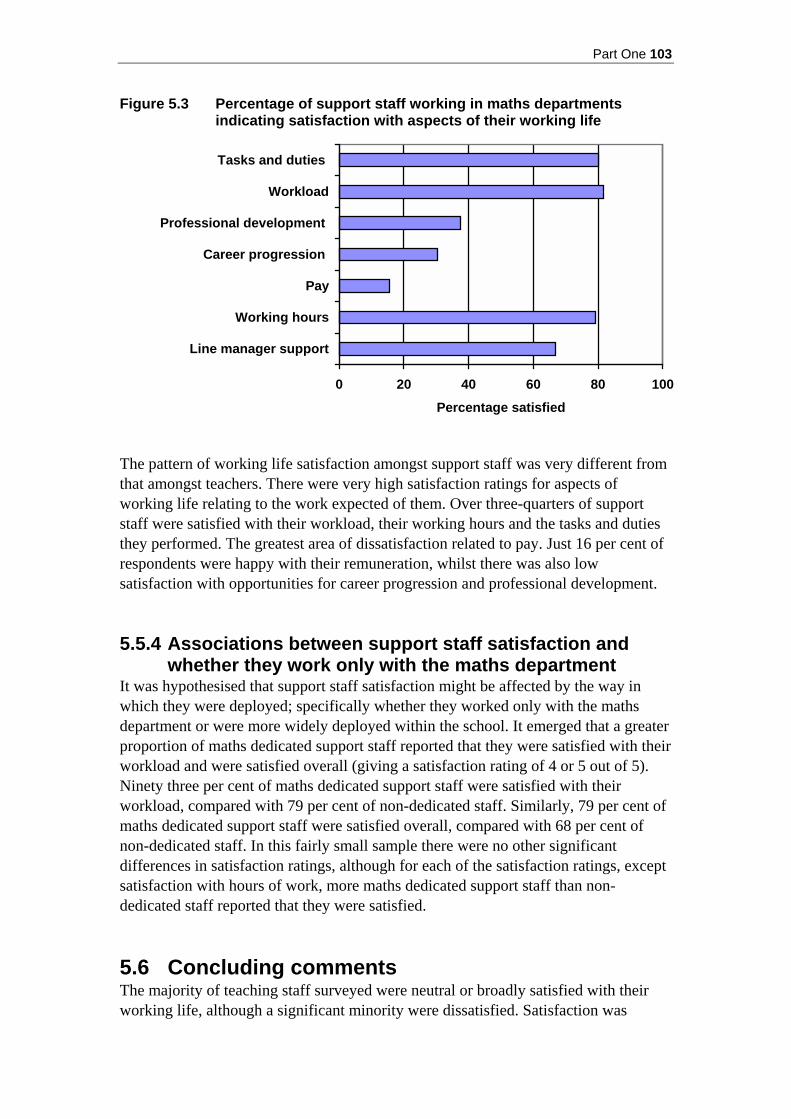
Part One 103
Figure 5.3 Percentage of support staff working in maths departments indicating satisfaction with aspects of their working life
0 20 40 60 80 100
Line manager support
Working hours
Pay
Career progression
Professional development
Workload
Tasks and duties
Percentage satisfied
The pattern of working life satisfaction amongst support staff was very different from that amongst teachers. There were very high satisfaction ratings for aspects of working life relating to the work expected of them. Over three-quarters of support staff were satisfied with their workload, their working hours and the tasks and duties they performed. The greatest area of dissatisfaction related to pay. Just 16 per cent of respondents were happy with their remuneration, whilst there was also low satisfaction with opportunities for career progression and professional development. 5.5.4 Associations between support staff satisfaction and
whether they work only with the maths department It was hypothesised that support staff satisfaction might be affected by the way in which they were deployed; specifically whether they worked only with the maths department or were more widely deployed within the school. It emerged that a greater proportion of maths dedicated support staff reported that they were satisfied with their workload and were satisfied overall (giving a satisfaction rating of 4 or 5 out of 5). Ninety three per cent of maths dedicated support staff were satisfied with their workload, compared with 79 per cent of non-dedicated staff. Similarly, 79 per cent of maths dedicated support staff were satisfied overall, compared with 68 per cent of non-dedicated staff. In this fairly small sample there were no other significant differences in satisfaction ratings, although for each of the satisfaction ratings, except satisfaction with hours of work, more maths dedicated support staff than non-dedicated staff reported that they were satisfied. 5.6 Concluding comments The majority of teaching staff surveyed were neutral or broadly satisfied with their working life, although a significant minority were dissatisfied. Satisfaction was

104 Deployment in mathematics
slightly lower amongst heads of department than amongst teachers. Areas of particular dissatisfaction were related to workload (amount of non-contact time, working hours and general workload) and pupil behaviour. These sources of dissatisfaction are issues that all teachers will contend with. However, research by Smithers and Robinson (2004, 2005b) has suggested that teachers of maths leave the profession in larger numbers than would be expected. Therefore, further emphasis on the areas that cause them particular dissatisfaction may be needed. At the time that this research was being conducted the area of workload was beginning to receive additional attention in the form of the national introduction of planning, preparation and assessment (PPA) time. None the less, this research may suggest that PPA time might, by itself, be insufficient to solve the problem of retaining maths teachers and departmental heads without further amelioration of specialist-staff shortages. Departmental shortage of maths-specialist staff emerged as a strong and significant independent predictor of overall professional dissatisfaction in maths departments amongst both teachers and heads of departments. Thus, this implies a pressing need to address ways of increasing specialist teaching capacity.
Part Two 105
PART TWO Deployment in science

106 Deployment in science
6 Who is teaching science
Key findings Analysis was undertaken that considered all teachers who taught science – both those based in the department and those who were principally teachers of other subjects. According to departmental heads’ responses, this is the breakdown in terms of science-specialism for all those teaching science in one in five schools in England. Members of science departments Teachers with a specialism in biology 44 per cent Teachers with a specialism in chemistry 25 per cent Teachers with a specialism in physics 19 per cent Teachers with a specialism in other science 5 per cent Teachers with a non-science-related specialism 2 per cent
Members of other departments Teachers who mainly teach other subjects teaching science 6 per cent Thus, according to departmental heads, 8 per cent of the teachers who were teaching science in the sample schools were either non-specialists or were principally teachers of other subjects. Science teachers and departmental heads • Analysis of survey responses from the entire sample of 2,756 science teachers and
754 departmental heads revealed that: • almost three-quarters of science teachers and almost four-fifths of heads of
science departments held a degree in either biology, chemistry, physics, general science or another science
• more than a quarter of science teachers and departmental heads held a degree in biology
• one in six (16 per cent) teachers and one in five (20 per cent) heads of department held a degree in chemistry
• one in ten teachers (10 per cent) and one in seven departmental heads (14 per cent) held a degree in physics
• six per cent each of teachers and departmental heads held a degree in general science, and 15 per cent of teachers and 13 per cent of departmental heads held a degree in another science
• one in ten (11 per cent) teachers and heads of department (10 per cent) held B.Sc or BA with QTS or B.Ed in science
• relatively small proportions of science teachers and heads of department held a Cert Ed (4 per cent, 3 per cent) or PGCE in science (7 per cent, 5 per cent)
• teachers and departmental heads with no post-A-level qualification in science represented two per cent of the teacher and one per cent of the head of department sample.
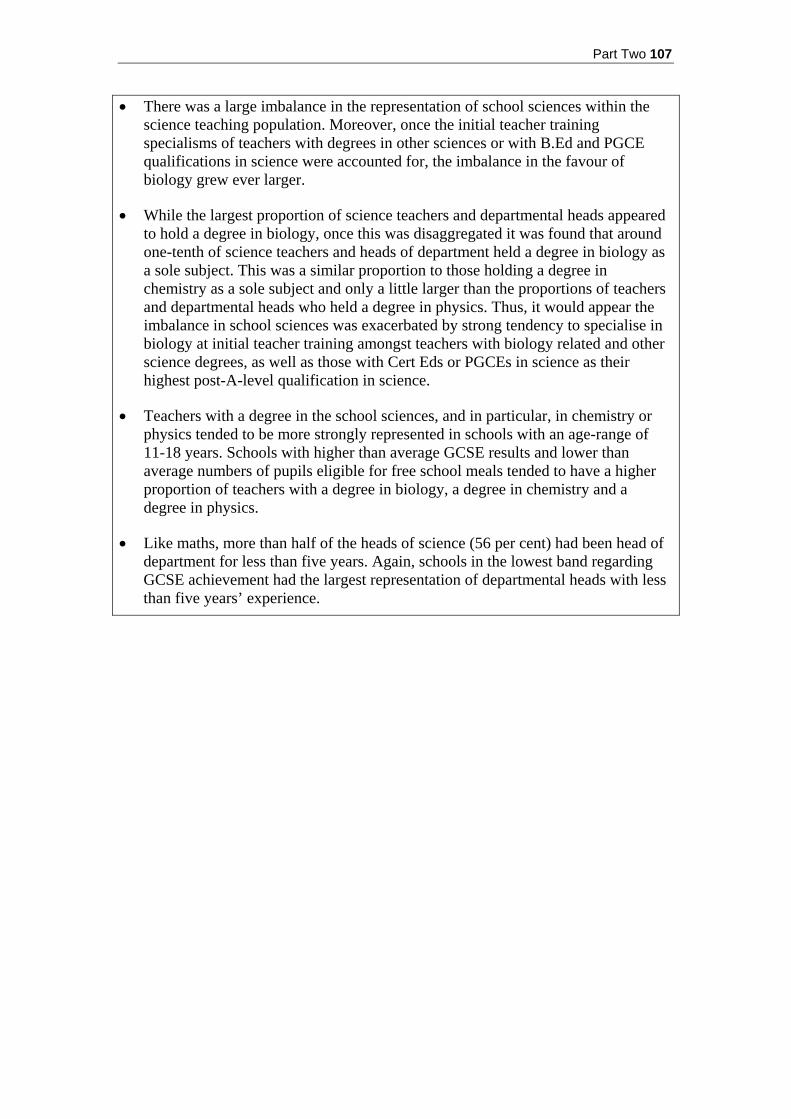
Part Two 107
• There was a large imbalance in the representation of school sciences within the science teaching population. Moreover, once the initial teacher training specialisms of teachers with degrees in other sciences or with B.Ed and PGCE qualifications in science were accounted for, the imbalance in the favour of biology grew ever larger.
• While the largest proportion of science teachers and departmental heads appeared to hold a degree in biology, once this was disaggregated it was found that around one-tenth of science teachers and heads of department held a degree in biology as a sole subject. This was a similar proportion to those holding a degree in chemistry as a sole subject and only a little larger than the proportions of teachers and departmental heads who held a degree in physics. Thus, it would appear the imbalance in school sciences was exacerbated by strong tendency to specialise in biology at initial teacher training amongst teachers with biology related and other science degrees, as well as those with Cert Eds or PGCEs in science as their highest post-A-level qualification in science.
• Teachers with a degree in the school sciences, and in particular, in chemistry or physics tended to be more strongly represented in schools with an age-range of 11-18 years. Schools with higher than average GCSE results and lower than average numbers of pupils eligible for free school meals tended to have a higher proportion of teachers with a degree in biology, a degree in chemistry and a degree in physics.
• Like maths, more than half of the heads of science (56 per cent) had been head of department for less than five years. Again, schools in the lowest band regarding GCSE achievement had the largest representation of departmental heads with less than five years’ experience.

108 Deployment in science
6.1 Introduction This chapter uses the evidence from the surveys of departmental heads and science teachers in order to consider the question: who is teaching science in secondary schools in England? Chapter 6 begins by drawing on information provided by heads of science in their questionnaires. These respondents were asked to give details of the specialisms of all the teachers who were members of the science departments. They were also asked, in addition to those in their department, whether other teachers who were principally members of other departments also taught science. Their responses provide evidence of the specialisms and experience of all the teachers who teach science in the survey sample schools. Following this, the chapter moves on to data from the survey of 2,756 science teachers and 754 departmental heads on their qualifications in science. The distribution of the samples in terms of the highest post-A-level qualification in science is presented, with some additional information on each of the qualification categories. Further detail of the characteristics of the heads of science departments and science teachers are then relayed, including: gender; age; length of time in teaching and teaching science; any previous career; any other roles in the department or school as a whole; and contract type. This purpose of this chapter is to ascertain who is teaching science. As will be shown, those teaching the subject were not always specialists in science and were not always teachers who were members of the science department. None the less, throughout this chapter, and elsewhere in the report, the terms ‘science teacher’ or ‘teacher of science’ are used to refer to any teacher who teaches the subject regardless of whether it is their subject specialism or whether it is their main teaching subject. The term ‘specialist’ is reserved for those who have university qualifications in the subject, either at degree level or above or for their ITT. Whilst much of the discussion in this chapter focuses on qualifications, it should be noted that teachers’ qualifications do not necessarily always equate with the quality of teaching. Section 6.2 Who is teaching science in one in five secondary schools?
• the composition of science departments in one in five maintained secondary schools in England
• the number of departments using teachers who principally teach other subjects to also teach science
• all teachers teaching science
Section 6.3 The qualifications of the heads of science departments and science teachers • qualification bands • the distribution of qualification bands by background variables • degree class

Part Two 109
Section 6.4 The characteristics of heads of science departments and science teachers • gender • age • length of time in teaching and teaching sciences • careers prior to teaching sciences • other roles in department/school • contract type
Section 6.5 Concluding comments 6.2 Who is teaching science in one in five secondary
schools? The analysis presented in this section is based on data supplied by heads of science regarding the teachers who were timetabled to teach science in their schools. Of the 754-strong sample of science heads of department, 630 provided complete details in their questionnaire and as a result, the findings presented in this section are based on the responses of this subsample. Therefore, whilst departmental heads from one in four secondary schools actually returned questionnaires, the evidence in this section (6.2) relates to who is teaching science in 20 per cent of all maintained secondary schools in England. The data from this sub-sample is also used in the economic analysis set out in Part 3 and the Appendix, which gives national projections of the numbers and specialisms of the teachers of science. In their questionnaire, departmental heads were asked to give details of all teachers who taught science. Thus, from this, a picture can be built of all those teaching the subject in these schools. In order to establish who teaches science, departmental heads were first asked in their questionnaire about the teachers who were members of the science department – their responses to this are relayed in section 6.2.1. Heads of department were then invited to give details of any teachers who mainly taught other subjects or were principally members of other departments but who also taught science as a timetabled lesson during the academic year 2004–2005 – section 6.2.2 sets out the findings from this inquiry. Section 6.2.3 then draws together the details of those in the science department and those brought in from other subjects in order to ascertain the specialisms and experience of all those teaching science. 6.2.1 The composition of science departments This section examines the data provided by 630 departmental heads regarding the composition of their science departments. In their questionnaire, departmental heads were asked to state the number of teachers in their department, including themselves, who taught science as a timetabled lesson. The responses revealed the following about the composition of the science departments in one in five secondary schools:

110 Deployment in science
• the numbers of teachers within departments ranged from two teachers (one department) to 24 teachers (also one department)
• the mean number of teachers in science departments was nine, one more than in mathematics departments
• overall, 8 per cent of teachers in science departments were NQTs, the same proportion as mathematics teachers
• the majority of departments (64 per cent) with NQTs had just one, although departments could have up to four or five NQTs
• in total, 3 per cent of teachers in science departments had trained overseas.
Heads of department were also asked to state the approximate size of the science departmental budget (e.g. the funds used for costs of equipment, photocopying, professional development). Budgets ranged from £1,000 to £45,000, with the median being £8,500 and varied according to the relative coverage of the department. 6.2.2 Departments that are using teachers who principally
teach other subjects to also teach science This section examines the data provided by 630 departmental heads in order to discover how many teachers were teaching science but who mainly taught other subjects. The survey asked departmental heads to state the number of teachers who mainly taught other subjects or were principally members of other departments and also taught science as a timetabled lesson in the academic year 2004–2005. They were further asked to specify the main teaching subjects of those teachers. Responses from departmental heads in the sample schools revealed that:
• just over one-third (37 per cent) of science departments used teachers from other subjects to teach science – a smaller proportion than that found for mathematics (58 per cent)
• these teachers from other subjects accounted for 6 per cent of the total number of teachers taking science classes
• in almost three-quarters (71 per cent) of these departments, one teacher from another department was deployed
• in 96 per cent of these departments, up to three teachers from other departments were also teaching science.
Departments used teachers from a range of other subjects. The most frequently cited were mathematics, PE, special educational needs and ICT (see Table 6.1).

Part Two 111
Table 6.1 Main teaching subjects of teachers from other departments used to teach science
Teachers who are principally members of other
departments who teach science Main teaching subject %
ICT 10 Psychology 2 Mathematics 30 Health and social care 4 PE 25 SEN & alternative curriculum 12 Technology 7 Geography 5 English 7 Modern Foreign Languages 3 RE 3 Other subject 19 Invalid 2 TOTAL 100 Base: 233 Multiple response question: respondents could state more than one subject, therefore percentages do not sum to 100 Source: NFER survey of heads of science departments, 2005. 6.2.3 All teachers teaching science Based on the responses from departmental heads, section 6.2.1 gave details of teachers within science departments and section 6.2.2 set out numbers of teachers who, whilst principally members of other departments, also taught science in the sample schools. In this section, we take these two groups together to acsertain the specialisms and experience of all those teaching science in 20 per cent of secondary schools in England. Departmental heads were asked to state the numbers of teachers within their department, including themselves, whose specialism (i.e. a degree in the subject or a specialism in the subject at initial teacher training) was in biology; chemistry; physics; other science; or was non-science related. Their responses to these inquiries are presented in Figure 6.1 together with the proportion of those from other departments who teach science.
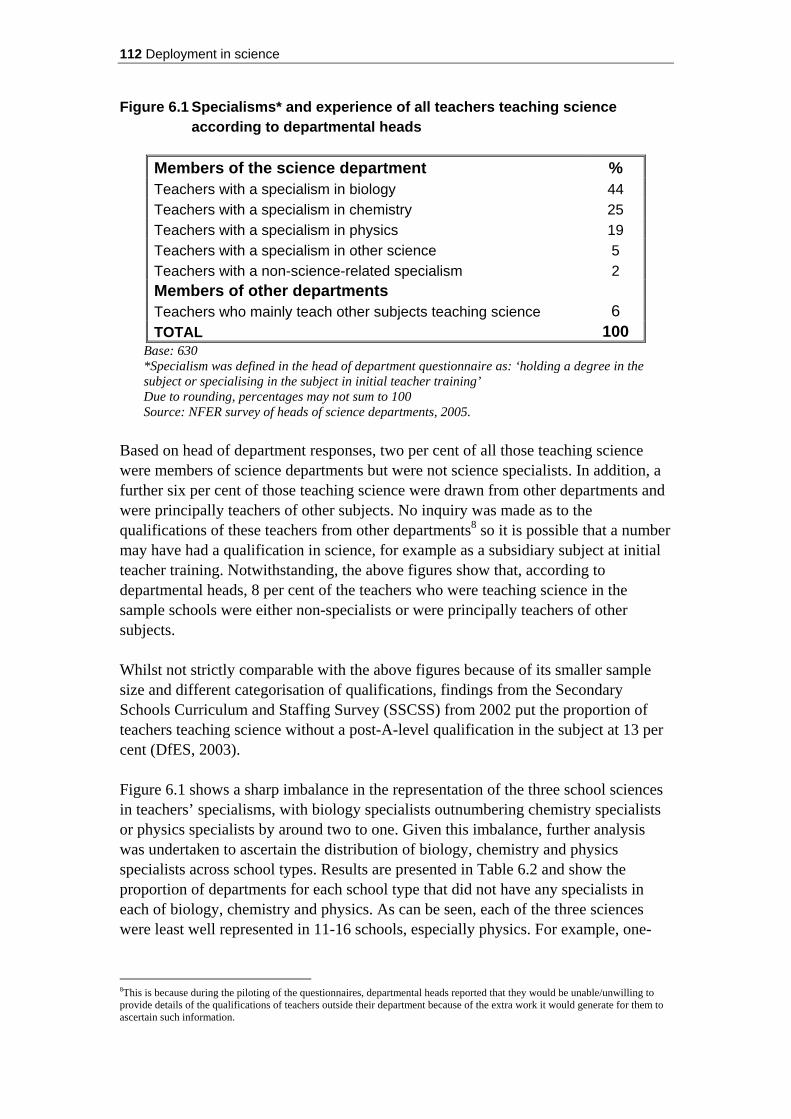
112 Deployment in science
Figure 6.1 Specialisms* and experience of all teachers teaching science according to departmental heads
Members of the science department % Teachers with a specialism in biology 44 Teachers with a specialism in chemistry 25 Teachers with a specialism in physics 19 Teachers with a specialism in other science 5 Teachers with a non-science-related specialism 2 Members of other departments Teachers who mainly teach other subjects teaching science 6 TOTAL 100
Base: 630 *Specialism was defined in the head of department questionnaire as: ‘holding a degree in the subject or specialising in the subject in initial teacher training’ Due to rounding, percentages may not sum to 100 Source: NFER survey of heads of science departments, 2005.
Based on head of department responses, two per cent of all those teaching science were members of science departments but were not science specialists. In addition, a further six per cent of those teaching science were drawn from other departments and were principally teachers of other subjects. No inquiry was made as to the qualifications of these teachers from other departments8 so it is possible that a number may have had a qualification in science, for example as a subsidiary subject at initial teacher training. Notwithstanding, the above figures show that, according to departmental heads, 8 per cent of the teachers who were teaching science in the sample schools were either non-specialists or were principally teachers of other subjects. Whilst not strictly comparable with the above figures because of its smaller sample size and different categorisation of qualifications, findings from the Secondary Schools Curriculum and Staffing Survey (SSCSS) from 2002 put the proportion of teachers teaching science without a post-A-level qualification in the subject at 13 per cent (DfES, 2003). Figure 6.1 shows a sharp imbalance in the representation of the three school sciences in teachers’ specialisms, with biology specialists outnumbering chemistry specialists or physics specialists by around two to one. Given this imbalance, further analysis was undertaken to ascertain the distribution of biology, chemistry and physics specialists across school types. Results are presented in Table 6.2 and show the proportion of departments for each school type that did not have any specialists in each of biology, chemistry and physics. As can be seen, each of the three sciences were least well represented in 11-16 schools, especially physics. For example, one-
8This is because during the piloting of the questionnaires, departmental heads reported that they would be unable/unwilling to provide details of the qualifications of teachers outside their department because of the extra work it would generate for them to ascertain such information.
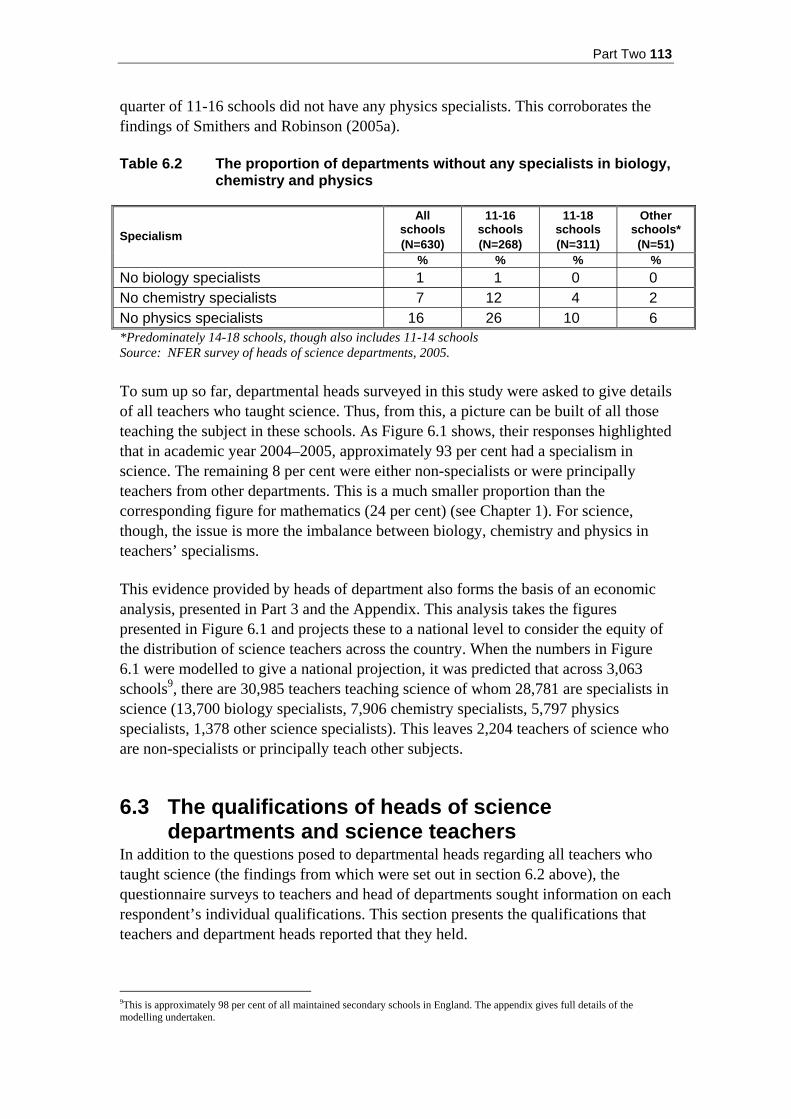
Part Two 113
quarter of 11-16 schools did not have any physics specialists. This corroborates the findings of Smithers and Robinson (2005a). Table 6.2 The proportion of departments without any specialists in biology,
chemistry and physics
All schools (N=630)
11-16 schools (N=268)
11-18 schools (N=311)
Other schools* (N=51)
Specialism
% % % % No biology specialists 1 1 0 0 No chemistry specialists 7 12 4 2 No physics specialists 16 26 10 6 *Predominately 14-18 schools, though also includes 11-14 schools Source: NFER survey of heads of science departments, 2005. To sum up so far, departmental heads surveyed in this study were asked to give details of all teachers who taught science. Thus, from this, a picture can be built of all those teaching the subject in these schools. As Figure 6.1 shows, their responses highlighted that in academic year 2004–2005, approximately 93 per cent had a specialism in science. The remaining 8 per cent were either non-specialists or were principally teachers from other departments. This is a much smaller proportion than the corresponding figure for mathematics (24 per cent) (see Chapter 1). For science, though, the issue is more the imbalance between biology, chemistry and physics in teachers’ specialisms. This evidence provided by heads of department also forms the basis of an economic analysis, presented in Part 3 and the Appendix. This analysis takes the figures presented in Figure 6.1 and projects these to a national level to consider the equity of the distribution of science teachers across the country. When the numbers in Figure 6.1 were modelled to give a national projection, it was predicted that across 3,063 schools9, there are 30,985 teachers teaching science of whom 28,781 are specialists in science (13,700 biology specialists, 7,906 chemistry specialists, 5,797 physics specialists, 1,378 other science specialists). This leaves 2,204 teachers of science who are non-specialists or principally teach other subjects. 6.3 The qualifications of heads of science
departments and science teachers In addition to the questions posed to departmental heads regarding all teachers who taught science (the findings from which were set out in section 6.2 above), the questionnaire surveys to teachers and head of departments sought information on each respondent’s individual qualifications. This section presents the qualifications that teachers and department heads reported that they held.
9This is approximately 98 per cent of all maintained secondary schools in England. The appendix gives full details of the modelling undertaken.

114 Deployment in science
When interpreting the findings in this section, it is important to bear in mind that the data from the teacher survey refers only to those who returned a teacher questionnaire rather than to all science teachers. This is in contrast to the figures from heads of department in section 6.2, which do relate to all those teaching science in the sample schools. The teacher survey sample was, however, sizable and constituted approximately 41 per cent of all those teaching science in the sample schools (or almost 10 per cent of all science teachers in England based on the national projections above)10. This section begins by presenting the qualifications that teachers and department heads reported they held in terms of their highest post-A-level qualification in science. There were eleven qualification bands:
1. Degree or higher degree in biology
2. Degree or higher degree in chemistry
3. Degree or higher degree in physics
4. Degree or higher degree in general science
5. Degree or higher degree in other science
6. B.Sc or BA with QTS or B.Ed in science
7. Cert Ed incorporating science
8. PGCE incorporating science
9. Other post-A-level qualification in science
10. A-level science qualification
11. No post-A-16 qualification in science. The section then moves on to consider in more detail the subjects, types and the initial teacher training subjects, if applicable, of the two samples. Then, this section examines the distribution of qualification types by background variables including Government Office Region, age range, GCSE attainment, level of free school meals and level of Special Educational Needs in the school. Finally, the degree class attained by those in the teacher and departmental head samples are relayed. As was pointed out in Part 1 in relation to the discussion on mathematics, while this chapter analyses qualifications in terms of the highest post-A-level qualification in science, and these categories are then used elsewhere in Part 2 as a tool in further analyses, it should be stated that in no way should these categories be taken to represent a judgement as to the requisite or desired qualifications to enable a teacher to be qualified to teach science. Instead, they provide a useful and workable definition of qualifications in science that make no comment on whether the teacher who holds them is competent to teach science. 10The responses from departmental heads in this section are based on the full sample of 754. Thus, they are drawn from 25 per cent of all maintained secondary schools.

Part Two 115
Table 6.3 shows the breakdown of the samples in terms of their qualifications in science. The teachers and heads of department are counted once against their highest qualification in science. Unlike mathematics, which had seven categories, science breaks down into 11 categories as degrees in biology, physics and chemistry are accounted for, as are degrees in general science and in other sciences. If an individual holds a degree in chemistry and a PGCE in science, they are included in the figures for ‘degree in chemistry’. If an individual holds a PGCE in science but a degree in a non-science subject, they are counted against ‘PGCE incorporating science’. However, if an individual holds a first degree in biology, followed by a masters degree in biochemistry they are counted in the ‘degree in biology’ category, rather than in the ‘other science’ category11. ‘School sciences’ take priority12. Table 6.3 Highest post-A-level qualification held by science teachers and
heads of science departments
Teachers of science Heads of science departments Highest qualification in sciences
N % N % Degree in Biology 753 27 194 26 Degree in Chemistry 440 16 149 20 Degree in Physics 279 10 106 14 Degree in general science 158 6 48 6 Degree in other science 415 15 101 13 B.Sc or BA with QTS or B.Ed in science 311 11 72 10 Cert Ed incorporating science 109 4 26 3 PGCE incorporating science 184 7 36 5 Other post-A-level science qualification 49 2 5 <1 A-level science 29 1 9 1 No post-16 science qualification 27 1 0 0 No response 2 <1 8 1 TOTAL 2,756 100 754 100
Due to rounding, percentages may not sum to 100 Source: NFER surveys of teachers of science and heads of science departments, 2005.
Table 6.3 shows the following.
• In total, almost three-quarters of science teachers (74 per cent) and almost four-fifths of heads of science departments (79 per cent) in the sample held a degree in either biology, chemistry, physics, general science or another science.
• Around one-tenth of science teachers (11 per cent) and heads of science departments (10 per cent) held a B.Sc or BA with QTS or B.Ed in science, meaning that 85 per cent of science teachers and 89 per cent of heads of science departments in the sample held a degree or B.Ed in science – a considerably larger proportion than was seen for mathematics.
11For a breakdown of the sciences included in the ‘other science’ category, please see section 6.3.5. 12Where teachers/heads of department held combined/joint honours degrees in sciences (e.g. a joint degree in biology and chemistry), these are included in the general science band – see section 6.3.4.

116 Deployment in science
• The imbalance between the three school science subjects is again apparent13. More than one-quarter of the surveyed science teachers held a degree in biology (27 per cent), compared with almost one in six with degrees in chemistry (16 per cent) and one in ten who have a degree in physics (10 per cent).
• In total, two per cent of science teacher respondents and one per cent of heads of science departments did not hold a post-A-level qualification in science, a noticeably smaller proportion than in the mathematics samples. As a consequence, 98 per cent of the surveyed science teachers and 99 per cent of heads of science departments held a post-A-level qualification in science.
Overall, by far the majority of science teachers held a degree in science. While this might suggest that science teachers and heads of science are generally ‘better’ qualified than mathematics teachers, it should be noted that the situation as regards science is possibly somewhat more complex in that it encompasses three separate sciences. As was noted above, there is a considerable imbalance between the representation of specialists in each of the ‘school science’ subjects. In the teacher sample, there was more than twice the proportion of science teachers with a biology degree than teachers with a degree in physics, for example. Indeed, there were more teachers with a degree in ‘other’ science than there were teachers with a degree in physics. Similarly, there are roughly equal proportions of science teachers with a degree in chemistry and with a degree in ‘other science’. This picture belies a situation in which there is considerable inequality of representation within the three ‘school sciences’. Science teachers and heads of department holding a degree in a subject other than science but having a PGCE in science were less frequently occurring than mathematics teachers and heads of department whose highest post-A-level qualification in mathematics was a PGCE, perhaps suggesting that as a subject, science is less accessible to, or less popular with, potential teachers without a degree in science. Of the 2,756 teachers teaching science surveyed, just 2 per cent did not hold a post-A-level qualification in science. This is a considerably smaller proportion than that found for teachers of mathematics who were surveyed. The proportion of heads of department with no post-A-level qualification in science was smaller again, at 1 per cent, representing the heads of nine of the 754 science departments surveyed. As a whole, then, a larger proportion of the sample of science teachers and heads of department tended to hold a post-A-level qualification in science than the mathematics samples. This section has established that the largest proportion of science teachers and heads of department held a degree in science as their highest post-A-level qualification,
13NB. The figures in Figure 6.1 are not directly comparable with those in Table 6.3. The figures in Figure 6.1 relate to the specialisms (i.e. degree or ITT) in biology, chemistry and physics for all teachers teaching science in the sample schools. The figures in Table 6.3 relate to degrees only in biology, chemistry and physics of those teachers who returned questionnaires. None the less, the pattern is the same.

Part Two 117
although there was substantial inequity in the representation of the three school sciences within this category. The following sections move on to consider each of the science qualification bands in more depth, providing more detailed explanation of the types of qualification and subject in each category. Frequencies are presented as a proportion of the total 2,756-strong sample of science teachers or 754 heads of science departments. 6.3.1 Degree in biology This section disaggregates the ‘degree in biology’ category, represented by more than a quarter of science teachers and heads of science departments. Table 6.4 displays the degree subject for those teachers and heads of department who fell into the degree in biology category. As well as first degrees, it also shows the numbers of masters level and PhD degrees in biology and in other science subjects held by teachers and heads of department in this category. Table 6.4 Type of degree in biology held by science teachers and heads of
department whose highest post-A-level qualification in science was a degree in biology
Teachers of
science Heads of science
departments Type of degree N % N %
BA/BSc Biology 340 12 108 14 BA/BSc Biology related (e.g. botany, zoology) 278 10 58 8 BA/BSc Biology & science related 72 3 23 3 BA/BSc Biology & non-science related 28 1 1 <1 MA/MSc Biology 48 2 10 1 MA/MSc Other science subject* 27 1 11 1 DPhil/PhD Biology 40 1 2 <1 DPhil/PhD Other science subject 16 <1 3 <1 TOTAL 753 27% 263 26% *‘Other science subject’ includes medical-related sciences, biochemistry, environmental science, etc. – see section 6.3.5 Multiple response question: respondents could give more than one degree, therefore percentages may not sum to 27 and 26 Source: NFER surveys of science teachers and heads of science departments, 2005. Table 6.4 shows that:
• overall, more than one-tenth of both the science teacher (12 per cent) and head of department (14 per cent) samples held a degree in biology as a sole subject
• a slightly smaller proportion held a biology-related degree, such as zoology, genetics and microbiology
• very small proportion of both the science teacher and departmental heads samples held a masters-level or PhD degree in biology.
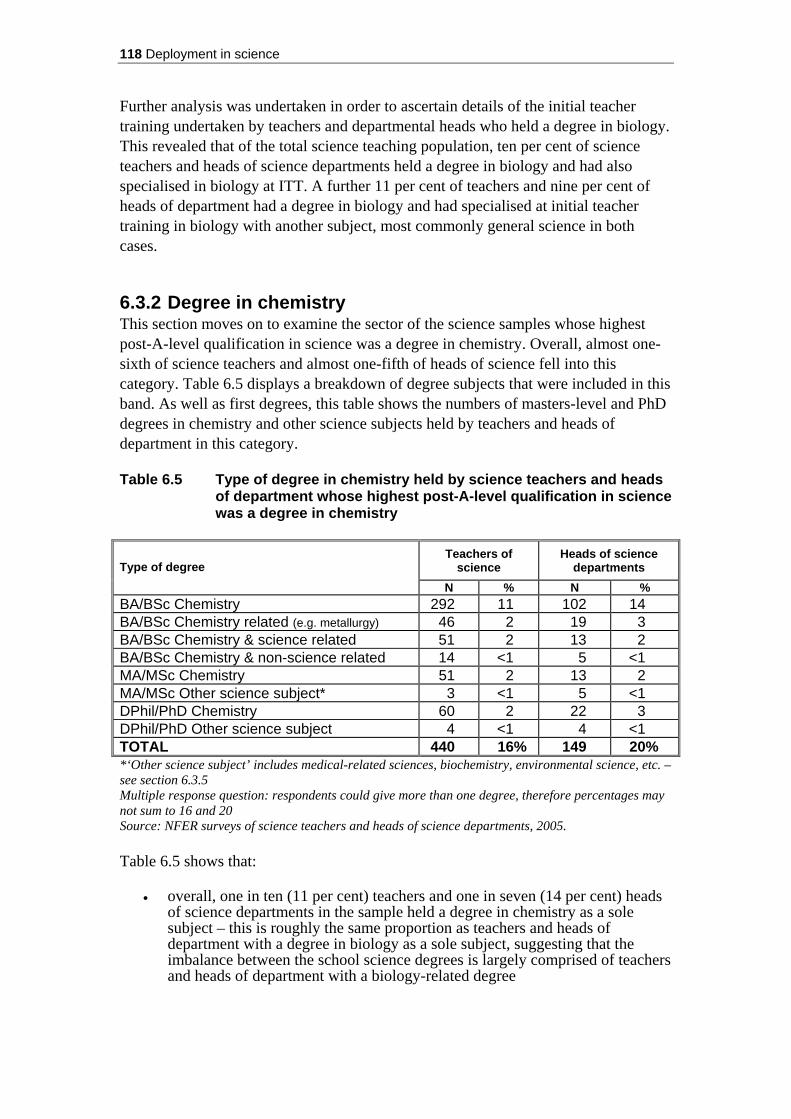
118 Deployment in science
Further analysis was undertaken in order to ascertain details of the initial teacher training undertaken by teachers and departmental heads who held a degree in biology. This revealed that of the total science teaching population, ten per cent of science teachers and heads of science departments held a degree in biology and had also specialised in biology at ITT. A further 11 per cent of teachers and nine per cent of heads of department had a degree in biology and had specialised at initial teacher training in biology with another subject, most commonly general science in both cases. 6.3.2 Degree in chemistry This section moves on to examine the sector of the science samples whose highest post-A-level qualification in science was a degree in chemistry. Overall, almost one-sixth of science teachers and almost one-fifth of heads of science fell into this category. Table 6.5 displays a breakdown of degree subjects that were included in this band. As well as first degrees, this table shows the numbers of masters-level and PhD degrees in chemistry and other science subjects held by teachers and heads of department in this category. Table 6.5 Type of degree in chemistry held by science teachers and heads
of department whose highest post-A-level qualification in science was a degree in chemistry
Teachers of
science Heads of science
departments Type of degree N % N %
BA/BSc Chemistry 292 11 102 14 BA/BSc Chemistry related (e.g. metallurgy) 46 2 19 3 BA/BSc Chemistry & science related 51 2 13 2 BA/BSc Chemistry & non-science related 14 <1 5 <1 MA/MSc Chemistry 51 2 13 2 MA/MSc Other science subject* 3 <1 5 <1 DPhil/PhD Chemistry 60 2 22 3 DPhil/PhD Other science subject 4 <1 4 <1 TOTAL 440 16% 149 20% *‘Other science subject’ includes medical-related sciences, biochemistry, environmental science, etc. – see section 6.3.5 Multiple response question: respondents could give more than one degree, therefore percentages may not sum to 16 and 20 Source: NFER surveys of science teachers and heads of science departments, 2005. Table 6.5 shows that:
• overall, one in ten (11 per cent) teachers and one in seven (14 per cent) heads of science departments in the sample held a degree in chemistry as a sole subject – this is roughly the same proportion as teachers and heads of department with a degree in biology as a sole subject, suggesting that the imbalance between the school science degrees is largely comprised of teachers and heads of department with a biology-related degree

Part Two 119
• around five per cent of both samples held a higher degree in chemistry, either at masters level or PhD.
Further analysis was undertaken in order to establish the proportions of surveyed science teachers and heads of department who held a degree in chemistry and had specialised in chemistry at initial teacher training. Overall, six per cent of science teachers and seven per cent of heads of science departments had a degree in chemistry and had specialised in chemistry at initial teacher training. Six per cent of teachers and eight per cent of heads of science had a degree in chemistry and had specialised in chemistry with another subject, most commonly general science at ITT. This leaves a further four per cent of teachers and five per cent of heads of department who had a degree in chemistry but had specialised in general science at initial teacher training or who did not state their specialism. 6.3.3 Degree in physics This section moves on to consider science teachers and heads of science departments whose highest post-A-level qualification in science was a degree in physics. This category accounts for ten per cent of teachers and 14 per cent of heads of department. Table 6.6 displays the breakdown of degree type and subject of teachers and heads of department in this category. Table 6.6 Type of degree in physics held by science teachers and heads of
department whose highest post-A-level qualification in science was a degree in physics
Teachers of
science Heads of science
departments Type of degree N % N %
BA/BSc Physics 184 7 77 10 BA/BSc Physics related (e.g. geophysics, astronomy) 25 <1 4 <1 BA/BSc Physics & science related 46 2 18 2 BA/BSc Physics & non-science related 6 <1 4 <1 MA/MSc Physics 35 1 6 <1 MA/MSc Other science subject* 11 <1 2 <1 DPhil/PhD Physics 9 <1 2 <1 DPhil/PhD Other science subject 2 <1 2 <1 TOTAL 279 10% 106 14% *‘Other science subject’ includes medical-related sciences, biochemistry, environmental science, etc. – see section 6.3.5 Multiple response question: respondents could give more than one degree, therefore percentages may not sum to 10 and 14 Source: NFER surveys of science teachers and heads of science departments, 2005. Table 6.6 reveals that:
• overall, seven per cent of teachers and ten per cent of heads of science departments held a degree in physics as a sole subject – whereas there were roughly equal proportions of teachers and heads of departments with degrees solely in chemistry or biology, teachers and heads of department with degrees
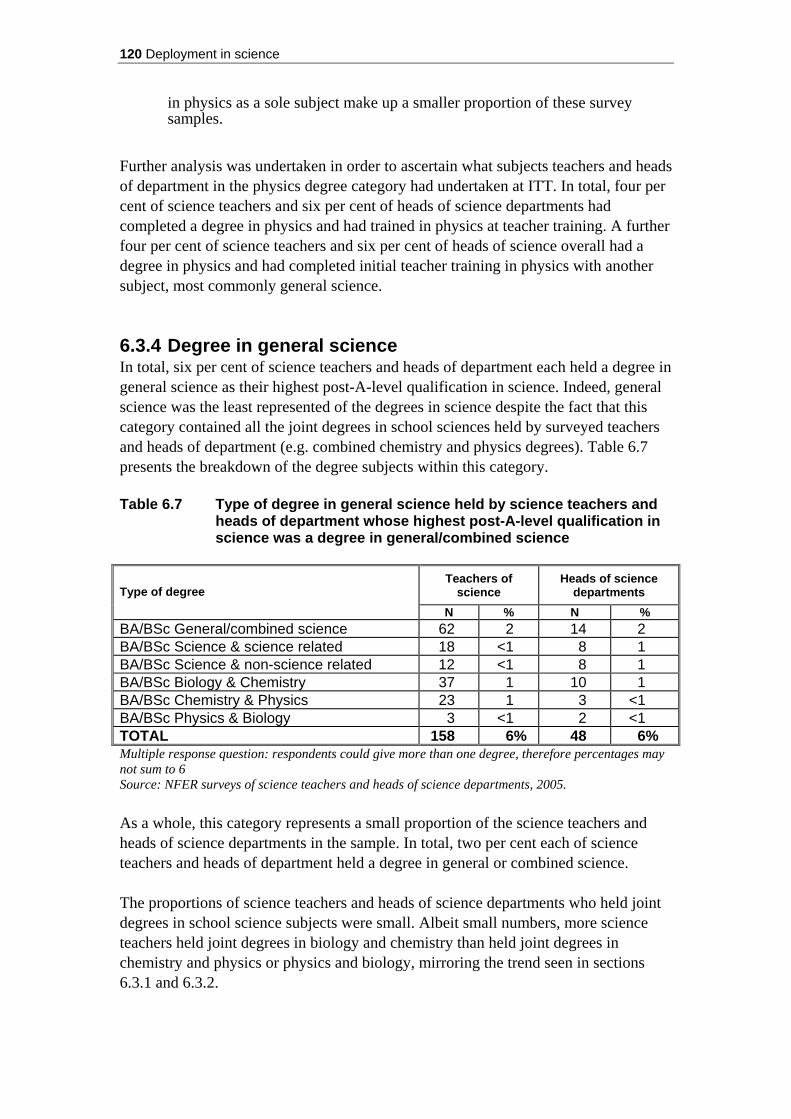
120 Deployment in science
in physics as a sole subject make up a smaller proportion of these survey samples.
Further analysis was undertaken in order to ascertain what subjects teachers and heads of department in the physics degree category had undertaken at ITT. In total, four per cent of science teachers and six per cent of heads of science departments had completed a degree in physics and had trained in physics at teacher training. A further four per cent of science teachers and six per cent of heads of science overall had a degree in physics and had completed initial teacher training in physics with another subject, most commonly general science. 6.3.4 Degree in general science In total, six per cent of science teachers and heads of department each held a degree in general science as their highest post-A-level qualification in science. Indeed, general science was the least represented of the degrees in science despite the fact that this category contained all the joint degrees in school sciences held by surveyed teachers and heads of department (e.g. combined chemistry and physics degrees). Table 6.7 presents the breakdown of the degree subjects within this category. Table 6.7 Type of degree in general science held by science teachers and
heads of department whose highest post-A-level qualification in science was a degree in general/combined science
Teachers of
science Heads of science
departments Type of degree N % N %
BA/BSc General/combined science 62 2 14 2 BA/BSc Science & science related 18 <1 8 1 BA/BSc Science & non-science related 12 <1 8 1 BA/BSc Biology & Chemistry 37 1 10 1 BA/BSc Chemistry & Physics 23 1 3 <1 BA/BSc Physics & Biology 3 <1 2 <1 TOTAL 158 6% 48 6% Multiple response question: respondents could give more than one degree, therefore percentages may not sum to 6 Source: NFER surveys of science teachers and heads of science departments, 2005. As a whole, this category represents a small proportion of the science teachers and heads of science departments in the sample. In total, two per cent each of science teachers and heads of department held a degree in general or combined science. The proportions of science teachers and heads of science departments who held joint degrees in school science subjects were small. Albeit small numbers, more science teachers held joint degrees in biology and chemistry than held joint degrees in chemistry and physics or physics and biology, mirroring the trend seen in sections 6.3.1 and 6.3.2.
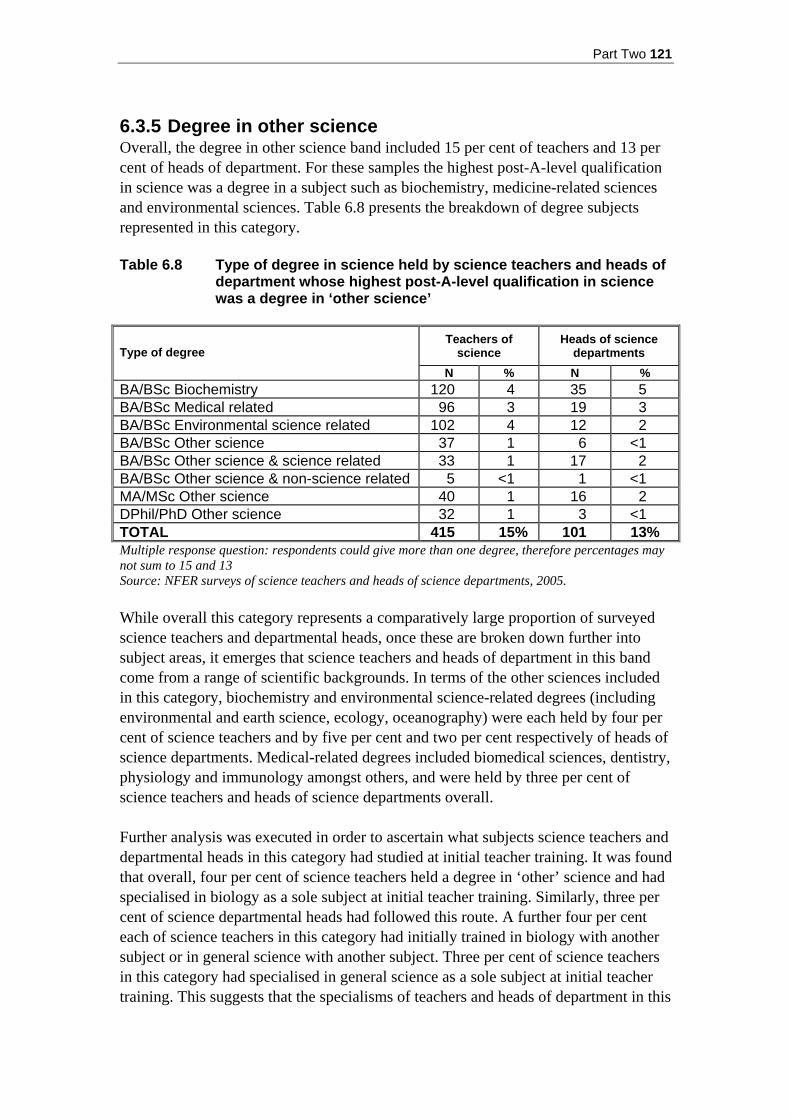
Part Two 121
6.3.5 Degree in other science Overall, the degree in other science band included 15 per cent of teachers and 13 per cent of heads of department. For these samples the highest post-A-level qualification in science was a degree in a subject such as biochemistry, medicine-related sciences and environmental sciences. Table 6.8 presents the breakdown of degree subjects represented in this category. Table 6.8 Type of degree in science held by science teachers and heads of
department whose highest post-A-level qualification in science was a degree in ‘other science’
Teachers of
science Heads of science
departments Type of degree N % N %
BA/BSc Biochemistry 120 4 35 5 BA/BSc Medical related 96 3 19 3 BA/BSc Environmental science related 102 4 12 2 BA/BSc Other science 37 1 6 <1 BA/BSc Other science & science related 33 1 17 2 BA/BSc Other science & non-science related 5 <1 1 <1 MA/MSc Other science 40 1 16 2 DPhil/PhD Other science 32 1 3 <1 TOTAL 415 15% 101 13% Multiple response question: respondents could give more than one degree, therefore percentages may not sum to 15 and 13 Source: NFER surveys of science teachers and heads of science departments, 2005. While overall this category represents a comparatively large proportion of surveyed science teachers and departmental heads, once these are broken down further into subject areas, it emerges that science teachers and heads of department in this band come from a range of scientific backgrounds. In terms of the other sciences included in this category, biochemistry and environmental science-related degrees (including environmental and earth science, ecology, oceanography) were each held by four per cent of science teachers and by five per cent and two per cent respectively of heads of science departments. Medical-related degrees included biomedical sciences, dentistry, physiology and immunology amongst others, and were held by three per cent of science teachers and heads of science departments overall. Further analysis was executed in order to ascertain what subjects science teachers and departmental heads in this category had studied at initial teacher training. It was found that overall, four per cent of science teachers held a degree in ‘other’ science and had specialised in biology as a sole subject at initial teacher training. Similarly, three per cent of science departmental heads had followed this route. A further four per cent each of science teachers in this category had initially trained in biology with another subject or in general science with another subject. Three per cent of science teachers in this category had specialised in general science as a sole subject at initial teacher training. This suggests that the specialisms of teachers and heads of department in this

122 Deployment in science
category tended to be biology or general science, further widening the gap between biology specialists and specialists in chemistry and physics within secondary schools in England. 6.3.6 B.Ed/QTS in science We turn now to consider teachers and heads of department whose highest post-A-level qualification in sciences was B.Ed or QTS in science. Across the total sample of 2,756 science teachers and the heads of 754 science departments, ten per cent of teachers and 11 per cent of heads of department held a B.Sc or BA with QTS or a B.Ed in science as their highest post-A-level qualification in the subject. This proportion accords with the frequencies of teachers with degrees in biology and chemistry as sole subjects. Science teachers The ten per cent of teachers in this category comprises two per cent of teachers who held a B.Ed or B.Sc/BA with QTS where biology was their sole specialism at initial teacher training; a further one per cent each of teachers who had initial teacher training specialisms in general/combined science, chemistry and physics. The remaining five per cent had trained at initial teacher training in general science with biology, chemistry or physics or in another combination of those subjects. Again, biology was most frequently represented. Heads of science departments The 11 per cent of heads of department who comprise this category included three per cent who held a B.Ed or B.Sc/BA with QTS where biology was their sole specialism at initial teacher training; a further one per cent each of departmental heads who had initial teacher training specialisms in general/combined science, chemistry and physics. The remaining five per cent had completed their QTS or B.Ed in general science with biology, chemistry or physics, or in another combination of these subjects. As with science teachers, biology was most frequently represented. 6.3.7 PGCE incorporating science Overall, seven per cent of science teachers and five per cent of departmental heads held a PGCE incorporating science as their highest post-A-level qualification in the subject. Teachers and heads of department in this category held degrees in subjects other than biology, chemistry, physics, general science or any other science. Table 6.9 displays the degree subject and type of degree held by teachers in this category.

Part Two 123
Table 6.9 Subject of first degree for science teachers and heads of department whose highest post-A-level qualification in science is a PGCE
Teachers holding PGCE in
science Heads of department holding PGCE
in science Subject of first degree N % N %
Engineering 66 2 20 3 Geology 21 1 5 1 Agricultural science 15 1 1 <1 Psychology 10 <1 2 <1 Food science 10 <1 1 <1 Sports science 10 <1 0 0 Other subject 18 1 0 0 TOTAL 184 7% 36 5% Multiple response question: respondents could able give more than one subject Source: NFER surveys of science teachers and heads of science departments, 2005. Table 6.9 reveals that:
• almost all of the science teachers and all departmental heads in this category held a degree in a science-related subject as well as a PGCE in science
• the most represented degree subject held by teachers and departmental heads whose highest qualification in science was a PGCE was engineering: overall two per cent of teachers and three per cent of heads of department in the sample held a degree in engineering and a PGCE in science.
As was noted in section 6.3.1 above, unlike the trends seen in mathematics, there appear to be very few science teachers and heads of department who had come into teaching science from a non-science-related background. This might indicate that the sciences do not lend themselves to being taught by teachers without a post-A-level qualification in the subject. 6.3.8 Cert Ed incorporating science Overall, four per cent of teachers and three per cent of departmental heads held a Cert Ed in science as their highest post-A-level qualification in the subject. The majority of science teachers in this category had specialised at initial teacher training in biology as a sole subject or biology with another science or general science. Similarly, most of the three per cent of departmental heads in this category had also specialised in biology as a sole subject or with another science subject at initial teacher training, again reflecting the trend for the science teaching population to have specialised in teaching biology. 6.3.9 Other post-A-level qualification in science Overall, two per cent of science teachers and five heads of science departments held some other type of post-A-level qualification in science, representing a small minority

124 Deployment in science
of both samples. Teachers in this category included one per cent of teachers who had trained overseas and held an overseas qualification in science or in teaching science. Teachers who entered teaching through other routes were also representing in this category and largely comprised teachers who had completed the Graduate Teaching Programme (one per cent) although there was representation of Teach First and other education diplomas. 6.3.10 No post-A-level qualification in science This section examines those teachers and departmental heads who held no post-A-level qualification in science. Owing to the low numbers of teachers in this category, both those with an A-level in science and those with no post-16 qualification in science are discussed together. Overall, two per cent of teachers and 1 per cent of heads of department in the sample held no post-A-level qualification in science. The degree subject held by teachers in this category was varied: six teachers held a science-related degree including engineering, geology and agriculture and the remaining teachers held non-science related degrees. The majority of teachers in this category reported that they had been teaching sciences for less than five years, suggesting that they may be teaching science in order to alleviated staff shortages within science departments in secondary schools. The above sections have shown that the largest majority of science teachers and departmental heads held a degree in science. However, in terms of the ‘school science’ subjects, there was a great deal of inequality, with biology in particular being strongly represented to the cost of chemistry and physics. As well as those teachers who held a degree in biology, there was a substantial number who held a degree in general or other sciences and specialised in biology at initial training, as well as teachers who had entered teaching through the B.Ed/QTS, Cert Ed and PGCE routes. A further area of concern may be that a minority of teachers whose highest post-A-level qualification in science was a degree in biology held this degree in biology as a sole subject, indeed the majority held biology-related degrees or joint degrees in biology with another science or science-related subject. 6.3.11 The distribution of qualification bands by background
variables This section moves on to consider where the differently qualified science teachers in the sample taught in terms of the Government Office Region, the age-range of the school, schools’ GCSE attainment band and the level of free school meals eligibility. A number of tables are presented in this section, each showing the disaggregation of science teachers only (heads of science departments are not included in this section). Table 6.10 presents a cross-tabulation of the highest post-A-level qualification in science categories by the Government Office Region.
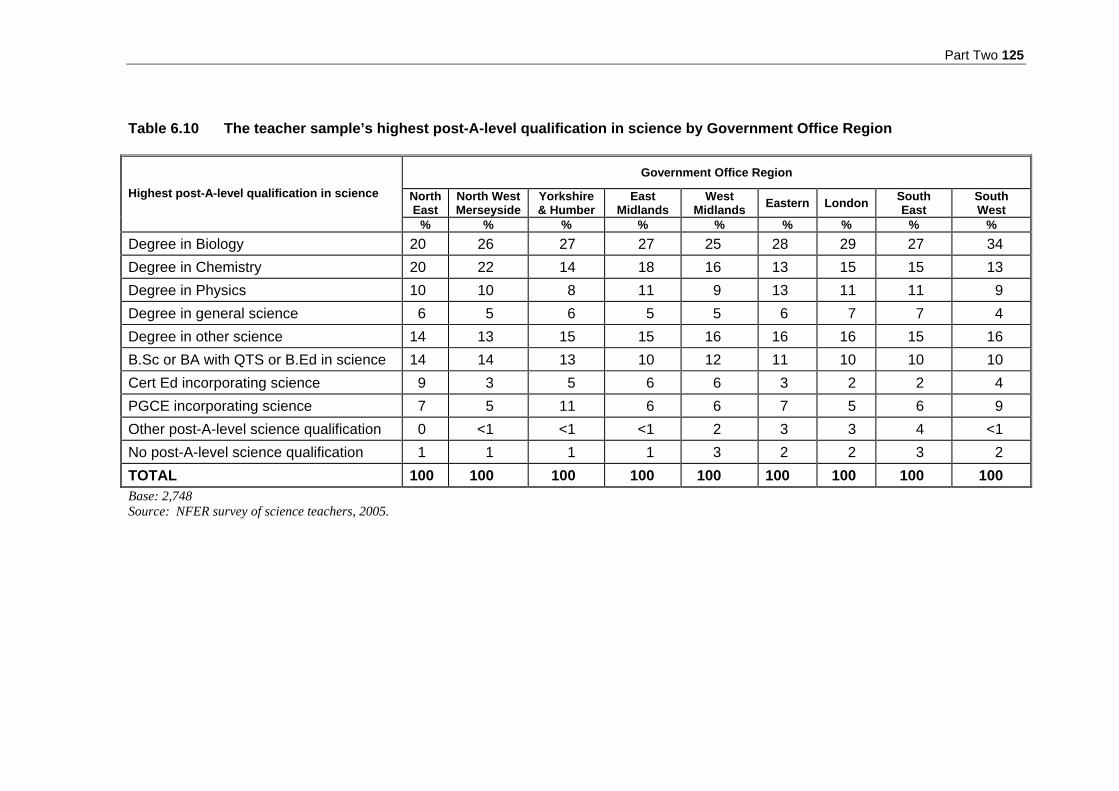
Part Two 125
Table 6.10 The teacher sample’s highest post-A-level qualification in science by Government Office Region
Government Office Region
North East
North West Merseyside
Yorkshire & Humber
East Midlands
West Midlands Eastern London South
East South West
Highest post-A-level qualification in science
% % % % % % % % % Degree in Biology 20 26 27 27 25 28 29 27 34 Degree in Chemistry 20 22 14 18 16 13 15 15 13 Degree in Physics 10 10 8 11 9 13 11 11 9 Degree in general science 6 5 6 5 5 6 7 7 4 Degree in other science 14 13 15 15 16 16 16 15 16 B.Sc or BA with QTS or B.Ed in science 14 14 13 10 12 11 10 10 10 Cert Ed incorporating science 9 3 5 6 6 3 2 2 4 PGCE incorporating science 7 5 11 6 6 7 5 6 9 Other post-A-level science qualification 0 <1 <1 <1 2 3 3 4 <1 No post-A-level science qualification 1 1 1 1 3 2 2 3 2 TOTAL 100 100 100 100 100 100 100 100 100 Base: 2,748 Source: NFER survey of science teachers, 2005.

126 Deployment in science
Table 6.10 shows that, in general, surveyed teachers with a degree in science of some kind are spread fairly evenly across the Government Office Regions, although there are some differences in the geographical distribution of the degree in school science categories. For example, there is a difference of 14 percentage points between the frequency of teachers with a degree in biology in the South West and North East regions. Similarly, there appear to be more teachers with a degree in chemistry in the North East and North-West regions than elsewhere in England, likely owing to the concentration of chemical industries in these regions. The largest proportions of teachers with no post-A-level qualification in science are found in the West Midlands and South East regions. Table 6.11 presents the qualification in science categories cross-tabulated with the age-range of the schools in which the teachers in each band taught. Table 6.11 The teacher sample’s highest post-A-level qualification in
science by the age range of the school
Age range of school
11-16 11-18 Other* Highest post-A-level qualification in science
% % % Degree in Biology 27 28 26 Degree in Chemistry 13 18 17 Degree in Physics 7 12 11 Degree in general science 6 6 5 Degree in other science 14 16 16 B.Sc or BA with QTS or B.Ed in science 14 9 11 Cert Ed incorporating science 6 3 5 PGCE incorporating science 8 6 8 Other post-A-level science qualification 2 2 1 No post-A-level science qualification 3 2 2 TOTAL 100 100 100 *Predominately 14-18 schools but also includes 11-14 schools Base: 2,748 Source: NFER survey of science teachers, 2005. Table 6.11 reveals that teachers with a degree in the school sciences, and in particular in chemistry or physics, tend to be more strongly represented in schools with an age-range of 11–18 years. This is almost certainly related to the fact that there is scope to teach A-level sciences in these schools. Conversely, teachers with B.Ed or QTS in science, a PGCE in science or Cert Ed in science tend to be more strongly represented in schools with an 11–16 age range than in 11–18 schools. Teachers without a post-A-level science qualification are represented more or less evenly both of these school types. Tables 6.12 and 6.13 present teachers in each of the science qualification categories cross-tabulated with the GCSE achievement band of the school and the level of free school meals in the school respectively.
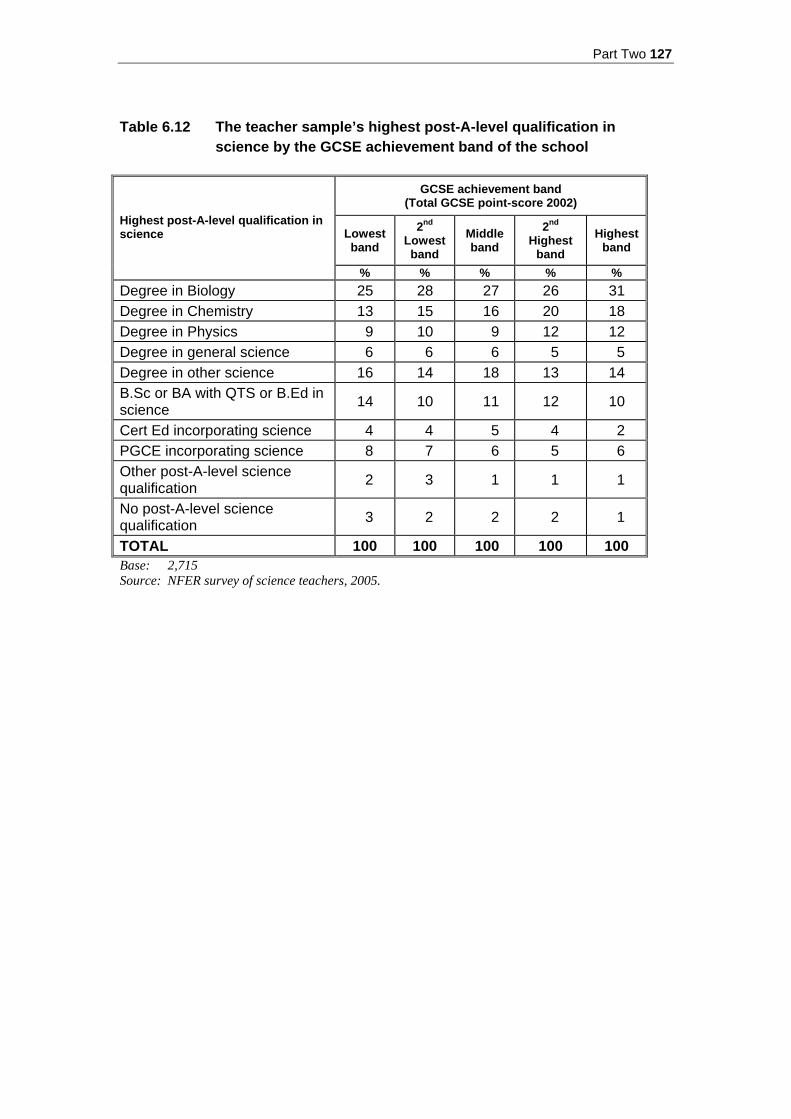
Part Two 127
Table 6.12 The teacher sample’s highest post-A-level qualification in
science by the GCSE achievement band of the school
GCSE achievement band (Total GCSE point-score 2002)
Lowest band
2nd Lowest band
Middle band
2nd Highest
band Highest
band
Highest post-A-level qualification in science
% % % % % Degree in Biology 25 28 27 26 31 Degree in Chemistry 13 15 16 20 18 Degree in Physics 9 10 9 12 12 Degree in general science 6 6 6 5 5 Degree in other science 16 14 18 13 14 B.Sc or BA with QTS or B.Ed in science 14 10 11 12 10
Cert Ed incorporating science 4 4 5 4 2 PGCE incorporating science 8 7 6 5 6 Other post-A-level science qualification 2 3 1 1 1
No post-A-level science qualification 3 2 2 2 1
TOTAL 100 100 100 100 100 Base: 2,715 Source: NFER survey of science teachers, 2005.
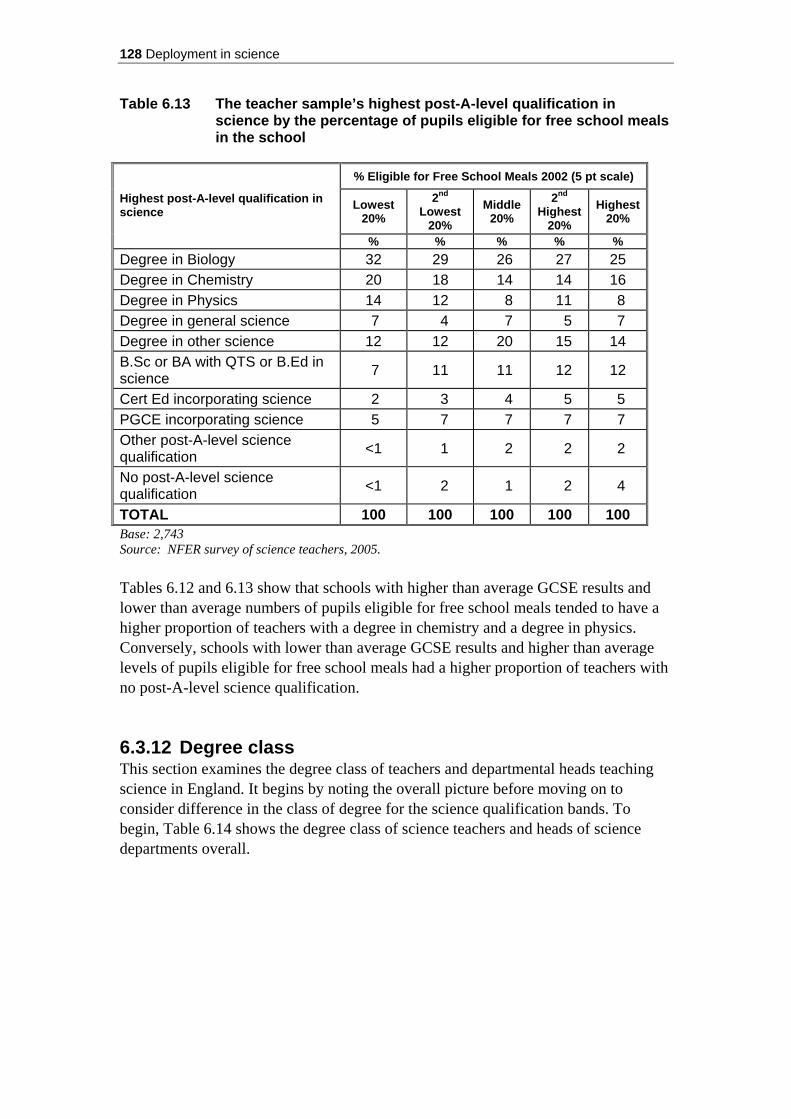
128 Deployment in science
Table 6.13 The teacher sample’s highest post-A-level qualification in science by the percentage of pupils eligible for free school meals in the school
% Eligible for Free School Meals 2002 (5 pt scale)
Lowest 20%
2nd Lowest
20% Middle
20% 2nd
Highest 20%
Highest 20%
Highest post-A-level qualification in science
% % % % % Degree in Biology 32 29 26 27 25 Degree in Chemistry 20 18 14 14 16 Degree in Physics 14 12 8 11 8 Degree in general science 7 4 7 5 7 Degree in other science 12 12 20 15 14 B.Sc or BA with QTS or B.Ed in science 7 11 11 12 12
Cert Ed incorporating science 2 3 4 5 5 PGCE incorporating science 5 7 7 7 7 Other post-A-level science qualification <1 1 2 2 2
No post-A-level science qualification <1 2 1 2 4
TOTAL 100 100 100 100 100 Base: 2,743 Source: NFER survey of science teachers, 2005. Tables 6.12 and 6.13 show that schools with higher than average GCSE results and lower than average numbers of pupils eligible for free school meals tended to have a higher proportion of teachers with a degree in chemistry and a degree in physics. Conversely, schools with lower than average GCSE results and higher than average levels of pupils eligible for free school meals had a higher proportion of teachers with no post-A-level science qualification. 6.3.12 Degree class This section examines the degree class of teachers and departmental heads teaching science in England. It begins by noting the overall picture before moving on to consider difference in the class of degree for the science qualification bands. To begin, Table 6.14 shows the degree class of science teachers and heads of science departments overall.

Part Two 129
Table 6.14 Degree class held by science teachers and heads of science departments
Science teachers Heads of science departments Class of degree
N % N % 1st 168 6 33 4 2nd 107 4 41 5 2(i) 895 33 208 28 2(ii) 809 29 245 33 3rd 205 7 74 10 Ordinary 34 1 10 1 Other 69 3 26 3 No response 469 17 117 16 TOTAL 2,756 100 754 100 Due to rounding, percentages may not sum to 100 Source: NFER surveys of science teachers and heads of science departments, 2005. Table 6.14 reveals that more than two-fifths of science teachers (43 per cent) and more than one-third of departmental heads (37 per cent) had obtained a 2(i) degree or higher. Further, almost half of science heads of department had obtained a 2(ii) degree or lower, while there were similar proportions of science teachers in both these categories. Just six per cent of teachers and four per cent of departmental heads had a first class degree. Tables 6.15 and 6.16 present cross-tabulations of the highest post-A-level qualification in science held by the samples with degree class, in order to ascertain what differences existed in terms of degree class, between the school sciences, general and other science degrees. In these tables, only those teachers and heads of department who responded to the question concerning degree class on the surveys are considered and the figures quoted below relate to a sub-sample of 2,287 science teachers and 637 heads of department.

130 Deployment in science
Table 6.15 Highest post-A-level qualification held by science teachers with degree class
Degree class
1st 2nd 2(i) 2(ii) 3rd Ordinary Other Highest post-A-level qualification in science
% % % % % % % Degree in Biology 5 4 48 37 5 <1 1 Degree in Chemistry 12 3 32 34 14 3 3 Degree in Physics 6 9 24 36 18 3 3 Degree in general science 9 5 33 38 7 4 5 Degree in other science 6 3 49 35 5 <1 1 B.Sc or BA with QTS or B.Ed in science 9 6 34 34 9 2 6 Cert Ed incorporating science 15 15 15 23 8 0 23 PGCE incorporating science 6 3 37 36 12 2 3 Other post-A-level science qualification 5 14 36 18 9 0 18 No post-A-level science qualification 0 9 36 36 0 0 18 Base: 2,287 Due to rounding, percentages may not sum to 100 Source: NFER survey of science teachers, 2005.
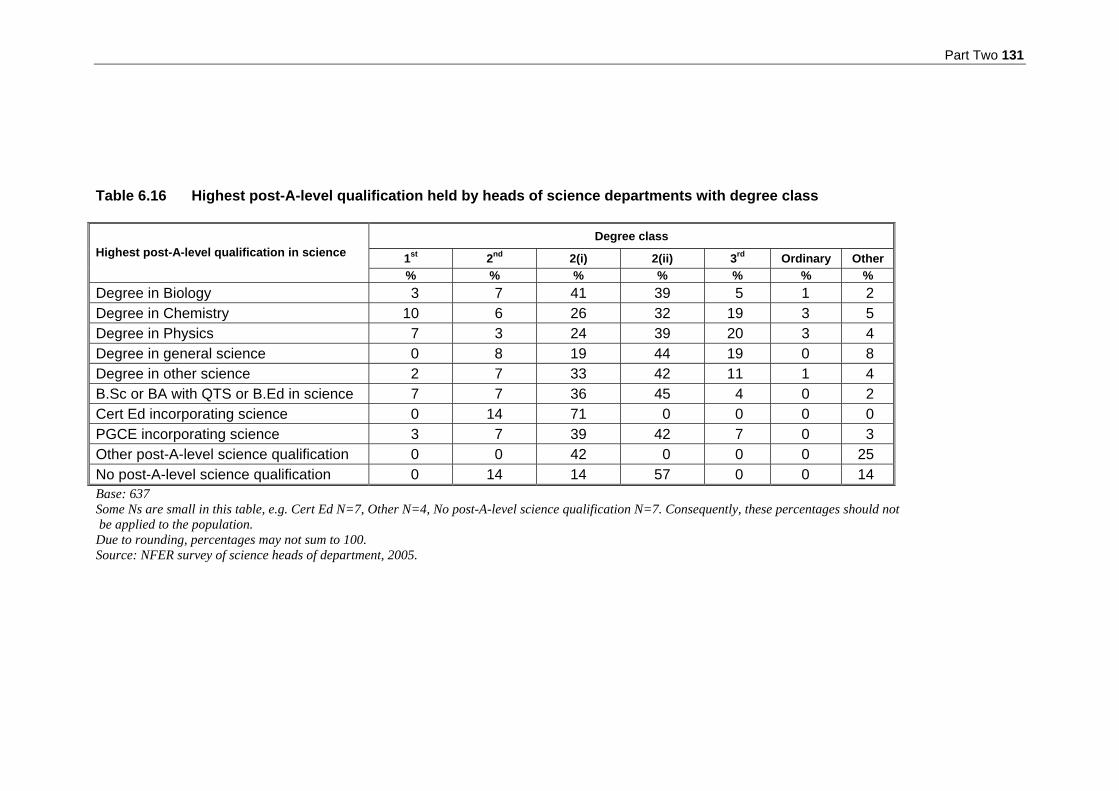
Part Two 131
Table 6.16 Highest post-A-level qualification held by heads of science departments with degree class
Degree class
1st 2nd 2(i) 2(ii) 3rd Ordinary Other Highest post-A-level qualification in science
% % % % % % % Degree in Biology 3 7 41 39 5 1 2 Degree in Chemistry 10 6 26 32 19 3 5 Degree in Physics 7 3 24 39 20 3 4 Degree in general science 0 8 19 44 19 0 8 Degree in other science 2 7 33 42 11 1 4 B.Sc or BA with QTS or B.Ed in science 7 7 36 45 4 0 2 Cert Ed incorporating science 0 14 71 0 0 0 0 PGCE incorporating science 3 7 39 42 7 0 3 Other post-A-level science qualification 0 0 42 0 0 0 25 No post-A-level science qualification 0 14 14 57 0 0 14 Base: 637 Some Ns are small in this table, e.g. Cert Ed N=7, Other N=4, No post-A-level science qualification N=7. Consequently, these percentages should not be applied to the population. Due to rounding, percentages may not sum to 100. Source: NFER survey of science heads of department, 2005.

132 Deployment in science
Tables 6.15 and 6.16 show that:
• more than half of teachers with a degree in biology, about half of teachers with a degree in chemistry and two-fifths of teachers with a degree in physics had obtained a degree of 2(i) or higher. The same pattern can also be observed for departmental heads, though the proportions holding a 2(i) degree or above in each case is lower than for teachers
• of the degree bands, degrees in biology and degrees in ‘other’ science had the highest proportion of teachers and departmental heads with 2(i) degrees or above
• degrees in physics had the largest proportion of teachers and heads of department who held a 2(ii) degree or lower.
Extrapolating to the sample of 2,756 science teachers and heads of 754 science departments as a whole we can deduce the following information:
• 14 per cent of science teachers and 12 per cent of departmental heads held at least a 2(i) degree in biology
• seven per cent of science teachers and heads of science held at least a 2(i) degree in chemistry
• four per cent of science teachers and heads of department held at least a 2(i) degree in physics.
6.4 Characteristics of heads of science departments
and science teachers This section considers science teachers and heads of department in more detail in terms of the following characteristics:
• gender • age • length of time in teaching and teaching sciences • any previous career • other roles in the department or school.
6.4.1 Gender Of the 745 heads of science departments who responded to the question on gender on the questionnaire, the majority were male (62 per cent). Managing science departments appears to be much more male-dominated than mathematics departments, where the gender split was closer to 50:50. The converse was true of the sample of 2,749 teachers who responded to this question on the survey, where the largest proportion of teachers were female at 55 per cent – reflecting the trend found for mathematics teachers.

Part Two 133
6.4.2 Age Science teachers spanned a wide age-range from the youngest at 22 (15 teachers) and the eldest at 65 (3 teachers) years of age. The majority of heads of department were aged between 30 and 59 and were evenly spread across the three decades. One-quarter of teachers were aged under 30 (a larger proportion than in mathematics teachers), almost half of the teachers responding to the survey were aged over 40 and almost one-quarter were over 50, revealing a less aging profile than that seen for teachers of mathematics. Table 6.17 Age range of science teachers and heads of department
Science teachers Heads of science departments Age range N % N %
Under 25 143 6 0 0 25-29 509 20 31 5 30-39 707 27 222 32 40-49 624 24 223 32 50-59 580 22 213 31 60+ 34 1 5 <1 TOTAL 2,597 100 694 100 No response: 159 science teachers; 60 heads of science departments Due to rounding, percentages may not sum to 100 Source: NFER science teacher survey and science head of department survey, 2005 Table 6.18 reveals the breakdown of science teachers’ age by their highest post-A-level qualification in science. Teachers with a degree in biology were, on average, younger than those with degrees in chemistry or physics. One-third of teachers with a degree in biology were under the age of 30. For teachers with a degree in chemistry, the figure was closer to one-quarter, and for physics, it is nearer to one-fifth. One-quarter of teachers with a degree in physics were over the age of 50. This proportion is slightly smaller than that quoted by Smithers and Robinson (2005a, p.8), who found that 31 per cent of physics graduates were over 50 (though their sample included the independent sector and colleges). None the less, it is in sharp contrast to the 15 per cent of biology graduates of this age. Thus, already in shorter supply, more of the teachers with degrees in physics and for that matter, chemistry, are older and therefore closer to departing the profession through retirement.

134 Deployment in science
Table 6.18 Age range of science teachers by highest post-A-level qualification in science
Degree
in biology
Degree in
chemistry
Degree in
physics
Degree in general science
Degree in other science
B.Ed/QTS in
science
PGCE in
science
Cert Ed in
science Age
range % % % % % % % %
Under 25 6 5 8 3 7 7 4 0
25-29 27 18 13 11 26 14 18 0 30-39 29 31 26 23 32 16 34 1 40-49 23 24 27 31 20 27 30 16 50-59 15 21 24 30 14 32 15 77 60+ <1 1 2 2 <1 4 0 6
TOTAL 100 100 100 100 100 100 100 100 Base: 2,597 (results for ‘other post-A-level qualification in science and ‘no post-A-level qualification’ in science not shown) Source: NFER survey of science teachers, 2005. 6.4.3 Length of time in teaching and teaching sciences As with mathematics teachers, almost two-fifths of science teachers had been teaching and/or teaching sciences for less than five years at the time of the survey, and almost three-fifths had been teaching sciences for less than ten years, suggesting that as a whole, the sample was not made up of long-serving experienced science teachers. Table 6.19 shows that overall, just over two-thirds of science teachers (67 per cent) had been teaching for less than 15 years. Table 6.20 presents the length of time that heads of departments had been teaching and the length of time that they had been heads of science departments. As was found to be the case in mathematics departments, whilst more than one-quarter of heads of science departments had been teaching for more than 25 years, overall, more than half of heads of science departments (56 per cent) had been a head of department for less than five years. In total, just under one-quarter of departmental heads had managed a department for more than ten years.
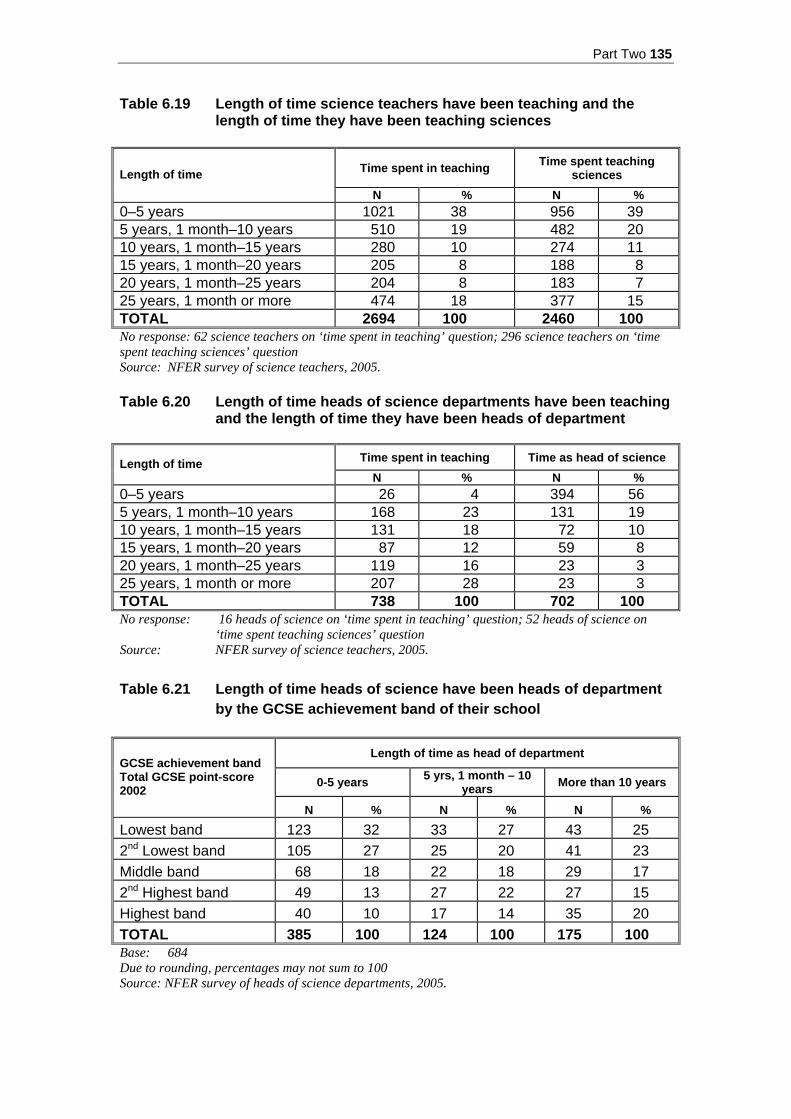
Part Two 135
Table 6.19 Length of time science teachers have been teaching and the length of time they have been teaching sciences
Time spent in teaching Time spent teaching sciences Length of time
N % N % 0–5 years 1021 38 956 39 5 years, 1 month–10 years 510 19 482 20 10 years, 1 month–15 years 280 10 274 11 15 years, 1 month–20 years 205 8 188 8 20 years, 1 month–25 years 204 8 183 7 25 years, 1 month or more 474 18 377 15 TOTAL 2694 100 2460 100 No response: 62 science teachers on ‘time spent in teaching’ question; 296 science teachers on ‘time spent teaching sciences’ question Source: NFER survey of science teachers, 2005. Table 6.20 Length of time heads of science departments have been teaching
and the length of time they have been heads of department
Time spent in teaching Time as head of science Length of time N % N %
0–5 years 26 4 394 56 5 years, 1 month–10 years 168 23 131 19 10 years, 1 month–15 years 131 18 72 10 15 years, 1 month–20 years 87 12 59 8 20 years, 1 month–25 years 119 16 23 3 25 years, 1 month or more 207 28 23 3 TOTAL 738 100 702 100 No response: 16 heads of science on ‘time spent in teaching’ question; 52 heads of science on
‘time spent teaching sciences’ question Source: NFER survey of science teachers, 2005. Table 6.21 Length of time heads of science have been heads of department
by the GCSE achievement band of their school
Length of time as head of department
0-5 years 5 yrs, 1 month – 10 years More than 10 years
GCSE achievement band Total GCSE point-score 2002
N % N % N % Lowest band 123 32 33 27 43 25 2nd Lowest band 105 27 25 20 41 23 Middle band 68 18 22 18 29 17 2nd Highest band 49 13 27 22 27 15 Highest band 40 10 17 14 35 20 TOTAL 385 100 124 100 175 100 Base: 684 Due to rounding, percentages may not sum to 100 Source: NFER survey of heads of science departments, 2005.

136 Deployment in science
Table 6.21 presents cross-tabulations of the length of time that heads of science departments have been departmental heads by the GCSE attainment band of their school. As can be seen from Table 6.21, schools in the lowest band regarding GCSE achievement had the largest representation of heads of science departments with less than five years’ experience, which, at almost one-third, mirrors the findings for the heads of mathematics departments in the study. In schools in the highest GCSE achievement band, there was double the proportion of departmental heads with more than ten years’ experience of the role compared with those of less than five years’ experience. Unlike the pattern found in mathematics departments, however, there were no differences found for science departmental heads in terms of the levels of pupils with special educational needs in the school. 6.4.4 Careers before teaching sciences The older age profile of teachers of science, coupled with the fact that almost two-fifths had been teaching for less than five years may be related to the fact that in common with teachers of mathematics, more than two-fifths of science teachers surveyed (45 per cent) had had another career prior to entering the teaching profession. In terms of science departmental heads, a smaller proportion of the sample – closer to one-third (35 per cent) – had a career before teaching. Of the teachers of science and departmental heads who had had a previous career, frequently cited prior occupations included scientific research (21 per cent and 22 per cent respectively of those stating previous careers) and laboratory technician (10 per cent and 7 per cent respectively). Eight per cent of science departmental heads had also previously worked in accountancy. 6.4.5 Others roles in department/school More than half of heads of department responding to the questionnaire reported that they held no other roles or responsibilities in their school. The remaining heads of department held a wide variety of roles. Of the 43 per cent who held extra responsibilities, one-fifth held more senior management roles within the school, such as an assistant or deputy headship, being a member of the senior management team or being a senior teacher; over one-third had pastoral responsibilities such as form tutor but also as head or deputy head of year; and almost one half held other whole-school responsibilities, much like the proportions seen for heads of mathematics departments. In contrast, almost three-quarters of science teachers (74 per cent) also held some extra roles or responsibilities within the school. In almost half of these cases, the other responsibilities held by science teachers were in the area of pastoral care. Of these science teachers with extra responsibilities, over one-fifth were also form tutors and 15 per cent were either heads or deputy-heads of year. Nearly one-quarter of those with additional responsibilities held management responsibilities within their science department (e.g. second in department), and one-quarter held responsibilities related to a curriculum phase or science, such as key stage 3 science coordinator, head of

Part Two 137
chemistry etc. One-quarter of science teachers with additional roles held other whole-school responsibilities. In total, thirty-three (one per cent) of the science teachers in the sample and just one of the departmental heads were Advanced Skills Teachers (ASTs). 6.4.6 Contract type Teachers and departmental heads were asked to state whether their contract was temporary, supply or permanent and full-time or part-time. The following findings represent the total samples of 2,756 science teachers and 754 heads of department:
• overall, 94 per cent of science teachers were on permanent contracts, 5 per cent held temporary contracts and 1 per cent were supply teachers
• 8 per cent of science teachers were part-time • 92 per cent of departmental heads held permanent contracts and 6 per cent
stated that they were the temporary or acting head of department.
6.5 Concluding comments In science, compared with mathematics, the proportion of non-specialist teachers was less extreme. For science, rather, the sharp imbalance between the school sciences in teachers’ qualifications was an outstanding feature. In effect, in the science teaching population, biologists outnumbered chemists or physicists by around two to one. This imbalance in the representation of the three sciences was also spread unevenly across schools. For example, one-quarter of 11-16 schools did not have any physics specialists. Recent research (Smithers and Robinson, 2005) concluded that ‘Physics is in danger of disappearing as an identifiable subject from much of state education, through redefinition to general science and teacher shortage’ (p.55). Findings presented in this chapter concur with the assessment related to teacher shortage and also suggest that the same summation, though to a lesser degree, may apply to chemistry. This, then, raises questions about what can be done to attract physics and chemistry specialists to the teaching profession, and also how to resolve the inequity between schools in terms of staffing. One possibility may be physics- and chemistry-focused professional development for existing teachers (e.g. through the newly established Science Learning Centres).

138 Deployment in science
7 The staffing of science lessons
Key findings
• In determining how to deploy teachers to science classes, overwhelmingly, priority was given to year groups / courses that involve national assessment: double award science, AS/A2-level groups and Year 9.
• In terms of the factors that figured most highly in their deployment decision-making, the most frequently identified by far was staff’s subject knowledge (incidentally nominated by a higher proportion of heads of science than heads of maths). As was the case with maths, staff professional development and staff preference were prioritised least often, each by fewer than one-quarter of departmental heads.
• Analysis was undertaken to ascertain how deployment varies by year group / course and science. The lower numbers of teachers with a degree in physics or chemistry compared with those holding a biology degree meant that they taught smaller proportions of science time in each year of key stage 3 and for single award, double award, applied science and other key stage 4 science courses. This would inevitably mean less exposure to specialists in physics particularly and also chemistry, which could perhaps affect students’ perceptions of these sciences and possibly militate against their selecting these sciences for further study.
• In terms of double award science, the biology element was best served regarding the proportion of teachers who taught this and had specialised in this science. Around two-thirds of those teaching the biology element of double award science had a biology degree or had qualified to teach this at ITT.
• In contrast, of those teaching double award chemistry, two-fifths had studied chemistry at degree level or by ITT. The figures were lower still for physics: one-third of those teaching the physics element of double award science had a specialised in this subject at degree-level or at ITT. Indeed, here physics specialists were actually outnumbered by the proportion of staff who taught double award physics yet held no qualifications at post-16 level or above in the subject.
• Compared with double award science, deployment of teachers to pupils learning GCSE biology, chemistry and physics showed a move towards more specific specialist deployment. Therefore, a much greater proportion of the time was taught by specialists in the specific science than was the case for double award science.
• In this sample, the vast majority of the teaching time in each of A-level biology, chemistry and physics – around 90 per cent – was taken by those with a degree in the particular science or who had specialised in this as part of their ITT. None the less, this still left around 10 per cent of the time (13 per cent in A-level physics) – not an insignificant amount – to be taught by those whose either held no qualifications at post-16 level or above in the science or whose highest qualification in the science was itself A-level.
• Around one-quarter of departmental heads responded that their department had experienced ‘a great deal’ of difficulty in the area of staff shortages and around half had experienced shortages ‘quite a lot’ or ‘a great deal’.

Part Two 139
7.1 Introduction Chapter 6 of this report set out the qualifications of the teachers who currently teach science lessons in a sample of one in four secondary schools in England. This section now considers how these teachers are deployed to teach the various year groups and ability groups in terms of the qualifications that they hold. To this end, this chapter sets out the year groups and key factors that are prioritised in departmental heads’ decision-making on the deployment of staff to science classes. It then moves on to consider how this translates into practice by examining the teaching timetables of our sample in order to ascertain how deployment varies according to year group at Key Stage 3, type of course at Key Stage 4 (for example, single award science, double award science, GCSE biology, chemistry and physics) and at AS/A2-level. The chapter then concludes by considering the sample’s experience of shortages of science-specialist teaching staff and the strategies used to remedy such shortages. Thus, the chapter is structured as follows: Section 7.2 Decision-making regarding the deployment of teachers to classes Section 7.3 The deployment of teachers to science classes Section 7.4 Strategies for alleviating staff shortages Section 7.5 Concluding comments 7.2 Decision-making regarding the deployment of
teachers to classes In order to understand the way in which decisions are made regarding the allocation of available teachers to the various science classes, heads of departments were invited to answer the following in their questionnaires:
‘In determining how to deploy teachers to teach science classes, please select from the list the four year groups / courses that tend to be given the highest priority in your decision making.’ ‘In determining how to deploy teachers to teach science classes, please select from the list the three factors that tend to be given the highest priority in your decision-making.’
Tables 7.1 and 7.2 set out the findings from these inquiries. Both tables first show the responses from all of the heads of science departments in the sample, then the results are presented for the departmental heads working in 11-16 schools and then those from 11-18 schools.
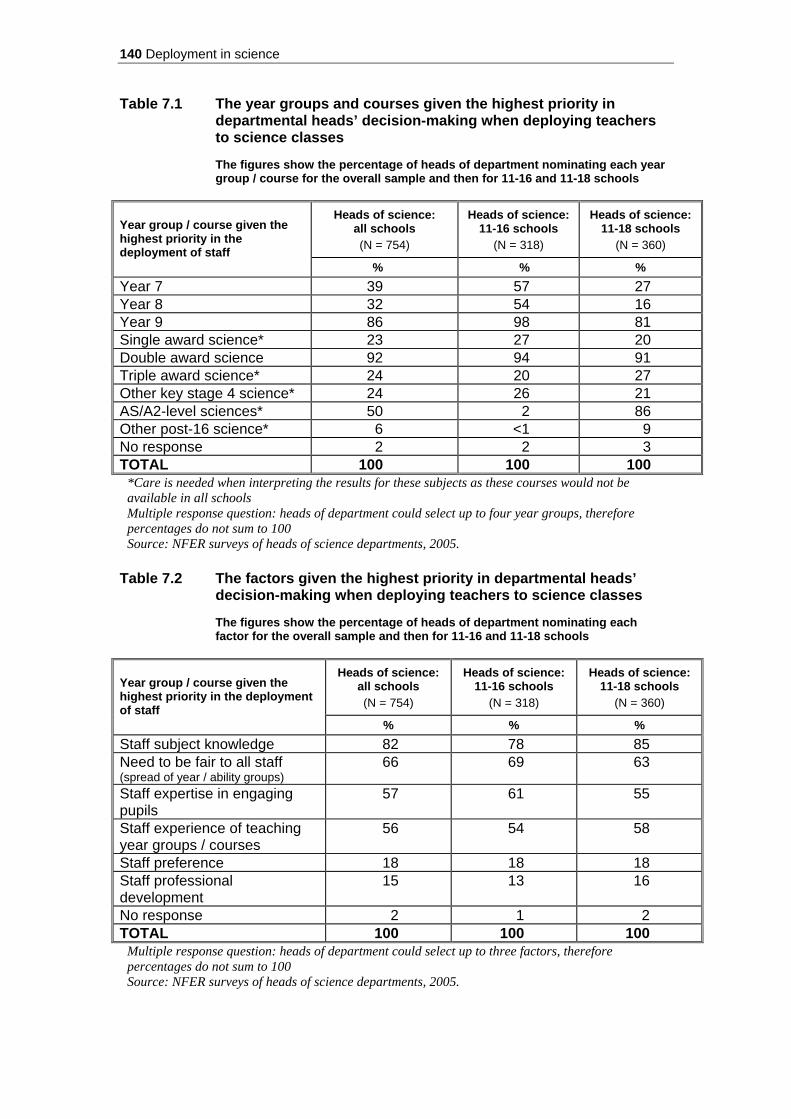
140 Deployment in science
Table 7.1 The year groups and courses given the highest priority in departmental heads’ decision-making when deploying teachers to science classes
The figures show the percentage of heads of department nominating each year
group / course for the overall sample and then for 11-16 and 11-18 schools
Heads of science: all schools (N = 754)
Heads of science: 11-16 schools
(N = 318)
Heads of science: 11-18 schools
(N = 360)
Year group / course given the highest priority in the deployment of staff
% % % Year 7 39 57 27 Year 8 32 54 16 Year 9 86 98 81 Single award science* 23 27 20 Double award science 92 94 91 Triple award science* 24 20 27 Other key stage 4 science* 24 26 21 AS/A2-level sciences* 50 2 86 Other post-16 science* 6 <1 9 No response 2 2 3 TOTAL 100 100 100
*Care is needed when interpreting the results for these subjects as these courses would not be available in all schools Multiple response question: heads of department could select up to four year groups, therefore percentages do not sum to 100 Source: NFER surveys of heads of science departments, 2005.
Table 7.2 The factors given the highest priority in departmental heads’
decision-making when deploying teachers to science classes The figures show the percentage of heads of department nominating each
factor for the overall sample and then for 11-16 and 11-18 schools
Heads of science: all schools (N = 754)
Heads of science: 11-16 schools
(N = 318)
Heads of science: 11-18 schools
(N = 360)
Year group / course given the highest priority in the deployment of staff
% % % Staff subject knowledge 82 78 85 Need to be fair to all staff (spread of year / ability groups)
66 69 63
Staff expertise in engaging pupils
57 61 55
Staff experience of teaching year groups / courses
56 54 58
Staff preference 18 18 18 Staff professional development
15 13 16
No response 2 1 2 TOTAL 100 100 100
Multiple response question: heads of department could select up to three factors, therefore percentages do not sum to 100 Source: NFER surveys of heads of science departments, 2005.
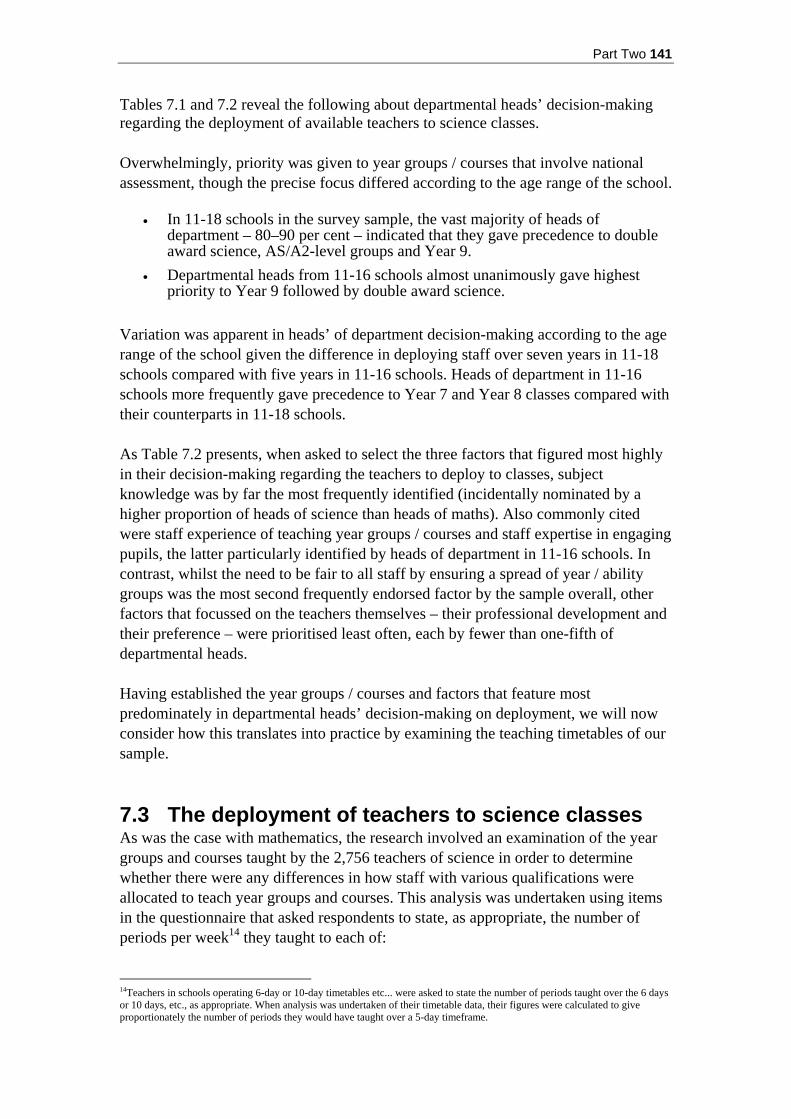
Part Two 141
Tables 7.1 and 7.2 reveal the following about departmental heads’ decision-making regarding the deployment of available teachers to science classes. Overwhelmingly, priority was given to year groups / courses that involve national assessment, though the precise focus differed according to the age range of the school.
• In 11-18 schools in the survey sample, the vast majority of heads of department – 80–90 per cent – indicated that they gave precedence to double award science, AS/A2-level groups and Year 9.
• Departmental heads from 11-16 schools almost unanimously gave highest priority to Year 9 followed by double award science.
Variation was apparent in heads’ of department decision-making according to the age range of the school given the difference in deploying staff over seven years in 11-18 schools compared with five years in 11-16 schools. Heads of department in 11-16 schools more frequently gave precedence to Year 7 and Year 8 classes compared with their counterparts in 11-18 schools. As Table 7.2 presents, when asked to select the three factors that figured most highly in their decision-making regarding the teachers to deploy to classes, subject knowledge was by far the most frequently identified (incidentally nominated by a higher proportion of heads of science than heads of maths). Also commonly cited were staff experience of teaching year groups / courses and staff expertise in engaging pupils, the latter particularly identified by heads of department in 11-16 schools. In contrast, whilst the need to be fair to all staff by ensuring a spread of year / ability groups was the most second frequently endorsed factor by the sample overall, other factors that focussed on the teachers themselves – their professional development and their preference – were prioritised least often, each by fewer than one-fifth of departmental heads. Having established the year groups / courses and factors that feature most predominately in departmental heads’ decision-making on deployment, we will now consider how this translates into practice by examining the teaching timetables of our sample. 7.3 The deployment of teachers to science classes As was the case with mathematics, the research involved an examination of the year groups and courses taught by the 2,756 teachers of science in order to determine whether there were any differences in how staff with various qualifications were allocated to teach year groups and courses. This analysis was undertaken using items in the questionnaire that asked respondents to state, as appropriate, the number of periods per week14 they taught to each of:
14Teachers in schools operating 6-day or 10-day timetables etc... were asked to state the number of periods taught over the 6 days or 10 days, etc., as appropriate. When analysis was undertaken of their timetable data, their figures were calculated to give proportionately the number of periods they would have taught over a 5-day timeframe.

142 Deployment in science
• key stage 3: Year 7, Year 8, Year 9 • key stage 4: GCSE single award science, GCSE double award science,
GCSE biology, GCSE chemistry, GCSE physics, GCSE applied science, other key stage 4 science
• post-16: AS/A2-level biology, chemistry, physics, other post-16 science courses.
In addition, respondents who taught double award science were asked to indicate which elements of the course they taught – double award biology, double award chemistry, double award physics – by circling ‘Yes’ or ‘No’ as appropriate. The analysis was conducted firstly in terms of qualifications in science by the same methods as had been used in maths i.e. the periods spent teaching each year group / course were converted into time spent teaching in minutes. This established the length of time per week that each teacher respondent spent teaching each year group / course. By summing all responses for, say, Year 7, we could ascertain the total length of time that our teacher sample overall spent teaching Year 7. This figure was then disaggregated by the 11 qualification bands, that is teachers’ highest science qualification (as set out in Chapter 6). This was repeated for all year groups and courses. From this, we have been able to determine – for our sample – the proportion of time taught by teachers with the various levels of qualifications in science and how deployment varies by year group / course. In addition, further analysis was undertaken to consider the actual qualifications held in biology, chemistry and physics for those teaching these elements in double award science, full GCSE courses and AS/A2-levels in these subjects. To this end, three new sets of qualifications bands were drawn up to categorise the samples’ qualifications in each of biology, chemistry and physics. To explain further, taking biology as an example, four qualifications bands were constructed:
1 Degree in biology 2 Initial teacher training in biology 3 Biology A-level 4 No post-16 qualification in biology.
Data for each member of the sample was analysed and each was assigned to one of the bands according to their highest qualification in biology. The time that the sample spent teaching GCSE biology and AS/A2-level biology was then broken down by the biology qualifications bands. This revealed the proportions of time taught in these subjects by teachers with the various levels of qualifications in biology. In addition, the numbers teaching the biology element of GCSE double award science were also disaggregated by the biology bands in order to ascertain their level of qualification in the subject. This process was repeated for chemistry, and then for physics.

Part Two 143
Tables 7.3-7.11 present the results of these analyses. Tables 7.3-7.5 first set out the results for the breakdown of teaching time by the 11 qualification bands that categorise the samples’ highest qualification in science. Later, Tables 7.6-7.11 display the results of the analysis described above for biology, chemistry and physics. Table 7.3 The proportion of time taught to each year group at key stage 3
by teachers’ highest qualification in science: overall sample
Proportion of time taught to each year group
Year 7 Year 8 Year 9 Highest post-A-level qualification in science % Teachers
overall in category % % %
Degree in biology 27 28 28 29 Degree in chemistry 16 16 15 15 Degree in physics 10 9 9 10 Degree in general science 6 5 6 6 Degree in other science 15 15 16 16 B.Sc or BA with QTS or B.Ed in science
11 12 12 12
Cert Ed in science 4 4 4 4 PGCE in science 7 6 7 7 Other post-A-level science qualification
2 1 2 2
A-level science 1 1 <1 <1 No post-16 science qualification
1 1 1 1
No response <1 <1 <1 0 TOTAL 100 100 100 100 Base: 2,756 Source: NFER survey of science teachers, 2005.
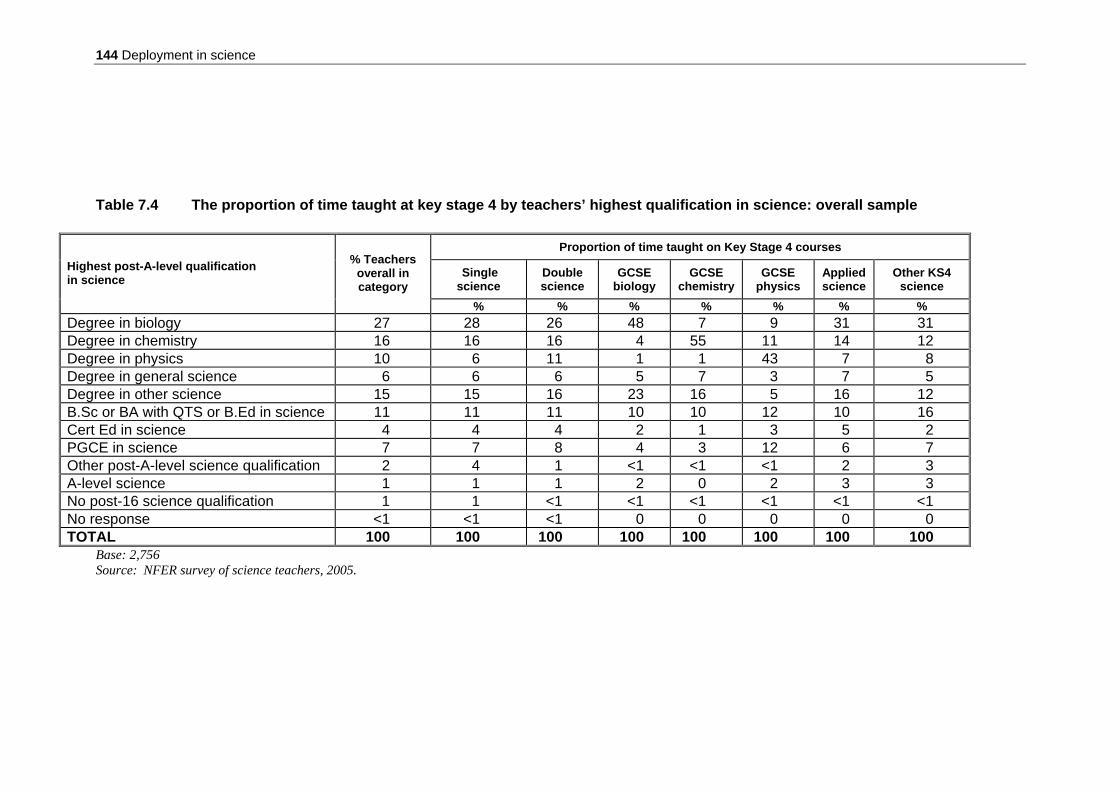
144 Deployment in science
Table 7.4 The proportion of time taught at key stage 4 by teachers’ highest qualification in science: overall sample
Proportion of time taught on Key Stage 4 courses
Single science
Double science
GCSE biology
GCSE chemistry
GCSE physics
Applied science
Other KS4 science
Highest post-A-level qualification in science
% Teachers overall in category
% % % % % % % Degree in biology 27 28 26 48 7 9 31 31 Degree in chemistry 16 16 16 4 55 11 14 12 Degree in physics 10 6 11 1 1 43 7 8 Degree in general science 6 6 6 5 7 3 7 5 Degree in other science 15 15 16 23 16 5 16 12 B.Sc or BA with QTS or B.Ed in science 11 11 11 10 10 12 10 16 Cert Ed in science 4 4 4 2 1 3 5 2 PGCE in science 7 7 8 4 3 12 6 7 Other post-A-level science qualification 2 4 1 <1 <1 <1 2 3 A-level science 1 1 1 2 0 2 3 3 No post-16 science qualification 1 1 <1 <1 <1 <1 <1 <1 No response <1 <1 <1 0 0 0 0 0 TOTAL 100 100 100 100 100 100 100 100
Base: 2,756 Source: NFER survey of science teachers, 2005.

Part Two 145
Table 7.5 The proportion of time taught at post-16 by teachers’ highest qualification in science: 11–18 schools
Proportion of time taught on post-16 courses
A-level biology
A-level chemistry
A-level physics
Other post-16
Highest post-A-level qualification in science
% Teachers overall in category
% % % % Degree in biology 28 61 4 <1 28 Degree in chemistry 18 2 61 5 21 Degree in physics 12 <1 4 53 14 Degree in general science 6 7 4 5 8 Degree in other science 16 22 14 3 15 B.Sc or BA with QTS or B.Ed in science 9 6 10 17 8
Cert Ed in science 3 <1 1 1 3 PGCE in science 6 2 2 13 4 Other post-A-level science qualification 2 <1 <1 2 <1
A-level science 1 <1 0 <1 0 No post-16 science qualification 1 0 0 <1 0 No response <1 0 0 <1 0 TOTAL 100 100 100 100 100 Base: 1,311 Source: NFER survey of science teachers, 2005. 7.3.1 Deployment by science The first point to make in response to the findings that emerge from the tables relates to the imbalance between the three sciences in terms of teachers’ qualifications. Chapter 6 showed the lower numbers of teachers in the sample with a degree in physics or chemistry compared with those holding a biology degree. As Table 7.3 shows, the lower numbers of these teachers means that they taught smaller proportions of science time in each year of key stage 3 and for single award, double award, applied science and other key stage 4 science courses. This would inevitably mean less exposure to specialists in physics particularly and also chemistry, which could perhaps affect students’ perceptions of these sciences and possibly militate against their selecting these sciences for further study. Taking this further, the analysis of the individual sciences by teachers’ qualifications in Tables 7.6-7.11 reveals the following findings. Double award science In terms of the biology, chemistry and physics components of double award science, a substantial minority of those in the sample teaching each element held no qualification in the subject at post-16 level or above (no A-level, no ITT, no degree). As Tables 7.6-7.9 show, this amounted to around one-fifth of the teacher respondents

146 Deployment in science
teaching double award biology and chemistry, and two-fifths of those taking double award physics. Of the three though, the biology element of double award science was best served regarding the proportion of teachers who taught this and had specialised in this science. Around two-thirds of those teaching double award biology in the teacher sample had a biology degree or had qualified to teach this at ITT. In contrast, of those teaching double award chemistry in the teacher sample, two-fifths had studied chemistry at degree level or by ITT. The figures were lower still for physics: less than one-third of those teaching the physics element of double award science had a specialised in this subject at degree-level or at ITT. Indeed, here physics specialists were actually outnumbered by the proportion of staff who taught double award physics yet held no qualifications at post-16 level or above in the subject (no A-level in physics or higher). In 11-16 schools, the low numbers of physics-specialists teaching this element of double award science was particularly striking. In the teacher sample in these schools, half of those teaching this part of the course did not have a qualification in physics at post-16 level (i.e. no A-level) or above. In fact, just eight per cent of those teaching double award physics held a physics degree with a further 15 per cent having undertaken an ITT course during which they specialised in physics. Table 7.6 The proportion of teachers who teach double award biology by
teachers’ highest qualification in biology
Double award biology Highest qualification in subject %
Degree in biology 37 Biology at ITT 27 A-level in biology 18 No post-16 qualification in biology 19 TOTAL 100 Base: 1,240 Due to rounding, percentages do not sum to 100 Source: NFER survey of science teachers, 2005.

Part Two 147
Table 7.7 The proportion of teachers who teach double award chemistry by teachers’ highest qualification in chemistry
Double award chemistry Highest qualification in subject
% Degree in chemistry 21 Chemistry at ITT 18 A-level in chemistry 41 No post-16 qualification in chemistry 21 TOTAL 100 Base: 1,287 Due to rounding, percentages do not sum to 100 Source: NFER survey of science teachers, 2005. Table 7.8 The proportion of teachers who teach double award physics by
teachers’ highest qualification in physics
Double award physics Highest qualification in subject %
Degree in physics 16 Physics at ITT 15 A-level in physics 29 No post-16 qualification in physics 40 TOTAL 100 Base: 1,201 Due to rounding, percentages do not sum to 100 Source: NFER survey of science teachers, 2005. GCSE biology, chemistry and physics Compared with double award science, deployment of teachers to pupils taking GCSE biology, chemistry and physics shows a move towards more specific specialist deployment. Of those teaching these GCSE courses in the sample, substantially more had a degree or ITT specialism in the relevant science than was the case for the double award elements of biology, chemistry and physics. For example, 71 per cent of those taking GCSE physics in this sample had a post-A-level qualification in the subject compared with 31 per cent of those teaching double award physics (as Table 7.8 shows). As well as the proportion of people teaching each science course, the questionnaire also probed the amount of time that teachers spent teaching GCSE biology, chemistry and physics (and the A-level sciences). The results are presented in Table 7.9–.7.11 and reveal that, for example, in this sample 75 per cent of the time in GCSE physics was spent with a teacher with a degree in physics or who undertook ITT in this subject. The same pattern is true for biology and chemistry, although the proportion is again affected by the number of teachers available within each subject specialism. Thus, because of their larger numbers, 84 per cent of GCSE biology time was taught by those with a post-A-level qualification in the subject compared with the 75 per cent for GCSE physics and 80 per cent for GCSE chemistry.

148 Deployment in science
AS/A2-level biology, chemistry and physics In this sample, the vast majority of the teaching time in each of A-level biology, chemistry and physics – around 90 per cent – was taken by those with a degree in the particular science or who had specialised in this as part of their ITT. None the less, this still left around 10 per cent of the time (13 per cent in A-level physics) – not an insignificant amount – to be taught by those who either held no qualifications at post-16 level or above in the science or whose highest qualification in science was itself A-level. Further, if we consider A-level sciences solely in terms of the time taught by those with a degree in the specific science, it can be seen that in this sample the majority of the time – though by no means the overwhelming majority – was taught by those with a degree:
• 59 per cent of the time spent teaching A-level biology was taught by those with a degree in biology
• 60 per cent of the time spent teaching A-level chemistry was taught by those with a degree in chemistry
• 52 per cent of the time spent teaching A-level physics was taught by those with a degree in physics.
Table 7.9 The proportion of biology time taught by teachers’ highest
qualification in biology
Proportion of time taught on biology courses GCSE biology:
all schools A-level biology: 11–18 schools
Highest qualification in biology
% % Degree in biology 48 59 Biology at ITT 37 31 Biology A-level 11 7 No post-16 qualification in biology 5 3 TOTAL 100 100 Base: GCSE biology: all schools = 159; A-level biology: 11-18 schools = 379 Source: NFER survey of science teachers, 2005.

Part Two 149
Table 7.10 The proportion of chemistry time taught by teachers’ highest qualification in chemistry
Proportion of time taught on chemistry courses
GCSE chemistry: all schools
A-level chemistry: 11–18 schools
Highest qualification in chemistry
% % Degree in chemistry 52 60 Chemistry at ITT 28 31 Chemistry A-level 13 8 No post-16 qualification in chemistry 7 <1 TOTAL 100 100 Base: GCSE chemistry: all schools = 138; A-level chemistry: 11-18 schools = 254 Source: NFER survey of science teachers, 2005.
Table 7.11 The proportion of physics time taught by teachers’ highest
qualification in physics
Proportion of time taught on physics courses GCSE physics:
all schools A-level physics: 11–18 schools
Highest qualification in physics
% % Degree in physics 43 52 Physics at ITT 32 35 Physics A-level 15 8 No post-16 qualification in physics 10 5 TOTAL 100 100 Base: GCSE physics: all schools = 145; A-level physics: 11-18 schools = 229 Source: NFER survey of science teachers, 2005. 7.3.2 Deployment of teachers without post-A-level science
qualifications Similar to the pattern found in maths, teachers without a post-A-level qualification in science taught all year groups and courses throughout key stages 3 and 4, although there are fewer teachers teaching science who fall into this qualification band than was the case with mathematics. Unlike maths, the science questionnaires did not specifically include items on the ability grouping that teachers taught, but the data still provides some clues to this. At key stage 4 there exists a hint that these teachers are more likely to be deployed to lower ability groups. As Table 7.4 shows, three per cent of the time spent teaching applied science or other key stage 4 courses (e.g. entry-level science) was delivered by teachers without a post-A-level science qualification, admittedly a small amount of the time but a greater proportion than would have been expected.

150 Deployment in science
Case study Practice in deployment of staff to deliver the curriculum
For one head of science in a 11–16 school, deployment was a case of matching the capabilities of staff to the course and pupils. Deliver the curriculum and raise achievement ‘The qualities and skills of the teachers is crucial when I’m deploying staff to particular subject areas. What I will personally look for is the ability of the teacher to really effectively deliver the curriculum, but at the same time raise achievement. Now that doesn’t necessarily mean that they will be a subject specialist in that area, but they will have the ability to actually absorb new information and deliver it effectively. I’ll give you a typical example. Our GCSE applied science course, nobody had taught that before. This is our first year for certification for that. Because it’s a whole spectrum of biology, chemistry and physics, it’s quite difficult to actually assign a particular subject specialist because there’s not equal amounts of biology, chemistry or physics. So the colleague I chose for this would be the one who is good at organising the coursework aspect of it because 60 per cent was coursework and who would also be confident in delivering all of the three subjects. So the deployment was mainly based on the ability of the staff and the qualities they had to actually raise achievement and confidently deliver the curriculum – but not necessarily to be a specialist in a particular area’ (head of science, 11–16 school). In one 11–18 school, the head of department considered carefully the nature of each individual class, and matched the teacher to pupil needs. Matching the teacher to the needs of each class ‘Good practice is good teaching skills, behaviour management and the management of the pupils’ needs. I have to look at how people manage the needs of the pupils. If I’m looking at Year 9, I might give the top Year 9 to a teacher who is not so good, but the kids will work for them and they can get the kids to work to get the levels that they deserve. There might be one or two casualties, but nothing serious. The same is true for key stage 4. If I put a slightly weaker teacher for separate science you might have casualties such as an A or B, instead of an A*. These are casualties that you can live with as a department, but I have to pay attention that I don’t get too many’ (head of science, 11–18 school). However, the deployment of staff was revisited regularly throughout the year and pupils would be moved in order to attain better with a different teacher. ‘I tend to know the examination classes quite well. That is one priority: I make sure I know my examination classes even if I’m not teaching half of them. Once I look at the modular results I can tell if something is not right because if I go back and look at Year 9, level 5 or 6, and I go back to key stage 2 and see level 5, and then I look at the modular results and see a ‘C’ then I know something is not right there and I investigate. Sometimes you have a teacher who looks efficient but then you look at the results and they don’t add up. Sometimes you can find an EAL (English as an additional language) student with enough English to be in separate science as long as a good teacher picks that up, so then I move them’ (head of science, 11–18 school).

Part Two 151
7.4 Strategies for alleviating staff shortages This section now considers the sample’s experience of shortages of science-specialist teaching staff and the strategies used to remedy such shortages. Firstly, both heads of department and teachers were asked to consider the extent to which their department had suffered from shortages of science-specialist teaching staff over the previous three years, or the time in which they had been at the school if shorter. Of the 744 heads of science departments who responded to this survey question, just over one-quarter (27 per cent) responded that their department had experienced ‘a great deal’ of difficulty in this area and more than half of departments had experienced shortages ‘quite a lot’ or ‘a great deal’. Thirteen per cent of heads of science departments (just slightly more than the proportion of maths departmental heads) responded that they had not experienced any shortages of specialist teaching staff. Of the science teachers who responded to this question in the teacher survey, eight per cent were not sure of the extent to which their department had been affected by such shortages. However, almost one-third of teachers reported their department had experienced ‘quite a lot’ of difficulty and almost one-quarter cited ‘a great deal’. Thirteen per cent of teachers reported that their departments had not experienced any difficulties, the same proportion of heads of science departments suggesting that, unlike mathematics, teachers and heads of science departments tended to concur with respect to the extent to which their departments had suffered from shortages of science-specialist teaching staff. The head of department sample was then asked to indicate the frequency with which they employed a number of pre-selected strategies in order to alleviate staff shortages. Respondents could choose from four responses: ‘frequently’, ‘sometimes’, ‘rarely’ and ‘never’. Table 7.12 displays their responses to this question.

152 Deployment in science
Table 7.12 Strategies used by heads of science departments to alleviate staff shortages
Frequency
Frequently Sometimes Rarely Never No response
Strategies to alleviate staff shortages
% % % % % Use science-specialist supply 25 39 17 15 5 Use non-science-specialist supply 24 36 15 21 5 Increase science teachers’ timetables 10 34 19 31 5 Use teachers of other subjects 10 31 22 31 6 Increase science class sizes 10 21 19 43 7 Use student teachers to teach sciences 6 17 13 56 8 Use support/technicians to teach science 3 7 7 76 7 Increase NQTs’ timetables 3 9 16 65 7 Reduce no. of timetabled lessons 2 9 7 74 7 Base: 754 Source: NFER surveys of heads of science departments, 2005. Unlike heads of mathematics who most frequently used teachers of other subjects in order to cope with shortages of specialist teaching staff, the most common strategy employed by heads of science was the use of supply teachers, especially specialist cover (around three-fifths responded that these strategies were used ‘frequently’ or ‘sometimes’). Increasing science teachers’ timetables (44 per cent) was also a strategy used more often than deploying teachers from other subjects (41 per cent). Less frequently used strategies included using student teachers (23 per cent), increasing NQTs’ timetables (12 per cent) and reducing the timetabled number of science lessons for pupils (11 per cent). The use of support staff to remedy staff shortages was reported less often than it had been in maths. Respondents were given the opportunity to report any ‘other’ strategies that they had employed in order to alleviate shortages. The range of strategies cited by the heads of 27 science departments included making changes to the timetable in six cases, employing non-science specialists in four cases, exploiting links with ITT institutions, recruiting overseas teachers, rotating staff, reducing the number of courses offered by the department and using members of the senior management team to teach sciences.

Part Two 153
Case study Strategies used in the case-study science departments to alleviate staff shortages
Using local knowledge ‘Two science teachers who are now coming to the end of their third year of teaching were students here and although I advertised nationally and locally, none of them applied. We had to go head-hunting them and to get messages out to them to come in and talk to us. We had to be really proactive in dragging them in and we knew they were good and would fit into the department’ (deputy headteacher, 11–16 school). Forging links with Initial Teacher Training institutions ‘I think being involved with ITT and having students is a good recruitment strategy. Not only might we meet students who want to be at this school, but they go out and spread the word about the school and that’s a pretty secure way of recruiting and I think it’s more productive than national adverts in any subject area’ (member of senior management team,11– 16 school). Using non-specialists from other departments ‘Having a non-specialist in the department poses a great challenge, especially if they’ve never taught science before. We have a departmental handbook which basically gives the organisation of the department and how the department runs in terms of learning and teaching so we have to provide INSET to the individuals concerned to allow them to deliver the subject area they need to deliver’ (head of science, 11-16 school). Recruiting flexibly ‘Two years ago we interviewed on the same day for a maths teacher and two science teachers. In fact, we didn’t appoint for maths, we appointed three physicists and the agreement between the three of them was that they would share the burden of that maths appointment. (headteacher, 11–18 school). Using local knowledge ‘We’ve had a good relationship with our science adviser at the LEA. He was in on the interviews [for a head of science post] and was able to help us with his local knowledge and we appointed an AST that had been working in another local school. So we had that network to be able to put the word out. We have a belief that this person will go onto senior leadership, and I would think the three to five years that s/he may work in this school will be a real boost to the department’ (headteacher, 11–18 school). Offering extra responsibilities/opportunities for development ‘I used to work with [this teacher] at my previous school. S/he was at the verge of changing jobs in that school and I said, “‘Why don’t you apply? I’m advertising for a key stage 3 coordinator?” There were opportunities for her/him here which were not in the previous school – here s/he will have more experience of management and we have the potential to offer her/him more in development as a person’’ (head of science, 11–18 school). Overseas recruitment One head of department in an 11–18 school had recruited several times from overseas. This was done through an agency that recruits teachers from Jamaica. Interviews were done over the telephone and by video link. Success was mixed, while some teachers had proved to be excellent, others had been weaker. However, weaknesses were overcome through internal departmental support.

154 Deployment in science
7.5 Concluding comments The previous chapter showed the imbalance in the representation of the three sciences and this chapter has documented how this was reflected in teaching time. The lower numbers of teachers with a degree in physics or chemistry (compared with those holding a biology degree) meant that they taught smaller proportions of science time throughout key stage 3 and for GCSE single award and double award science. For example, in the teacher sample, physics specialists who taught the physics element of GCSE double award science were actually outnumbered by the proportion of staff who also taught this yet held no qualifications at post-16 level or above in the subject (no A-level, no degree, no ITT). This seems a cause for concern in the light of recent research that found an association between specialist teaching and pupil performance in physics (Smithers and Robinson, 2005a). In addition, that students have less exposure to specialists in physics and chemistry could affect their perceptions of these sciences and possibly dissuade them from selecting them for further study.

Part Two 155
8 The contribution of technicians and support staff in science departments
Key findings
• All but one of the heads of science surveyed recorded having at least one science technician working with their department.
• On the whole, heads of science reported that technicians rarely undertook work with pupils to support learning in class.
• All but three per cent of the heads of science surveyed indicated that their department received some in-class support from support staff (e.g. from teaching assistants, learning support assistants). However, in contrast, 12 per cent of teachers reported receiving no in-class support.
• Heads’ of department and teachers’ satisfaction ratings for the amount and quality of technical assistance received were consistently higher than those for in-class and administrative support.
• Heads of department were asked to report if there were any support staff (other than technicians) working only within the science department. The majority (80 per cent) of science departmental heads recorded that, save technicians, they did not have any support staff attached solely to their department, with the remainder reporting at least one member of support staff dedicated only to science. These science-dedicated support staff were rarely perceived to be specialists in the subject in terms of their background or training.
• Analysis revealed that where departments had dedicated support staff, departmental heads were significantly more satisfied with the amount and quality of in-class support and administrative support they received.
156 Deployment in science
8.1 Introduction This section looks at the contribution of technicians and other support staff (e.g. teaching assistants, learning support assistants and departmental assistants) working in science departments. The discussion draws on survey data from heads of department and science teachers. The chapter is structured as follows: Section 8.2 Numbers of science technicians Section 8.3 Tasks undertaken by science technicians Section 8.4 Numbers of other support staff working in science departments Section 8.5 Tasks undertaken by other science support staff Section 8.6 Satisfaction with science technicians and support staff Section 8.7 Developing the contribution of support staff Section 8.8 Concluding comments 8.2 Numbers of science technicians Heads of department were asked to report the number of technicians working with the science department. Of those heads of science who responded (738), all but one recorded having at least one science technician working with their department. The number of technicians ranged from 1 to 9, with the most common being two technicians per department. 8.3 Tasks undertaken by science technicians This section examines the range of tasks carried out by technicians. Departmental heads were asked to rate how often technicians undertook specified tasks in their department using a response scale comprising ‘frequently’, ‘sometimes’, ‘rarely’ and ‘never’. Table 8.1 details their responses.

Part Two 157
Table 8.1 Head of departments’ ratings of the amount of support science departments received from technicians
Frequently Sometimes Rarely Never No response Type of support
% % % % % Stock control 88 10 1 <1 1 Preparing/setting up equipment 88 9 2 <1 1 Preparing resources 61 20 13 5 1 Administrative tasks 35 44 16 5 2 Demonstrating experiments in class 3 20 36 40 1 Working with pupils to support learning in class
2 15 32 51 1
Base: 754 Due to rounding, percentages may not sum to 100 Source: NFER survey of heads of science departments, 2005.
According to departmental heads, the tasks most frequently carried out by technicians were stock control and preparing/setting up equipment. Each of these was frequently carried out by technicians in 98 per cent of departments. Heads of science reported that technicians were much less likely to work with pupils to support learning in class (83 per cent recorded ‘rarely’ or ‘never’) or to demonstrate experiments in class (76 per cent stated ‘rarely’ or ‘never’). As will be shown in the next chapter, which gives technicians’ perspectives on their roles, a number were keen to work more closely with pupils. Technicians’ involvement with pupils, amongst other activities, was observed in schools visited for the case-study phase of the research, as the following vignette exemplifies.

158 Deployment in science
Case study Developing technicians’ role in the science departments
The science department in one secondary school in the south of England had developed the responsibilities of technicians. Four main areas were highlighted. Demonstrating in lessons Experience and qualifications in a related subject meant that technicians were able to demonstrate experiments to pupils in-class.
‘I have electronic qualifications … so anything involving electricity, wiring, circuits and things like this, we tend to get asked to come in and check things over with the children. For the applied science course, I spent a lot of time in there with the children working with them, because I’ve probably got more experience with working in industry and doing these things than anybody else’ (science technician).
‘They [technicians] are also involved in preparing for the A-level practical exams. They work quite closely with the beginning teachers because we have beginning teachers every year so they tend to help them quite a lot, with preparation for practical work’ (head of department). Administrative support In addition to in-class support, the technicians had an administrative role within the department. This included an overview of the departmental budget and entering pupil data.
‘I look after the budget, keep an eye on what we’re spending. We have our own computer programme which duplicates basically what Accounts are doing, but I can feed into it what I like’ (science technician).
‘We keep our own independent records of end of topic tests, end of term tests, modular results, GCSE results. We input the data. I developed the program ten years ago’ (science technician). Links with primary schools The technician also fostered links with local primary schools.
‘We go to a primary school for Science Week. We had a few demos, which were a little hazardous, but I could stand in with the video camera linked to a projector. So if the kids couldn’t get close enough or couldn’t see it, they could look at it on the big screen…’ (science technician). Information Communications Technology Technicians had a key role in assisting with ICT-related issues (e.g. assisting pupils and teachers with white boards, video conferencing and other audio-video work).
‘We’re putting schemes of work on to DVDs and chapterising them just as you would with a commercial DVD, which is a step forward as far as we’re concerned’ (science technician).
8.4 Number of other support staff working with
science departments In the course of their questionnaires, heads of science were also asked about the assistance their department received from support staff other than technicians (e.g. teaching assistants, learning support assistants and departmental assistants).
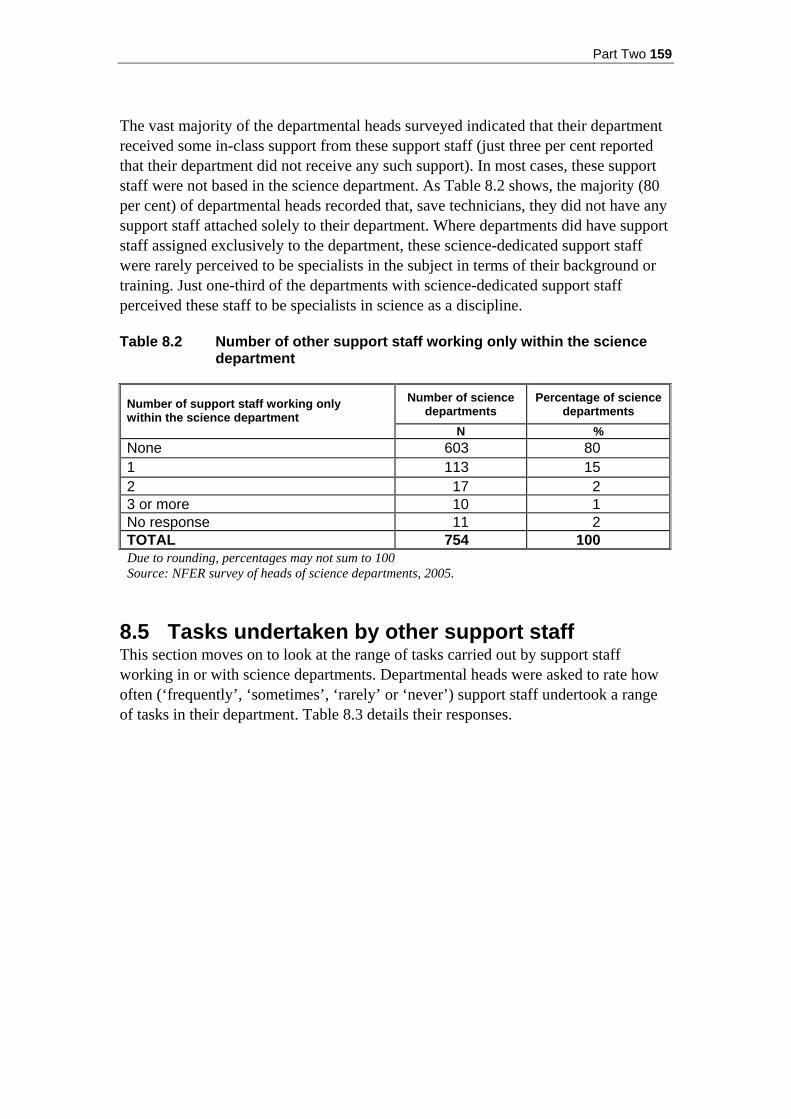
Part Two 159
The vast majority of the departmental heads surveyed indicated that their department received some in-class support from these support staff (just three per cent reported that their department did not receive any such support). In most cases, these support staff were not based in the science department. As Table 8.2 shows, the majority (80 per cent) of departmental heads recorded that, save technicians, they did not have any support staff attached solely to their department. Where departments did have support staff assigned exclusively to the department, these science-dedicated support staff were rarely perceived to be specialists in the subject in terms of their background or training. Just one-third of the departments with science-dedicated support staff perceived these staff to be specialists in science as a discipline. Table 8.2 Number of other support staff working only within the science
department
Number of science departments
Percentage of science departments Number of support staff working only
within the science department N %
None 603 80 1 113 15 2 17 2 3 or more 10 1 No response 11 2 TOTAL 754 100 Due to rounding, percentages may not sum to 100 Source: NFER survey of heads of science departments, 2005.
8.5 Tasks undertaken by other support staff This section moves on to look at the range of tasks carried out by support staff working in or with science departments. Departmental heads were asked to rate how often (‘frequently’, ‘sometimes’, ‘rarely’ or ‘never’) support staff undertook a range of tasks in their department. Table 8.3 details their responses.

160 Deployment in science
Table 8.3 Head of departments’ ratings of the amount of support science departments received from other support staff (e.g. teaching assistants / departmental assistants)
Frequently Sometimes Rarely Never No
response Task (%) (%) (%) (%) (%)
Supporting the learning of an individual in class
55 35 6 3 1
Supporting the learning of small groups in class
29 44 16 9 2
Providing behaviour management support in class
10 30 32 25 2
Preparing resources 10 20 26 42 2 Administrative support 7 17 23 51 2 Managing the class whilst the teacher works with individuals
1 5 28 64 2
Marking <1 2 9 88 2 Base: 754 Due to rounding, percentages may not sum to 100 Source: NFER survey of heads of science departments, 2005.
According to departmental heads, the tasks most frequently carried out by support staff were those related to providing in-class support, including supporting the learning of an individual (90 per cent recording ‘frequently’ or ‘sometimes’) as well as small groups (73 per cent stating ‘frequently’ or ‘sometimes’). Those tasks seen to be undertaken by support staff far less often included administrative support, managing the class whilst the teacher worked with individuals and, in particular, marking. 8.6 Satisfaction with science technicians and
support staff This section considers both departmental heads and science teachers’ satisfaction with the assistance received from all support staff. In their questionnaires, both heads of department and teachers were firstly asked if they received technical, in-class and administrative support.
• All departmental heads and teachers reported receiving technical support. • With regard to in-class support, as was the case with maths, there was
some difference – though not as pronounced – between the proportions of departments and teachers in receipt of such assistance. According to departmental heads’ responses, three per cent of science departments did not receive any in-class support. In contrast, among the sample of science teachers, 12 per cent reported receiving no support of this type.
• In terms of administrative support, eight per cent of departments and nine per cent of teachers received no such assistance.

Part Two 161
Those respondents in receipt of support were asked to rate their satisfaction on a 5-point scale from 1 = very dissatisfied to 5 = very satisfied. The amount and quality of technical, in-class, administrative assistance was considered, and the results are presented in Tables 8.4 and 8.5. Table 8.4 Heads of departments’ satisfaction ratings of the assistance their
department receives from support staff
Ratings of satisfaction on a scale of 1-5 % of Respondents
1 Very
dissatisfied
2 3
4 5 Very
satisfied
N
% % % % % Amount of technical support 6 9 14 35 37 Quality of technical support 754 5 6 15 33 42 Amount of in-class support 6 22 41 26 5 Quality of in-class support 735 4 16 36 35 10 Amount of administrative support
14 28 28 22 8
Quality of administrative support
691 9 17 27 33 15
Due to rounding, percentages may not sum to 100 Source: NFER survey of heads of science departments, 2005.
Table 8.5 Science teachers’ satisfaction ratings of the assistance their
department receives from support staff
Ratings of satisfaction on a scale of 1-5 % of Respondents
1 Very
dissatisfied
2 3
4 5 Very
satisfied
N
% % % % % Amount of technical support received
3 9 16 32 41
Quality of technical support received
2,754 3 9 15 30 43
Amount of in-class support 5 22 38 26 9 Quality of in-class support 2,430 3 14 33 35 15 Amount of administrative support
10 30 33 21 7
Quality of administrative support
2,506 8 17 33 30 12
Due to rounding, percentages may not sum to 100 Source: NFER survey of science teachers, 2005.
Table 8.4 shows that the amount and quality of technical assistance received was consistently rated higher than in-class and administrative support. Around three-

162 Deployment in science
quarters of the heads of departments and teachers in the sample expressed satisfaction with the amount and quality of the technical support received (a rating of 4 or 5 out of 5). Of those in receipt of assistance, around one-third of departmental heads and teachers were broadly satisfied with the amount of in-class support received. Their ratings of the quality of in-class support were higher, with 45 per cent of science heads and half of science teachers giving a rating of 4 or 5. Ratings of the amount and quality of in-class support were a little lower for science than they were for maths. Of those who were in receipt of administrative assistance from support staff, less than one-third of science heads and science teachers were satisfied with the amount received (i.e. they circled 4 or 5 out of 5) and less than half of both samples were satisfied with the quality. As noted earlier, just one-fifth of heads of science reported having at least one member of support staff attached solely to their department. However, analysis revealed that where departments did have such science-dedicated support staff, heads were significantly more satisfied with the amount and quality of in-class and administrative support received. For example, over half (59 per cent) of heads of department with science-dedicated support staff were generally satisfied with the quality of administrative support they received, in contrast to 44 per cent of those without such science-dedicated assistance. When the responses of science teachers in departments with and without dedicated support staff were compared, small but significant differences were found in relation to the quality of administrative support received. Finally, unlike maths, there was no association between satisfaction and the presence of science-dedicated support staff who were specialists in the subject itself, either through background or training. 8.7 Developing the contribution of support staff In total, 513 heads of science (68 per cent) made suggestions as to how they would like to see the role of support staff develop in their departments. Their responses covered the same broad themes as were cited by heads of maths, with the addition of a fifth area relating specifically to science technicians:
• the need for support staff to be dedicated solely to the science department or at least to be more closely involved with the department
• more support staff time • increased administrative assistance from support staff • higher calibre of support staff including their general skills and knowledge • the need for more support both from and for technicians.
The first of these themes (the need for support staff to be dedicated solely to the department or at least more closely involved) was identified by 17 per cent of
Part Two 163
respondents. In particular, ten per cent of heads of science specifically expressed a desire for science-dedicated support staff; indeed, this was the most frequently cited area of development. Enabling support staff to attend departmental meetings, greater liaison between support staff and science departments and greater departmental control over deployment were other nominations for developing contributions. The second theme related to the need for more support staff time (15 per cent of respondents) in learning assistance, both in and out of class. In this respect, heads of department felt that support staff’s contribution could be further developed by them taking groups (e.g. for revision sessions) and whole classes as well as greater provision of individual support of specific pupil types (such as, gifted and talented pupils and pupils with special educational needs). A third theme was the need for more administrative assistance from support staff, (13 per cent of respondents).This included more support in the areas of data entry, preparing resources and displays of pupils’ work. In addition, heads of department noted the need for a higher calibre of support staff in terms of their skills and knowledge (11 per cent of respondents). The following areas for development were noted: increased subject, curriculum and teaching knowledge and more specifically increased ICT knowledge. Finally, the need for more support both from and for technicians was noted. Included in this category was the desire for technicians to provide more in-class support as well as more equipment-related support, and the need for more technician training to be available.

164 Deployment in science
Case study Departmental-dedicated cover supervision
In one science department in an 11–16 school, one of the technicians has a dual role of science technician and cover supervisor for the department. The benefits of cover supervisors based in the department Because the cover supervisor is based in the department, there is time for the teacher to speak to them prior to the lesson to ascertain the tasks that the cover supervisor feels confident to undertake. As a technician, the cover supervisor has knowledge of the schemes of work and has a background in science. Further, because s/he is known to the pupils, behaviour is perceived to be better during the lessons s/he supervises than it would be with a supply teacher.
‘Teachers have already planned the lesson, but even if they haven’t, I know by giving out the equipment what units of work they are working on because each year group follows a unit of work right the way through. So the work is set and I just go in and deliver the lesson’ (science cover assistant/technician).
‘In the science department the children are more familiar with [the cover assistant/technician] so their behaviour is better and s/he seems to get more work out of them that a normal supply teacher would and because s/he is ‘science’, s/he understands it and s/he can explain it better to them – s/he has been fantastic’ (science teacher). Support staff training ‘S/he’s receiving in-house INSET with the other cover assistants … some of the INSET has been very similar to what teachers would get in Initial Teacher Training – the three-part lesson and what they would have to do when the work is left and set for the pupils, so they won’t actually have to plan a lesson themselves … It’s an ongoing INSET programme on a weekly basis that’s allowing us to build a strong team of staff who can actually provide continuity in the school and in particular in the science department. It’s a strong, positive step for us’ (head of science).
8.8 Concluding comments Analysis presented in this chapter has shown that heads’ of department and teachers’ satisfaction ratings for the amount and quality of technical assistance received were consistently higher than those for in-class and administrative support. None the less, the evidence did highlight the value of the contribution of support staff (e.g. teaching assistants, administrative assistants) who undertook these roles, especially where they worked solely in the science department, although findings would suggest that at present this occurred in only a minority of cases. Thus, as in mathematics, there was evidence in favour of having a member of support staff based in the science department in all schools.

Part Two 165
9 Views of technicians and other support staff working with science departments
Key findings Science technicians
• The vast majority of science technicians (87 per cent) worked only within the science department and worked with all three sciences in fairly equal measure.
• Just over three-fifths of the sample (63 per cent) were paid term-time only and around half of the sample (49 per cent) worked full time.
• Around two-fifths of respondents (44 per cent) reported that they had spent five years or less in their current role at the time of the survey. Around one in three technicians (29 per cent) had spent five years or less working as a technician in education.
• The majority of respondents (81 per cent) had a qualification in science equivalent to GCSE grade C or above. Thirty-seven per cent of respondents had a qualification in maths / numeracy equivalent to GCSE grade C or above. Similarly, 39 per cent held a qualification in English at this level or above.
• Those tasks most frequently carried out in science departments by technicians included the preparing/setting up equipment in class, maintaining equipment and materials, and upkeep of the laboratories to maintain health and safety.
• On the whole, the majority of technicians rarely carried out learning support tasks in the science department. None the less, there was a significant minority (one-third and upwards) who at least sometimes demonstrated experiments or worked with groups or individuals in class. Where technicians were keen to take on further roles or duties in the science department, the most frequent response was for a greater involvement with pupils.
• One in three technicians had never been included in either the science department or whole-school development/training sessions that took place for teachers.
• Just over three quarters of technicians (77 per cent) however reported that they had received professional development/training sessions specifically for their role or about science in general.
Science support staff
• Thirteen of the 42 support staff worked only with science departments. • Examination of respondent’s qualifications revealed that the majority met the
minimum requirements for HLTA status. • The most frequently cited highest qualification in science was O-level grades A-
C or passes with just under one-third of respondents (14) citing this as their highest qualification in the subject.

166 Deployment in science
9.1 Introduction This chapter firstly draws on survey data from 187 technicians working with science departments and includes details of the characteristics of technicians and the tasks they undertake, the numbers of support staff attached exclusively to the science department and the professional development opportunities that support staff have available to them.
The chapter then moves on to discuss the experiences of other support staff working with science departments (e.g. teaching assistants, learning support assistants and departmental assistants). To this end, it relays findings from a telephone and questionnaire survey conducted with 42 such support staff. The structure of Chapter 9 is as follows: Section 9.2 Characteristics of technicians working in science departments Section 9.3 Tasks undertaken by technicians working in science departments Section 9.4 Supporting other departments Section 9.5 Professional development for technicians in science departments Section 9.6 Views of other support staff working in science departments Section 9.7 Concluding comments Given the size of the samples (187 technicians and 42 support staff), the findings in this section should be regarded as illustrative rather then representative of the national picture. 9.2 Characteristics of technicians working with
science departments This section considers the characteristics of science technicians working with science departments, including:
• gender/age • job title • contract type • length of time in current role • previous careers • line management • qualifications.

Part Two 167
9.2.1 Gender/Age Of the 187 respondents, the vast majority of technicians working with science departments were female (83 per cent). Respondents spanned a wide age range from the youngest at 18 to the eldest at 75 years of age. As Table 9.1 illustrates, around one-sixth of the science technicians were less than 39 years of age with three-quarters of respondents in the 40 to 59 age bracket. In contrast to support staff working in mathematics departments, there were a higher percentage of males in the science technician sample. Furthermore, the average age of science technicians was higher than that of support staff working with mathematics departments.
Table 9.1 Age range of technicians working with science departments
Number of technicians working with science
departments
Percentage of technicians working with science
departments Age range
(N) (%) Under 20 1 <1 20-29 8 4 30-39 21 11 40-49 69 37 50-59 72 38 60+ 13 7 No response 3 2 TOTAL 187 100 Due to rounding, percentages may not sum to 100 Source: NFER survey of technicians working with science departments, 2005.
9.2.2 Job title In the survey, respondents were asked to state their current job title. The most common was that of ‘science technician’ (56 per cent) followed by ‘senior technician’ (41 per cent). Other job titles included: (one respondent in each case) administrative assistant, curriculum assistant and health safety officer.
9.2.3 Contract type Technicians working with science departments were asked to report the type of contract they held (permanent or temporary), whether they worked full-time or part-time and if they were paid for term-time only or for the whole year (including school holidays). Nearly all of those surveyed held a permanent contract with only one per cent with a temporary post. Around half of the sample (49 per cent) worked full time. Just over three-fifths of the sample (63 per cent) were paid for term-time only (although their pay was spread evenly throughout the whole year).

168 Deployment in science
9.2.4 Length of time in current role In the survey, technicians were asked to report the approximate length of time they had spent working as a science technician in their current school and working as a science technician in education. As Table 9.2 shows, just over two-fifths of respondents (44 per cent) reported that they had spent five years or less in their current role at the time of the survey. Around one in three technicians (29 per cent) had spent five years or less working as a technician in education. Table 9.2 Length of time science technicians reported working in their
current role and as a science technician in education
Time spent working as a technician in your current role
Time spent working as a technician in
education Length of time
(N) (%) (N) (%) 0–5 years 82 44 54 29 5 years 1 month –10 years 39 21 31 17 10 years 1 month –15 years 19 10 11 6 15 years 1 month – 20 years 29 16 14 7 20 years 1 month – 25 years 7 4 17 9 25 years 1 month – 30 years 6 3 8 4 30 years 1 month or more 5 3 13 7 No response 0 0 39 21 TOTAL 187 100 187 100 Due to rounding, percentages may not sum to 100 Source: NFER survey of technicians working with science departments, 2005.
9.2.5 Previous careers The older age profile of science technicians (as noted earlier) may be related to the trend in this group for having a career prior to working as a technician. Just over four-fifths of science technicians surveyed (83 per cent) had had another career. Of those respondents with prior careers, the largest proportions had previously worked as laboratory technicians (36 per cent). Other frequently cited preceding careers were in the area of research/lecturing (14 per cent), administration (12 per cent) and research assistant posts (10 per cent). All previous careers cited are listed below.

Part Two 169
Previous careers (counts)
Laboratory technician (56) Agriculture (3) Lecturing/research (21) Electrical technician (4) Administration (18) Teaching assistant (3) Research assistant (15) Civil service (2) Retail (13) Trades (2) Health related (9) Art related (2) Leisure services (8) Military (1) Industrial supervisor (8) In school (non-teaching) (1) Pharmacy (8) Social related (1) Finance (8) Personnel (1) Teacher (7) Management (1) Pre-school (6) Emergency services (1) Retail management (5) Self employed (1) IT related (5) Creative (1) Engineer (4) Industry (1)
9.2.6 Line management Surveyed technicians were asked to state who their current line manager was. Table 9.3 provides details of their responses. Nearly three fifths (59 per cent) of those surveyed reported their line manager to be the head of the science. One in five science technicians (21 per cent) reported having a senior technician as their line manager. ‘Other’ line managers cited included: the head of a specific science subject (e.g. head of chemistry) (11 respondents); administration manager (6); business manager (3); support staff manager (3); librarian (3) and deputy headteacher (1). Table 9.3 Line managers of technicians
Number of technicians working
with science departments
Percentage of technicians working
with science departments
Line manager
(N) (%) Head of the science department 111 59 Senior / team leader technician 39 21 Assistant head of the science department 1 <1
Other 28 15 More than one box ticked 6 3 No response 2 1 TOTAL 187 100 Due to rounding, percentages may not sum to 100 Source: NFER survey of technicians working with science departments, 2005.

170 Deployment in science
9.2.7 Qualifications Technicians were asked to indicate which types of qualifications they held overall, and also to state the highest qualification they held in science. Tables 9.4 and 9.5 provide details. Table 9.4 Qualifications held by technicians working in the science
department
Number of technicians working with science
departments
Percentage of technicians working with science
departments Qualification type
(N) (%) No qualifications 3 2 CSE 54 29 GSCE grades D-G 9 5 GCSE grades C or above 35 19 O level grades A-C or passes 133 71 A/AS level 83 44 NVQ Level 1 3 2 NVQ Level 2 9 5 NVQ Level 3 10 5 NVQ Level 4 2 1 Degree 49 26 Higher degree 15 8 Other 79 42 TOTAL 187 100 Multiple response question: technicians indicated all the qualifications that they held, therefore percentages do not sum to 100 Source: NFER survey of technicians working with science departments, 2005.
Table 9.5 Highest qualification in science held by technicians working with
science departments
Qualification type Number of technicians working with science
departments (N)
Percentage of technicians working
with science departments
(%) No qualifications 12 6 CSE 13 7 GSCE grades D-G 2 1 GCSE grades C or above 8 4 O level grades A-C or passes 58 31 A/AS level 40 21 Degree 34 18 Higher degree or post-graduate course 11 6 No response 9 5 TOTAL 187 100 Due to rounding, percentages may not sum to 100 Source: NFER survey of technicians working with science departments, 2005.
As Table 9.5 shows, four-fifths of respondents had a qualification in science equivalent to GCSE grade C or above and higher. The most frequently held highest

Part Two 171
qualification in science was O levels (A-C or passes) with just under one-third of the technicians citing this. One in four technicians had either a degree or higher qualification in science. Six per cent had no qualifications in the subject. Fifteen per cent of respondents reported having other qualifications relevant to their current role. The following box provides details of respondents’ other qualifications in rank order and shows that the most common was a general technician qualification. Qualifications related to current role (count)
Technicians qualification (care and guidance) (14)
Other teaching qualification (3)
Equipment handling (8) Certificate of education (2) Other technicians’ qualification (8) PGCE (1) IT qualification (6) Teaching assistants qualification (care and
guidance) (1) Health and safety qualification (6) Other teaching assistants qualification (1) NVQ technicians (5) Degree (other) (1)
9.3 Tasks undertaken by technicians working with
science departments This section goes on to consider the type of tasks undertaken by technicians working with science departments including:
• the frequency with which technicians carry out a range of technical-related tasks
• the frequency with which technicians carry out a range of learning support tasks
• any other duties and responsibilities technicians would like to have in the science department.
9.3.1 Technicial tasks Firstly, technicians were asked how often (if at all) they undertook a range of tasks as a technician in the science department. Table 9.6 details the responses.

172 Deployment in science
Table 9.6 Provision of technical support by technicians working with science departments
Frequently Sometimes Rarely Never/NA No
response Task (%) (%) (%) (%) (%)
Preparing/setting up equipment in class
93 5 2 0 1
Maintaining equipment and materials
90 9 0 1 1
Upkeep of the laboratories to maintain health and safety
87 11 1 1 1
Stocktaking and ordering equipment 80 14 3 2 0 Preparing resources (e.g. photocopying) for teachers
64 23 10 3 0
Providing technical advice to teachers
51 38 8 2 1
Preparing displays of pupils’ work for teachers
10 23 36 30 1
Inputting pupil data for teachers 9 16 20 56 0 Base: 187 Due to rounding, percentages may not sum to 100 Source: NFER survey of technicians working with science departments, 2005.
As Table 9.6 shows, the tasks most frequently carried out in science departments by technicians included the preparing/setting up equipment in class (93 per cent), maintaining equipment and materials (90 per cent) and upkeep of the laboratories to maintain health and safety (87 per cent). In contrast, over half of technicians had never input pupil data for teachers and one in three technicians had never prepared displays of pupils’ work. 9.3.2 Learning support Technicians were asked how often (if at all) they provided a range of learning support tasks in the science department. Table 9.7 details their responses. Table 9.7 Learning support-related tasks carried out by technicians
working with science departments
Frequently Sometimes Rarely Never/NA No response Task
(%) (%) (%) (%) (%) Demonstrating experiments in class
5 32 32 31 1
Working with groups or individuals in class
5 27 33 36 0
Taking whole classes 1 5 10 84 2 Base: 187 Due to rounding, percentages may not sum to 100 Source: NFER survey of technicians working with science departments, 2005.

Part Two 173
Table 9.7 shows that on the whole the majority of technicians rarely carried out learning support tasks in the science department. None the less, there was a significant minority (one-third and upwards) who at least sometimes demonstrated experiments or worked with groups or individuals in class. In addition, 40 respondents reported carrying out at least one other type of learning support activity in the science department. The occurring most frequently was assessing pupils’ work (9 responses). The other forms of learning support cited are listed in the box. Other forms of learning support provided (counts)
Assessing pupils’ work (9)
Supporting new teachers (4)
One-to-one work with pupils out of class (4)
Work with pupils with SEN (3)
Cover lessons (3)
Demonstrating equipment (3)
Field trips (2)
Supporting pupils with ICT (2)
Exam invigilation /administration (1)
Setting cover work (1)
Differentiating resources (1)
Creating resources (1)
Teaching extra lessons (1)
Personal support (1)
Health and safety (1)
9.3.3 Other duties and responsibilities technicians would like
to undertake In the survey, technicians working with science departments were asked, ‘In addition to the duties you currently undertake, please state the other duties or responsibilities you would like to carry out in the science department’. In total, 57 technicians answered this and their most frequent response was to have a greater involvement with pupils (17 responses). Others included: delivering practicals (9 responses) and planning lessons (7 responses). This would suggest a desire amongst some technicians to carry out more tasks directly related to supporting teaching and learning. However, almost one in ten reported that they did not want to undertake any other additional duties or responsibilities in the science department. 9.4 Supporting other departments The vast majority of science technicians (87 per cent) worked only within the science department. In total, 25 of the 187 respondents reported working across the school, and when asked to state the other areas or departments in which they worked, the most common response was equipment (7 responses) followed by ICT and examinations (4 responses respectively). As Table 9.8 shows, technicians worked with all three sciences in fairly equal measure. Those sciences included in the ‘other’ category are listed (in rank order) in the box.

174 Deployment in science
Table 9.8 The sciences that technicians supported
Number of technicians working with science
departments
Percentage of technicians working with
science departments Science
(N) (%) Biology 157 84 Chemistry 164 88 Physics 161 86 Other 22 12 TOTAL 187 100 Multiple response question: respondents could state more than one science, therefore percentages do not sum to 100 Source: NFER survey of technicians working with science departments, 2005.
The other sciences that technicians supported (count)
General science (5)
Rural/agricultural science (2)
Earth science (2)
Environmental science (2)
Combined science (1)
Electronics (1)
Health/social sciences (1)
Geology (1)
9.5 Professional development of technicians working
with science departments This section looks at the professional development opportunities previously and currently being undertaken by technicians working with the science department, including:
• arrangements for performance reviews/appraisals • qualifications being currently undertaken • inclusion in professional development that takes place within the science
department for teachers • participation in training sessions specifically for technicians or about science • specific areas in which technicians would find it useful to receive some
professional development to help them in their role. 9.5.1 Arrangements for performance reviews/appraisals In the survey, technicians were asked if they received a performance review or appraisal and if they had the opportunity to discuss their training and development needs. Around three-fifths of technicians received an annual review or appraisal. Despite this, a greater number (71 per cent) reported that they were able to discuss training/development needs. Most commonly science technicians discussed such training and development needs with the head of department and, to a lesser extent, with the senior technician.

Part Two 175
9.5.2 Qualifications currently undertaken Technicians working with the science department were asked if they were currently undertaking, planning to undertake, already held or had no plans to undertake science technician qualifications; teaching qualifications and other qualifications. Table 9.9 Technicians’ plans to undertake further qualifications
Currently undertaking
Planning to undertake
Already hold
No plans No response Undertaking these
qualifications (%) (%) (%) (%) (%)
Science technicians qualifications
4 10 8 72 7
Teaching qualification
0 5 3 79 13
Other qualification 4 7 2 70 18 Base: 187 Due to rounding, percentages may not sum to 100 Source: NFER survey of technicians working with science departments, 2005.
Table 9.9 shows that the majority of science technicians had no plans to undertake any further qualifications. Where there was an intention, respondents were most often planning to undertake science technician qualifications. The most frequently cited ‘other’ qualification sought by technicians was a degree (7 responses). All ‘other’ qualifications cited are listed in the box. Other qualifications sought by support staff
Degree (7)
Learning support qualification (3)
ICT related qualification (3)
Further/high degree (2)
Pastoral related qualification (1)
NVQ (1)
9.5.3 Professional development opportunities for technicians Technicians were asked to rate how often (‘always’, ‘sometimes’, ‘rarely’, ‘never’) they were included in training sessions that took place within the science department for teachers and also to indicate their participation in professional development/training sessions that took place within the school overall for teachers. Table 9.10 sets out the responses.
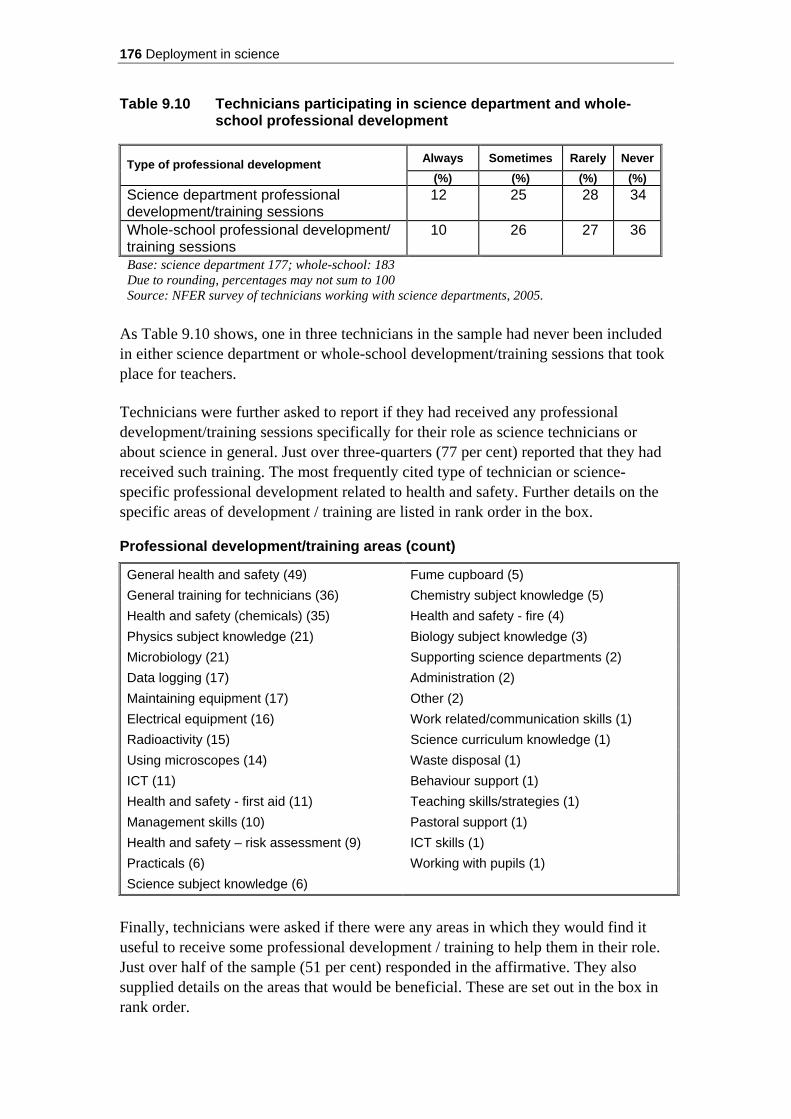
176 Deployment in science
Table 9.10 Technicians participating in science department and whole-school professional development
Always Sometimes Rarely NeverType of professional development
(%) (%) (%) (%) Science department professional development/training sessions
12 25 28 34
Whole-school professional development/ training sessions
10 26 27 36
Base: science department 177; whole-school: 183 Due to rounding, percentages may not sum to 100 Source: NFER survey of technicians working with science departments, 2005.
As Table 9.10 shows, one in three technicians in the sample had never been included in either science department or whole-school development/training sessions that took place for teachers. Technicians were further asked to report if they had received any professional development/training sessions specifically for their role as science technicians or about science in general. Just over three-quarters (77 per cent) reported that they had received such training. The most frequently cited type of technician or science-specific professional development related to health and safety. Further details on the specific areas of development / training are listed in rank order in the box. Professional development/training areas (count)
General health and safety (49) Fume cupboard (5) General training for technicians (36) Chemistry subject knowledge (5) Health and safety (chemicals) (35) Health and safety - fire (4) Physics subject knowledge (21) Biology subject knowledge (3) Microbiology (21) Supporting science departments (2) Data logging (17) Administration (2) Maintaining equipment (17) Other (2) Electrical equipment (16) Work related/communication skills (1) Radioactivity (15) Science curriculum knowledge (1) Using microscopes (14) Waste disposal (1) ICT (11) Behaviour support (1) Health and safety - first aid (11) Teaching skills/strategies (1) Management skills (10) Pastoral support (1) Health and safety – risk assessment (9) ICT skills (1) Practicals (6) Working with pupils (1) Science subject knowledge (6)
Finally, technicians were asked if there were any areas in which they would find it useful to receive some professional development / training to help them in their role. Just over half of the sample (51 per cent) responded in the affirmative. They also supplied details on the areas that would be beneficial. These are set out in the box in rank order.

Part Two 177
Areas for development / training to help technicians in their role (count)
ICT Skills (26) Behaviour management (6) Subject knowledge (18) Teaching skills (5) Health and safety (15) Communication skills (5) More training in general (11) Curriculum knowledge (3) Equipment handling (10) Maintaining resources (3) Management skills (9) Time management (2) Delivering practicals (8) SEN Knowledge (1) Administrative skills (7) Other (1) Qualifications (7)
9.6 Views of other support staff working with science
departments After discussing the views of technicians, this short section outlines the views of a smaller sample of other support staff working with science departments (e.g. teaching assistants, learning support assistants and departmental assistants). As with the previous section, it includes details of their characteristics; tasks undertaken; and professional development opportunities. It should be noted, however, that the small size of this sample (42 respondents) means that all findings must be interpreted with caution. Of the 42 respondents, the majority of support staff working with science departments were female (35 respondents). They spanned a wide age range from the youngest at 21 to the eldest at 63 years of age. Nearly three-quarters were aged between 40 and 59 years of age. Around half of respondents (20) reported that they had spent five years or less working in education as a support assistant at the time of the survey. Around two-thirds of the support staff had been supporting the science department for five years or less. Thirty-eight of the 42 support staff surveyed reported having had another job or career prior to their current role. Of those respondents with prior careers, the largest proportions had previously worked in an administrative role (7 respondents). Most commonly, the job titles of the 42 respondents fell into the general learning support category, for example teaching assistant or learning support assistant. Nearly all of the support staff surveyed held a permanent contract with only three respondents holding a temporary post. Just over three-fifths of the sample worked full-time (26 respondents) and 29 respondents were paid for the work they did in term-time only (though their pay was spread evenly throughout the year). With respect to their line management, 24 of those surveyed reported their line manager to be the SENCO. Eleven were line managed by the head of science.
178 Deployment in science
Examination of respondents’ qualifications revealed that the majority met the minimum requirements for HLTA status. Of the 42 respondents, 30 had a qualification in maths / numeracy equivalent to GCSE grade C or above. Thirty-five respondents had a qualification in English / literacy equivalent to GCSE grade C or above. The most frequently cited highest qualification in science was O-level grades A-C or passes with just under one-third of respondents (14) citing this as their highest qualification in the subject. Three respondents had an A-level in science and a further six held a degree in the area. Eight respondents held no qualifications in science. Twenty-two respondents reported having other qualifications relevant to their current role; the majority of those cited being teaching assistant qualifications. The support staff working with science departments worked with all three sciences to fairly equal measure and across all year groups. They most commonly worked with mixed ability and lower ability classes. Only two respondents reported working with A-level biology, chemistry and physics and other post-16 groups. Of the 42 respondents, 13 worked only with science departments. Those working across departments reported spending between one hour and 36 hours per week working in/supporting the science department with the largest proportions supporting in science for less than ten hours per week. When asked to report which other departments they worked with, the most common responses was mathematics (11 respondents), all departments (6 respondents), and English, geography and history departments (five respondents respectively). Respondents were asked to provide details of both the learning support and administrative tasks they carried out within the science department. The learning support related tasks undertaken most frequently included in-class support for an individual and small groups followed by providing behaviour management support. Over half of the support staff surveyed had never taken whole classes or marked pupils’ work. Respondents carried out administrative support to a lesser extent than learning support. The most common type of administrative support provided was preparing resources for teachers. Eleven respondents reported carrying out at least one other type of administrative support in the science department, the most common being data management. When asked if there were any other duties or responsibilities they would like to take on in the science department, the most frequent response from surveyed support staff was the opportunity to deliver lessons (6 respondents). Others included more one-to-one work with pupils, delivering practicals, more SEN work and marking. Despite this, fifteen support staff reported that they did not want to undertake any other additional duties or responsibilities. With regards to professional development, the survey revealed that 27 of the 42 support staff working with science departments received a performance review or appraisal, with 37 respondents also indicating that they were able to discuss their training or development needs. Members of staff with whom support staff discussed such needs included, in order of frequency, the SENCO (19 respondents), the head of science (8 respondents) and the deputy head (5 respondents).

Part Two 179
The majority of the support staff surveyed had been included in at least some whole-school professional development / training sessions that took place generally for teachers. However, just over half of this sample of support staff had never been included in science departmental training sessions. Support staff working with the science department were further asked to state if they had received any professional development / training sessions specifically for support staff or specifically on science. In total, 36 of the 42 respondents reported that they had had support staff training. The most frequently cited types of professional development in this area included: behaviour management (17 respondents); SEN support (17 respondents) and learning support training (8 respondents). Of the 13 who reported receiving professional development/training sessions specifically on science, the most frequently cited foci included supporting science departments (7 respondents) and science curriculum knowledge (5 respondents). Overall, half of the respondents reported that there were specific areas in which they would find it useful to receive some professional development / training to help them in their role in the science department. The areas most commonly mentioned in this regard were science subject knowledge (6 responses) and ICT skills (5 responses). Where respondents were planning to or were currently undertaking further qualifications, most frequently they were seeking HLTA status (10 respondents). Seven were currently undertaking or planning to undertake teaching assistant qualifications, and four were intending to work towards a teaching qualification. In addition, there were seven other types of qualification that the surveyed support staff were currently undertaking or were keen to pursue. These included: a degree in science (1), ICT-related qualification (1), GCSE mathematics (1), GCSE (non science) (1), other science qualification (1). 9.7 Concluding comments Evidence presented in this chapter has shown that, on the whole, the majority of technicians surveyed in this research rarely or never carried out learning support tasks in the science department. None the less, where they were keen to take on further roles or duties, the most frequent response was for a greater involvement with pupils. Several of the ‘good practice’ science departments involved in the case-study phase of the research deployed their technicians to demonstrate experiments or work with groups or individuals in class. These findings, thus, raise the question as to whether technical staff can routinely become more involved with supporting learning in the classroom.

180 Deployment in science
10 Professional satisfaction of science teachers, heads of department and support staff
Key findings This chapter discussed the professional satisfaction of science teachers, heads of science department and support staff and technicians working in science department. The main points emerging are summarised below.
• Around two fifths of teachers and heads of department were broadly satisfied
with their professional lives, whilst around a quarter were dissatisfied. Responses of teachers and those of heads of department were remarkably similar, with few members of either group expressing very strong satisfaction or dissatisfaction. The majority of both groups were either neutral or somewhat positive about their work.
• Heads of science departments were more likely than teachers to believe that they would still be working in teaching in five years’ time, despite reporting similar levels of overall satisfaction with their professional life.
• The amount of work required appears to be a considerable source of dissatisfaction for teachers, and particularly for heads of department. High levels of dissatisfaction with pupil behaviour were also seen amongst both groups.
• Amongst heads of department, holders of physics degrees were significantly more likely to be satisfied than those holding chemistry and biology degrees, but this pattern was not seen in the teacher sample.
• Departmental factors associated with professional satisfaction for science teachers and heads of department were: • shortages of science specialist teaching staff. More shortages were
associated with lower satisfaction for both teachers and heads of department • the presence of science-dedicated support staff in the department. This type
of support was associated with greater satisfaction with support from the senior management team and career progression amongst heads of department.
• When multiple regression analysis was carried out to see what school- department - and individual-level factors were independent predictors of satisfaction (not due to intercorrelations between these and other background variables) significant predictors of overall satisfaction amongst teachers were: • school attainment level (higher attainment was associated with greater
satisfaction) • age (greater age was associated with lower satisfaction) • shortages of science-specialist teaching staff (more shortages were
associated with lower satisfaction).
Amongst heads of department significant independent predictors of satisfaction

Part Two 181
were: • gender (males were less satisfied) • time in teaching (longer in teaching was associated with lower satisfaction) • holding a physics degree (associated with greater satisfaction) • shortages of science-specialist teaching staff (more shortages were
associated with lower satisfaction).
• Just over a third of heads of science felt they had been able to meet the professional development needs and interests of staff in their department. On the whole, ratings were clustered around the centre of the response scale; suggesting that departments where staff needs are fully met are unusual, as are departments unable to meet staff needs at all. The most frequently cited focus of professional development was national strategies.
• Overall levels of satisfaction amongst science support staff and technicians were high. Support staff were somewhat more satisfied than technicians with all areas of their working life except workload. Pay and career progression were the greatest areas of dissatisfaction, with around one-quarter of support staff and fewer than one in ten technicians satisfied with their pay.

182 Deployment in science
10.1 Introduction The following chapter examines levels of professional satisfaction, intention to remain in teaching and professional development amongst science teachers, heads of science department, science technicians and support staff working with science departments.
The high level of unfilled science vacancies nationally (Ofsted, 2005) means that schools are wise to take the retention of their staff very seriously. Staff shortages can place a great burden on staff, resulting in professional dissatisfaction and, in some cases, leading to teachers leaving the profession or moving into the private sector (Ofsted, 2004b; Smithers and Robinson, 2000). Individual- and school-level factors associated with satisfaction are addressed in this chapter, including levels of staff shortage, and the satisfaction of teachers holding science qualifications of different levels and subject specialisms.
The structure of this chapter is as follows:
Section 10.2 Professional satisfaction and intention to remain in teaching
amongst teachers and heads of department Section 10.3 Factors associated with satisfaction and likelihood of staying in
teaching amongst teachers and heads of department Section 10.4 Meeting the professional development needs of teachers Section 10.5 Professional satisfaction amongst technicians and support staff
working in science departments Section 10.6 Concluding comments 10.2 Professional satisfaction and intention to remain
in teaching amongst science teachers and heads of department
Teachers and heads of department were asked to indicate their level of satisfaction with a number of aspects of their working life on a scale ranging from 1 (very dissatisfied) to 5 (very satisfied). They were also asked to give an overall rating of their professional satisfaction on a similar scale, and to indicate how likely they were to be continuing working in teaching in five years’ time, on a scale from 1(very unlikely) to 5 (very likely).
10.2.1 Overall professional satisfaction The responses of science teachers and heads of department to the item regarding overall satisfaction are given in Table 10.1.

Part Two 183
Table 10.1 Overall satisfaction ratings of science teachers and heads of department
Ratings of satisfaction on a scale of 1-5
% of respondents
1 Very dissatisfied
2 3 4 1 Very satisfied
Teachers of science (N=2684)
4 20 37 35 5
Heads of science departments (N=726)
5 21 38 33 4
Due to rounding, percentages may not sum to 100. Source: NFER surveys of teachers of science and heads of science departments, 2005
Responses of teachers and those of heads of department were remarkably similar, with few members of either group expressing strong satisfaction or dissatisfaction. The majority of both groups indicated that they were either neutral, or somewhat positive about their work.
Altogether 40 per cent of science teachers and 37 percent of heads of department were broadly satisfied, giving a satisfaction rating of 4 or 5 out of 5, whilst 24 per cent of teachers and 26 percent of heads of department were broadly dissatisfied (rating 1 or 2 out of 5).
10.2.2 Intention to remain in teaching Respondents’ perceptions of the likelihood of their remaining in teaching were strongly associated with age amongst both teachers and heads of department, an effect which was predominantly due to participants approaching retirement age being very likely to expect to leave. For this reason, results are shown in Table 10.2 for the sample as a whole, together with those for the subgroup of participants aged under 55.

184 Deployment in science
Table 10.2 Ratings of likelihood of working in teaching in five years’ time, amongst science teachers and heads of science department
Ratings of likelihood of remaining in teaching on a scale of
1-5 % of respondents
1 Very unlikely
2 3 4 5 Very likely
All respondents (N=2,738) 19 10 18 19 35 Teachers of
science Aged under 55
(N=2,295) 12 11 20 20 37
All respondents (N=736) 21 7 12 16 43 Heads of
science departments Aged under 55
(N=568) 13 7 13 18 49
Due to rounding, percentages may not sum to 100 Source: NFER surveys of teachers of science and heads of science departments, 2005
Although the majority of both teachers and heads of department felt that they were likely to remain in teaching for the next five years at least (rating 4 or 5 out of 5), a large minority gave lower ratings (42 per cent of teachers and 33 per cent of heads of department). Heads of department may feel that they have more invested in their teaching career than teachers, since they showed higher levels of commitment to remain in teaching, despite having similar levels of overall satisfaction with their professional life.

Part Two 185
Case study Measures to enhance teacher retention
One case-study school has identified improving retention as a possible means of addressing difficulties with staff shortages in their science, as well as their mathematics, department. This 11–16 school has prioritised measures to ensure satisfaction on the part of the head of science, particularly since heads of department tend to move schools fairly regularly through promotion. Giving staff extra responsibilities and promotions where possible The head of science (as well as the head of maths) is part of a middle management group where s/he takes responsibility for roles at a whole-school level.
‘That is absolutely a retention strategy for us. The head of science came to us as an NQT in 1999. That year the school underwent re-organisation and we went from 750 to 1050 pupils with 40 new members of staff that year. So they are our own-grown middle managers and they contribute to that middle level of management in a very proactive way and have a lot of impact with extra responsibilities for learning across the whole school, not just department. Recruiting heads of maths and science, I just cannot imagine how difficult that would be and we have got young teachers here that are good, ambitious, love the school and want to be here and so we do everything that we can to retain those sorts of people and give them opportunities within the schools’ (deputy head). Providing extra professional support Professional support particularly appreciated by the staff includes:
- an extra member of support staff working only in the science department
- use of cover supervisors to ensure staff do not lose non-contact time to cover classes for sick colleagues
- departmental banks of teaching resources accessible to all staff
- use of a behaviour coordinator to ensure staff have support with difficult pupils at all times departmental banks of teaching resources accessible to all staff
- the head of department does ‘learning walks’ (lesson observations) to monitor and evaluate staff and to provide support quickly and effectively.
10.2.3 Satisfaction with specific aspects of working life Science teachers and heads of science department were asked to indicate their level of satisfaction with a number of specific aspects of their working life. These were:
• their teaching timetable • managing their workload • the hours they worked • the amount of non-contact time they received • pupil behaviour and attitudes • professional development opportunities available to them • opportunities for career progression • freedom to teach subjects in the way they chose • their pay

186 Deployment in science
• the level of resources allocated to the science department • the support they received from their head of department (only asked of those
in the teacher sample) • the contribution of teachers within the science department (only asked of those
in the head of department sample) • the support they received from the school senior management team (only
asked of those in the head of department sample).
The percentage of science teachers and heads of department giving each response to these survey items are shown in Table 10.3, whilst the percentage of respondents indicating that they were satisfied with each aspect of their work (giving a rating of 4 or 5 out of 5) is illustrated in Figure 10.1.

Part Two 187
Table 10.3 Rating of satisfaction with specific aspects of working life amongst science teachers and heads of department
Ratings of satisfaction on a scale of 1-5
% of respondents Teachers of science
N 1 Very
dissatisfied
2 3 4 5 Very
satisfied
Your teaching timetable 2725 3 13 30 39 16 Managing your workload 2733 8 28 38 23 4 The hours you spend working 2732 18 35 29 15 3
Amount of non-contact time you receive 2729 15 35 28 16 5
Pupil behaviour / attitude 2738 27 31 25 14 3 Professional development opportunities 2731 10 23 33 26 8
Opportunities for career progression 2694 11 22 36 24 8
Freedom to teach in the way you choose 2738 12 21 25 30 13
Your pay 2722 9 23 36 26 5 Resources allocated to the science department 2735 15 26 31 24 5
Support from your science head of department 2708 5 10 18 32 35
Heads of science departments
N
1 Very
dissatisfied
2 3 4 5 Very
satisfied
Your teaching timetable 740 3 12 26 42 17 Managing your workload 742 18 31 37 13 2 The hours you spend working 743 32 35 23 8 2
Amount of non-contact time you receive 743 19 38 26 15 3
Pupil behaviour / attitude 742 21 32 27 17 4 Professional development opportunities 743 5 20 34 30 11
Opportunities for career progression 737 9 17 38 27 10
Freedom to teach in the way you choose 744 10 20 22 33 16
Your pay 742 8 20 33 32 7 Resources allocated to the science department 741 15 25 25 26 9
Contribution of teachers in your department 737 2 12 24 43 19
Support from the senior management team 741 8 21 31 31 9
Due to rounding, percentages may not sum to 100 Source: NFER surveys of teachers of science and heads of science departments, 2005
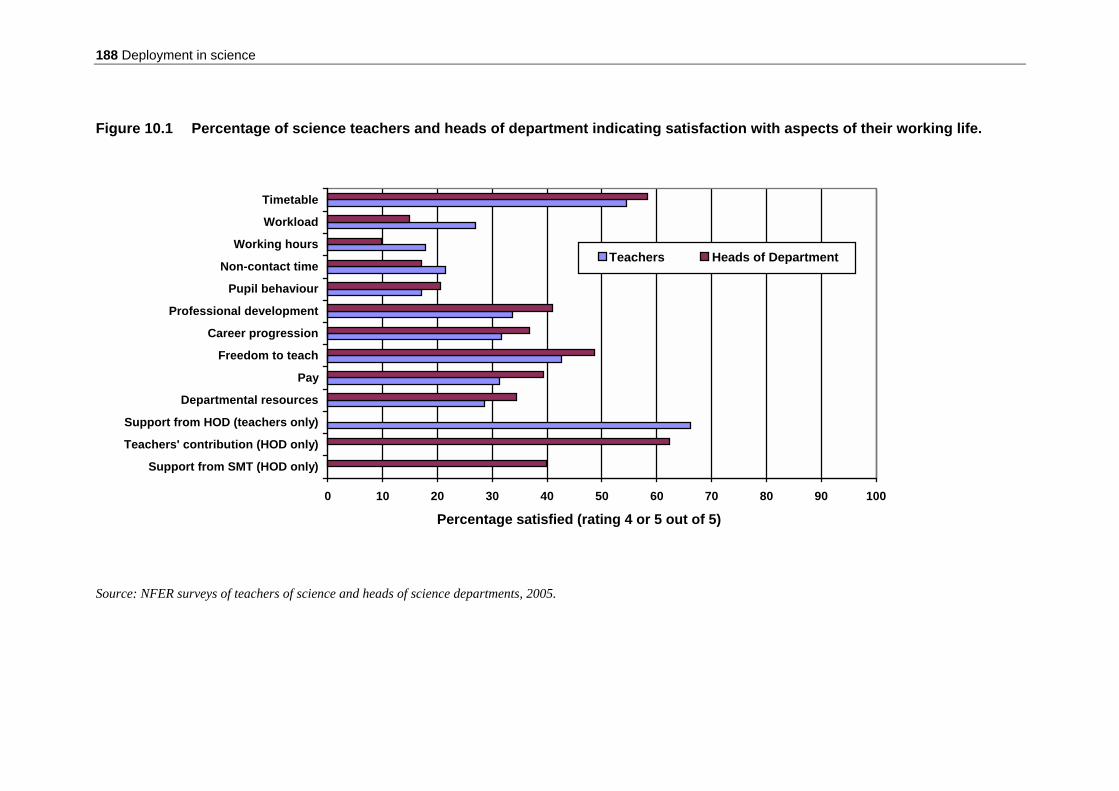
188 Deployment in science
Figure 10.1 Percentage of science teachers and heads of department indicating satisfaction with aspects of their working life.
0 10 20 30 40 50 60 70 80 90 100
Support from SMT (HOD only)
Teachers' contribution (HOD only)
Support from HOD (teachers only)
Departmental resources
Pay
Freedom to teach
Career progression
Professional development
Pupil behaviour
Non-contact time
Working hours
Workload
Timetable
Percentage satisfied (rating 4 or 5 out of 5)
Teachers Heads of Department
Source: NFER surveys of teachers of science and heads of science departments, 2005.
Part Two 189
If ratings of 4 or 5 out of 5 are taken to represent satisfaction, teachers registered the highest levels of satisfaction with:
1. Support from the science head of department (67 per cent give a rating of 4
or 5) 2. Their teaching timetable (55 per cent give a rating of 4 or 5) 3. The freedom to teach in the way they choose (43 per cent give a rating of 4
or 5).
Areas given the lowest ratings were: 1. Pupil behaviour (17 per cent give a rating of 4 or 5) 2. Working hours (18 per cent give a rating of 4 or 5) 3. Amount of non-contact time (21 per cent give a rating of 4 or 5).
The amount of work required of teachers appears to be generally a source of dissatisfaction, with just 27 per cent of teachers satisfied with their workload, 18 per cent satisfied with the hours they work and 21 per cent content with the amount of non-contact time they receive. Factors related to departmental support and organisation are generally sources of satisfaction, with 67 per cent of teachers happy with the support they get from the head of department and 55 per cent content with their teaching timetable.
The satisfaction of heads of department was similar in many respects to that of teachers. Areas of working life given the highest satisfaction ratings were:
1. Contribution of teachers in their department (62 per cent give a rating of 4
or 5) 2. Their teaching timetable (59 per cent give a rating of 4 or 5) 3. Their freedom to teach in the way they choose (49 per cent give a rating of
4 or 5).
Areas given the lowest ratings were: 1. Working hours (10 per cent give a rating of 4 or 5) 2. Managing workload (15 per cent give a rating of 4 or 5) 3. Amount of non-contact time (18 per cent give a rating of 4 or 5)
Considerable dissatisfaction amongst heads of department with the amount of work required of them was normative. Only one in ten of the heads of department were satisfied with their working hours. They also showed low levels of satisfaction with pupil behaviour (21 per cent satisfied), but were largely content with their timetables, the contribution of staff within their department and their freedom to teach their subject in the way they chose.
190 Deployment in science
These findings on teacher satisfaction corroborate those of Sturman (2002) whose study of quality of working life in teachers found that work-related stress and workload were the greatest sources of dissatisfaction for many teachers, whilst most were happy with their responsibilities and levels of support they received.
10.2.4 Associations between satisfaction with specific areas of working life and overall satisfaction and intention to remain in teaching
The associations between each of these specific facets of satisfaction and overall satisfaction and intention to stay in teaching were examined in order to establish which factors contributed most to overall measures of job satisfaction and commitment to stay in the profession. All individual satisfaction ratings were significantly and positively associated with overall professional satisfaction and likelihood of remaining in teaching. Associations with the intention to leave were less strong than with overall satisfaction, since an intention to leave teaching might be expected to be based on a range of factors, some of which are unrelated to professional satisfaction. The strongest associations are shown in Table 10.4.
Table 10.4 Associations between rating of satisfaction with specific areas of
working life and overall measures of professional satisfaction and intention to remain in teaching
Science teachers Science heads of department
Overall satisfaction associated with: Teaching timetable (correlation (r) =.54) Managing workload (r =.53) Pupil behaviour (r =.49) Freedom to teach (r =.47) Working hours (r =.46)
Overall satisfaction associated with: Managing workload (r =.53) Support from SMT (r =.52) Working hours (r =.49) Pupil behaviour (r =.44) Freedom to teach (r =.43)
Likelihood of remaining in teaching associated with: Pupil behaviour (r =.29) Freedom to teach (r =.25) Pay (r=.24) Teaching timetable (r=.24) Career progression (r=.23)
Likelihood of remaining in teaching associated with: Freedom to teach (r =.30) Managing workload (r =.26) Working hours (r=.25) Support from SMT (r=.24) Pupil behaviour (r=.22)
All correlations (Spearman’s rho) positive and significant at p<0.01 Source: NFER surveys of teachers of science and heads of science departments, 2005 Pupil behaviour and freedom to teach subjects in the way they chose were important areas of satisfaction for both teachers and heads of department (i.e. the greater the satisfaction with pupil behaviour, the greater the overall satisfaction; the greater the

Part Two 191
satisfaction with workload, the greater the overall satisfaction). Analysis of teacher responses also highlighted the importance of a satisfactory teaching timetable. Head of department responses also highlighted the importance of good support from the senior management team.
10.3 Factors associated with satisfaction and likelihood of staying in teaching amongst teachers and heads of department
The following section examines the extent to which individual-, department- and school-levels factors are associated with ratings of satisfaction and likelihood of remaining in teaching amongst science teachers and heads of department. 10.3.1 Association between science qualifications and
professional satisfaction It was hypothesised that the professional satisfaction of teachers and heads of department would be associated with the level of their highest post-A-level science qualification. For these analyses, the small number of participants in some of the qualification band groups necessitated some merging of groups. Hence the satisfaction ratings of those with no post-A-level science qualifications were compared with those with a post-A-level science qualification but no science degree, and with those with a science degree. In addition, the ratings of those with degrees in physics, chemistry and biology were also examined. The satisfaction ratings of these groups can be seen in Table 10.5.
Table 10.5 Percentage of science teachers and heads of department giving
high ratings of their professional satisfaction (rating 4 or 5 out of 5) by their highest post-A-level qualification in science
Teachers Heads of department
Qualifications of different levels N % N %
No post-A-level science qualification 56 45 10 40
Post-A-level science qualification but no science degree 627 38 134 34
Any science degree (including physics, chemistry and biology degrees) 2001 39 582 40
Degrees in specific sciences
Physics degree 277 40 102 50 Chemistry degree 429 40 146 33 Biology degree 734 41 188 33 Source: NFER surveys of teachers of science and heads of science departments, 2005
There were no significant differences in levels of professional satisfaction between teachers and heads of department holding different levels of science qualification,
192 Deployment in science
although amongst both teachers and heads of department, those with a post-A-level science qualification but no degree were the least likely to be satisfied.
Amongst heads of department, holders of physics degrees were significantly more likely to be satisfied than those holding chemistry and biology degrees, but this pattern was not replicated in the teacher sample. 10.3.2 School-level and department-level factors associated
with satisfaction and likelihood of staying in teaching A number of school - and department-level factors were examined in terms of their associations with teacher satisfaction and likelihood of staying in teaching. These included:
• extent of specialist staff shortages in the science department • the presence of support staff working only with the science department
(excluding technicians) • heads of departments’ priorities when deploying teachers to cover the
timetable.
The following sections discuss each of these three factors in turn.
Associations with the extent of teacher shortages The extent to which satisfaction with specific areas of working life (see section 10.2.3) was associated with specialist teacher shortages within science departments was examined by carrying out correlations between ratings of teacher shortages and ratings of satisfaction. Teachers and heads of department working in departments experiencing more shortages were found to be less satisfied in all areas, i.e. in each case, those teachers from departments with lower levels of staff shortages were more satisfied than those from departments with more shortages. The six areas of working life satisfaction most closely linked to staff shortages for both teachers and heads of department can be seen in Table 10.6. All associations are negative indicating that increasing shortages are associated with decreasing satisfaction.
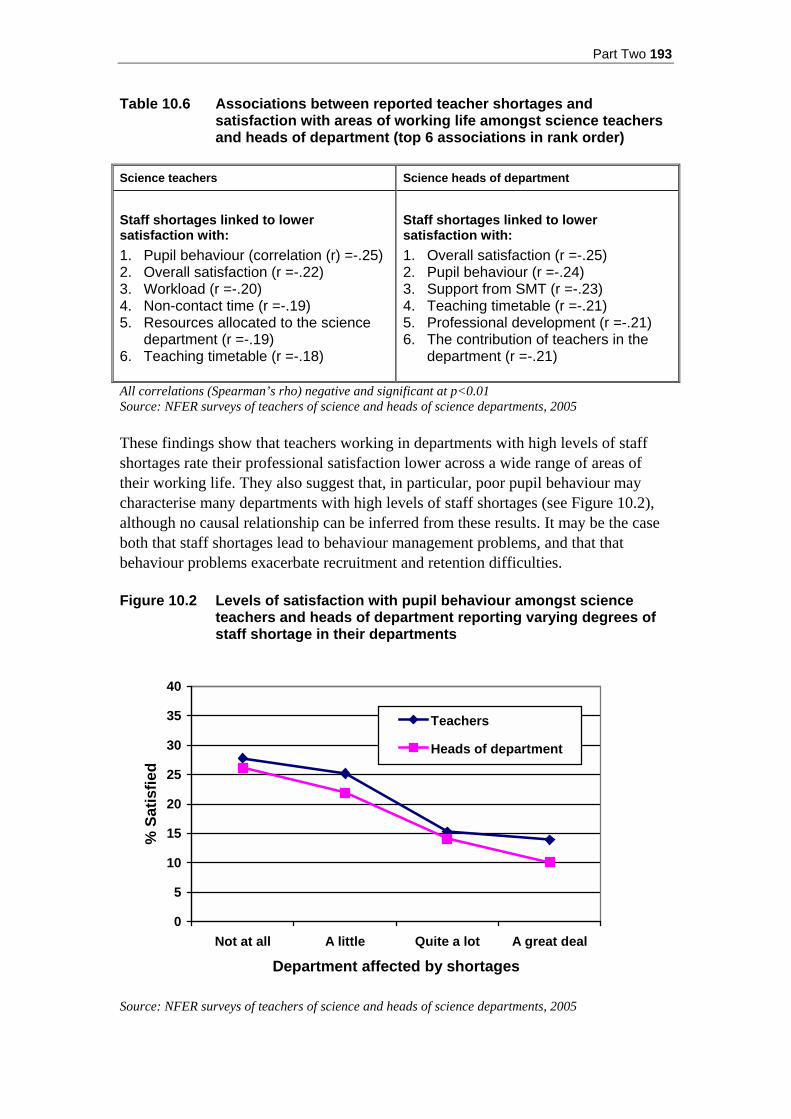
Part Two 193
Table 10.6 Associations between reported teacher shortages and satisfaction with areas of working life amongst science teachers and heads of department (top 6 associations in rank order)
Science teachers Science heads of department
Staff shortages linked to lower satisfaction with: 1. Pupil behaviour (correlation (r) =-.25) 2. Overall satisfaction (r =-.22) 3. Workload (r =-.20) 4. Non-contact time (r =-.19) 5. Resources allocated to the science
department (r =-.19) 6. Teaching timetable (r =-.18)
Staff shortages linked to lower satisfaction with: 1. Overall satisfaction (r =-.25) 2. Pupil behaviour (r =-.24) 3. Support from SMT (r =-.23) 4. Teaching timetable (r =-.21) 5. Professional development (r =-.21) 6. The contribution of teachers in the
department (r =-.21)
All correlations (Spearman’s rho) negative and significant at p<0.01 Source: NFER surveys of teachers of science and heads of science departments, 2005 These findings show that teachers working in departments with high levels of staff shortages rate their professional satisfaction lower across a wide range of areas of their working life. They also suggest that, in particular, poor pupil behaviour may characterise many departments with high levels of staff shortages (see Figure 10.2), although no causal relationship can be inferred from these results. It may be the case both that staff shortages lead to behaviour management problems, and that that behaviour problems exacerbate recruitment and retention difficulties.
Figure 10.2 Levels of satisfaction with pupil behaviour amongst science
teachers and heads of department reporting varying degrees of staff shortage in their departments
0
5
10
15
20
25
30
35
40
Not at all A little Quite a lot A great deal
Department affected by shortages
% S
atis
fied
Teachers
Heads of department
Source: NFER surveys of teachers of science and heads of science departments, 2005
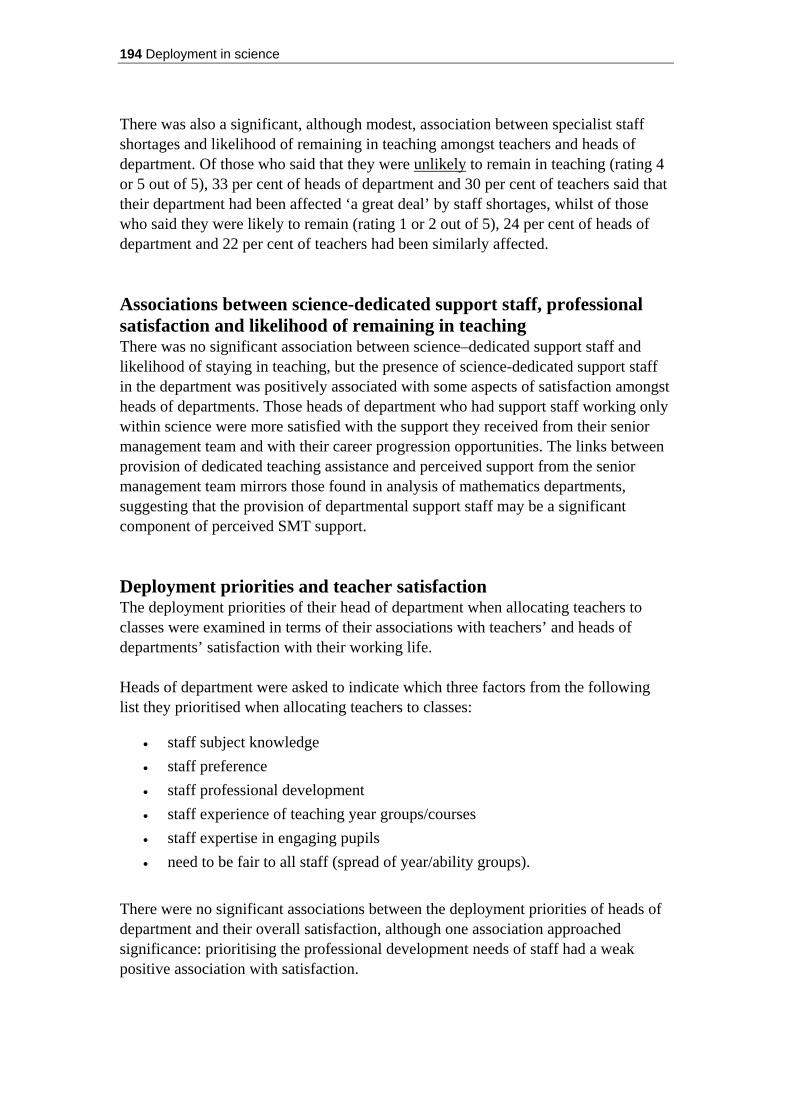
194 Deployment in science
There was also a significant, although modest, association between specialist staff shortages and likelihood of remaining in teaching amongst teachers and heads of department. Of those who said that they were unlikely to remain in teaching (rating 4 or 5 out of 5), 33 per cent of heads of department and 30 per cent of teachers said that their department had been affected ‘a great deal’ by staff shortages, whilst of those who said they were likely to remain (rating 1 or 2 out of 5), 24 per cent of heads of department and 22 per cent of teachers had been similarly affected.
Associations between science-dedicated support staff, professional satisfaction and likelihood of remaining in teaching There was no significant association between science–dedicated support staff and likelihood of staying in teaching, but the presence of science-dedicated support staff in the department was positively associated with some aspects of satisfaction amongst heads of departments. Those heads of department who had support staff working only within science were more satisfied with the support they received from their senior management team and with their career progression opportunities. The links between provision of dedicated teaching assistance and perceived support from the senior management team mirrors those found in analysis of mathematics departments, suggesting that the provision of departmental support staff may be a significant component of perceived SMT support. Deployment priorities and teacher satisfaction The deployment priorities of their head of department when allocating teachers to classes were examined in terms of their associations with teachers’ and heads of departments’ satisfaction with their working life.
Heads of department were asked to indicate which three factors from the following list they prioritised when allocating teachers to classes:
• staff subject knowledge • staff preference • staff professional development • staff experience of teaching year groups/courses • staff expertise in engaging pupils • need to be fair to all staff (spread of year/ability groups).
There were no significant associations between the deployment priorities of heads of department and their overall satisfaction, although one association approached significance: prioritising the professional development needs of staff had a weak positive association with satisfaction.

Part Two 195
10.3.3 Factors independently associated with overall satisfaction: multiple regression analysis
In order to establish whether associations between professional satisfaction and individual- and school-level variables are independent of other aspects of variation between schools and departments, a multiple regression was carried out, which examined the overall satisfaction ratings of teachers and heads of department whilst controlling for the effects of the other variables in the model. Two similar analyses were run, one for teachers and another for heads of departments. Variables were entered into the multiple regression in four stages:
1. Backgound information about the school
a. Geographical location (nine Government Office Regions) b. School size (small/medium/large) c. School age range (age range up to 16/ up to18) d. Attainment (GCSE points band 2002).
2. Individual respondent characteristics
a. Gender of respondent b. Age c. Time teaching science (science teachers) / total time in teaching (heads of
department) d. Respondent’s science qualification band.
3. Science department characteristics
a. Departmental shortages of science-specialist teaching staff* b. Science-dedicated support staff (yes or no)* c. Number of technicians working in the science department*.
* Taken from the head of department surveys in both the teacher and head of department analyses
Results of science teacher multiple regression In the first stage of the model, school attainment level was significantly associated with overall teacher satisfaction, such that teachers working in schools with a higher GCSE points score were more satisfied than those in schools with a lower points score. When individual teacher characteristics were added into the model, respondents’ age was found to be a significant negative predictor of satisfaction, with older teachers recording lower satisfaction ratings. None of the qualification bands significantly predicted satisfaction. When departmental factors were added into the model, teacher shortages emerged as a significant negative predictor of satisfaction, such that teachers in departments experiencing shortages were less satisfied. Hence, the factors that were significant, independent predictors of overall satisfaction in the final stage of the model were:
• school attainment level (positive) • age (negative)

196 Deployment in science
• shortages of science-specialist teaching staff (negative).
Results of science head of department multiple regression In the head of department multiple regression, only school attainment was a significant predictor of satisfaction in the first stage of the analysis, with heads of department in school with a higher GCSE points score reporting higher levels of satisfaction. At the second stage, respondents’ gender and time in teaching were significant predictors, such that male teachers and those who had been in the profession longer were less satisfied. Holders of a degree in physics were also significantly more satisfied than holders of a biology degree. When departmental factors were added at stage three, shortages of science specialist teaching staff were found to be associated with lower satisfaction, and geographical location became a significant predictor of satisfaction. School attainment level became non-significant at this stage of the model. None of the deployment priorities, added at stage four, was significant predictors of satisfaction.
Hence at the final stage, the following factors were all significantly and independently associated with overall satisfaction:
• gender (males were less satisfied) • time in teaching (negative) • holding a physics degree (positive) • shortages of science-specialist teaching staff (negative).
10.4 Meeting the professional development needs of
teachers Heads of department were asked to rate the extent to which they felt that the science department has been able to meet the professional development needs and interests of staff on a 5-point scale from 1 (not at all) to 5 (a great deal). Table 10.7 shows that around one third of heads of science (32 per cent) felt their department had been able to meet the professional development needs and interests of staff (giving a rating of 4 or 5). On the whole, heads of departments’ ratings clustered around the centre of the scale with few respondents feeling that the professional development needs of teachers had been met either ‘not at all’ or ‘a great deal’.

Part Two 197
Table 10.7 Extent to which the professional development needs and interests of science teachers are met
Ratings of extent to which professional development
needs have been met on a scale of 1-5 % of respondents
1 Not at all
2 3 4 5 A great deal
Extent to which the professional development needs and interests of staff are met
4 22 42 28 4
Base: 737 Due to rounding, percentages may not sum to 100 Source: NFER survey of heads of science departments, 2005.
Heads of department were also asked to indicate what had been the focus of teachers’ professional development in their department in the past year. Five possible foci were listed:
• national strategies • examination board / syllabus requirements • science subject knowledge and skills • information and communications technology • whole school priorities.
There was also an opportunity for heads of department to add ‘other’ professional development foci to the list. Responses can be seen in Table 10.8. Table 10.8 Focus of professional development experienced by science
teachers
Frequently Sometimes Rarely Not this school year
No response Focus of professional
development (%) (%) (%) (%) (%)
National strategies 59 34 4 1 2 Examination board / Syllabus requirements 20 57 15 6 2
Furthering science subject knowledge and skills 7 44 35 13 2
Information Communications Technology 10 45 29 14 2
Whole school priorities 35 47 12 5 2 Other 2 2 0 1 95 Base: 754 Due to rounding, percentages may not sum to 100 Source: NFER survey of heads of science departments, 2005.
Heads of department reported that national strategies were the most frequent focus of professional development experienced by teachers of science. In total, 95 per cent

198 Deployment in science
reported this area to be the focus of teachers’ professional development ‘frequently’ or ‘sometimes’. Furthering science subject knowledge and skills was the focus of professional development least often. There were 22 responses to ‘other’. Of those who provided details, the most frequently cited other areas of professional development were teaching methods (three responses); informal professional development (two responses); behaviour management (two responses) and assessment (two responses). 10.5 Professional satisfaction amongst technicians
and other support staff working with science departments
The professional satisfaction of technicians and other support staff working with science departments was also examined. In a question similar to that on the teacher surveys, support staff and technicians were asked to rate their satisfaction with several aspects of their working life, together with their overall level of satisfaction, on a 5-point scale on which a rating of 1 corresponded to ‘very dissatisfied, and a rating of 5 to ‘very satisfied’. They were also asked how likely they were to still be working as a technician or support assistant in education in five years’ time.
10.5.1 Support staff overall satisfaction Overall levels of satisfaction amongst support staff are illustrated in Table 10.9.
Table 10.9 Ratings of overall satisfaction with working life amongst support
staff working with science departments
Ratings of satisfaction on a scale of 1-5 % of respondents
1 Very
dissatisfied
2 3 4 5 Very satisfied
Support staff (N=42) 0 2 29 38 31
Technicians (N=184) 4 7 24 47 18
NB: There were fewer than 100 respondents to the science support staff survey Due to rounding, percentages may not sum to 100 Source: NFER surveys of support staff working in science departments 2005.
On the whole, satisfaction ratings amongst support staff were very high, with 29 out of 42 support staff rating their satisfaction at 4 or 5 out of 5, and no respondents indicating that they were very dissatisfied. Amongst technicians, satisfaction was also high, although lower than amongst support staff, with almost two thirds satisfied with their working life and a little over one in ten indicating that they were dissatisfied (1 or 2).
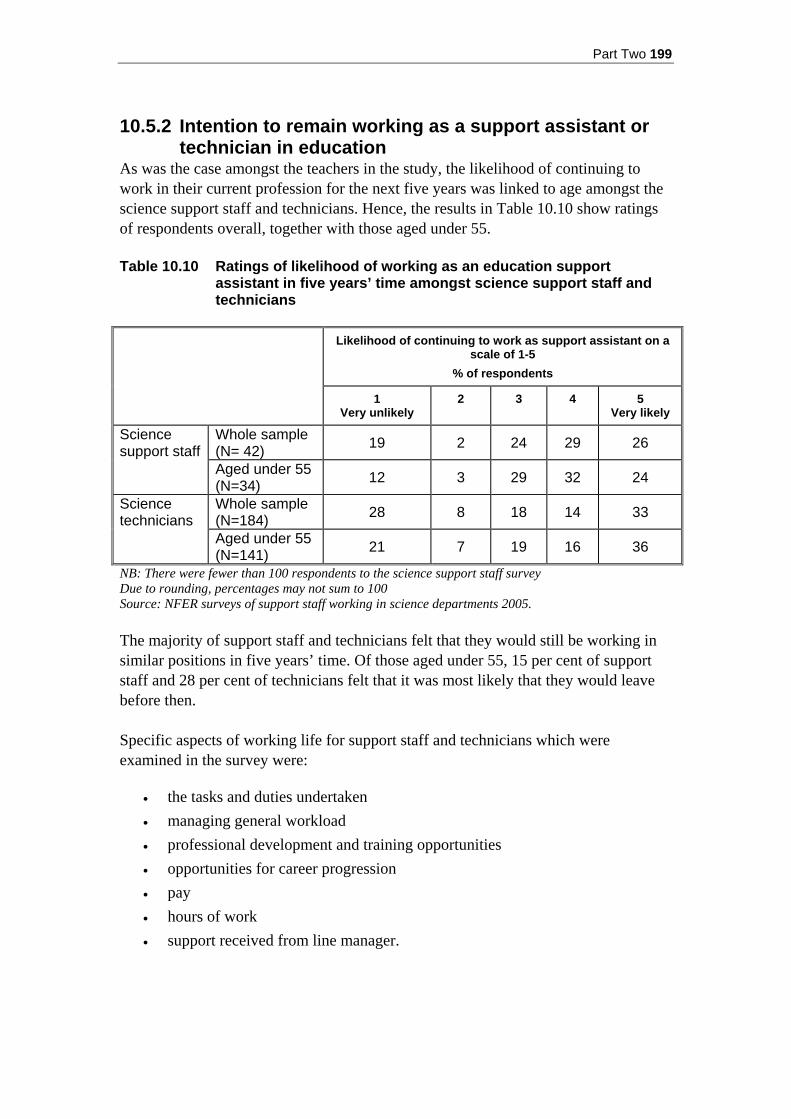
Part Two 199
10.5.2 Intention to remain working as a support assistant or
technician in education As was the case amongst the teachers in the study, the likelihood of continuing to work in their current profession for the next five years was linked to age amongst the science support staff and technicians. Hence, the results in Table 10.10 show ratings of respondents overall, together with those aged under 55.
Table 10.10 Ratings of likelihood of working as an education support
assistant in five years’ time amongst science support staff and technicians
Likelihood of continuing to work as support assistant on a
scale of 1-5 % of respondents
1 Very unlikely
2 3 4 5 Very likely
Whole sample (N= 42) 19 2 24 29 26 Science
support staff Aged under 55 (N=34) 12 3 29 32 24
Whole sample (N=184) 28 8 18 14 33 Science
technicians Aged under 55 (N=141) 21 7 19 16 36
NB: There were fewer than 100 respondents to the science support staff survey Due to rounding, percentages may not sum to 100 Source: NFER surveys of support staff working in science departments 2005. The majority of support staff and technicians felt that they would still be working in similar positions in five years’ time. Of those aged under 55, 15 per cent of support staff and 28 per cent of technicians felt that it was most likely that they would leave before then.
Specific aspects of working life for support staff and technicians which were examined in the survey were:
• the tasks and duties undertaken • managing general workload • professional development and training opportunities • opportunities for career progression • pay • hours of work • support received from line manager.
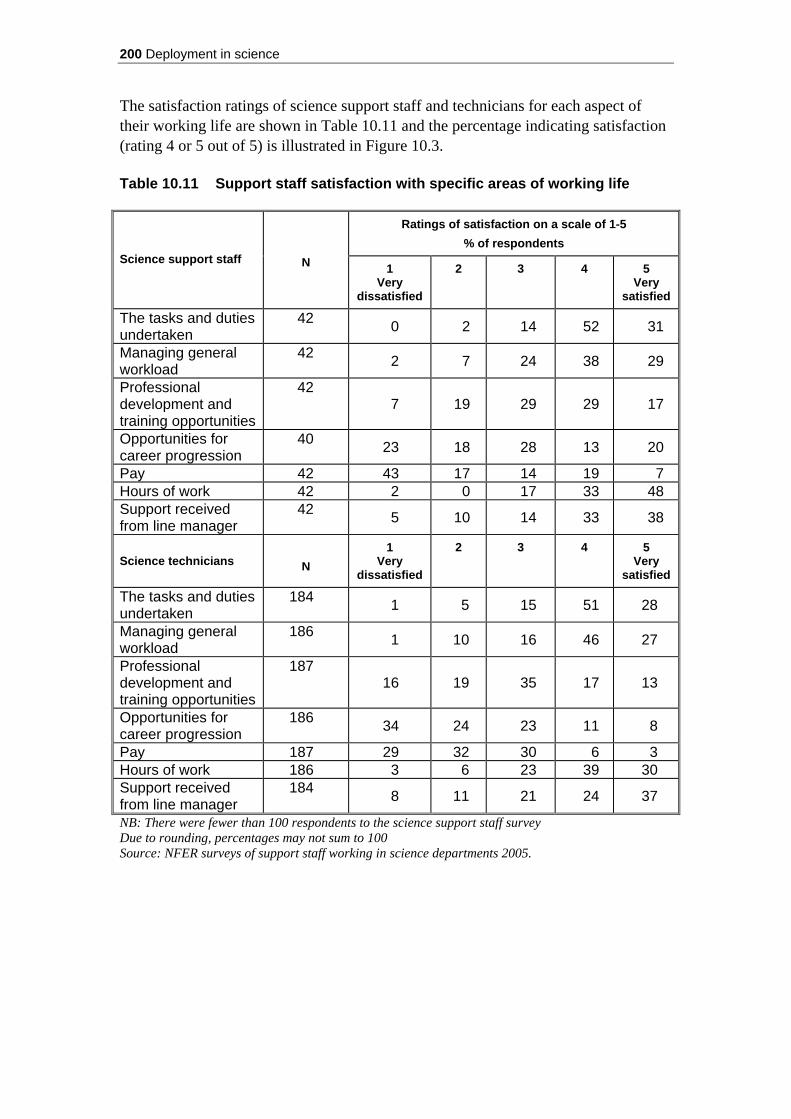
200 Deployment in science
The satisfaction ratings of science support staff and technicians for each aspect of their working life are shown in Table 10.11 and the percentage indicating satisfaction (rating 4 or 5 out of 5) is illustrated in Figure 10.3.
Table 10.11 Support staff satisfaction with specific areas of working life
Ratings of satisfaction on a scale of 1-5 % of respondents
Science support staff
N 1 Very
dissatisfied
2 3 4 5 Very
satisfied
The tasks and duties undertaken
42 0 2 14 52 31
Managing general workload
42 2 7 24 38 29
Professional development and training opportunities
42 7 19 29 29 17
Opportunities for career progression
40 23 18 28 13 20
Pay 42 43 17 14 19 7 Hours of work 42 2 0 17 33 48 Support received from line manager
42 5 10 14 33 38
Science technicians
N 1
Very dissatisfied
2 3 4 5 Very
satisfied
The tasks and duties undertaken
184 1 5 15 51 28
Managing general workload
186 1 10 16 46 27
Professional development and training opportunities
187 16 19 35 17 13
Opportunities for career progression
186 34 24 23 11 8
Pay 187 29 32 30 6 3 Hours of work 186 3 6 23 39 30 Support received from line manager
184 8 11 21 24 37
NB: There were fewer than 100 respondents to the science support staff survey Due to rounding, percentages may not sum to 100 Source: NFER surveys of support staff working in science departments 2005.

Part Two 201
Figure 10.3 Percentage of support staff and technicians working in science departments indicating satisfaction with aspects of their working life
0 20 40 60 80 100
Line managersupport
Working hours
Pay
Careerprogression
Professionaldevelopment
Workload
Tasks / duties
Percentage satisfied
TechniciansSupport staff
The pattern of working life satisfaction amongst support staff and technicians was very different from that amongst teachers. There were high satisfaction ratings for aspects of working life relating to the work expected of them. Over two-thirds of support staff and technicians were satisfied with their workload, their working hours and the tasks and duties they performed. The greatest area of dissatisfaction related to pay. Twenty six per cent of support staff and just nine per cent of technicians were happy with their pay, whilst there was also low satisfaction with opportunities for career progression and professional development. Technicians gave lower satisfaction ratings than support staff for all aspects of working life except workload.
10.6 Concluding comments Professional satisfaction was slightly lower amongst heads of department than amongst teachers of science, with majority of both groups giving ratings indicating neutral or broadly satisfied attitudes to their overall working life. None the less, a significant minority were dissatisfied. Areas of particular dissatisfaction were related to workload (amount of non-contact time, working hours and general workload) and pupil behaviour. The many alternative career opportunities available to science graduates have been highlighted as a cause of recruitment difficulties in science teaching, and research by Smithers and Robinson (2004 and 2005b) has shown that science teachers also leave the profession in larger numbers than would be expected. Therefore, further emphasis on retaining science teachers and hence on ameliorating the sources of their dissatisfaction may be needed. To date, these areas have already
202 Deployment in science
been the focus of attention, especially workload issues (and it should be noted that this study was undertaken before the national introduction of planning, preparation and assessment (PPA) time). None the less, PPA time may not, by itself, be sufficient to solve the workload issues of science teachers and departmental heads, without further resolution of specialist-staff shortages. Departmental shortage of science-specialist staff emerged as a strong and significant independent predictor of overall professional satisfaction in science departments amongst both teachers and heads of departments. As was the case in maths, this implies a pressing need to address ways of increasing science-specialist teaching capacity.
Part Three 203
PART THREE Economic analysis

204 Economic analysis
11 Economic analysis: an overview 11.1 Introduction The purpose of this economic analysis is two-fold: first, to provide a description of the distribution and deployment of maths and science teachers across the country as implied by the survey data and to measure the equity of this distribution; and, second, in light of mixed evidence of the effect of teacher salaries on supply, to use the new data to explore the extent to which it implies additional policy amenable variables such as teacher income, can be used to influence the supply and distribution of these teachers. The measure of deployment across England and the measure of the equity of this distribution is useful for a number of reasons. Firstly, although an average or aggregate number of suitably qualified staff members per pupil may provide a useful summary measure of the average supply, only a more detailed description is sufficient to pick out any systematic patterns that may be of policy relevance. For example, there may be a general national shortage of specialist mathematics and science teachers, but the problem may be particularly acute in schools serving deprived areas as Chapters 1 and 6 documented. Identifying such trends may be useful to policy makers. For example the FSM breakdown may be used to assess vertical and horizontal equity considerations, which are often prominent in the education funding formula literature. Vertical equity represents the principal that greater resource should be directed towards those with greater need and horizontal equity states that equal resources should be directed towards equal need. Thus, for these principles to be upheld, we would expect increasing numbers of teachers per capita as we progress from the lower to the higher bands of FSM eligibility. If this is not observed then policy makers may choose to place an emphasis of any future policy on increasing supply in deprived areas rather than just a general increase in supply per se. A second reason for defining and calculating a measure of the distribution is that, should it be conducted over time, it may be used as an instrument to measure the effect of Government policy. Such techniques have been used to good effect in addressing problems in the supply and distribution of supply of General Practitioners (Hann & Gravelle, 2004). The second aim of the economic analysis is to provide guidance on the extent to which teacher salaries or other means may be used as an instrument to affect supply and the distribution of suitable teachers. The current evidence on the effect of teacher salaries on graduate decisions to enter or leave a teaching occupation is somewhat mixed and we look to add to this literature by applying the underlying economic theories to the new data that has been uncovered in this study. In order to do so we produce an exploratory analysis which looks at the extent to which supply and shortages are correlated with a geographically varying opportunity (salary) cost of a teacher occupation.

Part Three 205
Many of the issues addressed in this analysis require a certain degree of familiarity with the rather technical techniques required in estimation with observational data (for example how we deal with missing values and how we measure inequality). At this stage in the report we provide only some of the key findings for the reader. In addition, an appendix accompanies the report, providing details of all the techniques and regressions used in this analysis, as well as a full account of the findings. This chapter is structured as follows: 11.2 The distribution of teachers per capita across England 11.3 The role of teacher income in determining supply and the distribution of
supply 11.4 Overall conclusion of economic analysis 11.2 The distribution of teachers per capita across
England The economic analysis first sought to provide a national picture of the distribution and deployment of maths and science teachers across the country, as implied by the survey data and to measure the equity of this distribution. In order to conduct this analysis, departmental heads’ survey results were used to estimate the numbers of staff teaching mathematics and science across all schools in England (details of how this was undertaken are set out in section 2.1 in the appendix). By combining the survey responses from our sample schools and the estimated results from the non-surveyed or non-response schools, a national picture could be built. That is, we could predict the total number of maths and science teachers teaching these subjects across all secondary schools in England. In addition, we could estimate the numbers of biology, chemistry and physics specialists teaching science; other-science specialists teaching science; non-science specialising teachers15 teaching science; mathematics specialists teaching maths and non-maths-specialising teachers16 teaching maths per school across all English secondary schools. For each of these, per capita adjusted measures (i.e. the number of teachers per 1,000 pupils) were constructed. Having established the average number of these teachers per 1,000 pupils, the equity of the distribution could be measured. (This was done using the Gini coefficient – a full explanation of which can be found in section 2.3 of the appendix). The analysis calculated the distribution of teachers per capita across schools in England. The distributions were also measured within GORs and within quintiles of %FSM entitlement in order to highlight any variations in the national picture across important sub-groups.
15I.e. non-science specialists (no degree or ITT) and teachers from other departments who teach science. 16I.e. non-maths specialists (no degree or ITT) and teachers from other departments who teach maths.

206 Economic analysis
A summary of the results is presented below. The general distribution of teachers (regardless of subject) per capita across England is described briefly first, then the results for science and maths are relayed. 11.2.1 The distribution of teachers per capita across England The analysis began with the general distribution of teachers (regardless of subject) per capita across England. This was included as a comparator group by which to compare the distribution of maths and science teachers. This allows us to identify whether unequal distributions of maths and science teachers are specific to that specialisation or just reflecting a general distribution problem per se. Analysis indicates that the distribution of all teachers in England does not appear to be much of an issue. There is an average of 59.37 teachers per 1,000 pupils across schools in the country, with an even per capita spread across all schools. Thus, in terms of numbers of teachers per pupil, there appears to be little variation in the distribution of those teachers across schools. A breakdown of the data by sub-group showed no alarming patterns across geographical regions or FSM bands. 11.2.2 The distribution of science teachers In the analysis, we started with an examination of the overall numbers of science teachers per capita (i.e. both specialists and non-specialists) and then continually refined the models to look at:
• total science-specialist teachers (i.e. excludes non-specialist teachers) • total biology, chemistry and physics specialist teachers (i.e. excludes non-
specialists and those specialising in another science) • biology specialists • chemistry specialists • physics specialists • non-science specialising teachers.
The findings were as follows. Total teachers per pupil teaching science This measure looks at the distribution of the number of teachers teaching science per 1,000 pupils across schools. The definition includes all those who teach science – both specialists and non-specialists alike – that is it includes teachers with specialisms in biology, chemistry, physics, other sciences and teachers who specialise in other subjects.
• Overall, there are on average 10.06 teachers per 1,000 pupils teaching science subjects within maintained secondary schools in England. In general, the

Part Three 207
picture is not greatly changed from the distribution of all teachers per capita (as shown above) in that the number of teachers of science per capita is relatively evenly spread.
• There are, however, one or two small departures from the ‘all teachers’ picture. For example, schools with high-FSM populations tend to have fewer science teachers per capita than schools in more affluent areas – a difference of 1.5 teachers per 1,000 pupils between the lowest and highest band of FSM eligibility.
Total science-specialist teachers per pupil teaching science This measure examines only those teachers who are science specialists and teach science. i.e. it excludes those teachers who teach science but have specialisms in other areas and/or are predominantly teachers of other subjects.
• Overall, there are on average 9.27 science-specialist teachers per 1,000 pupils teaching science, with a relatively even distribution across schools.
• The geographical breakdown by GOR shows no systematic variation from the national picture – thus, the average number of teachers across regions is stable.
• However, the analysis by FSM banding shows differences between lower and higher bands of FSM eligibility. Schools with lowest levels of FSM eligibility have, on average, almost two more science specialist teachers per 1,000 pupils than schools with the highest level of FSM eligibility.
Biology, chemistry and physics specialist teachers per pupil teaching science The measure of science teachers is further refined to include only those teachers who have specialisations in any of the traditional school sciences: biology, chemistry and physics. i.e. this excludes non-specialising teachers as well as those who specialised in another science.
• The national picture shows an average of 8.81 such teachers per 1,000 pupils across schools.
• The inequality of distribution across FSM eligibility bands emerges once again and, this time, is more pronounced. The variation across bands is quite large with schools serving pupils with the lowest levels of FSM eligibility having over 25 per cent more specialist teachers per capita (2.2 teachers) than those schools in the highest band of FSM eligibility.
We now break down our measurements still further to look at teachers specialising in specific sciences. Biology specialists
• The analysis shows that there are, on average, 4.40 biology teachers per 1,000 pupils.
• The breakdown of the distribution by subgroup shows that biology teachers are fairly evenly spread across GORs and FSM eligibility bands. This stands

208 Economic analysis
out as the exception to the increasing inequality and FSM eligibility band patterns that have emerged as we have considered all science teachers then science-specialists then biology, chemistry and physics science specialists. Thus, any inequalities in science staff are not due to inequalities in the supply of biology specialists.
Chemistry specialists
• Compared with biology specialists, chemistry specialists are relatively scarce with 2.56 teachers per 1,000 pupils across schools. Furthermore, this more limited supply is more unevenly distributed across schools. Half of the schools employ approximately 60% of chemistry specialists per capita.
• The breakdown across subgroups reveals noticeable differences across geographical regions. The South-East, London and Eastern GORs show the lowest number of teachers per 1,000 pupils.
• Further, there is a pronounced difference with expected numbers across FSM eligibility bands, with the schools with the lowest FSM levels enjoying 38 per cent more chemistry specialists per capita than schools in the highest band (though it should be noted that this amounts to approximately one teacher per thousand pupils).
Physics specialists
• The substantive story of physics is a more exaggerated version of that of chemistry: a smaller supply of teachers per 1,000 pupils, on average 1.85 teachers per 1,000 pupils and an even less equitable distribution across schools: The data show that half of the schools employ approximately two-thirds of the physics specialists per capita
• Regional patterns are again apparent, with noticeably lower numbers of teachers per 1,000 pupils in four GORs: London, South-East, Eastern and Yorkshire.
• Again, the largest systematic differences in teachers per capita are to be found across FSM bands with lowest FSM eligibility schools enjoying 100 per cent more physics specialists per capita (1.85 teachers), on average, than schools in the highest band.
Non-science specialising teachers per pupil teaching science The final measure for science was to consider the non-science specialising teachers who teach the subject.
• The national picture shows an average of 0.79 non-science teachers teaching science. The distribution of these teachers is very unequal: approximately half of schools are using three-quarters of non-science teachers per capita.
• Breakdowns by subgroup produced opposite results to those observed with the science-specialist teachers. This is as would be expected if non-science staff are used to make up the shortfalls of science specialists. Thus, schools in the three GORs (Eastern, London and the South East) use more non-science teachers per capita than other areas.
• The reverse pattern is also observed across FSM eligibility bands with schools in the lowest FSM band using 40 per cent fewer non-science teachers per capita (0.4 teachers) than schools in the highest band.
Part Three 209
Scientific staff shortage To some extent, the analysis of numbers of staff and the distribution of staff across England, the GORs and FSM eligibility bands is somewhat limited as it not possible to distinguish between supply and demand. That is, it is not possible to be certain that the lower numbers of physics teachers in the higher FSM eligibility bands is a result of lower demand for physics specialists per capita by those schools or a result of unmet demand i.e. supply not being sufficient to meet demand. Thus, we supplement our analysis of the numbers of teachers with an analysis of the extent to which the surveyed departmental head reported that their department had been affected by shortages of staff in the past three years. This element, in conjunction with the analysis of the numbers of staff, helps determine whether the observed differences in the distribution of staff of different types are indeed a function of lower demand in some areas or mainly as a result of unmet demand.
• Analysis17 reveals that, on average, a school has a 0.5 probability of reporting the department being considerably affected by a shortage in science-specialist teaching staff. This was not distributed evenly across schools.
• Staff shortage difficulties increase as the level of eligibility for FSM increases. The three GORs – Eastern, London and the South-East – consistently show the highest levels of staff shortage problems and so much so that a school serving a deprived population in the North East has a lower probability of reporting a staff shortage problem than a school in any of the three mentioned areas serving the lowest FSM eligibility band.
The patterns observed in the analysis of staff shortage problems are the opposite of those observed in the distribution of specialist teachers. That is lower numbers of specialist staff, higher numbers of the use of non-science staff and higher probabilities of staff shortages are being reported in schools with highest proportions of pupils eligible for FSM (especially in the Southern and Eastern GORs). This indicates that the observed patterns probably do not reflect different levels of demand for staff across regions, but are a function of supply. There is also an apparent difference across GORs in the responsiveness of the probability of reporting a problem in a GOR to the measure of FSM eligibility of the school. For example the North-East region shows virtually no responsiveness to increases in FSM eligibility whereas almost all other regions show an increase of 20 – 30 per cent as FSM eligibility increases from the lowest to the highest band. This level of detail shows that the issues of vertical equity may not be consistent across the country.
17The analysis is based on the probability that a head of department would register in the questionnaire that their department has been affected by shortages of science-specialist teachers ‘quite a lot’ or ‘a great deal’.

210 Economic analysis
11.2.3 The distribution of mathematics teachers The analysis of teachers of mathematics was conducted in the same manner as that of science teachers, in that we started with the numbers of maths teachers per capita then refined the analysis to look at maths-degree-holding teachers and then non-maths teachers. Total teachers per pupil teaching mathematics This measure looks at the distribution of the number of teachers teaching maths per 1,000 pupils across schools. The definition includes all those who teach maths (both specialists and non-specialists alike).
• The estimated number of teachers of mathematics per 1,000 pupils is 9.04 and there is a relatively even spread of those teachers per capita across schools.
• Analysis by subgroup shows there is some small variation across regions, such that the North-East has fewer teachers per capita and the East Midlands has the most. The number of per capita teachers increases with FSM eligibility, such that teachers with higher levels of FSM have more maths teachers (this is different from the pattern for all science teachers).
Total maths specialists per pupil teaching mathematics This measure uses teacher numbers who are reported as having a degree in maths, a degree with mathematical content or have specialised in maths for teacher training (i.e. non-specialists are excluded).
• The estimated average number of maths specialists teaching mathematics in maintained secondary schools in England is 6.81 teachers per 1,000 pupils, and there is a relatively even distribution of these teachers across schools.
• As was the case with science specialists, the analysis by FSM banding shows differences between the lower and higher bands, with schools with lowest levels of FSM eligibility having more maths specialist teachers per 1,000 pupils than schools with the highest level of FSM eligibility.
Teachers of mathematics with a maths degree This measure considers the distribution of only those teachers who hold a degree in maths.
• The average number of maths-degree holding teachers who teach the subject is 3.72 teachers per 1,000 pupils. These teachers are unevenly spread across schools such that 50 per cent of schools deploy less than 40 per cent of the maths-degree-holding teachers per capita.
• There is little systematic difference across regions with similar averages per capita, and similar measures of inequity within regions. However, when considering the breakdown across FSM eligibility bands, a familiar pattern emerges. The lower FSM eligibility bands enjoy a disproportionately greater share of maths-degree-holding teachers who teach the subject, than do the
Part Three 211
highest FSM eligibility schools, on average a 43 per cent (1.5 teachers) higher number of teachers per capita.
Non-maths specialised teachers This measure looks at the deployment of non-maths specialised staff (as described by the head of department) in the teaching of mathematics in maintained secondary schools in England.
• On average, there are 2.23 non-maths specialising teachers per 1,000 pupils teaching mathematics across English maintained secondary schools. The deployment of these teachers across schools is uneven.
• As with the deployment of non-science-specialised staff in the teaching of science, the use of non-mathematics specialising staff in the teaching of maths may occur because non-specialists are being used to counter a shortage of specialist staff. If this were the case then we would expect opposite patterns to that observed in the deployment of specialist staff such as maths-degree holders. This opposite pattern is most apparent in the deployment across FSM eligibility bands with highest FSM eligibility band schools using on average 87 per cent more non-maths specialised teachers than schools in the lowest FSM eligibility bands.
Shortages in Mathematics teaching staff As before, we use departmental heads’ survey responses on the extent of specialist-staff shortages affecting the department in conjunction with numbers of teaching staff to distinguish whether observed differences are mainly a function of differing demands or supply constraints.
• The analysis estimates that there is a 0.57 probability of a head of maths reporting that the department had been affected by a shortage of mathematics-specialist staff within the last three years. This number exceeds the probability of a similar problem in the science department, indicating a more severe problem in the supply of mathematics teachers.
• Like the distribution of the probability of staff shortages in science, the probability of a mathematics department suffering from a specialist staff shortage is different across GORs and is increasing in the eligibility of its pupils for FSM. However, although the relative variations across regions are similar, there is a marked difference between the manner in which science and mathematics departments suffer from shortages as eligibility for FSMs increases.
• Although the distribution is less variable than with science teachers, it is systematically more closely related to different levels of FSM eligibility. That is, the expected increase in probability of staff shortages is more sensitive to increasing levels of FSM eligibility with most GORs showing a 25 – 35 per cent increase in the probability across FSM bands. For example, although the North-East again shows the lowest levels of probability and has the lowest range of response (21 per cent difference between the lowest and highest FSM bands), the probability of observing a staff shortage in a North-Eastern school serving the highest FSM eligibility band is considerably higher that of a London school serving the lowest band of FSM eligible pupils.

212 Economic analysis
11.3 The role of teacher income in determining supply and the distribution of supply
In the previous sections we have demonstrated systematic differences in the numbers of specialist staff being employed across geographical regions and increasing levels of FSM eligibility within and across GORs. By linking the count data to the reported problems of staff shortages, we have demonstrated that these variations appear to more a function of limited supply than differing demands. In this section we look at the influence of teacher income relative to external income opportunities that exist for graduates with relevant degrees, in determining the supply of graduates becoming teachers and the influence of which schools they choose. The importance of the issues explored in this section is highlighted by Professor Smith’s recommendation in addressing supply issues that:
The Inquiry recommends that more must be done to address the issue of pay and other incentives to teachers of mathematics and other shortage subjects
Recommendation 2.8 (Smith, 2004). However, it should be noted that this recommendation is made despite rather mixed evidence from previous research. For example, Smithers and Robinson (2003) in looking at the motivations of teachers who leave find ‘salary seems relatively unimportant in decisions to go but … if raised would encourage some to stay’ (p. 87). However, Dolton and Van Der Klaauw (1999) find that their research:
…points to the importance of the wage and relative foregone earnings in turnover decisions. These results suggest at the most simplistic level that the higher the opportunity wage outside teaching the more likely teachers are to leave teaching for an alternative career. In addition, the higher the wage in teaching the less likely the teacher is to quit a teaching job for career or family reasons (p. 548).
Further, using US data, Eide et al., (2004) found that:
Relative teacher salary and non-teaching career options are also important determinants of the type of individuals who choose to enter teaching. That is, teacher salary and alternative labour-market options affect both the quantity and the quality of the teacher work-force (p. 237).
Despite finding that salaries do have an influence on supply, Eide et al., (2004) raise the question whether salaries are the most effective instrument with which to

Part Three 213
influence supply. They conclude that, given difficulties in implementing ‘market-type’ solutions, policy makers should consider:
… non-monetary incentives that would sufficiently compensate [potential] high-quality teachers such that they would be willing to accept a lower salary than in a non-teaching occupation (p. 241).
Thus, the objective of this section is to link the new data derived from this research with data on labour market conditions to supplement the existing literature on teacher labour supply. The underlying conceptual model underpinning this section is based on the economic notion of (compensating) wage differentials. The idea explored is that the further teacher salaries are away from an equilibrium level, the larger we would expect the gap to be between supply and demand. If we can somehow measure the responsiveness of this disequilibrium to changes in the wage rate, then we may be able to gain some understanding of how wage rates may be used to influence supply and the distribution of supply. We are able to attempt this exploratory analysis in this research by exploiting the idea that the teaching salary scale creates different opportunity costs of becoming a teacher in different local labour markets and different school conditions. We must stress that this analysis is exploratory and, given the limited nature of the data, subject to several important caveats which are described in further detail in the economic appendix. Principally, we regard this analysis as a preliminary scoping exercise to see whether there exists any further potential in using wages or other compensating instrument (which need not be financial) to tackle issues of supply and distribution of supply. This section may serve as useful guide to direct the efforts of future research towards the pertinent questions.
The analysis showed that non-teaching average salaries for graduates are generally higher in Eastern, London and South East regions. For the specialist degree holders in chemistry and physics, their expected non-teaching salaries are also higher in the North West and Yorkshire. Mathematics and related subject holders (e.g. statistics) generally have higher average salaries outside of teaching except in the North East and South West. Conversely biology degree-holding graduates typically have lower salaries than teachers (excepting South West and North West) and always have lower average salaries than chemistry, physics and maths degree holders (and quite often lower than the graduate average). These patterns are interesting because they imply that graduates with different specialisations and in different GORs face very different opportunity costs of becoming teachers. Furthermore, it is noticeable that responsiveness to FSM eligibility is greater in those GOR where the opportunity cost is highest. Finally, biology specialists show the least variation across GORs and FSM eligibility groups and also have a relatively low opportunity cost of becoming a teacher across all regions. Thus, the data show an apparent relationship between supply, school characteristics and local labour market conditions. However, analysis of the Labour Force Survey in conjunction with the survey data imply that teachers and potential teachers have a relatively modest responsiveness to income, leading to a

214 Economic analysis
tentative conclusion indicating that salary-based incentives may not be the most effective means of addressing supply issues. 11.4 Overall conclusion of economic analysis The analysis of teacher numbers per capita across England and in particular across GOR and differing levels of pupil FSM eligibility reveal a number of interesting patterns that have a significant policy relevance. Firstly, although the head count of per capita teachers in mathematics and science subjects across England is relatively even, consideration of the specialisation and nature of those teachers reveals a very different pattern. Specialised staff per capita (e.g. maths degree holders) are relatively and consistently far more scarce in relatively deprived areas, and especially in those areas in which employees with these specialisations have a higher expected non-teaching salary. Indeed, in those geographical areas which have higher non-teaching salaries, the relationship between deprivation and a lower supply appears most pronounced. Similarly, the relationship between supply and deprivation is most pronounced in those disciplines that have the higher external salaries. On a similar note, economic analysis corroborates earlier findings that many schools are using non-specialists to make up for the shortfall of scarce specialists. The relationship is such that those schools with high FSM levels in areas which have higher non-teaching salaries are more likely to use higher numbers of non-maths specialising staff. Thus, this study adds an additional component to the research showing general shortfalls in the levels of specialist staff in science and mathematics. The extra dimension is that this shortfall is not evenly distributed across schools and shows a geographical- and deprivation-related trend. The trend is such that vertical equity principles (directing greater resources to greater need), particularly in the more affluent South and South-East areas, are violated – that is, the distribution of the already limited supply is tilted against schools serving relatively deprived areas. The tentative relationship estimated between levels of relative salaries and supply indicates that policy makers may potentially use teacher salaries as an instrument to address supply and the distribution of supply issues. However, further analysis showed a seemingly low responsiveness of supply to income and this indicates a prohibitively expensive exercise and there may exist other, more cost-effective, instruments that could be used. For example, if teachers or potential teachers are indifferent between an extra £5,000 in salary and protected non-teaching time, then protected non-teaching time has an equivalent income value of £5,000. If protected non-teaching time could be implemented at a cost less than providing an additional £5,000 in salary, it represents a more cost-effective manner of obtaining the same effect.

Part Three 215
However, if income or other instrument is used, the analysis still implies that geographically-specific policies may still be required. For example, the compensating salary (or equivalent) variation required to influence specialist staff in London or the South East to go to schools serving high FSM eligible schools will be larger than in the North-East as the relative teaching opportunity cost is generally higher and supply demonstrate a greater sensitivity to increasing levels of deprivation. Thus, the analysis suggests that targeted incentives may be required (rather than incentives applied across the board) which may differ across GORs if issues of the inequitable distribution are to be addressed.
216 Conclusion
CONCLUSION

Conclusion 217
Conclusion In concluding this report, we review findings, as well as draw together key results for mathematics and science, and pose questions for further consideration that have emanated from the data analysis. The qualifications and deployment of mathematics and science teachers: implications and questions Based on responses from departmental heads, around one-quarter of the teachers deployed to teach mathematics were non-specialists18 or were principally teachers of other subjects. In science, the corresponding figure, whilst not negligible, was less extreme: eight per cent of science teachers were non-specialists or were principally teachers of other subjects in contrast to the 24 per cent for maths. For science, rather, the sharp imbalance between the school sciences in teachers’ qualifications was an outstanding feature. In effect, in the science teaching population, biologists outnumbered chemists or physicists by around two to one. Further, physics specialists, as well as constituting the smallest group of the three, had also attained lower degree classes on average. The overall figures for the qualifications of mathematics and science teachers mask inequity in staffing between schools. In maths, the proportion of non-specialists teaching the subject was not distributed evenly across schools. Thus, teachers who were not maths specialists were most often found in the lowest attaining schools, those serving areas of socio-economic deprivation and those with an 11-16 age range. Additionally, in science the imbalance in the representation of biology, physics and chemistry was unevenly spread across schools. For example, one-quarter of 11-16 schools did not have any physics specialists. Further, imbalance was also evident within schools in terms of pupils’ ability: for instance, in maths, pupils set in designated ‘low ability’ groups had an increased chance of being taught by a teacher without a post-16 qualification in the subject. Whilst not suggesting that teachers’ qualifications necessarily equate with the quality of teaching, these findings give rise to a number of implications and questions.
• National projections of maths teacher numbers produced as part of the
research predicted that around one-quarter of the secondary school maths teaching population were non-specialists or were principally members of other departments. Does this finding once again highlight the imperative (see DfES, 2004) of a continued focus on attracting as many maths specialists into the profession as possible?
• Notwithstanding this imperative, analysis presented in the Smith Inquiry showed that making up the shortfall of mathematics specialist teachers with maths graduates may not be possible because of the high proportion
18‘Specialist’ is defined as those teachers holding either a degree in maths or a degree incorporating maths (and equally, the sciences) or having specialised in mathematics (or sciences) as Initial Teacher Training (ITT).
218 Conclusion
of UK maths graduates needed to fill all the allocated ITT training places (40 per cent in 2004–05) (Smith/DfES, 2004: 46). Given the unlikelihood of this, the Inquiry suggested that other measures, such as the current programme of enhancing mathematics ITT for non-maths graduates, should be pursued. In addition, because of the proportion of non-specialists currently teaching maths, a further question raised by this research is: what kinds of professional development can be made available to those non-specialists who are already teaching maths to extend their knowledge in the subject? What is the most appropriate type of professional development for this cohort of teachers?
• In terms of science, a key question is: what can be done to achieve a more even representation of biology, chemistry and physics teachers at key stages 3 and 4? At present, there are lower numbers of teachers with a degree in physics or chemistry (compared with those holding a biology degree). The consequence of this is that they teach smaller proportions of science time throughout key stage 3 and for single award and double award science. This inevitably means that students receive less exposure to specialists in physics in particular, as well as chemistry. Could this perhaps affect students’ perceptions of these sciences and possibly militate against their selecting them for further study?
• Recent research (Smithers and Robinson, 2005) concluded that ‘Physics is in danger of disappearing as an identifiable subject from much of state education, through redefinition to general science and teacher shortage’ (p.55). Findings presented in this report concur with the assessment related to teacher shortage and also suggest that the same summation, though to a lesser degree, may apply to chemistry. What can be done to attract physics and chemistry specialists to the teaching profession? Further, can the current imbalance be reduced through physics - and chemistry-focused professional development for existing teachers (e.g. through the newly established Science Learning Centres and via professional bodies)?
• The findings regarding inequity in the staffing of mathematics and science lessons between schools also raises the question: how could this be better balanced in order to ensure that all pupils, regardless of the school they attend and their ability level, have a more equal chance of receiving specialist teaching? How far can effective current strategies and approaches used in individual schools (some of which were exemplified by the case studies visited in this research) be further shared to address the problem?
Deployment of support staff in mathematics and science departments: implications and questions Analysis highlighted the value of those support staff (e.g. teaching assistants, administrative assistants) who worked exclusively in the department. This occurred in only a minority of maths and science departments. However, where it was the case, it led to increased satisfaction among departmental heads and teachers with regard to the in-class and administrative support received. This was true for both subjects, though it was particularly the case in maths where there was also an association between satisfaction and the presence of dedicated support staff who were regarded as specialists in the subject. Furthermore, in addition to the departmental advantages, there was evidence that being based in one department was also of benefit to the support staff themselves. Thus, the maths-dedicated support assistants surveyed were

Conclusion 219
more satisfied overall than those working across the school and also had access to greater professional development opportunities. Some implications and questions raised by these findings are as follows:
• The findings of this study support the TDA’s pilot to develop the specialist HLTA role in mathematics and science in secondary schools. In addition, the evidence backs up the undertaking given in the DfES’s response to the Smith Inquiry to recruit, train and support, through ongoing CPD, a new cadre of mathematics-specialist HLTAs to enable every secondary school in England to recruit at least one by 2007/8. This research has also highlighted that, if this is not already the intention, maximum benefit would be derived by these support staff being solely attached to the maths department, alongside support staff with general teaching assistant and administration duties. In this regard, does deployment require further elaboration in policy documentation?
• This study does, however, suggest an area of potential challenge with regard to the provision of at least one maths-specialist HLTA per school. Whilst admittedly a small sample, three-fifths of the support staff currently working with maths departments and surveyed for this research did not possess sufficient qualifications to be eligible for HLTA status. Does this have implications for any training and recruitment purposes?
• On the whole, the majority of technicians surveyed in this research rarely or never carried out learning support tasks in the science department. None the less, where technicians were keen to take on further roles or duties, the most frequent response was for a greater involvement with pupils. Where it is of benefit to the department and welcomed by the technician, can technical staff become more involved with supporting learning in the classroom?
• Overall levels of job satisfaction amongst both maths and science support staff and science technicians were high, though levels of pay and opportunities for career progression were sources of dissatisfaction, particularly so for technicians. As support staff’s roles are extended in school, can their remuneration and career development prospects be increased?
Professional satisfaction among departmental heads and teachers of mathematics and science: implications and questions The majority of teaching staff surveyed were neutral or broadly satisfied with their working life, although a significant minority were dissatisfied. Satisfaction was slightly lower amongst heads of department than amongst teachers of maths and science. Areas of particular dissatisfaction were related to workload (amount of non-contact time, working hours and general workload) and pupil behaviour, especially so in science. Satisfaction with workload was also found to be closely associated with overall satisfaction amongst teachers and heads of both maths and science departments. In multiple regression analyses, which examined a number of possible predictors of overall satisfaction simultaneously, departmental shortage of specialist staff emerged as a strong and significant independent predictor of overall professional
220 Conclusion
satisfaction – or dissatisfaction – in maths and science departments, and amongst both teachers and heads of departments. These findings give rise to the following implications and questions.
• Some of the sources of dissatisfaction identified by maths and science teachers are issues that all teachers will contend with (e.g. workload, pupil behaviour – see Sturman, 2002). However, research by Smithers and Robinson (2004 and 2005) has suggested that teachers of maths and science leave the profession in larger numbers than would be expected. Therefore, further emphasis on the areas that cause them particular dissatisfaction may be needed. To date, these areas have already been the focus of attention, especially workload issues. Admittedly this study was undertaken before the national introduction of planning, preparation and assessment (PPA) time. None the less, given the associations between staff shortages and increased workload that this research identified (see Chapters 5 and 10), will PPA time by itself be sufficient to solve the workload issues of maths and science teachers and departmental heads, without further amelioration of specialist-staff shortages?
• Multivariate analysis presented in this report has shown the negative impact of shortages of specialist teaching staff on the job satisfaction of teachers and departmental heads. This is in addition to the inequity between schools in the qualifications of staff teaching maths and science (see Chapters 1, 6 and 11), and on top of the associations between pupil performance and teachers’ qualifications, as referenced in the Smith Inquiry and Roberts Report and in research on physics in schools and colleges (Smithers and Robinson, 2005). Thus, staffing and deployment in these subjects represents an area of continuing need. There has already been action and support to attempt to alleviate the situation (e.g. Golden hellos, diversification of routes into teaching, enhanced professional development opportunities). None the less, given the evidence from this study of 25 per cent of maintained secondary schools in England, the key question to emerge is: what else can be done to increase specialist teaching capacity in mathematics and science?

Appendix 221
APPENDIX

222 Appendix
APPENDIX
Economic analysis 1 Introduction The purpose of this economic analysis is twofold: first, to provide a description of the distribution and deployment of maths and science teachers across the country as implied by the survey data and to measure the equity of this distribution; and, second, in light of mixed evidence of the effect of teacher salaries on supply, to use the new data to explore the extent to which additional policy amenable variables such as teacher income, may be used to influence the supply and distribution of these teachers. The measure of deployment across England and the measure of the equity of this distribution is useful for a number of reasons. Firstly, although an average or aggregate number of suitably qualified staff members per pupil may provide a useful summary measure of the average supply, only a more detailed description is sufficient to pick out any systematic patterns that may be of policy relevance. For example, there may be a general national shortage of qualified science teachers, but the problem may be particularly acute in schools serving deprived areas. Identifying such trends may be useful to policy makers, as they may choose to place an emphasis of any future policy on increasing supply in deprived areas rather than just a general increase in supply per se. A second reason for defining and calculating a measure of the distribution is that, should it be conducted over time, it may be used as an instrument to measure the effect of Government policy. Such techniques have been used to good effect in addressing problems in the supply and distribution of supply of General Practitioners (Hann & Gravelle, 2004). The second aim of the economic analysis is to provide guidance on the extent to which teacher salaries or other means may be used as an instrument to affect supply and the distribution of suitable teachers. The current evidence on the effect of teacher salaries on graduate decisions to enter or leave a teaching occupation is somewhat mixed and we look to add to this literature by applying the underlying economic theories to the new data that has been uncovered in this study. In order to do so we produce an exploratory analysis which looks at the extent to which supply and shortages are correlated with a geographically varying opportunity (salary) cost of a teacher occupation. Many of the issues addressed in this analysis require a certain degree of familiarity with the rather technical techniques required in estimation with observational data (for example how we deal with missing values and how we measure inequality). In the report itself we provide only some of the key findings for the reader. This appendix provides details of all the techniques and regressions used in the analysis.

Appendix 223
2 Data considerations 2.1 Sources There are three main sources of data that drive this section: the head of subject questionnaire responses to staff and specialised staff numbers and whether their department has been affected by shortages; data from NFER’s Register of Schools (ROS) containing contextual data on the characteristics of the schools from which the responses came; and the Labour Force Survey (quarterly surveys 2003 to 2004), which is used to describe the characteristics of the local labour markets in which schools operate. The 2005 ROS data is also used to define the relevant population of schools and pupils. Note this does not completely match the 2003 ROS data which was used to define the population from which schools were randomly sampled, as a small number of schools have merged or changed their name and obtained new unique school identifiers. However, using the 2005 data appears appropriate as it contains the contextual data relevant to the responses at the time they were made. Data from the Quarterly Labour Force Survey (LFS) (eight waves from Spring 2003 to Winter 2004) were used to provide external data on the numbers of suitably qualified graduates within Government Office Regions (GOR) used as a proxy measure of the potential labour supply market. Income and occupation data are also contained in this survey and are used to construct an opportunity cost (in terms of salary) of becoming a teacher by degree type. 2.2 General modelling technique The empirical foundation underpinning all the analysis presented in this section is the ability to use the survey results to estimate the numbers of staff teaching mathematics and science across all schools in England. Firstly, it should be noted that the analysis of the survey results themselves should be broadly representative of the whole-countrywide picture as the sample was broadly representative of maintained secondary schools in England. Nevertheless it is useful to present the whole picture as implied by the survey, rather than just the survey results themselves (not least to remove any misleading impact of over-sampled school types). The rationale behind the extrapolation of survey results to a national picture is this: from the questionnaire we observe the variable of interest, say specialised maths teachers, call this variable y. From the ROS data, we observe the contextual variables of the school from which this observation came (pupil teacher ratios, key stage results, etc.), call these variables x. ROS also supplies us with values of x from all other schools within the defined population, i.e. those schools for which we do not observe y. Thus, if we understand the relationship between x and y and then we can use the x values contained in the ROS data to estimate y for each school from which we do not observe y. These predictions form the basis of the national picture.

224 Appendix
Clearly, this technique requires us to have a good understanding of this relationship. As we do not know this relationship, we use the survey results and ROS data to estimate this relationship. There are principally three major issues which may affect our regression model. They are:
• the nature of the dependent variable, y. • the effect of non-response within the survey. • the uncertainty caused by using estimates.
In summary, we deal with these considerations as follows and with a general principle that we address these issues and use the more complex models only where necessary, i.e. we use the simplest model wherever possible as long as we believe the results do not mislead and where we can justify use of the model. However, even where more complex models are used, they are standard and verifiable given the data issues. Furthermore, the main output – the predictions, are as easily understandable whatever model used and, by using the correct model, are more likely to be plausible unbiased and precise estimates. For example, the main dependent variables are staff counts (headcount). Such variables are non-negative and (should be) whole numbers. Where counts are low and there are counts of ones, twos and even zeros, then the distribution of these counts tend to be quite skewed. These types of dependent variables are not always well modelled by the standard regression model which assumes the dependent variable is continuous, may range between minus and plus infinity and has a symmetric distribution around the expected value, none of which apply in this case. Thus, a standard model may very well produce estimates of negative numbers – implausible predictions created by an inappropriate model choice. Our solution is to pick the model appropriate to the data, in this case a type of model known as Poisson regression, which, in addition to being indicated by standard statistical ‘goodness of fit’ tests is also the standard regression model used to model ‘count’ data (Kennedy, 2003). Other issues regarding the nature of the dependent variable include the clustering of responses within schools, within LEAs and within GORs. This implies use of a multi-level (a.k.a. panel data) Poisson model. Such models are available within software packages such as MLwiN but, especially for non-linear models such as Poisson regression, tend to be very time-consuming to estimate. Our initial model (not reported) results indicate that multi-level models were not required and using a standard Poisson model did not produce substantively different results. As a result, multi-level models were not used. The second major data issue involves that of missing data caused by survey non-response, a potential problem of ignoring non-response is that the estimated relationship between y and x may be biased. The key issue is that steps are taken to understand the nature of the mechanism that causes missing data and to determine

Appendix 225
whether the data are missing at random and thus the missing mechanism is ignorable. Our data-evidenced conclusion is that the missing mechanism is ignorable and thus no special steps need be taken for non-response from head of departments who were in the survey but provide either no response or an invalid response. The final data issue we consider is that we recognise that extrapolating the survey results to a national picture produces an estimate that is subject to some degree of uncertainty. In principle, the approach adopted in this section creates two sources of uncertainty: first order or sampling uncertainty and the second order uncertainty created by using an estimate of the relationship between y and x. First order uncertainty is illustrated by a simple example: suppose we have a coin which, when tossed, has a probability of landing heads up of 0.5. If we were to toss the coin ten times then we would expect five heads, however there is a non-negative probability that we would actually observe other counts of heads. In the context of this research, for each non-survey school we may derive an expected number of teachers given the school’s characteristics, but like the coin example there exists the potential for the actual number of teachers to differ from this number. The uncertainty that surrounds the estimates of the number of teachers in each non-surveyed school has implications for the estimate of the measures of the distribution of teachers across schools in England. We quantify the effect of this uncertainty on our measures of interest (the equity of the distribution) via Monte Carlo simulation methods which can be used to estimate standard errors bracketing the estimate of a measure of substantive interest. There are no substantive issues that arise that require additional attention. Second order uncertainty, involving the uncertainty surrounding our estimate of the relationship between y and x, is not addressed in this research beyond the choice of the Poisson model already discussed. 2.3 Measuring inequality Unlike measuring the total or average number of qualified teachers per pupil, something which has a fairly obvious calculation, measures of the equity of a distribution are not so straight forward. Traditional measures of describing distributions such as the standard deviation or inter-quartile range may disguise important characteristics of the nature of the inequality and may not be amenable to tracking changes over time. In light of such problems, economists have sought different means of measuring inequality and a popular choice is the Gini coefficient which is often used to measure income inequality. The Gini coefficient measures inequality on a scale of 0 to 1, where 1 measures perfect inequality (all the output/resources/income/etc. belong to one individual) and 0 represents perfect equality (all the outputs/etc. are proportionately distributed across the population). The nature of the Gini coefficient means that it is amenable for comparison across countries, time and disciplines. In this particular case, it may be used as a measure to compare the distribution of maths teachers against science teachers and against other types of teachers. It may also be used meaningfully across time and so can be used as a measure for the analysis of the
226 Appendix
success of any policy designed to address the inequality issue. Furthermore, recent developments, notably in the inequality of health, have attempted to deconstruct the measure of inequality into that which is caused by policy amenable variables and that which is caused by factors beyond the control of policy makers. The meaning of the Gini coefficient is most easily demonstrated by a diagram and is shown in Figure 11.1. This diagram shows the Lorenz curve, initially developed as a graphical representation of the income distribution. It plots the cumulative distribution of the outcome of interest, plotted against the cumulative distribution of the outcome sorted population. The technique is applicable to any variable of interest, such as maths or science teachers holding maths or science degrees, for example. In constructing the curve we sort or rank the population increasing in their holding of the variable of interest so the unit of the population with the lowest amount is shown first. We can then plot the cumulative proportions held by these units on the graph. So, for example with science teachers, if the lowest 40 per cent of schools employed 8 per cent of the science teachers and the next lowest 40 per cent held 30 per cent, we could plot two points on the graph at co-ordinates (40,8) and (80,38) as shown. Joining those points up, and all other points for all members of the population constructs the Lorenz Curve as shown, which by definition will originate at (0,0) and end at (100,100). However by itself, the Lorenz curve for a population is not particularly meaningful, some points of reference are required and these are provided by the two binding examples of perfect equality and perfect inequality.

Appendix 227
Figure 1 Gini measure of inequality
Consider the situation where teachers are equally distributed amongst the schools, then the ‘poorest’ (in terms of the number of teachers they have) 10 per cent of the population of schools would have 10 per cent of the teachers and the ‘richest’ 10 per cent of the schools would also have 10 per cent of the teachers. In all cases the cumulative proportion of the schools would equal the same cumulative proportion of teachers. In this case the hypothesized Lorenz curve would be a 45 degree line originating from (0,0) and ending at (100,100). This line represents perfect equality. Conversely, consider the situation where all the teachers are employed by one school. In this case the poorest 99 per cent of the schools will employ 0 per cent of the teachers, with the final school owning 100 per cent. The hypothesized Lorenz curve will originate from (0,0), follow the x-axis (cumulative per cent of the population) until it reaches 100 per cent of the population where it will follow the vertical y-axis to (100,100). This represents perfect inequality.
10 20 30 40 50 60 70 80 90 0
0
10
20
30
100
40
50
60
70
80
90
100
Lorenz curve
10 20 30 40 50 60 70 80 90 0
0
10
20
30
100
40
50
60
70
80
90
100
10 20 30 40 50 60 70 80 90 0
0
10
20
30
100
40
50
60
70
80
90
100
Cumulative proportion of schoolsC
umulative proportion of teachers A
B
Lorenz Curve
228 Appendix
Thus, the shape and position of an actual Lorenz curve is given meaning by its relative position to these two extreme cases. The more curved and closer to the bottom y-axis and right-hand side x-axis a Lorenz Curve is, the greater the inequality of the distribution of the resource/income/etc. However, rather than just relying on a visual inspection of the Lorenz curve, the Gini coefficient gives the curve some meaningful quantification. If we label the shaded area between the empirically determined Lorenz curve and the 45 degree line representing perfect equality, A and if we label the area between the Lorenz curve and the perfectly inequitable situation represented by the bottom y-axis and the right-hand x-axis, B. Then the Gini coefficient is equal to A/(A+B). As can be seen, the coefficient is bounded by 1 and 0 and is increasing in A. Not all inequality in distribution may be considered undesirable. For example, if schools have different numbers of pupils, it would appear reasonable that they have a proportionate difference in the number of teachers. Thus, the outcome variable measured is usually adjusted such that it reflects a variable that should be evenly distributed i.e. the variable is needs-adjusted. The simplest case is to adjust the number of teachers per school across schools to a number of teachers per (pupil) capita across schools. Further adjustments may be made to reflect a preference to allocate greater resources to those pupils with greater educational needs (as in needs- based funding formulae), but for the remainder of this section we will use number of teachers per 1,000 pupils. 3 The distribution of teachers per capita across
England This section calculates the Gini measure of the distribution of teachers per capita across schools in England using the stated survey results from the responding schools and the estimated results from the non-surveyed or non-response schools. The estimated results are based on a Poisson Regression model with parameters estimated from the survey results. 3.1 The multiple regression model The dependent variables were defined as the counts of teachers as provided by the returned head of department questionnaires. For science, these were the number of biology, chemistry and physics specialist teachers; the number of other-science teachers teaching science; and the number of non-science specialising teachers teaching science (whether they were from other departments or considered part of the science department). It was left to the head of department’s discretion as to whether the teacher was considered as a specialist. Similarly, for the mathematics department, the head of department defined maths specialist teachers and non-maths teachers teaching mathematics. These categories were modelled separately with similar sets of explanatory variables. A separate regression equation was specified for each category as we wished to allow

Appendix 229
for flexibility in the way the dependent variable responded to explanatory variables. For example, we may expect the effect of deprivation to work in opposite directions on, say, the number of mathematics teachers and on the number of non-mathematics teachers and should allow flexibility in the regression model to allow this. Multi-level models were considered to allow for the clustering of responses within schools, though our initial results suggested this additional level of sophistication was not required. Similarly missing survey responses were considered ignorable and there is no requirement for a two-stage model to obtain an unbiased estimate of the relationship between y and x. Explanatory variables were chosen on the basis of a priori theoretical expectations, predictive power and availability in the ROS and LFS datasets. For example, the number of pupils within a school was expected to be a strong driver behind the number of teachers, therefore this variable would be included in the regression model whether it is revealed to be significant or not (though we would be very surprised were it not significant!). Similarly variables such as the ratio of mean market wage for that specialism to mean teacher’s wage in that GOR are included. Other variables (such as dummies for GORs) which have no policy relevance or strong a priori rationale for inclusion are only included if they are statistically significant. In the end, an elective set of explanatory variables are included, which are consistent across all regressions. It should be noted that predictions (which are the main outcome of interest) were largely invariant to marginal changes in which variables were included. These variables are:
• the number of pupils across all ages within that school (ROS, 2005) • percentage of free school meals (FSM) pupils (ROS, 2005) • GOR standardised percentage of FSM pupils (constructed from ROS,
2005) • diversity of ethnic make-up of pupils (ROS, 2005) • key stage 3 results quintile for that department [baseline: middle quintile
group] (ROS, 2005) • single-sex status for school [all-male or all-female; baseline mixed] (ROS,
2005) • age-group banding for school [11-18 or other; baseline 11-16] (ROS,
2005) • pupil-teacher-ratio (PTR) for school (ROS, 2005) • ratio of market salary for degree to teacher salary for that GOR
(constructed from LFS). Other variables such as percentage of pupils with English as an Additional Language (EAL) were considered but did not add substantively to the predictive powers of the model due to a correlation between FSM and diversity measures. Including these types of such highly correlated variables introduces problems of multicollinearity – highly variable parameter estimates, with potentially odd signs, inflated standard
230 Appendix
errors and no increase in predictive powers. For these reasons, a relatively parsimonious set of variables were chosen. A number of the variables are included on theoretical grounds and require some further explanation. The ratio of market to teacher wages for that degree within the GOR is attempting to pick up the effect of opportunity salaries on teacher numbers. As market wages increase the effect on supply is predicted to be negative and so we expect a negative sign on the estimated parameter for this variable. The GOR standardised percentage of FSM pupils is designed to pick up the relative deprivation within in a school compared with its neighbouring schools. As schools within a local labour market may be in competition with other schools in its area for qualified staff, then this measure is intended to capture the relative level of deprivation in a school as compared with its neighbours, the expected sign on the estimated parameter for this variable is negative. Similarly, the PTR for the school may pick up the effects of the characteristics of a school as measured through the desire or ability to attract and retain a general level of teachers (per pupil). Finally, the key stage 3 quintile results are used as a predictor of staff numbers. Note that there may be a simultaneous relationship between key stage 3 results and the number of qualified staff in a department (i.e. key stage 3 results are endogenous and a function of qualified staff), thus estimating the effect of key stage 3 results on staff numbers would require additional steps. However, as we are principally interested in the predictive powers of key stage 3 on the number of staff then it is sufficient to effectively measure the correlation between the variables as is done here. The results are broadly consistent with a proiri expectations: staff numbers are increasing with number of pupils and specialist staff numbers with key stage 3 attainment in that department. Non-specialist staff numbers are decreasing in key stage 3 attainment and increasing in the opportunity cost of market salary (e.g. use of non-maths teachers teaching maths is higher in areas where maths- (and related subject-) degree holders can earn relatively high salaries outside teaching). Other variables, such as the percentage of pupils qualifying for FSM did not always behave as expected, but added to the predictive power of the regression model in many cases and so were left in (again it is worthwhile noting that we are interested in using the %FSM as means of prediction rather than as a means of testing a hypothesis). Although individual variables vary in their statistical significance across regression equations, the statistical model itself was significant in all cases and provides an unbiased basis for estimating teacher numbers for all remaining schools in the population. To allow for the variation in the sample unexplained by the model, first-order probabilistic uncertainty analysis was conducted on the predictions of the staff numbers using Monte Carlo simulation. 3.2 Outcome variables Having conducted the regression model, produced estimates and combined these with our observed survey values, we now have a picture of the number of biology, chemistry and physics (B,C and P) specialists teaching science; other-science

Appendix 231
specialists teaching science; non-science specialising teachers teaching science; mathematics specialists teaching maths and non-maths-specialising teachers teaching maths per school across all schools with valid ROS 2005 data in England. From the ROS 2005 data, we also know pupil numbers per school and the PTR per school. From this information, we construct the following per capita adjusted measures of interest (head count of teachers per 1,000 pupils per school):
• general number of teachers • total teachers teaching mathematics • separate models for mathematics-specialist teachers teaching mathematics
(excludes non-maths teachers), maths degree holding teachers and non-maths teachers teaching mathematics
• total teachers teaching science • total science-specialist teachers (excludes non-science teachers) • total B,C and P specialist teachers (excludes non- and other-science teachers) • separate models for B,C and P teachers and non-science teachers.
In addition, we have head of department responses on whether staff shortages have created problems for the department. The distribution of the probability of there being a problem can also be measured across schools via a Gini coefficient. If all schools were as likely to have the same probability of problems then the coefficient would equal zero. Thus we have an additional two outcome measures whose distribution across schools is of interest, they are the probabilities of a head of department reporting:
• a maths department staff shortage • a science department staff shortage.
As these two outcomes were captured using ordered categorical scales in the survey, ordered probit models (as opposed to Poisson regression) were used in the latter two regression models. The general number of teachers is included as a comparator group by which to compare the distribution of maths and science teachers. This will allow us to identify whether unequal distributions of maths and science teachers are specific to that specialisation or just reflecting a general distribution problem per se. 3.3 The distribution of teachers per capita across England The data for this measure of equity are provided by ROS, 2005 and so no estimated results are used. The ROS data show an average of 59.37 teachers per 1,000 pupils across all schools in England. Figure 11.2 shows the distribution as measured by a Lorenz Curve and this particular Lorenz Curve is relatively close to the line of equality indicating a distribution of overall teachers which is relatively even. This is

232 Appendix
reflected in a Gini coefficient of 0.0596 indicating little inequality. In terms of understanding how unequal the distribution is, it is helpful to remember that the measure is bounded by 0 and 1 and so may be interpreted like a proportion or percentage – that is, given the stock of teachers per pupil, it is only 5.96 per cent unevenly distributed. Thus, in terms of numbers of teachers per pupil across schools, there appears to be little variation in the distribution of those teachers across schools. Figure 2 Distribution of teachers per pupil across schools
0.2
5.5
.75
1cu
mul
ativ
e pr
opor
tion
of te
ache
rs p
er p
upil
0 .25 .5 .75 1cumulative proportion of schools
actual distribution equality
The distribution may also be measured within GORs and within quintiles of %FSM entitlement. The purpose of this sub-group analysis is to highlight any variations in the national picture across important sub-groups. The graph below shows the average number of per 1,000 capita teachers per school within GOR and FSM percentage groups as a 3-dimensional column. If there are no systematic deviations across these groups then we would expect all these columns to be broadly of the same height with no discernable pattern. The graph is followed by a cross-tabulation showing the actual figures used to construct the graph. The column graph may also be used in conjunction with the Lorenz Curve and Gini-Coefficient. In particular, the column graph may be used to observe whether inequality as measured by the Gini-Coefficient is random or related to geographical location, deprivation or a mixture of the two.
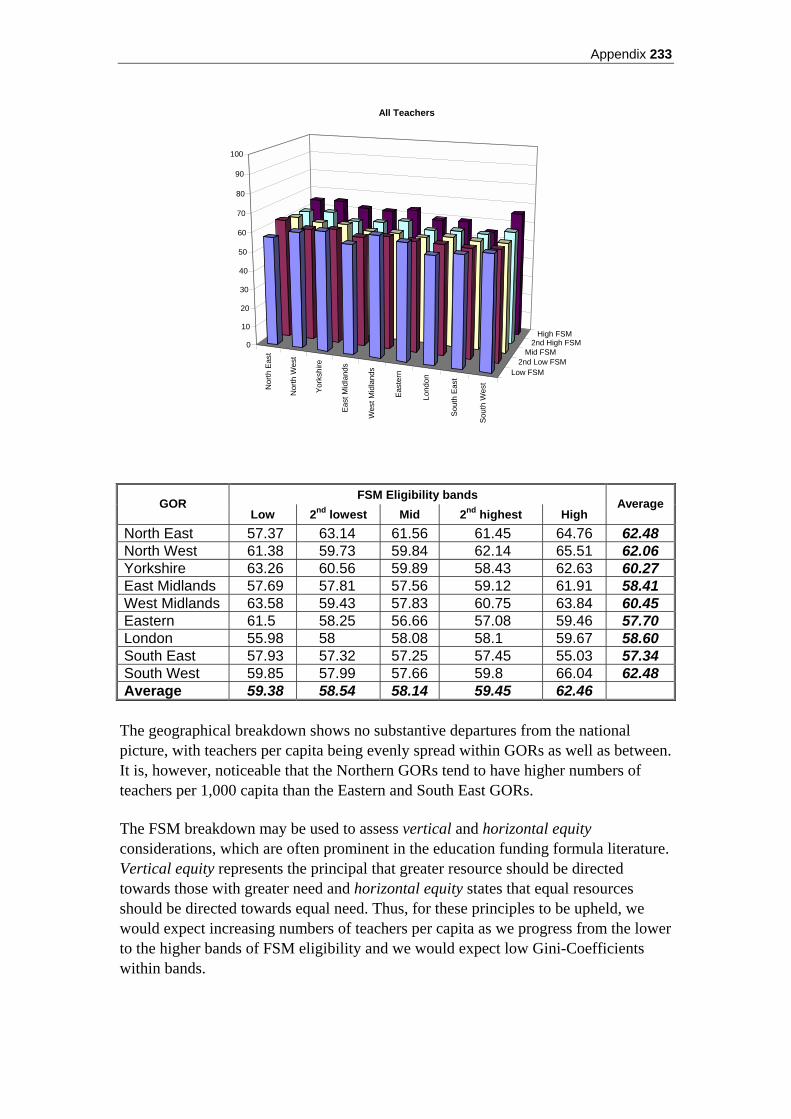
Appendix 233
Nor
th E
ast
Nor
th W
est
York
shire
East
Mid
land
s
Wes
t Mid
land
s
East
ern
Lond
on
Sout
h Ea
st
Sout
h W
est
Low FSM2nd Low FSM
Mid FSM2nd High FSM
High FSM0
10
20
30
40
50
60
70
80
90
100
All Teachers
FSM Eligibility bands GOR
Low 2nd lowest Mid 2nd highest High Average
North East 57.37 63.14 61.56 61.45 64.76 62.48 North West 61.38 59.73 59.84 62.14 65.51 62.06 Yorkshire 63.26 60.56 59.89 58.43 62.63 60.27 East Midlands 57.69 57.81 57.56 59.12 61.91 58.41 West Midlands 63.58 59.43 57.83 60.75 63.84 60.45 Eastern 61.5 58.25 56.66 57.08 59.46 57.70 London 55.98 58 58.08 58.1 59.67 58.60 South East 57.93 57.32 57.25 57.45 55.03 57.34 South West 59.85 57.99 57.66 59.8 66.04 62.48 Average 59.38 58.54 58.14 59.45 62.46
The geographical breakdown shows no substantive departures from the national picture, with teachers per capita being evenly spread within GORs as well as between. It is, however, noticeable that the Northern GORs tend to have higher numbers of teachers per 1,000 capita than the Eastern and South East GORs. The FSM breakdown may be used to assess vertical and horizontal equity considerations, which are often prominent in the education funding formula literature. Vertical equity represents the principal that greater resource should be directed towards those with greater need and horizontal equity states that equal resources should be directed towards equal need. Thus, for these principles to be upheld, we would expect increasing numbers of teachers per capita as we progress from the lower to the higher bands of FSM eligibility and we would expect low Gini-Coefficients within bands.

234 Appendix
In accordance with the principals of vertical equity, there is a slight but general trend of increasing resource per pupil as we move up the eligibility bands. However, there is an equally slight but noticeable trend for increasing inequality of distribution of teachers within quintiles as we move up the FSM eligibility classifications. That is, the distribution is less evenly distributed within schools with the highest band of FSM eligibility, indicating that there may be marginal horizontal equity issues within the highest band of FSM entitlement. In conclusion, this type of analysis indicates that the distribution of all teachers in England does not appear to be much of an issue. The Gini-Coefficient indicates an even per capita spread across all schools and the sub-group breakdown show no alarming patterns across geographical regions or FSM bands. The apparent slight bias towards increased numbers of teachers within the highest-FSM qualifying bands is in accordance with the principles of vertical equity. The distribution of science teachers Total teachers per pupil teaching science subjects This measure looks at the distribution of the number of teachers teaching science per pupil across schools. The definition include specialists and non-specialists alike, that is it includes teachers with specialisms in biology, chemistry, physics, other sciences and teachers who specialise in other subjects. Overall, there are on average 10.06 teachers per 1,000 pupils teaching science subjects within maintained secondary schools in England. The Gini coefficient is 0.0847 (standard error19= 0.0148) indicating a marginal increase in inequality of the distribution of these teachers above the general distribution of teachers per pupil.
19 Gini-coefficient standard errors are computed via a Monte Carlo simulation and reflect first-order uncertainty regarding the estimated outcomes of the non-surveyed or non-responding schools.

Appendix 235
Figure 3 Distribution of science teachers per pupil across schools
0.2
5.5
.75
1cu
mul
ativ
e pr
opor
tion
of te
ache
rs p
er p
upil
0 .25 .5 .75 1cumulative proportion of schools
actual distribution equality
The marginal increase in inequality of the distribution of science teaching teachers per pupil is in accordance with the notion that there is a greater problem with the distribution of science teachers than the distribution of teachers per se. However, the fact the increase is so marginal illustrates that, in terms of the number of teachers teaching science, the distribution of these teachers is still pretty even. For the column graph, please note the FSM band axis has been reversed relative to the all teachers graph in order to avoid larger columns obscuring smaller columns.

236 Appendix
Nor
th E
ast
Nor
th W
est
York
shire
East
Mid
land
s
Wes
t Mid
land
s
East
ern
Lond
on
Sout
h Ea
st
Sout
h W
est
High FSM2nd High FSM
Mid FSM2nd Low FSM
Low FSM0
2
4
6
8
10
12
14
All Teachers of Science
FSM Eligibility bands GOR
Low 2nd lowest Mid 2nd highest High Average
North East 11.19 10.2 Mid 9.54 9.44 9.64 North West 12 10.67 9.73 9.81 9.84 10.06 Yorkshire 12.13 10.62 9.88 9.49 9.99 10.09 East Midlands 12.14 10.55 10.15 9.85 10.1 10.38 West Midlands 12.7 10.59 10.36 9.52 10.06 10.14 Eastern 10.83 10.31 9.8 9.8 10.75 10.10 London 11.35 10.14 9.88 9.79 10.07 10.08 South East 10.87 10.14 10.28 9.71 9.91 10.05 South West 11.36 10.17 9.75 9.36 9.49 9.837 Average 11.46 10.36 9.49 9.68 9.96
In terms of the breakdown of distribution by GOR, as with the general teachers per capita distribution, the distribution across regions is similar i.e. little difference in the average number of teachers per capita across regions and similar levels of equality of the distribution within regions. However, notice that the Northern GORs no longer have greater numbers than their Midlands or Southern counterparts. The breakdown of the distribution across and with FSM bands is, however, different from the picture produced in the general teacher distribution. In this case, the trend is decreasing i.e. the higher the deprivation of the population a school serves, the fewer the expected numbers of teachers teaching science per capita. This is contrary to the principles of vertical equity where we would observe, all other things being equal, there to be greater numbers of teachers per pupil in the higher FSM bands. Within FSM bands, the equity of the distribution is relatively equal and stable. Thus, although schools with higher proportions of pupils eligible for FSM are likely to have

Appendix 237
fewer teachers of science per pupil than schools with lower levels of FSM eligibility, the distribution of teachers per capita amongst these schools with similar levels of eligibility is relatively even. In conclusion, the picture is not greatly changed from the distribution of all teachers per capita in that the number of teachers of science per capita is relatively evenly spread. There are, however, one or two small departures from the all teachers picture. The slight trend towards greater numbers of teachers within schools serving high-FSM populations is now reversed. That is, schools with high-FSM populations tend to have fewer science teachers per capita than schools in more affluent areas – a difference of 1.5 teachers per 1,000 pupils between the lowest and highest band of FSM eligibility. This is contrary to the principles of vertical equity. Total science specialising teachers per pupil teaching science subjects This measure excludes those teachers who have specialisms in areas other than science and/or predominantly teach subjects other than science. The objective of this and further refinements is to identify the distribution of ‘quality-adjusted’20 supply. That is, we make distinctions between the specialisms of the teachers teaching science. This refinement will allow us to pick up any patterns that are obscured by simply considering the numbers teaching science in total. Overall, there are on average 9.27 science specialist teachers per 1,000 pupils teaching science. The measure of the equity of this distribution is 0.0864 (std error = 0.0173). These findings may be considered relative to the number of teachers teaching science and show relatively little difference i.e. a relatively even national distribution of science specialist teachers teaching science.
20Based on the assumption that we would prefer our teachers of science to have a specialisation in science and in particular, specialisation in the sciences of biology, chemistry and physics.

238 Appendix
Figure 4 Distribution of science specialist teachers per pupil across schools
0
.25
.5.7
51
cum
ulat
ive
prop
ortio
n of
teac
hers
per
pup
il
0 .25 .5 .75 1cumulative proportion of schools
actual distribution equality
Similarly, the geographical breakdown shows no systematic variation from the national picture – the average number of teachers across regions is stable and the distribution within regions is comparable across regions.
Nor
th E
ast
Nor
th W
est
York
shire
East
Mid
land
s
Wes
t Mid
land
s
East
ern
Lond
on
Sout
h Ea
st
Sout
h W
est
Low FSM2nd Low FSM
Mid FSM2nd High FSM
High FSM
0
2
4
6
8
10
12
14
Science specialising teachers

Appendix 239
FSM Eligibility bands
GOR Low 2nd lowest Mid 2nd highest High
Average
North East 10.62 9.88 Mid 8.99 8.81 9.11 North West 11.32 10.11 9.25 8.97 8.85 9.27 Yorkshire 11.5 10.05 9.19 8.73 8.97 9.37 East Midlands 11.19 9.89 9.57 9.05 8.83 9.54 West Midlands 12.1 9.96 9.51 8.81 8.94 9.36 Eastern 10.29 9.49 9.08 8.5 9.12 9.14 London 10.74 9.56 8.96 8.9 9.07 9.20 South East 10.25 9.39 9.49 8.67 8.34 9.19 South West 10.91 9.68 8.84 8.52 8.72 9.25 Average 10.82 9.71 8.91 8.82 8.93
The analysis by FSM banding shows an increase in the difference between lower and higher bands of FSM eligibility. That is, when one considers measuring only science specialising teachers the inequitable distribution of those teachers between higher and lower levels of deprivation increases in favour of the least deprived schools, further violating the principle of vertical equity. Schools with lowest levels of FSM eligibility are, on average, expected to have almost 2 more science specialising teachers per 1,000 pupils than schools with the highest level of FSM eligibility. Biology, chemistry and physics specialised teachers teaching sciences The measure of science teachers is further refined to include only those teachers who have specialisations in the three core scientific subjects: biology, chemistry and physics. The national picture shows an average of 8.81 such teachers per 1,000 pupils across schools. The equity of the distribution as measured by the Gini-coefficient is 0.0944 (std error =0.0171). These national measures are comparable to the national measures of all teachers teaching science subjects and measures of the general number of teachers per capita. In particular, the national picture is relatively reassuring in that although the measures show a slightly less equitable distribution of specialist teachers, the difference is not startling.

240 Appendix
Figure 5 Distribution of biology, chemistry and physics specialists per pupil across schools
0
.25
.5.7
51
cum
ulat
ive
prop
ortio
n of
teac
hers
per
pup
il
0 .25 .5 .75 1cumulative proportion of schools
actual distribution equality
Nor
th E
ast
Nor
th W
est
York
shire
East
Mid
land
s
Wes
t Mid
land
s
East
ern
Lond
on
Sout
h Ea
st
Sout
h W
est
Low FSM2nd Low FSM
Mid FSM2nd High FSM
High FSM
0
2
4
6
8
10
12
14
Biology, Chemistry and Physics teachers
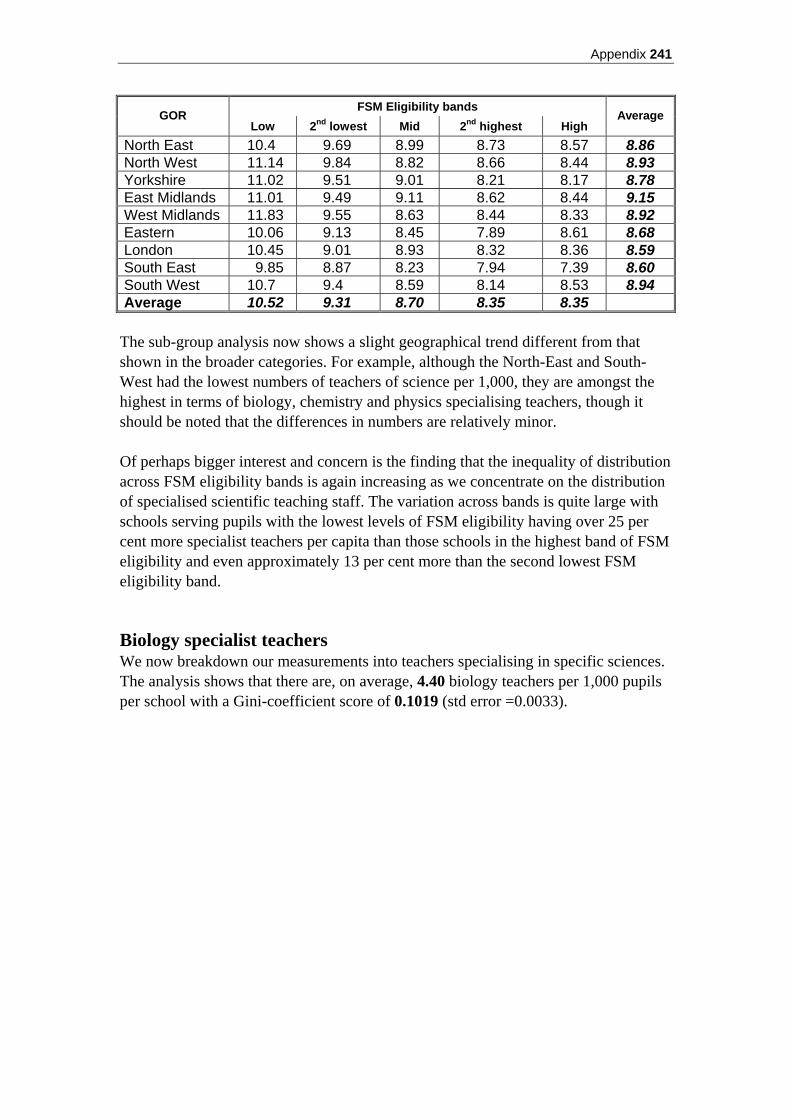
Appendix 241
FSM Eligibility bands GOR
Low 2nd lowest Mid 2nd highest High Average
North East 10.4 9.69 8.99 8.73 8.57 8.86 North West 11.14 9.84 8.82 8.66 8.44 8.93 Yorkshire 11.02 9.51 9.01 8.21 8.17 8.78 East Midlands 11.01 9.49 9.11 8.62 8.44 9.15 West Midlands 11.83 9.55 8.63 8.44 8.33 8.92 Eastern 10.06 9.13 8.45 7.89 8.61 8.68 London 10.45 9.01 8.93 8.32 8.36 8.59 South East 9.85 8.87 8.23 7.94 7.39 8.60 South West 10.7 9.4 8.59 8.14 8.53 8.94 Average 10.52 9.31 8.70 8.35 8.35
The sub-group analysis now shows a slight geographical trend different from that shown in the broader categories. For example, although the North-East and South-West had the lowest numbers of teachers of science per 1,000, they are amongst the highest in terms of biology, chemistry and physics specialising teachers, though it should be noted that the differences in numbers are relatively minor. Of perhaps bigger interest and concern is the finding that the inequality of distribution across FSM eligibility bands is again increasing as we concentrate on the distribution of specialised scientific teaching staff. The variation across bands is quite large with schools serving pupils with the lowest levels of FSM eligibility having over 25 per cent more specialist teachers per capita than those schools in the highest band of FSM eligibility and even approximately 13 per cent more than the second lowest FSM eligibility band. Biology specialist teachers We now breakdown our measurements into teachers specialising in specific sciences. The analysis shows that there are, on average, 4.40 biology teachers per 1,000 pupils per school with a Gini-coefficient score of 0.1019 (std error =0.0033).

242 Appendix
Figure 6 Distribution of biology specialists per pupil across schools
0.2
5.5
.75
1cu
mul
ativ
e pr
opor
tion
of te
ache
rs p
er p
upil
0 .25 .5 .75 1cumulative proportion of schools
actual distribution equality
Nor
th E
ast
Nor
th W
est
York
shire
East
Mid
land
s
Wes
t Mid
land
s
East
ern
Lond
on
Sout
h Ea
st
Sout
h W
est
Low FSM2nd Low FSM
Mid FSM2nd High FSM
High FSM
0
0.5
1
1.5
2
2.5
3
3.5
4
4.5
5
Biology Teachers

Appendix 243
FSM Eligibility bands GOR
Low 2nd lowest Mid 2nd highest High Average
North East 4.39 4.07 4.13 4.18 4.74 4.30 North West 4.77 4.36 4.11 4.3 4.57 4.35 Yorkshire 4.83 4.38 4.35 4.19 4.69 4.39 East Midlands 4.74 4.23 4.43 4.51 4.74 4.45 West Midlands 4.95 4.32 4.29 4.46 4.8 4.48 Eastern 4.58 4.3 4.21 4.44 4.94 4.34 London 4.59 4.25 4.51 4.29 4.69 4.50 South East 4.5 4.32 4.38 4.46 4.42 4.39 South West 4.6 4.32 4.36 4.55 4.5 4.40 Average 4.64 4.31 4.31 4.36 4.68
The breakdown of the distribution into subgroups yields no hidden patterns within subgroups with averages and distributions across GORs and FSM eligibility bands being remarkable stable with no discernable trends. Thus, although forming the bulk of the three core science subject specialisms, biology teachers are fairly evenly spread across GORs and FSM eligibility bands. This stands out as the exception to the increasing inequality, GOR and FSM eligibility band patterns that were emerging as we further refined our measures. Any inequalities in science staff are not due to inequalities in the supply of biology specialising teachers. Chemistry specialists Compared with biology specialists, chemistry specialists are relatively scarce with 2.56 teachers per 1,000 pupils across schools. Furthermore, this more limited supply is more unevenly distributed with a Gini-coefficient of 0.1566 (std error =0.0044).

244 Appendix
Figure 7 Distribution of chemistry specialists per pupil across schools
0.2
5.5
.75
1cu
mul
ativ
e pr
opor
tion
of te
ache
rs p
er p
upil
0 .25 .5 .75 1cumulative proportion of schools
actual distribution equality
Nor
th E
ast
Nor
th W
est
York
shire
East
Mid
land
s
Wes
t Mid
land
s
East
ern
Lond
on
Sout
h Ea
st
Sout
h W
est
Low FSM2nd Low FSM
Mid FSM2nd High FSM
High FSM
0
0.5
1
1.5
2
2.5
3
3.5
4
4.5
5
Chemistry Teachers
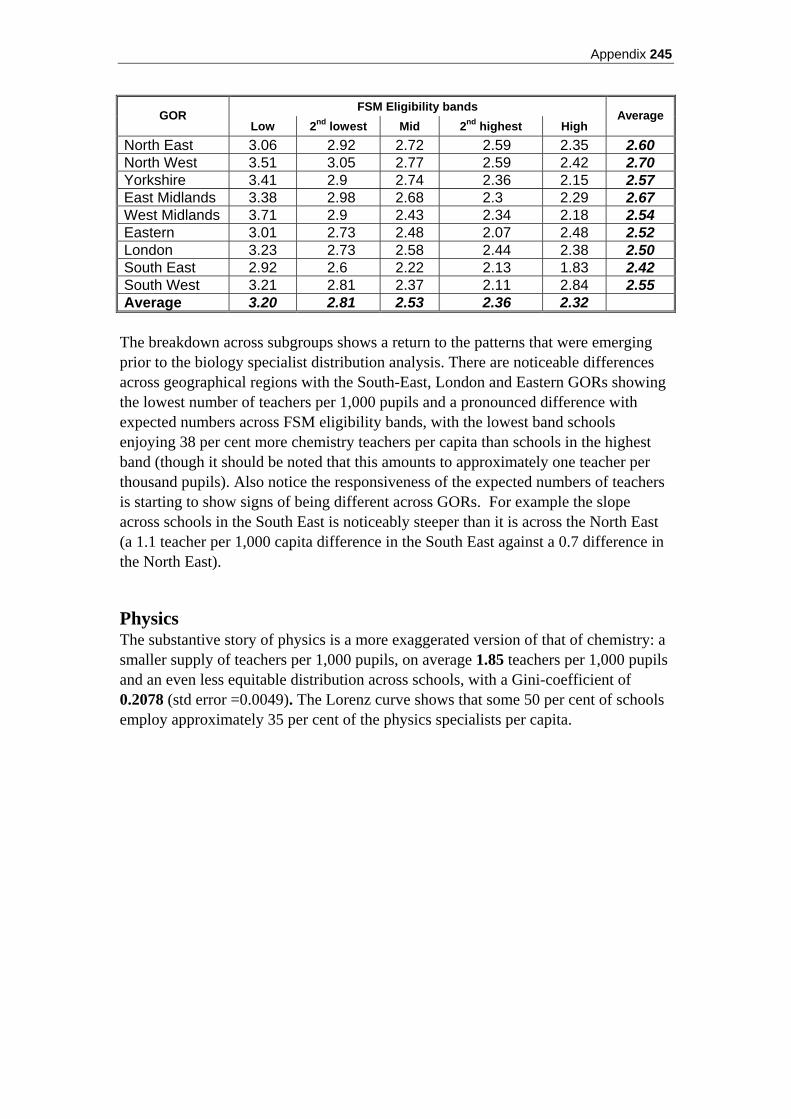
Appendix 245
FSM Eligibility bands GOR
Low 2nd lowest Mid 2nd highest High Average
North East 3.06 2.92 2.72 2.59 2.35 2.60 North West 3.51 3.05 2.77 2.59 2.42 2.70 Yorkshire 3.41 2.9 2.74 2.36 2.15 2.57 East Midlands 3.38 2.98 2.68 2.3 2.29 2.67 West Midlands 3.71 2.9 2.43 2.34 2.18 2.54 Eastern 3.01 2.73 2.48 2.07 2.48 2.52 London 3.23 2.73 2.58 2.44 2.38 2.50 South East 2.92 2.6 2.22 2.13 1.83 2.42 South West 3.21 2.81 2.37 2.11 2.84 2.55 Average 3.20 2.81 2.53 2.36 2.32
The breakdown across subgroups shows a return to the patterns that were emerging prior to the biology specialist distribution analysis. There are noticeable differences across geographical regions with the South-East, London and Eastern GORs showing the lowest number of teachers per 1,000 pupils and a pronounced difference with expected numbers across FSM eligibility bands, with the lowest band schools enjoying 38 per cent more chemistry teachers per capita than schools in the highest band (though it should be noted that this amounts to approximately one teacher per thousand pupils). Also notice the responsiveness of the expected numbers of teachers is starting to show signs of being different across GORs. For example the slope across schools in the South East is noticeably steeper than it is across the North East (a 1.1 teacher per 1,000 capita difference in the South East against a 0.7 difference in the North East). Physics The substantive story of physics is a more exaggerated version of that of chemistry: a smaller supply of teachers per 1,000 pupils, on average 1.85 teachers per 1,000 pupils and an even less equitable distribution across schools, with a Gini-coefficient of 0.2078 (std error =0.0049). The Lorenz curve shows that some 50 per cent of schools employ approximately 35 per cent of the physics specialists per capita.
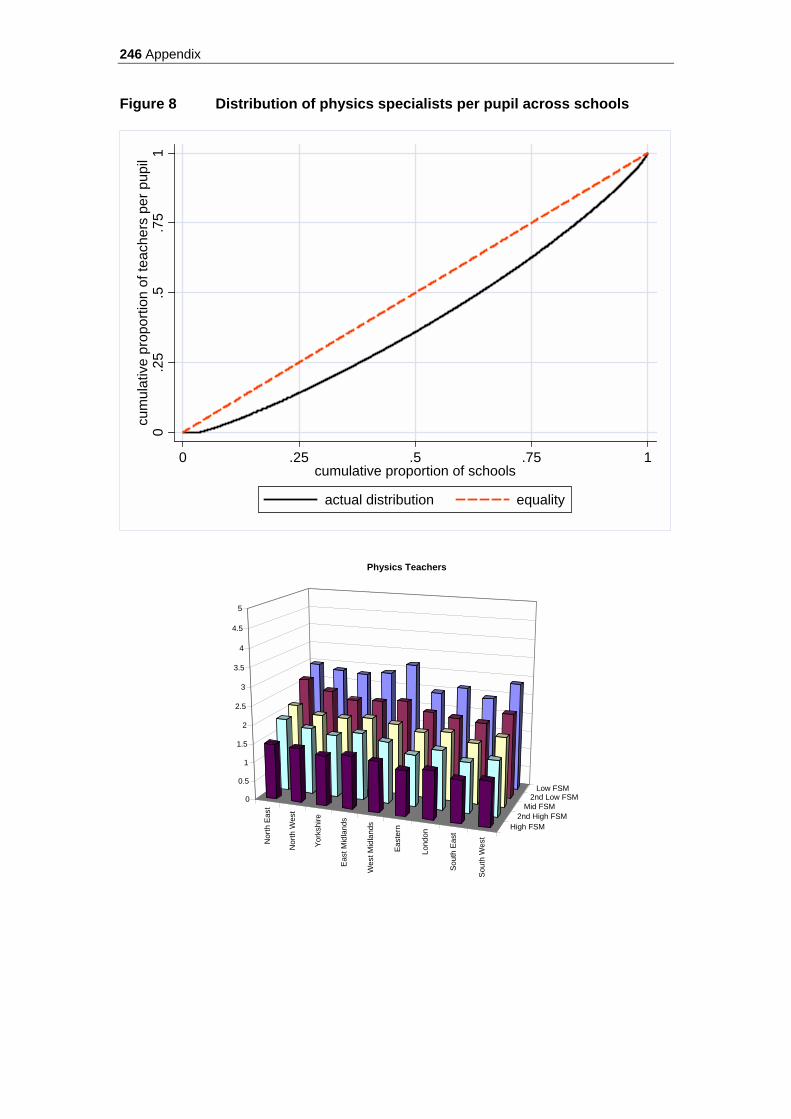
246 Appendix
Figure 8 Distribution of physics specialists per pupil across schools
0.2
5.5
.75
1cu
mul
ativ
e pr
opor
tion
of te
ache
rs p
er p
upil
0 .25 .5 .75 1cumulative proportion of schools
actual distribution equality
Nor
th E
ast
Nor
th W
est
York
shire
East
Mid
land
s
Wes
t Mid
land
s
East
ern
Lond
on
Sout
h Ea
st
Sout
h W
est
Low FSM2nd Low FSM
Mid FSM2nd High FSM
High FSM
0
0.5
1
1.5
2
2.5
3
3.5
4
4.5
5
Physics Teachers

Appendix 247
FSM Eligibility bands GOR
Low 2nd lowest Mid 2nd highest High Average
North East 2.96 2.69 2.14 1.95 1.49 1.96 North West 2.86 2.44 1.95 1.77 1.45 1.88 Yorkshire 2.79 2.24 1.93 1.66 1.33 1.82 East Midlands 2.89 2.27 2.01 1.8 1.41 2.03 West Midlands 3.17 2.33 1.91 1.64 1.34 1.90 Eastern 2.46 2.1 1.76 1.38 1.2 1.82 London 2.64 2.03 1.84 1.58 1.28 1.59 South East 2.43 1.96 1.63 1.35 1.13 1.79 South West 2.88 2.26 1.86 1.48 1.19 1.99 Average 2.69 2.19 1.86 1.63 1.35
Regional patterns are again apparent, with noticeably lower averages in four GORs, London, South-East, Eastern and Yorkshire. Again, though, the largest systematic differences in teachers per capita are to be found across FSM eligibility bands with lowest FSM eligibility schools enjoying 100 per cent more physics specialist teachers per capita on average than schools in the highest band. However, the responsiveness of physics specialists supply to increasing levels of FSM eligibility appears to be relatively equally high across all geographical areas. Non-science teachers The final sub-category of science teachers we consider are those of non-science specialising teachers teaching science. Unlike the supply of science-specialist teachers, increasing numbers of this category of teacher per pupil may not always be viewed in such a positive light. Although it is possible that non-science teachers are specifically chosen alongside scientific staff as complements, it is possible that they also act as substitutes i.e. instead of scientific-specialist staff. That is, teachers of other disciplines used to teach science may occur where there exists a shortage of specialist teachers. In this respect, non-science teachers may be regarded to some extent as capturing the shortage of science-specialist teachers. If this were the case, we would expect to see opposite patterns between the employment of science-specialist and non-science teachers teaching the subject. The national picture shows an average of 0.79 non-science teachers teaching science and the distribution of these teachers is very unequal with a Gini-coefficient of 0.4054 (std error =0.0055). The Lorenz curve shows that approximately 50 per cent of schools are employing 75 per cent of non-science teachers per capita teaching science.

248 Appendix
Figure 9 Distribution of non-science specialising teachers per pupil across schools
0
.25
.5.7
51
cum
ulat
ive
prop
ortio
n of
teac
hers
per
pup
il
0 .25 .5 .75 1cumulative proportion of schools
actual distribution equality
Note the scale of FSM eligibility is reversed relative to the previous few column graphs
Nor
th E
ast
Nor
th W
est
York
shire
East
Mid
land
s
Wes
t Mid
land
s
East
ern
Lond
on
Sout
h Ea
st
Sout
h W
est
Low FSM2nd Low FSM
Mid FSM2nd High FSM
High FSM0
0.5
1
1.5
2
2.5
3
3.5
4
4.5
5
Non-Science Background Teaching Science
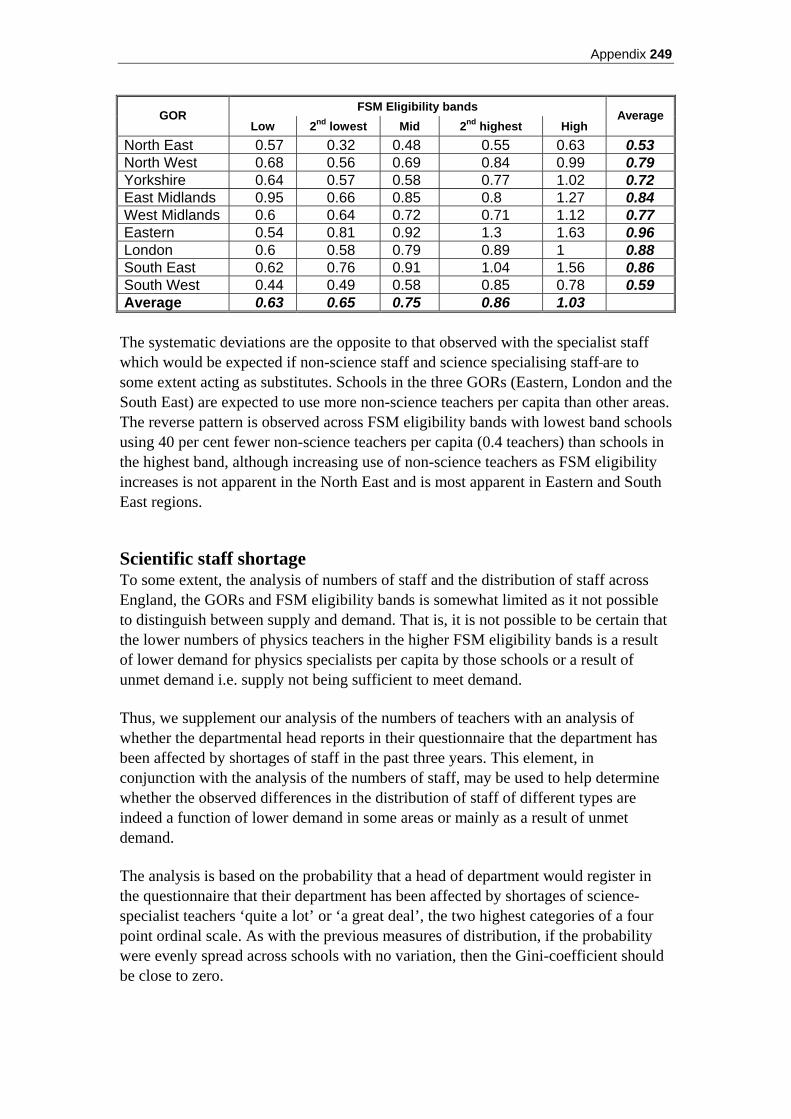
Appendix 249
FSM Eligibility bands GOR
Low 2nd lowest Mid 2nd highest High Average
North East 0.57 0.32 0.48 0.55 0.63 0.53 North West 0.68 0.56 0.69 0.84 0.99 0.79 Yorkshire 0.64 0.57 0.58 0.77 1.02 0.72 East Midlands 0.95 0.66 0.85 0.8 1.27 0.84 West Midlands 0.6 0.64 0.72 0.71 1.12 0.77 Eastern 0.54 0.81 0.92 1.3 1.63 0.96 London 0.6 0.58 0.79 0.89 1 0.88 South East 0.62 0.76 0.91 1.04 1.56 0.86 South West 0.44 0.49 0.58 0.85 0.78 0.59 Average 0.63 0.65 0.75 0.86 1.03
The systematic deviations are the opposite to that observed with the specialist staff which would be expected if non-science staff and science specialising staff are to some extent acting as substitutes. Schools in the three GORs (Eastern, London and the South East) are expected to use more non-science teachers per capita than other areas. The reverse pattern is observed across FSM eligibility bands with lowest band schools using 40 per cent fewer non-science teachers per capita (0.4 teachers) than schools in the highest band, although increasing use of non-science teachers as FSM eligibility increases is not apparent in the North East and is most apparent in Eastern and South East regions. Scientific staff shortage To some extent, the analysis of numbers of staff and the distribution of staff across England, the GORs and FSM eligibility bands is somewhat limited as it not possible to distinguish between supply and demand. That is, it is not possible to be certain that the lower numbers of physics teachers in the higher FSM eligibility bands is a result of lower demand for physics specialists per capita by those schools or a result of unmet demand i.e. supply not being sufficient to meet demand. Thus, we supplement our analysis of the numbers of teachers with an analysis of whether the departmental head reports in their questionnaire that the department has been affected by shortages of staff in the past three years. This element, in conjunction with the analysis of the numbers of staff, may be used to help determine whether the observed differences in the distribution of staff of different types are indeed a function of lower demand in some areas or mainly as a result of unmet demand. The analysis is based on the probability that a head of department would register in the questionnaire that their department has been affected by shortages of science-specialist teachers ‘quite a lot’ or ‘a great deal’, the two highest categories of a four point ordinal scale. As with the previous measures of distribution, if the probability were evenly spread across schools with no variation, then the Gini-coefficient should be close to zero.

250 Appendix
The analysis shows that, on average, a school has a 0.5 probability of reporting the department being significantly affected by a shortage in science-specialist teaching staff. The Gini-coefficient is 0.1623 (std error = 0.0083) indicating that there is a non-ignorable difference in the distribution of that probability across schools. Figure 10 Distribution of science-specialist staff shortages across schools
0.2
5.5
.75
1cu
mul
ativ
e pr
opor
tion
of s
taff
shor
tage
pro
babi
lity
0 .25 .5 .75 1cumulative proportion of schools
actual distribution equality
Nor
th E
ast
Nor
th W
est
Yor
kshi
re
Eas
t Mid
land
s
Wes
t Mid
land
s
Eas
tern
Lond
on
Sou
th E
ast
Sou
th W
est
low2nd Low
Mid2nd High
High0
0.1
0.2
0.3
0.4
0.5
0.6
0.7
0.8
0.9
1
Science Staff Shortage

Appendix 251
FSM Eligibility bands GOR
Low 2nd lowest Mid 2nd highest High Average
North East 0.35 0.30 0.37 0.38 0.40 0.38 North West 0.35 0.37 0.44 0.49 0.50 0.46 Yorkshire 0.36 0.36 0.46 0.53 0.57 0.48 East Midlands 0.34 0.42 0.49 0.54 0.55 0.48 West Midlands 0.33 0.40 0.52 0.56 0.55 0.49 Eastern 0.41 0.47 0.59 0.67 0.69 0.56 London 0.43 0.48 0.54 0.60 0.62 0.58 South East 0.47 0.54 0.65 0.71 0.75 0.60 South West 0.25 0.30 0.37 0.46 0.50 0.36 Average 0.39 0.43 0.51 0.56 0.56
The systematic variation in the probabilities of reporting a specialist-staff shortage problem are sufficient to be noticeable in a cross-tabulation. As expected problems are increasing with FSM eligibility but what is striking is the difference in this relationship across GORs. The three GORs – Eastern, London and the South-East – consistently show the highest levels of staff shortage problems and sufficiently so that a school serving a deprived population in the North East has a lower probability of reporting a staff shortage problem than a school in any of the three mentioned areas serving the lowest FSM eligibility band. It is also useful to observe the responsiveness of the probability of reporting a problem in a GOR to the measure of FSM eligibility of the school. The North-East region shows virtually no responsiveness to increases in FSM eligibility whereas almost all other regions show an increase of 20 – 30 per cent as FSM eligibility increases from the lowest to the highest band. This analysis, relative the previous graphs of science staff numbers, has placed a greater emphasis on different starting positions across GORs. The following graphs show the science staff composition in each of the GORs by level of FSM eligibility. Science Staff Composition by GOR and FSM Eligibility
0
2
4
6
8
10
12
14
teachersper 1000 capita
low 2nd low mid 2nd high highFSM Eligibility
North-East Science Teaching Staff Composition
biologychemistryphysicsother-sciencenon-science

252 Appendix
0
2
4
6
8
10
12
14
teachers per 1000 capita
low 2nd low mid 2nd high highFSM Eligibility
North-West Science Teaching Staff Composition
biologychemistryphysicsother-sciencenon-science
0
2
4
6
8
10
12
14
teachersper 1000 capita
low 2nd low mid 2nd high highFSM Eligibility
Yorkshire Science Teaching Staff Composition
biologychemistryphysicsother-sciencenon-science
0
2
4
6
8
10
12
14
teachersper 1000 capita
low 2nd low mid 2nd high highFSM Eligibility
East Midlands Science Teaching Staff Composition
biologychemistryphysicsother-sciencenon-science
0
2
4
6
8
10
12
14
teachersper 1000 capita
low 2nd low mid 2nd high highFSM Eligibility
West Midlands Science Teaching Staff Composition
biologychemistryphysicsother-sciencenon-science

Appendix 253
0
2
4
6
8
10
12
14
teachersper 1000 capita
low 2nd low mid 2nd high highFSM Eligibility
Eastern Science Teaching Staff Composition
biologychemistryphysicsother-sciencenon-science
0
2
4
6
8
10
12
14
teachersper 1000 capita
low 2nd low mid 2nd high highFSM Eligibility
London Science Teaching Staff Composition
biologychemistryphysicsother-sciencenon-science
0
2
4
6
8
10
12
14
teachersper 1000 capita
low 2nd low mid 2nd high highFSM Eligibility
South West Science Teaching Staff Composition
biologychemistryphysicsother-sciencenon-science
0
2
4
6
8
10
12
14
teachersper 1000 capita
low 2nd low mid 2nd high highFSM Eligibility
South East Science Teaching Staff Composition
biologychemistryphysicsother-sciencenon-science
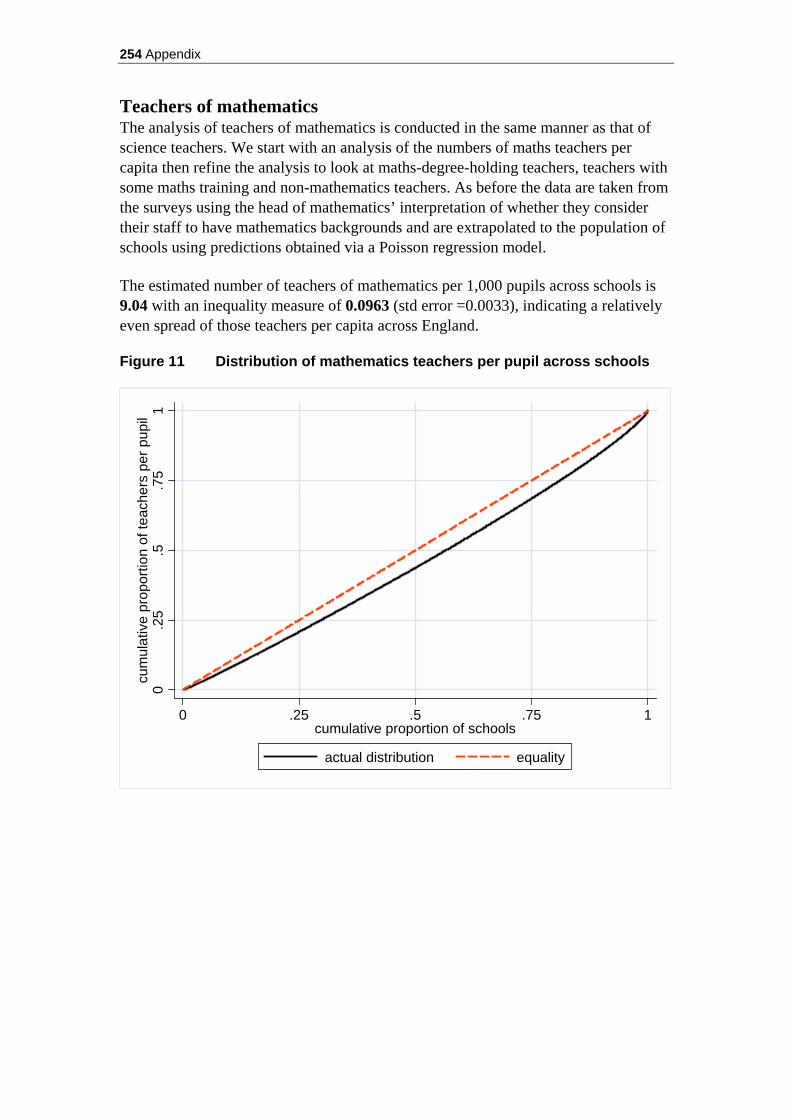
254 Appendix
Teachers of mathematics The analysis of teachers of mathematics is conducted in the same manner as that of science teachers. We start with an analysis of the numbers of maths teachers per capita then refine the analysis to look at maths-degree-holding teachers, teachers with some maths training and non-mathematics teachers. As before the data are taken from the surveys using the head of mathematics’ interpretation of whether they consider their staff to have mathematics backgrounds and are extrapolated to the population of schools using predictions obtained via a Poisson regression model. The estimated number of teachers of mathematics per 1,000 pupils across schools is 9.04 with an inequality measure of 0.0963 (std error =0.0033), indicating a relatively even spread of those teachers per capita across England. Figure 11 Distribution of mathematics teachers per pupil across schools
0.2
5.5
.75
1cu
mul
ativ
e pr
opor
tion
of te
ache
rs p
er p
upil
0 .25 .5 .75 1cumulative proportion of schools
actual distribution equality

Appendix 255
Nor
th E
ast
Nor
th W
est
York
shire
East
Mid
land
s
Wes
t Mid
land
s
East
ern
Lond
on
Sout
h Ea
st
Sout
h W
est
Low FSM2nd Low FSM
Mid FSM2nd High FSM
High FSM0
2
4
6
8
10
12
14
Teachers of Mathematics
FSM Eligibility bands GOR
Low 2nd lowest Mid 2nd highest High Average
North East 7.55 7.84 7.91 8.51 8.77 8.38 North West 9.15 8.76 8.74 9.2 9.82 9.18 Yorkshire 8.72 8.64 8.51 8.33 9.69 8.73 East Midlands 8.67 8.51 9.53 9.66 10.81 9.37 West Midlands 9.94 8.58 8.81 9.05 10.23 9.16 Eastern 8.98 8.76 9.26 9.66 10.54 9.20 London 8.9 8.44 8.77 9.27 9.67 9.25 South East 8.56 8.63 8.88 9.78 10.16 8.96 South West 8.74 8.34 8.38 9.44 11.14 8.64 Average 8.88 8.58 8.84 9.21 9.84
There is some small variation across regions. What pattern emerges is the North-East again having fewer teachers per capita and the East Midlands having the most. The number of per capita teachers is increasing in line with FSM eligibility as occurred with general teaching staff but was not observed with science teachers. This observation is consistent with the principles of vertical equity. All in all, the picture is very similar to that which emerged regarding the number of science teachers prior to refining the measure to look at specialists. Mathematics specialists This measure uses teacher numbers who are reported as having a degree in maths, a degree with mathematical content or have specialised in maths for teacher training. The estimated average number of maths specialists teaching mathematics in maintained secondary schools in England is 6.81 teachers per 1,000 pupils. The inequality measure is 0.0838 (std error =0.0065), indicating a relatively even distribution.

256 Appendix
Figure 12 Distribution of mathematics specialists per pupil across schools
0.2
5.5
.75
1cu
mul
ativ
e pr
opor
tion
of te
ache
rs p
er p
upil
0 .25 .5 .75 1cumulative proportion of schools
actual distribution equality
Note the FSM eligibility axis is reversed relative to the previous graph.
Nor
th E
ast
Nor
th W
est
York
shire
East
Mid
land
s
Wes
t Mid
land
s
East
ern
Lond
on
Sout
h Ea
st
Sout
h W
est
Low FSM2nd Low FSM
Mid FSM2nd High FSM
High FSM
0
2
4
6
8
10
12
14
Maths Specialisation Teachers

Appendix 257
FSM Eligibility bands GOR
Low 2nd lowest Mid 2nd highest High Average
North East 6.36 6.35 6.58 6.65 6.62 6.59 North West 7.75 7.02 6.84 6.77 6.97 6.92 Yorkshire 7.49 7.01 6.76 6.38 6.91 6.76 East Midlands 7.24 6.58 6.9 6.69 7.25 6.82 West Midlands 8.11 6.87 6.81 6.56 7.08 6.89 Eastern 7.51 6.79 6.64 6.38 7.26 6.72 London 7.53 6.95 6.98 7 7.2 7.10 South East 7.1 6.71 6.43 6.49 6.75 6.65 South West 7.19 6.71 6.48 6.76 7.98 6.69 Average 7.39 6.79 6.70 6.65 7.05
As with science, the FSM eligibility trend observed in the total teacher numbers disappears when we eliminate those teachers who are non-maths specialists and/or who mainly teach other subjects. Teachers of mathematics with a maths degree This measure considers the distribution of only those teachers who hold a degree in maths. The average number of maths degree holding mathematics teachers is 3.72 teachers per 1,000 pupils. The distribution of these teachers is more uneven than with teachers a more limited specialism in maths, with the measure of inequality being more than double the coefficient of the distribution of teachers with a specialism in mathematics at 0.1759 (std error =0.0040). The Lorenz Curve shows that 50% of schools deploy less than 40% of the maths degree holding teachers per capita.

258 Appendix
Figure 13 Distribution of teachers with a maths degree per pupil across schools
0
.25
.5.7
51
cum
ulat
ive
prop
ortio
n of
teac
hers
per
pup
il
0 .25 .5 .75 1cumulative proportion of schools
actual distribution equality
Nor
th E
ast
Nor
th W
est
York
shire
East
Mid
land
s
Wes
t Mid
land
s
East
ern
Lond
on
Sout
h Ea
st
Sout
h W
est
Low FSM2nd Low FSM
Mid FSM2nd High FSM
High FSM
0
1
2
3
4
5
6
7
8
Maths Degree Holders Teaching Mathematics

Appendix 259
FSM Eligibility bands GOR
Low 2nd lowest Mid 2nd highest High Average
North East 4.45 4.27 4.1 3.6 3.71 3.81 North West 5.21 4.45 3.8 3.45 3.55 3.80 Yorkshire 4.47 4.44 3.79 3.24 2.95 3.63 East Midlands 4.99 4.06 3.58 3.55 3.44 3.77 West Midlands 6.01 4.39 3.65 3.32 3.6 3.87 Eastern 4.86 3.85 3.36 3.03 3.03 3.54 London 4.92 3.87 3.93 3.59 3.47 3.69 South East 4.52 3.89 3.14 2.97 3.11 3.58 South West 5.1 4.26 3.46 3.3 3.73 3.83 Average 4.93 4.12 3.57 3.36 3.45
There is little systematic difference across regions with similar numbers of average teachers per capita, and similar measures of inequity within regions, but when considering the breakdown across FSM eligibility bands, a familiar pattern emerges. The lower FSM eligibility bands enjoy a disproportionately greater share of maths-degree-holding teachers who teach the subject, than do the highest FSM eligibility schools, on average a 43 per cent higher number of teachers per capita (i.e. 1.5 teachers per 1,000 pupils). Again, the most noticeable jumps occur for the lowest FSM eligibility band, especially in the Eastern, South East and London regions. Non-maths specialising teachers teaching mathematics This measure looks at the deployment of non-maths specialised staff (as described by the head of department) in the teaching of mathematics in maintained secondary schools in England. As with science teachers, if used as a substitute for maths-specialist staff, then the use of non-specialising staff may be indicative of a staff shortage. Again, one should view this discussion in conjunction with the section on shortages of maths-specialist teaching staff, which follows. On average, there are 2.23 non-maths specialising teachers per 1,000 pupils teaching mathematics across English maintained secondary schools. The deployment of these teachers across schools is uneven: 50 per cent of schools using approximately 30 per cent of non-specialists per capita. The measure of inequality is relatively high at 0.30021 (std error =0.0049).

260 Appendix
Figure 14 Distribution of non-maths specialising teachers per pupil across schools
0
.25
.5.7
51
cum
ulat
ive
prop
ortio
n of
teac
hers
per
pup
il
0 .25 .5 .75 1cumulative proportion of schools
actual distribution equality
Nor
th E
ast
Nor
th W
est
York
shire
East
Mid
land
s
Wes
t Mid
land
s
East
ern
Lond
on
Sout
h Ea
st
Sout
h W
est
Low FSM2nd Low FSM
Mid FSM2nd High FSM
High FSM0
1
2
3
4
5
6
7
8
Non-Mathemtics Specialists Teaching Mathematics

Appendix 261
FSM Eligibility bands GOR
Low 2nd lowest Mid 2nd highest High Average
North East 1.19 1.49 1.33 1.87 2.16 1.79 North West 1.4 1.74 1.9 2.43 2.84 2.25 Yorkshire 1.22 1.64 1.75 1.96 2.78 1.97 East Midlands 1.43 1.93 2.64 2.99 3.56 2.55 West Midlands 1.82 1.7 2 2.49 3.16 2.27 Eastern 1.47 1.96 2.62 3.28 3.29 2.48 London 1.37 1.49 1.79 2.28 2.47 2.15 South East 1.46 1.91 2.45 3.29 3.41 2.31 South West 1.54 1.64 1.9 2.69 3.16 1.95 Average 1.48 1.79 2.14 2.56 2.79
As with the deployment of non-science-specialising staff in the teaching of science, the use of non-mathematics specialising staff in the teaching of maths may occur because non-specialists are being used to counter a shortage of specialist staff. If this were the case then we would expect opposite patterns to that observed in the deployment of specialist staff such as maths-degree holders. This opposite pattern is most apparent in the deployment across FSM eligibility bands with highest FSM eligibility band schools using on average 87 per cent more non-maths teachers than schools in the lowest FSM eligibility bands. This indicates that non-specialist teaching staff may be being used as substitutes for specialist staff. Shortages in Mathematics teaching staff As before, we use departmental heads’ survey responses on the extent of specialist-staff shortages affecting the department in conjunction with numbers of teaching staff to distinguish whether observed differences are mainly a function of differing demands or supply constraints. The analysis estimates that there is a 0.57 probability of a head of maths reporting that the department had been affected by a shortage of mathematics-specialist staff within the last three years. This number exceeds the probability of a similar problem in the science department, indicating a more severe problem in the supply of mathematics teachers. The distribution of this higher probability is more evenly allocated across schools than was the case with science, with a Gini-coefficient of 0.1424 (std error =0.0072).

262 Appendix
Figure 15 Distribution of maths-specialist shortages across schools
0.2
5.5
.75
1cu
mm
ulat
ive
prop
ortio
n of
sta
ff sh
orta
ge p
roba
bilit
y
0 .25 .5 .75 1cummulative proportion of schools
actual distribution equality
Nor
th E
ast
Nor
th W
est
York
shire
East
Mid
land
s
Wes
t Mid
land
s
East
ern
Lond
on
Sout
h Ea
st
Sout
h W
est
low2nd Low
Mid2nd High
High0
0.1
0.2
0.3
0.4
0.5
0.6
0.7
0.8
0.9
1
Maths Staff Shortage

Appendix 263
FSM Eligibility bands GOR
Low 2nd lowest Mid 2nd highest High Average
North East 0.34 0.33 0.39 0.49 0.55 0.47 North West 0.37 0.43 0.51 0.60 0.62 0.55 Yorkshire 0.36 0.43 0.51 0.61 0.66 0.54 East Midlands 0.39 0.51 0.60 0.68 0.73 0.60 West Midlands 0.34 0.44 0.54 0.60 0.61 0.53 Eastern 0.47 0.57 0.69 0.78 0.80 0.66 London 0.41 0.49 0.55 0.62 0.66 0.60 South East 0.44 0.56 0.68 0.77 0.80 0.62 South West 0.30 0.41 0.52 0.65 0.66 0.49 Average 0.40 0.49 0.57 0.64 0.65
Like the distribution of the probability of staff shortages in science, the probability of a mathematics department suffering from a specialist staff shortage is different across GORs and is increasing in the eligibility of its pupils for FSM. However, although the relative variations across regions are similar, there is a marked difference between the manner in which science and mathematics departments suffer from shortages as eligibility for FSMs increases. Although the distribution is less variable than with science teachers, it is systematically more closely related to different levels of FSM eligibility. That is, the expected increase in probability of staff shortages is more sensitive to increasing levels of FSM eligibility with most areas showing a 25 – 35 per cent increase in the probability across FSM bands. For example, although the North-East again shows the lowest levels of probability and has the lowest range of response (21 per cent difference between the lowest and highest bands), the probability of observing a staff shortage in a North-Eastern school serving the highest FSM eligibility band is considerably higher that of a London school serving the lowest band of FSM eligible pupils. In fact, the probabilities are only equivalent in the mid-range for London schools and the second highest ranges in the South-East and Eastern regions. 4 The role of teacher income in determining supply
and the distribution of supply In the previous sections we have demonstrated systematic differences in the numbers of specialist staff being employed across geographical regions and increasing levels of FSM eligibility within and across GORs. By linking the count data to the reported problems of staff shortages, we have demonstrated that these variations appear to more a function of limited supply than differing demands. In this section we look at the influence of teacher income relative to external income opportunities that exist for graduates with relevant degrees in determining the supply of graduates becoming teachers and the influence of which schools they choose.
The importance of this section is highlighted by Professor Smith’s recommendation in addressing supply issues that:

264 Appendix
The Inquiry recommends that more must be done to address the issue of pay and other incentives to teachers of mathematics and other shortage subjects.
Recommendation 2.8 (Smith, 2004) However, it should be noted that this recommendation is made despite rather mixed evidence from previous research. For example, Smithers and Robinson (2003) in looking at the motivations of teachers who leave find ‘salary seems relatively unimportant in decisions to go but … if raised would encourage some to stay’ (p. 87). However, Dolton and Van Der Klaauw (1999) find that their research:
…points to the importance of the wage and relative foregone earnings in turnover decisions. These results suggest at the most simplistic level that the higher the opportunity wage outside teaching the more likely teachers are to leave teaching for an alternative career. In addition, the higher the wage in teaching the less likely the teacher is to quit a teaching job for career or family reasons (p. 548).
Further, using US data, Eide et al., (2004) found that:
Relative teacher salary and non-teaching career options are also important determinants of the type of individuals who choose to enter teaching. That is, teacher salary and alternative labour-market options affect both the quantity and the quality of the teacher work-force (p. 237).
Despite finding that salaries do have an influence on supply, Eide et al., (2004) raise question whether salaries are the most effective instrument with which to influence supply. They conclude that, given difficulties in implementing ‘market-type’ solutions, policy makers should consider:
… non-monetary incentives that would sufficiently compensate [potential] high-quality teachers such that they would be willing to accept a lower salary than in a non-teaching occupation (p. 241).
Thus, the objective of this section is to link the new data derived from this research with data on labour market conditions to supplement the existing literature on teacher labour supply. The underlying conceptual model underpinning this section is based on the economic notion of (compensating) wage differentials. Typically this theory is applied to situations where the labour market is in equilibrium (demand equals supply) and is used to identify which elements of an equilibrium salary are due to such things as the undesirable elements of a particular job (e.g. a premium for shift work) or to worker productivity. In the context of this research we are unable to assume the market is in equilibrium and so we make a lateral shift in the way we implement these ideas: the argument being that the further teacher salaries are away
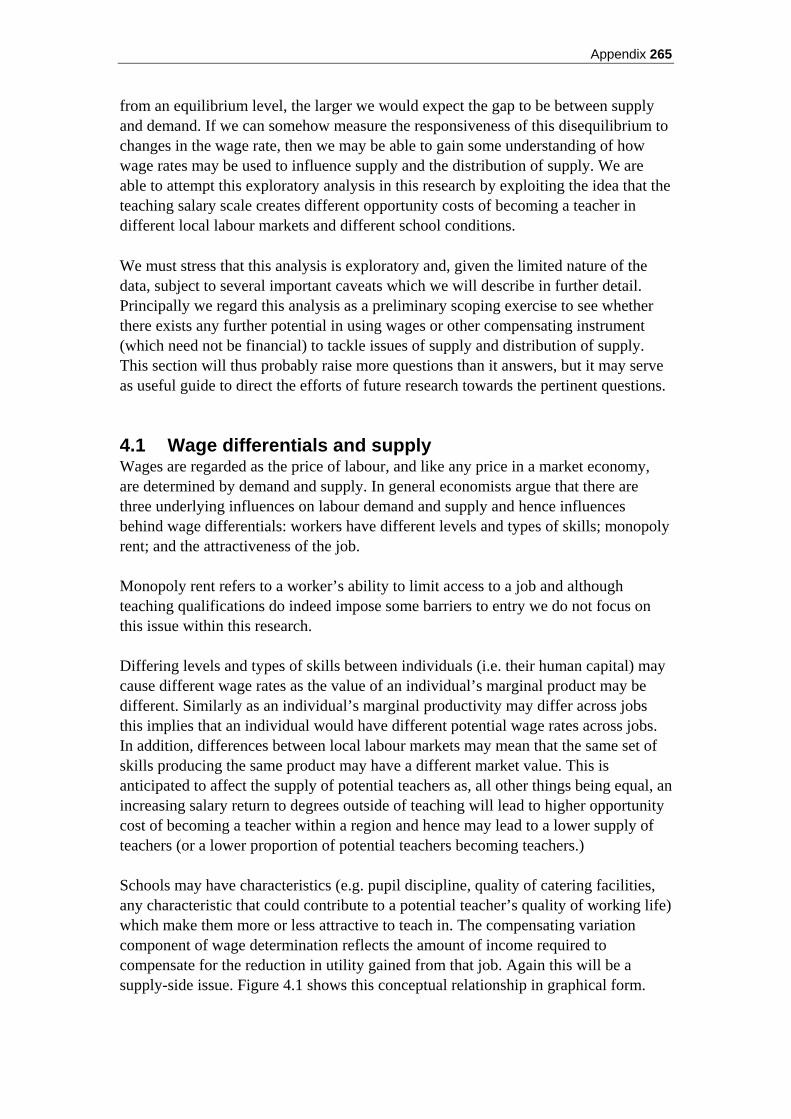
Appendix 265
from an equilibrium level, the larger we would expect the gap to be between supply and demand. If we can somehow measure the responsiveness of this disequilibrium to changes in the wage rate, then we may be able to gain some understanding of how wage rates may be used to influence supply and the distribution of supply. We are able to attempt this exploratory analysis in this research by exploiting the idea that the teaching salary scale creates different opportunity costs of becoming a teacher in different local labour markets and different school conditions. We must stress that this analysis is exploratory and, given the limited nature of the data, subject to several important caveats which we will describe in further detail. Principally we regard this analysis as a preliminary scoping exercise to see whether there exists any further potential in using wages or other compensating instrument (which need not be financial) to tackle issues of supply and distribution of supply. This section will thus probably raise more questions than it answers, but it may serve as useful guide to direct the efforts of future research towards the pertinent questions. 4.1 Wage differentials and supply Wages are regarded as the price of labour, and like any price in a market economy, are determined by demand and supply. In general economists argue that there are three underlying influences on labour demand and supply and hence influences behind wage differentials: workers have different levels and types of skills; monopoly rent; and the attractiveness of the job. Monopoly rent refers to a worker’s ability to limit access to a job and although teaching qualifications do indeed impose some barriers to entry we do not focus on this issue within this research. Differing levels and types of skills between individuals (i.e. their human capital) may cause different wage rates as the value of an individual’s marginal product may be different. Similarly as an individual’s marginal productivity may differ across jobs this implies that an individual would have different potential wage rates across jobs. In addition, differences between local labour markets may mean that the same set of skills producing the same product may have a different market value. This is anticipated to affect the supply of potential teachers as, all other things being equal, an increasing salary return to degrees outside of teaching will lead to higher opportunity cost of becoming a teacher within a region and hence may lead to a lower supply of teachers (or a lower proportion of potential teachers becoming teachers.) Schools may have characteristics (e.g. pupil discipline, quality of catering facilities, any characteristic that could contribute to a potential teacher’s quality of working life) which make them more or less attractive to teach in. The compensating variation component of wage determination reflects the amount of income required to compensate for the reduction in utility gained from that job. Again this will be a supply-side issue. Figure 4.1 shows this conceptual relationship in graphical form.
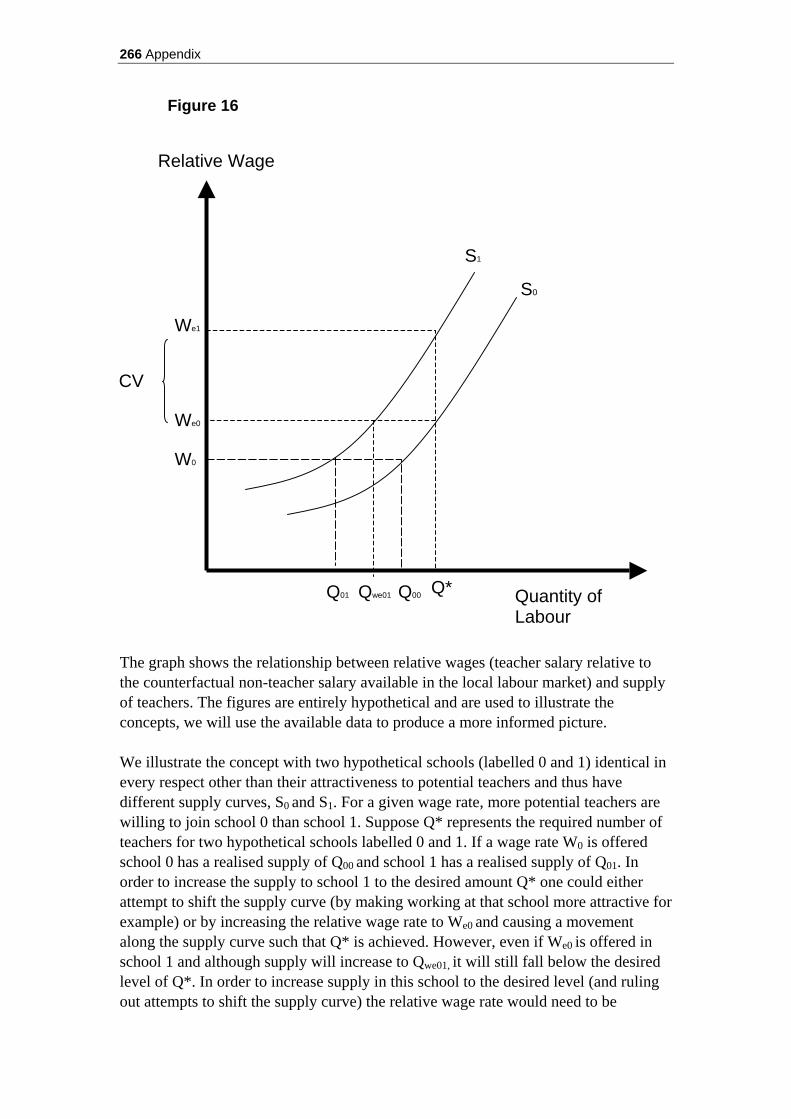
266 Appendix
Figure 16
The graph shows the relationship between relative wages (teacher salary relative to the counterfactual non-teacher salary available in the local labour market) and supply of teachers. The figures are entirely hypothetical and are used to illustrate the concepts, we will use the available data to produce a more informed picture. We illustrate the concept with two hypothetical schools (labelled 0 and 1) identical in every respect other than their attractiveness to potential teachers and thus have different supply curves, S0 and S1. For a given wage rate, more potential teachers are willing to join school 0 than school 1. Suppose Q* represents the required number of teachers for two hypothetical schools labelled 0 and 1. If a wage rate W0 is offered school 0 has a realised supply of Q00 and school 1 has a realised supply of Q01. In order to increase the supply to school 1 to the desired amount Q* one could either attempt to shift the supply curve (by making working at that school more attractive for example) or by increasing the relative wage rate to We0 and causing a movement along the supply curve such that Q* is achieved. However, even if We0 is offered in school 1 and although supply will increase to Qwe01, it will still fall below the desired level of Q*. In order to increase supply in this school to the desired level (and ruling out attempts to shift the supply curve) the relative wage rate would need to be
Relative Wage
S1
S0
Quantity of Labour
Q*
CV
W0
We0
We1
Q00 Qwe01 Q01

Appendix 267
increased (for that school) to We1. The difference between We0 and We1 is thus the compensating variation in income required to overcome the less attractive nature of school 1. The actual amounts required will depend on the shapes of the supply curves and the shifts in supply curves that differences in school characteristics make. For example, the steeper the supply curves (i.e. the less responsive they are to relative wages) the greater the amount of additional wages required to shift supply by a relative amount, in such cases it may make more economic sense to attempt to shift supply curves rather than try to stimulate movements along the curve. Indeed it may be the case that supply is so unresponsive to income that it would not be possible to move along a curve to a desired level of supply. As these supply curves are unobserved, it is a further aim of this section to identify the extent to which available data may be used to inform policy makers. One further implication of the compensating model is identified by the graphical approach. That is, a policy aimed at all schools may not eliminate differentials in supply, if policy makers wish to tackle issues of distribution, then they may wish to consider targeting policies more precisely. 4.2 Local Labour Market Conditions The evidence we use to inform this section is a combination of that provided by the questionnaire responses, ROS data and local labour conditions provided by Government Labour Force Quarterly Surveys 2003 – 2004 which record educational backgrounds, occupational choice and income of individuals across the UK. The LFS is used to identify the local labour market conditions and behaviour of graduates in GORs. The following graph shows the ratio of salaries of graduates to the salaries of teachers as reported in the Labour Force Survey. The wages are calculated using the LFS income weights as suggested by the LFS to allow for non-response and the sampling frame (further details are available at http://www.statistics.gov.uk/StatBase/Source.asp?vlnk=358&More=Y)

268 Appendix
Values above 1 indicate that the average salary of holders of that type of degree is above that of teachers in that particular GOR.
Government Office Region Graduates Biology Chemistry Physics Maths & Related
North East 0.95 0.88 0.97 0.93 0.93 North West 0.97 1 1.1 1.06 1.09 Yorkshire 0.97 0.72 1.06 1.16 1.05 East Midlands 0.88 0.74 0.99 0.96 1.13 West Midlands 0.93 0.62 0.96 0.91 1.02 Eastern 1.05 1.07 1.19 1.22 1.28 London 1.13 0.92 1.16 1.18 1.23 South East 1.16 0.95 1.19 1.19 1.2 South West 0.93 0.82 0.92 0.96 0.97
It is noticeable that non-teaching average salaries for graduates are generally higher in Eastern, London and South East regions. For the specialist degree holders in Chemistry and Physics their expected non-teaching salaries are also higher in the North West and Yorkshire. Mathematics and related subject holders (e.g. statistics) generally have higher average salaries outside of teaching except in the North East and South West. Conversely Biology degree-holding graduates typically have lower salaries than teachers (excepting South West and North West) and always have lower average salaries than Chemistry, Physics and Maths degree holders (and quite often lower than the graduate average). These patterns are interesting because they imply that graduates with different specialisations and in different GORs face very different opportunity costs of becoming teachers and if potential teachers are responsive to the
Nor
th E
ast
Nor
th W
est
Yor
kshi
re
East
Mid
land
s
Wes
t Mid
land
s
Eas
tern
Lond
on
Sout
h Ea
st
Sou
th W
est
BiologyGraduates
ChemistryPhysics
Maths & Related0
0.2
0.4
0.6
0.8
1
1.2
1.4
Ratio
Graduate/Teacher Salary Ratios
Appendix 269
income opportunities outside of teaching, all other things being equal, we would expect to observe a relationship between graduate job choice, opportunity cost and within regions, the attractiveness of the school. 4.3 The relationship between supply, local labour market
and school conditions We first look at LFS data on graduates and their career choice. In order to explore whether graduates are influenced by alternative salary opportunities we ran a grouped logistic regression using the career choice of the LFS graduates with a particular degree in a GOR. The dependent variable is thus the proportion of that group who are currently working as teachers with the wage ratio as the dependent variable (along with a constant term). There are 45 different groups on which to base the regression (e.g. maths graduates in the North East, maths graduates in Yorkshire, maths graduates in the South West, biology graduates in the South West). With such a small number of groups (and limited variation across these groups) we regard this analysis as indicative and exploratory. The theory predicts that graduates will be less likely to become teachers if the opportunity cost (measured by an increasing wage ratio) is higher, thus the simple null hypothesis being tested is that an increasing wage ratio will not be associated with a smaller probability of an individual becoming a teacher. The logistic regression model rejects this hypothesis and estimates a wage-ratio coefficient of -1.256 (95% confidence interval of -2.191, -0.322) and a constant term -1.557. Thus, as a wage-ratio for a graduate in a GOR increases from say 1 to 1.05, this indicates that the probability that a graduate from that GOR with that degree type will become a teacher drops by 0.36%. As a result, although there does appear to be a significant relationship between income and the choice of becoming a teacher, the relationship looks fairly inelastic. Referring back to our model, this implies that using income as the instrument to influence the choice of graduates may require relatively large changes in income to prompt movements along the supply curve (i.e. the supply curves are relatively steep). Furthermore, the regression results were quite sensitive to alternative specifications. For example, it is possible that systematic differences between GORs in terms of salary ratios may be correlated with other differences between GORs that influence graduate decisions or that systematic difference between types of degrees is correlated with the types of people doing those types of degrees. To counter this we looked at putting regional and degree (maths; science; baseline = other) dummies in the regression model. Such modifications to the model had the effect of reducing the magnitude of the wage effect (though it is still negative), indicating an even less elastic relationship. The other means by which we may test the relationship between salaries and supply is in a further examination of the wage ratio term in the Poisson regression models used to predict school numbers. Whereas the previous salary analysis effectively considered the slope of the supply curve, this analysis may be used to assess the

270 Appendix
compensating variation aspect of salaries – that is, we may use the regressions as a tentative means of assessing how much additional salary (in a GOR) would have to be offered to offset a school characteristic that inversely impacts on the supply to that school. We may do this by considering the regression coefficients from the regression model (and comparing them to other coefficients within the models). The evidence from such an exercise is somewhat mixed, though again generally consistent with the theory i.e. coefficients for specific degree non-teaching/teaching wage ratios are negative in regressions looking at the number of teachers with that specialisation; positive in the regressions looking at the use of non-specialists; and positive in the reporting of problems of staff shortages – though very few of the coefficients are statistically significant. Again this indicates that although salary may be used as an instrument to influence choice, it may be a relatively expensive means of doing so. In conclusion, the estimated results would indicate a very limited scope for using simple income instruments to address the issue of graduate choice between teaching and non-teaching careers and location of teachers between schools. However, the data used to draw this inference is limited and we regard this element of the analysis almost as a ‘wet finger in the air’, though it should also be noted that this includes the possibility that the relationship between income and career choice is underestimated. The results are, however, consistent with the underlying theory, and policy makers may wish to consider the model implications should they find a policy instrument that is cost-effective. One such implication is that instruments should be geared towards specific target areas (i.e. relatively deprived areas in the three South and Eastern GORs) if policy makers wish to tackle distributional issues. 5 Final conclusions The analysis of teacher numbers per capita across England and, in particular, across GOR s, and differing levels of pupil FSM eligibility reveal a number of interesting patterns, which have significant policy relevance. Firstly, although the numbers of per capita teachers in mathematics and science subjects across England and the various sub-groups are relatively even, consideration of the specialisation and nature of those teachers reveals a very different pattern. Specialised staff per capita are relatively and consistently far more scarce in relatively deprived areas and also in areas in which employees with these specialisations have a higher expected non-teaching salary. Furthermore, in geographical areas which have higher non-teaching salaries, the relationship between deprivation and a lower supply appears most pronounced. Similarly, the relationship between supply and deprivation is most pronounced in those disciplines which have the higher external salaries. On a similar note, economic analysis corroborates earlier findings that many schools are using non-specialists to make up for the short-fall of scarce specialists. The relationship is such that those schools serving high FSM eligibility pupils in areas

Appendix 271
which have higher non-teaching salaries are more likely to use higher numbers of non-specialist staff. Thus, this study adds an additional component to the research showing general shortfalls in the levels of specialist staff in science and mathematics. The extra dimension is that this shortfall is not evenly distributed across schools and shows a geographical- and deprivation-related trend. The trend is such that vertical equity principles (directing greater resources to greater need), particularly in the more affluent South and South-East areas, are violated – that is, the distribution of the already limited supply is tilted against schools serving relatively deprived areas. The tentative relationship estimated between levels of relative salaries and supply indicates that policy makers may potentially use teacher salaries as an instrument to address supply and the distribution of supply issues. However, the seemingly low responsiveness of supply to income indicates this may be a prohibitively expensive exercise and there may exist other, more cost-effective, instruments that could be used. For example, if teachers or potential teachers are indifferent between an extra £5,000 in salary and protected non-teaching time, then protected non-teaching time has an equivalent income value of £5,000. If protected non-teaching time could be implemented at a cost less than providing an additional £5,000 in salary, it represents a more cost-effective manner of obtaining the same effect. However, if income or other instrument is used, the analysis implies that geographically-specific policies may still be required. For example, the compensating salary (or equivalent) variation required to influence specialist staff in London or the South East to go to schools serving high FSM eligible schools will be larger than in the North-East as the relative teaching opportunity cost is generally higher and individuals demonstrate a greater sensitivity to increasing levels of deprivation. Thus, the economic analysis undertaken suggests that geographically-specific incentives may be required rather than incentives applied across the board.

272 References
References CHAMBERS, G. and ROPER, T. (2002). ‘Why students withdraw from initial teacher training for secondary schools: the Leeds experience’. In: MENTER, I., HUTCHINGS, M. and ROSS, A. (2002). The Crisis in Teachers Supply. Stoke on Trent: Trentham. COCKCROFT, W.H. (1982). Mathematics Counts. London: HMSO. DILLON, J., OSBORNE, J., FAIRBROTHER, R. and KURINA, L. (2000). A Study Into the Professional Views and Needs of Science Teachers in Primary and Secondary Schools in England [online]. Available: http://www.cst.gov.uk/cst/reports/files/science-teachers/kostfin1.pdf [13 December, 2005]. DEPARTMENT FOR EDUCATION AND SKILLS (1998). Teachers: Meeting the Challenge of Change. Green Paper. London: The Stationery Office. DEPARTMENT FOR EDUCATION AND SKILLS (2003). Secondary Schools Curriculum and Staffing Survey [online]. Available: http://www.dfes.gov.uk/rsgateway/DB/SFR/s000413/index.shtml [16 December, 2005]. DEPARTMENT FOR EDUCATION AND SKILLS (2004a). Making Mathematics Count: the Department for Education and Skills’ Response to Professor Adrian Smith’s Inquiry into Post-14 Mathematics Education [online]. Available: http://www.dfes.gov.uk/mathsinquiry/DfES-Making%20Maths%20Count.pdf [13 December, 2005]. DEPARTMENT FOR EDUCATION AND SKILLS (2004b). Statistics of Education: Teachers in England 2003 Edition [online]. Available: http://www.dfes.gov.uk/rsgateway/DB/VOL/v000495/schools_04_final.pdf [13 December, 2005]. DOLTON, P. and VAN DER KLAAUW, W. (1999). ‘The Turnover of Teachers: A Competing Risks Explanation’ The Review of Economics and Statistics 81, 3, 543-552 (1999). EDMONDS, S., SHARP, C. and BENEFIELD, P. (2002). Recruitment to and Retention on Initial Teacher Training: a Systematic Review [online]. Available: http://www.tda.gov.uk/upload/resources/doc/n/nfer-review.doc [13 December, 2005]. EURYDICE (2002a). The Teaching Profession Europe: Profile, Trends and Concerns. Report I. Initial Training and Transition to Working Life of Teachers in General Lower Secondary Education. Brussels: Eurydice European Unit.

References 273
EURYDICE (2002b). The Teaching Profession Europe: Profile, Trends and Concerns. Report II. Teacher Supply and Demand at General Lower Secondary Education. Brussels: Eurydice European Unit. FIGLIO, D.N. (1997). ‘Teacher salaries and teacher quality’, Economics Letters; 55: 267–71. HANN, M. and GRAVELLE, H. (2004). ‘The maldistribution of general practitioners in England and Wales: 1974–2003’, British Journal of General Practice, 54, 509, 894–8. HM TREASURY, DEPARTMENT FOR TRADE AND INDUSTRY and DEPARTMENT FOR EDUCATION AND SKILLS (2004). Science & Innovation Investment Framework 2004-2014 [online]. Available: http://www.hm-treasury.gov.uk/spending_review/spend_sr04/associated_documents/spending_sr04_science.cfm [19 December, 2005]. GREAT BRITAIN. PARLIAMENT. HOUSE OF COMMONS. EDUCATION AND SKILLS COMMITTEE (2004). Secondary Education: Teacher Retention and Recruitment. Fifth Report of Session 2003-04. Volume I: Report, Together with Formal Minutes (HC: 1057-1) [online]. Available: http://image.guardian.co.uk/sys-files/Education/documents/2004/09/21/FinalReport.pdf [13 December, 2005]. HUTCHINGS, M., MENTER, I., ROSS, A. and THOMSON, D. with BEDFORD, D. (2000). Teachers Supply and Retention in London 1998-99. London: TTA. JOHNSON-WILDER, S., ALLEN, B., THUMPSTON, G., COOKE, H., BROWN, M. and BURTON, L. (2003). Teachers of Mathematics: their Qualifications, Training and Recruitment. A Report of a Survey of Secondary Mathematics Departments Carried Out in the Academic Year 2001-2002 [online]. Available: http://cme.open.ac.uk/conference02/NAMA.pdf [16 December, 2005]. MENTER, I., HUTCHINGS, M. and ROSS, A. (2002). The Crisis in Teachers Supply. Stoke on Trent: Trentham. OFFICE FOR STANDARDS IN EDUCATION (2005). Ofsted Subject Reports 2003/04: Science in Secondary Schools (HMI 2332) [online]. Available: http://www.ofsted.gov.uk/publications/index.cfm?fuseaction=pubs.summary&id=4067 [20 December, 2005]. OFFICE FOR STANDARDS IN EDUCATION (2004a). Ofsted Subject Reports 2002/03: Mathematics in Secondary Schools (HMI 1978) [online]. Available: http://www.ofsted.gov.uk/publications/index.cfm?fuseaction=pubs.displayfile&id=3541&type=doc [13 December, 2005]. OFFICE FOR STANDARDS IN EDUCATION (2004b). Ofsted subject reports 2002/03: Science in Secondary Schools (HMI 1987) [online]. Available: http://www.ofsted.gov.uk/publications/index.cfm?fuseaction=pubs.displayfile&id=3547&type=doc [13 December, 2005].

274 References
THE OPEN UNIVERSITY, NATIONAL ASSOCIATION OF MATHEMATICS ADVISORS and KING’S COLLEGE (2003). Teachers of Mathematics: their Qualifications, Training and Recruitment. A Report of a Survey of Secondary Mathematics Departments Carried Out in the Academic Year 2001-2002 [online]. Available: http://cme.open.ac.uk/conference02/NAMA.pdf [13 December, 2005]. ROBERTS, G. (2002). SET for Success: the Supply of People with Science, Technology, Engineering and Mathematics Skills [online]. Available: http://www.hm-treasury.gov.uk/documents/enterprise_and_productivity/research_and_enterprise/ent_res_roberts.cfm [13 December, 2005]. ROPER, T. (2002). ‘Who is teaching secondary mathematics?’ In: JOHNSTON-WILDER, S. Key Stage 3 Mathematics Teachers: the Current Situation, Initiatives and Visions: Proceedings of a National Day Conference. Milton Keynes: The Open University, Centre for Mathematics Education. SMITH, A. (2004). Making Maths Count: the Report of Professor Adrian Smith’s Inquiry into Post-14 Mathematics Education [online]. Available: http://www.dfes.gov.uk/mathsinquiry/Maths_Final.pdf [13 December, 2005]. SMITHERS, A. and ROBINSON, P. (2000). Coping with Teacher Shortages. London: NUT. SMITHERS, A. and ROBINSON, P. (2001). Teachers Leaving. London: NUT. SMITHERS, A. and ROBINSON, P. (2003). Factors Affecting Teachers’ Decisions to Leave the Profession (DfES Research Report 430) [online]. Available: http://www.dfes.gov.uk/research/data/uploadfiles/RR430.pdf [13 December, 2005]. SMITHERS, A. and ROBINSON, P. (2004). Teacher Turnover, Wastage and Destinations (DfES Research Report 553) [online]. Available: http://www.dfes.gov.uk/research/data/uploadfiles/RR553.pdf [13 December, 2005]. SMITHERS, A. and ROBINSON, P. (2005a). Physics in Schools and Colleges: Teacher Deployment and Student Outcomes [online]. Available: http://www.buckingham.ac.uk/education/research/ceer/pdfs/physicsprint.pdf [12 December, 2005]. SMITHERS, A. and ROBINSON, P. (2005b). Teacher Turnover, Wastage and Movement Between Schools (DfES Research Report 640). Available: http://www.dfes.gov.uk/research/data/uploadfiles/RR640.pdf [12 December, 2005] UNESCO (2002). ‘More children, fewer teachers: new UNESCO-ilo study sees global teacher shortage causing decline in quality education’, UNESCO Press, 2002-67, 4 October [online]. Available: http://portal.unesco.org/en/ev.php-URL_ID=6667&URL_DO=DO_TOPIC&URL_SECTION=201.html [13 December, 2005]. UNESCO (2004). ‘High-level experts' meeting on the UNESCO Teacher Training Initiative in Sub-Saharan Africa’, UNESCO Press [online]. Available:

References 275
http://portal.unesco.org/education/en/ev.php-URL_ID=32260&URL_DO=DO_TOPIC&URL_SECTION=201.html [13 June, 2005]. WHITEHEAD, J. and POSTLETHWAITE, K. (2000). ‘Recruitment, access and retention; some issues for secondary initial teacher education in the current social context’, Research in Education, 64, 44–55. WHITMUIR (2000). Whitmuir Report. OME Study: Recruitment and Retention of Classroom Teachers.[Report produced for the School Teachers’ Review Body]. Manchester: Whitmuir.
WILLIS, P. (2002). Trained to Teach? London: SHA.
Copies of this publication can be obtained from:
DfES PublicationsP.O. Box 5050Sherwood ParkAnnesleyNottinghamNG15 0DJ
Tel: 0845 60 222 60Fax: 0845 60 333 60Minicom: 0845 60 555 60Oneline: www.dfespublications.gov.uk
© NFER Trading Limited 2006
Produced by the Department for Education and Skills
ISBN 1 84478 656 0Ref No: RR708www.dfes.go.uk/research