Embed Size (px)
Citation preview
Fachgebiet 3D-Nanostrukturierung, Institut für Physik 18.01.2018
Contact: [email protected]; [email protected]
Office: Heisenbergbau V 202, Unterpörlitzer Straße 38 (Tel: 3748) Meitnerbau 1.2.106, Gustav-Kirchhoff-Straße 5 (Tel: 4902)
http://www.tu-ilmenau.de/3dnanostrukturierung/
Prof. Yong Lei & Dr. Yang Xu
Techniken der Oberflächenphysik

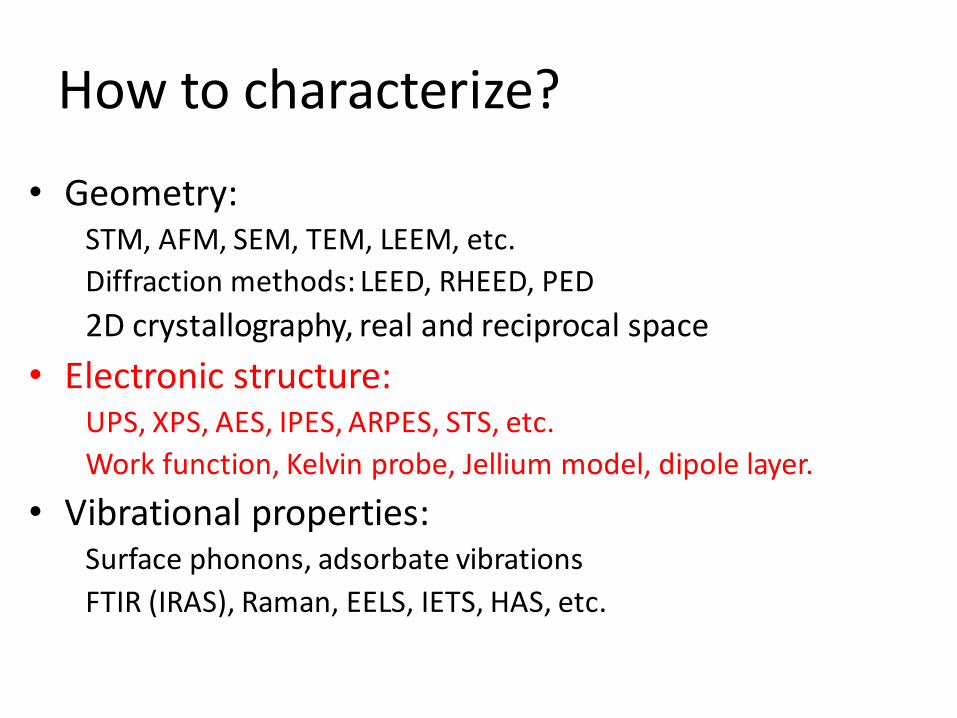
How to characterize?
• Geometry: STM, AFM, SEM, TEM, LEEM, etc.
Diffraction methods: LEED, RHEED, PED
2D crystallography, real and reciprocal space
• Electronic structure: UPS, XPS, AES, IPES, ARPES, STS, etc.
Work function, Kelvin probe, Jellium model, dipole layer.
• Vibrational properties: Surface phonons, adsorbate vibrations
FTIR (IRAS), Raman, EELS, IETS, HAS, etc.
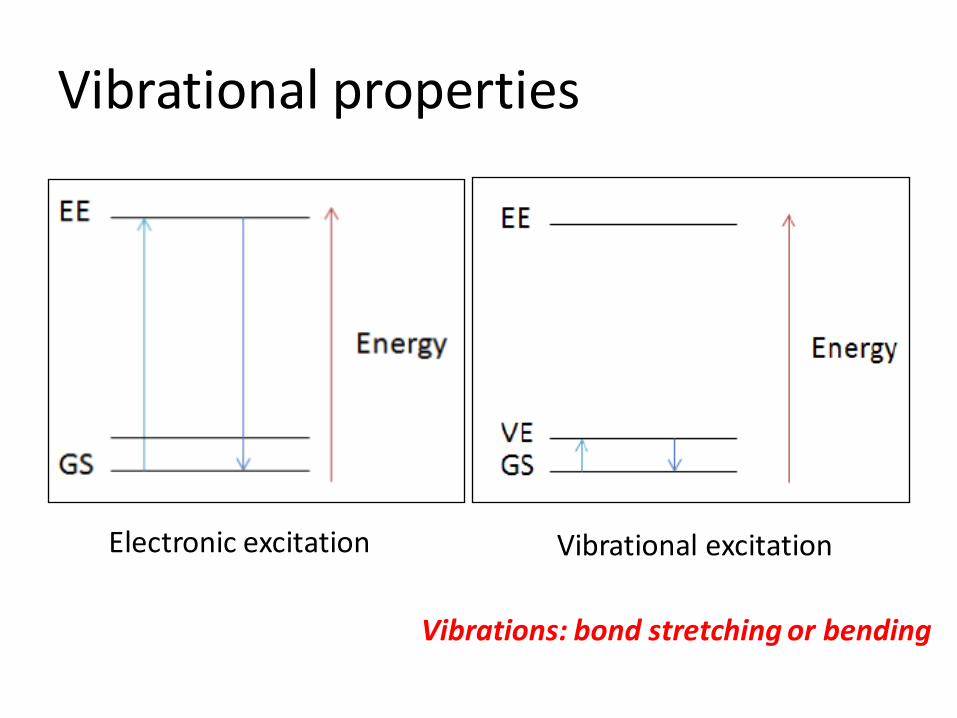
Vibrational properties
Electronic excitation Vibrational excitation
Vibrations: bond stretching or bending

Vibrational spectroscopy
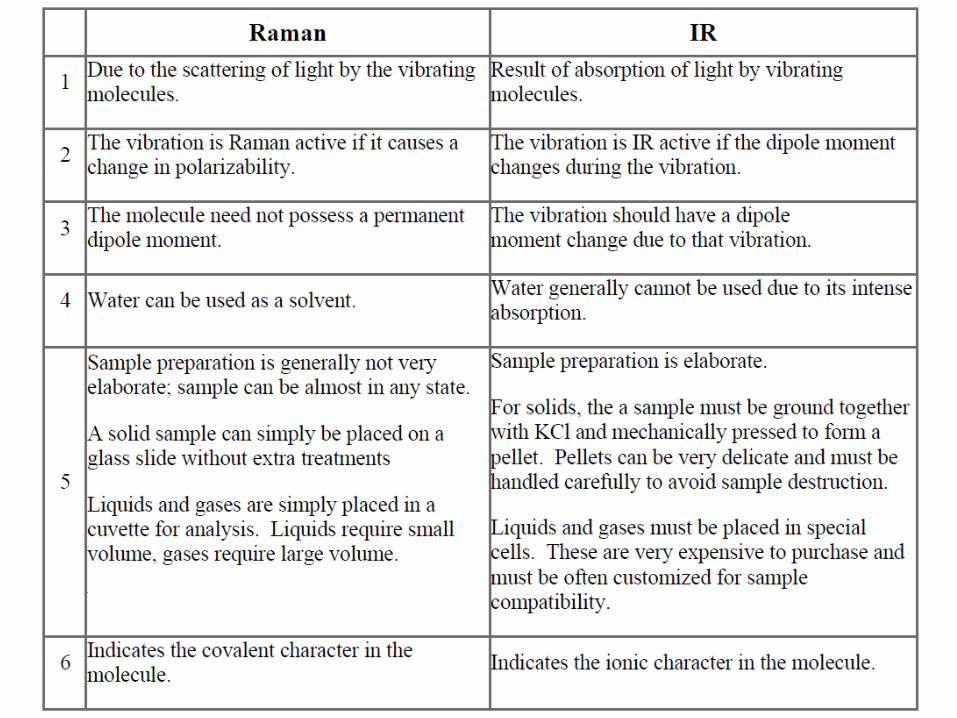
• Raman spectroscopy
• Infrared spectroscopy (IR)
Vibrational spectroscopy is an energy sensitive method: based on changes of dipole moment (IR) or polarizabilities (Raman) - caused by molecular vibrations of molecules - discrete energy transitions absorption (IR) - changes of frequencies during scattering (Raman) of electromagnetic radiation (wavelength from 1 to 300 μm).
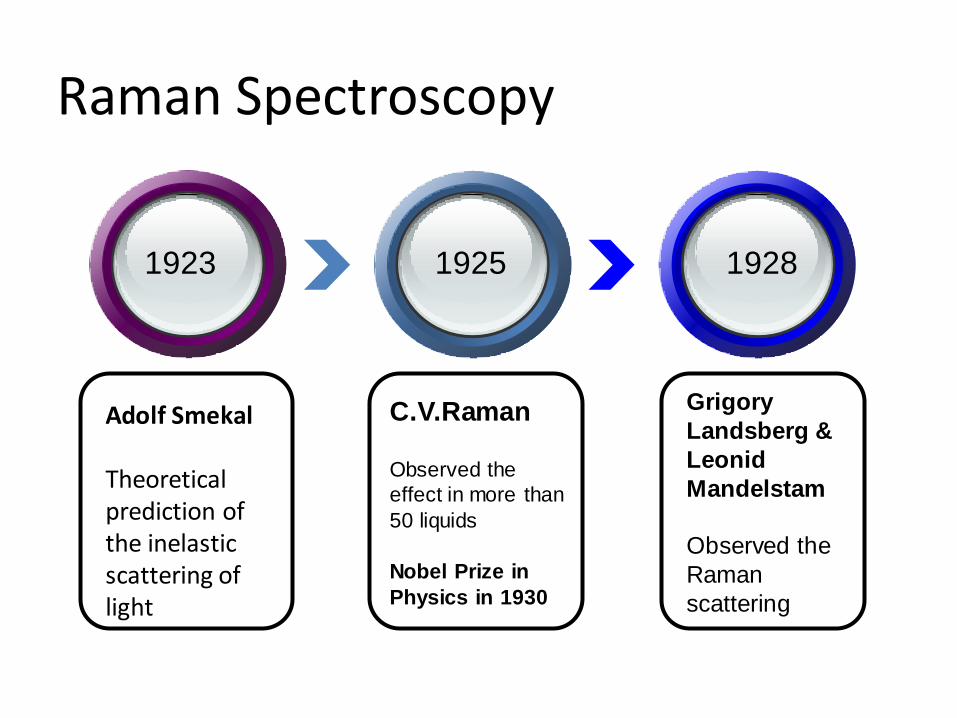
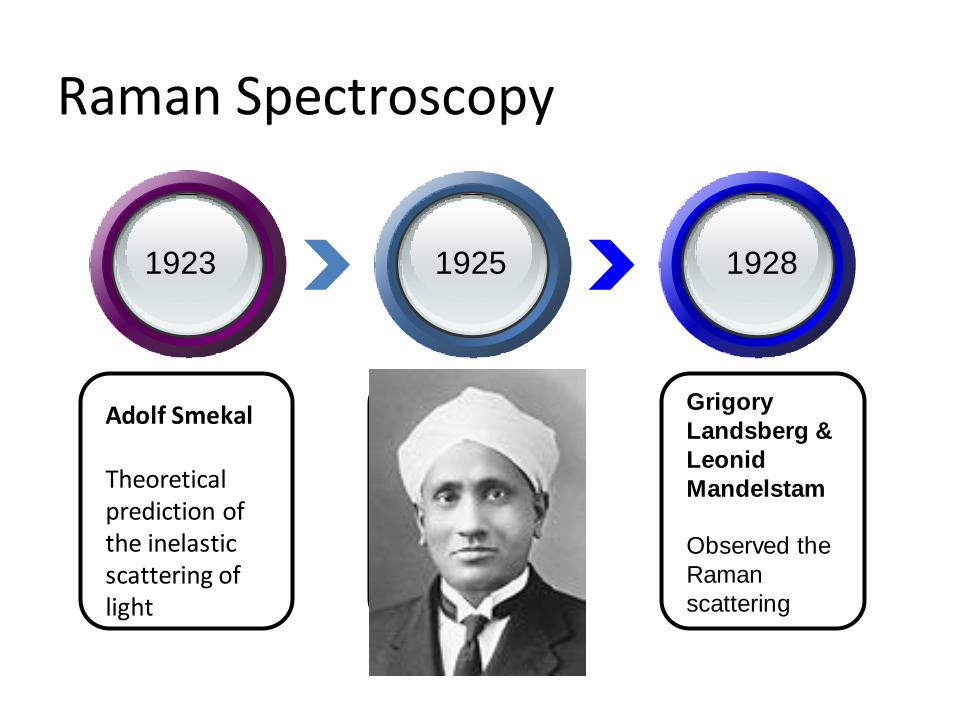
Raman Spectroscopy
1923 1925 1928
Adolf Smekal Theoretical prediction of the inelastic scattering of light
C.V.Raman Observed the
effect in more than
50 liquids
Nobel Prize in
Physics in 1930
Grigory
Landsberg &
Leonid
Mandelstam
Observed the
Raman
scattering
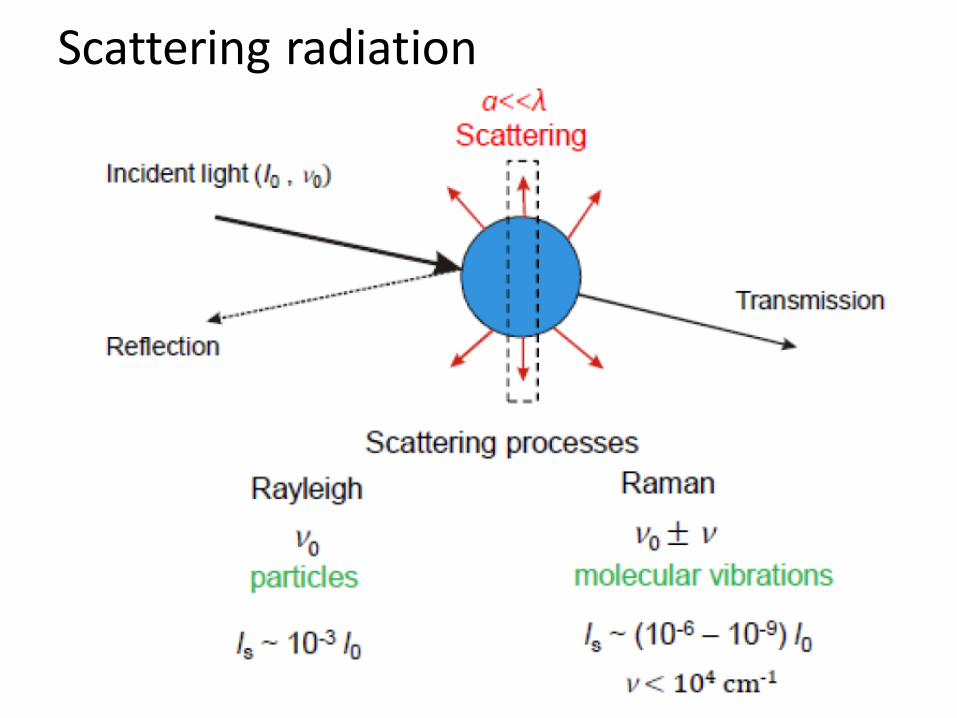
Scattering radiation
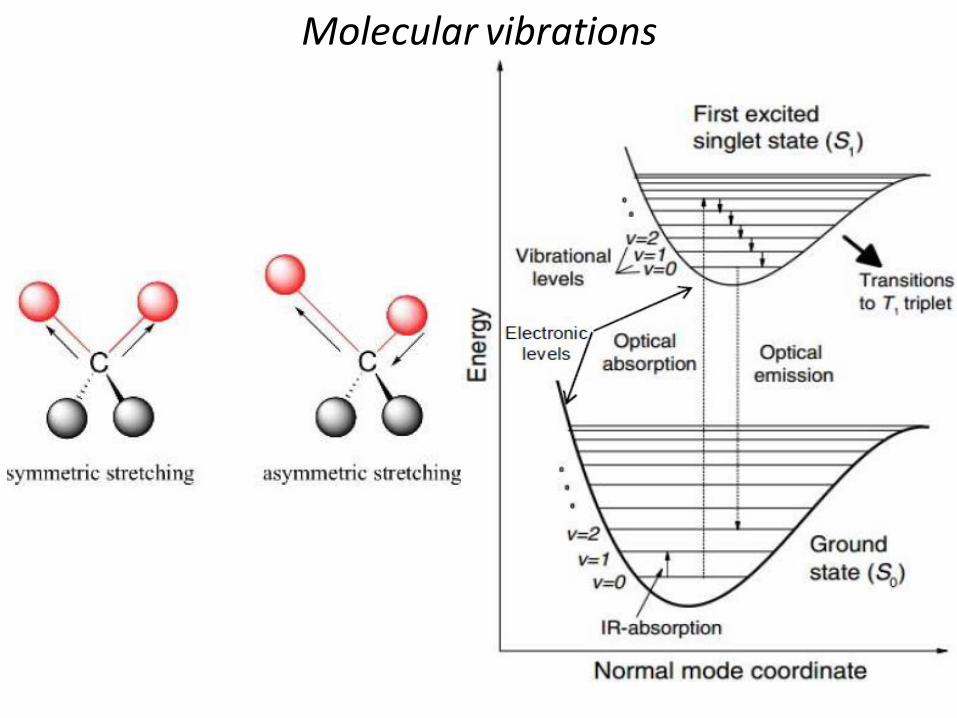
Molecular vibrations
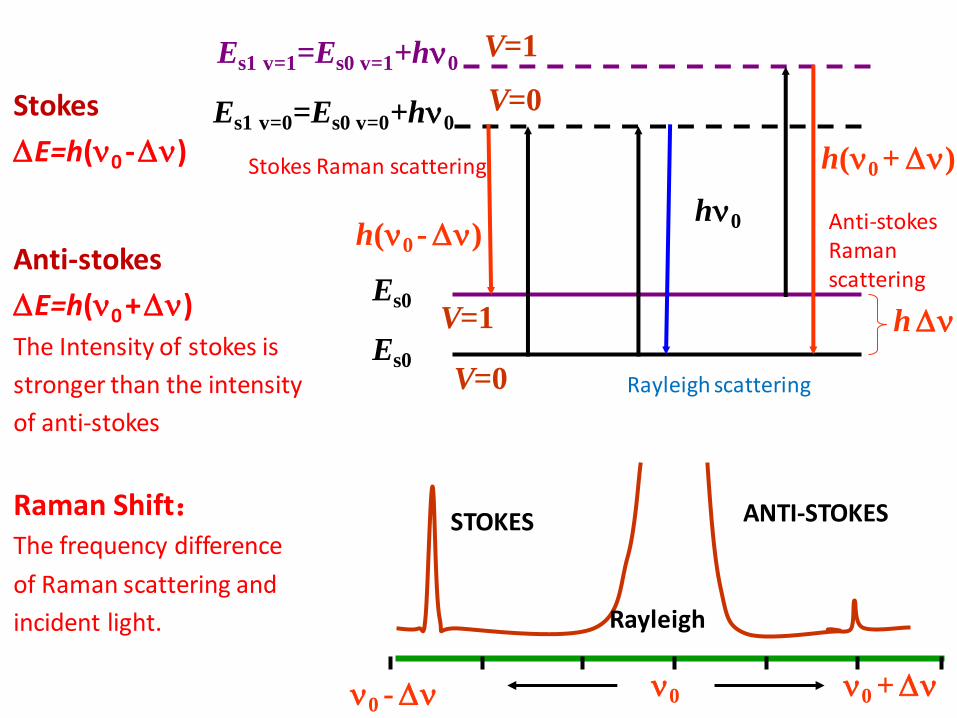
Stokes
E=h(0 - )
Anti-stokes
E=h(0 + ) The Intensity of stokes is
stronger than the intensity
of anti-stokes
Raman Shift: The frequency difference
of Raman scattering and
incident light.
h(0 + )
Es0
Es0 V=1
V=0
Es1 v=1=Es0 v=1+h0
Es1 v=0=Es0 v=0+h0
h
h0 h(0 - )
ANTI-STOKES
0 -
Rayleigh
STOKES
0 + 0
Stokes Raman scattering
Anti-stokes Raman scattering
Rayleigh scattering
V=1
V=0
IR absorption
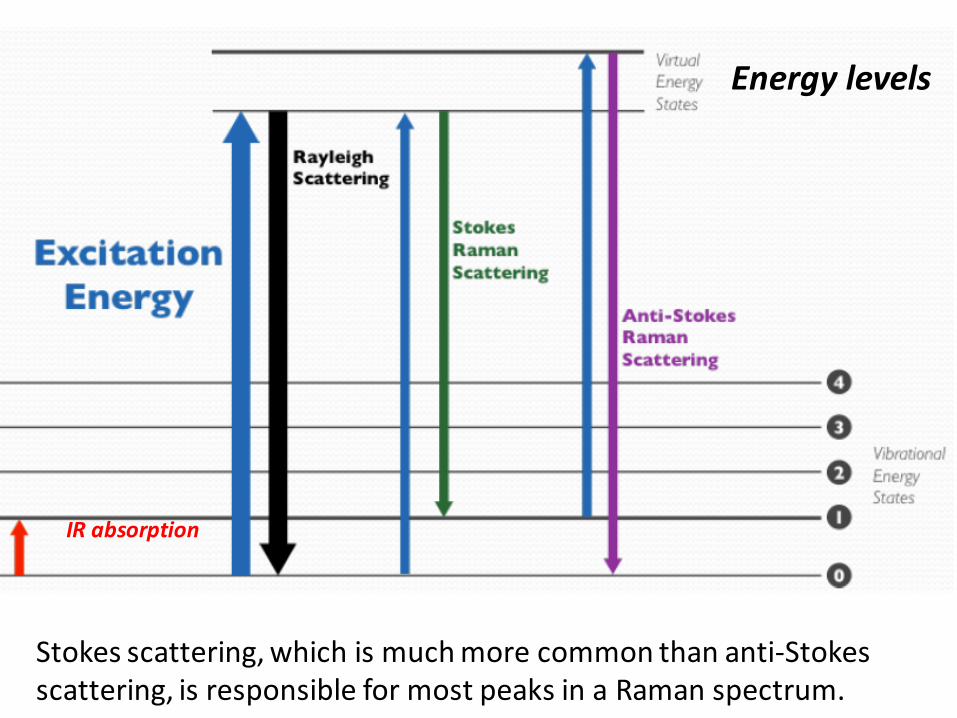
Stokes scattering, which is much more common than anti-Stokes scattering, is responsible for most peaks in a Raman spectrum.
Energy levels
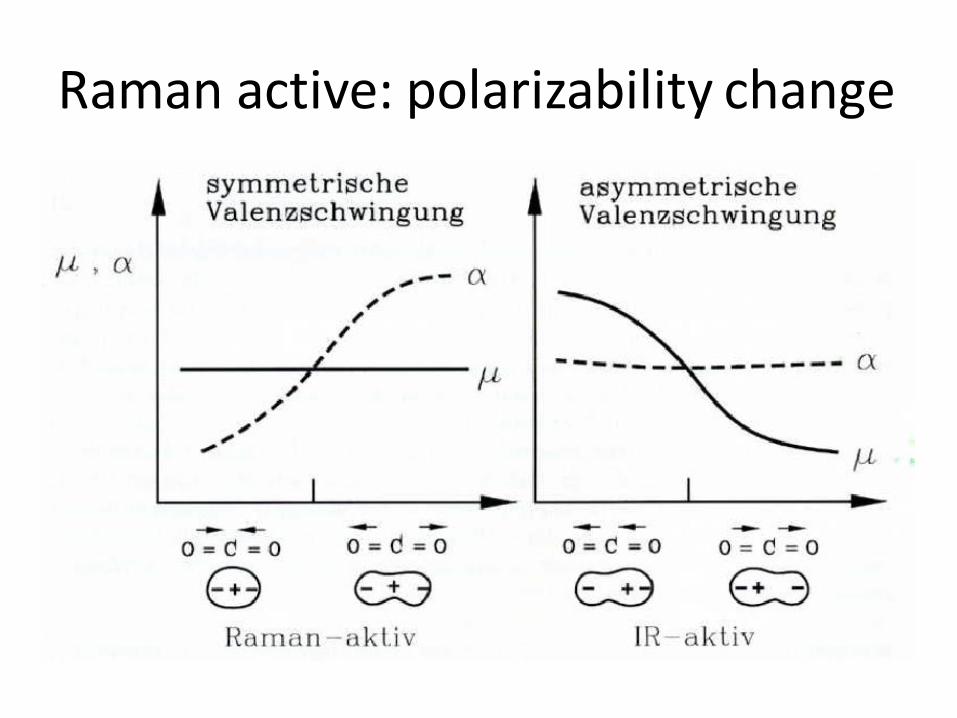
Raman active: polarizability change

The polarizability must change during the vibration (for Raman)!
In a centro-symmetric molecule, a vibrational mode may be either IR active or Raman active, but not both.
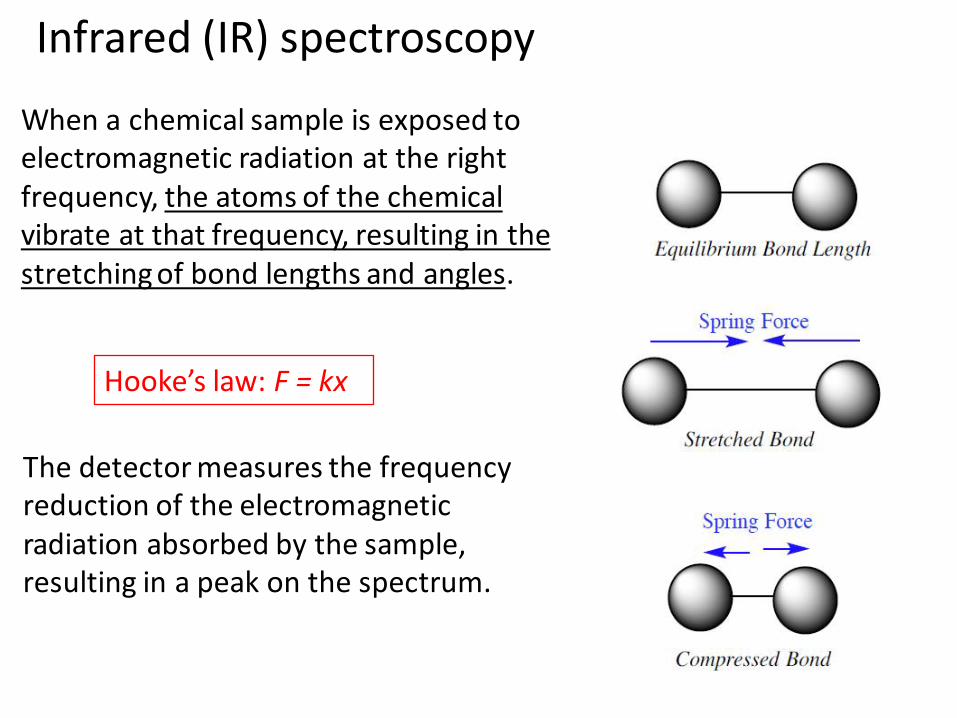
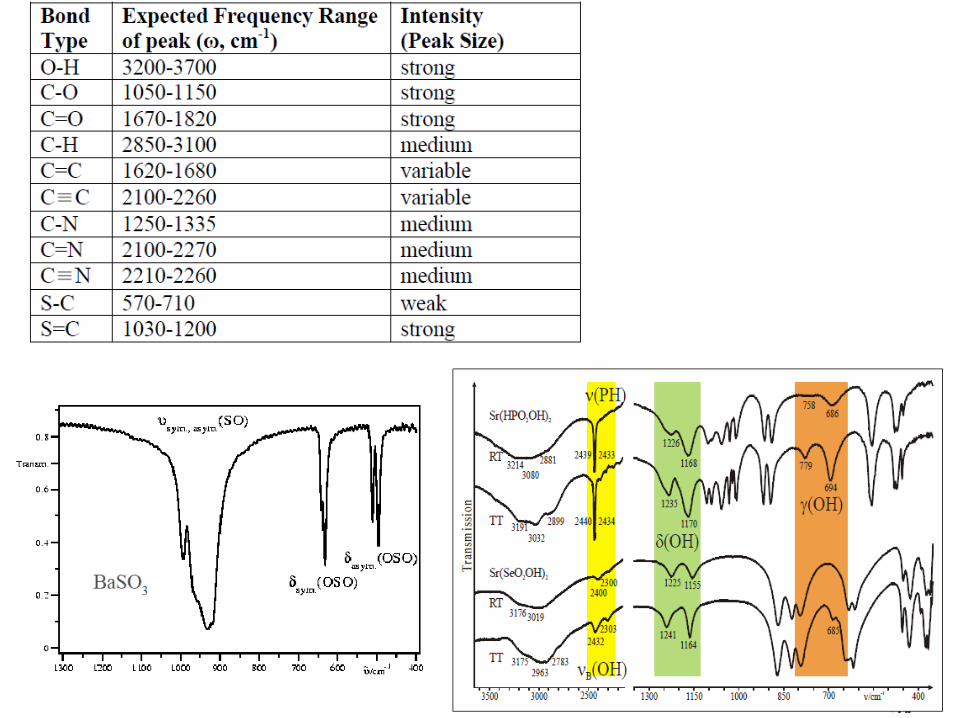
Infrared (IR) spectroscopy
When a chemical sample is exposed to electromagnetic radiation at the right frequency, the atoms of the chemical vibrate at that frequency, resulting in the stretching of bond lengths and angles.
Hooke’s law: F = kx
The detector measures the frequency reduction of the electromagnetic radiation absorbed by the sample, resulting in a peak on the spectrum.
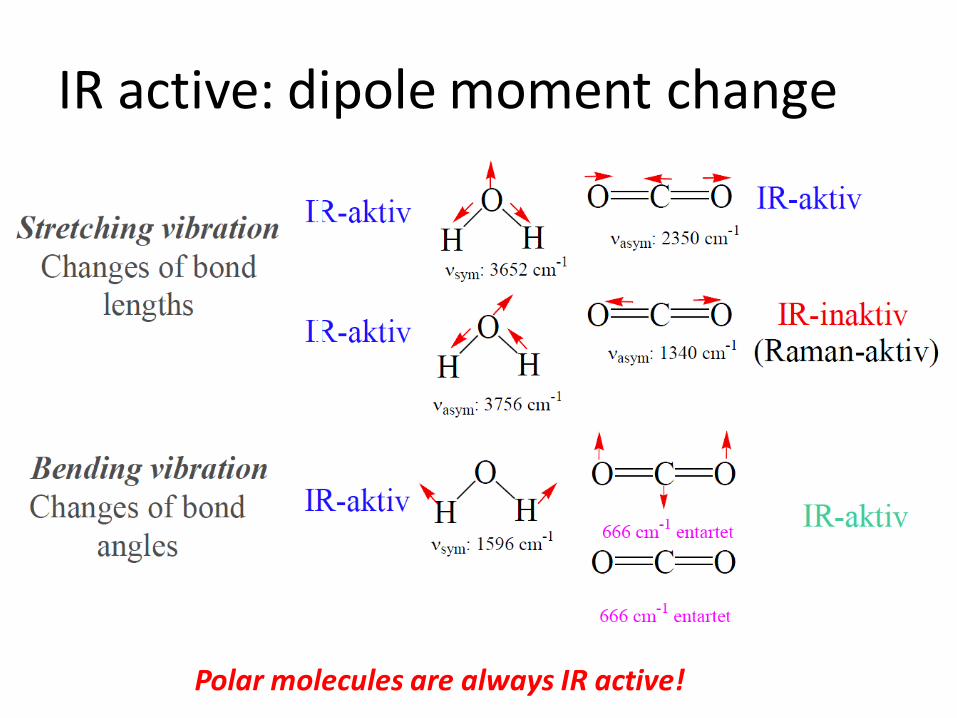
IR active: dipole moment change
Polar molecules are always IR active!

Nonpolar molecules must vibrate in a nonsymmetrical way to be IR active!

Instrumental of Raman Single wavelength laser source
Collimator

Raman spectra of 1,6-dichlorohexane obtained at different excitation lights.
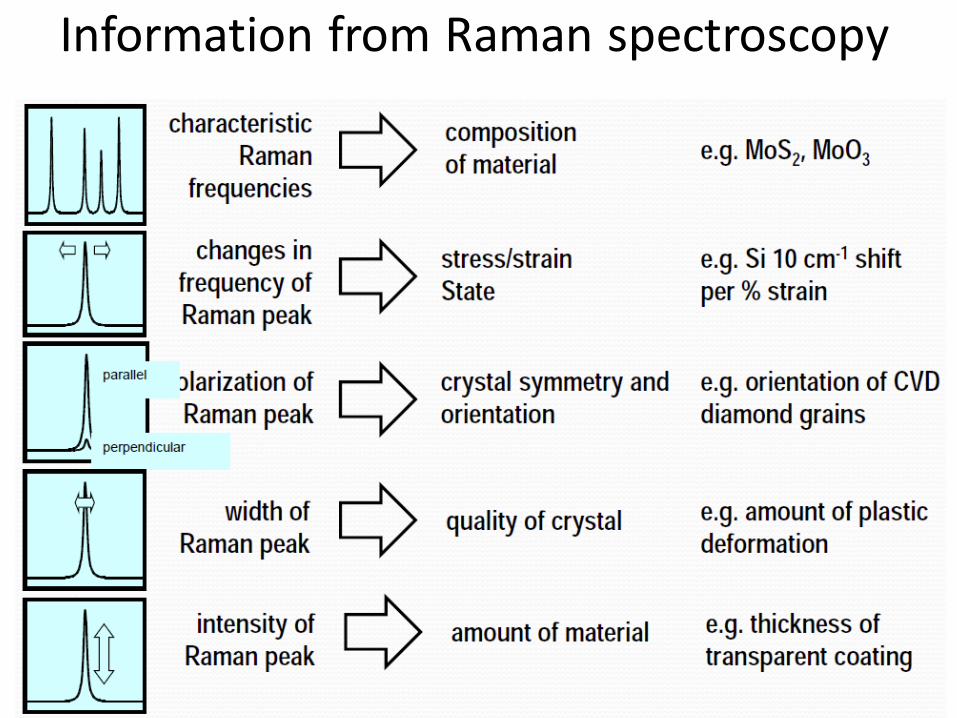
Information from Raman spectroscopy
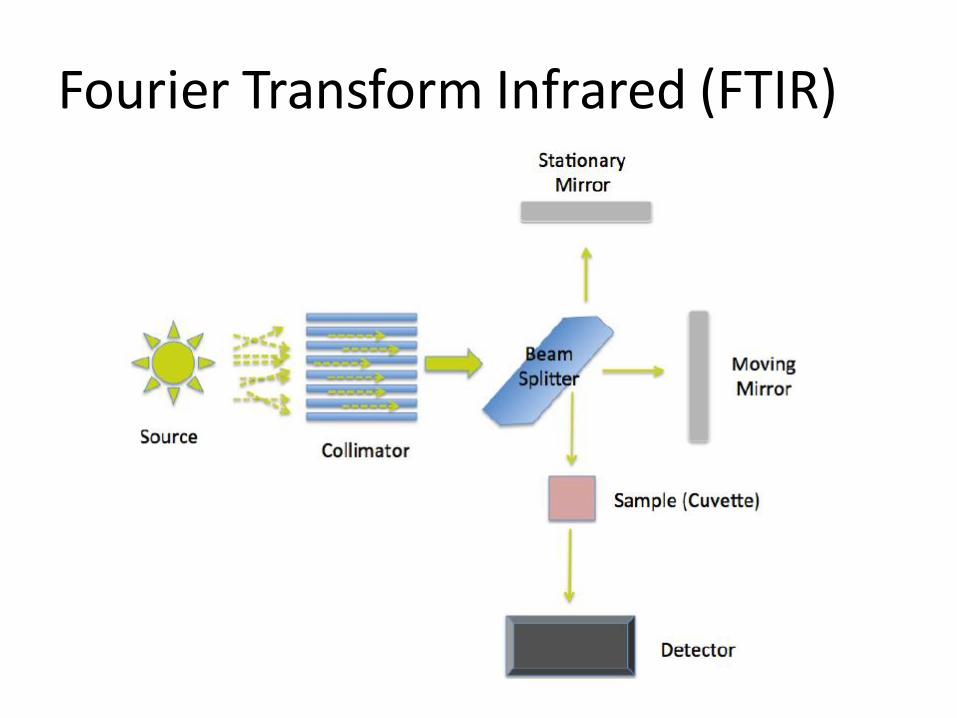
Fourier Transform Infrared (FTIR)
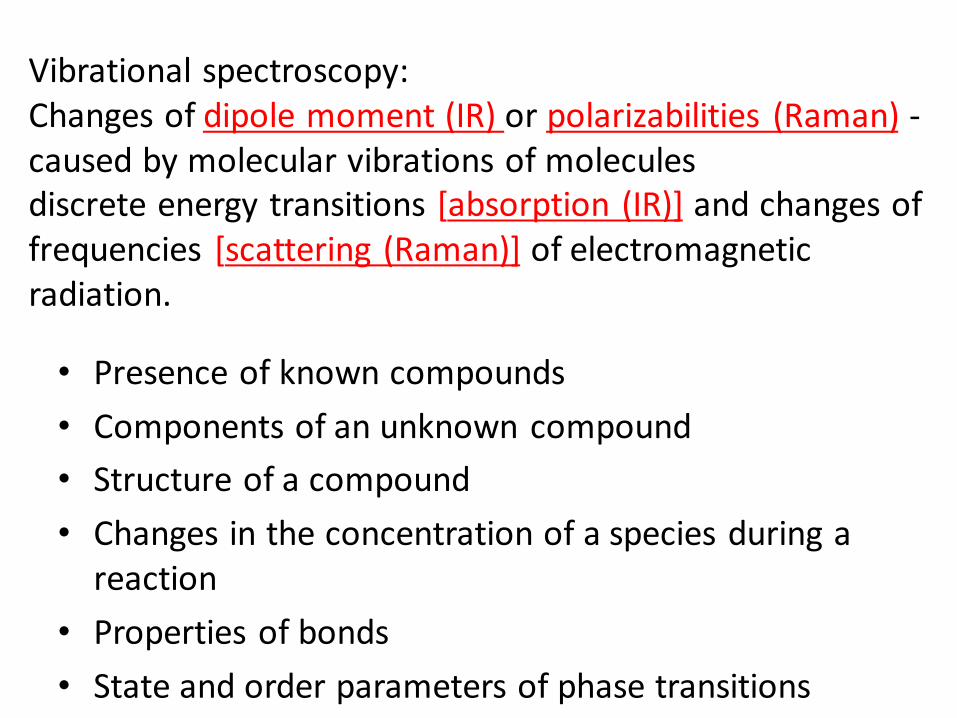
• Presence of known compounds
• Components of an unknown compound
• Structure of a compound
• Changes in the concentration of a species during a reaction
• Properties of bonds
• State and order parameters of phase transitions
Vibrational spectroscopy: Changes of dipole moment (IR) or polarizabilities (Raman) - caused by molecular vibrations of molecules discrete energy transitions [absorption (IR)] and changes of frequencies [scattering (Raman)] of electromagnetic radiation.
Raman Spectroscopy
1923 1925 1928
Adolf Smekal Theoretical prediction of the inelastic scattering of light
C.V.Raman Observed the
effect in more than
50 liquids
Nobel Prize in
Physics in 1930
Grigory
Landsberg &
Leonid
Mandelstam
Observed the
Raman
scattering
A trip in 1921 from Europe to India leads Raman to change history. He
observed the blue color of sea and wondered about its origin. Raman was
aware of Rayleigh’s explanation - the color of the sea was due to the reflection
of blue sky - but he did not accept it. He proceeded to demonstrate Rayleigh’s
explanation to be false. With a diffraction grating, he showed that the
maximum spectral intensity was different for the blue sky and the blue sea.
During his trip, Raman sent two papers to Nature noting that the color of sea
was due to light scattering by the water molecules—a phenomenon he called
molecular diffraction. Thus began Raman’s new research concept: the
molecular basis of light scattering.
Raman and his students observed the frequency shift of scattered light. They
knew the phenomena was not Rayleigh scattering, since that type of scattering
did not produce a frequency shift; however, they needed to exclude the
possibility that fluorescence were causing the shift. They purified the liquids
multiple times. When the phenomenon remained, they concluded that it was
not due to fluorescence.
By 1925, Raman had observed the frequency-shifted scattered light in more
than 50 liquids and, by 1927, he had noticed that the scattered light was
polarized. He described the phenomenon—which he called modified
scattering—in a paper in Nature. Later it would be called the Raman effect.
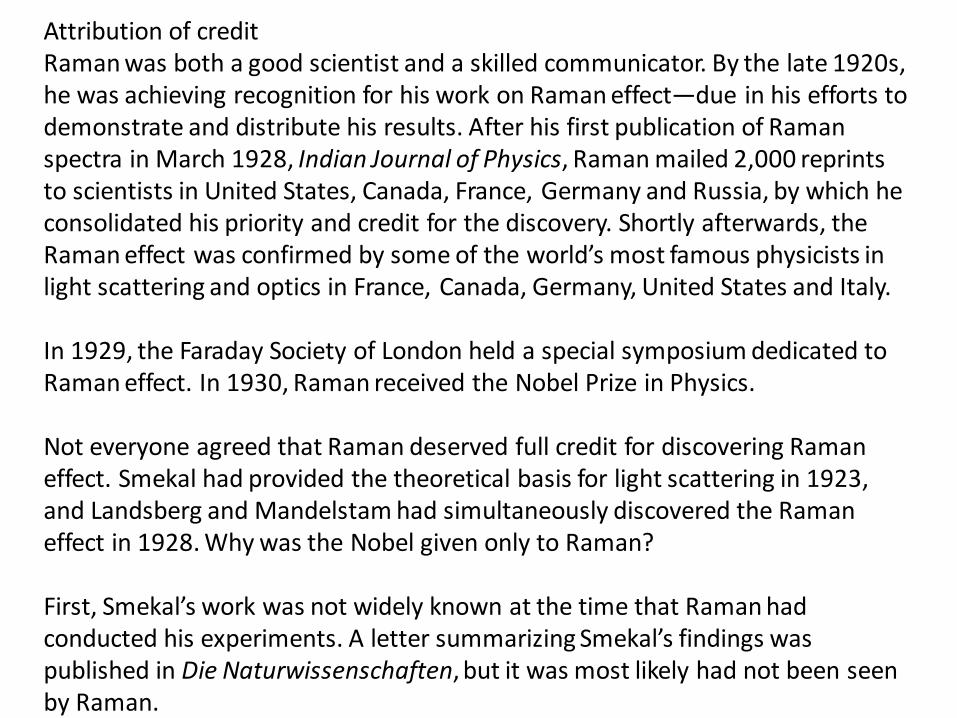
Attribution of credit Raman was both a good scientist and a skilled communicator. By the late 1920s, he was achieving recognition for his work on Raman effect—due in his efforts to demonstrate and distribute his results. After his first publication of Raman spectra in March 1928, Indian Journal of Physics, Raman mailed 2,000 reprints to scientists in United States, Canada, France, Germany and Russia, by which he consolidated his priority and credit for the discovery. Shortly afterwards, the Raman effect was confirmed by some of the world’s most famous physicists in light scattering and optics in France, Canada, Germany, United States and Italy. In 1929, the Faraday Society of London held a special symposium dedicated to Raman effect. In 1930, Raman received the Nobel Prize in Physics. Not everyone agreed that Raman deserved full credit for discovering Raman effect. Smekal had provided the theoretical basis for light scattering in 1923, and Landsberg and Mandelstam had simultaneously discovered the Raman effect in 1928. Why was the Nobel given only to Raman? First, Smekal’s work was not widely known at the time that Raman had conducted his experiments. A letter summarizing Smekal’s findings was published in Die Naturwissenschaften, but it was most likely had not been seen by Raman.

For Landsberg and Mandelstam, they had published their results after Raman’s were in print. In addition, their paper cited previous works by Raman; although this paper was published before Raman’s March 1928 Nature article detailing his discovery, these references perhaps confused the Nobel Committee and led them to believe that the Russians’ work did not represent an independent and simultaneous discovery. Still, many Austrian and Russian physicists felt strongly that credit should be shared. They refused to use the name “the Raman effect,” and referred instead to “combination scattering” or “the Smekal-Mandelstam-Raman scattering.” In 1931, K.W.F. Kohlrausch, an Austrian physicist, gave his book a title that recognized both Smekal and Raman: Der Smekal-Raman Effekt. In fact, some of the Nobel nominations for the 1930 award included other scientists. One nomination went jointly to Raman and Heisenberg. Two others recognized Raman and R.W. Wood, the American scientist who confirmed Raman’s experiments. Another was for Raman, Landsberg and Mandelstam. But the Nobel Committee decided the award should go to Raman alone, and the rest is history.
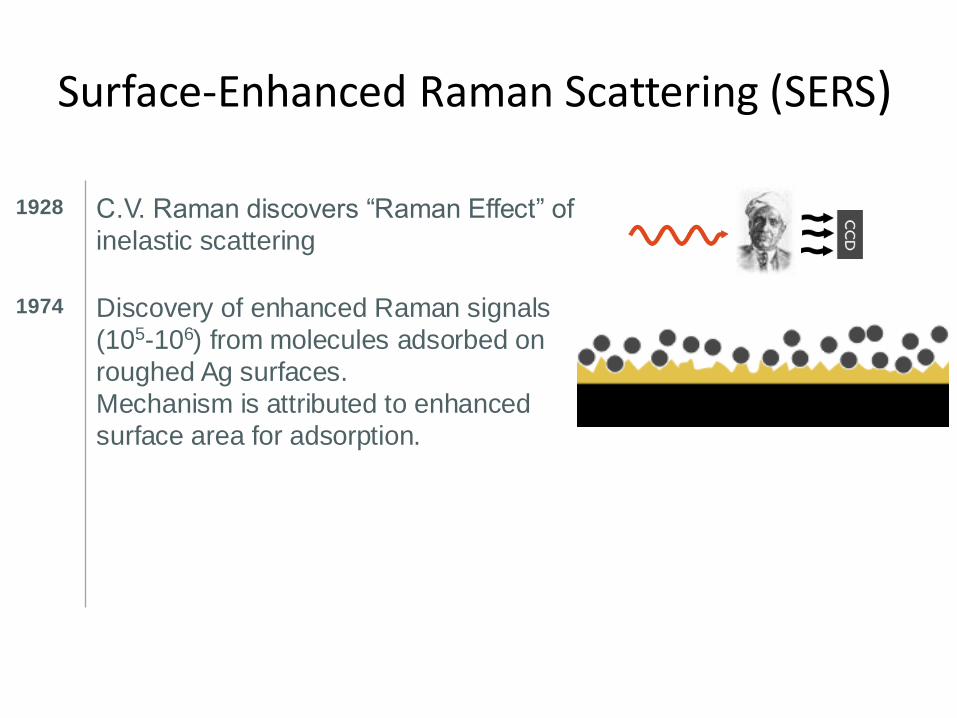
Surface-Enhanced Raman Scattering (SERS)
1928 C.V. Raman discovers “Raman Effect” of
inelastic scattering
1974 Discovery of enhanced Raman signals
(105-106) from molecules adsorbed on
roughed Ag surfaces.
Mechanism is attributed to enhanced
surface area for adsorption.
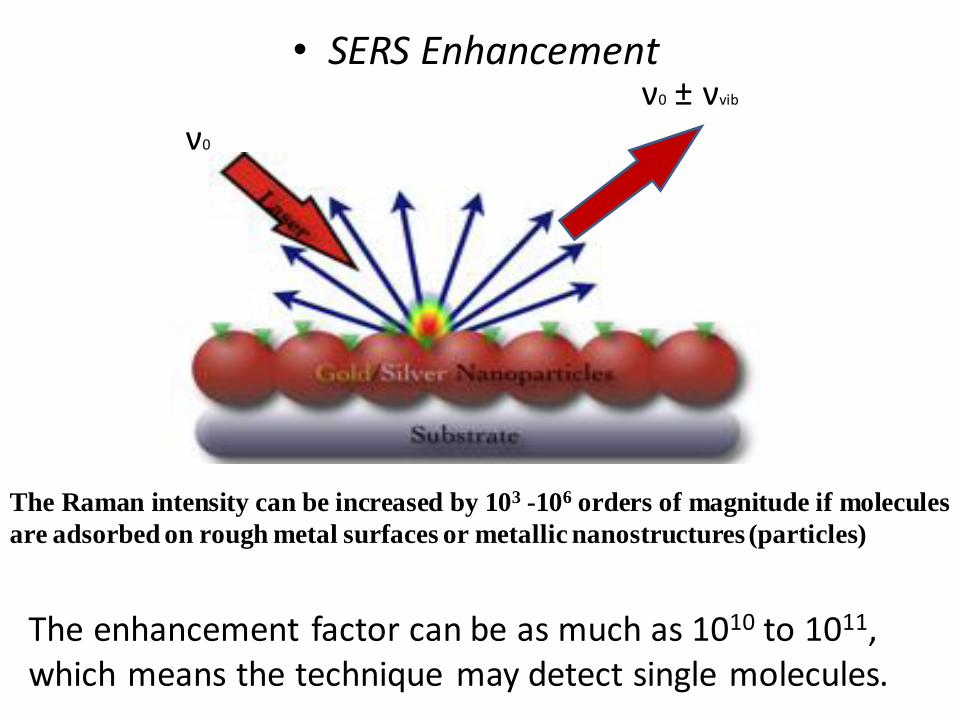
• SERS Enhancement
ν0
ν0 ± νvib
The Raman intensity can be increased by 103 -106 orders of magnitude if molecules
are adsorbed on rough metal surfaces or metallic nanostructures (particles)
The enhancement factor can be as much as 1010 to 1011,
which means the technique may detect single molecules.
Raman vs. SERS
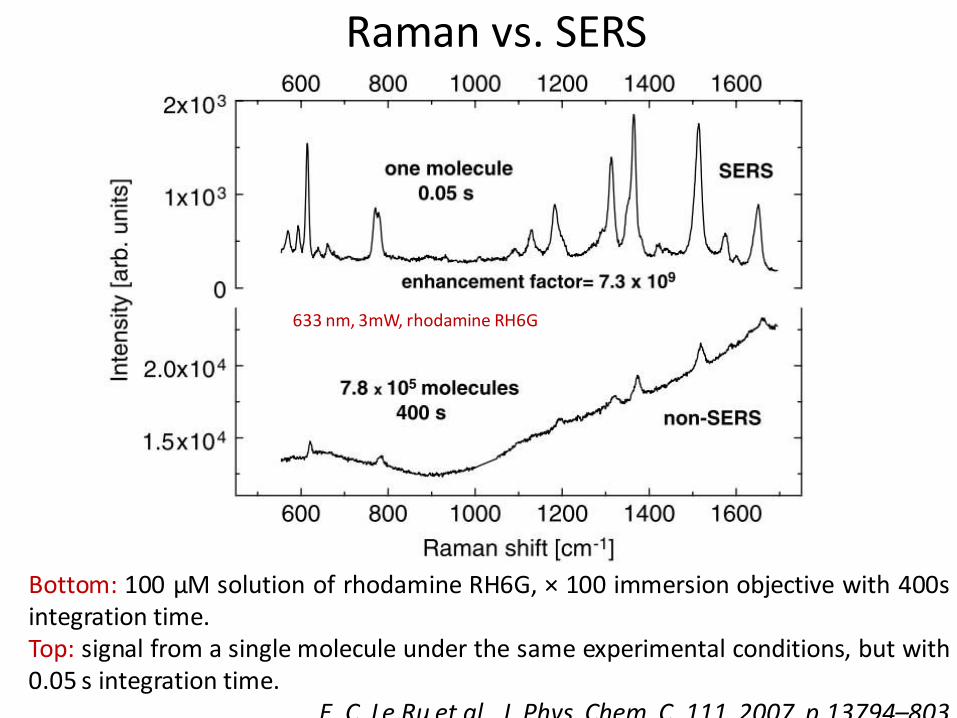
633 nm, 3mW, rhodamine RH6G
Bottom: 100 μM solution of rhodamine RH6G, × 100 immersion objective with 400s integration time. Top: signal from a single molecule under the same experimental conditions, but with 0.05 s integration time.
E. C. Le Ru et al., J. Phys. Chem. C, 111, 2007, p.13794–803
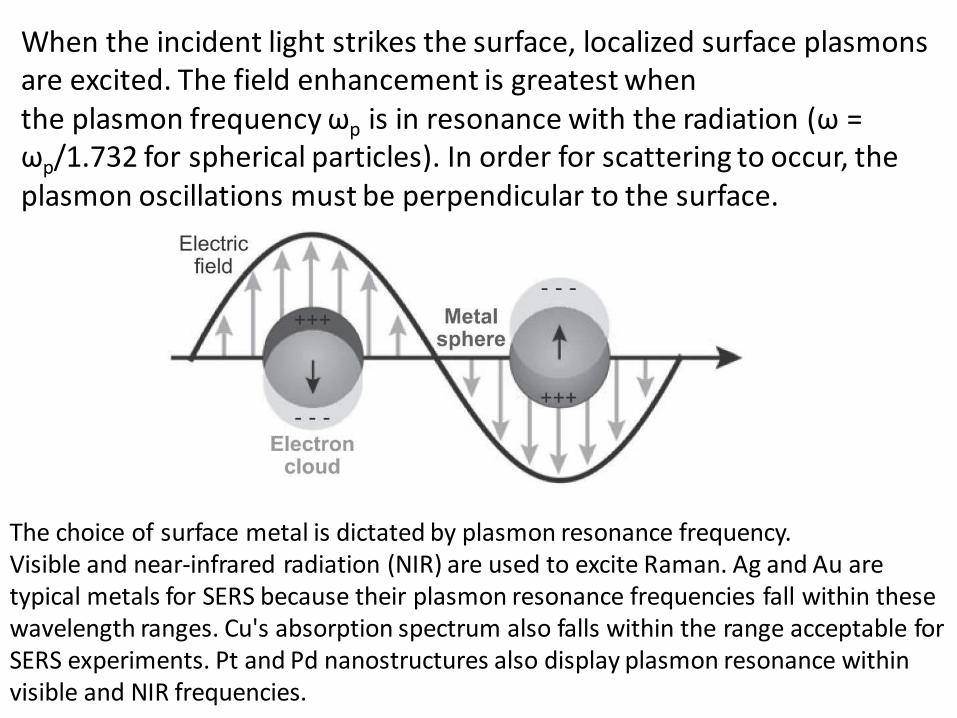
When the incident light strikes the surface, localized surface plasmons are excited. The field enhancement is greatest when the plasmon frequency ωp is in resonance with the radiation (ω = ωp/1.732 for spherical particles). In order for scattering to occur, the plasmon oscillations must be perpendicular to the surface.
The choice of surface metal is dictated by plasmon resonance frequency. Visible and near-infrared radiation (NIR) are used to excite Raman. Ag and Au are typical metals for SERS because their plasmon resonance frequencies fall within these wavelength ranges. Cu's absorption spectrum also falls within the range acceptable for SERS experiments. Pt and Pd nanostructures also display plasmon resonance within visible and NIR frequencies.
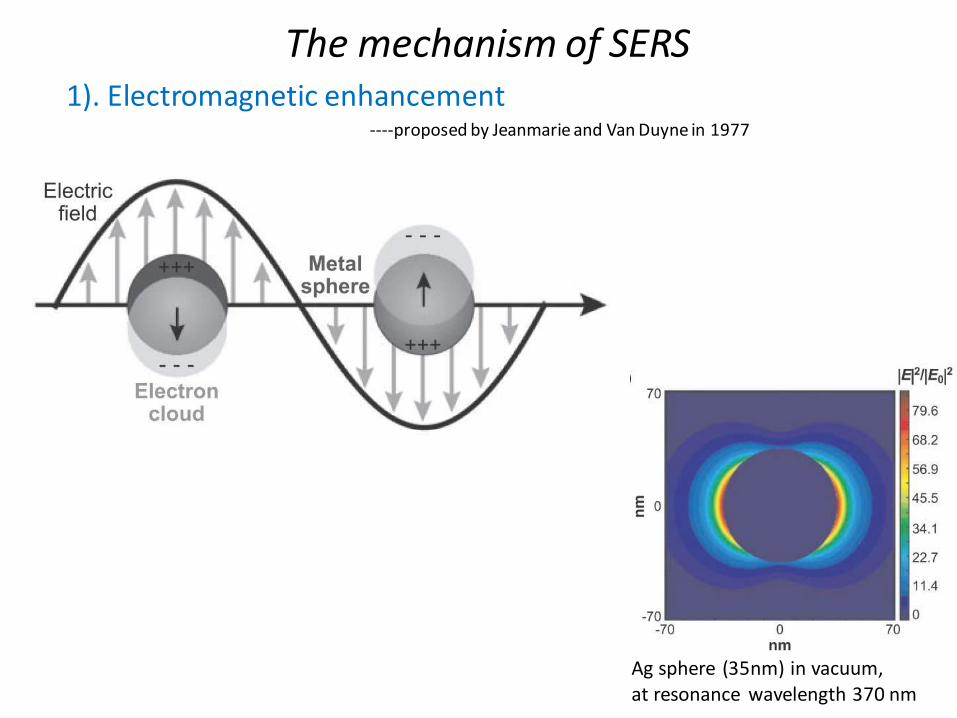
The mechanism of SERS 1). Electromagnetic enhancement ----proposed by Jeanmarie and Van Duyne in 1977
Ag sphere (35nm) in vacuum, at resonance wavelength 370 nm
2). Chemical enhancement ----proposed by Albrecht and Creighton in 1977
Based on metal-molecule charge-transfer effects, involves charge transfer between the chemisorbed species and the metal surface
The exact mechanism of the enhancement effect of SERS is still in
debating:
two different theories and mechanisms:
Electromagnetic theory proposes the excitation of localized surface
plasmons, while the chemical theory proposes the formation
of charge-transfer complexes.
The chemical theory applies only for species that have formed
a chemical bond with the surface, so it cannot explain the observed
signal enhancement in all cases, whereas the electromagnetic theory
can apply even in those cases where the specimen is physical-
adsorbed only to surface. It has been shown recently that SERS
enhancement can occur even when an excited molecule is relatively
far from surface of metallic nanoparticles enabling surface plasmon
phenomena. This observation provides a strong support for the
electromagnetic theory.
Debate of the exact mechanism of SERS, from 1977
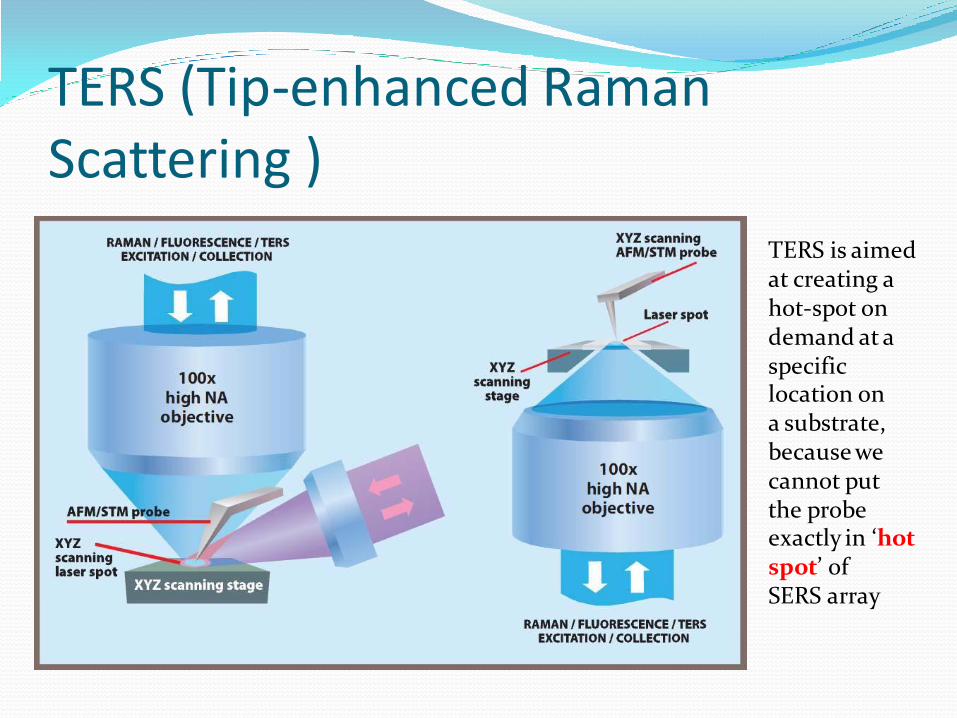
TERS (Tip-enhanced Raman Scattering )
TERS is aimed at creating a hot-spot on demand at a specific location on a substrate, because we cannot put the probe exactly in ‘hot spot’ of SERS array
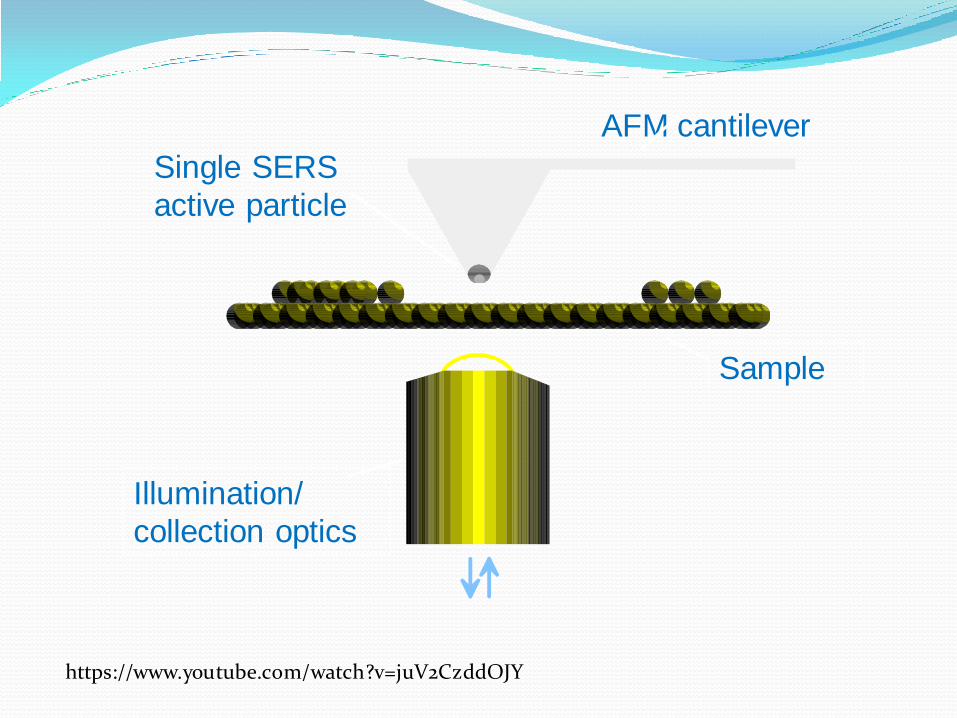
Sample
Single SERS
active particle
AFM cantilever
Illumination/
collection optics
https://www.youtube.com/watch?v=juV2CzddOJY
How to characterize?
• Geometry: STM, AFM, SEM, TEM, LEEM, etc.
Diffraction methods: LEED, RHEED, PED
2D crystallography, real and reciprocal space
• Electronic structure: UPS, XPS, AES, IPES, ARPES, STS, etc.
Work function, Kelvin probe, Jellium model, dipole layer.
• Vibrational properties: Surface phonons, adsorbate vibrations
FTIR (IRAS), Raman, EELS, IETS, HAS, etc.

Work function
• The minimum thermodynamic energy needed to remove an electron from a solid to a point in the vacuum immediately outside the solid surface.
• Not a characteristic of a bulk material, but rather a property of the surface of a material.
W = -eφ - EF
-e: the charge of an electron φ: electrostatic potential in vacuum nearby the surface EF: Fermi level (electrochemical potential of electrons) inside the material -eφ: energy of an electron in the vacuum nearby the surface

Metal: work function = ionization energy
Semiconductor: work function ≠ ionization energy
Very sensitive to surface condition!
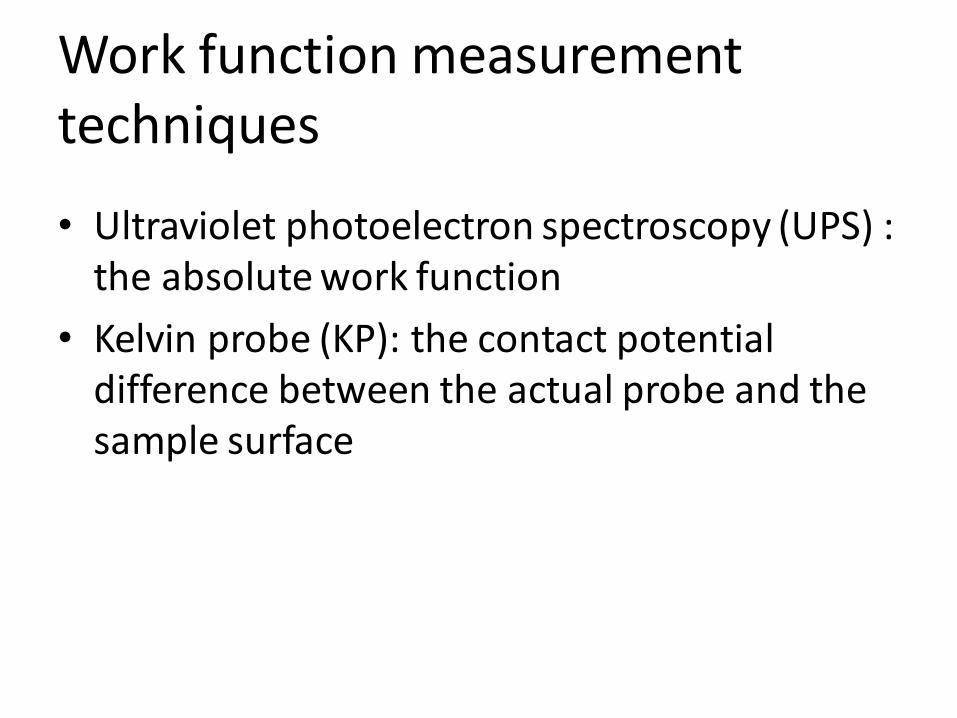
Work function measurement techniques
• Ultraviolet photoelectron spectroscopy (UPS) : the absolute work function
• Kelvin probe (KP): the contact potential difference between the actual probe and the sample surface
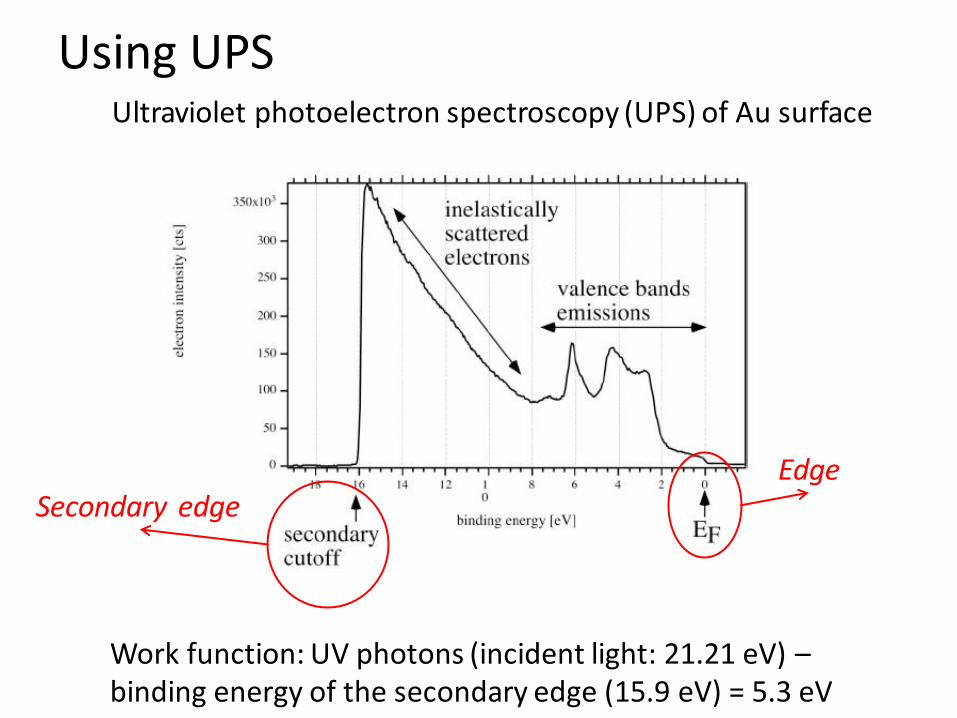
Using UPS Ultraviolet photoelectron spectroscopy (UPS) of Au surface
Work function: UV photons (incident light: 21.21 eV) – binding energy of the secondary edge (15.9 eV) = 5.3 eV
Edge Secondary edge
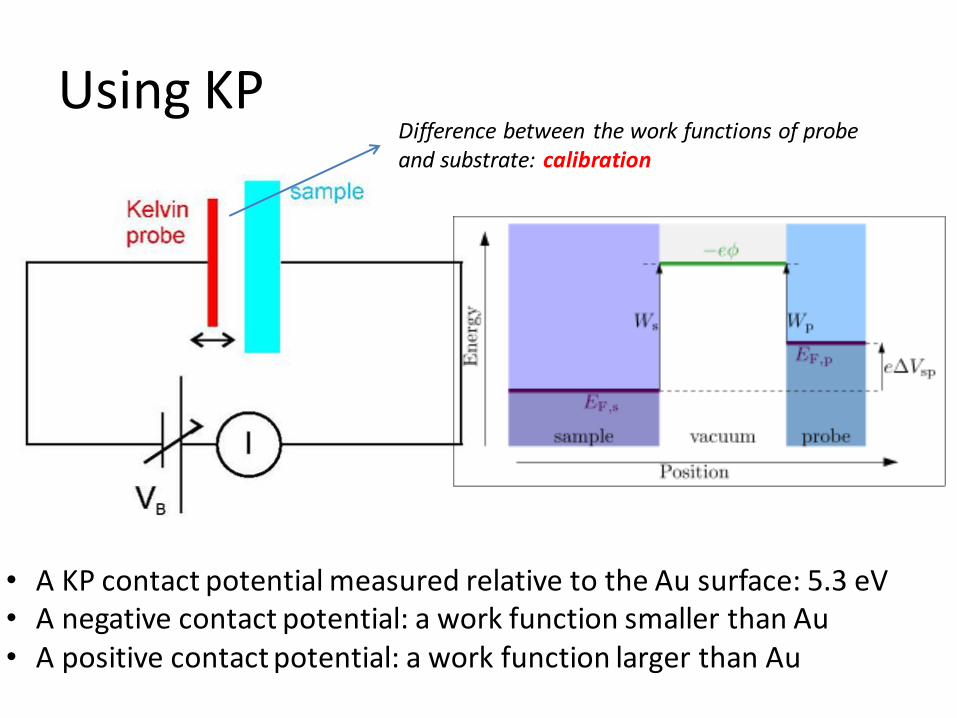
Using KP Difference between the work functions of probe and substrate: calibration
• A KP contact potential measured relative to the Au surface: 5.3 eV • A negative contact potential: a work function smaller than Au • A positive contact potential: a work function larger than Au
Techniques related to electronic surface states
• Ultraviolet photoelectron spectroscopy (UPS)
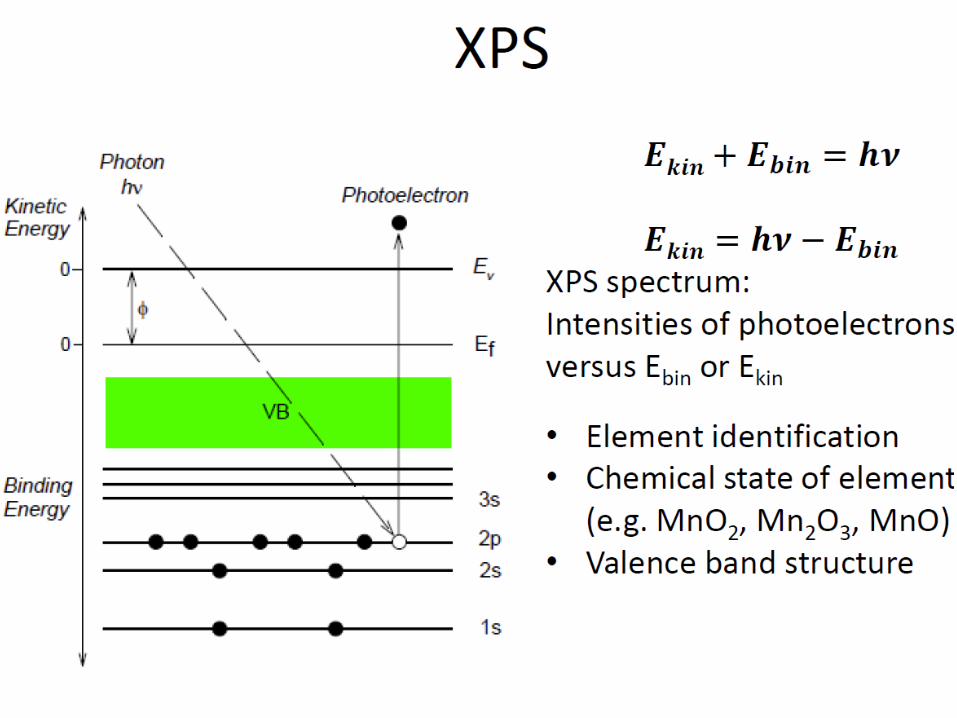
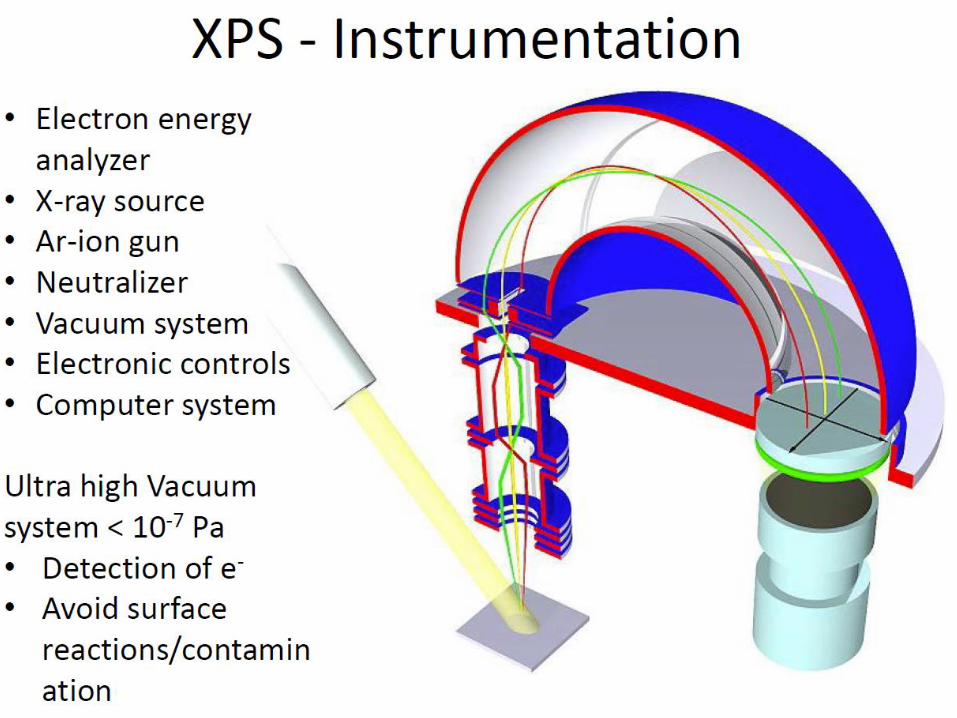
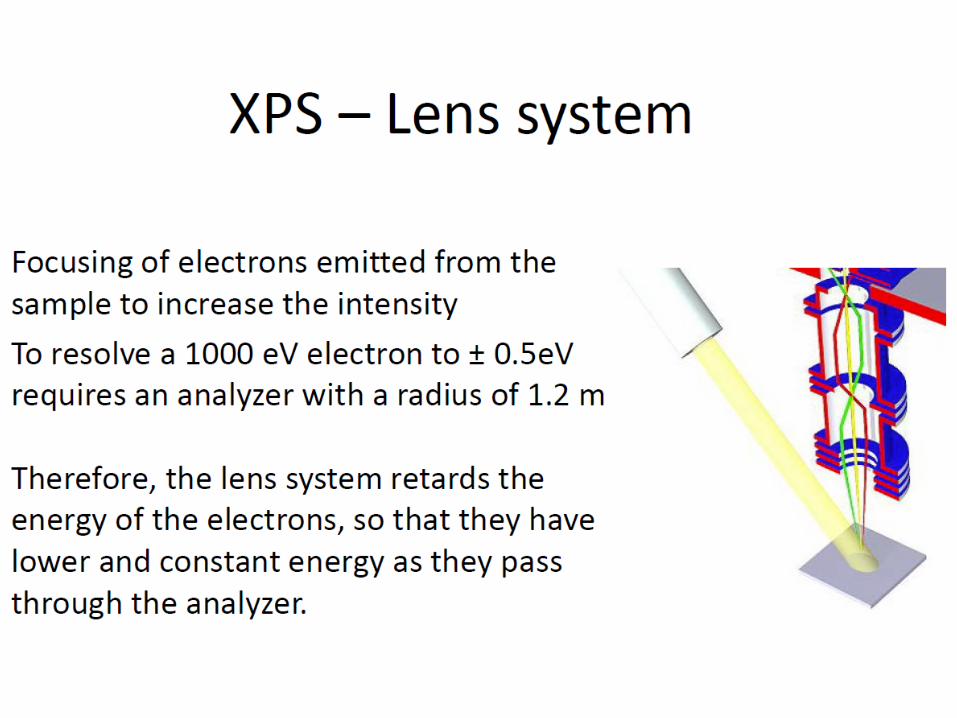
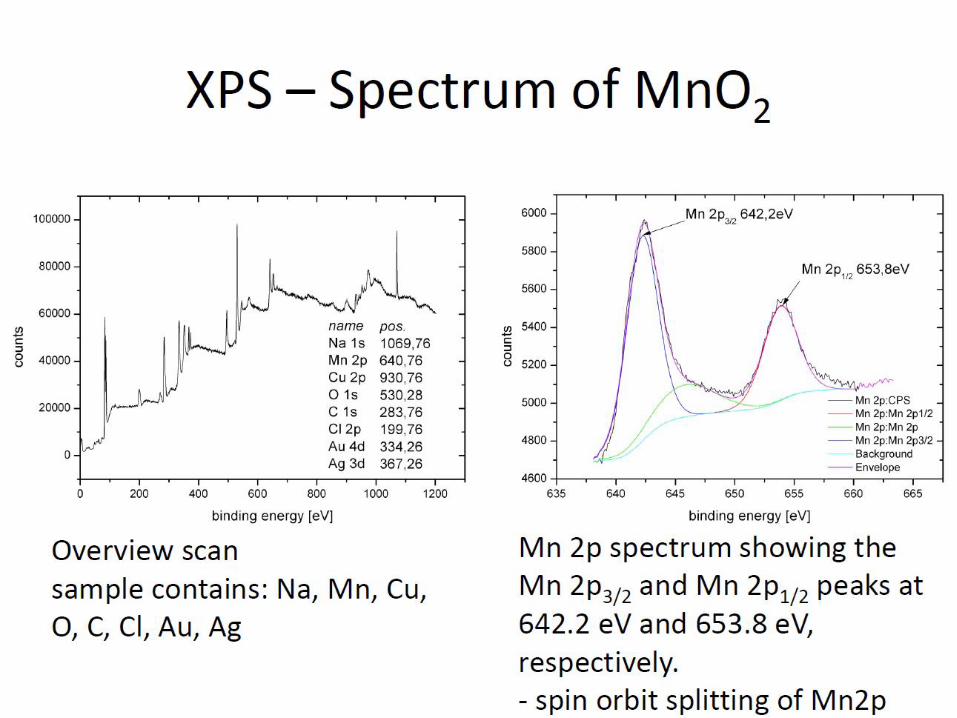
• X-ray photoelectron spectroscopy (XPS)
• Inverse photoemission spectroscopy (IPES)
• Auger electron spectroscopy (AES)
• Angle-resolved photoemission spectroscopy (ARPES)
• Scanning tunneling spectroscopy (STS)

The Nobel Prize in Physics 1981
• Kai Siegbahn
According to quantum physics principles, the electrons in atoms and molecules have defined energy levels. Albert Einstein's theory of the "photoelectric effect" says that a light particle (photon) can liberate an electron from an atom if it has sufficient energy. In the 1950s Kai Siegbahn developed methods for achieving highly accurate measurements of energy levels in atoms by irradiating them with photons and measuring the energy of the electrons emitted using the photoelectric effect.


Auger electron spectroscopy (AES)
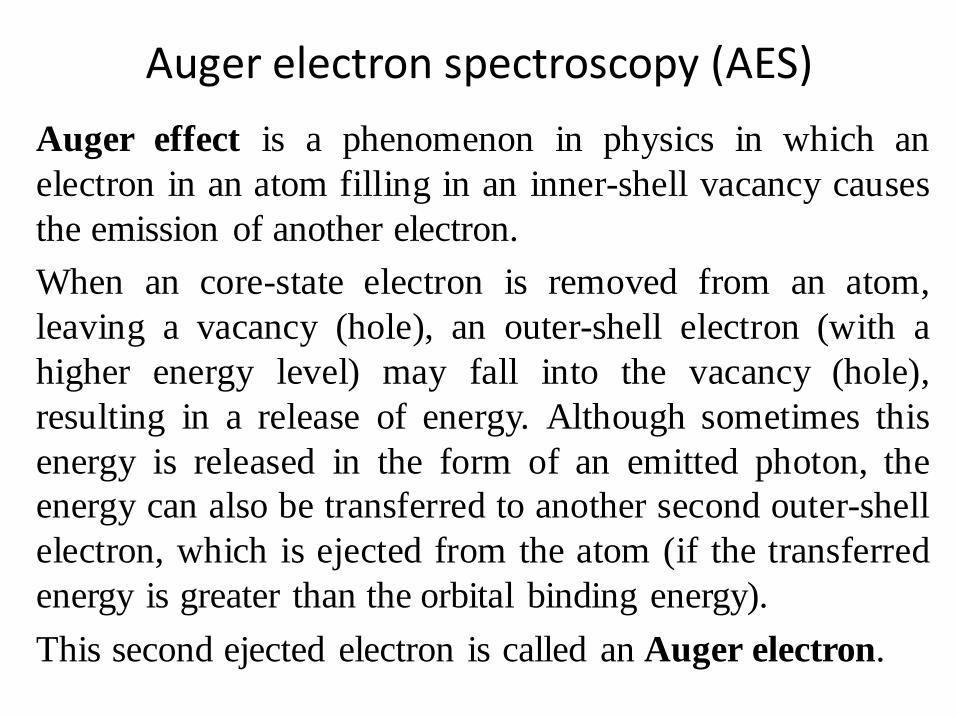
Auger effect is a phenomenon in physics in which an
electron in an atom filling in an inner-shell vacancy causes
the emission of another electron.
When an core-state electron is removed from an atom,
leaving a vacancy (hole), an outer-shell electron (with a
higher energy level) may fall into the vacancy (hole),
resulting in a release of energy. Although sometimes this
energy is released in the form of an emitted photon, the
energy can also be transferred to another second outer-shell
electron, which is ejected from the atom (if the transferred
energy is greater than the orbital binding energy).
This second ejected electron is called an Auger electron.
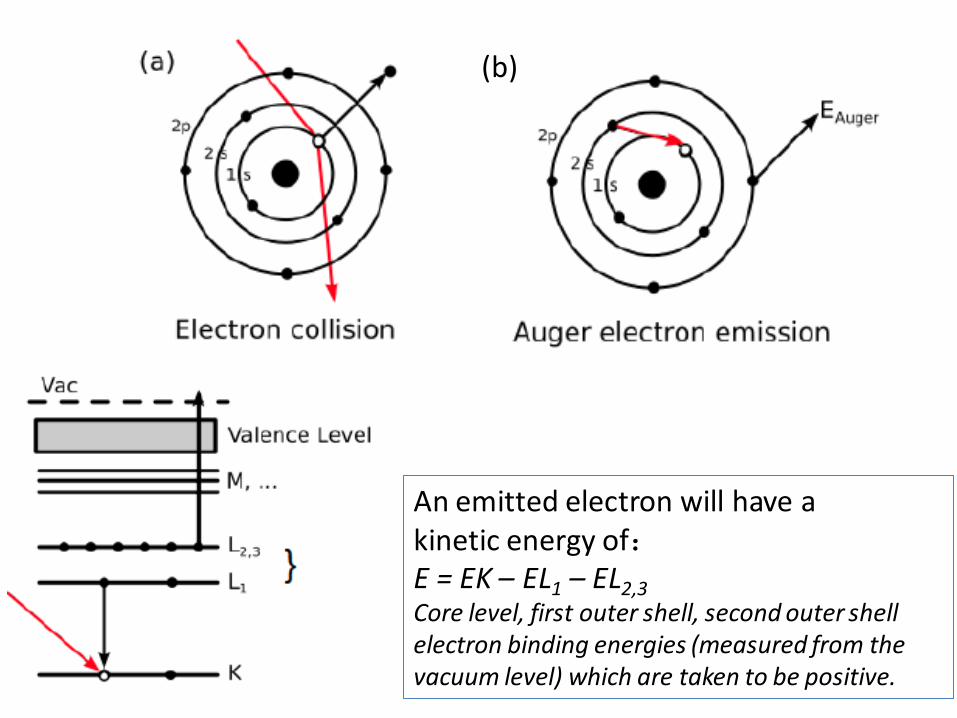
(b)
An emitted electron will have a kinetic energy of: E = EK – EL1 – EL2,3 Core level, first outer shell, second outer shell electron binding energies (measured from the vacuum level) which are taken to be positive.

• Advantages
- Sensitivity to atoms of low atomic number
- High spatial resolution
- Detailed examination of solid surfaces
• Disadvantages
- Not used to provide structural and oxidative state information (XPS)
- Quantitative analysis is difficult

Thank you!