Embed Size (px)
Citation preview

TECHNICAL SKILLS FOR TECHNO- ECONOMIC DEVELOPMENT
by
Sean Godfrey Renecke
A dissertation submitted in partial fulfilment of the requirements for the degree of
MAGISTER INGENERIAE
In
ENGINEERING MANAGEMENT
in the
FACULTY OF ENGINEERING AND THE BUILT ENVIRONMENT
at the
University of Johannesburg
SUPERVISOR: PROFESSOR L. PRETORIUS
2005

ABSTRACT
The low level of living standard of South Africa's black population is a characteristic
of its history. The economic growth and development of any country rely on its
factors of production. The main factor of production that can not be neglected is its
labour force. The labour force of South Africa is plagued by its history, where the
strategy of the past government of that era was to ensure that the black population
remains uneducated. South Africa has however moved beyond its past and is looking
into the future where its people can live in harmony.
The majority of the population fall between the ages of 15-35 classified as youth.
Unfortunately the highest unemployment rate occurs amongst the black youth of
South Africa. The challenge South Africa faces is to alleviate poverty and the high
rate of unemployment. The focus is to boost the work force by changing the skills
profile of the people, which is currently enforced by the government through the
Skills Development Act.
The study undertaken indicated that to achieve a better life for all a paradigm shift in
the educational system of the country must be initiated. A much needed technical
skills development is required. However the long term remedy could be to ensure that
the schools provide quality learners who will be able to be utilised in the work place.
Another important factor of production is technology innovation, the only set-back is
that there is a small community of engineers in the country and the enrolment figures
for this field of study are not promising. One of the root causes of this is the low
percentage of mathematics and physical science learners completing school. As a
result there are a low percentage of learners moving into a technical field of study
especially engineering.
One of ways to unlock South Africa's economic growth is an investment in its people
and engineers are the most suitable custodians. The engineer can drive technology
which is one of the portals to techno-economic growth.

While humanity shares one planet, it is the planet on which there are
two worlds, the world of the rich and the world of the poor. Raanan
Weitz, 1986
We cannot rebuild our society at the expense and standard of living
of ordinary men and women. We cannot develop at the expense of
social justice. We cannot compete without a floor of basic human
standards. Nelson Mandela
The school in many underdeveloped countries is a reflection and a
fruit of the surrounding underdevelopment, from which arises its
deficiency, its quantitative and qualitative poverty. But little by little,
and there lies the really serious risk, the school in these
underdeveloped countries risks becoming in turn a factor of
underdevelopment. Joseph Kizerbo, former Minister of Education,
Burkino Faso
TABLE OF CONTENTS
CHAPTER 1
1
INTRODUCTION
1
1.1 BACKGROUND 1
1.2 PROBLEM STATEMENT 2
1.3 RESEARCH OBJECTIVES 3
1.4 SUMMARY 4
CHAPTER 2 5
ECONOMIC DEVELOPMENT 5
2.1 INTRODUCTION 5
2.2 DEFINING ECONOMIC DEVELOPMENT / GROWTH 5
2.3 MEASURING ECONOMIC DEVELOPMENT 7
2.4 CHARACTERISTICS OF DEVELOPING NATIONS 8
2.4.1 LOW LEVEL OF LIVING STANDARD 8
2.4.1.1 POVERTY 8
2.4.1.2 EDUCATION 9
2.4.2 Low LEVELS OF PRODUCTIVITY 11
2.4.3 HIGH RATES OF POPULATION GROWTH AND DEPENDENCY
BURDENS 11
2.4.4 HIGH AND RISING LEVELS OF UNEMPLOYMENT AND
UNDEREMPLOYMENT 14
2.4.5 SIGNIFICANT DEPENDENCE ON AGRICULTURE PRODUCTION
AND PRIMARY PRODUCT EXPORTS 17
i

2.4.6 DOMINANCE, DEPENDENCE AND VULNERABILITY IN
INTERNATIONAL RELATIONS 18
2.5 CONCLUSION 19
CHAPTER 3 20
OVERVIEW OF SOME ECONOMIC THEORY 20
3.1 INTRODUCTION 20
3.2 RELEVANT ASPECTS OF ECONOMICS 20
3.3 NATIONAL ACCOUNTS 21
3.3.1 GROSS DOMESTIC EXPENDITURE (GDE) 21
3.3.2 GROSS DOMESTIC PRODUCT (GDP) 23
3.4 THEORIES OF ECONOMIC GROWTH 26
3.4.1 THE HARROD-DOMAR MODEL 26
3.5 CONCLUSION 30
CHAPTER 4 31
ECONOMIC HISTORY OF SOUTH AFRICA 31
4.1 INTRODUCTION 31
4.2 SNAP SHOT OF SOUTH AFRICA'S HISTORY 31
4.2.1 A POLITICAL PERSPECTIVE OF SOUTH AFRICA'S PAST 31
4.2.2 THE CRUSADE KNOWN AS 'APARTHEID' 33
4.3 SOUTH AFRICA'S ECONOMIC GROWTH 35
4.3.1 SOUTH AFRICA'S BASIC PRODUCTION FACTORS 37
4.3.1.1 LAND AND NATURAL RESOURCES 37
4.3.1.2 LABOUR AND ENTREPRENEURSHIP 38
4.3.1.3 CAPITAL 39
4.4 ECONOMIC GROWTH A SOUTH AFRICAN PERSPECTIVE 40
ii

4.4.1 SHORT TERM GROWTH
40
4.4.2 LONG TERM GROWTH
41
4.5 CONCLUSION
42
CHAPTER 5 43
THIRD WORLD PERSPECTIVE OF LABOUR 43
5.1 INTRODUCTION 43
5.2 TRENDS IN THIRD WORLD COUNTRIES 43
5.3 SOUTH AFRICA'S LABOUR FORCE 44
5.3.1 THE UNEMPLOYMENT SITUATION IN SOUTH AFRICA 48
5.4 ECONOMIC MODELS OF EMPLOYMENT DETERMINATION 50
5.4.1 BACKGROUND 50
5.4.2 KEYNESIAN THEORY OF EMPLOYMENT 51
5.4.3 TYPES OF UNEMPLOYMENT EXPERIENCED IN SOUTH
AFRICA 52
5.4.3.1 GENERAL UNEMPLOYMENT 52
5.4.3.2 STRUCTURAL UNEMPLOYMENT 52
5.4.3.3 TECHNOLOGICAL UNEMPLOYMENT 53
5.4.3.4 FRICTIONAL UNEMPLOYMENT 53
5.4.3.5 SEASONAL UNEMPLOYMENT 53
5.5 CONCLUSION 54
iii

CHAPTER 6 55
SCIENCE AND TECHNOLOGY ONE OF THE PORTALS TO
ASSIST ECONOMIC GROWTH 55
6.1 INTRODUCTION 55
6.2 SOUTH AFRICA'S EDUCATIONAL SITUATION: A BRIEF
OVERVIEW 56
6.2.1 THE LITERACY LEVEL OF THE POPULATION OF SOUTH
AFRICA 58
6.2.2 THE EDUCATION OUTPUTS OF SOUTH AFRICA 59
6.3 EDUCATION, SOCIETY AND DEVELOPMENT 63
6.3.1 EDUCATION AND ECONOMIC GROWTH 64
6.3.2 EDUCATION, INEQUALITY AND POVERTY 64
6.3.3 EDUCATION, INTERNAL MIGRATION AND FERTILITY 65
6.3.4 EDUCATION AND RURAL DEVELOPMENT 65
6.3.5 EDUCATION AND INTERNATIONAL MIGRATION:
INTELLECTUAL DEPENDENCE AND THE BRAIN DRAIN 66
6.4 CONCLUSION
68
CHAPTER 7 69
TECHNICAL SKILLS DEVELOPMENT A PORTAL TO
SOUTH AFRICA'S ECONOMIC GROWTH AND
DEVELOPMENT 69
7.1 INTRODUCTION
69
7.2 WHY THE NEED FOR SKILLS DEVELOPMENT? 69
7.3 THE NEED FOR ENGINEERING SKILLS IN SOUTH AFRICA 72
iv

7.3.1 DEVELOPMENT OF ENGINEERS FOR SUSTAINABLE
GROWTH 73
7.4 TECHNOLOGY'S ROLES IN ECONOMIC DEVELOPMENT 77
7.4.1 TECHNOLOGY INNOVATION FORCES TECHNICAL SKILLS
DEVELOPMENT 77
7.4.2 SOUTH AFRICA'S PORTRAIT FOR A 'WINING NATION' 80
7.5 NEED FOR ENGINEERS IN ECONOMIC DEVELOPMENT 81
7.6 CONCLUSION 83
CHAPTER 8 85
CONCLUSIONS AND RECOMMENDATION 85
8.1 CONCLUSIONS
85
8.2 RECOMMENDATION
88
BIBLIOGRAPHY 90
v

LIST OF FIGURES
FIGURE 2.1: COUNTRY A AND B WITH DIFFERENT RATES OF GROWTH AND LEVELS
OF INCOME. [1] 7
FIGURE 2.2: GRAPH OF THE LEVEL OF EDUCATION IN SOUTH AFRICA- OCTOBER
1999 [4] 10
FIGURE 2.3: POPULATION PROFILE OF SOUTH AFRICA, MID 2004 ESTIMATES [45] 12
FIGURE 2.4: UNEMPLOYMENT BY AGE IN SOUTH AFRICA- OCTOBER 1999 [4] 15
FIGURE 2.5: GRAPH OF THE UNEMPLOYMENT RATE BY RACE IN SOUTH AFRICA-
1994-1999 [4] 16
FIGURE 3.1: REAL GDP IN FIVE YEAR INCREMENTS FROM 1960 - 2000 [3] 25
FIGURE 3.2: RELATIONSHIP BETWEEN CAPITAL AND OUTPUT [1] 28
FIGURE 4.1: ECONOMIC GROWTH 1947 -2004 [4], [13] 35
FIGURE 5.1: WORKERS BY MAIN OCCUPATION IN SOUTH AFRICA: MARCH 2004
[17] 47
FIGURE 6.1: PERCENTAGE DISTRIBUTION OF LEARNERS BY GRADE, ELSEN AND
PRE-PRIMARY IN ORDINARY SCHOOLS IN 2001 [47] 57
FIGURE 6.2: AVERAGE UNDERGRADUATE SUCCESS RATE IN CONTACT EDUCATION
BY RACE GROUP IN 2001 [47] 63
FIGURE 7.1: MATRICULATION STATISTICS FOR PERIOD 1994 - 2003 [20], [40] 70
FIGURE 7.2: ECSA REGISTRATION TRENDS PER CALENDAR YEAR [38] 75
FIGURE 7.3: THE AGE DEMOGRAPHICS OF SCIENTISTS IN SOUTH AFRICA [49] 76
FIGURE 7.4: THE JAPANESE IMAGE OF THE COMPANY TREE [31] 81
FIGURE 7.5: THE EFFECT TECHNOLOGY HAS ON ECONOMIC GROWTH AND QUALITY
OF LIFE [35], [49] 82
vi

LIST OF TABLES
TABLE 2.1: UNEMPLOYMENT RATE IN SOUTH AFRICA [4], [17] 13
TABLE 2.2: A COMPARISON OF THE STRUCTURE OF TRADE FOR CERTAIN
COUNTRIES' EXPORTS [16] 18
TABLE 3.1: SHARE OF TOTAL SPENDING BY THE CONSUMER, 2000 [3] 22
TABLE 3.2: PERCENTAGE SHARE IN GROSS CAPITAL FORMATION OF THE MAJOR
TYPE OF ASSETS DURING 2000 [3] 23
TABLE 5.1: SOUTH AFRICA' S PROJECTED POPULATION GROWTH RATES [4] 45
TABLE 5.2: SOUTH AFRICA' S ESTIMATED CRUDE BIRTH RATE BY RACE [4] 45
TABLE 5.3: SOUTH AFRICA'S ESTIMATED CRUDE DEATH RATE BY RACE [4] 46
TABLE 5.4: SOUTH AFRICA'S ESTIMATED FERTILITY RATES BY RACE [4] 46
TABLE 5.5: ESTIMATED PROPORTIONAL AGE PROFILE BY RACE -MARCH 2004 47
TABLE 5.6: ESTIMATED POPULATION OF WORKING AGE (15-65 YEARS) OFFICIAL
DEFINITION OF UNEMPLOYMENT, SOUTH AFRICA MARCH 2004 [4] 49
TABLE 6.1: EDUCATION LEVELS OF PEOPLE 20 YEARS AND OLDER BY RACE, 1999
[4] 56
TABLE 6.2: POPULATION BREAKDOWN OF PEOPLE AGED 20 YEARS AND OLDER
ABLE TO READ AND OR WRITE N ONE LANGUAGE, 1999 [4] 58
TABLE 6.3: SOUTH AFRICAN NATIONAL SENIOR CERTIFICATE MATHEMATICS AND
PHYSICAL SCIENCE IN 2001 [47], [35]
60
TABLE 6.4: SOUTH AFRICAN HEADCOUNT ENROLMENTS IN PUBLIC EDUCATION
INSTITUTIONS IN 2001 [47]
60
TABLE 6.5: ENROLMENT RATIOS FOR A FEW DEVELOPED AND DEVELOPING
COUNTRIES [16]
61
TABLE 6.6: GRADUATE/ DIPLOMATS BY MAJOR FIELD OF STUDYING IN 2001 [47] 61
TABLE 6.7: GRADUATE/ DIPLOMATS FORMAL QUALIFICATION N 2001 [47] 62
TABLE 7.1: COMPOSITION OF THE SOUTH AFRICAN WORKFORCE [20] 71
TABLE 7.2: ECSA'S REGISTRATION STATISTICS, AS AT 25 JUNE 2004 [22] 74
vi'

ACKNOWLEDGMENT S
To my wife, Odelle' and baby boy Jared, thank you for your support,
understanding and patience. Your inspiration has motivated me to be successful
in everything I do.
viii

GLOSSARY
GNP: Gross National Product
EAP: Economically Active People
GDE: Gross Domestic Expenditure
GCE: Government Consumption Expenditure
GDP: Gross Domestic Product
LDC: Less Developed Countries
SALFS: South Africa Labour Flexibility Survey
SETA: Sector Education and Training Authority
ANC: African National Congress
ELSEN: Education for Learners with Special Education Needs
SET: Science Engineering and Technology
NSI: National System of Innovation
ECSA: Engineering Counsel of South Africa
ix
Chapter 1
INTRODUCTION
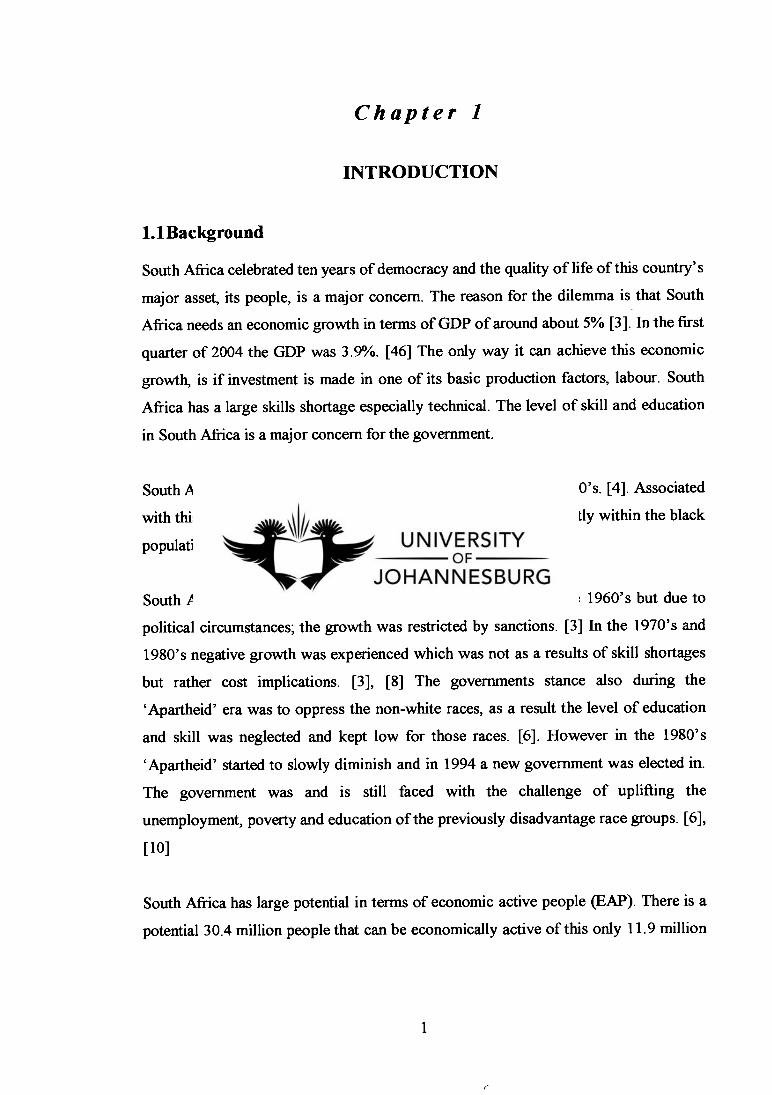
1.1Background
South Africa celebrated ten years of democracy and the quality of life of this country's
major asset, its people, is a major concern. The reason for the dilemma is that South
Africa needs an economic growth in terms of GDP of around about 5% [3]. In the first
quarter of 2004 the GDP was 3.9%. [46] The only way it can achieve this economic
growth, is if investment is made in one of its basic production factors, labour. South
Africa has a large skills shortage especially technical. The level of skill and education
in South Africa is a major concern for the government.
South Africa has experienced a low economic growth since the 1970's. [4]. Associated
with this are high unemployment and poverty rates, occurring mostly within the black
population of South Africa. [17]
South Africa experienced relatively good economic growth in the 1960's but due to
political circumstances; the growth was restricted by sanctions. [3] In the 1970's and
1980's negative growth was experienced which was not as a results of skill shortages
but rather cost implications. [3], [8] The governments stance also during the
`Apartheid' era was to oppress the non-white races, as a result the level of education
and skill was neglected and kept low for those races. [6]. However in the 1980's
`Apartheid' started to slowly diminish and in 1994 a new government was elected in.
The government was and is still faced with the challenge of uplifting the
unemployment, poverty and education of the previously disadvantage race groups. [6],
[10]
South Africa has large potential in terms of economic active people (EAP). There is a
potential 30.4 million people that can be economically active of this only 11.9 million
1

are economically active and 4.6 million are unemployed as per the March 2004 labour
survey. [4], [17].
A large portion of the potential economically active people are persons between the
ages of 15 — 24, approximately 9.6 million of the total population of South Africa.
[17], [45]. This implies that most of the EAP should still be in schools and tertiary
institutions. The national schools' pass rates are however a cause of concern, the
current trend in senior certificate pass rate is relatively high, but the exemption pass
rate have shown little or no change over the last 10 years. [20], [40] Associated with
this is also a low number of learners studying mathematics and physical science. [47]
The effect has thus compounded and is reflective in the low technical and general skill
shortage. The total number of registered engineers with the Engineering Counsel of
South Africa (ECSA) is only 25 767, which accounts for only 0.08 % of the total
potential economically active people in South Africa in 2004. Of this only 3380 are
non white. [22] This low number of engineers could have a negative affect on techno-
economic growth.
1.2Problem statement
The low level of technical skill is affecting the economy especially if it has to be
driven by technology. One of the areas of concern is the high amount of learners in
school and the quality of the learners completing the senior certificate especially the
number of successful learners doing mathematics and physical science. The end effect
is that there is low number of tertiary enrolments in science, engineering and
technology, which is evident in the number of registered engineers. The need for
technical skills (engineers) cannot be over emphasised as engineering and economics
go hand-in-hand. [25] Engineers are required to balance resource limitations, cost
constraints and technology advancements to satisfy human wants. [11] Engineers are
thus needed for any technology driven economy and investment in technical skills
development can only produce rewards for the economy and thus the population. [24]
2

1.3 Research objectives
The purpose of this research is to determine the importance of skills development in
South Africa, especially technical skills and why there is a shortage of it. The research
also investigates the link between engineering and economics, from a growth
perspective. The level of economic growth is also reviewed to determine what can be
proposed to contribute to South Africa's economic growth.
The following are the major objectives of this research
To review South Africa's economic development and the effects it has on the
population.
To provide a basis of economic theory
To review South Africa's economic history to better understand its current
challengers.
Certain aspects of Third World countries will be reviewed to determine if there
is a common trend.
A link between education and the economy is reviewed.
Finally, the need for technical skill and the current skill shortage is investigated
3

1.4Summary
South Africa has great potential; its population consists of a vast array of unique and
talented people. The potential of South Africa must be unlocked as its future is in its
people. The high poverty and unemployment rates are a major concern affecting the
economy. The level of technical skill is also low especially for an economy that wants
to be driven by technology. The quality of the senior certificate pass rates is also of
concern. This research aims to determine the link between technical skill
(engineering) and economic growth.
Before the link between engineering and economic development is reviewed it is
important to determine the aspects of economic development, which is the focus of
Chapter 2.
4

Chapter 2
ECONOMIC DEVELOPMENT
2.1Introduction
Before the issue of skills development and the economy is discussed, it is important to
define economic development and the various facets of economics.
Economic development cannot be described in a single definition as it can be
interpreted in terms of objectives or processes. The aim of these objectives is to
influence the countries growth towards a sustainable community. The challenge of
ensuring economic development is no easy task, as creating jobs, elevating poverty
and improving the overall quality of life can not be done overnight. [9], [17]
2.2 Defining economic development / growth
It is important to distinguish between economic development and economic growth;
these two words are normally used synonymously when discussing economic issues.
Although they go together they have minor differences in terms of economics.
The Oxford dictionary defines the two as: [48]
Growth: process of growing; thing that grows or has grown; Growth industry one
developing faster than others
Development: make or become larger or more mature or organized; bring or come into
existence; make usable or profitable, build on (land); treat (a film etc.) so as to make a
picture visible.
Growth and development work hand in hand. An economy cannot have growth and no
development and vice versa; development without growth does not result in a
sustainable economy.
5

In its simplest form economic development consists of three major areas: [9]
Policies that government undertakes to meet broad economic objectives
including inflation control, high employment and sustainable growth. [9]
Policies and programs to provide services including building highways,
managing parks and providing medical access to the disadvantaged. [9]
Policies and programs explicitly directed at improving the business climate
through specific efforts, business finance, marketing, neighbourhood
development, business retention and expansion, technology transfer, real estate
development and others. [9]
Successful economic development differs, for various countries due to geographical
and political environment. [9]
A countries size, population and level of income per capita are important for economic
development. [2] Generally, large size has advantages of diverse resource capabilities,
large market potential and a smaller dependence on foreign sources of material and
products. [2] On the other hand, large size can have problems of administrative
control, national cohesion and regional imbalance. [2] "India has a population of 810
million and an annual per capita income level of less than $275, while Singapore with
less than 2.7 million people has an annual GNP per capita of over $7400." [2]
The political structure and the vested interest and allegiance of ruling elites typically
determine the strategies which could lead to effective economic development. [2]
"What ever the distribution of power among military, large landowners of Latin
America, the politicians and high level civil servants of Africa, the oil sheiks and
financial moguls of the Middle East and the wealthy industrialists of Asia — most
developing countries are ruled directly and indirectly by small powerful elites to a
greater extent than that of developed nations." [2]
Generally, there is no single formula, strategy or government policy that can be used to
achieve economic development. South Africa is faced with the challenge of elevating
6
700
Country A
Country B
0 2 4 6 8 10 12
Time Periods
Inco
me
(Mon
ey u
nit
s)
400
300
200
100
poverty and raising the skill level so as to uplift the standard of living for the majority
of the population.
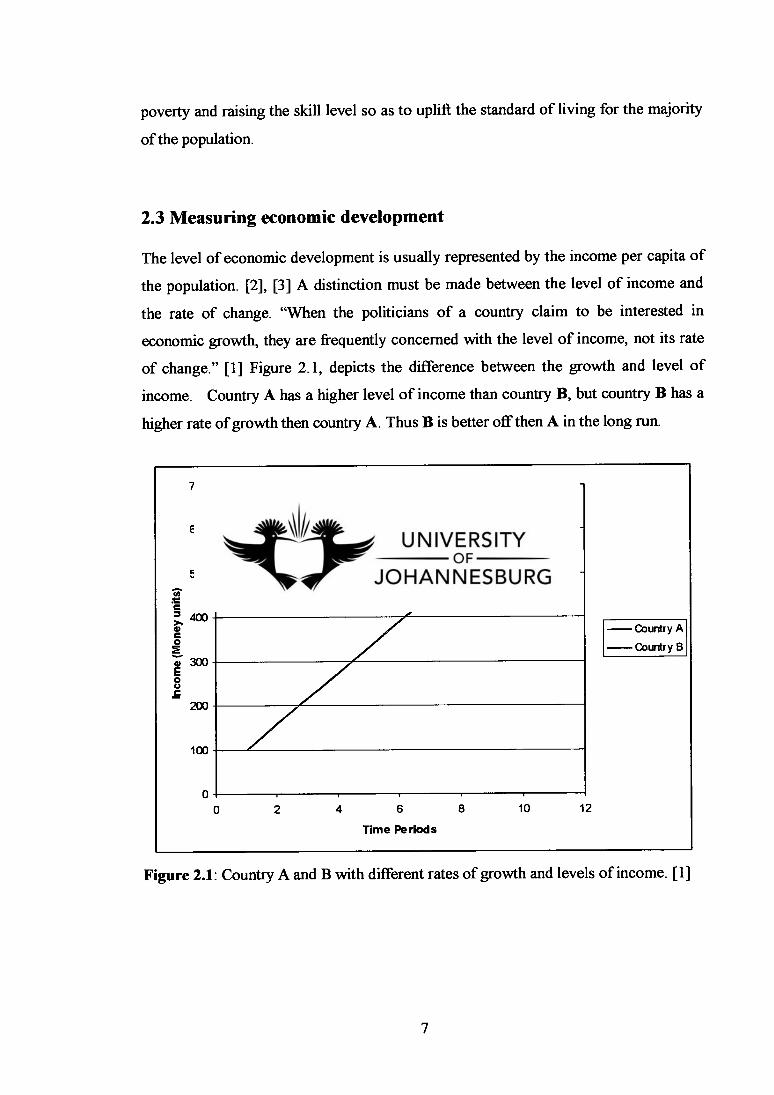
2.3 Measuring economic development
The level of economic development is usually represented by the income per capita of
the population. [2], [3] A distinction must be made between the level of income and
the rate of change. "When the politicians of a country claim to be interested in
economic growth, they are frequently concerned with the level of income, not its rate
of change." [1] Figure 2.1, depicts the difference between the growth and level of
income. Country A has a higher level of income than country B, but country B has a
higher rate of growth then country A. Thus B is better off then A in the long run.
Figure 2.1: Country A and B with different rates of growth and levels of income. [1]
7

The Gross National Product (GNP) per capita is used as a summary index of the
relative well-being of people in different nations. [1], [3] It is particularly useful as it
depicts both the efficiency of production and the success in achieving economic goals.
2.4Characteristics of developing nations
The common characteristics of a developing nation can be classified into six broad
categories: [2] South Africa can be classified as a developing nation, the six categories
will be defined and a South African perspective provided. [2]
2.4.1 Low level of living standard
Developing nations generally have low levels of living standard for majority of the
population in the country. [2] The low levels can manifest in the form of poverty, lack
of housing, poor health, low levels of education, high infant mortality, low life
expectancy and work expectancy. [2]
2.4.1.1 Poverty
The degree of poverty in any country depends on two factors: 1) the average level of
national income and 2) the degree of inequality in its distribution. [2] This implies that
the more unequal the distribution, the greater the extent of the poverty. Thus also for
any given distribution, the lower the average level of income, the greater the extent of
poverty. [2]
Economists have developed an international standard of measuring the level of
poverty; this is the "international poverty line" and is expressed in dollars $. [15]
8

In 1995, South Africa's International Poverty Line indicated that 7.1% of the
population was below the $1 a day and 23.8% of the population was below $2 day. See
Appendix 1, Data on poverty, from the World Development Indicators 2004 report.
[15]
According to a survey completed in 1996, approximately 57% of South Africa's
population is living in abject poverty. [5] The survey used, defined the minimum living
level as 'the minimum financial requirements for members of a family to maintain
their health and have acceptable standards of hygiene and sufficient clothing for their
needs.' [5]
2.4.1.2 Education
Third world countries can also be evaluated on the spread of educational opportunities;
the most significant of these is to provide primary school education opportunities. In
most countries education takes up a large portion of the government's budget.
Although the number of enrolments in schools has generally increased, the literacy
levels of developing nations are still very low in comparison to developed countries.
[2]
The South African situation reflects the trend of developing nations. The data in Figure
2.2 indicates the education levels in 1999 for the population aged 20 years and older
which only made up 12% of the total population. [4]
9

o No Education, 2792000, 12%
o Other / unspecified, 430000, 2%
o Degree /higher, 884000, 4%
Primary, 6058000, 26%
Secondary, 12115000, 50%
Diploma /certificate with
grade 12, 1033000,4%
o Diploma /certificate with
grade 11 or lower, 237000, 1%
0 NTC 1-3, 150000, 1%
Level Of Education
Source: Statistics South Africa, October Household Survey 1999
Figure 2.2: Graph of the level of education in South Africa- October 1999 [4]
The level of education within the population can be improved. The South African
government has formulated many programs and policies to address this issue.
However it can be inferred from the data in Figure 2.2, that to improve the economy
and increase the level of technology, a dramatic change must take place within South
Africa's level of education. The issue of education is discussed in more detail in
Chapter 6.
10

2.4.2 Low levels of productivity
"The concept of a production function systematically relating outputs to different
combinations of factor inputs for a given technology is often used to describe the way
in which societies go about providing for their material needs." [2] When a comparison
is made throughout the world it is easy to identify that the output per worker in
developing countries are lower than that of developed countries. The low levels of
labour productivity can be due to the lack of factor inputs, one of them being physical
capital. [2], [3]
To increase productivity, domestic and foreign finance should be invested into
physical capital goods. To increase the human capital, investment should be made in
education and training. [3]
2.4.3 High rates of population growth and dependency burdens
The birth and death rates for developing and developed countries are different. Birth
rates in developing countries are generally relatively high; similarly the death rates are
also high when compared to developed countries. [2]
The high birth rate implies that approximately 33% of South Africa's population
consists of children under the age of 15. [4] In developed countries this figure is in the
order of 23% which suggests that the active labour force has to support, proportionally,
almost double as many children in developing countries. On the other hand, the
percentage of people over the age of 65 is higher in developed countries. [4]
Economically Active People (EAP) are defined as persons between the ages of 15 and
65 years who are working, or person whoa are unemployed. [4] Children and the
elderly are thus referred to as an economic 'dependency burden' meaning that they do
not contribute productively toward society and must thus be supported by the active
labour force. [4]
11

I LAJ70
90%
— 80%
70%—
—
—
__ 60%
— 50% —
— 40% —
— 30% ---
--- 20% —
— 10% —
0% 0-14 15-24 25-34 35-49 50 -64 65+
0 Indian 293627 216896 188095 232581 149243 57544
o Coloured 1270342 763954 772906 823884 375860 143812
White 890074 652393 564834 1083974 853949 451623
African 13346112 8043350 6911475 6015930 2934383 1189886
Indian
Coloured
White
African
O Age 65+ 1842865
4%
0 Age 35-64 12469804
26% O Age 0-14
15800155 33%
0 Age15-34 18113903
37%
Figure 2.3: Population profile of South Africa, mid 2004 estimates [45]
Figure 2.3, reveals that potentially South Africa has 63% of the population that
potentially can be economically active, the highest occurring amongst the black South
Africans. On the other hand South Africa's economic burden makes up almost 36% of
the population. These values would not have been a cause for concern if South Africa
did not have such a high unemployment rate. [17]
12

However, the South African unemployment rate is a major issue affecting the
economy, with a 27.8% unemployment rate as shown in Table 2.1. The unemployment
defined as the number of economically active people who cannot find work. [4]
Race Total % of EAP
Not Economically
active
Economically Active
Total I Workers I Unemployed
per race I per race N (1000) %
Total Population 48227
?Me ➢tion EA? 30429 100% 13833 16596 11984 461111 27.8%
°/® of total Population 63.1% 28.7% 34.4% 24.8% 9.6%
milack African 23743 78.0% 11488 48.4% 12255 8149 4106 24.7%
% of total Population 49.2% 23.8% 25.4% 16.9% 8.5%
Coloured 2787 9.2% 1010 36.2% 1776 1462 314 1.9%
% of total Population 5.8% 2.1% 3.7% 3.0% 0.7%
'Indian. Asian 862 2.8% 350 40.6% 512 425 87 0.5%
% of total Population 1.8% 0.7% 1.1% 0.9% 0.2%
White 3021 9.9% 978 32.4% 2043 1942 101 0.6%
°A) of total Population 6.3% 2.0% 4.2% 4.0% 0.2%
Table 2.1: Unemployment rate in South Africa [4], [17]
The potential EAP is 30 429 000 which as stated previously accounts for 63% of
48 226 727 people making up the total population of South Africa. The economically
contributing people make up only 24.8 % of the total population, since 28.7% is not
economically active and just over 9.6% are unemployed. Also evident from table 2.1,
13

is that 78% of the potential EAP occurs in the Black population, where a large portion,
48%, is not economically active and 24.7% are unemployed.
When one investigates the data, it can be both alarming and challenging. To raise the
level of education, increase the amount of EAP and reduce the level of unemployment
is a daunting task. This is compounded by the fact that South Africa would have to
provide more jobs for the new EAP as well. The flip side is that the economic situation
of South Africa can improve; the data presented above can change. If an emphasis is
placed on increasing the number of EAP and decrease the number of unemployment,
the effect can be two fold. There could be a reduction in poverty and an increase in the
economic growth, which can be beneficial to all South Africans.
The government knows what is required; the main concern is how it is going to be
achieved. South Africa's greatest potential, its wealth and future lies in its people. The
more people, especially the black population, contributing to the economy implies that
there would a reduced economic burden on the EAP as potentially the unemployment
rate would decrease.
2.4.4 High and rising levels of unemployment and underemployment
The major problem facing developing countries is the ability to utilize the labour
effectively. Underutilization of labour can manifest in two forms. [2]
Those who work less than what they could and those who work full time
but have a low productivity.
Then there is unemployment — those who are able or eager to work but for
whom no suitable jobs are available.
Unemployment as defined by Statistics South Africa is those among the EAP who: [4]
■ Have not worked during the last seven years
14
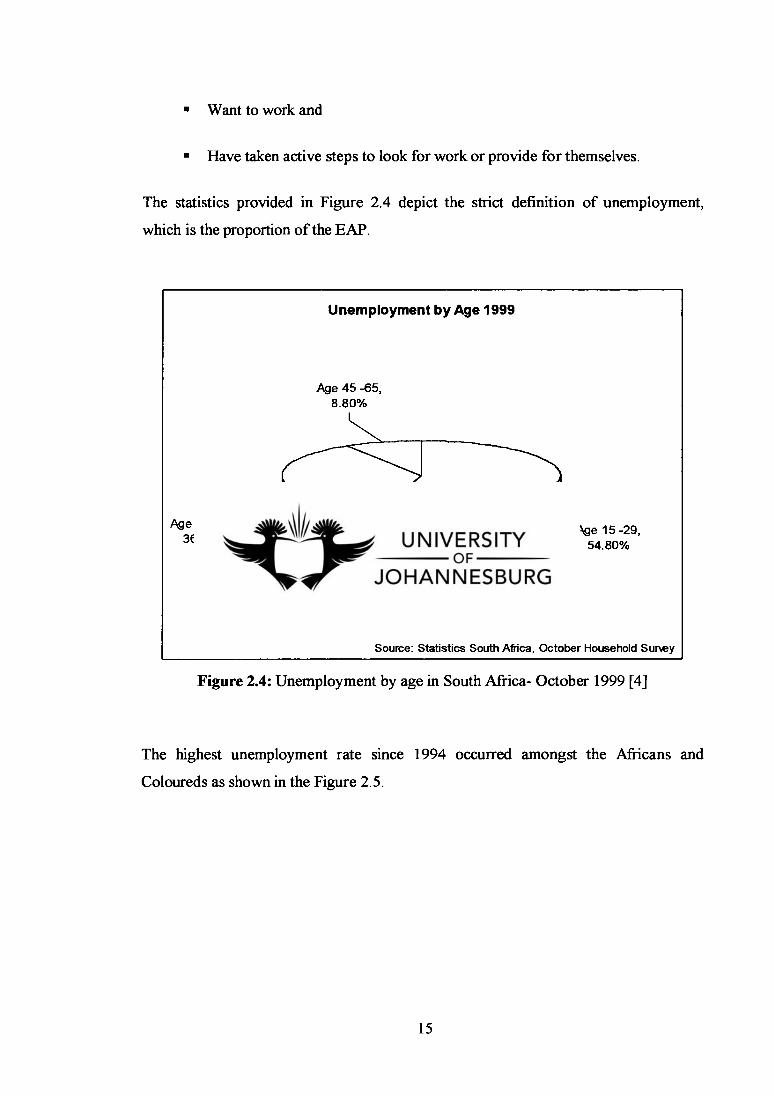
Unemployment by Age 1999
Age 45 -65, 8.80%
Age 30 - 44, 36.50%
Age 15 -29, 54.80%
Source: Statistics South Mica, October Household Survey
Want to work and
Have taken active steps to look for work or provide for themselves.
The statistics provided in Figure 2.4 depict the strict definition of unemployment,
which is the proportion of the EAP.
Figure 2.4: Unemployment by age in South Africa- October 1999 [4]
The highest unemployment rate since 1994 occurred amongst the Africans and
Coloureds as shown in the Figure 2.5.
15

35%
30%
25%
20%
15%
10%
5%
0% 1993
Unemployment Rate by Race 1994 -1999 Strict Definition
-African
—0— Coloured O— lndi an
White
1994 1995 1996 1997 1998 1999 2000
Source: ' s South Africa, October Household Survey 1999
Figure 2.5: Graph of the unemployment rate by race in South Africa- 1994- 1999 [4]
Figure 2.5 reveals the strict definition of unemployment, the unemployment rate
increased by a relatively large percentage in 1998, by 3.7% and 4.9% for Africans and
Indians respectively. The unemployment rate however decreased the following year by
a 2.8 % and 0.6% for Africans and Coloureds respectively. Yet, during the same
period the unemployment rate increased by 0.9 % and 0.3% for Indians and Whites
respectively. [4] This could have been due to the employment equity act enforced by
the government. The obvious fact is that there is still a relative high unemployment
rate amongst the Africans. "The economy's low and single-digit growth rates have
been consistently unable to act as a generator of a sufficient quantum of employment
in the domestic economy." [19]
16

2.4.5 Significant dependence on agriculture production and primary product exports
South Africa can be classed as a Third World nation. In the fact that the Third World
nations are defined as "countries characterised by low levels of living, high rates of
population growth, low levels of per capita income, and general economic growth and
technological dependence on First and Second World economies." [2]
In Third World nation's majority of people live and work in rural areas. "Over 65%
are rural based, compared with less than 27% in economically developed countries.
Similarly, 62% of the labour force is engaged in agriculture, compared with only 7%
in developed nations. Agriculture contributes about 20% of GNP of developing nations
versus only 3% of the GNP of developed nations." [2] "According to the results of the
Census of Agriculture there were 45 818 active commercial farming units in South
Africa in 2002. This is a decrease of 12 162 farming units since the last Census of
Agriculture in 1994." [32] However the gross farming income generated increased by
R14 billion over the same period. [32]
Although exports are important in many developing nations, Third World export
growth has barely kept pace with that of developed nations. [2], [16]. In Table 2.2 the
difference in exports are shown for a few high, medium and low human index ranks as
per the Human development report of 2003. [16] It is important to note the major
difference in the high technology exports for the high human development countries.
17

Human Development Index
Exports of goods and services (as % of GDP) 2001
Primary exports (as % of merchandise exports) 2001
Manufactured exports (as % of merchandise exports) 2001
High-technology exports (as % manufactured exports) 2001
High human development
Netherlands 65 29 70 32
United states 11 14 82 32
Japan 10 3 93 26
Medium human development
Brazil 13 44 54 18
South Africa 28 28 59 5
Low Human development
Zimbabwe 22 72 28 0
Mozambique 22 91 8 /
Table 2.2: A comparison of the structure of trade for certain countries' exports [16]
2.4.6 Dominance, dependence and vulnerability in international
relations
"One of the major factors contributing to the low levels of living is the high unequal
distribution of economic and political power between the rich and poor nations." [2]
The imbalance in the strength is evident in the control and power of international trade
as well as the ability of the rich nation to dictate which technology, foreign aid and
private capital are transferred to developing countries. [2]
18

Mother factor that has contributed to underdevelopment has been the transfer of First
and Second World values, attitudes, institutions and standards of behaviour to Third
World nations. "Of even greater significance may be the influence of rich-country
social and economic standards on developing country salary scales, life-styles and
attitudes towards accumulation of wealth." [2] Finally, the penetration of rich-country
attitudes, values and standards, also contribute to the problem widely recognized and
referred to as 'international brain drain'. This is the migration (loss) of professional
and skilled personnel from developing countries to developed nations. The sectors
generally affected are doctors, nurses, engineers and economists. The above makes
developing nations vulnerable to outside control which affects their overall economy
and well being. [2], [42]
The emigration of EAP in South Africa has followed the trend of developing countries.
[2] According to the report conducted by the University of Cape Town, 233 609 South
Africans emigrated to five major countries (Australia, Canada, New Zealand, the
United Kingdom and the United States) during the period 1989 to 1999. Of these
emigrants over 10% were classified as being professionals or having a high level of
technical skills. [4], [42]
2.5Conclusion
In this Chapter, economic development and growth were defined and some terms used
for measuring economic development were explored. The characteristics of developing
nations were reviewed and the various aspects analysed. The effects of low level of
living were also explored. The issue of education, poverty and economic burden were
also highlighted.
To set the platform of addressing the education and technical skill of a developing
South Africa, it is imperative that an overview of economic theory be presented; this is
tackled in Chapter 3.
19

Chapter 3
OVERVIEW OF SOME ECONOMIC THEORY
3.1Introduction
For the reader to be in a position to understand the impact of education and skill of a
labour workforce for any economy, it is important that the reader has knowledge of
some of the basics of economic theory. This chapter will explore the various terms and
important aspects of economic theory.
3.2Relevant aspects of economics
One of the foci of economics is a basic fact of life i.e. what happens when needs
exceed available resources. This is a situation that affects all consumers and even large
corporations. Everyone has a desire or need for something, no matter what their level
of wealth or education is.
However, there is a range of needs which are essential to all. [3] These are education,
communication, electricity, water, health care services and transport. [3] These needs
have been taken for granted by people who have always had access to use these
essential needs and services. These essential needs are also used daily by people and
without it can be detrimental to an economy. In order for any economy to meet these
essential needs it requires resources.
20

These resources can be classified as: [3]
Natural Resources
Labour
Capital and
Entrepreneurship
As discussed above, when needs exceed resources, the only choice is to consider
certain tradeoffs or compromises. In other words in order to balance needs and
resources one must economize.
Economics can thus be defined as "the study of the way in which human beings
employ scarce resources (with alternative uses) to satisfy their many needs." [3], [9]
3.3National accounts
To understand economic growth more clearly it is important to explain a few terms
used to measure it.
3.3.1 Gross domestic expenditure (GDE)
"GDE is the total spending within an economy." [3] In any economy the spending of
goods and services can be split into three types:
Households; that purchase consumer goods and utilize services to satisfy
their personal needs and desires. These can be further defined as durable
goods – (cars, furniture and household appliances, etc), semi-durable goods
– (clothes, car parts, etc) and non durable goods – (food, petrol, medical
21

suppliers and services such as public transport, health care). [3] South
Africa's household spending in 2000 is shown in Table 3.1.
Final consumption expenditure by household by category, 2000 % Share
Durable goods 7.5 % Semi-durable goods 11.1% Non-durable goods 41.1 %
Services 40.3 % TOTAL 100%
Table 3.1: Share of total spending by the consumer, 2000 [3]
"Investment by companies and the government in goods that are neither
consumed, or exported but are used for capital formation." [3] These
investments can be divided into two kinds: [3]
Gross fixed capital formation. These are made up of expenditure
used on fixed capital assets, such as buildings and equipment.
The value of the change in investments — which is basically the
stocks built for the business sector and government. This is either
resold or used.
22

Table 3.2, outlines South Africa's gross fixed formation by assets in 2000.
Gross Fixed Capital formation by type of asset, 2000
% Share
Residential Buildings 8.4%
Non-residential buildings 10.9%
Construction works 13.6%
Transport Equipment 12.2%
Mkelninery and equipment 52.2%
Other 2.7 %
TOTAL 100%
Table 3.2: Percentage share in gross capital formation of the major type of assets during 2000 [3]
■ Final consumption expenditure by general government (previously known
as GCE — Government Consumption Expenditure). The largest portion of
this expenditure is spent on salaries for civil servants.[3]
3.3.2 Gross domestic product (GDP)
"The GDP is the total value of goods and services produced by factors of production
located in South Africa over a specified period." [3], [41] Exports are purposefully not
included in GD expenditure and are thus added to calculate GD production. [3]
GDP = GDE + Exports — Imports [expenditure method] (3.1)
23

In 2000, South Africa's GDP was R618.6 Billion which was made up as shown in the
calculation below: [3]
GDP = R595.6 + R162.5 — R139.5 = R618.6 Billion .(3.2)
GDP — GDE = Exports — Imports (3.3)
Thus if GDP > GDE =Exports > Imports (3.4)
Also if GDP < GDE Exports < Imports (3.5)
GDP thus measures the total volume of goods and services produced. The change in
GDP across a time frame provides a means to measure growth. [3] Figure 3.1, provides
an indication of the GDP for South Africa from 1960 - 2000. The GDP thus indicates
that there has been growth for South Africa since 1960.
To better understand the statistics provided it is important to define nominal and real
GDP.
Nominal GDP: Measures the value of goods and services produced in a country
expressed in current prices. [41]
Real GDP: Measures the value of goods and services expressed in the prices of some
base year. [41]
24

Real GDP (Rbn) 700
600
500
400 C ce
300
200
100 —
1960 1965 1970 1975 1980 1985 1990 1995 2000
Figure 3.1: Real GDP in five year increments from 1960 — 2000 [3]
Importantly also, is the Gross National Income (previously referred to as Gross
National Product- GNP). [3] GNP measures the total value of the output produced by
citizens irrespective of the location. Implying that if South Africans are working
abroad, they are still contributing to the GNP of South Africa. [3] The GNP takes into
consideration that residents of a particular country can also earn income in the form of
interest and dividends on investments they have abroad. This income is referred to as
primary income from the rest of the world [3] Similarly foreign investments from non-
residents of a particular country can also earn income, which is referred to as primary
income to the rest of the world [3] The GNP can thus be presented by equation 3.6.
GNP = GDP + primary income from the rest of the world — primary income to the rest
of the world (3.6)
Generally it is expected in South Africa's small economy that the non-resident
investments in South Africa are less than what South Africans can invest overseas.
25

This implies that South Africa's primary income to the rest of the world is greater than
the primary income from the rest of the world. [3]
3.4Theories of economic growth
"An economic model is a statement of relationships among economic variables." [1]
The purpose of models is to illustrate the relationship between critical variables.
Variables in a model can be defined and separated into independent and dependent. [1]
"Models of economic growth are used for isolating and emphasizing critical variables
in the growth process." [1]
There are many theories on economic growth developed by many economists, and
most of these models never focused on economic growth until after World War II. [1]
One of the reasons why growth was neglected by the many economists was due to the
effective growth occurrence in Western Europe and North America. [1] "Growth was
rapid and fairly regular and could therefore be ignored." [1] The question of growth
then became an issue after World War II. [1]
3.4.1 The Harrod-Domar model
It is important to highlight one of the models of economic growth, since economic
models can highlight important variables required for the growth progress. [1]
The following explains economic growth in a simple production model. It involves
only one output GNP and two inputs, Capital and Labour. The model is referred to as
the Harrod —Domar model. [1], [2]
"Harrod observed that the full-employed income in period t would not be sufficient in
period (t+1) because of the additional capacity created by investment in period t". [2]
The question however was how much more spending is required at period (t+1). This
could be determined by the relationship between capital and output. [1]
26

Note: Investment in period 't' is determined by the balance of national income (GNP)
and gross domestic saving. Economic growth is a function of the national income and
gross domestic saving. [1], [2]
The following equations will quantify the model theoretically: [1]
Let Y = National Income; K = Capital; I = Investment; S = Saving, changes are
represented by d and period by t.
d Growth rate is defined as G = (3.7)
Yt
"Since total national savings, S, must equal total investment I." [2] Savings can thus be
expressed as follows.
Saving Ratio S = also It = St S = .(3.8) Yt Yt
But dIc.i = It and the capital / output ratio KdY
_ It (3.9)
dY
Equation 3.7 can re-written as:
dY I t lY t _ G _ S Yt It I dY K (3.10)
Equation 3.10 indicates that rate of growth is equal to the savings ratio divided by the
capital / output ratio.
This implies that G is directly proportional to S and inversely proportional to K. In
other words for an increase in growth, savings must increase and / or capital/ output
ratio must decrease.
27

Equation 3.10 can be further reviewed in terms of growth per capita. All that is
required is for the increase in the population (dP) to be subtracted from the rate of
growth. [1]
i.e. G S dp
7 - 1- (3.11)
What the above all simply implies is that savings lead to increase in investments,
which leads to increase in income. With an income increase the possibility of more
savings is increased and thus also investments.
Figure 3.2: Relationship between Capital and output [1]
In Figure 3.2, the curve Y(K) represents the relationship between income and outputs,
which shows that the rate of change in income slows down with additional capital
investment. [1]
28

On the other hand if the relationship was to be represented by the line O-T, there
would be a constant capital/ output ratio at every level of income or capital. [1] Where
the two graphs intersect, 'S' it represents the average capital/output ratio, the marginal
rate is however different which is represented by the slope of the curves. [1]
"Harrod's initial concern was with the time path of the equilibrium level of income."
[1] Savings are a function of income, but investment, he proposed, was determined by
an accelerator. Thus, in an economic boom it would lead to an expansion of income
above the equilibrium path. [1], [2] "In other words to run the economy up against the
ceiling or into depressions, or into contraction, which would halt growth by keeping
realised growth below the warranted potential." [1]
Domar's separate analysis of the same formula (equation 3.10) emphasised the nature
of balance along the equilibrium. He focused on the enlarged capital made available
for growth in't+1' by investment in 't'. [1]
The weakness of this theory:
It relies mainly on capital theory of value [2]
"Labour can be introduced but only at a constant capital / labour ratio" [1],
which can only occur if labour incidentally grows at the same rate as capital or
if labour is redundant at any and all rates of capital expansion. [1] If labour and
capital grow at different rates it would imply that either labour or capital must
be less than fully utilized. [1]
The model also ignores all possibilities of change in technology. [1]
The model also fails on empirical grounds. [1] "Growth as observed in
concrete situations proceeds faster than can be accounted for by the rate of
inputs of capital with a constant capital / output ratio. The theory can be saved
by allowing the capital / output ratio to change, but then it ceases to be a theory
and becomes a mere tautology." [1]
29

3.5 Conclusion
Chapter 3 presented an overview of some economic theories. The various ways in
which an economy is measured were also defined.
It is important to emphasise that in 2000, machinery and equipment made up 52% of
the total gross capital formation.
The chapter was concluded with reviewing one of the models used to measure
economic growth. The major outcome of the model was the importance of consumer
savings as it allows government access to money for investments.
A short overview of South Africa's economic history is required to understand this
chapter's theories and models which is the focus of Chapter 4.
30

Chapter 4
ECONOMIC HISTORY OF SOUTH AFRICA
4.1Introduction
A brief historical overview of the political and economic situation in South Africa is
presented. It will highlight certain aspects of South Africa's political history which
could possibly have impacted the technical skill situation of the country today.
This chapter will describe certain aspects of both the political and economic history of
South Africa, as both played a part in the forming of the South African economy.
4.2 Snap shot of South Africa's history
4.2.1 A political perspective of South Africa's past
The South African economy will be included as part of the review from the time of its
industrial revolution and only certain aspects will be presented.
In the beginning of the 19 th century, a large urban black and semi-urban working class
was being developed. The difference then between the white and black worker was
only the living wage. [6]
In the mid 1920's the white South Africans won the struggle over land and conditions
of labour. [6] During this period the white community were not totally united, a
language barrier existed between the English and Afrikaners. "The Afrikaner leaders
like General Hertzog and, later, Dr Malan attempted to alter the social and economic
balance within the white community in favour of the Afrikaners." [6]
In 1939, South Africa decided to support the British war effort of World War II. [6]
"As they had done in the South African Boer War, and during the World War I, black
31

and coloured South Africans threw their collective weight into the war effort." [6] The
important contribution however was when black workers occupied certain skilled and
semi skilled positions during the war, literally to assist in keeping the South African
economy going during the war, through the expansion of the manufacturing sector. [6],
[10] "In 1946, when the servicemen returned they were faced with problems which
confronted demolished British soldiers —unemployment and a housing shortage. In
Britain they expressed their resentment by voting Labour in the 'khaki election' of
1946." [6] In South Africa the discriminatory attitudes deepened as black workers
were either dismissed or demoted to unskilled positions which they occupied before
the war. [6] This resulted in the first truly organized strike, in 1946, by the black
mineworkers on the Witwatersrand, which frightened mine managers, white workers
and the police. [6], [7]
The government of the time decided to allow white farmers more power in terms of
control of the black labourers. [6] This was not successful as it resulted in the black
labourers disappearing across the country side into an expanding and better industrial
town. [6] This in turn caused the white farmers to be faced with a labour shortage and
one possible solution, which was not selected, was to increase the wages of the farm
labourers. [6] The government however rather decided to implement the Fagan
Commission Report in 1948 to address the issue of labour and urbanisation. [7], [50]
This report proposed that pass laws, a system of internal passports be implemented so
as to restrict the free movement of black people, be relaxed and that permanent black
urbanisation be encourage. [6]
32

4.2.2 The crusade known as 'Apartheid'
Dr. Malan led the main position party known as the `Gesiuwerde Nationale Party'
[Purified National Party], which was later, renamed the Herenigde Nasionale Party
(HNP). [6], [50] This party's slogan during the 1948 election was 'apartheid'. This
`apartheid' was more than just segregation designed to protect the interest of whites
against the black economic competition. It became a system of labour control. [6], [50]
From the early 1950's any black resistance was seen as treason which resulted in
severe prison sentence, which the government used, as their weapon against black
opposition. [6]
In 1960, there was a great deal of anger amongst urban blacks. "In March 1960, the
Sharpville massacre occurred, when panicked policeman fired into a crowd of black
demonstrators demonstrating against the degrading pass laws." [6] This resulted in the
international awareness about the outrage against the black population. Protest
continued and a state of emergency was declared. [6], [50] South Africa then left the
Common Wealth and became the Republic of South Africa sheltered behind exchange
controls. [6]
Top black leaders were arrested in 1963 at the `Rivonia trial'. ANC leaders including
Nelson Mandela were sentenced to life imprisonment. [5] "The African Resistance
Movement was infiltrated and broken up." [50] "Both the Pan African Congress
(PAC) and the ANC survived early exile, ready to take a more active role in the later
1970's and 1980's, but during the 1960's and 1970's their influence within South
Africa was much reduced." [50]
"In the late 1980's, technological changes were making skilled labour redundant. Most
blacks and increasing number of whites were unemployed and unemployable. New
capital investment was lacking. Prices were rising and real wages, for those that were
earning them, were falling sharply." [50]
33

In February 1990, the State President FW. De Klerk announced in his opening
address to parliament that liberation movements (ANC, PAC and the South African
Communists Party) will be unbanned and that political prisoners will be released. [50]
Notable factors that led to this decision were; the pressures from international;
financial, trade, sport and cultural sanctions. [5]
"Apartheid was being exposed and seen by a large portion of the white population as
morally unethical, indefensible and impervious to reforms." [6] White South Africa
changed, ethnic grievances and racism started to diminish. Private meetings were held
between Afrikaners, government ministers and exiled ANC leaders, especially Nelson
Mandela. [5] The discussions by these leaders were aimed at strategising a new
dispensation for South Africa, where blacks would play a major part. [5] It took time
and remarkable leadership to initiate a historic change in South Africa, where petty
`apartheid' laws and symbols were challenged and removed. [5] "By March of 1992
tangible benefits had been obtained for the government as a result of the change. Some
economic sanctions were lifted, sport boycotts were removed with South Africa's
participation in the Barcelona Olympic Games and international political acceptance
was achieved for the first time since the mid 1970's." [50] Irrespective of what the
political outcome has been, a large economic and social inequality rooted in over two
centuries can not be easily overcome. [50]
The snap shot of South Africa's history was intended to set a platform so as to review
South Africa's economic history in the following section.
34

4.3South Africa's economic growth
This section will address aspects of the characteristics and economic history of South
Africa.
Economic Growth, 1947 -2000
8.0%
7.0%
6.0%
5.0%
4.0%—
3.0%
2.0%
1 .0% -
0.0%
-1 .0%
-2.0%
—
—
—
—
_
tO CD CD CO CO CD CD CD CD CD CD 1,3 CJI CT CY1 CT CD 0) 0) ■I ■I -3.1 OD ■I C7 CA) 0) CO n) ri, co —. 42. --4 0
OD
_
OD W tD
1..7 NJ CD C) C7
fD CD C7 C3 Co —• D.
-3.0% Source: South Aiken Reserve Bank
Figure 4.1: Economic Growth 1947 -2004 [4], [13]
From Figure 4.1 it should be evident that growth was not favourable from the 1970's
and negative growth was evident in the 80's and 90's.
In order to better appreciate these figures, it is important to discuss South Africa's
economic history. Before the 2nd World War the growth was mainly dependant on
agriculture and mining. [3] During and after the war the manufacturing sectors started
to expand due to foreign sources being stopped. [3] The South African economy
however used this to its advantage in 1945, and the economy was relatively strong. [3]
Foreign capital from Britain was invested in South Africa and immigration rose and
the countries economy boomed. [3], [10] The country was in a position to produce
goods and services to sustain the international buying frenzy. [3] As a result the
35

exports increased resulting in an expansion of local industry, which in turn allowed for
a sustainable economic growth until the early 1960's. [3] "Manufacturing was
expanding in various directions, particularly in metals, engineering, textiles and
chemicals." [10]
The South African economy was then faced with major set backs caused by political
decisions and factors, as represented in the previous section. The political stance of the
government resulted in international and local investors losing confidence in South
Africa's future and large amounts of capital left South Africa. [3] "The South African
authorities implemented strict fiscal and monetary policies (to slow down domestics
spending) and introduced the blocked rand and later the financial rand to curb the
outflow of capital." [3] This resulted in a short decline in the economy which
recovered and picked up in 1962 and grew by approximately 6% per year. [3], [7]
In the 1970's and 1980's the South African economy experienced negative growth. "In
1975 agricultural exports were valued at R598 million while South Africa imported
agricultural products to the value of R142 million, leaving a positive contribution of
R456 million to the balance of payments." [10] Similarly, mining exports in 1975
valued at R3 343 million while the corresponding imports valued at R1 131 million.
[10] However the major deficit of R3 913 million was attributed to the manufactured
exports which valued at R1 771 million and the imports R5 685 million. [10] This
deficit could not be carried by both the positive contributions from both the
agricultural and mining exports. [10]
In the 1980's one of the reasons for the negative growth was attributed to the lack of
the country's ability to produce sophisticated machinery and equipment. [3] This was
not due to a lack of skills or expertise; and could have meant that it was not
economically feasible within South Africa. [3] "Possibly, the initial spatial investment
was too high to manufacture the equipment." [3] The compounding effect was it
became more feasible for South Africa to buy goods from foreign sources. For South
Africa this was not favourable since in order to import capital goods a foreign
exchange is required and this is earned by exporting goods. [3] Agricultural and
mining products were South Africa's best export commodity during this 1980's. [3]
36

Thus South Africa's ability to produce goods was largely dependant on the rest of the
world's desire to purchase, South Africa's agricultural and mining products, which
unfortunately is not reliable to sustain growth due to the fact that this desire does tend
to vary. [3]
In today's modern high tech-tech environment, the need for mining and agriculture
products are not as in high demand, as are microchips, biotechnology, nano-
technology, fiber-optic and ceramics etc. [31] There were also other factors in the
1980's which included a shortage of skilled labour, political unrest, drought and a lack
of foreign investment that affected the economic growth.[ 3], [31]
4.3.1 South Africa's basic production factors
The South African economy relies on four basic production factors that assist in
meeting the demand for goods and services. These factors are: Land; Labour; Capital
and Entrepreneurship, which are briefly discussed below. [3], [10]
4.3.1.1 Land and natural resources
South Africa's total land area is approximately 1.2 million km 2. [5] Agriculture,
forestry and fishing are important role players in the economy, although their total
contribution to the total GDP has decreased. [3] Their contribution in 1950 was 8.1 %
compared to 4.3% in 2000. South Africa's leading crop is maize and most of South
Africa's fish is exported. [3]
An important sector to highlight, is South Africa's mineral resource, which is rated
amongst the top three producers of a wide range of minerals (Gold, Platinum,
Chromium, Vanadium and Diamonds) which contributes to almost half of the
country's export earnings. [3], [6]
37

The contribution of the agricultural and mining sectors to GDP is declining, 10% -
2000, 30% -1960 and 28% in 1950, reveals a downward trend. [3] Although
agriculture and mining play an important role in the economy, the future economic
growth will not necessarily be sparked by expansion of these sectors. [3]
In the first quarter of 2004, the GDP improved, which is mainly due to the economic
activity in the primary (i.e. minerals, commodities and agricultural produce) and
secondary sectors (i.e. manufacturing, electricity, gas and water construction) of the
economy. [3], [6]] The tertiary sector which included trade, catering, accommodation,
transport, communication, finance, insurance, real estate and other community, social
and personal services including government remained strong; the end result was that
the primary sector growth increased to 3% in the first quarter of 2004. [6], [13] The
previous years have shown a fluctuation, in growth in terms of GDP; 2000 -3.5%,
2001 — 2.2%, 2002- 5.2%, 2003- 0.5%, 2004 -3.9%. [46]
4.3.1.2 Labour and entrepreneurship
South Africa's population is constantly increasing and is also affected by the influx of
illegal migrants crossing the borders into South Africa. The urban population figures
have also increased, which is partly due to the declining importance of agriculture. [3]
Any economy faced with an increasing population, requires an increase in its basic
resources. [1] The economy is placed under pressure if the production of goods and
services do not increase proportionally. [3]
The amount of work people can do is a function of three main aspects:
Increasing the skills of the workers [53]
Optimizing the time lost during shift changes [53]
The development of machines which assist the workers [53]
These aspects were highlighted over 300 years ago, and are still relevant today. Yet
these issues still affect society today. Implying, that skill development and technology
38

will always form part of an economy, and for the economy to develop these aspects
should form part of the focuses of any government.
The main area of concern is whether South Africa has a technically skilled labour force
to produce these goods and services, which is the main focus of the chapters that
follow.
Entrepreneurship has been neglected by many economists as various theories and
models do not take entrepreneurship into account. [23] The entrepreneur can be
described as an individual who has the knack to investigate an environment, identify
opportunities, utilize resources and implement plans and initiate actions to maximize
the opportunity. [23] It is the entrepreneur who can mobilizes the other factors of
production, be it labour, natural resources, technology and capital. [23]
4.3.1.3 Capital
As mentioned in Chapter 2, the capital supply increases when investment in goods
such as machinery, equipment and factories are made. Simply stated, more capital
goods lead to an increase in production and as a result can lead to economic growth.
[3]
The trend in GDP growth is not positive, in the 1960's the gross fixed capital
formation was on average 7.6 % per year while the GDP growth was below 6% per
year. During 1970's the GDP growth was on average 3% per year. The gross fixed
capital dropped between the periods of 1980 — 1993 by 2.3 % per year, the associated
growth was only 1% per year. [3], [4]
One of South Africa's major causes for negative growth in period 1985 — 1993 was the
lack of international investment and this was probably due to the international
community not agreeing with the South Africa's political stance and imposed
sanctions. [3], [10] This resulted in the country experiencing an outflow of capital.
39

This resulted in a low growth rate, increasing unemployment, the collapse of rand
exchange rate and high inflation. [3], [6]
The leaders of the South Africa changed the political situation as described previously.
This resulted in capital inflow in the mid 1994, the real domestic product also
increased by 2.7% in 1994 and 3.3 % in 1995. [3], [51] "A net capital inflow
amounting to R31 billion was recorded between mid-1994 and the end of 1995." [51]
This new change projected a better economic future as the real gross domestic product
increased by 1.3% in 1993, 2.7 % in 1994 and 3.3% in 1995. [51] However economists
predict that South Africa needs a growth of about 5% to achieve a meaning full
improvement. [3], [10]
4.4 Economic growth a South African perspective
Growth can be divided into two forms: 1-Short term and 2- Long Term, and it can be
measured by using national income statistics and GDP when considering growth. [7]
4.4.1 Short term growth
"Increase in total output of the economy from one year to another is sometimes
evidence of growth." [7]
The sources of short term growth can be achieved by making better use of existing
resources which are not being utilized to their full capacity. Employment can be re-
organised and utilized so as to increase productivity. [3]
40

4.4.2 Long term growth
Long term growth is preferred since GDP increases may occur over a period of two or
three years. [3]
The source for long term growth is not easy; it requires an increase in the capacity of
the economy to produce goods and services. [3] "New factories, machinery, equipment
and materials increase the physical 'capital stock' of a nation and make it possible for
expanded output levels to be achieved." [2]
Long term growth also refers to two variables: [3]
o Increase in the quantity of the factors of production available
o Improvement in their quality or both
Long Term growth will thus require change and improvement in the following: [1],
[2], [3], [43]
Labour —Increasing the quantity and quality of skilled labour. "A large labour force
means more productive manpower." [2] "Without significant improvements in labour
absorption coefficients, it is doubtful whether annual job creation much in excess of
100 000 would be possible." [43]
Capital — The existing form of capital must be increased and the amount of capital per
worker must also increase
Technology- Implementation of new and different techniques and processes
Natural Resources — The discovery of minerals deposits are important examples of
South Africa's history, its existence will remain a source of growth.
Other — Other factors exist and are sometimes overlooked, but they can be a major
role player in growth. Sociological and political stability are important factors that
affect growth.
41

4.5 Conclusion
This chapter briefly reviewed South Africa's political and economic history and this
highlighted certain sectors of the economy that can be improved. The major area
requiring drastic uplifting is the labour in South Africa as it is a source of growth.
The political strategy of the previous government was to ensure that the black
community was uneducated and this is still placing a major burden on the current
economy as the majority of the South African population is black, unskilled and
unemployed. [4], [17], [20] Thus, to increase the economic growth South Africa will
need to increase the labour force especially within the black population, capital must
also be increased and a focus on new technology. The result should have an impact on
the economy which is the focus of the following chapters.
Now that a platform has been set about economics and South Africa's economic
history, Chapter 5 will focus on employment so as eventually to be able to address the
potential of technical skills development.
42

Chapter 5
THIRD WORLD PERSPECTIVE OF LABOUR
5.1Introduction
Many developing countries are faced with a large rural-urban population movement,
associated with this is the decrease in agricultural productivity. [2] The result is
typically an increase in urban and rural unemployment, which is a general symptom of
inadequate economic development. [2] This re-iterates that employment and
development work hand-in-hand.
The level of unemployment is highest amongst the youth of South Africa. [45] Owing
to the fact that the highest unemployment rate occurs amongst the youth, the various
provincial governments have formed a local youth commission to advise local
government on various issues affecting the youth as well as to support the South
African national youth commission. [34] "The National Youth Commission was
established on 16 June 1996 as part of the democratic government's plan to develop a
comprehensive strategy to address the challenge facing young women and men in
South Africa." [34]
This chapter describes the various types of employment and provides some statistics
about South Africa's labour situation.
5.2Trends in Third World countries
Before the trends in Third World countries are discussed it is important to define what
First, Second and Third World actually refer to.
43

First World: Refers to the advanced capitalist countries that have experienced long
term economic growth, such as Western Europe, North America, Australia, New
Zealand and Japan. [2]
Second World: Refers to economically advanced socialist countries, such as the
Soviet Union, Poland, Czechoslovakia and Yugoslavia. [2]
Third World: Refers to developing countries, mainly characterised by low levels of
living, high rates of population growth, low levels of per capita income and general
economic and technology dependence on First and Second World Economies. These
are typically countries of Asia, Africa, the Middle East and Latin America. [2]
Third World countries employment problems can be attributed to three main issues:
[2]
Unemployment (people amongst the EAP who are not working [4]) and
underemployment (people working less than they would like to work [2])
affect much larger proportions of the Less Developed Countries (LDC) labour
force.
The employment problems cannot always be solved with employment models
of developed countries. [2]
Unemployment in Third World countries have an associated human
circumstances i.e. poverty and low levels of living standard.
5.3South Africa's labour force
South Africa's population is estimated at 44 819 778 people according to census 2001
and it is estimated to be 47 195 000 in March 2004. [4], [17] In 2000, South Africa's
average annual population growth rate was between 1.52% and 2%, due to HIV /Aids
the growth rate has declined from 2% in 1999 to 1.9% in 2000 and is projected to drop
to 0% in 2011. [4] Table 5.1 also projects a downward trend in population growth rates
as predicted by the Institute of Future Research. The Institute of Future Research also
44

estimates that the fertility rate was 3.2% between 1996 and 2001. [4] According to the
March 2004 labour survey; Africans make up 79.69% of the total population, Whites
8.95%, Coloureds 8.89% and Indians 2.44% and 52.32 % of the population are
women. [17] Table 5.2 reveals that the estimated crude birth rate will decrease by
56.6% over the period of 1996 -2031. [4]
35% of the population in 1998 was under 15 years of age while 5% was over 65. Of
this 37% were African and 22% White. [4]
Projected population growth rate by race 1996 -2001 to 2026 -2031 (low projections)
Race 1996 - 2001 2011- 2016 2026 -2031
African 2.3% 0.9% 0.2%
Coloured 1.1 % 0.5% (0.1%)
Indian/Asian 1.3% 0.7% 0.2%
White 0.4% 0.1% (0.3%)
South African 2.0% 0.8% 0.1% Source: Institute of Future Research
Table 5.1: South Africa's projected population growth rates [4]
Race 1996-2001 2011-2016 2026-2031 Increase
(decrease) 1996 -2031
African 32.2 21.4 13.1 (59.3%)
Coloured 20.2 16.1 11.2 (44.3%)
Indian/ Asian 18.5 13.3 10.4 (43.8)
White 13.3 10.4 9.0 (32.3%)
South Africa 28.8 19.8 12.5 (56.6%) Source: Institute of Future Research The crude birth rate is defined as the annual number of births per 1000 of the population
Table 5.2: South Africa's estimated crude birth rate by race [4]
45

Race 1996-2001 2011-2016 2026-2031 Increase (decrease)
African 12.6 14.9 13.3 5.6%
Coloured 9.0 10.8 11.9 32.2%
Indian/ Asian 5.6 6.7 8.8 57.1%
White 9.0 9.9 12.1 34.4 %
South Africa 11.7 13.9 13.0 11.1 % Source: Institute of Future Research
Table 5.3: South Africa's estimated crude death rate by race [4]
Race 1996-2001 2011-2016 2026-2031 Increase (decrease)
African 3.53 2.35 1.50 (57.5%)
Coloured 2.21 1.79 1.50 (32.1%)
Indian/ Asian 2.05 1.72 1.50 (26.8%)
White 1.68 1.50 1.50 (10.7%)
South Africa 3.20 2.25 1.50 (52.8%) Source: Institute of Future Research
Table 5.4: South Africa's estimated fertility rates by race [4]
The Tables 5.1 - 5.4 outline, that the age structure of the population is affected by birth
and mortality rates. "A high birth rate and death rate economy will have a greater
percentage of the total population in the dependant age group, than will a low birth rate
and death rate economy." [2] Over the period of 1996 -2031 the estimated crude death
would increase by 11.1% as shown in Table 5.3, while there is an associated 52.8%
decrease in fertility during the same period as shown in Table 5.4. [4]
It is important here to re-emphasise what was discussed in chapter 2, regarding EAP.
The South African EAP makes up a large portion of the population, and 37.56% of
this, is the youth of South Africa (15-24 years old - 20.06% and 25-34 years old
17.56%) as is evident in Table 5.5. [17] Thus for the future economic growth of South
Africa, it is imperative that the country ensure that the youth of South Africa is not
neglected or ignored as South Africa's future is in the youth.
46

Age African Coloured Indian White Total 0-114 13346112 1270342 293627 890074 15800155 L2.76% 15-24 8043350 763954 216896 652393 9676593 20.06%
39.56% 25-34 6911475 772906 188095 564834 8437310 17.50% 35-49 6015930 823884 232581 1083974 8156369 16.91% 50 -64 2934383 375860 149243 853949 4313435 8.94% GS+ 1189886 143812 57544 451623 1842865 33.02% Total 38441136 4150758 1137986 4496847 48226727 100.00%
Table 5.5: Estimated proportional age profile by race —March 2004 [17]
Figure 5.1, indicates that the majority of South African's work force (approximately
2.7 million people) are employed in elementary occupations, excluding domestic work.
Craft and trade workers make up about 1.5 million people and 1.4 million people are
service and sales workers. [17] The skilled agriculture and fish workers makes up the
smallest amount of people only 0.3 million and professional are not far behind with
only 0.5 million people. [17] The technical and associated professional account for
approximately 1.86 million people. [17]
0000)
3000 -
2500 — -
2000 — -
1500 — -
1000 --
500 — -
0
1 e t,.e 0 ,t. .
•
‘" 4.
ek 43 e 4," ol ,
GPI' +.64 ‘P , • (;4' \e" e,`& ,k cp
ci0)
," <„:-- ,.., fie
It 4 Cl. P 4- .. * ,o 9, dke
, , • ‹i''' .
2S' ,e5t 4\
Figure 5.1: Workers by main occupation in South Africa: March 2004 [17]
47

5.3.1 The unemployment situation in South Africa
The highest rate of unemployment in South Africa, as per the March 2004 labour
survey, occurs among the Africans while Whites have the lowest unemployment rate.
[17] Unemployment amongst women are also high as they exceed the unemployment
of men in South Africa, this is alarming as women makes up almost 52% of the total
EAP in South Africa. [4], [17] Women have an associated 32% unemployment rate
whereas men have a 24 % unemployment rate. [17] Collectively the South African
unemployment rate is approximately 27%.[17] The highest EAP occurs amongst
people with an education level of Gradel0 -12, and associated with this is a 26%
unemployment rate as shown in Table 5.6. [4], [17]
What the above thus implies is that the South African EAP with an education level of
Grade 12 is not sufficient for the work force as the there is an associated 32.2%
unemployment rate for this group of individuals. It thus reveals that the labour sector
of South Africa requires a skilled worked force, and evidently from Figure 5.1, a
technically skilled labour force is required.
48

Race Total Not
Economically active
Economically Active
Total Workers Unemployed
N (1000) N (1000) %
Highest level of education
30429 113833 16596 11984 451111 27.8
% of EAP 1M% 45.45% 54.54% 39.38% 15.15% /
None 2034 1193 841 719 122 14.5
Grade 0-3 1172 571 601 478 123 20.5
Grade 4 937 453 484 378 106 21.9
Grade 5 1128 571 557 434 123 22.1
Grade 6 1530 820 711 518 193 27.2
Grade 7 2392 1267 1125 825 300 26.7
Grade 8 2873 1570 1302 907 395 30.3
Grade 9 2860 1778 1082 679 403 37.2
Grade 10 3459 1867 1592 1049 543 34.1
Grade 11 2757 1401 1356 759 597 44
Gmde 112
% off ttote ZAP
6439 11936 6MS 3055 11650) 32.2
21.16% 6.35% 16.0% 10.04% 4.7% /
NTC I -II 199 52 147 118 29 19.5
Dipl./cert with Grade 11
241 31 210 174 36 17.2
Dipl./cert with Grade 12
1327 165 1162 1028 133 11.5
Degree and higher
965 114 852 804 48 5.6
Other 23 17 * * * 33.2
Unspecified 94 31 63 54 * 14.2 * For values of 10 000 or lower the sample size is too small for reliable estimates
Table 5.6: Estimated population of working age (15-65 years) Official definition of
unemployment, South Africa March 2004 [4]
49

It should be evident from Table 5.6 that one of the highest percentages of
unemployment occurs amongst learners with a Grade 11 and 12 level of education.
This most probably is attributed to the quality of the learners completing Grade 12 as
well as the small number of learners that pass Grade 12 with an exemption and those
who do pass with mathematics and science on the higher grade. [20], [40], [47]
It can thus be concluded that the current workplaces in South Africa require people
with some type of skill level other than just a grade 11 or 12 education level. This
could possibly explain the drive by the South African government to implement the
Skills Development Act. The main focus most probably is to provide the potential
EAP with a skill so that it can be utilised in the workplace.
The disturbing reflection of Table 5.6 is that there are an increasing and large number
of people who become an economic burden to the country. Alarmingly this number
continually increases every year and affects the economic growth as well as
unemployment rate.
5.4Economic models of employment determination
The problem of unemployment has affected many countries which have led to the
development of employment models so that economists could better assess the effect
on the economy. [1], [2]
5.4.1 Background
Two major theoretical responses were developed as a result of the inadequacy about
traditional wage theory and employment determination. These are: [2]
• Those that occur at micro level, which is the theory of" imperfect competition"
which was developed to explain the nature of implications of markets
dominated by one (monopoly) or a few (oligopoly) sellers of products or by
50

one or more purchaser of resources (monopsony and oligosony). [2] What
these demonstrated is that resources (labour) would be less than that of perfect
competition. It is due to these types of "market failures" that often provide the
theoretical and economic rationale for increased government intervention in the
economic system with the aim to offset the negative output and employment
effects. [2]
• "The more influential theory that emerged in response to the harsh economic
realities of the Great Depression was macro oriented." [2] This is the
Keynesian general theory of income and employed determination. [1] This
theory explains the determination of national output and employment in terms
of "aggregate demand" in relation to an economy's 'potential output'. [1] This
theory is discussed further in the following section.
5.4.2 Keynesian Theory of employment
What is interesting to note, is that generally a firm's demand for labour follows a trend,
which shows that when wages are low the number employed are high. Due to this
trend the rationale was to reduce wages to cure the unemployment problem. [2]
However, Keynes identified the pitfall in this thinking, in that the demand for labour is
a derived demand and that people have a dual role in the economy. [1], [2] People are
both workers and consumers. It simple means that if anyone wants to buy the products
of an industry, then the industry must rid itself of some of its factors of production,
thus leading to a rise in unemployment. [2] When the large portion of the labour
market accepts a wage reduction it results in a reduction in the level of demand for
products which then results in an increase in unemployment. [2], [7]
It is important to take cognisance of this dual role of people as factors of production.
[2] The people responsible for ensuring that the goods and services are produced for
society are the same people making up society that must utilize their disposable
income on these same services and products. [2] What this means is that as soon as
51

society decides to save instead of spend, it results in products being produced but not
sold. This leads to goods build up in warehouses and the level of production outputs
reduce with a consequent reduction in the high need for labour. [1], [2] The end result
is unemployment (retrenchments). The same rationale behind the factors of production
for a single industry (factor) is also valid for an economy. [7] Keynes further argued
that the level of employment in an economy depends on the total level demand, which
is called aggregate monetary demand. [1] This is further divided into four components;
(1) consumption, (2) investment, (3) exports and (4) government demand for goods
and services, which was discussed in Chapter 2.
5.4.3 Types of unemployment experienced in South Africa
South Africa experienced various types of unemployment as a result of its history.
These will be alluded to in the following subsections. [7]
5.4.3.1 General unemployment
This type of unemployment is as a result of a rising or deficient demand for services
and or products. [7] During the early 1970's South Africa experienced an overall
reduction in labour demand mainly due to, the worldwide increase in the petroleum
prices and the trade sanctions imposed on this country which affected export demand.
[7]
5.4.3.2 Structural unemployment
"In economics the word structural is used to describe an underlying, significant and
permanent change in the way things are done or related to one another. So structural
unemployment occurs when there is a significant gap between, on the one hand, the
education, skills, expertise etc. required for a job and, on the other hand, the
availability of appropriately qualified workers to fill those posts." [3]
52

This type of unemployment is due to the permanent decline in the demand of an
industry's product. [7] South Africa's prime example of structural unemployment
occurred as result of the collapse of the fashion demand for ostrich feathers before the
First World War in 1914. [7] A fall in the demand of gold and diamonds during the
late 1980's resulted in extensive retrenchments in the mining industry. [7]
5.4.3.3 Technological unemployment
Technological unemployment occurs as a technology develops. Technology changes
the methods and tooling of production. [7] "Technological unemployment is simply a
shortage of demand due to technology, such as robots replacing car assemblers." [18]
When a market demands high output and low cost the end result is often that people
are replaced by machinery. This type of unemployment is constantly increasing as
services are following suit. Banks, retailers, car-parks (pay-points) are increasingly
relying on technology rather than people. The end result is unemployment. [7]
5.4.3.4 Frictional unemployment
This type of unemployment is generally due to people frequently changing jobs. [7] It
is a natural process in an economy, which has also been attributed to the Employment
Equity act that the current South African government has implemented. [5] An
alternative view is also that people are unemployed in one region while there are
suitable vacancies available in other regions. [7] Other regions have developed a
perception that Gauteng is the best region to find employment, which has resulted in a
high migration rate to this province. [4]
5.4.3.5 Seasonal unemployment
Seasonal unemployment occurs particularly in agriculture, construction and in the
leisure industry. The demand of each of these sectors for labour is governed by
seasonal conditions. This type of employment is beyond any government or industry
control. [7]
53

5.5 Conclusion
This chapter highlighted one of the major characteristics of third world developing
nations, unemployment and employment. It also revealed that the largest rate of
unemployment occurs in the youth of South Africa, especially the youth that have a
Grade 11 or 12 level of education. [4]
This chapter also provided the statistic, according the March 2004 labour survey, that
South Africa only has 30 429 million people that could potentially be economically
active, yet only 11 984 million people are actually working and thus contributing to the
economy. [17] The data also revealed that 52.2% of the South African population are
women and associated with this is a 32% unemployment rate. [17]
In this chapter the Keynesian employment theory was discussed. This theory revealed
that the consumer plays a dual role in the economy in that unemployment can not be
resolved by reducing wages or the workers. [2] This chapter concluded by reviewing
various types of unemployment.
This chapter highlighted the high unemployment rate amongst the youth of South
Africa, especially those with a Grade 12 qualification. It is thus important to review the
importance of education which is reviewed in Chapter 6.
54

Chapter 6
SCIENCE AND TECHNOLOGY ONE OF THE PORTALS TO ASSIST ECONOMIC GROWTH
6.1Introduction
One type of investment that results in an increase in the tangible asset of a community
is the investment in people. [20] "Human capital may be regarded as the accumulated
skills of the work-force." [23] This can be viewed similar to the way a company
invests in machinery, which it hopes in the long run to make a profit from the
production of that machine. The investment made in education and obtaining a degree
or some type of tertiary education is likely going to result in an income potential in the
future working career as a result a contribution to the economy. [23] Moreover the
economy is sure to benefit from investing in education. [20]
"It is the human resource of a nation, not its capital or its material resource, that
ultimately determine the character and pace of its economic and social development."
[23]
For example according to the late Professor Frederick Harbison: [23]
"Human resource constitute the ultimate basis for wealth of nations. Capital
and natural resources are passive factors of production; human beings are the
active agents who accumulate capital, exploit natural resources, build social,
economic and political organisations, and carry forward national development
Clearly, a country which is unable to develop skills and knowledge of its people and
utilize them effectively in the national economy will be unable to develop anything
else. " [23]
55

6.2South Africa's educational situation: a brief overview
South Africa has a relatively high budget expenditure for education, compared to the
rest of the world. In 1994 the government has allocated, R31.8 billion to education and
R69 billion in 2003 for education. Of the R69.063 billion allocated to education;
R8.380 billion was allocated for universities and technikons and R53.102 billion was
allocated for college and school education. [5]
"In mid 2003, the South African public education system accommodated 11.7 million
school learners, 448 868 university students, 216 499 technikon students and over
356 000 Further Education and Training (FET) college students. There were 27 458
primary, secondary, combined and intermediate schools with 354 201 educators." [5]
Currently, the universities, technikons and technical colleges are undergoing
rationalization, which will reduce the overall number of institutions through mergers.
[5]
Table 6.1, provides an indication of South Africa's education level according to the
October household survey in 1999. [4] This table is similar to Figure 2.2, with the
exception that it outlines the education level of people by race classification.
Level of Education
N (1000)
African Coloured Indian White Total % of
Total None 2 601 161 22 6 2792 11.79 %
Primary 5 271 641 86 55 6 053 25.58 %
Secondary 8 463 1 158 467 2 012 12 100 51.13 %
NTC 1 -3 56 12 6 76 150 0.63 %
Diploma/certificate with grade 11 or lower
121 24 5 85 235 0.99 %
Diploma/certificate with grade 12
536 77 45 372 1 030 4.35 %
Degree/higher 270 36 47 528 881 3.72 %
Other/ unspecified 288 60 19 61 428 1.81 %
Total 17 606 2 169 696 3 195 23 667 /
Table 6.1: Education levels of people 20 years and older by race, 1999 [4]
56

Gr 8 9.1%
Gr 7 7.9%
Gr 11 6.0%
Gr 10 7.2%
ELSEN 0.2%
Gr 12 4.2%
Pre-Primary 2.4%
Gr 1 9.8%
Gr 2 8.1%
Gr 9 7.8% Gr 3
9.3%
Gr 4 10.0%
Table 6.1, reveals that, in 1994, a large portion of South Africa's education occurred
amongst the Secondary education level (51.13 %) and majority amongst the Africans.
The concerning data represented is that there is only 3.72 % of people with a degree or
higher education level.
Figure 6.1: Percentage distribution of learners by grade, ELSEN and pre-primary in ordinary schools in 2001 [47]
What is evident from Figure 6.1 is that fewer than 10% of learners enrolled in Grade 1
and just over 4% in Grade 12, which may indicate the high drop out rates between
these grades. [47] This is therefore not favourable for the South African economy, as
where are these potential economical active people been absorbed into the economy?
The likelihood could be that these learners who dropped out are becoming an
economic burden since there is such a high unemployment rate of people with a Grade
10- 12 education as indicated in chapter 5.
57

6.2.1 The literacy level of the population of South Africa
South Africa has a major challenge in trying to uplift the literacy level of its potential
EAP. In 1999, according to the household survey over 3 million people older than 20
years could not read or write. [4] This makes up almost 13% of the entire population.
[4] The highest of these occurs within the African and Coloured population as shown
in Table 6.2.
Able to read African Coloured Indian White Total Yes 14756000 1972000 659000 3167000 20554000
84.02% 91.30% 95.09% 99.50% 87.10%
No 2807000 188000 34000 16000 3045000
15.98% 8.70% 4.91% 0.50% 12.90%
Total 17563000 2160000 693000 3183000 23599000
Able to Write African Coloured Indian White Total Yes 14640000 1960000 655000 3158000 20413000
83.34% 90.70% 93.97% 99.18% 86.46%
No 2927000 201000 42000 26000 3196000
16.66% 9.30% 6.03% 0.82% 13.54%
Total 17567000 2161000 697000 3184000 23609000
Table 6.2: Population breakdown of people aged 20 years and older able to read and
or write in one language, 1999 [4]
58

6.2.2 The education outputs of South Africa
South Africa's history has also played a part in the distortion of qualifications and
education levels in South Africa, and is high on the Government's list of priorities, in
terms of increasing the pass rate level at school with special focus on mathematics,
science and technology. [21]
There are more than 500 000 candidates who are writing the 2004 matriculation
examination, of these only 40 000 are expected to pass with mathematics and physical
science on the higher grade. These figures are not indicative of growing educated
economy. [40] The result is that fewer students maybe enrolling for Science,
Engineering and Technology university degrees and the investment needed in
education is not meet. [47] Statistics from 2001 outline more clearly what has been
said above. Table 6.3 reveals, that nationally only a 46% and 68% pass rate was
achieved for mathematics and physical science respectively. [47]
Of all the learners that wrote the 2001 senior certificate 449 371, the number of
learners that wrote the mathematics examination was 263 945 (58.74%) and only 123
149 (27.4%) passed. [47] The mathematics higher grade percentage pass rate seems
impressive (72.8%); however it is the small number of learners that actually wrote,
only 34870, which is of concern. [47] These learners accounted for only 13.2% of the
total number of learners that wrote mathematics in 2001. This thus implies that of all
learners that wrote Mathematics only 20.6% passed on the higher grade. Of all the
learners that wrote the 2001 senior certificate 449 371, the number of learners that
wrote the mathematics examination was 263 945 (58.74%) and only 123 149 (27.4%)
passed as depicted in Table 6.3 [47] As a result the potential human capacity for
Science and Technology in South Africa is of concern as the proportion of SET
students remains low. [35]
59

Subject (2001)
No of candidates HG SG LG
Total passed
% passed
% of Total
'passed Mathematics
HG 34870 19504 5880 0 25384 72.80% 20.6%
Mathematics SG 229075 0 72301 25464 97765 42.68%
79.3%
Mathematics Total 263945 19504 78181 25464 123149 46.66%
100%
Physical Science HG 48996 24280 11174 0 35454 72.36%
33.6%
Physical Science SG 104851 0 45314 25784 70098 66.85%
66.4%
Physical Science Total 153847 24280 56488 25784 105552 68.61%
100%
Table 6.3: South African national senior certificate mathematics and physical science
in 2001 [47], [35]
Institution Headcount Student Enrolments Black students % of headcount
Contact Distance Total Contact Distance Universities 234 574 214 294 448 868 61% 76% Technikons 144 514 71 985 216 499 84% 84% Total 379 088 286 279 665 367 70% 78%
Institution Headcount enrolments in major field of study
SET Business &
Management Humanities Education
Universities 21.99% 98 728 21% 33% 24% Technikons 32.83% 71 071 47% 14% 6% Total 25.52% 169 800 29% 27% 18%
Table 6.4: South African headcount enrolments in public education institutions in
2001 [47]
Table 6.4, shows the enrolments for 2001 and what is highlighted is the small portion
of enrolments in the Science Engineering and Technology (SET) field of study, only
25.52% which is only 169800 students. [47] This is not sufficient for a required
technology driven economy.
60

Table 6.5, shows the difference of enrolment ratios for some developed and
developing countries. The enrolment ratio for students in science, mathematics and
engineering is quite comparative to the other countries in Table 6.5, which is a ratio of
the total tertiary enrolments for a specific period. However, it is the percentage of
secondary enrolments that is relatively low when compared to the other countries in
Table 6.5, thus one can assume that the total tertiary enrolments are also low.
Combined primary,
secondary and tertiary gross
enrolments ratio % 2000 -2001
Net primary
enrolment ratio %
Net secondary enrolment
ratio %
Tertiary students in science,
mathematics and engineering (as %
of all tertiary students 1994 -1997)
2000 -2001 2000 -2001
Netherlands 99 100 90 20
United States 94 95 88 /
Japan 83 101 101 23
Germany 89 87 88 31
Korea, Rep. of 91 99 91 34
Brazil 95 97 71 23
South Africa 78 89 59 18
Table 6.5: Enrolment ratios for a few developed and developing countries [16]
Institution
Major Field of Study
SET Business Education Humanities and other social science
Total
Universities 16135 22.3%
13225 18.3%
21080 29.1%
21901 30.3%
72341 100.0%
Technikons 7774
33.0% 8651
37.7% 2067 9.0%
4476 19.5%
22988 100.0%
Total Average
23909 25.11%
21876 23.0%
23147 24.3%
26377 27.7%
95329 100.0%
Table 6.6: Graduate/ diplomats by major field of studying in 2001 [47]
61

The graduates and diplomats in the SET field of study made up only 25%, while the
majority of student completed within the field of social science and humanities, as
shown in Table 6.6. [47]
Institution
Formal Qualification 3 Year Undergraduate Degree a & Diplom
Professional Undergraduate Degrees
Postgraduate below Masters
Masters Degree
Doctoral Degrees Total
Universities 37312 51.6%
10336 14.3%
17881 24.7%
6029 8.3%
783 1.1%
72341 100.0%
Technikons 16736 72.8%
5771 25.1%
249 1.1%
213 0.9%
19 0.1%
22988 100.0%
Total 54048 56.7%
16107 16.9%
18130 19.0%
6242 6.5%
802 0.8%
95329 100.0%
Table 6.7: Graduate/ diplomats formal qualification in 2001 [47]
Table 6.7, shows that in 2001, universities produced 72 341 of all graduates and
diplomats, while technikons' total was only 22 988. [47] This could be one of the
reasons why government decided to merge certain universities with technikons; the
aim would be to benefit from the higher success rate of universities.
62

90% -
80% _
70% -
60% -
50% -
40% -
30% -
20% -
10% -
85% ❑ University
o Technikons 78% 80%
74% 75%74% 74%
70%
65%— 67%
0% . I i 1
African Coloured Indian White Total
Figure 6.2: Average undergraduate success rate in contact education by race group in 2001 [47]
One of the problems which were due to South Africa's history is the inequalities of
outcome in the higher education system which is shown in Figure 6.2. The average
success rate of African students in undergraduate programmes at university was only
65%, compared to on average of 85% for that of White students. [47]
6.3 Education, society and development
The data provided in the previous section outlines the important relationship between
education and development which seems to be a characteristic of Third World
Countries. [2] It is important to note that education can influence the future and
direction of society in many ways, which makes education and development a two-
way process. [2]
63

Six specific economic development components will be discussed in the following
subsections: [2]
6.3.1 Education and economic growth
Third World Nations struggle to create a semi-skilled and skilled workforce which is
one of the reasons for slow economic growth. [2] Interestingly, economic growth in
developed countries is not generally due to physical capital growth but rather attributed
to human capital. [2] The underlying fact is that an educated and skilled labour force is
a much needed ingredient for sustainable economic growth.
6.3.2 Education, inequality and poverty
Economics of education in the past only focused on the connection it has with labour
productivity and output growth. The impact it had on poverty alleviation was partly
neglected in the past. [2] However, recent studies regarding poverty have identified an
interesting yet obvious phenomenon; the educational system of many developing
nations act to increase rather than to decrease income inequalities. "Simply this means,
that if for financial or any other reason the poor are denied access to secondary or
tertiary institutions, then the education system actually perpetuates and even increases
inequality." [2]
The trend in most Third World countries as a result of the unequal spread of income,
high secondary school fees and higher education subsidies is to increase inequality and
perpetuate poverty. [2] "In most developing countries the annual tuition (especially at
a better private school) is roughly equivalent to the per capita national income.
Equality of education opportunity can have little meaning if financial assets and
income-earning opportunities are very unequally distributed." [2] It is also evident in
the inequality of university outcomes as shown in Figure 6.2.
64

6.3.3 Education, internal migration and fertility
Rural — urban migration and levels of fertility seem linked quite closely to education.
The perception is that education influences labour movement due to salary
expectations. [2] The obvious scenario that plagues migration is that an individual with
a higher education has a wider urban —rural income differential and also has a higher
probability of securing a modern sector job than an individual that has a lower level of
education. [2] This is also evident through the high unemployment rates of people with
a Grade 12 qualification as discussed in chapter 5. [4]
The relationship between education and fertility is not as simple. Most studies reveal
an inverse relationship between education of women and their family size, especially
at lower levels of education. [2]
One obvious goal irrespective of the above is to increase the level of education
amongst women of South Africa which would have a positive affect on the economy.
Women account for 52.3% of the total population of South Africa. [17]
6.3.4 Education and rural development
Third world nations are faced with the imbalance between rural and urban
development. Agriculture is an important contributor to rural development as well as
economic growth. [2] Future emphasis should be placed on the growth of education in
this sector. The goals of rural development should stretch beyond the development of
agriculture and should be focused on a balanced economy through equitable
distribution, and rapid generation of the benefits of higher levels of living. [2] These
goals should be aimed at creating productive employment opportunities, more
equitable access to land and distribution of income, improvements in health, nutrition,
housing and finally access to both formal and non-formal education. [2] The resulting
effect would have direct impact on the needs of dwellers in rural regions, which would
also decrease the rural-urban migration. [2]
65

The overriding goal is to prepare all children to pass the standard qualifying
examinations for secondary schools and to make the rural learner more productive for
the rural environment. [10]
6.3.5 Education and international migration: intellectual dependence and the brain drain
Third World countries are faced with international migration, known as international
brain drain. [2] It is the phenomenon whereby the highly skilled labour force, migrates
primarily from poor to rich countries. The professional sectors mainly affected by this
are, the scientist, engineers, academics and doctors, who most of the time have been
trained in home country institutions at a considerable social cost to for example, South
Africa and only to reap the benefits and contribute to an already developed economy.
[2] The trend of international migration will continue to exist as long as there are wage
discrepancies between developed and developing nations. [2] Over 20 000 skilled
Africans migrate every year to developed countries, and it is estimated that Africa has
over 250 000 professionals working in developed countries. [12], [42] "In the World
Economic Forum's latest Global Competitiveness Report issued in September 200, the
loss of skills caused by emigration in south Africa was deemed to be the third most
serious among 59 countries surveyed." [12] This is however a global issue, advanced
economies like Germany and Canada face the dilemma of scientists moving towards
the United states, and their governments have attempted counteract interventions to
retain skills. [49]
What is important is to take cognisance of the fact that although the international brain
drain affects the LDC's economic growth; it also impacts on the educational system. It
has not only reduced the supply of vital professional people but has diverted attention
of those professionals who remain from important local problems and goals. [2] These
could include the development of appropriate technology, the promotion of low-cost
health care; the construction of low-cost housing, hospitals, schools; the design and
building of functional yet inexpensive labour-intensive roads, bridges and machinery;
66

the development of relevant university teaching material etc. the list is endless as the
needs of Third World countries are so vast. [2]
One could argue that some LDC's do not have a high international migration of
professionals yet the needs of the country are still neglected. "This is due to a more
severe type of brain drain, when the professionals migrate 'intellectually' in terms of
their activities, known as 'internal' brain drain." [2] This is best described in the form
of examples; developing countries have numerous doctors specializing in heart
diseases, while tropical medicine is considered to be second rate. [2] Architects are
concerned with the design of national monuments and modern public buildings and
state of the art shopping malls, while low cost housing, schools and clinics remain an
area of remote concern. [2] Engineers and scientists concentrate on the sophisticated
and most modern electronic equipment, while simple hand machine tools, or animal
farm equipment, basic sanitation and water-purification systems and labour-intensive
mechanical processes are relegated to the attention of 'foreign experts'. [2] "In all
these diverse professional activities, performance criteria are based not on
contributions to national development but rather on praise from the international
community." [2]
The dominance of international attitudes of the professionals in developing nations
tends to permeate the entire educational and intellectual establishments, with
antidevelopment affects. [2] " If a good university is to be more than ' just a collection
of books', as the philosopher Thomas Caryle once remarked, Third World universities
and professional schools have a vital role to play in making higher education more
tuned to the real needs of social and economic development." [2]
67

6.4Conclusion
On of the most pertinent and critical issues, education of South Africa was discussed in
this chapter. Various statistics about South Africa's educational outputs were
highlighted.
The most daunting reality of this chapter was that, of the high percentage of learners
who actual write the senior certificate approximately 20% of them enrol at tertiary
institutions. [47] Where are all these potential EAP's being absorbed in the economy?
This chapter also showed that in 2000, there was a small percentage of learners who
completed Gradel2 with mathematics and physical science, and that only 25% of all
graduates completed with Science Technology and Engineering (SET) as the field of
study. [47] "In developed countries more than 50% of economic growth is attributed to
technical progress." [49]
This thus emphasises the need for technical skills in South Africa, which is reviewed
in more detail in the Chapter 7.
68

Chapter 7
TECHNICAL SKILLS DEVELOPMENT A PORTAL TO SOUTH AFRICA'S ECONOMIC GROWTH AND DEVELOPMENT
7.1Introduction
The issue of educational reform is not new and was not as a result of the new South
African government. [20] It can be traced back to the 1980 when the South African
government appointed the Human Science Research Council (HSRC) to investigate
the South Africa's education situation.[20] The 1981 De Lange Commission Report
(named after the commission's chairman, Professor JP De Lange, then principal of the
Rand Afrikaans University) and titled Provision of Education in the RSA, and one of
it's most important recommendation was that should be equal schooling within one
education department across all racial groups. [20], [36], [39] " vital questions
about education in the homelands and rural areas were ignored." [39] Fortunately with
the change in the political climate of South Africa the issue regarding education and
training was and is a key focus for the government. This resulted in the development of
many discussion documents to address the skills shortage in South Africa.
This chapter will discuss skills development and the need especially for engineering
skills in South Africa.
7.2Why the need for skills development?
Chapter 5 and 6 provided the reality of South Africa's level of unemployment and
education, which affects the growing population between the ages of 15 — 35 (the
youth of South Africa). It is important to emphasise once again the difference that
exists with developed countries; South Africa's population in this category constitutes
69

almost 37.56% of the entire population in March 2004. In developed countries this
percentage is below 20%. [2], [4]
The concerning effect of this is that there is an increasing number of secondary school
learners and thus also the associated increase in the number of matriculation certificate
candidates. This situation has with it a high percentage of learners who do not actually
pass the matriculation examination with exemption, as shown in Figure 7.1.
80%
70%
60%
50%
40%
30%
20%
10%
0%
—
—
—
1994 1995 1996 1997 1998 1999 2000 2001 2002 2003
0% Pass 0% Exemption
Figure 7.1: Matriculation statistics for period 1994 — 2003 [20], [40]
As indicated in Figure 7.1, the pass rate in 2003 was an impressive 73.3 % of 440 267
learners who actual wrote the matriculation certificate. However, only 18.6% passed
with subjects on the higher grade (exemption). [20], [40] These statistics further
emphasise the burden placed on the current economic active people, it also implies that
the labour market is flooded yearly by a large amount of people who do not have the
minimum level of education required for employment and vocational development
70

training. This is also evident in the high unemployment rate of people with this level of
education as highlighted in chapter 5.
This implies that yearly these people are contributing to the increase in the number of
unemployment, as the South Africa labour market is in desperate need of skilled
people. The change in the world of work in the twentieth century has also demanded a
highly skilled work force, which South Africa is not producing. [23], [26]
The change in South Africa's workforce is evident from Table 7.1. The increase in the
number of professional and skilled workforce increased by a relatively small
percentage over a 20 year period, which is not good enough for an economy driven by
technology.
Year Professional Skilled Unskilled
1960 9% 18% 73%
1980 14% 26% 60%
2000 20% 28% 52%
Table 7.1: Composition of the South African workforce [20]
The obvious and simple solution is purely to increase the quality of the candidates
completing the matriculation certificate.
One of the ways to improve the education is to have the salaries of educators paid in
part by the learners/parents. [53] What this would tend to do is make certain
institutions more attractive, due to its success rate, reputation and quality of its
educators. [53] These learning institutions could churn out academically stronger
learners.
The current dilemma is how to utilize and develop the large percentage of the
population that is not adequately skilled. The government has implemented various
strategies and Acts to force a change in the labour market. These are the Skills
Development Act (Act No. 97 of 1998); Skills Development Levies Act (Act No. 9 of
1999) and the Green Paper on the Skills development strategy. [21] The intention is to
71

promote economic, employment and social growth by focusing on education, training
and employment services. [21]
One of the key focal points in the strategy is to implement a system of learnerships
used to facilitate the connection between structured learning and work experience in
order to obtain a registered qualification. [21] "Learnerships directly address the 'how'
of the skills development strategy." [21] The main objective of the skills strategy is to
have at least 70% of the workforce with a level 1 qualification by March 2005 of
which 15% should be in formal learnerships. [26]The expectation is that over 80 000
under the age of 30 should enter learnerships with hopefully 50% of these people
finding suitable work within six months of completion of the program. [26] The
learnerships developed by the 25 SETA' s (Sector Education and Training Authority)
should produce candidates with a qualification that is recognizable in the work place as
competent.
Companies presently cannot afford to run development programs due to cost
constraints, even though the government has implemented special skills development
grants; it is evident in the amount of apprenticeship programs which peaked at about
25 000 in the 1970's compared to only 3500 in the late 1990's. [26]
The areas, as identified by the Department of Labour, which has the greatest shortages,
are engineering, information technology, management and financial management. [26]
The mining sector requires skills in rock breaking, engineering maintenance and
repair, diamond repair; occupational health and safety representation just to mention a
few. [26]
7.3The need for engineering skills in South Africa
The need for engineering skills has necessitated the creation of MERSETA
(Manufacturing Engineering and Related Services Education and Training Authority)
in 2000, their target was to develop 10 000 unemployed people by the end of 2003.
[14], [27] The Merseta have five focal areas which are: learnerships, small and
medium enterprises (SMME's), adult basic education and training (Abet), quality
72

assurance and grant disbursements. The formation of the seta has attempted to resolve
the skill shortage in five main areas, these are: auto, metal and engineering, motor
retail and components, new tyre and plastics. [27]
The need for engineering skill cannot be over emphasised. The role of the engineer
should not be taken for granted as their outputs affect any economy that they
participate in. The fact of the matter is that Engineering and Economics go hand-in-
hand. "Engineering involves the determination of the combination of materials, forces,
information, and human factors that will yield a desired result. Engineering activities
are rarely carried out for the satisfaction that may be derived from them directly. With
few exception, their use is confined to satisfy human wants" [25] "It is these human
wants that binds engineering to economics, in that as natural resources diminish and
technology advances, the engineer is required to balance both resource limitations and
cost constraints for the good of all." [11]
"Economists today agree on a general definition something like the following: Economics is the study of how men and society end up choosing, with or without the use of money, to employ scarce productive resources that would have alternative uses, to produce various commodities and distribute them for consumption, now or in the future, among various people and groups in society. It analyses the costs and benefits of improving patterns of resource allocation." *
*PA Samuelson, Economics, 9 th Edition, McGraw-Hill, New York, 1973 [1 1 ]
7.3.1 Development of engineers for sustainable growth
The need for engineers to be developed across all race groups is imperative for
sustainable growth. [28] This is the opinion of James Ngobeni of the South African
Black Technical and Allied Careers Organisation. He pointed out that black engineers
and consultants should be developed and that they should obtain more expertise since
Africa tends to be over-reliant on international contractors. [28] It is interesting to note
that developed countries such as Japan, Korea and Malaysia optimised and developed
the necessary skills required to develop their economy. [30]
73

South Africa's engineering skill amongst the various race groups is not promising; this
is only based against the ECSA's (Engineering Council of South Africa) registration
statistics as at 25 June 2004, as shown in Table 7.2. [22] Hopefully, this does not
reflect the true engineering capability of South Africa because of a lack of many
engineers that do not register with ECSA. The conclusions made are however based on
ECSA's registration data and are also supported by the data regarding the enrolment in
SET as discussed in chapter 6.
Registration Category 'l ....
Bla
c k
g
-tC
Col
oure
d
a) Tti
Fem
a le
Professionals Professional Engineers 14808 14051 399 300 58 14522 286
Professional Engineering Technologists
2552 2326 73 111 42 2530 22
Professional Certified Engineers
863 841 4 16 2 862 1
Professional Engineering Technicians
877 502 279 56 40 847 30
Candidates Candidates Engineers 3325 2359 607 340 19 2956 344
Candidates Engineering Technologists
590 286 204 79 21 534 56
Candidates Certified Engineers
110 80 16 12 2 110 0
Candidates Engineering Technicians
762 215 440 90 17 652 110
Specified Category Registered Lift Inspectors 157 140 2 6 9 157 0
Registered Engineering Technicians (Including Master)
1723 1587 66 42 28 1711 12
Total 25767 22387 2090 1052 238 24881 861
% of total Economically Active Population (1000) in March 2004 [17]
30 429 3 021 23 743 862 2 787 14 354 16 065
0.08% 0.74% 0.01% 0.12% 0.01% 0.17% 0.01%
Table 7.2: ECSA's registration statistics, as at 25 June 2004 [22]
74

1600 -7
1400 -7
1200 -7
1000 -7-
800 --/-
600 -7-
200-7
0
4=.• C
4:7'
■=7
— .=,
..=,.•
.=7 - a=
4=7
= =
-
=
__■-___..-___,-__,-_—.-
-
=
-
.0-
-"m
ao -'
----=
___.-_,-___•:-_—•r-
- - - - -
....
-
...7
1994 1995 1996 1997 1998 1999 2000 2001 2002 2003 2004
o Total (A+B+C) 188 226 238 374 406 463 506 520 579 844 306
o Whites ( W ) 1370 1528 1359 1459 1432 995 802 832 1011 1086 305
2004=1 Januaryto 5 May 2004
Figure 7.2: ECSA registration trends per calendar year [38]
All things aside, the reality of Table 7.2 is not good due to the low registration levels
amongst Blacks, Coloured and Asians. The trend however in registration amongst
Asians, Black and Coloured has shown a progressive increase as shown in Figure 7.2.
One observation is that the registered individuals with ECSA are white male
dominated. The other reality is that there is only a small number of candidate
engineers as well as the shortage of female engineers which is a major concern among
many sectors of the economy due to the fact that women make a large percentage of
the population. [44], [45]
From Table 7.2, it is evident that there is only a small percentage of the EAP that are
registered with ECSA. The total EAP for South Africa is only 30 439 000 and only
25 767 (0.08%) of this population is registered with the ECSA. The engineer is
75

important in any economy and they are the drivers of technology and technology
drives an economy. [33], [37] This highlights the problem, that there are more
engineers required to drive South Africa's economy.
The above is further supported by the lack of individuals in the research and
development. The numbers of young scientists are diminishing as is evident in figure
7.3. The population of scientists are ageing, in 1998, 45% of scientific output was due
to scientists over the age of 50, as opposed to only 18% in 1990. [49]
Perc
enta
g e (%
)
Ageing scientists: Publication by age group
18 31
77 65
54
1990
1994
1998
❑Under 30 ❑ 30 - 40 ❑ 50 +
100
90
80
70
60
50
40
30
20
10
0
Figure 7.3: The age demographics of scientists in South Africa [49]
76

7.4 Technology's roles in economic development
Before, the impact of technology is discussed in terms of economic development it is
imperative that technology be defined.
Technology can be defined from the hardware of production, in other words the
knowledge about machines and processes. Expanding the definition, it could be
defined as all the skill knowledge and procedures for making, using or doing things.
[24] "It includes the nature and specifications of what is produced- the product design-
as well as the how it is produced." [24] The broader definition of technology takes
services such as banks, management, marketing, education and law into account.
However, generally technology is associated with science mainly engineering. [24]
7.4.1 Technology innovation forces technical skills development
Technology innovation is important as it affects labour productivity and as a result the
economy. This will be explained in support of justifying why technology is important
for economic development.
It was found in a survey on manufacturing firms that technological change can be
measured by three dimensions: [23]
• Product innovation: [23]
This is measured by the firms increase or decrease in product range that was
developed over a fixed period. In the manufacturing industry it was found that a
large percentage of firms increased there product range, which occurred mainly
with the large firms and of these approximately 40% had increased there labour.
On the other hand those firms who had a decrease in product range had an
associated decrease in labour requirement. [23]
77

What this implies is that if South Africa has a larger export —orientated market it
would naturally result in a decrease in the development of product range which
will affect employment. [23]
On the other hand it is important to note that those firms who increased their
product range not only increased there labour but also the quality of their labour;
an increased product range had an increased skill level associated with it. [23]
Capital innovation [23]
This type of innovation is measured by the South African Labour Flexibility
Survey (SALFS) and determines whether a firm has introduced new technology in
production during a two year period. [23]
Of the firms surveyed, 66% had introduced new technology, with the main change
occurring in new production machinery (55%), computerisation (26%) and line
automation (10.3%). [23] Of those firms that made a change, 22% believed that it
increased their labour demand while 23% believed that it decreased their labour
demand. [23] However, 40% of these firms believed that the new technology
increased the range of tasks that their employees were involved with. While 68%
of the firms said that the change resulted in an increased complexity of the
technical knowledge required of their employees. [23]
Technological change therefore can result in a natural increase in the quality of the
workforce.
Work process innovation [23]
During a survey, firms were asked whether or not they implemented any changes
in the way production was organised and also what changes were due to
technology change. [23] The results showed that 58% of firms made a process
change, of which 24% was only a re-organising or shifting of equipment and
facilities; 26% expanded worker-management communication procedures, 12%
increased the task range of the workers, 7% said they formulated work teams, 6%
78

had introduced the 'just in time' principle, 6% had delegated more managerial and
supervisory roles, 5% referred to the change as increasing worker independence,
the remainder of the firms referred to the change as the change in the control of
work , out-sourcing and managerial training. [23]
Of those firms that made work organisation changes, 19% said it enabled them to
reduce labour demand while 16% said it increased the labour demand. [23] Over
50% of the firms said that the change resulted in an increase in the complexity or
technical knowledge of the workers. [23]
The impact of technological change in the three forms described above, all had an
impact on labour. A large percentage believed that it increased their labour demand
but more importantly it increased or forced the increase in the quality of their
labour. The end result is that it developed the work force to be more skilled.
The three types of innovations can be best undertaken by engineers. To emphasise
the above, innovation affected labour positively. The engineer's responsibility is to
change the labour force that affects employment which affects the economy as well
as poverty. This is also the responsibility of the engineer and is supported by
management principles developed by Frederick Winslow Taylor in 1964.
The task management principles developed compromised of four key elements,
namely: [52]
Development of a scientific method of performing a task
Scientifically selecting the proper staff
Providing adequate training and development to the staff and rewarding them appropriately
Equal division of work and responsibility between the employee and management
The first three elements require a technical person and should also form part of the
engineers' portfolio. The impact of development and training of people can not be
79

over emphasised, as the need to train workers according to scientific methods
would also result in a better quality of life not only for the workers but also for
their immediate environment. [52]
7.4.2 South Africa's portrait for a 'Wining Nation'
The portrait of a 'wining nation' was part of the research by a team commissioned by
Anglo American Corporation; they published the research in the book, The World and
South Africa. [31]
The portrait of winning nation has the following ingredients: [31]
High Education
Work Ethic
Mobilisation of Capital
'Dual-Logic' Economy
Social Harmony
Global player
South Africa should learn from other developed countries especially Japan, where they
represent a company as a tree as depicted in Figure 7.4. [31] The roots of tree signify
the technologies that provide nourishment and stability. The trunk represents the
people and skill which are unique to the company and finally the branches are the
activities and the fruits of the products. [31] The Japanese have also defined their
strength as 'invisible assets', which are the people, the accumulation of knowledge and
skill, the culture, the design, the market, the product research and software. The
Japanese believe that one should build up a reservoir of 'invisible assets' to unleash on
competitors. The company, Honda, is proof of the success of this type of thinking. [31]
80

i_ ..........,„„).7,—.I.D,, Tre, ,j -u, , ,,, \:
// i
-,.., __ _- _
02 ,F;i3
l'isc[maz,Bica0 and CLT,]Dgid20
PF,20Eill@O
..o.
t ' 4. ; J 17 l nc riE ,, V J
Figure 7.4: The Japanese Image of the Company Tree [31]
7.5 Need for engineers in economic development
To re-iterate and in support of section 7.3, the role of the engineer can not be ignored.
The engineer is best geared to be the custodian of technology. This same view is held
by Gauteng's Premier, Mdhazima Shilowa, who discussed the various projects for
Gauteng in 2001, where he shared the vision for the Gauteng to be the 'smart'
province, he also placed emphasis on development, innovation, quality business and
financial services, as well as value added high-technology-based manufacturing. [29]
From the data represented in section 7.3 it should be evident that the engineering
sector should be developed. There should also be a focus on research and development
as there has been a decline in this field which is evident from the amount of graduates
that are completing in this field of study, which were the views of Professor
81

nuEal off Aft ctroaADH
SET human co2purec,1J
Futtum RA3 mpgdt
Warn tg warm ((l'inp),Toyemanv rnd
b[nrawallon
Bas6now i-rocecorrrmm
Enapongd Canna RIO knom-haw
cap g©rN
Anastasious Pouris, of the Pretoria University Institute of Technology. [30] He also
mentioned that ".....the number of science and engineering students at university is
declining." The other issue that the Professor mentions is a concern of the secondary
school mathematics and science deficiency. [30]
Figure 7.5: The effect technology has on economic growth and quality of life [35],
[49]
Figure 7.5 depicts the framework and the relationship between the various aspects of
the economy that affects economic growth and the quality of life. "Modern economies
require that these elements be present and growing. The framework is a representation
of the National System of Innovation (NSI)." [49] Figure 7.5 also shows that wealth
creation and quality of life are the two major outcomes of technology.
82

7.6Conclusion
In conclusion this chapter focused on engineering skills development. It highlighted
the need for technical skills in South Africa as well as the role of technology in
economic development.
The portrait of South Africa as a winning nation has been briefly reviewed and what
has constantly been mentioned is education. Without contradicting the importance of
technical skills development, the concern is that skills development is an important and
excellent strategic intent to uplift the status of the South African labour force. However
the strategy for technical skills development is a short term solution. A major problem
which is the high influx of matriculants that do not qualify to enter a tertiary institution
still persists. This the problem is not solved but possibly shifted to the SETA's, who
must try and raise the skill level of these potential EAP's.
The Grade 12 pass rates at schools increased, but a new strategy should focus not only
on the number but the quality of learners completing school. A shift should swing from
skills development to a school learner development in South Africa's next term of
democracy.
A plan should also be put into place to increase the number of learners passing
mathematics and physical science in grade 12, to hopefully increase the enrolment
figures for SET at tertiary institutions. The end result should thus be to increase the
number of engineers registered with the ECSA, and create an economy driven by
engineers to sustain a growing economy. Engineers are the most suitable custodians of
83

technology. Eventually a technology driven economy should result in a better quality
of life for all South Africans.
Finally, the responsibility of the engineer is at a pivotal point in South Africa's future.
The engineer has an impact on society. Without the engineer technology / innovation
cannot advance and as outlined in this chapter, innovation increases the labour force
and the quality of it. The engineer changes the quality of life for any society they work
in.
84

Chapter 8
CONCLUSIONS AND RECOMMENDATION
8.1 Conclusions
South Africa is a country with great potential and a prosperous future. One of the
hindrances to sustainable economic growth is the investment needed in human capital.
This dissertation emphasised the need for technical skills for techno-economic
development.
The characteristics of developing nations were discussed and statistics provided about
South Africa poverty and education were highlighted in Chapter 2. According to the
World Development Indicator's report 2001, South Africa had 23.8% of the
population living below the $2 a day poverty line.
The population of South Africa was also reviewed, as a large portion of the population
aged between 15 —35 regarded as youth. The total potential Economic Active People
(EAP) in South Africa accounts for 63% of the entire population. However associated
with this is a 27.8% unemployment rate. The importance of exports was also discussed
and a comparison made between South Africa and other developed and developing
countries. In 2001, all of South Africa's manufactured exports, High-technology
exports accounted for only 5%. This could be an indicator of the involvement of
technology within the manufacturing exports sector.
Chapter 3, provided an overview of some economic theories, and emphasised that 52%
of the total gross capital formation in 2000 comprised of machinery and equipment.
Chapter 4, focused on South Africa's political and economic history. South Africa has
journeyed through political history that affected the entire population irrespective of
race. The newly elected democratic government, inherited many setbacks due to its
turbulent past. One setback is the issue of skill, especially amongst the black South
85
Africans. Some sectors of the South African economy that if improved, can produce
long term growth. These are listed: Labour, Capital, Technology, Natural Resources
and other factors such as Sociological and Political stability.
The South African labour force was the focus of chapter 5. Of an entire population of
over 48 million, according to the March 2004 survey, 37.56% are youth. Technical and
associated professionals account for only 1.86 million people of the South African
population. Alarming facts presented are the high unemployment rates (32%) amongst
women that make up almost 52% of the entire population, also the unemployment
rates of the EAP according to education levels of people with Grade 10, 11 and 12.
In chapter 6, it was shown that South Africa's expenditure for education totalled
R69.063 billion in 2004. This could be due to the fact that in 2003, the public
education systems accommodated 11.7 million school learners, 448 868 university
students, 216 499 technikon students and 356 000 FET college students. The
interesting facts provided in chapter 6, were the number of mathematics and physical
science learners and the associated pass rates. In 2001, the pass rate for mathematics
and physical science were 46.66% and 68.61% respectively and of all the learners that
wrote the senior certificate examination, less than 20% passed with exemptions. The
compounding effect is the low tertiary enrolments in Science, Engineering and
Technology (SET), which accounted for only 25.52% of all tertiary institution
enrolments, in 2001. This permeates deep within the labour sector, as is evident in the
small number of registered persons with the Engineering Council of South Africa.
Blacks, Asians and Coloureds collective accounted for only 3380 of a total of 25767
registered people across all the categories as at June 2004. Sadly the low registration
amongst women, only 861 of all registered persons with ECSA as at 25 June 2004.
86

Technology is important for economic growth, as it leads to the development of skills
and thus innovation increases the quality of labour. The engineer is best suited to be
the custodian to implement and drive technology. The rewards in investing in human
capital, especially technical skills, should not be underestimated as it is linked to
economic growth. Technology can promote economic growth, which in turn can
improve human development. Improved in human development translates into the
reduction in poverty and unemployment. To achieve this, a new strategy is required to
improve the quality of learners in school, especially by increasing the number of
learners passing mathematics and science on the higher grade. The end result is to
drastically increase the enrolments in SET. The higher the Grade 12 pass rate,
potentially higher enrolments at tertiary institutions, reducing unemployment.
The labour market of South Africa is in need of a skilled workforce with more than
just a senior certificate. The development of skills can be driven by technology.
Technology in turn assists in economic development and also in alleviating poverty
and unemployment. This can however only achieved if investment is made in the
people of South Africa, our most important resource.
87

8.2 Recommendation
This dissertation focused on various aspects associated with techno-economic
development and only highlighted certain sectors. Possible further future research
topics:
The history of male dominance in the technical field as shown in the ECSA
registration statistics. What strategy is required to utilize the experience of the ageing
white technical male and the importance of developing the black engineer?
The contentious yet urgent point raised in this dissertation was the low participation of
women in the economy especially in SET. The reasons for this and the impact it could
have on the economy.
The principles of Scientific (task) Management researched and developed in 1967. The
implementation of these principles affects the quality of life for the employees and
companies who use it as well as the immediate surrounding community. Why have
these principles not been utilised, are they still valid for the 21 st century.
88

Appendix 1: Poverty Indicator [15]
National poverty line
International poverty line
Survey Rural
Population poverty line
Urban
below the
National Survey Rural
Population poverty line
Urban
below the
National
Pop.
below
Poverty
gap at
Pop.
below
Poverty
gap at Survey
year % % % year % % % year $1 a day
$1 a day
$2 a day
$2 a day
Portugal .. .. .. .. .. .. 1994 b <2 <0.5 <0.5 <0.5
Puerto Rico .. .. .. .. .. ..
Romania 1994 27.9 20.4 21.5 .. .. .. 2000 a 2.1 0.6 20.5 5.2
Russian Federation 1994 .. 30.9 .. .. .. 2000 a 6.1 1.2 23.8 8.0
Rwanda 1993 .. 51.2 .. .. .. 1983- 85 a 35.7 7.7 84.6 36.7
Saudi Arabia .. .. .. .. .. .. .. .. .. ..
Senegal 1992 40.4 .. 33.4 .. .. .. 1995 a 26.3 7.0 67.8 28.2
Sierra Leone 1989 76.0 53.0 68.0 .. .. .. 1989 a 57.0 39.5 74.5 51.8
Slovak Republic .. .. .. .. .. .. 1996 b <2 <0.5 2.4 0.7
Slovenia .. .. .. .. .. 1998 a <2 <0.5 <2 <0.5
Somalia .. .. .. .. .. .. .. .. .. ..
South Africa .. .. .. .. .. .. 1995 a 7.1 1.1 23.8 8.6
Spain .. .. .. .. .. .. .. .. ..
Sri Lanka
1990- 91 22.0 15.0 20.0
1995- 96 27.0 15.0 25.0
1995- 96 a 6.6 1.0 45.4 13.5
Sudan .. .. .. .. .. .. ..
Swaziland 1995 .. .. 40.0 .. .. .. ..
Tajikistan .. .. .. .. .. .. 1998 a 10.3 2.6 50.8 16.3
Tanzania 1991 40.8 .. 38.6 2000-
01 38.7 .. 35.7 1993 a 19.9 4.8 59.7 23.0
Thailand 1990 .. 18.0 1992 15.5 10.2 13.1 2000 a <2 <0.5 32.5 9.0
Togo
1987- 89 .. .. 32.3 .. .. .. .. .. ..
Trinidad and Tobago 1992 20.0 24.0 21.0 .. .. 1992 b 12.4 3.5 39 14.6
Tunisia 1990 13.1 3.5 7.4 1995 13.9 3.6 7.6 2000 a <2 <0.5 6.6 1.3
Turkey .. .. .. .. .. 2000 a <2 <0.5 10.3 2.5
Turkmenistan .. .. .. .. .. .. 1998 a 12.1 2.6 44 15.4
Uganda 1993 .. .. 55.0 1997 .. .. 44.0 .. .. .. ..
Ukraine 1995 .. 31.7 .. .. .. 1999 b 2.9 0.6 45.7 16.3
United Arab Emirates .. .. .. .. .. .. .. .. ..
United Kngdom .. .. .. .. .. .. .. .. ..
United States .. .. .. .. .. .. .. ..
Uruguay .. .. .. .. .. .. 2000 b <2 <0.5 3.9 0.8
Uzbekistan 2000 30.5 22.5 27.5 .. .. .. 2000 a 21.8 5.4 77.5 28.9
Venezuela, RB 1989 .. 1.3 .. .. .. 1998 b 15.0 6.9 32 15.2
Vietnam 1993 57.2 25.9 50.9 .. .. 1998 a 17.7 3.3 63.7 22.9
West Bank and Gaza .. .. .. .. .. .. .. .. ..
Yemen, Rep. 1998 45.0 30.8 41.8 .. .. 1998 a 15.7 4.5 45.2 15.0
Zambia 1996 82.8 46.0 69.2 1998 83.1 56.0 72.9 1998 a 63.7 32.7 87.4 55.4
Zimbabwe
1990- 91 35.8 3.4 25.8
1995- 96 48.0 7.9 34.9
1990- 91 a 36.0 9.6 64.2 29.4
a. Based on expenditure. b. Based on income.
89

BIBLIOGRAPHY
KINDLEBERGER, C. P. 1965 Economic Development, 2m1 Edition, McGraw-
Hill Book Company, Inc.
TODARO, M. P. 1989 Economic Development in Third World, 4th Edition,
Longman House, Burnt Hill, Harlow.
ROUX, A. 2002. Everyone's Guide to the South African Economy, 7th Edition,
Zebra Press.
SOUTH AFRICAN INSTITUTE OF RACE RELATIONS. 2001. South
African Survey 2000/01, Pietermartizburg: Natal Witness Commercial Printers.
SOUTH AFRICA. Government Communication (GSIS), October 2003. South
Africa Yearbook 2003/04, Pretoria: CSIS and STE Publishers
NEDBANK. 1991. South Africa: The new Beginning, London: Euromoney
Publication.
CURTIS, D., LOBLEY, D., 1994. Success in Economics for Southern Africa.
Johan Murray (Publisher) LTD
BERNSTEIN, A., October 1992. Implications for South Africa. Development and
Democracy Journal
International Economic Development Counsel [Online]. Available:
http://www.iedconline.org/hotlinks/whtecodev.html [25 September 2004]
COLEMAN, F. L., 1983. Economic history of South Africa, 1 s` Edition. HAUM
Educational Publishers.
90

RIGGS, J. L., Engineering Economics, 1977. McGraw-Hill Book Company.
ABSA. 15 January 2001. Economic Perspective: First Quarter 2001.
Johannesburg: ABSA Group Economic Research, ABSA Group Limited. [Online]
Available: http ://www. ab sa. co. za
SOUTH AFRICA. South African Reserve Bank. 24 August 2004. Annual
Economic Report 2004. Pretoria: SA Reverse Bank
MERSETA, Functions of the Merseta. [Online] Available:
http://www.merseta.org.za/aboutfunctions.asp, [19 February 2005]
WORLD BANKS DEVELOPMENT RESEARCH GROUP, 2004. World
Development Indicators: Poverty.
HUMAN DEVELOPMENT REPORT, 2003. Millennium Development Goals,
A compact among nations to end human poverty. Monitoring human Development:
Enlarging people's choice
STATISTICS SOUTH AFRICA., March 2004. Labour Force Survey. Statistical
Release (P0210). Pretoria: Statistics South Africa
MILLER, T. October 1994. The Causes of Unemployment in the UK 1994.
[Online]. Available: http://www.economic-truth.co.uk/ [February 2005]
SOUTH AFRICA. Employment and Unemployment Trends in post-apartheid
South Africa, prepared for the Presidency as part of their 10-year Cabinet Review
Process. The Labour Market in Post-Apartheid South Africa: A Brief Overview, 2004.
ERNST, E A., 2000. Skills Development handbook for SETA 's, employers and
Employees in South Africa, Pretoria: College of Competence.
91

SOUTH AFRICA. Department of Labour. March 1997. GREEN PAPER Skills
development strategy for Economic and Employment Growth in South Africa. Pretoria;
Department of Labour
ENGINEERING COUNCIL OF SOUTH AFRICA. July 2004. ECSA
Bulletin: Registration Statistics as at June 2004. Bruma: ECSA
STANDING, Guy., SENDER, J., WEEKS, J., 1996. Restructuring the Labour
market: The SA challenge, International Labour organisation.
STEWART, F., 1978. Technology and underdevelopment. 2'1 Edition. The
Macmillan Press LTD.
THUENSEN G. J., FABRYCKY W. J., 2001. Engineering Economy, 91h
Edition. Prentice Hall International Series.
ZHUWAKINYU, M., January 18-24, 2002. Setting the country's training and
education wheels in motion. Martin Creamer's Engineering News: The Great Skills
Challenge, 16-17
LEICHER, T., January 31 - February 6, 2003. Making South African skills
development a reality. Martin Creamer's Engineering News: New R&D Voyage. 18.
SPICER, D., May 24-30, 2002. Black engineers critical for SA's success. Martin
Creamer's Engineering News: Projects Galore. 22
HOLTZHAUSEN, L., March 23-29, 2001. How Shilowa is making Gauteng
`smart' . Martin Creamer's Engineering News: Knowledge the new Gold 16
CAMPBELL, K., August 8-14, 2003. Urgent need to boost engineering intake.
Martin Creamer's Engineering News: Making Public works work for jobs. 21
92

SUNTER, C., 1987. The World and South Africa in the 1990's. Human and
Rousseau Tafelberg.
STATISTICS SOUTH AFRICA, 15 September 2002. Census of commercial
agriculture 2002 (Summary). Statistical release (P1101). Pretoria: Statistics South
Africa
FARQUHARSON, F., 13 -16 July, 2004. Using 'Knowledge Mapping' as a
strategy for building a knowledge base in a scarce skills area: A South African Case
Study. National Skills Research Agency (NASRA), Durban Institute of technology.
Paper presented at the 13 th National vocational Education and Training research
conference, Australia.
NATIONAL YOUTH COMMISSION, About us: Background and Overview.
[Online] http://www.nyc.gov.za/about_nyc/background.htm [19February 2005]
SOUTH AFRICA. National Advisory Council of Innovation (NACI). 31 July
2002. South African Science and Technology: Key Facts and Figures 2002. Pretoria:
NACI and the Department of Arts, Culture, Science and Technology.
[Online] Available: http ://www. naci.org.za and http://www.dacst.gov.za
KRAAK, A., 2004. Training policies under late apartheid: the historical imprint
of a low skill regime. [Online] Available:
http://www.hsrcpublishers.co.za/.../tb1PDF/2040_02_Shifting_understanding_of Skill
in Sa—'19112004110952AM.pdf [February 2005]
De RAMIREZ, L. M., BEAUCHAMP, G., June, 1995. Integration of skills
development across the Engineering curriculum, University of Puerto Rico at
Mayaguez, ASEE Convention.
ENGINEERING COUNCIL OF SOUTH AFRICA. 2004. ECSA —Registration
Trends per calendar year, [Online] Available:
93

http://www.ecsa.co.za/transformation/StatsMay2004/Reg_AllCategories.htm .
[19February 2005]
KHUZWAYO, H. B., 2005. A history of mathematics education research in
South Africa: the apartheid years. [Online] Available:
hap ://wwvv. hsrcpubli shers. co . za/u ser uploads/tb1PDF/2034_12_Researching_Mathem
atics Education-04022005100943AM.pdf [February 2005]
MONARE, M., 2004.Will Matric 2004 make the Grade. The Star, 11 October.
ABOUT ECONOMICS, What's the difference between Nominal and Real GDP.
[Online] Available:
http ://www. economics. about. com/cs/macrohelp/a/nominal_vs_real . html, [9February
2005]
NTULI, D., 2004. Low wages behind African brain drain. Sunday Times:
Business Times, 17 October.
SOUTH AFRICA. South African government Information:
http://www.infogov.za , 1994. GEAR -A macroeconomic strategy [Online] Available:
http://polity.org.za/html/govdocs/policy/growth html, [February 2005]
EZELIORA, B., 2001. Developing engineering skills in female students by
incorporating local practices into science education. Nigeria [Online] Available:
http://www.awis.orginetwork/inter/ezeliora.html [15 May 2004]
STATISTICS SOUTH AFRICA. 27 July 2004. Mid-year population estimates,
South Africa 2004. Statistical Release (P0302), Pretoria: Statistics South Africa
SOUTH AFRICA. The Department of Trade and Industry. 2004. Gross
domestic product at market prices (Mar 1960 —Jun 2004) [Online] Available
http://www.thedti.goz.za/econdo/resbank/rb6006yt.html, [28 October 2004]
94

SOUTH AFRICA. The Department of Education. June 2003. Education
Statistics in South Africa at a glance in 2001, Pretoria: Education Management
Information systems (EMIS) Directorate, Department of Education.
HAWKINS, J. M., The Oxford mini-dictionary, 3rd Edition, 1992. Oxford:
Clarendon Press.
SOUTH AFRICA. Department of Science and Technology. August 2002. South
Africa's National Research and Development Strategy. Pretoria: The Government of
the Republic of South Africa.
NIGEL, W., 1994. The making of Modern South Africa Conquest, Segregation
and Apartheid, Historical Associations studies, Oxford: Blackwell Publishers.
SOUTH AFRICA. South African government Information:
http://www.infogov.za , 1994. A review of economic development since 1994. [Online]
Available: http:www//polity. org . za/html/govdoc s/pol icy/gear-03 html#appl, [February
2005]
TAYLOR, F. W., 1967, The Principles of Scientific Management, Harper and
Row Publishers, Incorporated.
SMITH, A., 1952, An Inquiry Into the Nature and Cause of the Wealth of
Nations, William Breton Publishers, Encyclopdia Britannica, Inc.
95