Embed Size (px)
Citation preview

Technical Report
ProFuN TG:A Tool for Programming and Managing
Dependable Sensor Network ApplicationsAtis Elsts and Konstantinos Sagonas
Department of Information Technology, Uppsala University, Sweden
Abstract—Sensor network macroprogramming methodologiessuch as the Abstract Task Graph (ATaG) hold the promiseof enabling high-level sensor network application development.However, progress in this area is hampered by the scarcity oftools, and also because of insufficient focus on developmentsupport for dependable application programming.
We present ProFuN TG (Task Graph), a tool for designingsensor network applications using task graphs. ProFuN TGprovides automated task mapping, sensor node firmware macro-compilation, application simulation, deployment, and runtimemaintenance. It also allows users to incorporate quality-of-servicerequirements in the applications, expressed through constraintson task-to-task data flows. For the design stage, we show howProFuN TG can be used to efficiently and optimally map tasks onnetworks while satisfying user-defined constraints. For runtime,we provide an efficient flooding-based protocol to set up tasks inthe network, and a middleware that continuously checks whetherthe conditions of the constraints are satisfied and requests taskremapping on failure.
I. INTRODUCTION
The currently dominating system-level approach to wirelesssensor network (WSN) software engineering does not provideready-to-use tools for implementing functionality commonlyrequired by WSN users, such as:
• Create a tailored firmware image for each sensor node inthe network depending on its hardware components andsoftware configuration.
• Using node configuration properties, partition the model ofthe network in logical regions.
• Set up specific application-level tasks on sensor nodes;control and change them during the network’s lifetime.
• Given the network model, assumptions about its environ-ment, and an application with specific quality-of-service(QoS) requirements, determine the nodes on which theapplication should be deployed so that the requirementshold.
• Continuously assure the user that the application is stillmeeting its QoS requirements.
Such functionality is instead implemented on application-specific basis; an approach that is both tedious and error prone.
We take an existing WSN programming methodology, theAbstract Task Graph (ATaG) [1], and implement it in ProFuN
TG 1 , a tool that addresses the needs of sensor networkprogramming, deployment and maintainance. ProFuN TGnot only allows users to describe the functionality of anapplication with a task graph, but also extends ATaG byallowing to incorporate end-to-end reliability requirements [2]in that description. The requirements are expressed in form ofconstraints on packet delivery rate (PDR) and delay, and areset on dataflows between tasks.
The tool includes support for mapping these task graphs onnetwork nodes, for macrocompilation of their code, and fortheir deployment both in simulated and real networks.
We implement a task allocation algorithm that efficientlyand optimally maps task graphs on networks while keepingthe mapping in bounds of user-defined constraints.
For the runtime, we provide an efficient flooding-basedprotocol that sets up tasks in the network. The supportingrun-time middleware (implemented for msp430 MCU basedsensor nodes) manages task-to-task communication, gathersapplication performance statistics and determines whether theconditions of the constraints hold, enabling run-time assur-ance. On failures, maintenance alert notifications are issued,and automated maintenance through task remapping is per-formed.
ProFuN TG is customizable: both user-defined tasks anduser-defined objective functions for task mapping are allowed.
The rest of this technical report includes a conceptualbackground (Section II); a high-level description of the tool(Section III); its architectural overview and a brief descrip-tion of its components (Section IV); an evaluation of thecomponents (Section V), and a comparison with related work(Section VI).
II. CONCEPTUAL FOUNDATIONS
A. Programming model
We adopt the Abstract Task Graph (ATaG) [1] macropro-gramming model, which builds on the dataflow programmingparadigm. The core concept of this programming model is thetask graph (Fig. 1a), a user-defined graph where the verticescorrespond to abstract tasks and edges denote dataflows be-tween these tasks.
1http://parapluu.github.io/profun/

(a) Task graph view (b) Network view
Fig. 1: The visual interface of ProFuN TG showing a heater control application with fire detection
An abstract task is a chunk of functionality with a fixedinterface, such as number of inputs and outputs. It is similarto a function in most programming languages. However, taskscommunicate exclusively by message passing; they do notshare state and cannot execute other tasks by using syn-chronous function calls. Tasks are annotated with properties,such as the firing rule (periodic or event-based), firing period,and the number of task copies to instantiate. Each abstract taskis instantiated on one or more sensor nodes.
An abstract dataflow is a link that connects a pair ofabstract tasks. All dataflows have scope: a property thatrestricts the maximal distance (in number of intermediate hopsor network regions) between the source and destination ina communicating pair of instantiated tasks. A dataflow mayalso have constraint properties that bound the acceptable PDRand packet delay values on this flow (Section II-C), numberof maximal retransmissions property, datarate property, andothers.
ATaG is a hybrid programming model: the high-level spec-ification is visual and declarative, while the low-level codeinside the tasks is textual and imperative. ProFuN TG taskcode is written in C.
ProFuN TG provides a number of predefined task typesin several categories: sensors, actuators, processing tasks,and other data I/O. Sensors typically produce data, actuatorsconsume data, and processing tasks take one or more inputdata items and convert them to one or more output data items.
While users are free to introduce their own types of tasksof any category by extending the tool, the predefined functiontask type is unique in the sense that it can be used implementfunctions specific to a single task graph using just the visualinterface. Users have to provide the name of the function, itsproperties (such as number of inputs and outputs), and its code.The code of a function task consists of several separate blocks,possibly empty, instantiated as separate C language functions:
• initialization;• periodic actions;
• input data item received;• cleanup.The initialization function is executed when the task is created.The periodic function is executed only for tasks with a periodicfiring rule; its frequency is determined by another property ofthe task. The input data item received function is executedwhen the task receives data from some other task, and cleanupis executed on termination. All types of tasks, including thepredefined ones, share this division of runtime functionality.
The task functions must run to completion; in other words,they are not interruptible by other tasks, and are not allowed tovoluntarily yield during execution. This limitation may seem tohinder implementation of asynchronous operations. However,there is a workaround that takes just a few lines of wrappercode. The idea is to start a thread (a protothread in Contiki OS)from a task’s initialization function and return immediately.The periodic function should either poll that thread to producedata items, or the thread can schedule itself to wake up whenneeded, and output data using ProFuN TG API. Finally, thetask’s cleanup function should destroy that thread.
B. Network model
ProFuN TG allows the user to interactively create and refinea model of the network and its environment (Fig. 1b).
The core of a network model is a set of sensor nodesconnected with radio links. The location of each node isspecified visually, by placing it on a background map. A nodealso has a number of other properties, such as its hardwareplatform and hardware components. In addition, user definedproperties (in name:value syntax) can be set. For example, theuser may specify one or more location properties, such as theroom and the building in which the node is located.
Each radio link has a number of properties that describe itsquality. In the absence of explicit configuration, link existenceand quality parameters are estimated by a network simulator.They can also be manually entered by the user, or collectedfrom the network by observing its performance. Examples

SimulationModels
Network &probability
TaskgraphOn-site surveys and
remote sensing
Past deployments
Initial design plans
Expert opinions
Available HW
Pilot deployments
Network
Designmodels
Collect constraint violation notificationsand performance statistics
Deploy models
Deploy models
Collectnotifications etc.
Fig. 2: Using ProFuN TG for iterative development workflow
of such properties include transmission success probabilityand delay value. We do not restrict the descriptions of theseproperties to their mathematically expected values (averages),but instead recognize that they are random variables, best de-scribed by probability distributions. For a motivating example,recall that packet delivery failures on wireless links are causedby several different reasons [3]. Some of these causes, such asinterference, lead to bursty packet losses, while others, such asa signal fading on weak links, do not exhibit this property asstrongly. Consider two imperfect network links, one of whichis interfered, while the other one suffers from signal fading.Assuming they have the same average PDR, the first one islikely to have far higher variance. Now assume a constraintthat bounds the maximal delay on a dataflow over a link. Sincethe end-to-end delay of retransmitted packets is dependent onPDR, this difference must be taken into account for such aconstraint.
C. Constraints
One of the key features of ProFuN TG is the support for userdefined, end-to-end constraints between source and destinationtasks. These constraints serve two roles.• Predictive: the task allocation algorithm takes the constraints
into account and will not produce mappings that violatesthem.
• Diagnostic: the runtime system continuously tests whetherconstraint conditions are met. In case this test fails on anode, that node notifies the central system, which then re-allocates the tasks.For each constraint, the user is allowed to specify the
minimal acceptable probability P with which it is predictedto hold in the task-mapping stage. For example, let us takeP = 0.98:
P(Delay < 3000ms) ≥ 0.98
P(PDR > 90%) ≥ 0.98
What does the probability P represent at runtime? Thereare at least two possible answers. The first is that the user iswilling to tolerate some violations at runtime, as long as theirproportional frequency is not higher than 1 − P . The secondis that P represents just the subjective uncertainty about the
model; for the runtime, the user wants guarantees that allcommunication will be within the bounds of the constraints,irrespective of the probabilities in the model.
The second interpretation leads to a simpler runtime check,but in some cases it is too restrictive. For example, the usermight not want to remap the source task (and possibly othertasks) just because a single packet failed to arrive within theexpected delay bounds. Therefore ProFuN TG offers to selectone of the two interpretations as a configuration option. Forthe first interpretation, statistically significant run-time tests areonly possible after certain amount of data has been gathered.This minimal-number-of-values is another user-configurableparameter.
III. PROFUN TG FUNCTIONALITY
Consider an example application: an indoor heating controlsystem extended with fire detection functionality (Fig. 1). Thisapplication has two sensing tasks: temperature and smoke,two actuation tasks: heater and alarm, and a data processingtask: threshold operation. Fire is detected when either a smokesensor is activated, or when temperature in a room exceeds apredefined threshold. The action taken by the system on fireis abstracted by the alarm task.
We assume the application is deployed in a building withseveral rooms, each of which has several sensor nodes.
The requirements of this application include:
• several types of nodes should be supported: a node equippedwith sensors and a node equipped with actuators;
• each room in the building should have at least one activeheater task;
• each heater task should receive input from at least twotemperature tasks located in the same room;
• each alarm task should receive data from a smoke sensor inthe same room, with delay smaller than 30 s with at least99.5 % probability;
• the energy consumed by the network should be minimized,as long as the constraints above are satisfied.
The bulk of the support that ProFuN TG provides to the usercan be separated in three distinct stages: node programming,task graph design & mapping, and task setup & maintenance.In the node programming stage firmware images are created

and programmed on network nodes. In the task graph de-sign and mapping stage application-level functionality is firstdescribed by the user, and then mapped on a model of thenetwork by the tool. In the task setup and maintenance stageapplication-level functionality is introduced in the network,and is reactively remapped in case the execution environmentor the physical environment changes.
The tool is designed for and supports an iterative develop-ment process (Fig. 2). For example, observing the operationof a real network may lead to changes in the network model,additional functional requirements to modification of the taskgraph, and hardware failures to reallocation of tasks.
A. Node programming
The programmer of WSN applications is faced with theproblem of configuration complexity. In a set of nodes that allrun the same application-level code many different configura-tions may be desired, for example:• System-level and network-level parameters (for example,
whether to retransmit packets on behalf of other nodes).• Node location, network address or ID number.• Per-node software correction settings for biased sensors.• Per-region application level settings, such as the by-default
desired temperature in the room in which the sensor nodeis located.
• Hardware components present on the node. Manual config-uration is typically required, as trying to initialize or use anon-existing hardware component may lead to suboptimalenergy usage or even a node reboot, and autodiscovery ofcomponents is impossible without hardware support.One solution is turn on or off functionality of a node
depending on its static network address or serial ID number.The problem with this approach is that on a larger number ofconfigurations the ID↔configuration mapping becomes hardto track, and laborious to modify. Clearly this approach doesnot scale. Furthermore, coexistence of nodes with differenthardware platforms in a single network is often desired; eachplatform typically requires a distinct compilation process toproduce its firmware.
ProFuN TG helps by automating this process by allowingthe user to describe the platform of each network node (froma pre-defined palette), and then to configure the nodes — tospecify their hardware components, their constant properties(included in the C source files from which the firmware is builtas C preprocessor directives), and the default values of theirvariables. Both template-based configuration of multiple nodesat once and configuration of a single node are supported.
Taking into account this configuration, ProFuN TG producesa firmware image for each node. The image is not required tobe unique – if several nodes share the same configuration,they all have indentical firmwares, so running a separatecompilation process is not required for each.
Finally, the produced firmware images are automaticallydeployed on sensor nodes. At the moment only wired pro-gramming is supported; however, there are no conceptual
obstacles against extending our approach with over-the-airreprogramming.
In the example application, the user starts by definingthe templates for sensing nodes and actuating nodes. Thedescription of these templates contain a list of hardwarecomponent drivers to be included in the firmware, and mayalso contain properties common to all or most of nodes, suchas the identifier of the building. Then the user defines constantproperties on each node, for example, room identifiers (a scalarproperty room_number), and also variables, such as thedesired temperature in a room. (Managing the runtime stateof these variables is not a part of ProFuN TG.)
B. Task graph design and mapping
The next difficulty of WSN application programming is todivide and setup the desired application-level functionality onall the nodes. At first, this task seems relatively straightforwardto perform even manually: the user first designates a few differ-ent roles of nodes, for example, sensing nodes, data processingnodes, actuating nodes, and then maps the functionality of theapplication on each node depending on its role.
However, the situation is complicated when specific rela-tions are desired. For instance, in our example application, theuser may want at least two distinct temperature sensor nodessending data to each heater node. Such a wish for redundantmeasurement sources is not atypical among WSN users; somecommon reasons are: (1) to provide the data consumers witha balanced view of the situation; (2) to allow to detect andignore measurement errors; (3) to increase the probability thatat least one of the sources successfully delivers the data; (4)to support applications that explicitly require redundant data,e.g. data collection for scientific studies.
ProFuN TG allows to configure these high-level relationseasily (i.e., once per network, not once per each pair of nodes),as well as to enforce the fact that these relations are meteverywhere in the network.
Furthermore, it allows to map tasks only to nodes with aspecific configuration. The user can write a binary predicatefor a task (i.e., a logical expression on node properties) whichis evaluated at design-time and functions as a filter on the setof nodes eligible to host the task.
The situation gets complicated even further if certain task-to-task reliability guarantees must be made between tasks,especially if they cannot be mapped on the same node. It isusually not possible to reduce these guarantees to a simplemetric such as number of hops between nodes, because thereare situations when a single bad link fails to deliver acceptablePDR, whereas a multihop path consisting of several good linkssucceeds. ProFuN TG combines the user-defined constraintswith the user-defined network model in order to automaticallydetermine optimal mappings of task pairs that are withinbounds of these constraints.
The network model used by ProFuN TG supports randomvariables, such as delay and PDR, defined on each linkof the network. The variables are described by probabilitydistribution functions. Both sums and mixtures of arbitrary

distributions are supported. For example, a network link mayhave a delay distribution that is sufficiently well approximatedby a single sharp peak at 0.5 sec with 60 % probability anda log-normally distributed tail of larger delays with 40 %probability and parameters µ = 0.6, σ = 1. ProFuN TGsupports the following syntax for writing down this examplemixture distribution:
Normal(0.5,0.0): 0.6, LogNormal(0.6,1): 0.4
Given the probability distribution functions (PDF) of in-dividual links, the task allocator estimates the cumulativedistribution functions (CDF) between each pairs of nodes inthe network. Given a particular constraint, it uses the pathCDF to check which mappings satisfy the condition of theconstraint (Fig. 3).
0 1 2 3 4 5 6Delay, sec
0.0
0.2
0.4
0.6
0.8
1.0
Prob
abilit
y
PDFCDFP=90%C=4.0sC=4.5s
Fig. 3: Probabilistic constraints on a log-normal delaydistribution. Given minimal probability P = 0.9, constraintswith delay value of C = 4 s are not satisfiable, whileconstraints with delay value C = 4.5 s are satisfiable (in themodel)
As an example, consider a maximal delay constraint. Theconstraint has two user-configured parameters: delay boundC and minimal probability P . A path from source node s todestination node d satisfies the constraint iff:
P(Delaypath(s,d) < C) ≥ P
By definition,
P(Delaypath(s,d) < C) = CDFPath(s,d)(C)
CDFpath(s,d)(C) =
∫ C
−∞PDFpath(s,d)(t)dt
Delay of a packet in sensor networks is heavily dependenton the number and quality of the links it has to cross. Thereforethe path delay distribution can be approximated as the sum ofits link delay distributions:
PDFpath(s,d) =∑
link∈ path(s,d)
PDFlink
where the sum is calculated as convolution of the link PDFfunctions.
Therefore to determine whether the path from s to dsupports dataflows with the specific constraint, ProFuN TG
evaluates:
CDFpath(s,d)(C) =
∫ C
−∞
∑link∈ path(s,d)
PDFlink(t)dt
Since in the general case the integral cannot be solvedanalytically, ProFuN TG uses numerical integration by MonteCarlo sampling to approximate its value.
In the case when the number of retranmissions is notinfinite, there is a non-zero probability that the packet is neverdelivered. To handle this case, the user should include anadditional mixture term in each link delay distribution. Theterm can be a single point with a very large value. For example,if the “infinity” floating point value defined by IEEE 754standard is used for this purpose, the path PDF is guaranteedto be above any finite constant C if a least one of the linksdrops the packet.
Once the set of the nodes suitable for a task has beendecided, that abstract task is mapped on one or more of thesenodes (depending on the number of copies desired) — in otherwords, it is instantiated in the model.
In the example application, the user starts by creatinga task graph for the application (Fig. 1). Then he createsa new constraint, describing the bound on the maximallyacceptable delay, and puts it on the relevant dataflows, suchas the dataflow between the smoke sensor and alarm actuator.
Then the user specifies task frequency properties. To fullfillthe requirements, he first must partition the network in regions– in this case, rooms. Partitioning is done by writing anexpression on node properties. These expressions must be inPython syntax, as they are evaluated by the Python interpreter.In the example, the expression is simply room_number,but more complex expressions are supported; they are noteven required to take scalar values; for example, the pair(building_number, room_number) is a valid expres-sion – given that both of these properties are defined on eachnode. Each partitioning expression completely seperates thenetwork in non-overlapping regions, so that all nodes in eachregion have the same value of the evaluated expression.
Once the expression is written, it is named (for example,“rooms”) and further referenced by its name. The user com-pletes his design by specifying that all dataflows are region-local, and, for each task, the number of desired copies perregion: two-per-room frequency for temperature tasks, one-per-room for all other tasks.
If a task requires specific hardware components or softwareconfiguration of a node, the user writes a binary predicate (inPython syntax) specifying these requirements. This predicateis evaluated on properties of each node, similarly to thepartitioning expressions.
C. Task setup and maintenance
When all of the abstract tasks have been the mapped onthe network model in a way that satisfies the user, he issuesthe “Deploy” command, which takes the mapped tasks one-by-one and instantiates them on network nodes that at thispoint are executing firmware images created in the first stage.

This step is done both on nodes connected by a cable andwirelessly; it is automated by the tool.
If desired, the complete model can also be executed forsome time in a simulation environment. In this way, the usercan see whether the constraints hold in the simulator. The restof this section also applies to simulated networks.
Task setup commands are generated by the gateway server,which then sends them to the gateway WSN node, which thenforwards them to the WSN. The following command typesare used: {add, remove} a task; set parameters for a task;{add, remove} a dataflow; {add, remove} a constraint; {add,remove} binding of a task on a node. The commands aresorted in classes to guarantee that, for example, a constraintcondition on a dataflow is not evaluated before the dataflowitself has been set up. All commands from a single classmust be acknowledged by destination nodes before commandsfrom the next class may be sent. The order of the classesare: (1) commands that remove constraints; (2) commandsthat instantiate dataflows; (3) all other commands, except (4)commands that add constraints. Dataflows are instantiatedbefore tasks are created in order to optimize performance inthe case when a flooding protocol is used to exchange thecommands. In that case, explicit task binding messages can beskipped, as the whole model is received by each node in thenetwork. However, keeping the whole model in the memorytypically is not feasible, so we allow a node to store only thosebindings that are relevant, i.e. only for tasks to which thereare some dataflows originated in the node.
As message loss is possible and probable in a WSN, allcommands of the task setup protocol are designed to beidempotent: i.e., receiving and processing the same commandmore than once has no effects.
Perhaps the biggest difficulty is to keep the network workingcorrectly. Sensor networks suffer from aggressive and chang-ing environmental conditions, software bugs, and hardwarefaults. Functionality-wise these faults can be grouped in threeclasses:
1) Sensor-level faults: sensor-reading functions returningerror values or invalid values.
2) Node-level faults: nodes rebooting, losing communicationcapabilities, or completely turning off, typically causedby insufficient remaining energy.
3) Link-level faults: links with no or severely degradedcapability for communicating data, typically caused eitherby interference or by radio signal fading.
While WSN operating systems can handle link and nodefailures through dynamic rerouting, they are unable to provideapplication-level end-to-end QoS guarantees because they lackapplication-specific information. Moreover, sensor level faultsare highly-application specific, and, even supposing the systemcan detect the fault in a node-level code, it is typically not ableto do anything about it other than returning an error code whenan application tries to read the sensor.
In contrast, the supporting run-time middleware of ProFuNTG gathers application performance statistics and determines
whether the conditions of the constraints hold, enabling main-tenance alert notifications, as well as automated maintenancethrough task remapping.
In this way, link-level faults are detected and handled. Sincea node-level fault implies effects similar to a link-level faults(no network traffic on dataflows routed through this node), wedo not handle them separately. The performance predictionalgorithm at the task-mapping stage also does not take intoaccount node-level faults for now; this is motivated by theobservations that in WSN node-level faults are much morerare than link faults, and that the node-to-node variance in aWSN is much smaller than the link-to-link variance, at leastin homogenous networks under normal conditions.
Since sensor-level faults are application specific, we do notoffer any functionality to detect them at the middleware level.Applications can detect them instead inside the application-specific task code. The middleware API then can be used tosend an alert message to the base station requesting that theoffending sensor on that specific node is marked as bad, andthe task is remapped. However, not all faults can be detectedat WSN node level. More computationally and data-intensivefault detection can be done on server-side hardware, by usingeither application-specific or third party tools. ProFuN TGprovides an HTTP API through which these tools can: (1)continuously poll the gateway server instance for sensor data,and (2) send alert notifications directly to the front-end,requesting sensor blacklisting and task remapping in case afault is detected.
D. Discussion
Infering the probability distributions from data is a well-known topic in statistics and machine learning still underactive research. In our case, standard statistical methods canbe used, such as the expectation-maximization algorithm [4]to find the maximum likelihood mixture of distributions foreach link based on its past performance data. The inferencealgorithm is not included in the tool itself, as choosing theright parameters for inference algorithms and interpreting theresults may require significant domain expertise and manualtweaking. It would be naıve to try to propose a general-purposealgorithm for inference that does not take into account thespecifics of different applications, networks, environments, anddifferent user requirements.
Instead, we offer a fairly general model format that canincorporate both network-level properties (such as Tx successrate) and higher-level properties (such as the delay distribution)for each link 2.
An important aspect specific to wireless communicationis the time-varying nature of link QoS. Often the changesare periodic and, to some extent, predictable, especially foroutdoor WSNs [5]. Since the user who sets QoS constraints ismostly interested in the worst-case performance, we proposethat the worst-period data on a link should be used to construct
2The format is documented in http://parapluu.github.io/profun/files/profun-schema.json

the link’s delay and PDR distributions. Finding the optimalwindow size (period length from which to take the data forconstructing the distributions) is in our list of immediate futurework.
IV. ARCHITECTURE AND COMPONENTS
executes
model allocation
NodeJS server (JS)
•Permanent storage•Library of examples
NodeRED
Faulty data detector• Outlier detection algorithms
Third-party tools
Frontend (JS)
•User interface (web)
NodeRED
Task allocator (C++)
•Routing estimation•Task mapping
Gecode
Gateway (Python)• Serial comm. with the gateway node• Web comm. with: • frontend • backend server • third-party tools
Database / cloud• Data storage and retrieval
Simulator (Java)
•Radio models•Network simulation
MSPsim
Middleware (C)•Task management•Runtime communication•Gathering of stats
Contiki
Data visualisation • Graphing interface
model
net status,constraints
measurements
network
radio links
tasks
measurements
net status,dynamic
constraints
dynamicconstraints
model firmware
Fig. 4: Architectural overview
Under the hood, ProFuN TG uses a number of well-known software tools and libraries: Contiki for system-levelfunctionality, Cooja for network simulation and as a genericinterface to platform-specific firmware compilers, Gecode 3
for constraint solving (used in the task allocation algorithm).For the visual frontend, an adapted version of Node-RED 4 isemployed.
ProFuN TG joins these components in a distributed mi-croservice architecture (Fig. 4 ). The components communicateby passing asynchronous JSON requests through HTTP, withthe exception of the WSN middleware, which uses an efficientbinary data format. The distributed nature of the tool meansthat each of the four main components (frontend web server,task allocator daemon, gateway server, and network simulator)can be run on a separate computer as long as they are in thesame network, or, alternatively, are connected to the Internet.
Since an HTTP message may time out at any point, thesystem must remain reliable under presence of lost and dupli-cate messages. Furthermore, we want the system to be able totransparently handle restarts of components. These propertiesis achieved by periodically (by default, every second) exchang-ing the whole model between the components. Thanks to the
3http://www.gecode.org4http://nodered.org
compact JSON data format, periodically exchanging the wholemodel is feasible, given a broadband connection; for example,a 100 node network with 20 tasks is described by just a 12 KBlarge JSON file.
The tool provides an HTTP interface for data export inJSON format. Through that interface, third-party tools canaccess the data, as well as impose dynamic constraints onthe task mapping algorithm. This enables integration with theplethora of existing fault detection tools and software libraries.
To provide a working example, we demonstrate [6] how toapply a Principal Component Analysis based fault detectionalgorithm [7] that automatically infers acceptable covariancebounds from a historical data training set and is able torecognize faulty data by detecting abnormal variance usingthese bounds. More generally, platforms such as The UniversalTranslator (UT3) [8] can be used an a adapter to commercialand custom Fault Detection and Diagnostic (FDD) tools.
A. Frontend
The frontend consists of a web interface implemented inHTML5 and JavaScript, and a nodejs web server written inJavaScript.
The web interface allows the user to design the applicationin the task graph view (Fig. 1a). The user starts the designprocess by dragging task templates from palette in the leftside of the view on the main editor window. After that, he isfree to edit the properties of each task — for example, specifyits firing period —, and to link the tasks together by dataflows.
In a similar fashion the interface allows to create and editthe network model: nodes and communication links betweenthem. Finally, it allows to visually observe how the task graphis mapped on the network by the task allocation algorithm(Fig. 1b), as well as to trigger the allocation manually byissuing the “Allocate” command.
The web server stores the persistent state of the completemodel. The user loads this state when connecting to the server,and can overwrite it with an updated version that includes hisedits by issuing the “Save” command. Collaborative editingis not possible, but collaborative viewing of the dynamicstate of the network model is, in principle, supported by thisarchitecture.
The frontend also functions as a communication hub for therest of the non-WSN side of the system, as shown in (Fig. 4).
B. The task allocator
The task allocation takes place in two stages (Fig. 5).First, the input model is validated and preprocessed by a
Python daemon. Then, the daemon executes a C++ applicationusing the preprocessed model as an input. The role of this C++application is to utilize the Gecode search API to find one ofthe globally optimal solutions to the task mapping problem.
The role of the preprocessor is to evaluate the predicates andpartitioning expressions. If a task has a user-defined predicatespecified in its properties, the predicate is evaluated on eachnode. If it fails on a node n, then n is added to the list of thenodes on which the task cannot be mapped.

FrontendPre-
processor(Python)
Task allocator(C++)
modelvalidatesthe model
evaluatespredicateson properties
sets derivedproperties
preprocessedmodel approximates
routing
allocatestasksmapping
of tasksmappingof tasks
-
Fig. 5: Process sequence for mapping the tasks to nodes
Frontendclient-side
Frontendserver-side
SEALcompiler
Simulatorinterface
nodelist
SEAL filescompilesSEAL to C
upload status
Gatewayserver
components& properties
of nodes
parametrizedMakefiles
parametrizedC files
retrievesandevaluatesfiletemplates
C files
programsconnectednodes
buildsfirmware
C files and Makefiles
firmware images
firmware images
Fig. 6: Process sequence for programming the nodes
Hardware component requirements play role similar to therole of predicates, but they are used directly by the C++ code.
The separation between the daemon and the search algo-rithm gives an additional benefit: increased robustness. Crashesin the C++ application (for example, because of an errorin user’s supplied objective function) do not destabilize thewhole system, as the crashed C++ application is simplyterminated, after which the Python daemon logs and reports atask allocation failure.
In future work, we also plan to extend the approach bystarting multiple search algorithms with different strategiesin parallel as multiple C++ application instances. As theevaluation (Section V-A) shows, no algorithm or strategyconsistenly dominates all other on every problem instance.On the other hand, it also shows that the fastest approach isoften at least an order of magnitude faster than others, eventhe second best.
FrontendGatewayserver
Gatewaynode
Targetnode
model witha new task
calculateschanges fromold state
createsa list ofcommands
savesnew state
ACKreception
"add task"command
ACK
initializesthe task
"add task"command
forwardscommands
ACKdelivery
Fig. 7: Process sequence for setting up a new instance of atask in the network
The pseudocode of the subsequent process is given inAlgorithm 1 .
The CREATEUSERCOPIES function makes the user-configured number of copies for each task. For example, if thetask is configured with per-node frequency, a copy is createdon each node that meets the component requirements.
The SIMPLIFY function reduces the size of the graph byseparating tasks in equivalence classes and replacing all tasksin each equivalence class with just one task. Several tasks areput in the same equivalence class if they always are going tobe mapped to the same node. For now, there are two caseswhen this equivalence is assumed for tasks u and t: (1) whenall I/O dataflows and component requirements of t and u arethe same; (2) when component requirements of t is a supersetof requirements for u, t has no other outputs except to u, andu no other inputs, and either no outputs, or an output to tasksin the same equivalence class. Other simplifications can beadded in the future. In general, there is a tradeoff between thedegree of the simplification and the fidelity of the allocationresult, in particular when a user-defined objective function isused.
The result of the BRANCHINGORDER function determinesthe order in which the search tree is processed. It is highlysignificant for the overall speed of the algorithm, and will bediscussed below.
The BRANCHANDBOUND function uses the Gecode APIto execute a branch-and-bound search algorithm. The searchprocess iteratively generates and tests mappings. For themappings that satisfy all constraints, the algorithm determinesthe “goodness” of the mapping by evaluating the objectivefunction supplied as an argument. The mappings on whichthe objective function reaches its minimal value are calledoptimal. Gecode search is guaranteed to return one of theseoptimal mappings.
By default, the objective function that the search algorithmattempts to minimize is the total energy consumption of the

Algorithm 1 The task allocation algorithmfunction ALLOCATETASKS(T,N,C,OF,MaxDup)
. T – tasks, N – nodes, C – constraints. OF – the objective function
. MaxDup – max number of auto-created duplicatesT ′ ← CREATEUSERCOPIES(T )
. Creates a user-configured number of copies for each taskT ′′ ← SIMPLIFY(T ′)
. Squashes groups of symmetrical tasksSP ← FLOYDWARSHALL(N )
. SP – shortest paths from node to nodereturn ALLOCATEINTERNAL(T ′′, N, SP,C,OF,MaxDup)
end function
function ALLOCATEINTERNAL(T,N, SP,C,OF,MaxDup)permissible← ∅. permissible – satisfying mappings for concrete task pairs
for source ∈ T dofor destination ∈ source.destinations do
for (SN,DN) ∈ N ×N domapping ← (source→SN , destination→DN )if ∀c ∈ C: SATISFIES(mapping, c) then
permissible← permissible ∪mappingend if
end forend for
end for
order ← BRANCHINGORDER(T )BestMapping ←
BRANCHANDBOUND(T,N, SP, order, permissible, OF ). Find the optimal solution using Gecode
if BestMapping = ∅ AND MaxDup > 0 then. Auto-duplicate tasks
T ′ ← Tfor source ∈ T do
for destination ∈ source.destinations doif (source, destination) /∈ permissible then
T ′ ← T ∪ DUPLICATE(source)end if
end forend forBestMapping ←
ALLOCATEINTERNAL(T ′, N, SP,C,OF,MaxDup−1)end if
return BestMappingend function
network. It is calculated as the sum of costs of all dataflows inthe network. (This particular objective function assumes thattask invocation costs are the same on all nodes, so they make aconstant term that can be factored out.) The cost of a dataflowis defined as the sum of the costs of all links the dataflow hasto cross (according to pre-computed shortest path information)to get from the node on which the source task is mapped tothe node on which the destination task is mapped. The shortestpath algorithm uses an abstract metric supplied in the networkmodel for each link; it may be simple hop count or ETX.
A few other predefined objective functions are available,
such as: “minimize the maximal energy consumption for nodesin the network”, and “maximize the least remaining energyafter a user-defined time period”. The users can also supplytheir own objective functions by writing their code in theinterface.
Using Gecode API, we prune the search tree as early aspossible to avoid fully generating mappings that cannot bebetter than the best mapping already found. The consequenceis that the search algorithm should be designed to start withmapping the part of the task graph that is least likely to change.
Therefore relatively good performance is expected if thealgorithm starts the mapping process with the most central,highly connected and heavily constrained tasks. However,there are different notions of centrality, and different centralitymeasures of a node in a graph, such as: degree of the node,closeness, etc. A promising measure in our case is eigenvaluecentrality; using it to order branch selection leads to muchbetter results than random ordering (Section V-A).
For a vertex (task) x eigenvalue centrality xv in graph G isdefined as:
xv =1
λ
∑t∈M(v)
xt =1
λ
∑t∈G
av,txt
where A is the adjacency matrix of the task graph, M(v) isthe set of neighbors of v, and is the greatest eigenvalue of A:
Ax = λx
The values xv for all tasks are calculated during the prepro-cessing stage of the task allocation algorithm, using iterativeapproximation.
The mapping order of the allocator is determined by sortingtasks in decreasing order by merit value: meritv = xv + a · cvwhere cv is the number of constraints on task v, and a is aconstant.
We implemented the BRANCHINGORDER function thatreturns this mapping order; the result of this function is usedinternally by Gecode.
C. Interface to the network simulator
The interface is implemented as a plugin for Cooja [9].The frontend periodically sends (by default, once per second)a network model and options to the plugin, which thenconstructs a network in Cooja corresponding to that model.The options include details such as transmission successprobability, maximal transmission distance, and which one ofthe predefined Cooja radio models to use. The potential radiolinks and their quality indicators are estimated by Cooja inreal time; this information is collected and sent back to thefrontend.
The second function of this interface is to control the execu-tion of the task graph application in the simulated network. Ex-ecution is started and stopped depending on user’s commands.The gateway server accesses the simulated network in the sameway a physical network is accessed. We use the Serial2Ptyplugin to construct a virtual serial port for the gateway node,to which the gateway server then connects.

D. MacrocompilerWe use two-stage compilation (Fig. 6 ). The first stage
takes templates of C source files and C code build scripts(Makefiles) and evaluates them using Jinja2 templatinglibrary, replacing template patterns in the files with variablessupplied by the frontend. The result of this first stage is amain.c file and a Makefile for each type of firmwareimage.
The second stage is the regular compilation process thatgenerates hardware-specific executable images. This process isoutsourced to the Cooja simulator, which is capable of buildingarbitrary applications, given a build script and source files.Briefly put, this stage compiles and links together the just-generated main.c file, the ProFuN TG middleware library,and Contiki system code to create a different firmware imagefor each type of node.
Hardware components are included and excluded from thefirmware images by using build script commands. Each plat-form provides a sensible set of hardware components enabledby default. Node properties specified in the visual interfaceare included in the compilation environment and seen by allsource files a C preprocessor directives.
The users of ProFuN TG are not limited by the softwarecomponents available out of the box. For one, they can writetheir own components. For another, they can use one ofthe two function components on the palette. Through thesecomponents, flow-specific functionality can be implemented.
Functions can be programmed directly in C, but they canalso be programmed in SEAL [10], a WSN-specific node-level programming language. SEAL comes with its ownmiddleware library whose functionality is partly orthogonal tothat of ProFuN TG middleware. For example, it implementscustom scheduling mechanisms on top of Contiki timers andprotothreads. It also implements commonly required functions,such as logical and arithmetical operations, data filtering andaggregation functions, etc.
Programming tasks in SEAL has a number of benefits:• a task is not required to be partitioned in three distinct
functions;• writing a task does not require knowledge of the middleware
C API;• advanced functionality (e.g. periodic self-scheduling of the
task) is comparatively much simpler to implement;• the code cannot cause the whole system to misbehave or
even reboot because of an accidental infinite loop in thecode: it is impossible to write non-interruptible loops inSEAL.Thus the ATaG architecture allows to join tasks written
in multiple programming languages in a single task graph.We are also evaluating other programming languages forprogramming the functions, such as Ceu [11], another node-level programming language that is compiled to C code.
E. Gateway serverThe gateway server is a Python daemon that acts as interface
between the sensor network and the rest of the system. The
server is intended to run on border routers, for example,in our testbed deployment (Section V-D) we put them onRaspberry Pi nodes. Each active gateway server instance has1:1 correspondence with a WSN node connected through theserial port.
When the user issues the “Deploy” command, the frontendsends the complete model to the gateway server instance. Themodel in this case includes the task mapping. The server, aftersuccessfully receiving this model, compares it with the last onereceived and determines the changes between them. For thefirst received model, an empty previous model is assumed.From these changes, an ordered list of commands is created(see Section III-C). Each command also includes the addressof the node on which it must be processed. The commandsare, one by one, formatted as binary messages and sent to theconnected WSN node (Fig. 7). Each binary message includesa single-byte checksum to ensure its integrity. Each commandmay be retransmitted by the gateway server several times untilan ACK is received.
Each command is processed by the connected node. Com-mands with bad CRC are rejected. Otherwise, in case thecommand is addressed to the node itself, a reply ACK is sentimmediately. In case it is addressed to some other node in thenetwork, the command is forwarded to target node, possiblymultiple times, until a network ACK is received from thetarget. After that, the directly connected node responds with aserial ACK to the gateway server.
The gateway WSN node also receives data messages andstatus messages, such as constraint condition violation alerts,and forwards them to the server. Status messages describe thedynamic state of the network model; they are forwarded to thefrontend server. Data are temporary kept in a RAM cache andalso optionally logged in a file. Custom or third party toolscan access the data in the RAM by issuing an HTTP JSONrequest.
F. Middleware
The middleware is a C library built on top of Contiki OS. Itmanages the runtime state of the task graph and also includesmsp430-specific implementations of predefined tasks.
The middleware initially used Contiki Rime protocol stack.There are three distinct traffic patterns it handles:• gateway to nodes (mesh protocol);• nodes to gateway (collect protocol);• task to task (mesh protocol, easily replaceable with
application-specific protocols).The first pattern is used to set up tasks and other dynamic stateon network nodes. The second pattern is used to send dataand status messages from the network to the gateway node.The third pattern is used by application-specific dataflowsdescribed by the task graph.
We extended the Rime mesh protocol by adding reliabilitysupport in form of retransmissions. Nevertheless, we discov-ered that the mesh protocol suffers from severe scalabilityproblems for gateway-to-node traffic. Setting up a task on aremote node requires reliable end-to-end transport for the task

message, and then also for the end-to-end acknowledgement.Setting up another task on a neighboring node requires almostcompletely repeating the process. The CSMA-based MACprotocol leads to severely reduced performance if many end-to-end messages have to be exchanged in a short time period.This scenario is very typical for the initial setup of the wholetask graph on the network, as well as for complete remapping.
A network flooding protocol such as Trickle [12] wouldlead to more efficient communications. However, using itwould require keeping a copy of the complete task graph onthe flash memory of each node. It would lead to increasedimplementation complexity, require energy for accessing theflash, and could wear it out in short time in dynamic networks.
The solution implemented in the current version of ProFuNTG is a Glossy [13] based scheduler, which replaces Rimefor the first two traffic patterns. The scheduler is completelygateway-controlled. It has support for two phases: periodicschedule phase, in which all nodes can originate messagesto gateway periodically, and target-specific traffic phase, inwhich only the gateway originates messages periodically,while nodes originate message only if they have data to sendand the gateway has explicitly scheduled them to do so. Theperiodic schedule phase is suitable for the initial setup ofthe task graph, and for collection of alert and data messagescoming from nodes en masse. The target-specific phase issuitable for making minor adjustments to the task graph, andis significantly more energy efficient. Setting up a task on asingle node in this phase is much faster, as the node sends anACK immediately, without waiting up to several seconds forits periodic schedule slot. However, when in this phase, nodesmay have to use other protocols (such as collect) to send datato the gateway on their own initiative.
The benefits of a flooding protocol-based solution are alsoclear from a more theoretical perspective. The purpose of thetask setup algorithm is to achieve consistency in the network,while not sacrificing availability properties. According to theCAP (Consistency, Availability, Partition tolerance) principle[14], the system is therefore vulnerable to partitioning of thenetwork. The single-path routing used by mesh protocol ismuch more likely to introduce transient partitioning of therouting tree, compared with the probability to have multiplepartitions in the multi-path flooding graph.
Since Glossy is not by default capable of coexisting withContikiMAC, the latter was extended with inactivity period,during which it does not attempt to send packets or listen tothe radio. The duration and the frequency of these periods arecontrolled by the Glossy scheduler at runtime.
An additional benefit from the Glossy-based scheduler isfor-free time synchronization on all nodes. Since we needsynchronized clocks in order to measure end-to-end delaysin the runtime phase, by running Glossy we avoid the need tohave a separate time-synchronization protocol.
The middleware uses Contiki timing events to schedule theexecution of periodic tasks, and a custom Contiki process eventto notify event-based tasks about incoming of new data. Inboth cases, there is just one handler process that receives all
the events, and based on them and task state determines whichtask callbacks should be executed.
Last but not least, the middleware is responsible for detect-ing violations of constraint conditions. To do that, it keepstrack of the performance history for each constraint on eachactive data flow at its destination node.
There are two different implementation approaches to run-time checks of a data flow:• Windowed approach. A buffer containing the last n time se-
ries values is kept and dynamically updated. The algorithmdoes not take into account any values beyond this window.
• Moving average approach. A scalar value containing anaggregate of the whole observed time series data is keptand updated.In our case, the window approach is only feasible for PDR
history. Single-bit-per packet memory requirement means thatkeeping a window of delivery history of last n packets with2-byte sequence numbers requires just dn/8e + 2 bytes. Incontrast, keeping a window of packet delay history (2-bytevalues, non-compressible in the general case) requires 2nbytes; keeping, for example, n = 100 values for each delayconstraint would be prohibitively expensive on nodes withlimited RAM.
As a consequence, delay history performance is estimatedusing the EWMA algorithm, while PDR performance is esti-mated using either EWMA or a windowed approach. Both thewindow size and the α value of EWMA (the decay rate) areuser configurable parameters.
A dataflow packet is detected as “not received” when aperiodic timeout timer for that dataflow is fired. This creates aproblem for tracking PDR and delay on event-based dataflows.Following the ideas of Wu et al. [15], our approach is to trackPDR on such dataflows by simulating the event on the sourcenode and sending the produced data to the destination task asusual, only different in the way that the data in that packetare marked as “test-only”. These test packets are received andprocessed by the middleware normally, with the exception ofthe last step: they are not fed as inputs to the destination task.Since sending these test packets takes significant energy, it isdone only when the user has explicitly configured to do so inaddition to placing the constraint.
V. EVALUATION
A. The task allocator
Optimal task allocation is a combinatorial problem withexponential-sized search space, therefore domain-specificheuristics are believed to be neccessary to make the searchfeasible.
We compare the performace of our task allocation algorithmwith that of Bijarbooneh et al. [16], as well as with the greedyalgorithm by Pathak et al. [17].
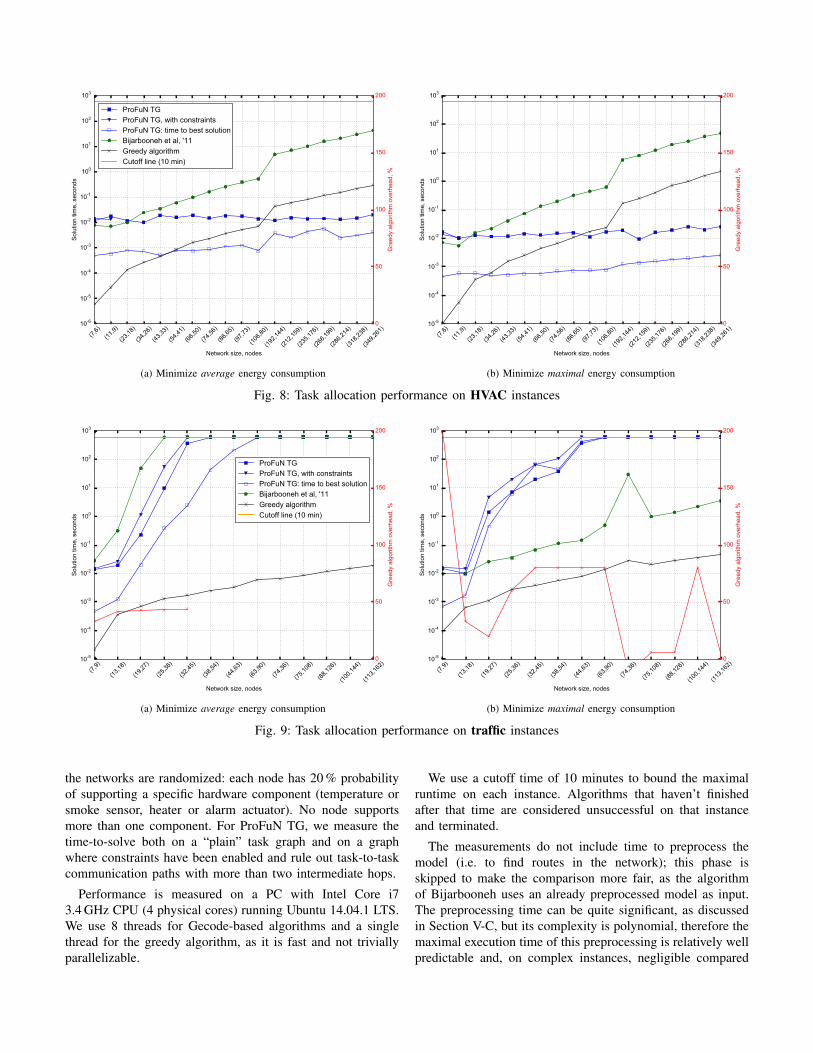
We reuse the test instances from these two papers, andmeasure performance on HVAC and traffic application taskgraphs, as well as for the task graph of the example application(Section III) in N × N grid networks. Node capabilities in
(7,6)
(11,9)
(23,18
)
(34,26
)
(43,33
)
(54,41
)
(66,50
)
(74,56
)
(86,65
)
(97,73
)
(106,8
0)
(192,1
44)
(212,1
59)
(235,1
76)
(266,1
99)
(286,2
14)
(318,2
38)
(349,2
61)
Network size, nodes
10-6
10-5
10-4
10-3
10-2
10-1
100
101
102
103
Solu
tion
time,
sec
onds
ProFuN TGProFuN TG, with constraintsProFuN TG: time to best solutionBijarbooneh et al, '11Greedy algorithmCutoff line (10 min)
0
50
100
150
200
Gre
edy
algo
rithm
ove
rhea
d, %
(a) Minimize average energy consumption
(7,6)
(11,9)
(23,18
)
(34,26
)
(43,33
)
(54,41
)
(66,50
)
(74,56
)
(86,65
)
(97,73
)
(106,8
0)
(192,1
44)
(212,1
59)
(235,1
76)
(266,1
99)
(286,2
14)
(318,2
38)
(349,2
61)
Network size, nodes
10-5
10-4
10-3
10-2
10-1
100
101
102
103
Solu
tion
time,
sec
onds
0
50
100
150
200
Gre
edy
algo
rithm
ove
rhea
d, %
(b) Minimize maximal energy consumption
Fig. 8: Task allocation performance on HVAC instances
(7,9)
(13,18
)
(19,27
)
(25,36
)
(32,45
)
(38,54
)
(44,63
)
(63,90
)
(74,36
)
(75,10
8)
(88,12
6)
(100,1
44)
(113,1
62)
Network size, nodes
10-5
10-4
10-3
10-2
10-1
100
101
102
103
Solu
tion
time,
sec
onds
ProFuN TGProFuN TG, with constraintsProFuN TG: time to best solutionBijarbooneh et al, '11Greedy algorithmCutoff line (10 min)
0
50
100
150
200
Gre
edy
algo
rithm
ove
rhea
d, %
(a) Minimize average energy consumption
(7,9)
(13,18
)
(19,27
)
(25,36
)
(32,45
)
(38,54
)
(44,63
)
(63,90
)
(74,36
)
(75,10
8)
(88,12
6)
(100,1
44)
(113,1
62)
Network size, nodes
10-5
10-4
10-3
10-2
10-1
100
101
102
103So
lutio
n tim
e, s
econ
ds
0
50
100
150
200
Gre
edy
algo
rithm
ove
rhea
d, %
(b) Minimize maximal energy consumption
Fig. 9: Task allocation performance on traffic instances
the networks are randomized: each node has 20 % probabilityof supporting a specific hardware component (temperature orsmoke sensor, heater or alarm actuator). No node supportsmore than one component. For ProFuN TG, we measure thetime-to-solve both on a “plain” task graph and on a graphwhere constraints have been enabled and rule out task-to-taskcommunication paths with more than two intermediate hops.
Performance is measured on a PC with Intel Core i73.4 GHz CPU (4 physical cores) running Ubuntu 14.04.1 LTS.We use 8 threads for Gecode-based algorithms and a singlethread for the greedy algorithm, as it is fast and not triviallyparallelizable.
We use a cutoff time of 10 minutes to bound the maximalruntime on each instance. Algorithms that haven’t finishedafter that time are considered unsuccessful on that instanceand terminated.
The measurements do not include time to preprocess themodel (i.e. to find routes in the network); this phase isskipped to make the comparison more fair, as the algorithmof Bijarbooneh uses an already preprocessed model as input.The preprocessing time can be quite significant, as discussedin Section V-C, but its complexity is polynomial, therefore themaximal execution time of this preprocessing is relatively wellpredictable and, on complex instances, negligible compared

0 200 400 600 800Network size, nodes
10-6
10-5
10-4
10-3
10-2
10-1
100
101
102
103
Solu
tion
time,
sec
onds
ProFuN TGProFuN TG, with constraintsProFuN TG: time to best solutionBijarbooneh et al, '11Greedy algorithmCutoff line (10 min)
0
100
200
300
400
500
Gre
edy
algo
rithm
ove
rhea
d, %
(a) Minimize average energy consumption
0 200 400 600 800Network size, nodes
10-5
10-4
10-3
10-2
10-1
100
101
102
103
Solu
tion
time,
sec
onds
0
100
200
300
400
500
Gre
edy
algo
rithm
ove
rhea
d, %
(b) Minimize maximal energy consumption
Fig. 10: Task allocation performance on randomized grid networks with example application’s task graph
AC
Bdatarate=2
datarate=1
(a) Task graph
A-capable B & C-capable
A & B-capable
1 2
3(b) Network 1
A-capable B & C-capable
A & B-capable
1 2
3
metric=1
metric=1000
(c) Network 2
Fig. 11: Counterexamples for the greedy algorithm. Given (a) task graph, the algorithm either (b) fails to produce a feasibletask mapping, or (c) produces a very suboptimal mapping
with time required to find the optimal mapping.The results (Fig. 10) show that for the example application
task graph, the ProFuN TG algorithm executes within tenseconds even on very large networks,
Overall, ProFuN TG algortihm has much better performancethan Bijarbooneh et al.’s algorithm for the AVERAGEENERGYobjective function. One reason for this could be the fact thatBijarbooneh’s algorithm is not a parallelizable: during thesearch process, we typically observed only one CPU corehaving full load, while ProFuN TG algorithm typically used all8 cores. We speculate that due to using a more intricate modelstructure, Bijarbooneh’s algorithm creates interdepencies be-tween search threads that lead to blocking waits. However, thespeed difference of our algorithms on many instances goes farbeyond the constant factor of 8.
In contrast, for the MAXENERGY ojective function Bijar-booneh’s algorithm is typically better, and in gives feasibleresults on all instances, except a few of the largest gridnetwork instances. According to private communication withthe author, it is explained by the fact their model successfullyexploits the properties of this objective function, while theAVERAGEENERGY objective function does not permit similargains at the level of the model.
Search on a graph with constraints on grid networks leadsto en even faster performance of ProFuN TG algorithm, asthese constraints reduce the number of candidate mappingsthat need to be evaluated. However, for all the HVAC instances(Fig. 8), except the two simplest ones, this constraint is tootight and causes no satisfactory solutions to be found at all.Also, Fig. 9b shows that MAXENERGY objective function ontraffic instances is an exception: constrained searh is slowerthere.
More complex task graph instances (Fig. 9) create problemsfor the branch-and-bound algorithm, making it prohibitivelyslow on large networks.
The time-to-search until the optimal solution usually ismuch smaller than the time to prove the optimality of thesolution found. However, in a few isolated instances (e.g.traffic task graph 45 tasks in a network with 32 nodes) itis consistenly higher than the time of the full search. Wespeculate that this anomaly is a measurement artifact, and thatthe performance hit comes from evaluation of the extra ifstatement that compares the value of the objective functionwith the optimal value, which is passed as argument. The ifstatement is conditionally included in program code, and iscompiled only for the time-to-best-solution tests.

The solutions that the greedy algorithm produces are oftenclose to the optimal, and its performance is even better thanthat of ProFuN TG algorithm — and, more importantly,its time complexity is always guaranteed to be polynomial.For example, it gives perfect solutions for HVAC instances,and 40 % median error for traffic instances. This is not asurprise, as the test instances were created by Pathak et al.to showcase the algorithm [17]. However, simple instancesexist on which the greedy algorithm gives arbitrary worseresults, or even fails to find a feasible solution. For example,in the network depicted in Fig. 11b, the greedy algorithm willstart by mapping tasks A and B on node 3. That node isdisconnected from the rest of the network. Since there areno more arrows pointing in our out of B, this task is nevergoing to be remapped to node 2. Therefore, wherever task Ais placed, it is not going to be able to communicate with bothB and C at the same time. The greedy algorithm is goingto find a feasible mapping in Fig. 11c; however, it is goingto be many times worse than the optimal solution found bythe tree search. We can conclude that the greedy algorithm isnot a reliable replacement for full-scale search even in simplenetworks.
The recommended method in practice is therefore to runthe full tree-search algorithm with a user-specified timeoutas a configuration option. If the algorithm terminates beforethe timeout, it has found an optimal solution. If it does not,the solution found at that point may already be the best (thealgorithm just has not proved its optimality yet), or fairly closeto it, as evidenced by the “time to best solution” line in thefigures.
B. Runtime system
The runtime system is feasible on low-power msp430 MCUbased sensor nodes: excluding Contiki system code, the Glossyscheduler, and implementations of pre-defined tasks, the mid-dleware with the default configuration settings uses 1.4 KB ofRAM and 6.6 KB of flash memory. The runtime state of asingle task uses 30 bytes of RAM, so up to approximatelyhundred tasks can be instantiated in a single Tmote Sky-like node. Additionally, each outgoing connection to a localtask uses 6 bytes of RAM, to a remote task: 16 bytes, eachconstraint: 26 bytes.
To evaluate dynamic performance we compare a Rimemesh-based and a Glossy-based implementations of the taskmanagement protocol. We use the Cooja simulator, and reportthe average performance of 10 runs. For Rime mesh, wecompare the performance of two cases: (1) all nodes start withempty routing tables, and (2) static routes are pre-installedalong the forwarding path. The second approach leads tohigher performance, but it is not going to scale, as sensornodes do not have enough RAM to hold the complete networkrouting table in memory. For Glossy, we compare 4-second(“default”) and 1-second (“fast”) round time. The defaultGlossy round length is selected to give similar radio duty cycleto Rime for these tests. Each Glossy round has a maximum
1
2
3
3
3
3
3
2
2
2
3
1
1
2
3
S1
S2 D
0GW
node radiocoverage
Fig. 12: Example of a 16-node grid network with uniformradio coverage. The numbers on nodes describe number ofhops to gateway. GW: gateway node, D: destination node, S1:initial source node of a dataflow, S2: source node after taskremapping. Straight arrows: task setup message path for nodeD; curved arrows: task-to-task dataflows
of 14 flooding slots: 6 for the gateway, 8 for maximum of 4nodes.
To minimize the number of random variables for which tocontrol, we use a simple and fixed network topology: N ×Ngrids, where all radio links have 80 % Rx success probability.
First, we measure the time to setup a single task on anode N hops away from the gateway (Fig. 12). Then we alsomeasure the time to set up a single, but unique task on each ofthe nodes. We start the timer when the gateway sends out thefirst “create task” message. We end the first type of test whenthe gateway receives ACK message from the single destinationnode, and the second when ACK is received from all nodes.The gateway tries to resend the “create task” message for eachtask once every 15 sec until it receives an ACK; if no queuespace is available (maximal queue size is set to 6 packets), itwaits for a second and retries. For Rime mesh, we limit eachmessage to maximum of 15 hop-to-hop retransmissions, andotherwise use the default Contiki settings.
For a single task, the default periodic Glossy-based sched-uler shows (Fig. 13a) better performance than Rime in almostall networks, as well as more predictable delivery times.However, Glossy is also capable of setting up a task on each ofnodes in less than 2 min on all networks, showing much betterscalability. Rime, in constrast, is already not able to do thistask within our 10 min cutoff time on 49-node networks, sowe do not evaluate it on larger networks. Furthermore, whenGlossy with target-specific schedule is used, the time-to-setupbecomes independent of the network size and diameter: theflooding protocol causes all nodes to receive all messages inany case.
Another nice property of the flooding protocol is thatreducing its period leads to proportional performance increase.Its schedule could be made several times tigher than our “fast”scheduler without risking introduction of wireless mediumcontention, so the user is free to choose an application-specifictradeoff between performance and energy consumption. Theperformance of Rime, in contrast, is known not to scalelinearly with increased duty cycle.
We also measure the time to reallocate a single task after

0 20 40 60 80 100Number of nodes
0
20
40
60
80
100
120
140
Con
verg
ence
tim
e, s
econ
ds
Rime stackRime stack, static routesRime stack, tasks on all nodesGlossy-based scheduler, default periodic scheduleGlossy-based scheduler, target-specific scheduleGlossy-based scheduler, tasks on all nodesGlossy-based scheduler, fast periodic scheduleGlossy-based scheduler, fast target-specific scheduleGlossy-based scheduler, fast, tasks on all nodes
(a) Task setup
0 20 40 60 80 100Number of nodes
0
50
100
150
Con
verg
ence
tim
e, s
econ
ds
Rime stackRime stack, static routesGlossy-based scheduler, default periodic scheduleGlossy-based scheduler, target-specific scheduleGlossy-based scheduler, fast periodic scheduleGlossy-based scheduler, fast target-specific schedule
(b) Task reallocation
Fig. 13: Performance of the task management protocol. Error bars show standard deviation divided by 2
a failure detection (Fig. 13b). The scenario involves movinga source task from node S1 to node S2, and is completelycontrolled by the gateway server. The timer in this scenariois started when the destination node D sends out the alertmessage and stopped when the gateway succesfully receivesan ACK from S2. This scenario is harder for the Glossy-basedprotocol, but nevertheless, target-specific schedule with thedefault period is competitive with static routing, and schedulewith the fast period is significantly better.
To summarize radio duty cycle measurements, for the rep-resentative 25-node test case the 10-run averaged average andmaximal radio-on proportion is 3.22 %/6.82 % for Rime for asingle task, 2.47 %/5.43 % for Rime all tasks, 2.79 %/5.43 %for Glossy for a single task, 3.80 %/4.61 % for Glossy alltasks, and 8.4 %/22.4 % & 13.0 %/15.0 % for Glossy withfast schedule, respectively. However, since the all-task setupduration is 13.7 times smaller for Glossy (with default roundperiod) compared to Rime, the actual average radio-on timeis 13.7×2.47
3.8 = 8.9 times smaller for Glossy!Overall, the flooding protocol emerges as a clear winner for
the task setup stage.
C. Frontend
The system as such is capable of handling large networks,as long as the task graph is relatively simple. Figure 14 showsthe performance of the frontend depending on the size of thenetwork.
Time-to-redraw (Fig. 14a and 14c ) is measured when thewhole network is visible on screen simultaneously. As it canbe seen, the performance is above the cinema gold standard
of 24 frames per second even for a 1000-node network, andremains close to that for a 700-link network with 100 nodes.
Task allocation performance (Fig. 14b and 14d ) is depen-dent mostly on the speed of the task allocation algorithm; thetime for other processing and delay due to TCP interprocesscommunication overhead are relatively small even on largenetwork instances. In the test, we use a simple task graphconsisting of two connected tasks and require that a copy ofeach pair is setup on every network node. For larger networksthe time to calcute the shortest-path routing tables is the mainbottleneck. We use the Floyd-Warshall algorithm, which hasO(|N |3) complexity, where N is the set of nodes. For a1000-node network the whole process takes approximately oneminute.
D. Constraint status prediction accuracy
We focus on evaluating our model rather than our imple-mentation. The core question is “given a specific constraint andnetwork’s performance history data, with what accuracy canwe predict that the constraint is going to hold in that networkin near future?”
We use simulations based on packet traces on links in our17-node testbed deployed in our office building in UppsalaUniversity (Fig. 15). We started by running a link discoverytest in the testbed. The test included packet broadcast burstsfrom each node in turn, scheduled in round-robin fashion.Each burst included sending 10 000 packets, 84 bytes each, andlasted approximately one minute. The PDR of each broadcastwas logged in each receiver node, both the cumulative value ofthe whole burst and the PDR in increments of 100 packets. In

0 200 400 600 800 1000Number of nodes
0
10
20
30
40
50
60
70
Tim
e, m
s
Redraw time
(a) Network view redraw time
0 200 400 600 800 1000Number of nodes
0
10000
20000
30000
40000
50000
60000
70000
Tim
e, m
s
Allocation time
(b) Task allocation time
0 200 400 600 800 1000Number of links
0
10
20
30
40
50
60
70
Tim
e, m
s
Redraw time
(c) Network view redraw time
0 200 400 600 800 1000Number of links
0
50
100
150
200
250
Tim
e, m
s
Allocation time
(d) Task allocation time
Fig. 14: User interface latency on large network instances. For (c) and (d), networks with 100 nodes are used
Fig. 15: Our testbed deployment, shown in ProFuN TG network view
this way, we discovered 24 bidirectional radio links with >1 %average PDR. We ran this test for approximately 3 weeks, aweek for each for IEEE 802.15.4 radio channels 15, 20, and26.
For the evaluation of the tool, initially 3 nodes were selectedfor the roles of heater actuators. Each had 3 temperature sensornodes sending data to them with 15 second period. On thedataflows we put constraints on maximal delay (C = 2000ms,P = 98.5%). We measured raw packet delivery rate in thenetwork in for 24 hours on 3 different radio channels. Atleast 490 000 packets were sent on each of the 9 links in each
period. These traces were input to a simulator, in which theapplication was simulated 10 times for each link for the 24hour period, and the condition of the constraint evaluated onceevery minute. It was satisfied in 72.3 % of test cases.
We evaluate a few simple prediction algorithms (Fig. 16),trying to see if the constraint is going to hold 30 min in future.We did not fix any distribution-from-data inference algorithm,but instead operated on raw delay data. Any aggregation wouldlose information and decrease the prediction accuracy; onthe other hand, more advanced prediction algorithms couldcounteract that.

90 92 94 96 98 100Positive support, %
0
20
40
60
80
100
Neg
ativ
e su
ppor
t, %
Keep currentWorst of previous 1hWorst of previous 3hAt most 10 bad in 3hMoving averageEWMA
(a) C = 1000ms, radio channel 26
90 92 94 96 98 100Positive support, %
0
20
40
60
80
100
Neg
ativ
e su
ppor
t, %
Keep currentWorst of previous 1hWorst of previous 3hAt most 10 bad in 3hMoving averageEWMA
(b) C = 1000ms, radio channel 20
90 92 94 96 98 100Positive support, %
0
20
40
60
80
100
Neg
ativ
e su
ppor
t, %
Keep currentWorst of previous 1hWorst of previous 3hAt most 10 bad in 3hMoving averageEWMA
(c) C = 1000ms, radio channel 15
90 92 94 96 98 100Positive support, %
0
20
40
60
80
100
Neg
ativ
e su
ppor
t, %
Keep currentWorst of previous 1hWorst of previous 3hAt most 10 bad in 3hMoving averageEWMA
(d) C = 2000ms, radio channel 26
90 92 94 96 98 100Positive support, %
0
20
40
60
80
100
Neg
ativ
e su
ppor
t, %
Keep currentWorst of previous 1hWorst of previous 3hAt most 10 bad in 3hMoving averageEWMA
(e) C = 2000ms, radio channel 20
90 92 94 96 98 100Positive support, %
0
20
40
60
80
100
Neg
ativ
e su
ppor
t, %
Keep currentWorst of previous 1hWorst of previous 3hAt most 10 bad in 3hMoving averageEWMA
(f) C = 2000ms, radio channel 15
Fig. 16: Constraint status prediction accuracy for 30 min in future
For the overall accuracy (averaged across the three differ-ent radio channels), simple “output the current state of theconstraint” algorithm is not beaten: 95.74 % accuracy (5.47percentage point standard deviation). However, we want thepredictor to have conservative bias, so the proportion of falsepositives is an even more important metric. We generate adatastream consisting on the number of out-of-bounds delaysfor a tighter constraint with a bound C = 1000ms. To thatdatastream we apply per-hour moving average and EWMAalgorithms (α = 0.1); the first gives 0.59 % false positiveswith overall accuracy above 90 %; the second 0.41 % falsepositives while keeping it above 80 %.
Trying to predict 1 h into the future gives approximatelytwice as inaccurate results overall. The results suggest thattask remapping is going to be required often.
VI. RELATED WORK
A. Programming model
There is a large body of work on high-level programmingfor sensor networks; however, tolerance to failures has beennoted [18] as an open research issue.
We chose ATaG as the underlying formalism because itnaturally allows to increase dependability of sensornet appli-cation: at runtime, by remapping tasks to other nodes in caseof failure, and at design time, by allowing the programmer touse redundant hardware nodes for additional copies of tasks.
We depart from the canonical ATaG programming model [1]by simplifying the dataflow programming language. In partic-ular, we do not include support for Abstract Data Items as first-class values. This simplifies the semantics of the application,but makes it impossible to specify more advanced types ofinterfaces between tasks (namely, the parent-child aggregationrelationship). We find that this change is justified becausehaving a language-level support for aggregation relationships,something not typically used in every application, imposessignificant cost on almost all applications. Consider an ap-plication with just four tasks that are all directly connected.Our approach requires just 10 elements to fully specify thisapplication (4 tasks and 6 dataflows); ATaG requires 4 tasks,6 data items, and 12 dataflows: 22 elements in total. Thiscomplexity increase is a hefty cost for a feature that is notuniversally required.

Another capability that was lost because of this simplifica-tion is the ability to exert finer control of the semantics ofindividual data flows: ATaG allows flows to be either pull-based or push-based; in contrast, from the point of ProFuNTG tasks, all communications are push-based. Nevertheless,this potential problem is mitigated by the fact that the run-time system of ProFuN TG may itself be implemented in apull-based fashion, for example, using the publish-subscribeparadigm, where the receiver task is the one that initiates datacollection from all connected sender tasks. We are working onsuch an implementation.
Our additions to ATaG have been already described (SectionII-A). The include the support for reliability requirements,as well as support for regioning the network based on nodeproperties.
B. Related tools
Srijan toolkit [19] is a graphical ATaG macroprogrammingsystem. In contrast to our work, it is missing the featuresintroduced by the constraints: both the predictive aspect atdesign time, and the diagnostic aspect at runtime. Furthermore,in Srijan, tasks in must be implemented in Java programminglanguage and require JVM at runtime.
There are other tools with functionality which to someextent overlaps with ours: high-level programming environ-ments [20] for WSN, deployment and experimentation supportsystems [21] [22], and runtime assurance systems [23], butthey all lack automated algorithms for task allocation. As forsensor data storage, processing and visualization frameworkssuch as SicsthSense, they complement the functionality of ourtool.
The user interface of ProFuN TG is adapted from Node-RED. However, not only we added the network model, theconstraints, and the macrocompilation and deployment system,we also do not share their run-time system that is implementedin JavaScript, therefore requires interpreter support and HTTPcommunication plane at runtime.
C. Reliability and efficiency aspects
We took the general idea of user-defined probabilistic end-to-end constraints from Bijarbooneh et al. [2]. The maindifference between these two models lies in the fact thattheir model included probability distributions on links betweentasks, while our has them on network links. As a result, theirdesign-time constraint satisfaction checker cannot differentiatebetween a dataflow on a single-hop path, and a dataflowbetween tasks separated by a multiple hops, while our task-mapping algorithm takes the number of hops into account.
Energy-efficient task mapping for WSNs has already beenexplored in detail [17] [16] [24]. Our main contribution hereis an optimal mapping algorithm with considerably improvedperformance.
D. System design
WSN are typically treated as decentralized systems. Nev-ertheless, our work is far from unique in treating them in
conjunction with a powerful centralized server-side function-ality. The approach adapted here has roots in industrial controlsystems [25].
Specifically in WSN, the approach has been seen not only intask-allocation tools, but also in run-time assurance systems[15] [23], and tools for network-wide parameter adaptation[26] [20]. Another notable example is the WirelessHARTprotocol stack that uses centralized scheduling mechanismsand is an industry standard [27].
In particular, the seminal work by Ferrari et al. [13] onGlossy, which demonstrated how simultaneous transmissionscan be used to transfer data in WSN using commercial off-the-shelf sensor node hardware, opened many new doors for cen-tralized systems, ranging from more efficient data collection[13] and dissemination [26], to generic network-wide com-munication primitives [28], to network-wide synchronizationguarantees [29].E. Granularity and types of tasks
The task graphs we envision as typical for WSN applica-tions do not contain tasks with small granularity. This is incontrast to visual dataflow programming languages such asLabVIEW [30], which use separate processing elements evenfor elementary operations such as Boolean functions AND,OR, and NOT. First, expressing every operation visually hasbeen shown to reduce readability of the representation [31].Second, and perhaps more to the point in WSN context, eachtask requires a significant amount of run-time state. Usingseveral tens of bytes of RAM for each application-level logicaloperation is prohibitively expensive on a system that has justa few kilobytes of RAM in total.
We also eschewed the support for predefined tasks forgeneric data aggregation operations. Even though implement-ing such a generic task functionality for calculating e.g.arithmetical average of multiple inputs may seem trivial,in real-world applications this kind of aggregation has todeal with faulty and missing data, which makes the desiredsemantics far from clear. For example, should the faulty databe detected by applying a threshold? An absolute value orvalue relative to the readings of other sensors? Should thereadings be clustered and the largest cluster assumed to bethe correct one? Or something different still [32]? Should amissing data item be replaced with the latest non-faulty valuefrom the same sensor? An average value of other sensors? Avalue predicted by some kind of model? These choices areapplication specific, therefore building a universal middlewarelevel data aggregation block is not possible.
VII. CONCLUDING REMARKS
ProFuN TG enables design of task graph applications thatare aware of data quality requirements. It achieves that byallowing the user to write PDR and delay constraints ondataflows between tasks. The tool also enables deploymentand maintenance of these applications in WSN by providingmiddleware that manages the runtime state of tasks and con-straint conditions, and triggers reallocation in case a constraintviolation is detected.
Our evaluation shows that the allocation algorithm canproduce optimal task mappings in an acceptable time (up to aminute) even on very large networks (hundreds of nodes). Inaddition, the task setup protocol can instantiate runtime taskson tens of nodes within a minute, making the reallocationapproach feasible in hard-to-predict, constantly changing real-world environments.
In future work we will look at how the central systemand the runtime middleware can work together to adapt thenetwork for the QoS requirements without resorting to taskreallocation. We will also look at how the task-to-task commu-nication can be made more predictable by using technologiessuch as the Low Power Wireless Bus (LWB) [28].
ACKNOWLEDGMENTS
The authors acknowledge support from SSF, the SwedishFoundation for Strategic Research.
Thanks to Farshid Hassani Bijarbooneh and Martin Jacobs-son for sharing their ideas and code, to UU IT department stu-dents (Andreas Moregard, Simon Young, and Per Ackermann-Bostrom) for the initial implementation of the middleware,and to Hongbin Liu for pointing out how to use principalcomponent analysis for sensor fault detection.
REFERENCES
[1] A. Bakshi, V. Prasanna, J. Reich, and D. Larner, “The Abstract TaskGraph: a methodology for architecture-independent programming ofnetworked sensor systems,” in Proceedings of the 2005 workshopon End-to-end, sense-and-respond systems, applications and services.USENIX Association, 2005, pp. 19–24.
[2] F. H. Bijarbooneh, A. Pathak, J. Pearson, V. Issarny, and B. Jonsson, “Aconstraint programming approach for managing end-to-end requirementsin sensor network macroprogramming,” in SENSORNETS, 2014, pp. 28–40.
[3] F. Hermans, H. Wennerstrom, L. McNamara, C. Rohner, and P. Gunning-berg, “All Is Not Lost: Understanding and Exploiting Packet Corruptionin Outdoor Sensor Networks,” in Wireless Sensor Networks. Springer,2014, pp. 116–132.
[4] T. K. Moon, “The expectation-maximization algorithm,” Signal process-ing magazine, IEEE, vol. 13, no. 6, pp. 47–60, 1996.
[5] H. Wennerstrom, F. Hermans, O. Rensfelt, C. Rohner, and L.-A. Norden,“A long-term study of correlations between meteorological conditionsand 802.15.4 link performance,” in SECON, 2013, pp. 221–229.
[6] A. Elsts, F. H. Bijarbooneh, M. Jacobsson, and K. Sagonas, “DemoAbstract: ProFuN TG: A Tool Using Abstract Task Graphs to Facilitatethe Development, Deployment and Maintenance of Wireless Sensor Net-work Applications,” in Poster and Demo Proceedings of 12th EuropeanConference on Wireless Sensor Networks (EWSN 2015), 2015.
[7] V. Venkatasubramanian, R. Rengaswamy, S. N. Kavuri, and K. Yin, “Areview of process fault detection and diagnosis: Part iii: Process historybased methods,” Computers & chemical engineering, vol. 27, no. 3, pp.327–346, 2003.
[8] P. Haves, “The universal translator - a freeware platform for third partydiagnostic algorithms.” [Online]. Available: http://utonline.org
[9] F. Osterlind, A. Dunkels, J. Eriksson, N. Finne, and T. Voigt, “Cross-level sensor network simulation with Cooja,” in Local Computer Net-works, Proceedings 2006 31st IEEE Conference on. IEEE, 2006, pp.641–648.
[10] A. Elsts, J. Judvaitis, and L. Selavo, “SEAL: a Domain-Specific Lan-guage for Novice Wireless Sensor Network Programmers,” in Proceed-ings of the 39th EUROMICRO Conference on Software Engineering andAdvanced Applications (SEAA). IEEE, 2013, pp. 220–227.
[11] F. Sant’Anna, N. Rodriguez, R. Ierusalimschy, O. Landsiedel, and P. Tsi-gas, “Safe system-level concurrency on resource-constrained nodes,”in Proceedings of the 11th ACM Conference on Embedded NetworkedSensor Systems. ACM, 2013, p. 11.
[12] P. A. Levis, N. Patel, D. Culler, and S. Shenker, Trickle: A self regulatingalgorithm for code propagation and maintenance in wireless sensornetworks. Computer Science Division, University of California, 2003.
[13] F. Ferrari, M. Zimmerling, L. Thiele, and O. Saukh, “Efficient networkflooding and time synchronization with Glossy,” in Information Process-ing in Sensor Networks (IPSN), 2011 10th International Conference on.IEEE, 2011, pp. 73–84.
[14] E. A. Brewer, “Towards robust distributed systems,” in Keynote speechat PODC, vol. 7, 2000.
[15] Y. Wu, K. Kapitanova, J. Li, J. A. Stankovic, S. H. Son, and K. White-house, “Run time assurance of application-level requirements in wirelesssensor networks,” in Proceedings of the 9th ACM/IEEE InternationalConference on Information Processing in Sensor Networks. ACM,2010, pp. 197–208.
[16] F. H. Bijarbooneh, P. Flener, E. Ngai, and J. Pearson, “Energy-efficienttask-mapping for data-driven sensor network macroprogramming usingconstraint programming,” in Proc. of the 12th INFORMS ComputingSociety Conference, 2011, pp. 1–13.
[17] A. Pathak and V. K. Prasanna, “Energy-efficient task mapping for data-driven sensor network macroprogramming,” Computers, IEEE Transac-tions on, vol. 59, no. 7, pp. 955–968, 2010.
[18] L. Mottola and G. Picco, “Programming wireless sensor networks:Fundamental concepts and state of the art,” ACM Comput. Surv., vol. 43,no. 3, pp. 19:1–19:51, Apr. 2011.
[19] A. Pathak, Q. Zhou, and V. Prasanna, “Srijan: A graphical toolkit for wsnapplication development,” in The 4th IEEE International Conference onDistributed Computing in Sensor Systems (DCOSS08), 2008, pp. 34–39.
[20] J. Eriksson, N. Finne, L. Mottola, and T. Voigt, “Final Run-Time SystemIncluding Self-Optimization,” Technical Report of makeSense project(7th Framework Programme), SICS, 2013.
[21] R. Figura, M. Ceriotti, C.-Y. Shih, M. Mulero-Pazmany, S. Fu,R. Daidone, S. Jungen, J. J. Negro, and P. J. Marron, “Iris: Efficientvisualization, data analysis and experiment management for wirelesssensor networks,” EAI Endorsed Transactions on Ubiquitous Environ-ments, vol. 14, no. 3, 11 2014.
[22] R. Leone, J. Leguay, P. Medagliani, C. Chaudet et al., “MakeSense:Managing Reproducible WSNs Experiments,” Fifth Workshop on Real-World Wireless Sensor Networks, 2013.
[23] M. L. Fairbairn, I. Bate, and J. A. Stankovic, “Improving the dependabil-ity of sensornets,” in Distributed Computing in Sensor Systems (DCOSS),2013 IEEE International Conference on. IEEE, 2013, pp. 274–282.
[24] B. Billet and V. Issarny, “From Task Graphs to Concrete Actions: A NewTask Mapping Algorithm for the Future Internet of Things,” in MASS- 11th IEEE International Conference on Mobile Ad hoc and SensorSystems, Philadelphia, United States, Oct. 2014.
[25] S. A. Boyer, SCADA: supervisory control and data acquisition. Inter-national Society of Automation, 2009.
[26] M. Zimmerling, F. Ferrari, L. Mottola, T. Voigt, and L. Thiele, “pTunes:Runtime parameter adaptation for low-power MAC protocols,” in Pro-ceedings of the 11th international conference on Information Processingin Sensor Networks. ACM, 2012, pp. 173–184.
[27] A. N. Kim, F. Hekland, S. Petersen, and P. Doyle, “When HART goeswireless: Understanding and implementing the WirelessHART standard,”in Emerging Technologies and Factory Automation, 2008. ETFA 2008.IEEE International Conference on. IEEE, 2008, pp. 899–907.
[28] F. Ferrari, M. Zimmerling, L. Mottola, and L. Thiele, “Low-powerwireless bus,” in Proceedings of the 10th ACM Conference on EmbeddedNetwork Sensor Systems. ACM, 2012, pp. 1–14.
[29] ——, “Virtual synchrony guarantees for cyber-physical systems,” inReliable Distributed Systems (SRDS), 2013 IEEE 32nd InternationalSymposium on. IEEE, 2013, pp. 20–30.
[30] “LabVIEW System Design Software.” [Online]. Available: http://www.ni.com/labview/
[31] T. R. Green and M. Petre, “When visual programs are harder to readthan textual programs,” in Human-Computer Interaction: Tasks andOrganisation, Proceedings of ECCE-6 (6th European Conference onCognitive Ergonomics). GC van der Veer, MJ Tauber, S. Bagnarola andM. Antavolits. Rome, CUD, 1992.
[32] M. Ceriotti, M. Corra, L. D’Orazio, R. Doriguzzi, D. Facchin, S. Guna,G. Jesi, R. Cigno, L. Mottola, A. Murphy et al., “Is there light at theends of the tunnel? Wireless sensor networks for adaptive lighting inroad tunnels,” in Information Processing in Sensor Networks (IPSN),2011 10th International Conference on. IEEE, 2011, pp. 187–198.