Embed Size (px)
Citation preview

TECHNICAL REPORT NO. TR-2014-19
APRIL 2014
US ARMY MATERIEL SYSTEMS ANALYSIS ACTIVITY
ABERDEEN PROVING GROUND, MARYLAND 21005-5071
DISTRIBUTION A: APPROVED FOR PUBLIC RELEASE; DISTRIBUTION IS UNLIMITED.
IAW Memorandum, Secretary of Defense, 27 December 2010, Subject: Consideration of Costs in DoD Decision-Making, the
cost of the study resulting in this report is $4,000,000.
ARMY INDEPENDENT RISK ASSESSMENT
GUIDEBOOK

DESTRUCTION NOTICE
Destroy by any method that will prevent disclosure of contents or reconstruction of the
document.
DISCLAIMER
The findings in this report are not to be construed as an official Department of the Army
position unless so specified by other official documentation.
WARNING
Information and data contained in this document are based on the input available at the
time of preparation.
TRADE NAMES
The use of trade names in this report does not constitute an official endorsement or
approval of the use of such commercial hardware or software. The report may not be cited for
purposes of advertisement.

i
REPORT DOCUMENTATION PAGE Form Approved
OMB No. 0704-0188 Public reporting burden for this collection of information is estimated to average 1 hour per response, including the time for reviewing instructions, searching existing data sources, gathering and maintaining the data needed, and completing and reviewing this collection of information. Send comments regarding this burden estimate or any other aspect of this collection of information, including suggestions for reducing this burden to Department of Defense, Washington Headquarters Services, Directorate for Information Operations and Reports (0704-0188), 1215 Jefferson Davis Highway, Suite 1204, Arlington, VA 22202-4302. Respondents should be aware that notwithstanding any other provision of law, no person shall be subject to any penalty for failing to comply with a collection of information if it does not display a currently valid OMB control number. PLEASE DO NOT RETURN YOUR FORM TO THE ABOVE ADDRESS.
1. REPORT DATE (DD-MM-YYYY) APRIL 2014
2. REPORT TYPE Technical Report
3. DATES COVERED (From - To)
4. TITLE AND SUBTITLE
ARMY INDEPENDENT RISK ASSESSMENT GUIDEBOOK 5a. CONTRACT NUMBER
5b. GRANT NUMBER
5c. PROGRAM ELEMENT NUMBER
6. AUTHOR(S)
Thomas Bounds; Andrew Clark; Todd Henry; John Nierwinski; Suzanne
Singleton; Brian Wilder
5d. PROJECT NUMBER
5e. TASK NUMBER
5f. WORK UNIT NUMBER
7. PERFORMING ORGANIZATION NAME(S) AND ADDRESS(ES)
Director
US Army Materiel Systems Analysis Activity
392 Hopkins Road
Aberdeen Proving Ground, MD
8. PERFORMING ORGANIZATION REPORT NUMBER
TR-2014-19
9. SPONSORING / MONITORING AGENCY NAME(S) AND ADDRESS(ES) 10. SPONSOR/MONITOR’S ACRONYM(S)
11. SPONSOR/MONITOR’S REPORT NUMBER(S)
12. DISTRIBUTION / AVAILABILITY STATEMENT
DISTRIBUTION A: APPROVED FOR PUBLIC RELEASE; DISTRIBUTION IS UNLIMITED.
13. SUPPLEMENTARY NOTES
14. ABSTRACT This report presents the US Army's approach to Risk Assessments for Army Acquisition programs, with a focus on
Technical and Schedule Risk. This report addresses in detail the complete breadth of Technical and Schedule Risk
Assessment methodologies employed in the conduct of these Risk Assessments, to include the Quick-Turn and Full
simulation-based Technical Risk Assessments, as well as the estimation-based Quick-Turn Schedule Risk
Assessment and the analogous program-based Schedule Risk Data Decision Methodology. A Software Risk
Assessment methodology is also presented. Examples are provided for all approaches.
15. SUBJECT TERMS
16. SECURITY CLASSIFICATION OF: 17. LIMITATION OF ABSTRACT
18. NUMBER OF PAGES
19a. NAME OF RESPONSIBLE PERSON
a. REPORT
UNCLASSIFIED
b. ABSTRACT
UNCLASSIFIED
c. THIS PAGE UNCLASSIFIED
SAME AS
REPORT
19b. TELEPHONE NUMBER (include area
code)
Standard Form 298 (Rev. 8-98) Prescribed by ANSI Std. Z39.18

ii
THIS PAGE INTENTIONALLY LEFT BLANK.

iii
CONTENTS
Page
LIST OF FIGURES ............................................................................................................ v LIST OF TABLES ............................................................................................................. vi ACKNOWLEDGEMENTS .............................................................................................. vii LIST OF ACRONYMS ................................................................................................... viii
1. EXECUTIVE SUMMARY ................................................................................................ 1 1.1 Summary. ................................................................................................................ 1
2. INTRODUCTION .............................................................................................................. 4 2.1 Preface..................................................................................................................... 4 2.2 Background. ............................................................................................................ 4
3. KEY DEFINITIONS, TERMS, AND PRINCIPLES ......................................................... 6 3.1 Technical Risk. ....................................................................................................... 6
3.1.1 Full Approach. ............................................................................................. 6
3.1.2 Quick-Turn Approach. ................................................................................ 6 3.1.3 Data Resolution. .......................................................................................... 6
3.2 Schedule Risk.......................................................................................................... 7
3.2.1 Full Approach. ............................................................................................. 7 3.2.2 Quick-Turn Approach. ................................................................................ 7 3.2.3 Data Resolution. .......................................................................................... 8
3.3 Cost Risk. ................................................................................................................ 8 3.4 Risk Assessments vs. Risk Management. ............................................................... 8
3.5 Technology Readiness Level. ................................................................................. 9 3.6 Integration Readiness Level. ................................................................................. 10 3.7 Manufacturing Readiness Level. .......................................................................... 10
3.8 Performance Assessment. ..................................................................................... 10
3.9 Risk Reporting Matrix. ......................................................................................... 11 4. RISK ASSESSMENTS FOR ARMY ACQUISITION STUDIES ................................... 13
4.1 Process. ................................................................................................................. 13
4.2 Risk Workshop...................................................................................................... 13 5. TECHNICAL RISK ASSESSMENT ............................................................................... 15
5.1 Background. .......................................................................................................... 15 5.2 Purpose. ................................................................................................................. 15 5.3 Quick-Turn Approach. .......................................................................................... 15 5.4 Full Approach. ...................................................................................................... 16
5.4.1 Step 1: Identify technologies for each alternative. .................................... 17
5.4.2 Step 2: Gather relevant technology and alternative information............... 17 5.4.3 Step 3: Secure SME support for readiness level assessment. ................... 17
5.4.4 Step 4: SMEs assess TRL, IRL, and MRL for each technology. .............. 17 5.4.5 Step 5: Identify technical risks, risk ratings, and mitigations. .................. 20 5.4.6 Step 6: SMEs identify key technologies. .................................................. 22 5.4.7 Step 7: Conduct risk workshop. ................................................................ 22 5.4.8 Step 8: Determine technical risk rating for each key technology. ............ 23
5.4.9 Step 9: Perform sensitivity analysis on the risk rating. ............................. 25 5.5 Validation. ............................................................................................................. 25 5.6 Data Development. ............................................................................................... 25

iv
CONTENTS
Page
5.7 Data Sources. ........................................................................................................ 26 5.8 Responsibilities. .................................................................................................... 26 5.9 Example. ............................................................................................................... 26
5.9.1 Step 1: Identify technologies for each alternative. .................................... 26
5.9.2 Step 2: Gather relevant technology and alternative information............... 27 5.9.3 Step 3: Secure SME support for readiness level assessment. ................... 27 5.9.4 Step 4: SMEs assess TRL, IRL, and MRL for each technology. .............. 28 5.9.5 Step 5: Identify technical risks, risk ratings, and mitigations. .................. 28 5.9.6 Step 6: SMEs identify key technologies. .................................................. 29
5.9.7 Step 7: Conduct risk workshop. ................................................................ 30 5.9.8 Step 8: Determine technical risk rating for each key technology. ............ 31
5.9.9 Step 9: Perform sensitivity analysis on the risk rating. ............................. 32
6. SCHEDULE RISK ASSESSMENT ................................................................................. 33 6.1 Background. .......................................................................................................... 33 6.2 Purpose. ................................................................................................................. 33
6.3 Analogous Programs. ............................................................................................ 33 6.4 Quick-Turn Approach. .......................................................................................... 33
6.4.1 Quick-Turn Approach Example. ............................................................... 34
6.5 Full Approach. ...................................................................................................... 34 6.5.1 Full Schedule Risk Modeling Approach Example .................................... 36
6.6 Data Development. ............................................................................................... 36 6.7 Data Sources. ........................................................................................................ 36 6.8 Responsibilities. .................................................................................................... 37
6.9 Schedule Risk Modeling. ...................................................................................... 37
7. SOFTWARE RISK ASSESSMENT ................................................................................ 38 7.1 Background. .......................................................................................................... 38 7.2 Limitations in Applying Army Methodologies..................................................... 38
7.3 Software System Risk Assessment Example. ....................................................... 39 8. SUMMARY ...................................................................................................................... 42
APPENDIX A – TECHNOLOGY READINESS LEVEL (TRL) .............................................. A-1 APPENDIX B – INTEGRATION READINESS LEVEL (IRL) ............................................... B-1 APPENDIX C – MANUFACTURING READINESS LEVEL (MRL) ..................................... C-1 APPENDIX D – SAMPLE RDEC TECHNICAL RISK ASSESSMENT GUIDANCE ........... D-1 APPENDIX E – METHODOLOGY FOR SUPPORTING DATA SUFFICIENCY IN RISK
ASSESSMENTS .......................................................................................................................... E-1 APPENDIX F – DATA ALLOCATION ISSUES ...................................................................... F-1
APPENDIX G – DISTRIBUTION LIST ................................................................................... G-1

v
LIST OF FIGURES
Figure No.
Title Page
Figure 1. DOD Risk Management Process .....................................................................................9 Figure 2. Risk Reporting Matrix ...................................................................................................11 Figure 3. Army Independent Risk Assessment Process Flow ......................................................13 Figure 4. TRL/MRL/IRL Mapping ...............................................................................................19 Figure 5. TARDEC Risk Recon Tip Sheet ...................................................................................21
Figure 6. Notional Quick-Turn Schedule Risk Assessment Example ..........................................34 Figure 7. SRDDM Process Flowchart ..........................................................................................35 Figure 8. Notional Schedule Risk Assessment Results ................................................................36 Figure 9. Software Risk Assessment Process Flowchart ..............................................................40
Figure 10. Risk Level Determination ............................................................................................41

vi
LIST OF TABLES
Table No.
Title Page
Table 1. Specific Technical Risk Example .....................................................................................7 Table 2. Likelihood Level Criteria................................................................................................11 Table 3. Consequence Level Criteria ............................................................................................12 Table 4. Notional Quick-Turn Technical Risk Assessment Results .............................................16 Table 5. Technologies for Air Defense System 1 Alternative ......................................................27
Table 6. Organizations for Potential SME Support ......................................................................28 Table 7. Readiness Level Assessments .........................................................................................28 Table 8. Identified Technical Risks ..............................................................................................29 Table 9. Identified Key Technologies ...........................................................................................29
Table 10. Technology Maturity Assessment Results ....................................................................30 Table 11. Transition Time Estimates ............................................................................................30
Table 12. Consequence Level Assessments..................................................................................31 Table 13. Monte Carlo Results for Likelihood .............................................................................31
Table 14. Risk Rating Results .......................................................................................................31 Table 15. Sensitivity Analysis Results..........................................................................................32

vii
ACKNOWLEDGEMENTS
The US Army Materiel Systems Analysis Activity (AMSAA) recognizes the following
individuals for their contributions to this report.
The author(s) are:
Thomas Bounds, Weapon Systems Analysis Division, WSAD
Andrew Clark, Weapon Systems Analysis Division, WSAD
Todd Henry, Weapon Systems Analysis Division, WSAD
John Nierwinski, Weapon Systems Analysis Division, WSAD
Suzanne Singleton, Weapon Systems Analysis Division, WSAD
Brian Wilder, Weapon Systems Analysis Division, WSAD
The author wishes to acknowledge the contributions of the following key individuals who
participated in the Risk IPT and played a major role in methodology development and assistance
in creation of this report:
Rebecca Addis, TARDEC Cindy Noble, TRAC
Zachary Collier, ERDC Dawn Packard, TARDEC
Cynthia Crawford, TARDEC Gretchen Radke, ARCIC
Jennifer Forsythe, AMSAA Kadry Rizk, TARDEC
Lisa Graf, TARDEC Klaus Sanford, TRAC
Elyse Krezmien, TRAC Jerry Scriven, ALU
Igor Linkov, ERDC Alison Tichenor, ODASA-CE
Bonnie McIlrath, TRAC Jerome Tzau, TARDEC
The author also wishes to acknowledge the contributions of the following individuals for
their assistance in reviewing this report:
Robert Chandler, AMSAA
J.D. DeVido, AMSAA
Lewis Farkas, AMSAA
Robert Hessian, AMSAA
Michael McCarthy, AMSAA
Eric Ruby, AMSAA
Matthew Schumacher, AMSAA
Douglas Turnbull, AMSAA
Randolph Wheeler, AMSAA
In addition, the authors wish to acknowledge the support and guidance received from
Army leadership during the development of this methodology.

viii
LIST OF ACRONYMS
AAR - After Action Review
ACAT - Acquisition Category
ALU - Army Logistics University
AMRDEC - Aviation and Missile Research Development and Engineering Center
AMSAA - US Army Materiel Systems Analysis Activity
AoA - Analysis of Alternatives
ARCIC - Army Capabilities Integration Center
ARDEC - Armament Research Development and Engineering Center
ARL - Army Research Laboratory
ASD(R&E) - Assistant Secretary of Defense for Research and Engineering
ATEC - Army Test and Evaluation Command
BCA - Business Case Analysis
C - Consequence Level
C-BA - Cost Benefit Analysis
CDD - Capability Development Document
CDF - Cumulative Density Function
CI - Confidence Interval
CKB - Capabilities Knowledge Base
CMMI - Capability Maturity Model Integration
COCOMO - Constructive Cost Model
DAMIR - Defense Acquisition Management Information Retrieval
DASA R&T - Deputy Assistant Secretary of the Army for Research & Technology
DAU - Defense Acquisition University
DCARC - Defense Cost and Resource Center
DCO - Defense Connect Online
DOD - Department of Defense
DODI - Department of Defense Instruction
DOT&E - Director of Operational Test & Evaluation
DTIC - Defense Technical Information Center
ECP - Engineering Change Proposal
EMD - Engineering and Manufacturing Development
ERDC - Engineer Research and Development Center
EVM - Earned Value Management
GAO - US Government Accountability Office
GCS - Ground Combat System
GCV - Ground Combat Vehicle
HQDA - Headquarters, Department of the Army

ix
ICD - Initial Capabilities Document
IPT - Integrated Product Team
IRL - Integration Readiness Level
IRT - Independent Review Team
KPP - Key Performance Parameter
KSA - Key System Attribute
KT - Key Technology
L - Likelihood
MDA - Milestone Decision Authority
MDAP - Major Defense Acquisition Program
MRL - Manufacturing Readiness Level
MS - Milestone
O&S - Operations and Support
ODASA-CE - Office of the Deputy Assistant Secretary of the Army for Cost & Economics
OSD - Office of the Secretary of Defense
OSD-CAPE - Office of the Secretary of Defense for Cost and Program Evaluation
PEO - Program Executive Office
PM - Project Manager
RDEC - Research, Development, and Engineering Center
RDECOM - Research, Development, and Engineering Command
RFI - Request for Information
RFP - Request for Proposal
SAR - Selected Acquisition Report
SLOC - Source Lines of Code
SME - Subject Matter Expert
SRDDM - Schedule Risk Data Decision Methodology
TARDEC - Tank Automotive Research, Development, and Engineering Center
TMA - Technology Maturity Assessment
TRA - Technology Readiness Assessment
TRAC - US Army Training and Doctrine Command (TRADOC) Analysis Center
TRADOC - US Army Training and Doctrine Command
TRL - Technology Readiness Level
WBS - Work Breakdown Structure
WSARA - Weapon Systems Acquisition Reform Act

x
THIS PAGE INTENTIONALLY LEFT BLANK

1
ARMY INDEPENDENT RISK ASSESSMENT GUIDEBOOK
1. EXECUTIVE SUMMARY
1.1 Summary. In May 2009, the Weapon Systems Acquisition Reform Act
(WSARA) was signed into law to reduce waste in defense spending by reforming the way in
which the Pentagon contracts and purchases major weapon systems. As a result, WSARA is
driving more analysis to support the Analysis of Alternatives (AoA) and other major acquisition
studies. In response, the US Army Materiel Systems Analysis Activity (AMSAA) served as the
lead organization on an Army Risk Integrated Product Team (IPT), which was established at the
direction of Senior Army analysis leaders, to develop standard methodologies for assessing
technical, schedule, and cost risk as part of acquisition studies. The risk assessments are
intended to inform decision makers of the potential risks associated with each alternative in the
study. AMSAA led the development and application of technical and schedule risk assessment
methodologies, and the Office of the Deputy Assistant Secretary of the Army for Cost &
Economics (ODASA-CE) led the development and application of the cost risk and uncertainty
analysis methodology.
The purpose of this guidebook is to document the current state of these methodologies.
This guidebook differs from the Risk Management Guide for DOD Acquisition, because the
Army Risk IPT methodology is focused on independent risk assessments that are conducted at a
specific moment in time and incorporate forecasting.1 The Risk Management Guide for DOD
Acquisition is used to assist Project Managers (PMs), program offices, and IPTs in effectively
managing program risks during the entire acquisition process, including sustainment.
The technical risk assessment methodology measures the risk that a technology relevant
to an Army acquisition system is not sufficiently developed (i.e., technology matured, integration
characterized, and manufacturing processes matured) within the desired timeframe. Technical
risk is reported as three levels (low, moderate, high) based on the standard Department of
Defense (DOD) Risk Reporting Matrix for Acquisition. The risk level is determined by
likelihood (probability) and consequence of event occurrence. Two approaches have been
developed for assessing technical risk, based on the amount of time available to complete the
assessment; these are referred to as the full approach and the quick-turn approach. The full
approach is a semi-quantitative assessment of the risk to sufficiently developing each key
technology within predetermined time constraints. It is based on the probability of the
technology being sufficiently matured, integrated, and manufacturable within the required
timeframes. AMSAA conducts a risk workshop to gather the required inputs to support the full
approach. The workshop is a critical part of the risk assessment process, and brings together
representatives from across the acquisition community. The quick-turn approach is a qualitative
assessment of the risk to sufficiently developing each key technology within predetermined time
constraints. It is based on the current technology, integration, and manufacturing readiness
levels, and the qualitative risk rating for any identified technical risks for each key technology.
The appropriate Research, Development, and Engineering Center (RDEC) conducts a risk
workshop to review SME input to support the quick-turn approach.
1 Risk Management Guide for DOD Acquisition, Sixth Edition, Department of Defense, August 2006.

2
The schedule risk assessment methodology measures the likelihood that each system
alternative will meet a program’s estimated schedule, based on historical analogous programs.
Two approaches have been developed for assessing schedule risk, based on the amount of
historical analogous programs and associated schedule data; these are referred to as the full
approach and the quick-turn approach. The full approach utilizes phase-level (e.g., Engineering
and Manufacturing Development Phase) acquisition times from historical analogous programs to
conduct quantitative modeling using Monte Carlo simulation and other mathematical techniques.
Results of the quantitative modeling yield a probability of meeting the program schedule. The
quick-turn approach qualitatively utilizes phase-level historical data, when there are not enough
programs or available data to have confidence in quantitative modeling results. Schedule risk is
reported as three levels (low, moderate, high), based on the results of the full or quick-turn
approach.
Cost risk and uncertainty analysis identifies the cost, in terms of dollars, time, and
materials that should be added to a point estimate to increase the probability of meeting the
desired outcome. It estimates the resources required to meet specified requirements and
performance objectives. Without risk analysis, a cost estimate will usually be a single value,
called a point estimate, which does not account for the uncertainties inherent in the effort. Cost
risk and uncertainty analysis communicates to decision makers the degree to which specific
uncertainties contribute to overall cost and schedule risk. The cost risk and uncertainty analysis
methodology has been documented by ODASA-CE in a Draft US Army Cost Analysis
Handbook.2 The methodology has been applied and accepted within the analytical community.
The cost risk methodology is not included in this guidebook; reference the cost analysis
handbook if further details are desired.
In order to meet the organization’s risk assessment demands, AMSAA established a
permanent Risk Team in October 2011. To date, the AMSAA Risk Team has completed 12
technical and schedule risk assessments to support AoAs and Cost-Benefit Analyses (C-BAs).
AMSAA also developed a software risk assessment methodology, which was used to support a
software-focused AoA. Lessons learned from these applications have contributed to
methodology and process improvements. The AMSAA Risk Team will continue to engage the
Risk IPT as needed, as major methodology efforts occur. In addition, the AMSAA Risk Team
continues to socialize and improve these methodologies based on stakeholder feedback.
Two key related areas for further development include risk interdependencies and risk-
informed trade space analysis. The Risk IPT recognizes that there are interdependencies
between technical, schedule, and cost risks. The current schedule risk assessment methodology
does not support inclusion of the technical risk assessment outputs. The AMSAA Risk Team is
currently developing an event-level schedule risk assessment methodology, which will model
key events within each acquisition phase. This new methodology will allow inclusion of the
technical risk assessment outputs, as well as support the ability to conduct trades. For example,
if an alternate technology is considered in order to reduce technical risk, the schedule risk
methodology will have the ability to model how it affects the schedule. In addition, AMSAA has
been collaborating with ODASA-CE regarding inclusion of the technical and schedule risks into
their cost risk analysis. This guidebook will be updated as necessary to document major
2 US Army Cost Analysis Handbook, ODASA-CE, February 2010.

3
methodology changes. Recommended approaches and guidelines are provided in this
guidebook; however, they may need to be tailored as applicable for unique studies.

4
2. INTRODUCTION
2.1 Preface. As acquisition schedules accelerate and budgets tighten, Army
leadership needs an early, independent, and agile approach for assessing risk and making
difficult program decisions. The risk assessment methodology documented in this guidebook
was developed to provide leadership with the essential information required to make informed
decisions at major milestones, and adheres to existing policy. The WSARA of 2009 is driving
more analysis to support AoAs, of which risk assessments and trade-offs are key elements.3
Department of Defense Instruction (DODI) 5000.02 also provides guidance related to risk
assessments and AoAs.4 Guidance from these sources was incorporated during the development
of this risk assessment methodology.
This guidebook differs from the Risk Management Guide for DOD Acquisition, because
the Army Risk IPT methodology is focused on independent risk assessments that are conducted
at a specific moment in time and incorporate forecasting.5 The Risk Management Guide for
DOD Acquisition is used to assist PMs, program offices, and IPTs in effectively managing
program risks during the entire acquisition process, including sustainment.
2.2 Background. AMSAA hosted an Army Risk Assessment Workshop in February
2011 to organize and plan the Army’s effort to develop methodologies and establish capabilities
to conduct risk assessments for Army acquisition programs. The objectives of the meeting
included the following: gain a common understanding of risk terminology; share current methods
used to perform risk assessments; identify risk assessment capabilities needed for future AoAs;
and determine capability gaps in performing risk assessments. DODI 5000.02 and WSARA of
2009 were reviewed to gain a common understanding of risk-related policy for AoAs. Existing
risk methodologies and lessons learned from recent AoAs were shared and discussed.
Following the workshop, an AMSAA-led Army Risk IPT was formed in March 2011 to
advance the development of risk assessment methodologies for acquisition studies. Upon its
establishment, the IPT had representatives from the following organizations: the Office of the
Deputy Assistant Secretary of the Army for Cost & Economics (ODASA-CE), U.S. Army
Training and Doctrine Command (TRADOC) Analysis Center (TRAC), Army Capabilities
Integration Center (ARCIC), Tank Automotive Research, Development and Engineering Center
(TARDEC), Program Executive Office for Ground Combat Systems (PEO GCS), Project
Manager for Ground Combat Vehicle (PM GCV), Engineer Research and Development Center
(ERDC), and Army Logistics University (ALU). Since March 2011, representatives from other
RDECs have joined the Risk IPT, and a few of the organizations no longer actively participate.
Leadership guidance from the Army Risk Assessment Workshop included developing
quantitative and repeatable methodologies that incorporate historical data. The IPT researched
and reached out to fellow Army organizations, Joint Services, industry, and academia to
understand and incorporate elements of their risk assessment methodologies. The IPT also held
3 Weapon Systems Acquisition Reform Act of 2009, Public Law 111-23, May 22, 2009.
4 Department of Defense Instruction, Number 5000.02, Under Secretary of Defense for Acquisition, Technology, &
Logistics (USD(AT&L)), December 8, 2008. 5 Risk Management Guide for DOD Acquisition, Sixth Edition, Department of Defense, August 2006.

5
informal consultations with representatives from the Office of the Secretary of Defense for Cost
and Program Evaluation (OSD-CAPE), Assistant Secretary of Defense for Research and
Engineering (ASD(R&E)), Defense Acquisition University (DAU), and other key stakeholders in
the acquisition process to obtain feedback during the methodology development process and
initial application of the methodologies.

6
3. KEY DEFINITIONS, TERMS, AND PRINCIPLES
3.1 Technical Risk. Technical risk is defined as the risk that a technology relevant to
an Army Acquisition system is not sufficiently developed (i.e., technology matured, integration
characterized, and manufacturing processes matured) within the desired timeframe.
Technical risk is reported at three levels (low, moderate, and high) based on the standard
DOD Risk Reporting Matrix for Acquisition.6 The risk level is determined by likelihood
(probability) and consequence of event occurrence. Two approaches (full and quick-turn) have
been developed for assessing technical risk based on the amount of time and information
available to complete the assessment.
3.1.1 Full Approach. The full technical risk assessment approach is a semi-
quantitative assessment of the risk to sufficiently developing each Key Technology (KT) within
predetermined time constraints. It is based on the probability of the technology being
sufficiently matured, integrated, and manufacturable within the required timeframe. The
probabilities are based on Subject Matter Expert (SME) input and forecasts, or historical data.
AMSAA conducts a risk workshop to review SME input to support the full approach.
3.1.2 Quick-Turn Approach. The quick-turn technical risk assessment
approach is a qualitative assessment of the risk to sufficiently developing each KT within
predetermined time constraints. It is based on the current Technology Readiness Level (TRL),
Integration Readiness Level (IRL) and Manufacturing Readiness Level (MRL), and the
qualitative risk rating for any identified technical risks for each KT. The appropriate RDEC
conducts a risk workshop to review SME input to support the quick-turn approach.
3.1.3 Data Resolution. The technical risk assessment requires the following
data:
KTs for each alternative system.
Current readiness level assessments for each alternative KT: TRL, IRL, and MRL. Each
of these readiness levels is explained below in sections 3.5 – 3.7.
Estimated transition times for each technology to reach predetermined readiness levels.
For example:
- TRL 6 (system prototype demonstrated to meet specific performance criteria in a
relevant environment), IRL 6 (integration element baseline established that
identifies all required interfaces), and MRL 6 (ability to produce prototype in a
production relevant environment with prototype manufacturing processes,
technologies, materials, tools, and personnel) by the planned milestone (MS) B
date.
- TRL 7 (system prototype demonstrated to meet specific performance criteria in an
operational environment), IRL 8 (functionality of integration technology has been
demonstrated in prototype modified vehicles that all system to system interface
requirements have been defined and functionally qualified), and MRL 8 (pilot line
6 Risk Management Guide for DOD Acquisition, Department of Defense, August 2006.

7
capability demonstrated in producing the detailed design of product features -
ready to begin low rate production) by the planned MS C date.
A technology or system is not sufficiently developed when it does not meet the technical
and manufacturing requirements acceptance criteria within the desired timeframe. The
total set of requirements and their acceptance criteria for each technology, subsystem or
system must be established and verified either by test, analysis or inspection. If these
requirements are not verified, SMEs must provide rationale on how the requirement
criteria are met. If no rationale is provided then this will be identified as a technical risk.
These transition times are based on SME input or historical technology development data.
Eliciting SME input for transition times may be done through a risk questionnaire.
Specific technical risks for each technology are identified, to include an assessed risk
rating. These risks may be referenced in transition time estimates. An example of a
specific moderate technical risk for an upgraded diesel engine is shown in Table 1 below,
where C reflects consequence level and L reflects likelihood level. Likelihood and
consequence levels are further discussed in Section 3.911.
Table 1. Specific Technical Risk Example
Technology Risk Title Description Context Consequence
if Realized C L
Risk
Rating
Upgraded
Diesel
Engine
Selection of
Front End
Accessory
Drives
(FEAD)
Design
If the current
FEAD design is
used instead of a
redesigned FEAD,
then there may be
engine
overheating and
vehicle mission
failures.
Manufacturer of the
upgraded diesel
engine proposes a
FEAD design that has
not been tested in the
vehicle and failure of
this can lead to engine
overheating and
vehicle mission
failures.
Engine
overheating
and vehicle
mission
failures.
4 2 Moderate
3.2 Schedule Risk. Schedule risk is defined as the likelihood that each system
alternative will meet a program’s estimated schedule milestones, based on historical analogous
program data. Schedule risks are reported at three levels (low, moderate, or high) and are based
on the results of AMSAA’s full or quick-turn schedule risk assessments.
3.2.1 Full Approach. The full schedule risk assessment approach is a
quantitative assessment conducted for each alternative within the acquisition study. A probability
is assessed for completing a given phase (e.g., Engineering and Manufacturing Development
(EMD) phase) within the schedule developed by the PM, based upon historical analogous
program data. A risk rating is assigned to each alternative based upon the calculated probability.
3.2.2 Quick-Turn Approach. The quick-turn schedule assessment risk
approach is a qualitative assessment comparing each alternative’s proposed schedule to historical
analogous programs by acquisition lifecycle phase. A qualitative risk rating is assigned to each
alternative based upon comparison to historical averages, known schedule delays for historical
analogous programs, SME input, and technical risk assessment results. This type of schedule
risk assessment is primarily driven by historical data limitations and time constraints based on
completion date of the study.

8
3.2.3 Data Resolution. The schedule risk assessment requires the following
data:
Program schedule for each alternative system.
Historical analogous programs:
o Length (in months) of each acquisition phase.
o Schedule delays that occurred within each phase.
3.3 Cost Risk. Cost risk and uncertainty analysis identifies the cost, in terms of
dollars, time, and materials that should be added to a point estimate to increase the probability of
meeting the desired outcome. The analysis produces estimates of the resources required to meet
specified requirements and performance objectives. Without risk analysis, a cost estimate will
usually be a single value, called a point estimate, which does not account for the uncertainties
inherent in the effort. Cost risk and uncertainty analysis communicates to decision makers the
degree to which specific uncertainties contribute to overall cost and schedule risk. Ignoring
potential uncertainties can cause underfunding, cost overruns, and the reduction of a program’s
scope or necessitation of additional funding to meet objectives. For more information on cost
risk, refer to the US Army Cost Analysis Handbook.7
3.4 Risk Assessments vs. Risk Management. Both risk assessments and risk
management are key processes used to evaluate risk on systems. The processes help to ensure
program cost, schedule, and performance objectives are achieved throughout the acquisition life
cycle. There are fundamental differences between the purposes of each process, which are
highlighted in this section.
Risk assessments should be performed by independent organizations (i.e., organizations
not under the management of the program office and not involved in the development of
technologies related to the program) at fixed points in time, usually early in the acquisition
process, to advise decision makers of potential risks among the alternatives under consideration.
The assessments also support trade space analysis and requirements development. Although risk
assessments are conducted at a point in time, the methodology incorporates forecasting and
projection to make predictions about future outcomes. The results of risk assessments are also
provided to the associated PMs for their awareness and input to the risk management process.
In contrast, risk management is a continuous process used to manage uncertainties
throughout the life cycle of a system. Risk Management more broadly considers all aspects of a
program, such as operational needs, attributes, constraints, performance parameters, threats,
technology, design processes, etc. An effective process requires involvement of the entire
program team and also requires help from outside experts knowledgeable in critical risk areas.
The Risk Management Guide for DOD Acquisition documents the process for PMs, program
offices, and IPTs to effectively manage program risks throughout the acquisition process.
7 US Army Cost Analysis Handbook, ODASA-CE, February 2010.

9
The risk management process model, as shown in Figure 1, includes the following key
activities, performed on a continuous basis:
Risk Identification,
Risk Analysis,
Risk Mitigation Planning,
Risk Mitigation Plan Implementation, and
Risk Tracking.
Figure 1. DOD Risk Management Process
3.5 Technology Readiness Level. TRL is a systematic metric/measurement system
used by government agencies, including the DOD, to support assessment of the maturity of a
particular technology as well as the comparison of maturity between different types of
technologies.
APPENDIX A –contains the definitions for each TRL (1-9), along with questions that
can be used to aid in TRL assessment.
TRLs should be assessed according to DOD Technology Readiness Assessment (TRA)
Guidance dated April 2011.8 When possible, the technical risk assessment should rely on KT
determination and readiness level assessments done as part of the TRA. This may be possible
for pre-MS B AoAs, but will require additional assessment of MRL and IRL for each
technology. The same SMEs used in the TRA should be consulted to assess the MRL and IRL,
if available. If unavailable, then other independent SMEs can make the assessments.
When the technical risk assessment cannot be coordinated with a TRA (e.g., pre-MS A
AoAs), an informal Technology Maturity Assessment (TMA) must be completed. The TMA
8 Department of Defense Technology Readiness Assessment (TRA) Guidance, Office of the Assistant Secretary of
Defense for Research and Engineering (ASD (R&E)), April 2011.

10
must be coordinated with the PM and the applicable RDEC to ensure appropriate SMEs are
assigned to the assessment. The preferred process is for the applicable RDEC (e.g., TARDEC
for ground systems, AMRDEC for aviation systems) to lead the TMA following the general
guidelines of the Army TRA Guidance. TMA results will be reviewed at a risk workshop to
reach group consensus on assessed levels.
3.6 Integration Readiness Level. IRL is a systematic measurement of the level of
integration between a technology and the environment into which it will operate. The
environment consists of various physical systems (electrical, mechanical, hydraulic,
informational, etc.), other technologies, functional groups such as manufacturing and service,
regulations, military standards, test environments, etc. Adequate interfaces between the
technology and environment are required to meet overall system performance requirements. The
IRL provides an indicator of the level of accountability of these interfaces affecting technology
implementation. IRL is not yet an approved DOD measure. Definitions for IRLs were
developed by the Stevens Institute of Technology for systems interoperability determinations,
and modifications were made by TARDEC for use in Army Risk Assessments.9 AMSAA and
TARDEC are currently socializing IRLs in the acquisition community with the intent of
achieving DOD approval.
APPENDIX B –contains the definitions for each IRL (1-9), along with questions that can
be used to aid in IRL assessment.
3.7 Manufacturing Readiness Level. MRL is a systematic measurement used by
government agencies, including the DOD, to assess the maturity of a given technology,
component, or system from a manufacturing perspective prior to incorporating that technology
into a system or subsystem.
APPENDIX C –contains the definitions for each MRL (1-10), along with questions that
can be used to aid in MRL assessment.
In addition, the MRL Deskbook provides official guidance on using MRLs in support of
Risk Assessments.10
3.8 Performance Assessment. The performance assessment, which considers item-
level, system-level, and operational effectiveness, is a key analysis effort supporting the AoA
and other acquisition studies. AMSAA is typically tasked with providing the item and system-
level performance data and analyses for these studies, which estimate the performance of
alternatives across several functional areas (e.g., force protection, survivability, lethality,
mobility, sustainment, target acquisition, fuel consumption, etc.) for a wide variety of
environmental and operating conditions. The item and system-level data is typically provided to
TRAC to support the operational effectiveness modeling and analysis. Like the risk assessment,
the performance assessment can also be used to inform trade space analysis and requirements
9 Brian Sauser, et al. “Integration Maturity Metrics: Development of an Integration Readiness Level.” Journal of
Information Knowledge Systems Management, Volume 9, No. 1 (January 2010): 17-46. 10
Manufacturing Readiness Level (MRL) Deskbook – Version 2.2, OSD Manufacturing Technology Program in
conjunction with The Joint Service/ Industry MRL Working Group, July 2012

11
development. The risk assessments and performance assessment should be coupled together to
give the decision maker a complete understanding of potential risks and performance
capabilities, so that accurate conclusions are made.
3.9 Risk Reporting Matrix. A standard format for evaluating and reporting risk as a
function of the likelihood and consequence of occurrence helps ensure common understanding of
risks at all levels. The Risk Reporting Matrix in Figure 2 below is the DOD standard established
in the Risk Management Guide for DOD Acquisition.11
The matrix is used to determine the
level of each risk, and is reported as low (green), moderate (yellow), or high (red).
Figure 2. Risk Reporting Matrix
Likelihood is the probability that an undesirable event will occur. The level of likelihood
is established using specified criteria shown in Table 2 below. For example, if an event has an
estimated 70% probability of occurrence, the corresponding likelihood level is 4.
Table 2. Likelihood Level Criteria
Level Likelihood DOD
Guidance10
Probability of
Occurrence
1 Not Likely ~ 10% L <= 20%
2 Low Likelihood ~ 30% 20% < L <= 40%
3 Likely ~ 50% 40% < L <= 60%
4 Highly Likely ~ 70% 60% < L <= 80%
5 Near Certainty ~ 90% L > 80%
Consequence is the impact (severity) if the undesirable event occurs. The level and types
of consequences are established using criteria such as those shown in Table 3. Risk
consequences include decreased technical performance, delays to schedule, and increased cost.
The consequence level definitions may be tailored for a specific application. Continuing with
the prior example of an event with 70% probability of occurrence, if the same event is
determined to have a minor reduction in technical performance, then the corresponding
consequence level is 2.
11
Risk Management Guide for DOD Acquisition, Department of Defense, August 2006.

12
Table 3. Consequence Level Criteria12
Level Technical Performance Schedule Cost
1
Minimal consequences to technical
performance but no overall impact to the
program success.
Negligible schedule slip.
Pre-MS B: <= 5% increase from previous cost estimate.
Post MS B: limited to <= 1% increase in Program Acquisition Unit Cost
(PAUC) or Average Procurement Unit Cost (APUC).
2
Minor reduction in technical performance or
supportability, can be tolerated with little or
no impact on program success.
Schedule slip, but able to meet key
dates (e.g., PDR, CDR, FRP, FOC)
and has no significant impact to slack
on critical path.
Pre-MS B: > 5% to 10% increase from previous cost estimate.
Post MS B: <= 1% increase in PAUC/APUC with potential for further cost
increase.
3
Moderate shortfall in technical performance
or supportability with limited impact on
program success.
Schedule slip that impacts ability to
meet key dates (e.g., PDR, CDR,
FRP, FOC) and/or significantly
decreases slack on critical path.
Pre-MS B: > 10% to 15% increase from previous cost estimate.
Post MS B: > 1% but < 5% increase in PAUC/APUC
4
Significant degradation in technical
performance or major shortfall in
supportability with moderate impact on
program success.
Will require change to program or
project critical path.
Pre-MS B: > 15% to 20% increase from previous cost estimate.
Post MS B: >= 5% but <10% increase in PAUC/APUC
5
Severe degradation in
technical/supportability threshold
performance; will jeopardize program
success.
Cannot meet key program or project
milestones.
Pre-MS B: > 20% increase from previous cost estimate.
Post MS B: >= 10% increase in PAUC/APUC danger zone for significant
cost growth and Nunn-McCurdy breach)
The corresponding likelihood and consequence levels are plotted on the Risk Reporting
Matrix to determine the level of risk. In the example above, a likelihood level of 4 and
consequence level of 2 equates to a moderate technical risk (yellow) rating.
12
Risk Management Guide for DOD Acquisition, Department of Defense, August 2006.

13
4. RISK ASSESSMENTS FOR ARMY ACQUISITION STUDIES
4.1 Process. The general process for conducting risk assessments for acquisition
studies is shown in Figure 3. Note that this process flow is based on executing the full technical
and schedule risk assessment approaches. The basic process steps include gathering and
conducting baseline information/analysis, quantifying risks, highlighting risk drivers, and
identifying mitigations.
Figure 3. Army Independent Risk Assessment Process Flow
AMSAA is responsible for conducting the technical and schedule risk assessments.
ODASA-CE is often responsible for conducting the cost risk assessment; however, for some
acquisition studies, TRAC, AMSAA, or the PM is responsible for the cost assessment. The
AMSAA risk analysts maintain communication with the cost analysts throughout the
assessments to ensure common assumptions and information are shared. Details of the risk
assessment process will be further discussed throughout the guidebook.
4.2 Risk Workshop. AMSAA conducts a risk workshop to facilitate the gathering of
data to support the full technical, schedule, and cost risk assessment approaches. The workshop
is a key part of the risk assessment process, and requires broad participation from study
stakeholder organizations to ensure workshop success. All discussions and briefs are on a “non-
attribution” and “not-for-release” basis to encourage dialogue and information sharing. Main
objectives of the workshop include the following:
Review and gain consensus on the current TRL, IRL, and MRL for each KT.
Determine the technical risk rating for each KT:
Tech
nic
al R
isk
Ass
essm
ent
AM
SA
A
Review Current
Readiness
Levels for
Each
Technology
Identify
Potential
Technical
Risks for Each
Technology
Assess
Transition
Times for Each
Technology
Assess
Consequence
for Each
Technology if
Not Delivered
Determine Risk
Rating for
Each
Technology
Sch
edu
le R
isk
Ass
essm
ent
AM
SA
A Analyze PM
Program
Schedule(s)
Identify
Historical
Analogous
Programs
Research
Historical
Programs and
Gather Data
Build
Distributions
Using
Historical Data
Calculate
Probability of
Meeting PM
Program
Schedule(s)
Co
st R
isk
Ass
essm
ent
OD
AS
A-C
E Model
Uncertainty
within the Cost
Estimate
Quantify Risk
within the Cost
Estimate
Calculate Risk
Informed Cost
Range
Identify Areas
of Cost
Uncertainty
S&T Community
• Identify Technologies
• Assess Readiness Levels
PM
•System Concepts
•Program ScheduleIn
pu
ts to
Ris
k
Ass
essm
ent
Develop Cost
Estimate
Su
mm
ari
ze R
isk
As
se
ss
me
nts
Inte
rde
pe
nd
en
cie
s

14
o Assess the transition times for each technology to reach the required TRL, IRL,
and MRL.
o Assess the consequence to performance, schedule, or cost if the technology is not
sufficiently developed within the timeframe.
Discuss PM schedule(s), gain consensus on analogous programs, and discuss schedule
risks for each alternative to support the schedule risk assessment.
Identify high risk areas and cost drivers for each alternative to support the cost risk
assessment.
The workshop typically lasts one week, depending upon the number of study alternatives
and KTs. Holding the workshop at a location that maximizes attendance will make the most of
dialogue and information exchange. Telecon and Defense Connect Online (DCO) capability
should be made available for participants that cannot attend. Read-ahead slides should be sent
out to workshop attendees with administrative information, purpose and objectives, required
participants and roles, workshop agenda, risk methodology overview, and other applicable
data/information. A pre-workshop telecon with the risk workshop attendees will ensure the
workshop purpose, roles/responsibilities, and required outputs are understood prior to the
workshop. In addition, the telecon is a good opportunity to finalize any key assumptions
regarding the readiness levels and to tailor the consequence definitions.
An experienced facilitator, with knowledge of the risk assessment methodologies, should
lead the risk workshop to ensure study success. A data collection tool can assist in elicitation of
the information, documentation and rationale, and post-processing following the workshop. A
designated workshop participant should be assigned to document pertinent discussions.
Following the workshop, an after action review (AAR) survey may be sent to participants to
capture potential methodology or process improvements. Details on the recommended structure
of the risk workshop are described in section 5.4.7.

15
5. TECHNICAL RISK ASSESSMENT
5.1 Background. DOD defines risk in acquisition programs as a measure of future
uncertainties in achieving program performance goals and objectives within defined cost,
schedule, and performance constraints. Risk has two components:
Probability (or likelihood) of event occurrence.
Consequence (or effect) of event occurrence.
The Army’s independent technical risk assessment methodology uses the standard risk
analysis approach established in the Risk Management Guide for DOD Acquisition.13
The Risk
Reporting Matrix in Figure 2 is the DOD standard used to determine the level of risks (low,
moderate, high) identified within an acquisition program.
Senior Army and OSD leaders have requested increased quantitative emphasis in the
standard DOD acquisition risk analysis method. The technical risk assessment described below
follows this guidance by incorporating quantitative methods to capture uncertainties not captured
with the standard DOD acquisition risk analysis method.
5.2 Purpose. The technical risk assessment measures the technology risks associated
with an Army acquisition system in order to provide the following information to decision
makers:
Independent SME assessment of KTs and their readiness levels (TRL, MRL, and IRL),
when risk assessment timing does not align with the formal TRA.
Identification of technical risks associated with each KT and materiel solution.
Insight into areas of mitigation necessary for each materiel solution included in the
assessment.
Early identification of high risk technologies.
5.3 Quick-Turn Approach. The quick-turn technical risk assessment approach is a
qualitative assessment of the risk to sufficiently developing each KT within the predetermined
time constraints. The assessment is based only on the current readiness levels (TRL, MRL, and
IRL) and the qualitative risk rating for any identified technical risks for each KT. Independent
SMEs should be used to assess the technology readiness levels and identify technical risks, to
include a risk rating. The appropriate RDEC should be responsible for identifying appropriate
technology SMEs, assessing the current readiness levels, identifying specific technical risks, and
conducting a risk workshop to review SME evaluations of readiness levels and risk ratings
assigned to each specified technical risk. APPENDIX D –contains sample readiness assessment
guidance for RDECs to issue to SMEs.
The quick-turn approach is most applicable for Engineering Change Proposals (ECPs), C-
BAs, Business Case Analyses (BCAs), and instances where turnaround time does not support
execution of the full technical risk assessment.
13
Risk Management Guide for DOD Acquisition, Department of Defense, August 2006.

16
When conducting a quick-turn technical risk assessment, the overall technical risk for a
given alternative is the risk level assigned to the highest-rated KT or risk element. Alternately,
these KTs or elements may be binned in risk categories, with the alternative assigned a series of
risk ratings based on the highest-rated element in each designated bin. After determining the
technical risk for a given alternative, mitigation strategies are identified and residual risk is
assessed. Table 4 shows notional quick-turn technical risk assessment results.
Note: Steps one through six of the full technical risk assessment (Section 5.4) also apply
for the quick-turn approach.
Table 4. Notional Quick-Turn Technical Risk Assessment Results
5.4 Full Approach. The full technical risk assessment approach is a semi-
quantitative assessment of the risk to sufficiently developing each KT within predetermined time
constraints. The assessment is based on the probability of the technology being sufficiently
matured, integrated, and manufacturable within the required timeframe (e.g., MS B and C). The
probabilities are based on SME input and forecasts, or historical data. AMSAA conducts a risk
workshop to review SME input to support the full approach. The assessment approach includes
the following:
Step 1: Identify technologies for each alternative based on the Systems Book for the
study.
Step 2: Gather relevant technology and alternative information.
Step 3: Secure SME support for readiness level assessment. APPENDIX D –
contains sample readiness assessment guidance for RDECs to issue to SMEs.
Step 4: SMEs assess TRL, IRL, and MRL for each identified technology in the
Program Systems Book.
Step 5: Identify technical risks, risk ratings, and potential mitigation strategies for
each technology.
Step 6: SMEs identify KTs to include in the risk assessment.
Step 7: Conduct risk workshop.
Step 8: Determine technical risk rating for each KT using the risk reporting matrix
from the Risk Management Guide for DOD Acquisition.14
Step 9: Perform sensitivity analysis on the risk rating.
Each step of the approach is further explained in subsequent sub-sections.
14
Risk Management Guide for DOD Acquisition, Department of Defense, August 2006.

17
5.4.1 Step 1: Identify technologies for each alternative.
The primary source used to describe technologies for each of the alternative systems is
the study Systems Book. AMSAA is usually tasked with maintaining the approved Systems
Book for study consistency. The Systems Book is the authoritative source for describing each
alternative assessed in the particular study. It provides basic descriptions of each system, to
include technologies. Technologies identified in the Systems Book for each alternative should
be the technologies assessed by the RDEC SMEs. The final list of technologies to be assessed
for each alternative should be agreed to by the study team, to include the appropriate PM.
5.4.2 Step 2: Gather relevant technology and alternative information.
Gathering all available information for each technology is essential for the SMEs to
provide a relevant and valuable assessment. In some cases, the PM may assist in providing
technology information. Having the Capability Development Document (CDD) requirements
available for the SMEs during their evaluation is important to the assessment process, as it
allows the SMEs to evaluate the ability of the technology to meet the program’s requirements.
For assessments on pre-MS A systems, the Initial Capabilities Document (ICD) or draft CDD
will suffice.
5.4.3 Step 3: Secure SME support for readiness level assessment.
Identify SMEs for each identified technology. Technology SMEs will usually be found within
the Research, Development, and Engineering Command (RDECOM) (e.g. RDECs, ARL) or
AMSAA. It is important to request SME participation in the assessment as early as possible, and
determine whether they will require funding. A kick-off meeting to provide guidance on the
technical risk assessment, including required deliverables and the timeline for the activity, will
ensure SME understanding of their assessments.
5.4.4 Step 4: SMEs assess TRL, IRL, and MRL for each technology.
SMEs should use all available information for the technology under evaluation to make
the best possible assessment. To evaluate the probability of a technology meeting the required
TRL within the required timeframe, the current TRL of each identified technology must be
assessed. For pre-MS B AoAs, the current TRLs should be obtained from the Deputy Assistant
Secretary of the Army for Research & Technology (DASA R&T) TRA, if timing of the TRA
supports the technical risk assessment. Close coordination with DASA R&T and the PM must
occur to ensure the TRLs used in the technical risk assessment are the same as in the formal
TRA. If possible, the same TRA SMEs should provide IRL and MRL assessments for the
technical risk assessment.
For pre-MS A AoAs completed prior to any formal TRA, and for pre-MS B AoAs where
the timing of the TRA does not support the technical risk assessment, a TMA or early evaluation
of technology maturity must be completed to support the technical risk assessment. The TMA
helps evaluate technology alternatives and risks and, thereby, helps the PM refine the plans for
achieving mature technologies at MS B. The TMA must be coordinated with the PM and RDEC

18
to ensure appropriate SMEs are assigned to the assessment. The preferred process is for the
applicable RDEC (e.g., TARDEC for ground systems, AMRDEC for aviation systems, etc.) to
lead the TMA following the general guidelines of the DOD TRA Guidance (April 2011). SMEs
must assess TRL, IRL, and MRL for each technology. These readiness level assessments will be
reviewed at the risk workshop so as to achieve group consensus on assessed levels.
Guidance in the form of definitions, descriptions, and questions to consider is provided to
the SMEs performing the TRL, MRL, and IRL assessments for a given technology. The TRL
criteria used are shown in APPENDIX A –and are taken from the DOD TRA Guidance (April
2011). The IRL criteria used are shown in APPENDIX B –. Since no DOD standard currently
exists for definitions of integration readiness, the IRL definitions used for the technical risk
assessment are based on the Stevens Institute of Technology IRL criteria, with modifications
made by TARDEC. The MRL criteria used are shown in APPENDIX C –and are taken from the
DOD MRL Deskbook, Version 2.01, July 2011.15
SMEs conducting the assessment must
provide a rationale for all assigned readiness level ratings. TRL/MRL/IRL mapping guidelines
for the program lifecycle are shown in Figure 4.16
This mapping shows the relationships
between TRL, MRL, and IRL for each phase of the lifecycle. The mapping of IRLs to the
lifecycle was developed by TARDEC and is still considered Draft, pending further socialization
of IRLs. Normal technology development requires attainment of a TRL before the equivalent
MRL and IRL can be attained.
15
Department of Defense Technology Readiness Assessment (TRA) Guidance, Office of the Assistant Secretary of
Defense for Research and Engineering (ASD (R&E)), April 2011. 16
Manufacturing Readiness Level (MRL) Deskbook – Version 2.2, OSD Manufacturing Technology Program in
conjunction with The Joint Service/ Industry MRL Working Group, July 2012

19
Figure 4. TRL/MRL/IRL Mapping
Materiel Solution
Analysis
TechnologyMaturation &
Risk Reduction
Engineering & Manufacturing
Development
Production & Deployment
Operations & Support
TRLs 1-3
Analytical/ Experimental
Critical Function/
Characteristic Proof of Concept
TRL 4
Component and/or
Breadboard Validation in a
Laboratory Environment
TRL 5
Component and/or
Breadboard Validation in a
Relevant Environment
TRL 6
System/ Subsystem
Model or Prototype
Demonstrated in a Relevant Environment
TRL 7
System Prototype
Demonstratedin an
Operational Environment
TRL 8
Actual System CompletedQualified
Through Test and
Demonstration
TRL 9
Actual System Mission Proven
Through
Successful Operations
Technology
Readiness
Levels
TRA Guidance
April 2011
MRLs 1-3
Manufacturing Feasibility
Assessed. Concepts
Defined/ Developed
MRL 4
Capability to Produce
Technology in Lab
Environment. Manufacturing Risks Identified
MRL 5
Capability to Produce
Prototype Components in
a Production Relevant
Environment
MRL 6
Capability to Produce
System/ Subsystem
Prototypes in a Production Relevant
Environment
MRL 7
Capability to Produce
Systems, Subsystems, or
Components in a Production
Representative
Environment
MRL 8
Pilot Line Capability
Demonstrated. Ready for LRIP
MRL 9
Low Rate Production
Demonstrated.
Capability in Place for FRP
MRL 10
Full Rate Production
Demonstrated.
Lean Production
Practices in Place
Manufacturing
Readiness
Levels
MRL Deskbook
July 2011
IRLs 1-3
Interfaces Identified.
Integration Proof of
Concept. Integration Features
Modeled
IRL 4
Proposed Interfaces
Established. Limited
Functionality Demonstrated
IRL 5
Major Integration
Functions Demonstrated
IRL 6
Integration Baseline
Established. Platform
Interfaces all Identified
IRL 7
Full Prototype Integration Cis
Successfully Integrated and
have Functional Requirement Compliance
IRL 8
Functionality of Integration
Items Demonstrated
in System Environment
IRL 9
Integration Proven in
Operational
Test and Demonstration
Integration
Readiness
Levels
Army Risk IPT
Materiel
Development
Decision
Post PDR
Assessment
Post CDR
Assessment
FRP
Decision
Review
A B C IOC FOC

20
5.4.5 Step 5: Identify technical risks, risk ratings, and mitigations.
In addition to the assignment of TRL, MRL, and IRL levels, the SMEs are asked to
identify any known or potential technical risks associated with the assessed technology. These
risks should serve as input to and influence the TRL, MRL, and IRL assessments. The risk
should be stated in one clear and concise sentence, creating an “IF … THEN … MAY”
statement. For example, if the current engine design is used instead of a redesigned accessory
drive, then there may be engine overheating and vehicle mission failures. The details of the risk
should include who, what, where, when, why, and how much risk. For each identified technical
risk, the SME should independently rate the likelihood and consequence of each risk using the
standard DOD Acquisition risk reporting matrix (Figure 2) and the criteria as stated in the Risk
Management Guide for DOD Acquisition (August 2006) or other program-designated criteria.
For example, TARDEC together with PEO GCS have created definitions for use in assessments
of ground systems in a Risk Recon Risk Management Tip Sheet as shown in Figure 5 below.
In addition, SMEs should identify any potential mitigation actions for the risk, and
capture this as part of their risk assessment. Risk mitigation planning identifies, evaluates, and
selects options to set risk at acceptable levels given program constraints and objectives. It
includes the specifics of what should be done, when it should be accomplished, who is
responsible, and the funding and schedule tasks required to implement the risk mitigation plan.17
Once the SMEs have completed the readiness level assessments and identification of
technical risks as part of the TMA, the overall lead (e.g. TARDEC Systems Engineering Group)
should conduct a workshop to review and finalize the SME assessments prior to the AMSAA-led
risk workshop.
17
Risk Management Guide for DOD Acquisition, Sixth Edition, Version 1.0, August 2006 and Defense Acquisition
Guidebook, August 5, 2010.

21
Figure 5. TARDEC Risk Recon Tip Sheet

22
5.4.6 Step 6: SMEs identify key technologies.
Having confirmed the guidance and processes used in the assessment, SMEs must
identify the KTs from the list of technologies under consideration. KTs should be determined
similarly to guidance in DOD TRA Guidance (April 2011) for determining whether or not a
technology is critical. The technologies included in the assessment should be KTs for the
alternative, although other technologies of interest can also be included in the assessment. The
criteria used to determine KTs are as follows:
1. Does the technology pose major technological risk during development?
2. Does the system depend on this technology to meet Key Performance Parameters
(KPP), Key System Attributes (KSA), or designed performance?
3. Is the technology or its application new or novel or is the technology modified
beyond initial design intent?
If the answer to question 1 is ‘Yes’, then the technology is key. If the answer to both
questions 2 AND 3 are ‘Yes’, then the technology is also key. A rationale explaining why the
technology has been identified as a KT is required and must be provided by each technology
SME.
5.4.7 Step 7: Conduct risk workshop.
AMSAA will conduct a risk workshop to facilitate the gathering of data to support the
technical, schedule, and cost risk assessments. Broad participation from study stakeholders is
required for workshop success. Participation from the following organizations is desired:
AMSAA, ODASA-CE, TRADOC Centers of Excellence, RDECOM (RDECs and ARL),
PEO/PM, HQDA/OSD Action Officers, TRAC, ARCIC, and the Army Test and Evaluation
Command (ATEC).
Workshop efficiency requires a formal structure to properly gather required information.
The recommended workshop structure is shown below.
Technical Risk. For each KT:
o Review TRL, IRL, and MRL for each KT. Group must come to agreement on
accurate readiness levels for each technology.
o Assess expected transition times for each KT to reach the required TRL, IRL,
and MRL (see examples below). Group must come to consensus on expected
transition times.
TRL 6, IRL 6, and MRL 6 at MS B, and
TRL 7, IRL 8, and MRL 8 at MS C.
o Use Monte Carlo simulation to model the expected likelihood (probability)
from the assessed transition times. Use likelihood level criteria shown in
Table 2 to map the likelihood (probability) to a likelihood level. Section 5.4.8
provides additional details on how to determine the likelihood level.
o Assess consequence if technology is not sufficiently developed (i.e.,
technology matured, integration characterized, and manufacturing processes

23
matured) by the required timeframe. Use consequence level criteria shown in
Table 3 based on probable PM mitigation to address the issue: accept
decreased performance (holding schedule and cost fixed), increase program
schedule (holding performance and cost fixed), or increase program cost
(holding performance and schedule fixed). Section 5.4.8 provides additional
details on how to determine the consequence level.
Consequence to technical performance should be addressed by
considering alternative technologies that could be sufficiently
developed in required timeframe and cost, and their impact to key
performance attributes or parameters.
Consequence to schedule should be addressed by comparing planned
development time to the estimated maximum total transition time for
the technology. Technology maximum total transition time estimate
should be determined by:
(1)
Where, TRL (max) = maximum TRL transition time estimate
IRL (max) = maximum IRL transition time estimate
MRL (max) = maximum MRL transition time estimate
Consequence to cost should be addressed by considering both cost
impacts of using the alternative technology and cost of schedule delays
if maximum transition times are experienced.
o Identify other technical risk factors that impact cost and schedule elements.
Schedule Risk. For each alternative:
o Identify/confirm analogous historical programs.
o Identify schedule risk drivers.
o Identify events that impact schedule risk.
o Identify schedule risk factors that impact technical and cost elements.
Cost Risk. For each alternative:
o Identify high risk areas for development, production, and operations and
support (O&S).
o Identify cost risk factors for use as potential trade space mitigation strategies
to reduce technical and/or schedule risk.
o Identify data accuracy impact on cost risk.
5.4.8 Step 8: Determine technical risk rating for each key technology.
This section provides the detailed methodology to be used in determining the technical
risk rating for each KT. The technical risk rating measures the risk that the technology is not
sufficiently developed within the given timeframe. The rating is based on the probability of the
technology being sufficiently matured, integrated, and manufacturable within the required

24
timeframe, as well as the consequence to technical performance, schedule, and cost if not
sufficiently developed. The rating is assessed using the standard DOD Acquisition risk reporting
matrix as shown in Figure 2. The technical risk rating is defined by likelihood and consequence
of event occurrence.
Likelihood measures the probability that the technology will not be sufficiently matured,
integrated, and manufacturable within the given timeframe (e.g., MS B and C). Likelihood
calculations are based on three elements:
Level of developmental effort remaining to reach the required TRL by the planned
milestone date (e.g., TRL 6 at MS B and TRL 7 at MS C). This is measured by
eliciting expected transition times for the technology to reach the required readiness
levels (given the current TRL) from SMEs. Elicited transition time estimates contain
minimum, most-likely and maximum time periods.
Additional level of integration effort remaining to reach the required IRL by the
planned milestone date (e.g., IRL 6 at MS B and IRL 8 at MS C), given that TRL 6
(for MS B) or TRL 7 (for MS C) is achieved. This is measured by eliciting expected
transition times (beyond that estimated to get to TRL 6 and TRL 7) for the technology
to reach IRL 6 and IRL 8 (given the current IRL) from SMEs. Elicited transition time
estimates will contain minimum, most-likely and maximum time periods.
Additional level of manufacturing effort remaining to reach the required MRL by the
planned milestone date (MRL 6 at MS B and MRL 8 at MS C), given that TRL 6 (for
MS B) and TRL 7 (for MS C) is achieved. This is measured by eliciting expected
transition times (beyond that estimated to get to TRL 6 and TRL 7) for the technology
to reach MRL 6 and MRL 8 (given the current MRL) from SMEs. Elicited transition
time estimates will contain minimum, most-likely and maximum time periods.
Monte Carlo simulation using @RISK software is used to determine the likelihood from
the three elicited transition time estimates (TRL, IRL, and MRL). A simple three-event model of
the elicited transition time estimates is built in @RISK. The transition time estimates are
modeled as triangular distributions (minimum, most-likely, and maximum times). Random
deviates are drawn from each of the three triangular distributions (trli, irli, and mrli). Since IRL
and MRL are dependent on TRL, but not each other, the total time required to develop the
technology is determined by:
(2)
This process is repeated 10,000 times in the Monte Carlo simulation to create a
distribution for the total time required to develop the technology (T). The time remaining until
either MS B or MS C is plotted on the distribution of T to calculate the likelihood probability
that the technology will not be sufficiently developed by the applicable milestone. Likelihood
level criteria are used to map the likelihood probability to a likelihood level in the DOD
Acquisition risk reporting matrix (Figure 2).
Consequence is assessed to technical performance, schedule, and cost if the technology is
not sufficiently developed within the required timeframe. Use consequence level criteria shown
in Table 3. Consequence to technical performance should be addressed by considering

25
alternative technologies that could be used and their impact to technical performance.
Consequence to schedule should be addressed through the estimated maximum transition times
for the technology. Consequence to cost should be addressed by considering both cost impacts
of using the alternative technology and cost of schedule delays if maximum transition times are
experienced.
Likelihood level and consequence level are plotted on the DOD Acquisition risk
reporting matrix in Figure 2 to determine the risk rating for the technology (low, moderate, or
high).
5.4.9 Step 9: Perform sensitivity analysis on the risk rating.
Sensitivity analysis can be performed after the risk rating for each KT is determined. The
acquisition milestone dates can be modified to determine how many additional months need to
be added to the schedule to reduce the risk rating. The results of the sensitivity analysis can aid
in identifying potential trade options.
5.5 Validation. Validation of this technical risk assessment methodology cannot
occur until after several years of application to multiple systems from which comparisons can be
made against actual program progress.
5.6 Data Development. To date, there are no data sources from which to draw
current readiness levels or historical readiness level progressions over time for use in the
technical risk assessment. The data development approach for each assessment is shown below:
Current technology readiness levels: The technical risk assessment should be
coordinated with the formal TRA, if timing of the study permits, to ensure consistent
readiness level ratings. A TRA is a systematic, metrics-based process that assesses the
maturity of, and the risk associated with, KTs used in Major Defense Acquisition
Programs (MDAPs), to include Acquisition Category (ACAT) ID and IC programs. The
PM conducts the TRA with the assistance of an independent team of SMEs that make up
the Independent Review Team (IRT). A TRA is required by DODI 5000.02 for MDAPs
at MS B (or at a subsequent MS if there is no MS B). It is also conducted whenever
otherwise required by the Milestone Decision Authority (MDA).18
If timing of the study
does not permit coordination with the formal TRA, then an informal TMA must be
conducted by RDEC technology SMEs to support the technical risk assessment.
Estimated technology transition times to TRL 6, IRL 6, MRL 6 and TRL 7, IRL 8, MRL
8. Currently these estimated transition times must be elicited from technology SMEs.
Technology maturity data may be obtained from PEOs/PMs and from industry through
Requests for Information (RFIs) or Requests for Proposal (RFPs). Required data must
track technology maturation over time by updating readiness levels to reflect current state
of technical development.
18
Department of Defense Technology Readiness Assessment (TRA) Guidance, Office of the Assistant Secretary of
Defense for Research and Engineering (ASD (R&E)), April 2011.

26
5.7 Data Sources. Currently, SME judgment must be used to assess the required
technology transition times to TRL 6, IRL 6, MRL 6 and/or TRL 7, IRL 8, MRL 8.
In addition, AMSAA is populating a Historical Risk Database with readiness level data
from these assessments. Data can be used to ensure consistency in ratings (e.g., at times, more
than one concurrent AoA includes the same KTs), as well as assisting in future methodology
validation.
5.8 Responsibilities. The following organizations are responsible for the technical
risk assessment.
AMSAA: lead the technical risk assessment; conduct risk workshop.
RDEC:
o Systems Engineering Group:
- Lead the TRA/TMA.
- Provide guidance to the technology SMEs to aid in identifying KTs,
assessing current TRLs, IRLs, and MRLs, and identifying/assessing
technical risks.
- Contribute to assessments on technology transition times.
o Technology SMEs:
- Assess current TRLs, IRLs, and MRLs.
- Identify KTs,
- Identify/ assess technical risks.
- Contribute to assessments on technology transition times.
TRADOC Centers of Excellence: represent users and contribute to assessments on
technical performance consequences.
PEO/PM:
o Contribute to assessments on technology transition times and consequence
determination for technical performance, schedule, and cost.
o Assist in providing technology information.
o Provide PM schedule for each alternative.
5.9 Example. Described below is an example of the steps required to conduct a
technical risk assessment following the full approach. All data is notional. This assessment is
notionally part of a pre-MS A AoA for an Air Defense System. Study guidance dictates the
technical risk assessment measure the risk to each KT being sufficiently developed by the
planned MS C, which is 65 months from MS A.
5.9.1 Step 1: Identify technologies for each alternative.
Table 5 shows the list of technologies from the Systems Book for a notional Air Defense
System 1 alternative. This list must be agreed to by the study team. These technologies will be
assessed by technology SMEs in the Technology Maturity Assessment.

27
Table 5. Technologies for Air Defense System 1 Alternative
The Systems Book does not provide much detailed information on the individual technologies so
SMEs must gather relevant technology information.
5.9.2 Step 2: Gather relevant technology and alternative information.
The Systems Book provides basic descriptions of each alternative system and a list of
included technologies. More detailed information on the included technologies must be gathered
to provide accurate assessments. A Work Breakdown Structure (WBS) for the alternative system
could provide some additional level of detail. Other technology information can be gathered
from the following sources and should be used by the SMEs to assess readiness levels and
determine KTs:
Purchase description
Test data
Requirements data
Prototyping information
Modeling and simulation analyses
Risk data
Issues data
Trade studies
Engineering presentations
System interface analyses
Manufacturing data
Contractor-provided data.
5.9.3 Step 3: Secure SME support for readiness level assessment.
Since this is a gun-based Air Defense System, ARDEC should be considered to lead the
Technology Maturity Assessment. Table 6 shows the list of possible organizations from which to
find potential SME support for assessing maturity. ARDEC should coordinate directly with the
organizations to identify appropriate SMEs for each technology.
Alternative Component Technology
Transmit Antenna
Receive Antenna
Processor Electronics
Barrel
Receiver
Feeder
Fire Control Radar
Weapon
Air Defense
System 1

28
Table 6. Organizations for Potential SME Support
Once SMEs are identified for each technology, guidance can be issued by ARDEC on the
conduct of the Technology Maturity Assessment.
5.9.4 Step 4: SMEs assess TRL, IRL, and MRL for each technology.
APPENDIX D –contains sample technical risk assessment guidance that should be issued
to the technology SMEs before they begin their assessment. Table 7 shows notional results for
the current readiness level assessments for Air Defense System 1.
Table 7. Readiness Level Assessments
5.9.5 Step 5: Identify technical risks, risk ratings, and mitigations.
Technology SMEs should also provide rationale for all assigned readiness levels. In
addition, the SMEs should identify specific technical risks for each technology along with an
associated risk level and possible risk mitigations. Table 8 shows notional technical risks,
assessed risk levels, and mitigations for the Air Defense System 1 alternative.
Alternative Component Technology SME Organizations
Transmit Antenna
Receive Antenna
Processor Electronics
Barrel
Receiver
Feeder
Air Defense
System 1
Fire Control Radar
Weapon
CERDEC, AMRDEC, SMDC, ARL
ARDEC, SMDC, ARL
Alternative Component Technology TRL IRL MRL
Transmit Antenna 6 5 5
Receive Antenna 6 5 5
Processor Electronics 5 4 4
Barrel 5 5 5
Receiver 6 5 5
Feeder 4 3 3
Fire Control
Radar
Weapon
Air Defense
System 1

29
Table 8. Identified Technical Risks
These identified technical risks can be used to help determine the KTs for the alternative.
5.9.6 Step 6: SMEs identify key technologies.
The criteria outlined in section 5.4.6 above should be used to identify KTs and provide
supporting rationale. Table 9 shows notional key technology recommendations for Air Defense
System 1: transmit antenna, receive antenna, and feeder. Study team approval of these key
technologies is important. Upon approval, these KTs will be the only technologies included in
the technical risk assessment, unless the study team feels other technologies should be included.
Table 9. Identified Key Technologies
ARDEC should conduct a SME workshop prior to the AMSAA-led risk workshop to
review all assessments and ensure accuracy. Table 10 shows the notional results of the
Technology Maturity Assessment.
Alternative Component Technology Technical Risks
Assessed
Risk Level Mitigations
Transmit
Antenna
If the transmit antenna cannot command
detonate the warheads then the system may not
meet all lethality requirements.
ModerateProtoptype radar to be
demonstrated in 24 months.
Receive
Antenna
If the receive antenna cannot track and
communicate simultaneously then the system
may not meet all lethality requirements.
ModerateProtoptype radar to be
demonstrated in 24 months.
Processor
Electronics
If the new processor design doesn’t meet speed
specifications then system may not meet
engagement requirements.
LowProtoptype radar to be
demonstrated in 24 months.
Barrel
If barrels cannot be optimized for C-RAM
engagements then system may not meet
lethality requirements .
Low
Use currently available
barrels with slightly
different geometries.
Receiver
If receiver isn’t able to support the required
shots per minute then the system may not meet
required operational performance.
LowFund to demonstrate at
required performance.
Feeder
If receiver isn’t able to support the required
shots per minute then the system may not meet
required operational performance.
LowFund to demonstrate at
required performance.
Fire Control
Radar
Weapon
Air Defense
System 1
Alternative Component Technology Key (Y/N)
Transmit Antenna Y
Receive Antenna Y
Processor Electronics N
Barrel N
Receiver N
Feeder Y
Fire Control Radar
Weapon
Air Defense
System 1

30
Table 10. Technology Maturity Assessment Results
5.9.7 Step 7: Conduct risk workshop.
AMSAA will conduct a risk workshop after the TMA is finalized. During the workshop,
SMEs in attendance will conduct an independent review of the readiness levels, so as to ensure
their validity. Table 11 shows group consensus results from the AMSAA-led risk workshop. It
shows estimated transition times to TRL 7, IRL 8, and MRL 8 for each of the KTs. (In addition,
TRL 6, IRL 6, MRL 6 transition tames may be elicited, providing additional information to the
decision maker.)
Table 11. Transition Time Estimates
Consequences if the KTs are not available in the required timeframe were also assessed at
the risk workshop. Performance of the KTs was determined critical to Air Defense System 1 and
could not be traded. Appropriate PM mitigation for all three KTs would be to increase the
schedule to allow technology development. Consequence level determination would be based on
results of TRL(max) + max{IRL(max),MRL(max)} compared to the planned MS C date in 65
months. Table 12 shows the resulting consequence levels for each KT. Consequence level
definitions from Table 3 were tailored during the risk workshop.
Alternative Component
Key
Technology TRL IRL MRL Technical Risks
Assessed
Risk Level Mitigations
Transmit
Antenna 6 5 5
If the transmit antenna cannot command
detonate the warheads then the system may not
meet all lethality requirements.
ModerateProtoptype radar to be
demonstrated in 24 months.
Receive
Antenna 6 5 5
If the receive antenna cannot track and
communicate simultaneously then the system
may not meet all lethality requirements.
ModerateProtoptype radar to be
demonstrated in 24 months.
Weapon Feeder 4 3 3
If receiver isn’t able to support the required
shots per minute then the system may not meet
required operational performance.
LowFund to demonstrate at
required performance.
Fire Control
RadarAir Defense
System 1
Min
Most
Likely Max Min
Most
Likely Max Min
Most
Likely Max
Transmit
Antenna36 48 68 6 18 33 0 6 10
Receive
Antenna28 36 58 6 12 37 0 6 10
Weapon Feeder 36 54 75 0 6 22 0 0 9
Time (months) to reach TRL 7Additional time (months)
beyond TRL 7 to reach IRL 8
Additional time (months)
beyond TRL 7 to reach MRL 8
Air Defense
System 1
Fire Control
Radar
Alternative Component
Key
Technology

31
Table 12. Consequence Level Assessments
The technical risk rating for each KT was determined with this elicited information.
5.9.8 Step 8: Determine technical risk rating for each key technology.
The technical risk rating for each KT is determined as described in section 5.4.8.
Likelihood measures the probability that the technology will not be sufficiently matured,
integrated, and manufacturable by MS C, which is planned for 65 months from MS A. @RISK
software was used to run Monte Carlo simulations on the transition time estimates in Table 11 as
described in section 5.4.8. Table 13 shows the results of the Monte Carlo simulations for the
likelihood.
Table 13. Monte Carlo Results for Likelihood
Likelihood level definitions from Table 2 were used to map results from Table 13 to a
likelihood level that can be plotted in the risk reporting matrix. Table 14 shows the resulting
likelihood levels and risk ratings for each of the KTs.
Table 14. Risk Rating Results
Key
Technology TRL(max) IRL(max) MRL(max)
Total Maximum Transition
Time (months)
MS C Planned Date Difference
(65 months)
Consequence
Level
Transmit
Antenna60 24 8 84 19 4
Receive
Antenna50 24 8 74 9 2
Feeder 62 12 6 74 9 2
Alternative Component
Key
Technology Likelihood (L)
Transmit
Antenna0.69
Receive
Antenna0.25
Weapon Feeder 0.47
Air Defense
System 1
Fire Control
Radar
Alternative Component
Key
Technology Likelihood (L)
Likelihood
Level
Consequence
Level Risk Rating
Transmit
Antenna0.69 4 4 High
Receive
Antenna0.25 2 2 Low
Weapon Feeder 0.47 3 2 Low
Air Defense
System 1
Fire Control
Radar

32
5.9.9 Step 9: Perform sensitivity analysis on the risk rating.
Risk rating sensitivity analysis is done iteratively in @RISK by increasing the milestone
date until the likelihood probability results in a lower risk rating. Table 15 shows the results of
the sensitivity analysis performed in @RISK. The table shows the additional number of months
that need to be added to the schedule to reduce the risk rating for the transmit antenna from high
to moderate and low.
Table 15. Sensitivity Analysis Results
Alternative ComponentKey
Technology
Number of Months
Added to Schedule
New
Likelihood
New
Likelihood
Level
Consequence
Level
New Risk
Rating
Air Defense
System 1
Fire Control
Radar
Transmit
Antenna2 0.60 3 4 Moderate
Air Defense
System 1
Fire Control
Radar
Transmit
Antenna12 0.20 1 4 Low

33
6. SCHEDULE RISK ASSESSMENT
6.1 Background. One of the top priorities of the US Army is to make decisions
regarding acquisition programs that will best serve the Warfighter. WSARA requires full
consideration of possible trade-offs among cost, schedule, and performance objectives to support
the AoA. Providing a useful and informative schedule risk assessment for a set of alternatives is
a key input to the decision making process.
Senior Army and OSD leaders have requested increased quantitative emphasis of
schedule risk modeling. The use of historical analogous data to perform the modeling was also
desired. The schedule risk assessment described below follows this guidance by incorporating
quantitative methods and historical data.
6.2 Purpose. The schedule risk assessment measures the schedule risks associated
with an Army acquisition system in order to provide the following information to decision
makers and the PM:
Information and data on historical analogous programs.
Probability of meeting schedule deadline(s).
Risk rating based on the probability of meeting schedule deadlines and/or historical data.
Identification of schedule risk drivers.
Potential risk mitigation strategies.
6.3 Analogous Programs. Selecting historical analogous programs are an integral
part of the schedule risk assessment methodology. The programs are chosen based on several
key factors, such as:
Program type (surface, air, sea, missile, etc.)
Acquisition Strategy
o Non-developmental Item, Commercial Off the Shelf, Government Off the Shelf,
New Start
o Acquisition Category (I, II, III)
o Domestic, Foreign
o Contract Type
o Stability of Funding
System Capabilities
Key Technologies
The factors for selecting analogous programs are still being developed and refined. No
mathematical approach or calculations are currently used to determine the analogous programs
based on these factors. The existing process is for AMSAA to develop an initial list of analogous
programs, by considering the above key factors, and then for consensus to be reached during the
risk workshop.
6.4 Quick-Turn Approach. The quick-turn schedule risk assessment approach is a
qualitative assessment that compares each AoA alternative’s proposed schedule to historical
analogous programs by acquisition lifecycle phase. A qualitative risk rating is assigned to each
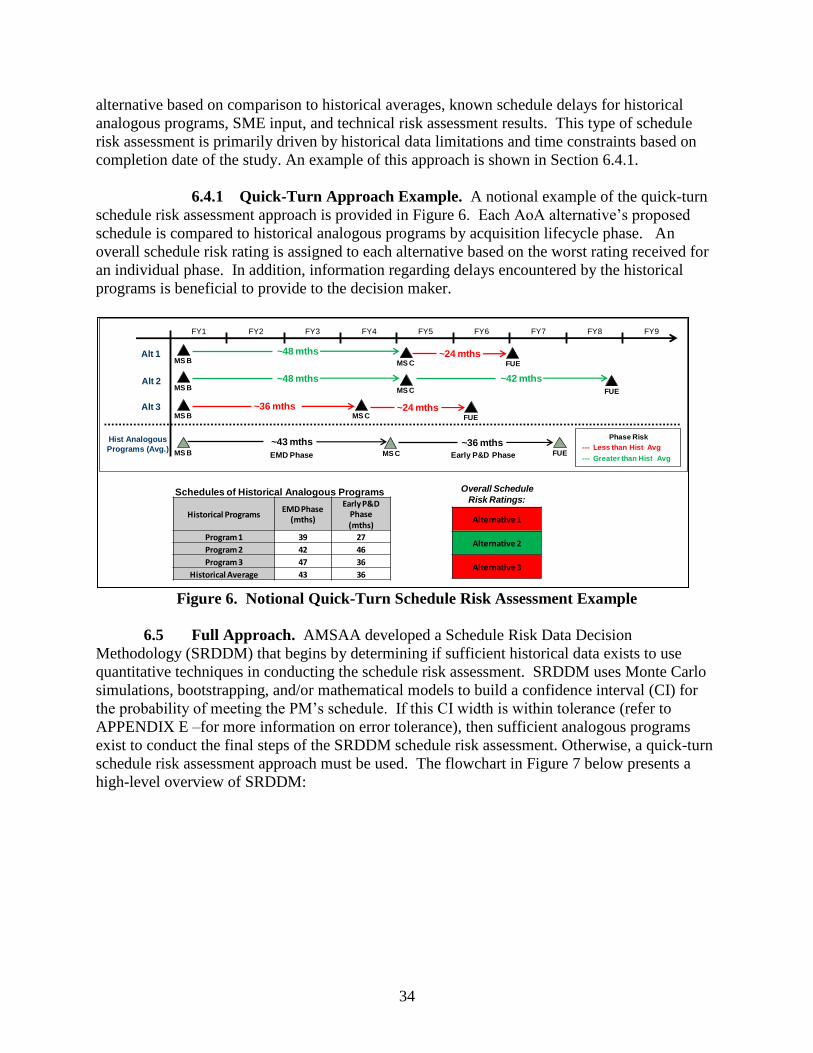
34
alternative based on comparison to historical averages, known schedule delays for historical
analogous programs, SME input, and technical risk assessment results. This type of schedule
risk assessment is primarily driven by historical data limitations and time constraints based on
completion date of the study. An example of this approach is shown in Section 6.4.1.
6.4.1 Quick-Turn Approach Example. A notional example of the quick-turn
schedule risk assessment approach is provided in Figure 6. Each AoA alternative’s proposed
schedule is compared to historical analogous programs by acquisition lifecycle phase. An
overall schedule risk rating is assigned to each alternative based on the worst rating received for
an individual phase. In addition, information regarding delays encountered by the historical
programs is beneficial to provide to the decision maker.
Figure 6. Notional Quick-Turn Schedule Risk Assessment Example
6.5 Full Approach. AMSAA developed a Schedule Risk Data Decision
Methodology (SRDDM) that begins by determining if sufficient historical data exists to use
quantitative techniques in conducting the schedule risk assessment. SRDDM uses Monte Carlo
simulations, bootstrapping, and/or mathematical models to build a confidence interval (CI) for
the probability of meeting the PM’s schedule. If this CI width is within tolerance (refer to
APPENDIX E –for more information on error tolerance), then sufficient analogous programs
exist to conduct the final steps of the SRDDM schedule risk assessment. Otherwise, a quick-turn
schedule risk assessment approach must be used. The flowchart in Figure 7 below presents a
high-level overview of SRDDM:
Overall Schedule
Risk Ratings:
Historical ProgramsEMD Phase
(mths)
Early P&D Phase(mths)
Program 1 39 27
Program 2 42 46
Program 3 47 36
Historical Average 43 36
Schedules of Historical Analogous Programs
FY1 FY2 FY3 FY4 FY5 FY6 FY7
FUE
Alt 1
Alt 2
MS C
Alt 3
~24 mths
MS B
MS B
~48 mths
Hist Analogous
Programs (Avg.)MS B MS C FUE
Phase Risk
--- Less than Hist Avg
--- Greater than Hist AvgEMD Phase Early P&D Phase
FY8 FY9
MS B
~43 mths ~36 mths
Alternative 1
Alternative 2
Alternative 3
MS C
~48 mths ~42 mths
FUE
~36 mthsMS C FUE
~24 mths

35
Figure 7. SRDDM Process Flowchart
The steps to the SRDDM process are as follows:
1. Obtain program schedule(s) from PM
2. Create initial list of historical analogous programs for each alternative
3. Obtain schedule information for analogous programs
4. Identify list of schedule risk drivers for each analogous program
5. Present analogous programs and risk drivers to stakeholders and SMEs
6. Develop consensus on analogous programs and risk drivers
7. Apply Schedule Risk Data Decision Methodology (SRDDM) to analogous program
data to estimate time required to complete each acquisition phase
8. Assess schedule risk for each alternative based on estimated completion time
Steps 5-6 are accomplished during the risk workshop. For each alternative, the schedule risk
assessment includes the probability of achieving each milestone date, the number of months
required to reduce the risk to moderate or low, and risk drivers for analogous programs. The
method for computing the probability of meeting the PM’s schedule is dependent upon whether
empirical data or a best fitting distribution is used. If empirical data is used, calculate the
percentage of analogous data that falls below the PM’s schedule estimate. If a best fitting
distribution is used, calculate the area below the PM’s schedule estimate. For more details on
SRDDM, refer to AMSAA’s technical report on the methodology.19
19
Nierwinski, J., “Schedule Risk Data Decision Methodology (SRDDM)”, AMSAA TR-2012-65, September 2012.
PM’s estimate
Perform Quick Turn Schedule
Risk Assessment
No for all distributions
Build distributions• Best Fitting• Empirical
Time
Fre
qu
en
cy
Improve quality of SRDDM by developing event driven
models; incorporating technical risk assessment outcomes and SME input;
etc.
Yes
For each distribution, build a Confidence Interval (CI) around the probability of meeting the PM’s schedule.
Involves
complex Monte Carlo
simulation &
mathematical formulas.
Is the CI
error
acceptable?
Collect Historical Analogous Phase Data for a given alternative
(Not enough data)
Probability that a program will meet its projected Acquisition milestones

36
6.5.1 Full Schedule Risk Modeling Approach Example
Figure 8 below shows the schedule risk assessment results for a notional program. The
baseline and accelerated schedules are shown at the top, and the table on the left shows the
analogous programs used to conduct the notional schedule risk assessment. The cumulative
probability plot on the right shows the probability and associated risk of completing the EMD
phase of the baseline and accelerated schedules. The results show that the program is high risk
for achieving the accelerated EMD phase time (.25) and moderate risk for achieving the baseline
EMD phase time (.63). The plot also shows that a low risk EMD phase can be achieved at 45
months.
Figure 8. Notional Schedule Risk Assessment Results
6.6 Data Development. AMSAA collects historical program data from Army, Navy,
Air Force and DOD sources to conduct its schedule risk assessments. Multiple data sources are
utilized to collect this data, which is resource intensive. As there is no single data repository from
which to obtain the required historical data and information, AMSAA has initiated development
of a Historical Risk database. The database contains general, technical, and schedule
data/information on current and historical programs.
During a recent schedule risk assessment application, AMSAA encountered an issue with
the historical data collected. APPENDIX F –provides an explanation of the process for how the
data was adjusted. This application highlighted the importance of fully understanding the data
being used for schedule risk modeling.
6.7 Data Sources. AMSAA’s schedule risk analysts rely on several data sources to
provide verified, substantive schedule information for analogous programs used to support risk
assessments. The current sources, and information about their content, are as follows:
0.0
0.1
0.2
0.3
0.4
0.5
0.6
0.7
0.8
0.9
1.0
0 6 12 18 24 30 36 42 48 54 60
FY 1 FY 2 FY 3 FY 4 FY 5 FY 6 FY 7
Program X Schedules (Notional)
EMD Phase P&D Phase
MS B MS C FUE ~36 Mo ~28 Mo
EMD Phase P&D Phase
MS B MS C FUE ~21 Mo ~16 Mo
Baseline(64 mo –MS B to FUE)
Accelerated(37 mo –MS B to FUE)
Analogous
Programs
EMD Phase
(months)
P&D Phase
(months)Total (months)
Program 1 39 27 66
Program 2 45 48 93
Program 3 9 17 26
Program 4 27 35 62
Program 5 25 18 43
Program 6 13 11 24
Program 7 23 45 68
Program 8 57 27 84
Average 30 29 58
Collect historical phase completion times
from analogous programs (Example focuses on MS B to MS C)
Use distribution of historical completion times to calculate
probability estimate for a given phase
Pro
bab
ilit
y o
f P
hase C
om
ple
tio
n
Number of Months in EMD Phase
EMD Phase Cumulative
Probability Distribution
Lower Confidence Bound
Low Risk
Moderate Risk
High Risk
Accele
rate
d (21 M
os)
Baselin
e (36 M
os)

37
Capabilities Knowledge Base (CKB) – Provides schedule information for current and
historical Army acquisition programs. Selected Acquisition Reports (SARs) collected in
the database provide milestones and significant event schedule dates. In addition, these
reports identify changes to the schedules and reasons for these changes. The database is
operated by ODASA-CE.
Defense Acquisition Management Information Retrieval (DAMIR) – Parent database to
CKB. Provides SAR information for acquisition programs.
Director of Operational Test & Evaluation (DOT&E) Annual Report – An online
repository of DOT&E annual reports. These annual reports provide status updates of all
DOD ACAT I programs. The reports are organized by year.
Defense Technical Information Center (DTIC) online – The largest comprehensive
website to search and access DOD and government-funded scientific, technical,
engineering, and business-related information.
Defense Cost and Resource Center (DCARC) Knowledge Portal – The DOD centralized
repository of Earned Value Management (EVM) data.
US Government Accountability Office (GAO) online database – Repository containing
reports on DOD programs as reported by the independent, nonpartisan agency that
supports Congressional operation.
6.8 Responsibilities. The following organizations are responsible for the schedule
risk assessment:
AMSAA: Lead the schedule risk assessment.
PEO/PM: Provide program schedule and associated assumptions for study alternatives;
provide data for analogous programs that are used in the schedule risk assessment.
RDECs, OSD, DA G-3, Other Study Team Members: Provide data for analogous
programs that are used in the schedule risk assessment.
6.9 Schedule Risk Modeling. The AMSAA Risk Team will continue to improve the
quality of SRDDM by developing event driven models which incorporate a network of details
such as: the WBS, critical path logic, correlation of events, technical risk assessment outcomes,
SME input, etc. To execute and develop these event-driven models, AMSAA will work with
PMs, SMEs, contractors, and any other parties that can add insight into the event-driven process.
This event-driven model is called the Schedule Risk Event-Driven Methodology (SREDM). An
initial version of SREDM was developed in 2013, and advancements to the methodology are
currently in progress.
AMSAA intends to utilize both SRDDM and SREDM and reconcile any differences.
This will produce more robust schedule risk results and provide more confidence in the final
schedule risk assessment. Having two strategies to assess schedule risk may lead to more
credible results and prevent the formulation of poor conclusions. For example, if SRDDM
produces a high schedule risk and the event model provides a low schedule risk, reconciling the
differences may reveal that a critical event was missing from the event model. Factoring this
missing event element into the event model could then produce a more realistic result.

38
7. SOFTWARE RISK ASSESSMENT
7.1 Background. Software development is an area that can affect many DOD
acquisition programs. Some programs are purely focused on the development of software-based
systems while other systems utilize software components to achieve their required capability.
Because of this, it is necessary to have a process set in place with which to evaluate the technical
and schedule aspects of software risk within acquisition programs. The Army’s schedule risk
assessment methodology, previously outlined in this guidebook, may be acceptable to use when
examining the risk of a software system program schedule, assuming that an appropriate set of
historical analogous data can be identified. However, due to the unique nature of the technical
challenges that could arise, it was determined that the technical risk assessment methodology
described in this guidebook may not be suitable when considering software systems and
components.
Efforts are currently underway to develop a standard Army software risk methodology
that could be utilized for assessing the technical risks related to software. Development of this
methodology will be done by researching methods that have been utilized in other organizations
and by exploring the possibility of making modifications to the current Army risk
methodologies.
The information provided in this section is meant to highlight some of the issues that
could arise with applying the existing Army risk methodologies to software systems. It will also
explore some potential methods for adjusting the current methodologies to accommodate
software systems and components. In addition, an example of a risk assessment that AMSAA
conducted on a software-based system is presented as well.
7.2 Limitations in Applying Army Methodologies. The technical challenges
involved with software development would likely be very different than those encountered in the
development of other types of systems. This is due to the fundamental differences of the
components that make up software systems. For instance, the technical risk assessment
methodology outlined in this guidebook examines the maturity of KTs of the system under
consideration. However, a system that is software-based is typically not made up of distinct
physical technologies, but rather it consists of lines of code that implement the algorithms
necessary to achieve the intended functionality of the system. This code development would
undergo a different type of development process than what would be utilized to mature a
physical technology. As a result, the standard readiness level (TRL, MRL, and IRL) definitions
may not be applicable when attempting to measure the maturity of the software system or
software components. Since the technical risk methodology relies on determining the probability
of achieving a particular readiness level by a certain milestone date, a standard set of software
maturation levels would have to be developed and mapped to the various milestones within the
acquisition lifecycle.
Given that a standard set of software maturation levels can be developed, the technical
risk methodology described in this guidebook could be applied to software based systems or
software components that are considered KT’s of other systems. For a completely software-

39
based system, instead of defining a set of KT’s, the software system could be decomposed into a
distinct set of software sub-functions. Each of these sub-functions could then be assessed to
determine their current readiness, based on the description of a software technical readiness
definition. An assessment could then be made as to the time required to improve the current
technical readiness level. Because the maturity of the software sub-functions would be assessed
as distinct parts, it would also be necessary to examine the maturity of these sub-functions in
terms of integration within the system. Further investigation can be done to determine if the IRL
definitions defined previously in the guidebook would be applicable to the software sub-
functions, or if a separate set of software integration readiness levels would have to be
developed. Manufacturing would likely not be an area of risk that applies to software systems
and components. Therefore, a software equivalent to the MRL definitions would not be
necessary.
As stated previously, when attempting to analyze the risk of meeting a program schedule
for a purely software-based system, the Army’s schedule risk assessment methodology could be
utilized if historical data on the development times of other analogous programs can be
identified. Given that this information is obtainable, the methodology would be applied in the
same manner as outlined in the schedule risk assessment section of this guidebook. A potential
issue, however, would be in defining what is meant by analogous. To define an analogous
program for a software system, a different set of criteria than what is used for non-software
systems may have to be developed. Possible factors to consider for analogous comparisons may
be: the functionality of the system as a whole or amongst the individual sub functions,
complexity of the system and sub-functions, number of Source Lines of Code (SLOC) required,
and the Capability Maturity Model Integration (CMMI) rating for the system developer. Further
investigation will have to be conducted to determine which factors of analogous programs most
impact the total development time of a software system.
7.3 Software System Risk Assessment Example. The following section discusses a
process that AMSAA developed to support a recent software-based program AoA. The technical
and schedule risk assessments for this AoA were combined into one risk assessment. Because
this was a software-based system, the risk involved in developing the system would be largely
due to the time required to write code. The risk assessment incorporated both the technical
aspects of the system as well as the time to develop the system. The assessment examined the
current maturity of each specific software sub-function, and used the level of maturity as a basis
for determining the impact to the schedule for fully developing the sub-function.
The final risk results consisted of a set of feasibility packages, each with a specific risk
level associated. A given feasibility package consisted of a sub-set of all system sub-functions.
The risk level for a given feasibility package was determined by the time required to code and
integrate all of the sub-functions included within the given feasibility package. In order to
calculate the amount of time required to code and integrate a whole package of sub-functions, it
was necessary to first determine the time involved in developing each sub-function alone. The
paragraph below, along with Figure 9, describes the process that was used to determine this time.

40
Figure 9. Software Risk Assessment Process Flowchart
The Constructive Cost Model (COCOMO) was used to provide an estimate of SLOC
required to bring a sub-function that is either completely undeveloped or partially developed to
full functionality. To calculate the remaining SLOC size, COCOMO requires both a total SLOC
size and a software modification rating. The total SLOC required for a sub-function is the
amount of code that is necessary in order for that sub-function to be fully developed. This
amount was determined based on the complexity of the particular sub-function. Each sub-
function was assigned a complexity rating of high, medium, or low. Using historical data on
analogous programs, a mapping was developed that estimated a total SLOC size based on
function complexity.
Each sub-function was also assigned a software modification rating. This rating was
assigned based on a determination of the percent of software development remaining for the sub-
function. A given rating has an upper and lower percentage bound for the amount of work
remaining. For example, if a sub-function had a rating of 4, then 20% to 40% of work still
remained in order to fully develop that sub-function. COCOMO uses only one percentage value
to determine the remaining SLOC size. However, in order to do the risk assessment, an upper
and lower calculation for remaining SLOC was necessary. As a result, COCOMO was applied
twice; once using the upper percentage bound, and once using the lower percentage bound.
The upper and lower remaining SLOC values were used to calculate an upper and lower
bound for time to develop the function. This was calculated by multiplying the remaining SLOC
by the productivity rate. The productivity rate was given as the number of hours per SLOC
(HRS/SLOC). This value was estimated based on calculated productivity rates from historical
data on analogous programs.

41
As was mentioned previously, feasibility packages with an associated risk rating were
constructed. For a given package, the risk level was determined by summing the upper and
lower time bounds for all sub-functions considered, and examining where that total band fell
with respect to the schedule deadline. The level of risk was assessed as low if both the upper and
lower time bounds of a package fell to the left of the target date. If the target date fell in between
the upper and lower time bounds, the package was assessed to be a moderate risk. If the upper
and lower time bounds both fell to the right of the target date, the package was assigned a risk
rating of high. The determination of risk levels is illustrated in Figure 10 below.
Figure 10. Risk Level Determination

42
8. SUMMARY
To date, 12 acquisition studies have been completed that utilized variations of the
methodologies defined in this guidebook. AMSAA, with support from the Risk IPT, has
numerous methodology and process improvement initiatives that are ongoing or planned. The
major current initiatives include development of a Schedule Risk Event-Driven Methodology
(SREDM), a Risk-Informed Trade Space Methodology (RITSM), and a Historical Risk
Database. Since these methodologies may evolve over time, based on lessons learned from
additional applications, and current methodology initiatives, AMSAA should be consulted to
determine if any changes or improvements have been made. This guidebook will be updated as
necessary to document major methodology changes.

A-1
APPENDIX A – TECHNOLOGY READINESS LEVEL (TRL)

A-2
THIS PAGE INTENTIONALLY LEFT BLANK.

A-3
TECHNOLOGY READINESS LEVEL (TRL)
TRL is a systematic metric/measurement system used by government agencies, including
the Department of Defense, which supports assessment of the maturity of a particular technology
and the consistent comparison of maturity between different types of technologies. The table
below provides TRL definitions and descriptions for each level. When looking to make a
readiness level assessment, consider the questions provided. If you answer ‘yes’ to the questions
for a given TRL, the technology is likely at that TRL. If you answer ‘no’ to any of the questions
for a given TRL, the technology is likely at a lower TRL. Continue descending on the TRL scale
until you can answer ‘yes’ to the questions at a given TRL.
TRL Definition Description Questions to Consider
9
Actual system proven
through successful
mission operations.
Actual application of the technology in
its final form and under mission
conditions, such as those encountered in
operational test and evaluation (OT&E).
Examples include using the system
under operational mission conditions.
Has the Operational Concept
been implemented
successfully?
Has the actual system been
fully demonstrated?
Has the system been installed
and deployed in its intended
platform?
8
Actual system
completed and
qualified through test
and demonstration.
Technology has been proven to work in
its final form and under expected
conditions. In almost all cases, this TRL
represents the end of true system
development. Examples include
developmental test and evaluation
(DT&E) of the system in its intended
weapon system to determine if it meets
design specifications.
Has the system been formed,
fitted, and function designed
for its intended platform?
Has all functionality been
demonstrated in simulated
operational environment?
Has the system been qualified
through test and evaluation on
the actual platform (DT&E
completed)?
7
System prototype
demonstration in an
operational
environment.
Prototype near or at planned operational
system. Represents a major step up
from TRL 6 by requiring demonstration
of an actual system prototype in an
operational environment (e.g., in an air-
craft, in a vehicle, or in space).
Has the system been tested in
an operational environment, but
not the eventual platform?
Has the system prototype been
successfully tested in a field
environment?
Has M&S been used to
simulate some unavailable
elements of the system?
6
System/subsystem
model or prototype
demonstration in a
relevant
environment.
Representative model or prototype
system, which is well beyond that of
TRL 5, is tested in a relevant
environment. Represents a major step
up in a technology’s demonstrated
readiness. Examples include testing a
prototype in a high-fidelity laboratory
environment or in a simulated
operational environment.
Has the engineering feasibility
been fully demonstrated? o System requirements finalized
(reliability, technical, etc)?
o Operating environment defined?
Has a representative
model/prototype been tested in
a high-fidelity lab or simulated
operational environment? o Relevant environment defined?
o Tested at relevant environment?
o What is the margin of safety, test to failure, sensitivity (robustness)?

A-4
Has M&S been used to
simulate system performance in
an operational environment? o M&S and test correlation?
5
Component and/or
breadboard validation
in a relevant
environment.
Fidelity of breadboard technology
increases significantly. The basic
technological components are
integrated with reasonably realistic
supporting elements so they can be
tested in a simulated environment.
Examples include “high-fidelity”
laboratory integration of components.
Are the system interface
requirements known?
Has high fidelity lab integration
of the system been completed
and the system ready for test in
realistic/simulated
environments?
Is the physical work breakdown
structure available?
4
Component and/or
breadboard validation
in a laboratory
environment.
Basic technological components are
integrated to establish that they will
work together. This is relatively “low
fidelity” compared with the eventual
system. Examples include integration of
“ad hoc” hardware in the laboratory.
Have laboratory experiments
with available components of
the system show that they can
work together?
Has low fidelity system
integration and engineering
been completed in a lab
environment?
Has a functional work
breakdown structure been
developed?
3
Analytical and
experimental critical
function and/or
characteristic proof
of concept.
Active R&D is initiated. This includes
analytical studies and laboratory studies
to physically validate the analytical
predictions of separate elements of the
technology. Examples include
components that are not yet integrated
or representative.
Have predictions of technology
capability been validated by
analytical studies?
Are paper studies available that
indicate the system components
ought to work together?
Has scientific feasibility been
fully demonstrated?
2
Technology concept
and/or application
formulated.
Invention begins. Once basic principles
are observed, practical applications can
be invented. Applications are
speculative, and there may be no proof
or detailed analysis to support the
assumptions. Examples are limited to
analytic studies.
Have the basic elements of the
technology been identified?
Are paper studies available that
indicate the application is
feasible?
Are the experiments that need
to be performed to research the
technology known?
1
Basic principles
observed and
reported.
Lowest level of technology readiness.
Scientific research begins to be
translated into applied research and
development (R&D). Examples might
include paper studies of a technology’s
basic properties.
Have the physical laws and
assumptions used in this
technology been defined?
Are paper studies available to
confirm basic principles?
Has a research hypothesis been
formulated?

A-5
DEFINITIONS:
BREADBOARD: Integrated components that provide a representation of a system/subsystem and which
can be used to determine concept feasibility and to develop technical data. Typically configured for
laboratory use to demonstrate the technical principles of immediate interest. May resemble final
system/subsystem in function only.
“HIGH FIDELITY”: Addresses form, fit and function. High-fidelity laboratory environment would
involve testing with equipment that can simulate and validate all system specifications within a laboratory
setting.
“LOW FIDELITY”: A representative of the component or system that has limited ability to provide
anything but first order information about the end product. Low-fidelity assessments are used to provide
trend analysis.
MODEL: A functional form of a system, generally reduced in scale, near or at operational specification.
Models will be sufficiently hardened to allow demonstration of the technical and operational capabilities
required of the final system.
OPERATIONAL ENVIRONMENT: Environment that addresses all of the operational requirements and
specifications required of the final system to include platform/packaging.
PROTOTYPE: A physical or virtual model used to evaluate the technical or manufacturing feasibility or
military utility of a particular technology or process, concept, end item or system.
RELEVANT ENVIRONMENT: Testing environment that simulates the key aspects of the operational
environment.
SIMULATED OPERATIONAL ENVIRONMENTAL: Either 1) a real environment that can simulate all
of the operational requirements and specifications required of the final system, or 2) a simulated
environment that allows for testing of a virtual prototype; used in either case to determine whether a
developmental system meets the operational requirements and specifications of the final system.

A-6
THIS PAGE INTENTIONALLY LEFT BLANK.

B-1
APPENDIX B – INTEGRATION READINESS LEVEL (IRL)

B-2
THIS PAGE INTENTIONALLY LEFT BLANK.

B-3
INTEGRATION READINESS LEVEL (IRL)
IRL is a systematic measurement of the level of integration between a technology and the
environment into which it will operate. The environment consists of various physical systems
(electrical, mechanical, hydraulic, informational, etc), other technologies, functional groups such
as manufacturing and service, regulations, military standards, test environments, etc. Adequate
interfaces between the technology and environment are required to meet overall system
performance requirements. The IRL provides an indicator of the level of accountability of these
interfaces affecting technology implementation. IRL is not yet an approved DOD measure. It
was developed by the Stevens Institute of Technology, with modifications made by TARDEC for
use in Army Risk Assessments. The table below provides IRL definitions and descriptions for
each level. When looking to make a readiness level assessment, consider the questions provided.
If you answer ‘yes’ to the questions for a given IRL, the technology is likely at that IRL. If you
answer ‘no’ to any of the questions for a given IRL, the technology is likely at a lower IRL.
Continue descending on the IRL scale until you can answer ‘yes’ to the questions at a given IRL.
IRL Definition Description Questions to Consider
9
Actual integration
completed and
Mission Qualified
through test and
demonstration in the
system environment.
Product design features and
configuration are stable. System design
has been validated through operational
testing of Low Rate Initial Production
(LRIP) items. Physical Configuration
Audit (PCA) or equivalent complete as
necessary. Design freeze is in place. All
changes require formal Engineering
Change Proposal (ECP) approval
process. All key characteristics (KCs)
are controlled in LRIP to threshold
quality levels. All component, element,
assembly and subsystem specifications
have been demonstrated to be satisfied
in a repeatable fashion in the mass
production facilities using specified
materials, process, machinery,
equipment and tooling.
Has a fully integrated system
demonstrated operational
effectiveness and suitability in
its intended or a representative
operational environment?
Have interface failures/failure
rates been fully characterized
and consistent with user
requirements?
8
Functionality of
integration
technology has been
demonstrated in
prototype modified
vehicles.
Detailed design of product features and
interfaces is complete. All product data
essential for system manufacturing has
been released. Design changes do not
significantly impact LRIP. KCs are
attainable based upon pilot line
demonstrations. Component and
element specifications have been
established and been agreed to by
configuration item (CI) component and
platform integrating manufacturers.
Functionality of integration items has
been demonstrated in prototype
modified vehicles.
Are all integrated systems able
to meet overall system
requirements in an operational
environment?
Have system interfaces been
qualified and functioning
correctly in an operational
environment?
Has integration testing been
closed out with test results,
anomalies, deficiencies and
corrective actions documented?

B-4
7
Technology
integration has been
verified and validated
with sufficient detail
to be actionable.
Product requirements and features are
well enough defined to support critical
design review, even though design
changes may be significant. All product
data essential for component
manufacturing has been released.
Potential KC risk issues have been
identified and mitigation plan is in
place. Full prototype integration CIs
have been successfully integrated and
shown to have functional requirement
compliance in system integration labs
(SILs).
Has end-to-end functionality of
the systems integration been
successfully demonstrated?
Has each system interface been
tested individually under
stressed and anomalous
conditions?
Has the fully integrated
prototype been demonstrated in
actual or simulated operational
environments?
6
Integration element
baseline established.
Integration element baseline
established; platform interfaces have all
been identified and agreed to. All
enabling/key technologies/components
for the integration CIs have been
demonstrated. Preliminary design KCs
defined. Notional interface proposals
with constraints have been established
(mechanical, all required vehicle
modifications to accept technologies to
be integrated, electrical/cabling,
wireless protocol, security, human
interface etc.). The integrating
technologies can Accept, Translate, and
Structure Information for its intended
application.
Have individual systems been
tested to verify that the system
components work together?
Have integrated system
demonstrations been
successfully completed?
External interfaces established
(hardware, software, physical
interfaces, and functional
interfaces)?
Interface analysis?
Test requirements of
interfacing systems and
acceptance criteria?
Met all interfacing
requirements by tests or
analysis (systems work
together)?
5
Major integrating
technology functions
demonstrated with
prototypes,
engineering models
or in laboratories.
Lower level performance requirements
sufficient to proceed to preliminary
design. All enabling/key technologies
and components identified and consider
the product lifecycle. Evaluation of
design KCs initiated. Product data
required for prototype component
manufacturing released. Major
functions of the integrating technology
have been demonstrated with
prototypes, engineering models or in
laboratories. There is sufficient Control
between technologies necessary to
establish, manage, and terminate the
integration.
Has an Interface Control Plan
been implemented (i.e.
Interface Control Document
created, Interface Control
Working Group formed, etc.)?
Are external interfaces well
defined (i.e. source, data
formats, structure, content,
method of support, etc.)?
Have system interface
requirements specification been
drafted?

B-5
4
There is sufficient
detail in the quality
and assurance of the
integration
technologies.
Integrating technologies have proposed
interfaces established for a targeted
platform for a proposed technology
insertion or a SIL. Initial potential Key
Performance Parameters (KPPs)
identified for preferred systems
concept. Integration CI characteristics
and measures to support required
capabilities identified. Form, fit, and
function constraints identified and
manufacturing capabilities identified for
integration CIs. Limited functionality
for integration elements has been
demonstrated via simulation, or a
preliminary integration scheme has
been implemented to permit collection
of integration technology performance
data in a laboratory.
Are overall system
requirements for end users’
application known/baselined?
Have analyses or internal
interface requirements been
completed?
Has a rigorous requirements
inspection process been
implemented?
3
Integration features
for integration
technology elements
have been modeled.
Top level performance requirements
defined. Trade-offs in design options
assessed based on models. Product
lifecycle and technical requirements
evaluated. Integration features for
integration technology elements have
been modeled. There is compatibility
(i.e., common language) between
technologies to orderly and efficiently
integrate and interact.
Have high-level system
interface diagrams been
completed?
Are the interface requirements
defined at the concept level?
2
There is some level
of specificity to
characterize
technology
interaction (i.e.,
ability to influence)
between technologies
through their
interface.
Applications defined. Broad
performance goals identified. Proposed
configuration concepts developed and
modeled enough for "Proof of Concept"
for the integration technology. Some
generalized integration CI interface
schemes have been proposed.
Are the inputs/outputs for
principal integration
technologies known,
characterized and documented?
Have the principal interface
requirements for integration
technologies been
defined/drafted?
1
An interface has been
identified with
sufficient detail to
allow
characterization of
the technology
relationship.
Interfaces between technologies have
been identified. Capabilities exist to
provide a solution for a need, but little
consideration has been given to
potential applications and integration
schemes.
Have the principal integration
technologies been identified?
Have the top-level functional
architecture and interface
points been defined?
Is the availability of principal
integration technologies known
and documented?

B-6
THIS PAGE INTENTIONALLY LEFT BLANK.
C-1
APPENDIX C – MANUFACTURING READINESS LEVEL (MRL)

C-2
THIS PAGE INTENTIONALLY LEFT BLANK.

C-3
MANUFACTURING READINESS LEVEL (MRL)
MRL is a systematic metric/measurement system that supports assessment of the maturity
of a given technology, component or system from a manufacturing perspective. The table below
provides MRL definitions and descriptions for each level. When looking to make a readiness
level assessment, consider the questions provided. If you answer ‘yes’ to the questions for a
given MRL, the technology is likely at that MRL. If you answer ‘no’ to any of the questions for
a given MRL, the technology is likely at a lower MRL. Continue descending on the MRL scale
until you can answer ‘yes’ to the questions at a given MRL.
MRL Definition Description Questions to Consider
10
Full Rate Production
demonstrated and
lean production
practices in place.
This is the highest level of production
readiness. Technologies should have
matured to TRL 9. This level of
manufacturing is normally associated
with the Production or Sustainment
phases of the acquisition life cycle.
Engineering/design changes are few
and generally limited to quality and
cost improvements. System,
components or items are in full rate
production and meet all engineering,
performance, quality and reliability
requirements. Manufacturing process
capability is at the appropriate quality
level. All materials, tooling, inspection
and test equipment, facilities and
manpower are in place and have met
full rate production requirements. Rate
production unit costs meet goals, and
funding is sufficient for production at
required rates. Lean practices are well
established and continuous process
improvements are ongoing.
Does industrial capability
support FRP?
Is the product design stable?
Are manufacturing processes
stable, adequately controlled,
capable, and achieve program
FRP objectives?
Are production facilities in
place and capacity
demonstrated to meet
maximum FRP requirements?
9
Low rate production
demonstrated;
Capability in place to
begin Full Rate
Production.
At this level, the system, component or
item has been previously produced, is
in production, or has successfully
achieved low rate initial production.
Technologies should have matured to
TRL 9. This level of readiness is
normally associated with readiness for
entry into Full Rate Production (FRP).
All systems engineering/design
requirements should have been met
such that there are minimal system
changes. Major system design features
are stable and have been proven in test
and evaluation. Materials are available
to meet planned rate production
schedules. Manufacturing process
capability in a low rate production
Is industrial capability in place
to support start of FRP?
Are major product design
features and configuration
designs stable?
Are manufacturing processes
stable, adequately controlled,
capable, and achieve program
LRIP objectives?
Are manufacturing facilities in
place and demonstrated in
LRIP?

C-4
environment is at an appropriate quality
level to meet design key characteristic
tolerances. Production risk monitoring
is ongoing. LRIP cost targets have been
met, and learning curves have been
analyzed with actual data. The cost
model has been developed for FRP
environment and reflects the impact of
continuous improvement.
8
Pilot line capability
demonstrated; Ready
to begin Low Rate
Initial Production.
This level is associated with readiness
for a Milestone C decision, and entry
into Low Rate Initial Production
(LRIP). Technologies should have
matured to at least TRL 7. Detailed
system design is complete and
sufficiently stable to enter low rate
production. All materials, manpower,
tooling, test equipment and facilities are
proven on pilot line and are available to
meet the planned low rate production
schedule. Manufacturing and quality
processes and procedures have been
proven in a pilot line environment and
are under control and ready for low rate
production. Known producibility risks
pose no significant challenges for low
rate production. Cost model and yield
and rate analyses have been updated
with pilot line results. Supplier
qualification testing and first article
inspection have been completed. The
Industrial Capabilities Assessment for
Milestone C has been completed and
shows that the supply chain is
established to support LRIP.
Has the Industrial Capability
Assessment (ICA) for MS C
been completed?
Has a detailed design of
product features and interfaces
been completed?
Have manufacturing processes
been verified for LRIP on a
pilot line?
Have pilot line facilities been
demonstrated?
7
Capability to produce
systems, subsystems,
or components in a
production
representative
environment.
This level of manufacturing readiness is
typical for the mid-point of the
Engineering and Manufacturing
Development (EMD) Phase leading to
the Post-CDR Assessment.
Technologies should be on a path to
achieve TRL 7.System detailed design
activity is nearing completion. Material
specifications have been approved and
materials are available to meet the
planned pilot line build schedule.
Manufacturing processes and
procedures have been demonstrated in a
production representative environment.
Detailed producibility trade studies are
completed and producibility
enhancements and risk assessments are
underway. The cost model has been
Has industrial capability to
support production been
analyzed?
Have product requirements and
features been well enough
defined to support critical
design review, even though
design changes may be
significant?
Have manufacturing processes
been demonstrated in a
production representative
environment?
Have manufacturing facilities
been identified and plans
developed to produce LRIP
build?

C-5
updated with detailed designs, rolled up
to system level, and tracked against
allocated targets.
6
Capability to produce
a prototype system or
subsystem in a
production relevant
environment.
Unit cost reduction efforts have been
prioritized and are underway. Yield and
rate analyses have been updated with
production representative data. The
supply chain and supplier quality
assurance have been assessed and long-
lead procurement plans are in place.
Manufacturing plans and quality targets
have been developed. Production
tooling and test equipment design and
development have been initiated.
Has the ICA for MS B been
completed?
Has the system allocated
baseline been established?
Have the manufacturing
processes been demonstrated in
a production relevant
environment? o Pre-production hardware built to
same level of quality? o Quality level established?
o Critical manufacturing processes
prototyped?
Have the manufacturing
facilities been identified and
plans been developed to
produce pilot line build?
5
Capability to produce
prototype
components in a
production relevant
environment.
This level of maturity is typical of the
mid-point in the Technology
Development Phase of acquisition, or in
the case of key technologies, near the
mid-point of an Advanced Technology
Demonstration (ATD) project.
Technologies should have matured to at
least TRL 5. The industrial base has
been assessed to identify potential
manufacturing sources. A
manufacturing strategy has been refined
and integrated with the risk
management plan. Identification of
enabling/key technologies and
components is complete. Prototype
materials, tooling and test equipment,
as well as personnel skills have been
demonstrated on components in a
production relevant environment, but
many manufacturing processes and
procedures are still in development.
Manufacturing technology development
efforts have been initiated or are
ongoing. Producibility assessments of
key technologies and components are
ongoing. A cost model has been
constructed to assess projected
manufacturing cost.
Has an industrial base
assessment been initiated to
identify potential
manufacturing sources?
Are lower level performance
requirements sufficient to
proceed to preliminary design?
Has maturity been assessed on
similar processes in
production?
Have manufacturing facilities
been identified and plans been
developed to produce
prototypes?
4
Capability to produce
the technology in a
laboratory
environment.
This level of readiness acts as an exit
criterion for the Materiel Solution
Analysis (MSA) Phase approaching a
Milestone A decision. Technologies
should have matured to at least TRL 4.
This level indicates that the
Have industrial base
capabilities been surveyed and
known gaps/risks identified for
preferred concept, key
technologies, components,
and/or key processes?

C-6
technologies are ready for the
Technology Development Phase of
acquisition. At this point, required
investments, such as manufacturing
technology development, have been
identified. Processes to ensure
manufacturability, producibility, and
quality are in place and are sufficient to
produce technology demonstrators.
Have form, fit, and function
constraints been identified and
manufacturing capabilities
identified for preferred systems
concepts?
Has a survey to determine the
current state of critical
processes been completed?
Has the availability of
manufacturing facilities for
prototype development and
production been evaluated?
3
Manufacturing Proof
of Concept
Developed.
Manufacturing risks have been
identified for building prototypes and
mitigation plans are in place. Target
cost objectives have been established
and manufacturing cost drivers have
been identified. Producibility
assessments of design concepts have
been completed. Key design
performance parameters have been
identified as well as any special tooling,
facilities, material handling and skills
required.
Have potential sources been
identified for technology
needs?
Have top level performance
requirements been defined?
Have high level manufacturing
processes been documented?
Have specialized facility
requirements/needs been
identified?
2 Manufacturing
Concepts Identified.
This level is characterized by
describing the application of new
manufacturing concepts. Applied
research translates basic research into
solutions for broadly defined military
needs. Typically this level of readiness
includes identification, paper studies
and analysis of material and process
approaches. An understanding of
manufacturing feasibility and risk is
emerging.
Have broad performance goals
been identified that may drive
manufacturing options?
Have materials and/or process
approaches been identified?
1
Basic Manufacturing
Implications
Identified.
The focus is to address manufacturing
shortfalls and opportunities needed to
achieve program objectives. Basic
research (i.e., funded by budget
activity) begins in the form of studies.
Have manufacturing research
opportunities been identified?

C-7
THIS PAGE INTENTIONALLY LEFT BLANK.

D-1
APPENDIX D – SAMPLE RDEC TECHNICAL RISK ASSESSMENT GUIDANCE

D-2
THIS PAGE INTENTIONALLY LEFT BLANK.

D-3
SAMPLE RDEC TECHNICAL RISK ASSESSMENT GUIDANCE
ANALYSIS OF ALTERNATIVES (AoA)
TECHNICAL RISK ASSESSMENT
RESEARCH, DEVELOPMENT & ENGINEERING CENTER (RDEC)
SUBJECT MATTER EXPERT (SME) GUIDANCE
TECHNOLOGY: _________________________________________________________________________
SME (NAME, PHONE, EMAIL):____________________________________________________________
SCOPE: TARDEC is performing a technical risk assessment in support of the XXXX AoA. The technical
risk assessment encompasses the following:
Collection of historical technical data for technologies.
Identification of key technologies.
Assessment of technology maturity, integration and manufacturing readiness for key technologies and
technologies of interest.
Identification and assessment of risks.
PM, XXXX has provided historical technical data for the technologies. You are requested to determine if the
technology is a key technology, assign a technology readiness level (TRL), an integration readiness level
(IRL) and a manufacturing level (MRL) and identify any technical risks and mitigation steps if known. The
assessment of the risks will be performed at a risk workshop and is not a required action by you at this time.
INSTRUCTIONS: Read this document in its entirety.
1) Review Data and Traceability Information
Review data related to your technology and the alternative. For requirements related information, reference the
provided CDD requirements and links to performance specifications. You may also want to consider talking to
other groups that may have integrated your technology on their program to gather additional information
pertaining to readiness levels and risks. Determine if you have enough information to perform items 2 – 6
listed below. If yes, continue to item 2. If no, contact the PM, XXXX SME or the candidate system POC.
2) Key Technologies
Identify the key technologies (KTs) from the list of technologies under consideration. KTs should be
determined similarly to guidance in Army TRA Guidance (June 2011) for determining whether or not a
technology is key.20
The criteria used to assess key technologies are as follows:
1. First, does the technology pose major technological risk during development?
2. Second, does the system depend on this technology to meet Key Performance Parameters (KPP),
Key System Attributes (KSA), or designed performance?
3. Third, is the technology or its application new or novel or is the technology modified beyond
design intent?
If the answer to question 1 is ‘Yes’, then the technology is key. If the answer to both questions 2
AND 3 are ‘Yes’, then the technology is also key.
20 Army Technology Readiness Assessment Guidance, Deputy Assistant Secretary of Army for Research and
Technology (DASA(R&T)), June 2011.

D-4
It is not enough to state that a particular technology is classified as key. A rationale explaining why
the technology has been identified as a KT is required and must be provided by each technology SME.
:
Determine if the technology is a key technology and provide rationale in the table provided below.
Technology Is this a key technology?
Answer yes or no. Rationale
3) Technology Readiness Level (TRL)
The table below provides TRL definitions and descriptions for each level. Also consider the questions
provided. If you answer yes to the questions for a given TRL, the technology is likely at that TRL. If you
answer no to any of the questions for a given TRL, the technology is likely at a lower TRL. Continue
descending on the TRL scale until you can answer yes to the questions at a given TRL.
TRL Definition Description Questions to Consider
9
Actual system proven
through successful
mission operations.
Actual application of the technology in its
final form & under mission conditions,
such as those encountered in operational
test & evaluation (OT&E). Examples
include using the system under
operational mission conditions.
Has the Operational Concept been
implemented successfully?
Has the actual system been fully
demonstrated?
Has the system been installed & deployed
in its intended platform?
8
Actual system
completed & qualified
through test &
demonstration.
Technology has been proven to work in
its final form & under expected
conditions. In almost all cases, this TRL
represents the end of true system
development. Examples include
developmental test & evaluation (DT&E)
of the system in its intended weapon
system to determine if it meets design
specifications.
Has the system been formed, fitted, &
function designed for its intended
platform?
Has all functionality been demonstrated in
simulated operational environment?
Has the system been qualified through test
& evaluation on the actual platform
(DT&E completed)?
7
System prototype
demonstration in an
operational
environment.
Prototype near or at planned operational
system. Represents a major step up from
TRL 6 by requiring demonstration of an
actual system prototype in an operational
environment (e.g., in an air-craft, in a
vehicle, or in space).
Has the system been tested in an
operational environment, but not the
eventual platform?
Has the system prototype been successfully
tested in a field environment?
Has M&S been used to simulate some
unavailable elements of the system?
6
System/subsystem
model or prototype
demonstration in a
relevant environment.
Representative model or prototype
system, which is well beyond that of TRL
5, is tested in a relevant environment.
Represents a major step up in a
technology’s demonstrated readiness.
Has the engineering feasibility been fully
demonstrated?
o System requirements finalized
(reliability, technical, etc)?
o Operating environment defined?

D-5
Examples include testing a prototype in a
high-fidelity laboratory environment or in
a simulated operational environment.
Has a representative model/prototype been
tested in a high-fidelity lab or simulated
operational environment?
o Relevant environment defined?
o Tested at relevant environment?
o What is the margin of safety, test to
failure, sensitivity (robustness)?
Has M&S been used to simulate system
performance in an operational
environment?
o M&S & test correlation?
5
Component &/or
breadboard validation
in a relevant
environment.
Fidelity of breadboard technology
increases significantly. The basic
technological components are integrated
with reasonably realistic supporting
elements so they can be tested in a
simulated environment. Examples include
“high-fidelity” laboratory integration of
components.
Are the system interface requirements
known?
Has high fidelity lab integration of the
system been completed & the system ready
for test in realistic/simulated
environments?
Is the physical work breakdown structure
available?
4
Component &/or
breadboard validation
in a laboratory
environment.
Basic technological components are
integrated to establish that they will work
together. This is relatively “low fidelity”
compared with the eventual system.
Examples include integration of “ad hoc”
hardware in the laboratory.
Have laboratory experiments with
available components of the system show
that they can work together?
Has low fidelity system integration &
engineering been completed in a lab
environment?
Has a functional work breakdown structure
been developed?
3
Analytical &
experimental critical
function &/or
characteristic proof of
concept.
Active R&D is initiated. This includes
analytical studies & laboratory studies to
physically validate the analytical
predictions of separate elements of the
technology. Examples include
components that are not yet integrated or
representative.
Have predictions of technology capability
been validated by analytical studies?
Are paper studies available that indicate
the system components ought to work
together?
Has scientific feasibility been fully
demonstrated?
2
Technology concept
&/or application
formulated.
Invention begins. Once basic principles
are observed, practical applications can be
invented. Applications are speculative, &
there may be no proof or detailed analysis
to support the assumptions. Examples are
limited to analytic studies.
Have the basic elements of the technology
been identified?
Are paper studies available that indicate
the application is feasible?
Are the experiments that need to be
performed to research the technology
known?
1
Basic principles
observed & reported.
Lowest level of technology readiness.
Scientific research begins to be translated
into applied research & development
(R&D). Examples might include paper
Have the physical laws & assumptions
used in this technology been defined?
Are paper studies available to confirm
basic principles?

D-6
studies of a technology’s basic properties.
Has a research hypothesis been
formulated?
Assign current TRL and provide rationale for rating in the table provided below.
Technology TRL Rationale
4) Integration Readiness Level (IRL)
The table below provides IRL definitions and descriptions for each level. Also consider the questions
provided. If you answer yes to the questions for a given IRL, the technology is likely at that IRL. If you
answer no to any of the questions for a given IRL, the technology is likely at a lower IRL. Continue
descending on the IRL scale until you can answer yes to the questions at a given IRL.
IRL Definition Description Questions to Consider
9
Actual integration
completed and
Mission Qualified
through test and
demonstration in the
system environment.
Product design features and
configuration are stable. System design
has been validated through operational
testing of LRIP items. Physical
Configuration Audit (PCA) or
equivalent complete as necessary.
Design freeze is in place. All changes
require formal Engineering Change
Proposal (ECP) approval process. All
KCs are controlled in LRIP to threshold
quality levels. All component, element,
assembly and subsystem specifications
have been demonstrated to be satisfied
in a repeatable fashion in the mass
production facilities using specified
materials, process, machinery,
equipment and tooling.
Has a fully integrated system
demonstrated operational
effectiveness and suitability in
its intended or a representative
operational environment?
Have interface failures/failure
rates been fully characterized
and consistent with user
requirements?
8
Functionality of
integration
technology has been
demonstrated in
prototype modified
vehicles.
Detailed design of product features and
interfaces is complete. All product data
essential for system manufacturing has
been released. Design changes do not
significantly impact Low Rate Initial
Production (LRIP). KCs are attainable
based upon pilot line demonstrations.
Component and element specifications
have been established and been agreed
to by CI component and platform
integrating manufacturers. Functionality
of integration items has been
demonstrated in prototype modified
vehicles.
Are all integrated systems able
to meet overall system
requirements in an operational
environment?
Have system interfaces been
qualified and functioning
correctly in an operational
environment?
Has integration testing been
closed out with test results,
anomalies, deficiencies and
corrective actions documented?

D-7
7
Technology
integration has been
verified and validated
with sufficient detail
to be actionable.
Product requirements and features are
well enough defined to support critical
design review, even though design
changes may be significant. All product
data essential for component
manufacturing has been released.
Potential KC risk issues have been
identified and mitigation plan is in
place. Full prototype integration CIs
have been successfully integrated and
shown to have functional requirement
compliance in SILs.
Has end-to-end functionality of
the systems integration been
successfully demonstrated?
Has each system interface been
tested individually under
stressed and anomalous
conditions?
Has the fully integrated
prototype been demonstrated in
actual or simulated operational
environments?
6
Integration element
baseline established.
Integration element baseline
established; platform interfaces have all
been identified and agreed to. All
enabling/key technologies/components
for the integration CIs have been
demonstrated. Preliminary design KCs
defined. Notional interface proposals
with constraints have been established
(mechanical, all required vehicle
modifications to accept technologies to
be integrated, electrical/cabling,
wireless protocol, security, human
interface etc.). The integrating
technologies can Accept, Translate, and
Structure Information for its intended
application.
Have individual systems been
tested to verify that the system
components work together?
Have integrated system
demonstrations been
successfully completed?
External interfaces established
(hardware, software, physical
interfaces, and functional
interfaces)?
Interface analysis?
Test requirements of
interfacing systems and
acceptance criteria?
Met all interfacing
requirements by tests or
analysis (systems work
together)?
5
Major integrating
technology functions
demonstrated with
prototypes,
engineering models
or in laboratories.
Lower level performance requirements
sufficient to proceed to preliminary
design. All enabling/key technologies
and components identified and consider
the product lifecycle. Evaluation of
design Key Characteristics (KC)
initiated. Product data required for
prototype component manufacturing
released. Major functions of the
integrating technology have been
demonstrated with prototypes,
engineering models or in laboratories.
There is sufficient Control between
technologies necessary to establish,
manage, and terminate the integration.
Has an Interface Control Plan
been implemented (i.e.
Interface Control Document
created, Interface Control
Working Group formed, etc.)?
Are external interfaces well
defined (i.e. source, data
formats, structure, content,
method of support, etc.)?
Have system interface
requirements specification been
drafted?
4
There is sufficient
detail in the quality
Integrating technologies have proposed
interfaces established for a targeted
Are overall system
requirements for end users’
application known/baselined?

D-8
and assurance of the
integration
technologies.
platform for a proposed technology
insertion or a Systems Integration Lab
(SIL). Initial potential Key Performance
Parameters (KPPs) identified for
preferred systems concept. Integration
CI characteristics and measures to
support required capabilities identified.
Form, fit, and function constraints
identified and manufacturing
capabilities identified for integration
CIs. Limited functionality for
integration elements has been
demonstrated via simulation, or a
preliminary integration scheme has
been implemented to permit collection
of integration technology performance
data in a laboratory.
Have analyses or internal
interface requirements been
completed?
Has a rigorous requirements
inspection process been
implemented?
3
Integration features
for integration
technology elements
have been modeled.
Top level performance requirements
defined. Trade-offs in design options
assessed based on models. Product
lifecycle and technical requirements
evaluated. Integration features for
integration technology elements have
been modeled. There is compatibility
(i.e., common language) between
technologies to orderly and efficiently
integrate and interact.
Have high-level system
interface diagrams been
completed?
Are the interface requirements
defined at the concept level?
2
There is some level
of specificity to
characterize
technology
interaction (i.e.,
ability to influence)
between technologies
through their
interface.
Applications defined. Broad
performance goals identified. Proposed
configuration concepts developed and
modeled enough for "Proof of Concept"
for the integration technology. Some
generalized integration Configuration
Item (CI) interface schemes have been
proposed.
Are the inputs/outputs for
principal integration
technologies known,
characterized and documented?
Have the principal interface
requirements for integration
technologies been
defined/drafted?
1
An interface has been
identified with
sufficient detail to
allow
characterization of
the technology
relationship.
Interfaces between technologies have
been identified. Capabilities exist to
provide a solution for a need, but little
consideration has been given to
potential applications and integration
schemes.
Have the principal integration
technologies been identified?
Have the top-level functional
architecture and interface
points been defined?
Is the availability of principal
integration technologies known
and documented?

D-9
Assign current IRL and provide rationale for rating in the table provided below.
Technology IRL Rationale
5) Manufacturing Readiness Level (MRL)
The table below provides MRL definitions and descriptions for each level. Also consider the questions
provided. If you answer yes to the questions for a given MRL, the technology is likely at that MRL. If you
answer no to any of the questions for a given MRL, the technology is likely at a lower MRL. Continue
descending on the MRL scale until you can answer yes to the questions at a given MRL.
MRL Definition Description Questions to Consider
10
Full Rate Production
demonstrated and
lean production
practices in place.
This is the highest level of production
readiness. Technologies should have
matured to TRL 9. This level of
manufacturing is normally associated
with the Production or Sustainment
phases of the acquisition life cycle.
Engineering/design changes are few
and generally limited to quality and
cost improvements. System,
components or items are in full rate
production and meet all engineering,
performance, quality and reliability
requirements. Manufacturing process
capability is at the appropriate quality
level. All materials, tooling, inspection
and test equipment, facilities and
manpower are in place and have met
full rate production requirements. Rate
production unit costs meet goals, and
funding is sufficient for production at
required rates. Lean practices are well
established and continuous process
improvements are ongoing.
Does industrial capability
support FRP?
Is the product design stable?
Are manufacturing processes
stable, adequately controlled,
capable, and achieve program
FRP objectives?
Are production facilities in
place and capacity
demonstrated to meet
maximum FRP requirements?
9
Low rate production
demonstrated;
Capability in place to
begin Full Rate
Production.
At this level, the system, component or
item has been previously produced, is
in production, or has successfully
achieved low rate initial production.
Technologies should have matured to
TRL 9. This level of readiness is
normally associated with readiness for
entry into Full Rate Production (FRP).
All systems engineering/design
requirements should have been met
such that there are minimal system
changes. Major system design features
Is industrial capability in place
to support start of FRP?
Are major product design
features and configuration
designs stable?
Are manufacturing processes
stable, adequately controlled,
capable, and achieve program
LRIP objectives?
Are manufacturing facilities in place and demonstrated in
LRIP?

D-10
are stable and have been proven in test
and evaluation. Materials are available
to meet planned rate production
schedules. Manufacturing process
capability in a low rate production
environment is at an appropriate quality
level to meet design key characteristic
tolerances. Production risk monitoring
is ongoing. LRIP cost targets have been
met, and learning curves have been
analyzed with actual data. The cost
model has been developed for FRP
environment and reflects the impact of
continuous improvement.
8
Pilot line capability
demonstrated; Ready
to begin Low Rate
Initial Production.
This level is associated with readiness
for a Milestone C decision, and entry
into Low Rate Initial Production
(LRIP). Technologies should have
matured to at least TRL 7. Detailed
system design is complete and
sufficiently stable to enter low rate
production. All materials, manpower,
tooling, test equipment and facilities are
proven on pilot line and are available to
meet the planned low rate production
schedule. Manufacturing and quality
processes and procedures have been
proven in a pilot line environment and
are under control and ready for low rate
production. Known producibility risks
pose no significant challenges for low
rate production. Cost model and yield
and rate analyses have been updated
with pilot line results. Supplier
qualification testing and first article
inspection have been completed. The
Industrial Capabilities Assessment for
Milestone C has been completed and
shows that the supply chain is
established to support LRIP.
Has the Industrial Capability
Assessment (ICA) for MS C
been completed?
Has a detailed design of
product features and interfaces
been completed?
Have manufacturing processes
been verified for LRIP on a
pilot line?
Have pilot line facilities been
demonstrated?
7
Capability to produce
systems, subsystems,
or components in a
production
representative
environment.
This level of manufacturing readiness is
typical for the mid-point of the
Engineering and Manufacturing
Development (EMD) Phase leading to
the Post-CDR Assessment.
Technologies should be on a path to
achieve TRL 7.System detailed design
activity is nearing completion. Material
specifications have been approved and
Has industrial capability to
support production been
analyzed?
Have product requirements and
features been well enough
defined to support critical
design review, even though
design changes may be
significant?
Have manufacturing processes

D-11
materials are available to meet the
planned pilot line build schedule.
Manufacturing processes and
procedures have been demonstrated in a
production representative environment.
Detailed producibility trade studies are
completed and producibility
enhancements and risk assessments are
underway. The cost model has been
updated with detailed designs, rolled up
to system level, and tracked against
allocated targets.
been demonstrated in a
production representative
environment?
Have manufacturing facilities
been identified and plans
developed to produce LRIP
build?
6
Capability to produce
a prototype system or
subsystem in a
production relevant
environment.
Unit cost reduction efforts have been
prioritized and are underway. Yield and
rate analyses have been updated with
production representative data. The
supply chain and supplier quality
assurance have been assessed and long-
lead procurement plans are in place.
Manufacturing plans and quality targets
have been developed. Production
tooling and test equipment design and
development have been initiated.
Has the ICA for MS B been
completed?
Has the system allocated
baseline been established?
Have the manufacturing
processes been demonstrated in
a production relevant
environment? o Pre-production hardware built to
same level of quality?
o Quality level established? o Critical manufacturing processes
prototyped?
Have the manufacturing
facilities been identified and
plans been developed to
produce pilot line build?
5
Capability to produce
prototype
components in a
production relevant
environment.
This level of maturity is typical of the
mid-point in the Technology
Development Phase of acquisition, or in
the case of key technologies, near the
mid-point of an Advanced Technology
Demonstration (ATD) project.
Technologies should have matured to at
least TRL 5. The industrial base has
been assessed to identify potential
manufacturing sources. A
manufacturing strategy has been refined
and integrated with the risk
management plan. Identification of
enabling/key technologies and
components is complete. Prototype
materials, tooling and test equipment,
as well as personnel skills have been
demonstrated on components in a
production relevant environment, but
many manufacturing processes and
procedures are still in development.
Manufacturing technology development
efforts have been initiated or are
Has an industrial base
assessment been initiated to
identify potential
manufacturing sources?
Are lower level performance
requirements sufficient to
proceed to preliminary design?
Has maturity been assessed on
similar processes in
production?
Have manufacturing facilities
been identified and plans been
developed to produce
prototypes?

D-12
ongoing. Producibility assessments of
key technologies and components are
ongoing. A cost model has been
constructed to assess projected
manufacturing cost.
4
Capability to produce
the technology in a
laboratory
environment.
This level of readiness acts as an exit
criterion for the Materiel Solution
Analysis (MSA) Phase approaching a
Milestone A decision. Technologies
should have matured to at least TRL 4.
This level indicates that the
technologies are ready for the
Technology Development Phase of
acquisition. At this point, required
investments, such as manufacturing
technology development, have been
identified. Processes to ensure
manufacturability, producibility, and
quality are in place and are sufficient to
produce technology demonstrators.
Have industrial base
capabilities been surveyed and
known gaps/risks identified for
preferred concept, key
technologies, components,
and/or key processes?
Have form, fit, and function
constraints been identified and
manufacturing capabilities
identified for preferred systems
concepts?
Has a survey to determine the
current state of critical
processes been completed?
Has the availability of
manufacturing facilities for
prototype development and
production been evaluated?
3
Manufacturing Proof
of Concept
Developed.
Manufacturing risks have been
identified for building prototypes and
mitigation plans are in place. Target
cost objectives have been established
and manufacturing cost drivers have
been identified. Producibility
assessments of design concepts have
been completed. Key design
performance parameters have been
identified as well as any special tooling,
facilities, material handling and skills
required.
Have potential sources been
identified for technology
needs?
Have top level performance
requirements been defined?
Have high level manufacturing
processes been documented?
Have specialized facility
requirements/needs been
identified?
2 Manufacturing
Concepts Identified.
This level is characterized by
describing the application of new
manufacturing concepts. Applied
research translates basic research into
solutions for broadly defined military
needs. Typically this level of readiness
includes identification, paper studies
and analysis of material and process
approaches. An understanding of
manufacturing feasibility and risk is
emerging.
Have broad performance goals
been identified that may drive
manufacturing options?
Have materials and/or process
approaches been identified?

D-13
1
Basic Manufacturing
Implications
Identified.
The focus is to address manufacturing
shortfalls and opportunities needed to
achieve program objectives. Basic
research (i.e., funded by budget
activity) begins in the form of studies.
Have manufacturing research
opportunities been identified?
Assign current MRL and provide rationale for rating in the table provided below.
Technology MRL Rationale
6) Identification of Risks/Issues and Potential Mitigations
The risk should be stated in one clear and concise sentence, creating an “IF … THEN … MAY” statement.
The details of the risk should include the Who, What, Where, When, Why, How and How Much of the risk.
You should also consider what the impacts to the program are in terms of Cost, Schedule, and Performance if
the risk becomes an issue. Please, rate the consequence C and likelihood L for each identified risk using the
provided risk Tip Sheet for guidance.
Risk Mitigation Planning is the activity that identifies, evaluates, and selects options to set risk at acceptable
levels given program constraints and objectives. It includes the specifics of what should be done, when it
should be accomplished, who is responsible, and the funding and schedule tasks required to implement the risk
mitigation plan (Risk Management Guide for DOD Acquisition, Sixth Edition, Version 1.0, August 2006 and
Defense Acquisition Guidebook, Dated: August 5, 2010).
Identify risks/issues and, if known, potential mitigations in the table provided below.
Technology Risks C L Mitigation

D-14
TRL/IRL/MRL Mapping
Provides a guide on how IRL and MRL generally map to TRL.
Materiel Solution
Analysis
TechnologyMaturation &
Risk Reduction
Engineering & Manufacturing
Development
Production & Deployment
Operations & Support
TRLs 1-3
Analytical/ Experimental
Critical Function/
Characteristic Proof of Concept
TRL 4
Component and/or
Breadboard Validation in a
Laboratory Environment
TRL 5
Component and/or
Breadboard Validation in a
Relevant Environment
TRL 6
System/ Subsystem
Model or Prototype
Demonstrated in a Relevant Environment
TRL 7
System Prototype
Demonstratedin an
Operational Environment
TRL 8
Actual System CompletedQualified
Through Test and
Demonstration
TRL 9
Actual System Mission Proven
Through
Successful Operations
Technology
Readiness
Levels
TRA Guidance
April 2011
MRLs 1-3
Manufacturing Feasibility
Assessed. Concepts
Defined/ Developed
MRL 4
Capability to Produce
Technology in Lab
Environment. Manufacturing Risks Identified
MRL 5
Capability to Produce
Prototype Components in
a Production Relevant
Environment
MRL 6
Capability to Produce
System/ Subsystem
Prototypes in a Production Relevant
Environment
MRL 7
Capability to Produce
Systems, Subsystems, or
Components in a Production
Representative
Environment
MRL 8
Pilot Line Capability
Demonstrated. Ready for LRIP
MRL 9
Low Rate Production
Demonstrated.
Capability in Place for FRP
MRL 10
Full Rate Production
Demonstrated.
Lean Production
Practices in Place
Manufacturing
Readiness
Levels
MRL Deskbook
July 2011
IRLs 1-3
Interfaces Identified.
Integration Proof of
Concept. Integration Features
Modeled
IRL 4
Proposed Interfaces
Established. Limited
Functionality Demonstrated
IRL 5
Major Integration
Functions Demonstrated
IRL 6
Integration Baseline
Established. Platform
Interfaces all Identified
IRL 7
Full Prototype Integration Cis
Successfully Integrated and
have Functional Requirement Compliance
IRL 8
Functionality of Integration
Items Demonstrated
in System Environment
IRL 9
Integration Proven in
Operational
Test and Demonstration
Integration
Readiness
Levels
Army Risk IPT
Materiel
Development
Decision
Post PDR
Assessment
Post CDR
Assessment
FRP
Decision
Review
A B C IOC FOC

D-15
THIS PAGE INTENTIONALLY LEFT BLANK.

E-1
APPENDIX E – METHODOLOGY FOR SUPPORTING DATA SUFFICIENCY IN RISK
ASSESSMENTS

E-2
THIS PAGE INTENTIONALLY LEFT BLANK.

E-3
METHODOLOGY FOR SUPPORTING DATA SUFFICIENCY IN RISK
ASSESSMENTS
Schedule Proportion Sampling Distribution
The Schedule Proportion Sampling Distribution (SPSD) uses Visual Basic and @Risk to
compute a sampling distribution for the probability of meeting the PM’s schedule. This
algorithm uses Monte Carlo simulation, resampling methods such as parametric and non-
parametric bootstrapping, KS Goodness of Fit testing, Q-Q plotting, and other mathematical
tools. This method produces a large number of estimates for P. At least 500 simulation runs
(denoted at 500 +) are required for stable results.
Percentile CI with Bias Correction
Section 6.5.2.2 references CI and coverage concept material from: Nierwinski, J.,
“MAINTAINABILITY DATA DECISION METHODOLOGY (MDDM)”, AMSAA TR-2011-
19, June 2011.
Let’s apply the Bias Corrected (BC) method to this distribution of 500 estimates of P.
The BC method is basically an adjustment (for non-normal data) to the percentile points of the
Percentile Method. The “BC” adjusts these percentile points when the mean and median are not
equal – hence it tries to normalize the distribution.
Let
( ) (1 )^ ^
,s s
P P
indicate the 100* s th and 100*(1 s )th percentiles from the 500
estimates of P. This represents the percentile method for a 2-sided 100*(1-2 s ) CI. The lower
and upper bound using the BC method is given by:
1( )^
P
, where ( )
1 00ˆ(2 )sz z
; Lower Bound
2( )^
P
, where (1 )
2 00ˆ(2 )sz z
; Upper Bound
Here (*) is the standard normal cumulative distribution function and (1 )sz
is the 100*
(1 )s th percentile point of a standard normal distribution. For example (.95)z = 1.645 and
(1.645) = .95.
The value of BC is derived by the proportion of replications that is less than the original
estimate ^
P . Here is that value:

E-4
^ ^
1
0
#{ }ˆ ( )
500
bMR MRz
B
In order to accurately build this 2-sided CI stochastic model, we need to assure that the
sample has enough data to achieve the requested level of confidence. To validate this accuracy
we use coverage models.
First let’s define what we mean by coverage and accuracy. Coverage is defined to be the
percentage of CIs that contain than the true population parameter P, where each CI is constructed
with some method at the 100*(1 s )th confidence level for a given random sample of n
analogous programs. In other words, we need to run the inference method (Monte Carlo
simulation with BC method) 500+ times (500+ samples drawn from a parametric or
nonparametric population) to obtain 500+ inferences (i.e. 500+ UB’s). These 500+ samples are
not to be confused with the B (500+) iterations from the Monte Carlo simulation with BC
method. Note, the 500+ simulated populations are built based on the sample information. Then
we determine how many CIs contain the true P.
Accuracy is just a convergence rule for explaining the relative error of a 1-sided
coverage. The rule focuses on the speed at which the relative error approaches 0. Second order
accuracy is defined as the actual non-coverage probability intended to be s % for a 1-sided
(1 )s % CI, approaches the ideal of s % with error proportional to 1/n. First order accuracy
would approach the ideal of s % with error proportional to 1
n. This means that the relative
error of the 1-sided coverage is of the order O(1/n) for second-order accuracy and O(1
n) for
first-order accuracy. BC is 2nd
order accurate since it adjusts the percentile points based on the
non-normal data. The percentile method is only 1st order accurate since it does not make any
adjustments to the percentile points.
Lessons learned from a coverage validation study reveal the following results:
At least 6 analogous programs (n) are needed to perform any of these confidence interval
methods.
If the probability is extreme (near 0 or 1) then use the Wilson Score Interval.
If the probability is not extreme then use one of the two Monte Carlo methods:
o Use Percentile Method if n is 10 or less.
o Use Bias Correction Method if n > 10.
Lessons learned demonstrated that both empirical and best fitting distribution techniques
yielded similar coverage's. Hence, choose the smallest CI width when selecting between these
two techniques.

E-5
Error Tolerance
The decision maker (DM) must decide an acceptable and tolerable width of the CI. The
assessment of the “tolerance of width of the CI” is a decision problem which requires proper
consideration of what happens to the “big picture problem” if the endpoints of this CI (namely
the UB and LB) are truly realized. In other words, the DM may change the decision as a result
of the LB or UB occurring. If the decision is changed, then the sensitivity of this width is too
large and cannot be tolerated. Hence, the width needs to be smaller. In order to reduce the
width, more analogous data needs to be collected.
On the other hand, if the DM does not change the decision as result of this width then the
width is acceptable or tolerated, and enough data was collected. Keep in mind that different
problems have different sensitivities to CI width. Sometimes a probability of 90% vs. 70% of
meeting schedule will not change the overall alternative level decision (i.e. both are directionally
pretty good with low risk). However, a probability of 99% vs. 90% of a bridge breaking in the
next year could be a decision changer.
For schedule risk assessment applications, the main concern that the decision maker has
is on the LB because that is where the risk is contained. Therefore, the risk is greater when a
large width exists between the mean and the LB probabilities compared to the UB. The DM
needs to assess the largest width (mean to LB) that he or she can live with. In other words, when
does the length of the width become an issue or when does it cause the DM to re-consider his or
her decision.

E-6
THIS PAGE INTENTIONALLY LEFT BLANK.

F-1
APPENDIX F – DATA ALLOCATION ISSUES

F-2
THIS PAGE INTENTIONALLY LEFT BLANK.

F-3
DATA ALLOCATION ISSUES
Suppose historical analogous programs from MS B-to-MS C were collected and this data
really represented MS A-to-MS C. For example, the programs may have prematurely entered the
acquisition process at MS B when the technology readiness levels were actually lower than
claimed. This could result in MS A to MS B activities being performed during MS B-to-MS C.
An algorithm was designed to allocate some of the time collected in MS B-to-MS C back to MS
A-to-MS B. To do this, historical analogous programs are collected that have both phases and a
weighted average factor is computed to be applied to the time in MS B-to-MS C. This will shift
some time back to MS A-to-MS B.
This weighted average factor is based on the history of analogous programs with times in
both phases and is only an estimate. Every estimate based on data has a CI associated with it.
So, a CI on the factor estimate is computed and then all models are reallocated and re-run using
the mean estimate and the lower and upper bounds from the CI.
Confidence Intervals for Ratio Means (CIM4RM) are used to compute the CI because
this metric is a ratio mean. The USPTO published patent reference for CIM4RM is listed below:
Pub. No. : U.S.2011/0054839A1
Pub. Date : March 3, 2011
Inventor: John Nierwinski

F-4
THIS PAGE INTENTIONALLY LEFT BLANK.

G-1
APPENDIX G – DISTRIBUTION LIST

G-2
THIS PAGE INTENTIONALLY LEFT BLANK.

G-3
DISTRIBUTION LIST
Organization
US Army Materiel Systems Analysis Activity
AMXAA-GL/Reports Processing
392 Hopkins Rd.
Aberdeen Proving Ground, MD 21005-5071
US Army TRADOC Analysis Center
ATRC-PR/Susan Matus
255 Sedgwick Avenue
Fort Leavenworth, KS 66027-2345
US Army TRAC- White Sands Missile Range
ATRC-W/Dr. Lambert
Bldg 1400
Martin Luther King Drive
White Sands Missile Range, NM 88002-5502
Defense Technical Information Center
ATTN: DTIC-O
8725 John J. Kingman Rd
Fort Belvoir, VA 22060-6218
Office of the Deputy Chief of Staff, G-4
DALO-ZX/Mr. John Corcoran
500 Army Pentagon (Room 1E394)
Washington, DC 20310-0500
john.f.corcoran10.civ@ mail.mil
Office of the Deputy Chief of Staff, G-3/5/7
DAMO-CIA/COL. Richard Holdren
4000 Army Pentagon (Room 2E382)
Washington, DC 20310-0400

G-4
DISTRIBUTION LIST (cont)
Organization
Army Capabilities Integration Center, ARCIC
COL. Thomas E Dillingham
950 Jefferson Avenue
Ft. Eustis, VA 23604-5761
Center for Army Analysis (CAA)
Dr. Steven A. Stoddard
COL. Brian Sperling
LTC Pierre D. Jutras
Stephen McCarty
David Knudson
Thomas Rothwell
6001 Goethals Road
Ft. Belvoir, VA 22060-5230
Headquarters, AMC (HQ AMC)
Chief Technology Officer/Dr. Grace Bochenek
Mr. Thomas Pedigo
Mr. Dennis Finn
4400 Martin Road
Redstone Arsenal, AL 35898-5000
HQ AMC
Director, Strategy and Concepts/Dr. Myra Gray
4400 Martin Road
Redstone Arsenal, AL 35898-5000

G-5
THIS PAGE INTENTIONALLY LEFT BLANK.