Embed Size (px)
Citation preview

TECHNICAL REPORT #2
Palm Beach International Airport Forecast
T e c h n i c a l R e p o r t # 2
Palm Beach International Airport Forecast
Palm Beach International Airport
Prepared for
Palm Beach County Department of Airports
DECEMBER 2005
In Association with Ricondo & Associates, Inc.
CONTENTS, CONTINUED
2_PBI_FORECAST_DECEMBER2005 ii
Contents
Section Page
1 Introduction............................................................................................................................... 1-1 1.1 Baseline and Historic Aviation Activity Forecast.............................................. 1-1
1.1.1 Baseline Aviation Activity ....................................................................... 1-1 1.1.2 Historic Aviation Activity ....................................................................... 1-2
1.2 Previous Aviation Activity Forecast ................................................................... 1-8 1.2.1 2001 Strategic Master Plan Study Forecasts .......................................... 1-8 1.2.2 FAA Terminal Area Forecasts ............................................................... 1-10
1.3 Factors Influencing the Commercial Aviation Industry................................. 1-12 1.3.1 Changes in “Legacy” Airline Business Models .................................. 1-12 1.3.2 Expansion of the Role and Changes in the Nature of
Regional Airlines..................................................................................... 1-19 1.3.3 Airfare Equalization between Legacy and LCCs ............................... 1-23
2 Forecast Approach .................................................................................................................... 2-1 2.1 Overview................................................................................................................. 2-1 2.2 Forecast Methodology........................................................................................... 2-1
2.2.1 Time Series Analyses................................................................................ 2-2 2.2.2 Multi-Variable and Single-Variable Regression Analyses .................. 2-3 2.2.3 Market-Share Approach........................................................................... 2-7
3 Passenger Enplanements Activity Forecast ......................................................................... 3-1
4 Commercial Airlines Operations Forecast........................................................................... 4-1 4.1 Classification of Commercial Airlines Operations............................................ 4-1 4.2 Domestic-Mainline Air Carrier Operations and Fleet Mix Forecast............... 4-2 4.3 U.S. and Foreign Flag International Operations Forecast ................................ 4-5 4.4 Regional/Commuter Market Trends .................................................................. 4-7 4.5 Summary of Commercial Airline Projections .................................................. 4-11
5 Cargo Volume and Operations Forecast .............................................................................. 5-1 5.1 Cargo Volume......................................................................................................... 5-1 5.2 All-Cargo Operations and Fleet Mix ................................................................... 5-4
6 General Aviation and Air Taxi............................................................................................... 6-1 6.1 Historic General Aviation Operations ................................................................ 6-1 6.2 Factors Influencing the General Aviation Activity ........................................... 6-3 6.3 Methodology and Assumptions .......................................................................... 6-4 6.4 General Aviation Operations ............................................................................... 6-5 6.5 Based Aircraft Fleet Mix........................................................................................ 6-6 6.6 Air Taxi Operations ............................................................................................... 6-6 6.7 General Aviation and Air Taxi Operations Summary...................................... 6-7
7 Military Activity ....................................................................................................................... 7-1

CONTENTS, CONTINUED
2_PBI_FORECAST_DECEMBER2005 iii
8 Enplanements and Aircraft Operations Peaking Activity ................................................ 8-1 8.1 Domestic-Mainline Passenger Peaking Characteristics.................................... 8-1 8.2 International Passenger Peaking Characteristics............................................... 8-2 8.3 Regional/Commuter Passenger Peaking Characteristics ................................ 8-3 8.4 All-Cargo Air Carrier Peaking Characteristics .................................................. 8-4 8.5 General Aviation and Air Taxi Peaking Characteristics .................................. 8-4 8.6 Military Peaking Characteristics.......................................................................... 8-5 8.7 Summary of Peaking Characteristics .................................................................. 8-5
9 Summary of Aviation Activity Forecasts ............................................................................. 9-1
Tables
1-1 Post-Deregulation Historic Enplaned Passenger Levels .............................................. 1-4 1-2 Historic Aircraft Operations ............................................................................................ 1-7 1-3 Summary of Passenger Projections—2001 Strategic Mater Plan Study ...................... 1-9 1-4 Summary of Aircraft Operations Forecast—2001 Strategic Master Plan Study ..... 1-10 1-5 2004 FAA Terminal Area Forecasts .............................................................................. 1-11 2-1 Trend Analysis Results ..................................................................................................... 2-2 2-2 Regression Analysis Results—Multiple Independent Variables ................................. 2-5 2-3 Regression Analysis Results—Single Independent Variables .................................... 2-6 2-4 Market Share Analysis Results ........................................................................................ 2-8 3-1 Projected Enplaned Passengers by Carrier Category .................................................. 3-4 4-1 Projection of Domestic Mainline Carrier Operations 4-4 4-2 Projection of U.S. and Foreign Flag International Carrier Operations ...................... 4-6 4-3 Projection of Regional/Commuter Carrier Operations ............................................. 4-10 4-4 Projection of Commercial Airline Activities Summary .............................................. 4-11 5-1 Historic Enplaned Belly and All Cargo Volumes (in tons) .......................................... 5-1 5-2 Projected Belly Cargo Volume (in tons) .......................................................................... 5-3 5-3 Projected All-Cargo Volume (in tons) ............................................................................. 5-4 5-4 Total Cargo Volume (in tons) Forecast Summary ......................................................... 5-5 5-5 All-Cargo Carriers Operations Forecast ........................................................................ 5-6 6-1 Historic General Aviation Activity .................................................................................. 6-2 6-2 General Aviation Operations Forecast ........................................................................... 6-5 6-3 Based Aircraft Fleet Mix Forecast ................................................................................... 6-6 6-4 Air Taxi Operations Summary ......................................................................................... 6-7 6-5 General Aviation/Air Taxi Operations Summary ........................................................ 6-7 7-1 Historic Military Operations Activity ............................................................................. 7-1 7-2 Military Activity Forecast ................................................................................................. 7-2 8-1 Domestic-Mainline Passenger Enplanements Peaking Characteristics ..................... 8-2 8-2 Domestic-Mainline Airline Operations Peaking Characteristics ................................ 8-2 8-3 International Passenger Enplanements Peaking Characteristics ................................ 8-3 8-4 U.S. & Foreign Flag Airline Operations Peaking Characteristics ................................ 8-3 8-5 Regional/Commuter Passenger Enplanements Peaking Characteristics .................. 8-3 8-6 Regional/Commuter Airline Operations Peaking Characteristics ............................. 8-4 8-7 All-Cargo Air Carrier Operations Peaking Characteristics .......................................... 8-4

CONTENTS, CONTINUED
2_PBI_FORECAST_DECEMBER2005 iv
8-8 General Aviation/Air Taxi Operations Peaking Characteristics ................................ 8-5 8-9 Military Operations Peaking Characteristics .................................................................. 8-5 8-10 Total Passenger Enplanements Peaking Characteristics .............................................. 8-6 8-11 Total Operations Peaking Characteristics ...................................................................... 8-6 9-1 Passenger Enplanements Summary ................................................................................ 9-1 9-2 Aircraft Operations Summary .......................................................................................... 9-1
Appendices
A: Historic and Forecast Socioeconomic Data B: Multiple and Single Regression Analyses C: Market Share Approach Analyses D: Alternative Demand Scenarios

SECTION 1 Introduction

2_PBI_FORECAST_DECEMBER2005 1-1
SECTION 1
Introduction
1.1 Baseline and Historic Aviation Activity Forecast 1.1.1 Baseline Aviation Activity This element of the planning process presents updated projections of aviation activity that will be used as a basis for facility planning at Palm Beach International Airport (PBI). These baseline aviation activity forecasts will update the projections contained in the 2001 Strategic Master Plan Study (2001 Strategic Plan), as well as those developed by the Federal Aviation Administration (FAA) in its 2004 Terminal Area Forecasts (TAF).
The aviation industry is highly dynamic and has experienced significant change and fluctuations since completion of the 2001 Strategic Plan. The aviation industry has faced the double impact of an economic recession in late 2000 and through much of 2001, along with the terrorist attacks of September 11, 2001. The effect of the terrorist attacks, combined with major fuel price increases, have also contributed significantly to the bankruptcy filings by United Airlines, US Airways, Delta Airlines, and Northwest Airlines. The long-term impacts of these events and the simultaneous recession remain the subject of considerable speculation as the commercial airline industry continues to adjust to the post-2001 operating environment. This analysis will draw upon current industry information to define future levels of activity at PBI, taking into consideration the possible range of influences that may occur as a result of the changing complexion of the commercial aviation industry in the post-September 11, 2001 industry environment.
Because of the major changes that have occurred since 2001, and to ensure that the planning process properly assesses the adequacy of existing facilities and defines the potential need for expanded or additional airport facilities, revised projections of passenger activity and aircraft operations are required. Projections from previous analyses have been reviewed to provide a historic perspective of the basis for these forecasts and to gain an understanding of the trends and assumptions that were used to guide the development of these earlier projections. To the extent feasible, this analysis will consider and, where appropriate, build upon the findings, methodologies, and results of prior forecasting efforts. In particular, the study considers the FAA TAF as projections of future activity at PBI are developed. The Aviation Activity Forecast process will develop baseline demand forecasts for the following elements of activity at PBI:
Passenger Activity
Annual Enplaned Passengers (Domestic/International Passenger Boardings)
Peak Month Enplaned Passengers (Domestic/International)
Peak Month Average Day Enplaned Passengers (Domestic/International)
Commercial Service Activity

SECTION 1 - INTRODUCTION
2_PBI_FORECAST_DECEMBER2005 1-2
Domestic Air Carrier Aircraft Operations (Total Landings and Takeoffs)
Regional/Commuter Airline Aircraft Operations
International Air Carrier Operations
All Cargo Freight Tonnage and Cargo Aircraft Operations
Airline Fleet Mix (aircraft type by seating range for domestic-mainline, regional/commuter, and international air carriers)
All Cargo Aircraft Fleet Mix
Peak Month, and Peak Month Average Day Operations
General Aviation Activity
Local Airport Area Operations
Itinerant Operations
General Aviation Aircraft Fleet Mix
Peak Month and Peak Month Average Day General Aviation Operations
Military Activity
Projected Annual Military Flight Operations
Peak Month and Peak Month Average Day Military Operations
The updated PBI aviation activity forecasts project future activity levels for the 5-, 10-, 15- and 20-year planning horizons. These forecasts will provide the demand benchmark against which existing facilities will be evaluated to determine the extent to which current airport facilities either meet or fall short of meeting current and projected demand. The forecasts presented in this analysis are based primarily on historic aviation and socioeconomic data from the PBI region available through July 2005. These data have been supplemented with operational statistics used by the FAA to develop its TAF to derive a more complete picture of operational activities and emerging trends in the nation, in the FAA’s southern region, and at PBI. In addition to the development of the baseline forecasts, the assessment of market conditions and trends has also resulted in the development of alternative scenario forecasts that consider the effect that changes in demand patterns in the PBI market area could have on the activity levels at the Airport. These alternative demand scenarios are presented in the appendices of this report.
1.1.2 Historic Aviation Activity When considering forecasts of aviation activity for PBI, it is important to understand the history of growth and fluctuations in enplaned passengers and operational activity at PBI. Forecasting would be relatively simple if the trends in activity growth were consistent; however, as outlined in the following section, while overall passenger enplanements at PBI have displayed a general growth trend, fluctuations have occurred in this trend over the years. The extent of growth that occurred during the mid to late 1990s was not as significant as might have been expected given what was occurring nationally during that timeframe

SECTION 1 - INTRODUCTION
2_PBI_FORECAST_DECEMBER2005 1-3
and when comparing PBI to other airports. As will be discussed in this report, historic activity levels at PBI have been affected by occurrences at Fort Lauderdale-Hollywood International Airport (FLL), a facility that experienced dramatic growth over the past 15 years, in part because of the emergence of the Airport as the center for low-cost/low-fare commercial service. As activity at FLL grew through the 1990s, and with the introduction of low-fare service by carriers such as Southwest Airlines, enplaned passenger growth at PBI moderated. Up until the last two to three years, the differential in airfares between carriers such as Delta, United, American, Northwest, Continental and US Airways (commonly referred to as Legacy Carriers) and low-cost/low-fare airlines such as Frontier, Southwest, Jet Blue, and Air Tran was significant and allowed FLL to capture market share away from both Miami International Airport (MIA) and PBI.
Enplaned Passengers
Between 1979 and 1988, enplaned passenger levels at PBI doubled, with enplanements (persons boarding a flight) increasing from approximately 1.2 million to more than 2.5 million in the course of the 10-year period. Over the next 10 years, while PBI saw an increase in passenger enplanements, this increase was significantly below the rate that occurred in the 1979 to 1988 time period. For example, over the 14-year timeframe from 1988 through year-end 2001, total enplaned passengers at PBI had grown by approximately 460,000 passengers. When viewing historic passenger levels at PBI, it is possible to correlate some of the fluctuations in activity to specific events that have influenced the aviation industry in the U.S. For example, the influence that airline deregulation had on the industry can be seen in the consistent pattern of passenger growth that occurred between 1979 and 1990. Of interest is the strength of the PBI market during 1981-1982, a period of sharp economic recession, as well as during 1989-1990, which was typified by another cooling economy. Growth in passengers between 1982 and 1988 is somewhat expected given the fact that this period was consistent with a period of strong economic expansion at the national level, in addition to the emergence of a number of new airlines that entered service. Some of the airlines that emerged during this period included Air Florida, Midway, and Peoples Express, as well as an array of smaller commuter airlines that began to affiliate with the larger mainline carriers.
Enplaned passenger growth peaked in 1990 at 2.85 million passengers, dropping to 2.54 million enplaned passengers in 1991. During this time, the nation experienced another economic recession and faced the uncertainty of travelers related to the potential safety of air travel stemming from the invasion of Kuwait by Iraq in August 1990, and the growing tensions in the Middle East that ultimately culminated in the Persian Gulf War in early 1991. As economic conditions improved and concerns related to the Persian Gulf War and potential terrorism acts subsided, enplaned passenger activity began to return to a pattern of growth. However, the level of enplaned passengers did not regain the level experienced from 1990 through 1996, when enplaned passenger levels once again attained the 2.85 million levels. From 1996 through the end of 2000, growth in enplaned passengers remained relatively static, with total enplaned passengers fluctuating between 2.85 million and 2.93 million. When this limited pattern of growth is compared to the strong expansion that was occurring in air travel demand on the national level, enplanement levels between 1996 and 2000 appear all the more limited.

SECTION 1 - INTRODUCTION
2_PBI_FORECAST_DECEMBER2005 1-4
In September 2001, the U.S. experienced the worst terrorist attack in its history when three of four hijacked aircraft were used as weapons against the World Trade Center and the Pentagon and the fourth aircraft crashed in Pennsylvania before it, too, could hit a major target. At the same time, the U.S. economy, which had experienced the single longest period of expansion in the nation’s history between 1994 through the end of 2000, entered a recession. These two events combined to devastate much of the commercial airline industry in the U.S. and are reflected in the passenger enplanement levels experienced at PBI since immediately after 2001. By year-end 2001, passenger enplanements had reached their highest recorded level (2.97 million) up to that time, and likely would have been higher had it not been for the events of September 11th, after which these levels dropped by 230,000 enplaned passengers and totaled approximately 2.75 million enplaned passengers in 2002. A myriad of factors contributed to this decrease in passengers, which included a reduction in business travel and use of alternative technologies by business for communicating with clients, the increased “hassle factor” associated with new security screening requirements, and continued concerns about the security of air travel. These factors appear to have had a lesser impact on PBI than has been the case at a large number of other U.S. domestic airports.
Since 2002, PBI has experienced one of its strongest periods of passenger growth since airline industry deregulation despite the fact that the economic recovery has been sluggish and the major legacy carriers continue to adjust business models in an attempt to return to profitability. From 2002 to year end 2004, enplanements increased by more than 550,000 passengers, which is roughly equivalent to the passenger growth that occurred between 1988 and 2001. While year end data are not yet available for fiscal year 2005, year-to-date information indicate that, barring any catastrophic event such the September 11, 2001 attacks, 2004 will see passenger levels at PBI continue to increase, exceeding last year’s all-time record level. Through July 2005, enplaned passengers were running at 182,222, or 8.69 percent above the record levels experienced in 2004. Table 1-1 displays the historic level of enplaned passengers for domestic activity, international activity, and total activity from 1979 thru 2004.
TABLE 1-1 Post-Deregulation Historic Enplaned Passenger Levels
Year
Enplaned Domestic
Passengers Enplaned International
Passengers Total Enplaned
Passengers
1979 1,187,413 16,172 1,203,585
1980 1,285,865 13,973 1,299,838
1981 1,292,190 12,067 1,304,257
1982 1,581,158 20,624 1,601,782
1983 1,830,553 37,241 1,867,794
1984 1,931,803 41,060 1,972,863
1985 1,858,032 43,807 1,901,839
1986 2,047,847 45,986 2,093,833
1987 2,285,275 47,475 2,332,750

SECTION 1 - INTRODUCTION
2_PBI_FORECAST_DECEMBER2005 1-5
TABLE 1-1 Post-Deregulation Historic Enplaned Passenger Levels
Year
Enplaned Domestic
Passengers Enplaned International
Passengers Total Enplaned
Passengers
1988 2,466,453 52,286 2,518,739
1989 2,505,122 78,401 2,583,523
1990 2,764,745 92,012 2,856,757
1991 2,474,784 67,138 2,541,922
1992 2,470,387 64,591 2,534,978
1993 2,492,869 51,888 2,544,757
1994 2,749,612 52,003 2,801,615
1995 2,677,452 51,670 2,729,122
1996 2,797,696 54,318 2,852,014
1997 2,865,496 51,518 2,917,014
1998 2,850,3661 51,2461 2,901,612
1999 2,772,4261 49,8451 2,822,271
2000 2,872,033 60,602 2,932,635
2001 2,905,406 73,357 2,978,763
2002 2,696,896 51,284 2,748,181
2003 2,954,387 57,586 3,011,973
2004 3,213,540 66,751 3,280,291
Sources: 2001 Strategic Airport Master Plan (1979-1997); PBI Airport Activity Statistics (1998-2004). Prepared by: Ricondo & Associates, Inc. Note: 1 Estimated.
Operations Activity
Operational activity at PBI over the past 10 years has been influenced by factors, including the growth in commercial passenger load factors, which have allowed the passenger airlines to accommodate additional passengers without having to add significantly to the number of flights used to meet added demand. Additionally, the Palm Beach Department of Airports (DOA) is the owner and operator of a system of airports within the county. In addition to PBI, these facilities include Palm Beach County Air Park (LNA) in Lantana, North County General Aviation Airport (F45) and Pahokee Airport. Of these facilities, F45 and LNA serve as relievers to PBI and, in 2004 they accommodated 601 based general aviation aircraft, along with providing facilities for itinerant operators flying into and out of Palm Beach County. The success in fostering use of the County system of airports can be seen in the general aviation operations levels at PBI, particularly in the reduction that occurred between 1994 and 1996, as F45 opened for activity. Aircraft operational activity has not reflected the level of growth that has typified the passenger activity data presented in Table 1-1.

SECTION 1 - INTRODUCTION
2_PBI_FORECAST_DECEMBER2005 1-6
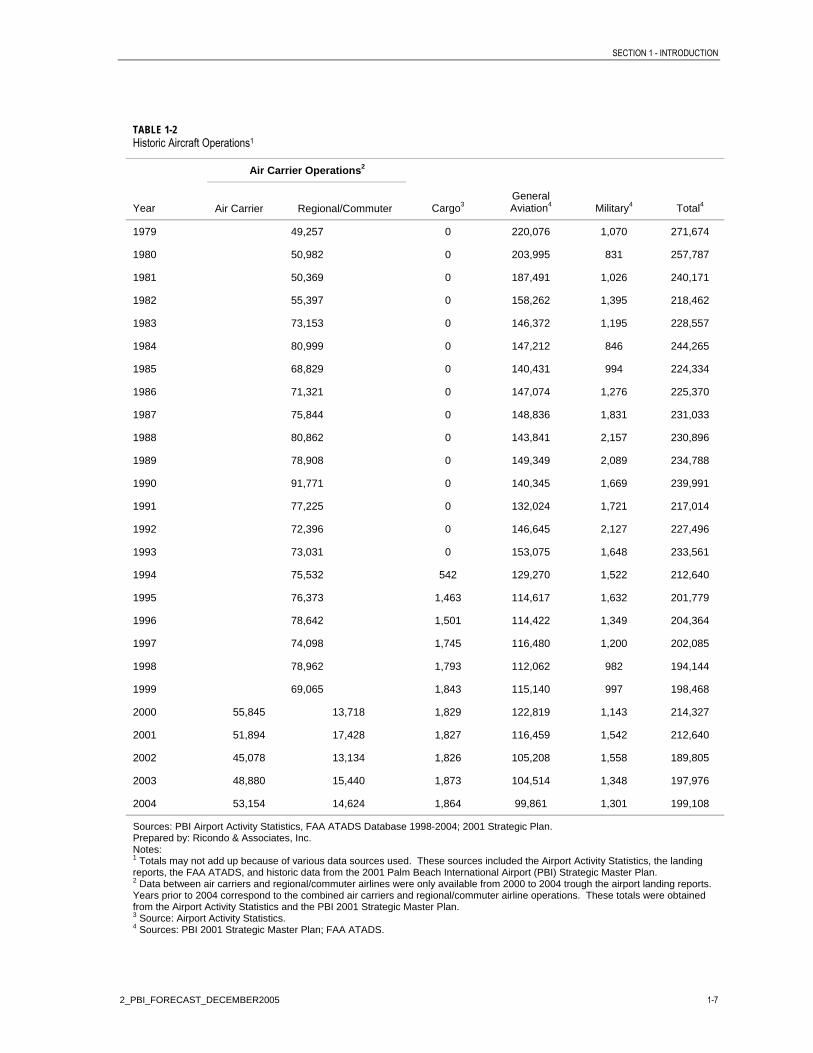
Table 1-2 displays the historic level of aircraft operations by primary category from 1979 through year-end 2004.
SECTION 1 - INTRODUCTION
2_PBI_FORECAST_DECEMBER2005 1-7
TABLE 1-2 Historic Aircraft Operations1
Air Carrier Operations2
Year Air Carrier Regional/Commuter Cargo3 General Aviation4 Military4 Total4
1979 49,257 0 220,076 1,070 271,674
1980 50,982 0 203,995 831 257,787
1981 50,369 0 187,491 1,026 240,171
1982 55,397 0 158,262 1,395 218,462
1983 73,153 0 146,372 1,195 228,557
1984 80,999 0 147,212 846 244,265
1985 68,829 0 140,431 994 224,334
1986 71,321 0 147,074 1,276 225,370
1987 75,844 0 148,836 1,831 231,033
1988 80,862 0 143,841 2,157 230,896
1989 78,908 0 149,349 2,089 234,788
1990 91,771 0 140,345 1,669 239,991
1991 77,225 0 132,024 1,721 217,014
1992 72,396 0 146,645 2,127 227,496
1993 73,031 0 153,075 1,648 233,561
1994 75,532 542 129,270 1,522 212,640
1995 76,373 1,463 114,617 1,632 201,779
1996 78,642 1,501 114,422 1,349 204,364
1997 74,098 1,745 116,480 1,200 202,085
1998 78,962 1,793 112,062 982 194,144
1999 69,065 1,843 115,140 997 198,468
2000 55,845 13,718 1,829 122,819 1,143 214,327
2001 51,894 17,428 1,827 116,459 1,542 212,640
2002 45,078 13,134 1,826 105,208 1,558 189,805
2003 48,880 15,440 1,873 104,514 1,348 197,976
2004 53,154 14,624 1,864 99,861 1,301 199,108
Sources: PBI Airport Activity Statistics, FAA ATADS Database 1998-2004; 2001 Strategic Plan. Prepared by: Ricondo & Associates, Inc. Notes: 1 Totals may not add up because of various data sources used. These sources included the Airport Activity Statistics, the landing reports, the FAA ATADS, and historic data from the 2001 Palm Beach International Airport (PBI) Strategic Master Plan. 2 Data between air carriers and regional/commuter airlines were only available from 2000 to 2004 trough the airport landing reports. Years prior to 2004 correspond to the combined air carriers and regional/commuter airline operations. These totals were obtained from the Airport Activity Statistics and the PBI 2001 Strategic Master Plan. 3 Source: Airport Activity Statistics. 4 Sources: PBI 2001 Strategic Master Plan; FAA ATADS.

SECTION 1 - INTRODUCTION
2_PBI_FORECAST_DECEMBER2005 1-8
1.2 Previous Aviation Activity Forecast In the recent past, two aviation activity forecasts have been updated for PBI. These consist of the FAA 2004 Terminal Area Forecast, and the projections contained in the 2001 Strategic Plan for PBI. The data contained in previous studies is considered valuable for comparison purposes, and, in the case of the most recent FAA TAF projections, were used as a basis of comparison with the projections developed independently in this analysis.
1.2.1 2001 Strategic Master Plan Study Forecasts The current Strategic Master Plan developed for PBI was completed in 2001. At the time that the master plan was being conducted, both the commercial aviation industry and general aviation had been experiencing significant expansion and growth that had commenced in late 1993 and continued through the third quarter of 2000. The 2001 Strategic Plan included forecasts of aviation activity, which were projected for a 20-year planning horizon. The base year for these forecasts was 1997. The projection techniques used for developing the baseline forecast in the 2001 Strategic Plan consisted of a series of multi-variable regression projections that statistically tested various socioeconomic and industry-related variables. There were 10 individual multi-variable regression analyses developed to establish a projection of future origin and destination passengers at PBI. The regression analyses tested the influence of a number of socioeconomic (income, population, employment, households) and aviation industry-related (fuel cost and yield) variables in association with historic enplanement activity at PBI as a basis for defining various projections of future enplaned origin and destination passengers.
Two regression projections were selected and the average of the two regression analyses was used to form the basis of a final forecast of origin and destination enplanements at PBI. The first regression projection employed for development of the origin and destination forecast was based on a regression model that identified PBI enplanements as a function of per capita personal income, PBI yield, and PBI market-area population, while the second regression projection employed PBI area households, non-farm employment in the market area, and PBI yield as variables. Both regression analyses resulted in high coefficients of correlation, indicating a strong relationship between the historic change in passenger enplanements and changes in the various variables used in the regression analysis. As noted, the results of the two regressions were average to arrive at a baseline forecast for domestic origin and destination passengers at PBI. Based on this approach, origin and destination enplanements were projected to grow at an average annual rate of 2.7 percent and to increase from the base-year level of 2.76 million to 5.05 million in 2020.
Historically, PBI has also experienced a limited level of connecting traffic consisting of passengers who fly into the airport to connect to a flight going to another destination. For connecting traffic at PBI between 1990 and 1997, the base year for the Strategic Master Plan forecasts had averaged 4.4 percent of total origin and destination passenger enplanements. The baseline forecast maintained the 4.4 percent level over the course of the forecast period, resulting in total connecting passenger enplanements growing to 232,000 enplaned passengers by 2020.
The final component of passenger activity addressed in the Strategic Master Plan Study was associated with international passengers, which, at PBI, primarily consisted of Canadian

SECTION 1 - INTRODUCTION
2_PBI_FORECAST_DECEMBER2005 1-9
and Caribbean destinations. A market-share approach was used to project the level of future international passenger enplanements. As an average percentage of total international enplanements on U.S. commercial carriers over the period 1978 to 1997, PBI’s international enplaned passenger count was used as a basis to project future international passenger levels. This approach resulted in international passengers growing from 51,518 in 1997 to a projected level of 271,000 by 2020, reflecting an average annual growth rate of 7.5 percent. The 2001 Strategic Plan projections of annual passenger enplanements at PBI are presented in Table 1-3.
Based on these projections, total enplanements were forecast to reach 3.87 million by 2005 and 5.55 million by 2020. As previously discussed, subsequent to the development of the 2001 Strategic Plan forecasts (approximately nine months after the completion of the 2001 Strategic Plan), the effect of an economic recession and the September 11th terror attacks combined to significantly change the complexion and business plans of the commercial aviation industry. A review of historic enplanements data for PBI indicates that the Airport did not experience a growth trend equal to that which was projected between 1997 and 2002. Between 1997 and 2001, enplanements grew by 61,749 or by just 2.1 percent over the 4-year period.
TABLE 1-3 Summary of Passenger Projections—2001 Strategic Mater Plan Study
Calendar Year Domestic O&D Enplanements
Connecting Enplanements
International Enplanements
Total Enplaned Passengers
1997 2,757,840 107,656 51,518 2,917,014
2005 3,586,000 164,000 115,000 3,865,000
2010 4,075,000 187,000 154,000 4,416,000
2015 4,562,000 209,000 204,000 4,975,000
2020 5,049,000 232,000 271,000 5,552,000
Source: 2001 Strategic Master Plan Study Update, Chapter Three. Prepared by: Ricondo & Associates, Inc.
In 2002, the number of enplaned passengers dropped by approximately 230,500, erasing the previous 4-year increase and ending the year approximately 169,000 below the 1997 level of 2.91 million. Thus, enplaned passenger levels were not growing at a rate consistent with those projected by the Strategic Master Plan forecasts through year-end 2002. In the wake of the economic recession of 2000/2001, the events of September 11, 2001, and corresponding airline bankruptcies, it would be reasonable to assume that passenger levels would decline, which was the case in 2002. However, for PBI the decrease in activity was a single-year event and subsequent years have seen a significant rebound. Between 2002 and 2003, enplanements increased by 263,792 passengers and exceeded 2001’s all-time record for enplanements. This trend continued between 2003 and 2004, with the Airport recording a growth of 268,318 enplaned passengers, setting a new record for passenger levels at PBI. All indications are that 2005 will continue this trend, with passenger enplanements through the end of July running 8.69 percent above the 2004 level. If this rate continues through the end of 2005, the Airport would finish the year approximately 285,000 passengers below the level projected in the Strategic Master Plan for 2005. While the variance between the forecast and

SECTION 1 - INTRODUCTION
2_PBI_FORECAST_DECEMBER2005 1-10
actual levels is relatively small, a review of trends in the local area suggest that the significant growth experienced at PBI over the past 2 years is not the result of the variables used to develop the strategic master plan projections, but rather it relates to changes the airlines have instituted in the wake of the impacts of the events of 2001 and business model changes that have been made in subsequent years.
Annual aircraft operations were forecast to increase at an average annual rate of 1.6 percent in the 2001 Strategic Plan. This forecast resulted in total operational activity being projected to increase from the 1997 base-year level of 202,085 operations to 227,800 operations in 2005 and 275,100 by 2020 under the baseline forecast. The projected level of future activity was driven primarily by the forecast growth in air carrier operations, which was projected to increase by an estimated 49,602 annual operations by the end of the 2020 planning period. Table 1-4 summarizes the projected operational activity from the 2001 Strategic Plan.
TABLE 1-4 Summary of Aircraft Operations Forecast—2001 Strategic Master Plan Study
Calendar Year Commercial Air Cargo Air Taxi & General Aviation Military Total Operations
2005 99,600 2,600 124,100 1,500 227,800
2010 108,200 3,100 131,600 1,500 244,400
2015 116,100 3,600 138,800 1,500 260,000
2020 123,700 4,100 145,800 1,500 275,100
Source: 2001 Strategic Master Plan Study Update, Chapter Four. Prepared by: Ricondo & Associates, Inc.
Actual operations at PBI dropped below the 1997 baseline level of 202,085 in both 1997 and 1998, then rose sharply to 214,327 in 2000, and ended 2001 at 212,640 takeoffs and landings. Since 2001, operational activity has remained below the 1997 baseline level with total operations experiencing its lowest recorded level since 1979 in 2002. Since 2002, operational activity has risen in both 2003 and 2004, with activity reaching 199,108 operations in 2004. Based on the actual level of activity since 1997, it is clear that operational activity at PBI has not followed the trend line that was projected in the Strategic Master Plan and, given the level of activity in 2004, it is highly unlikely that the forecast 2005 operations level will be reached.
1.2.2 FAA Terminal Area Forecasts The FAA prepares forecasts annually as a part of its effort to identify workload and staffing requirements based on future traffic levels at the nation’s airport facilities. Except for specific regional or state requests, the airports included in the FAA’s TAF report must meet at least one of the following criteria:
Have an existing FAA tower
Have an existing FAA Contract tower
Be a candidate for an FAA tower

SECTION 1 - INTRODUCTION
2_PBI_FORECAST_DECEMBER2005 1-11
Currently receiving or expected to receive scheduled air carrier or regional/commuter service
Currently exceed 60,000 itinerant or 100,000 total aircraft
Report 10 or more based aircraft on the latest available Airport Master Record (FAA 5010 form)
PBI meets all of these criteria and is consistently addressed in the FAA’s annual TAF updates. The TAF is updated annually to allow the agency to continually adjust its forecasts to address changes in the industry. Table 1-5 summarizes the passenger enplanements and aircraft operational projections contained in the 2004 TAF for PBI. The TAF projections prepared in early 2004 use 2003 as the base year and extend to the year 2020.
TABLE 1-5 2004 FAA Terminal Area Forecasts
Fiscal Year Total Annual Enplanements Total Annual Operations
Base Year (Fiscal Year)
2003 2,800,557 197,131
Forecast (Fiscal Year)
2005 3,191,691 200,860
2010 3,582,800 214,393
2015 3,973,910 228,554
2020 4,365,022 243,676
Source: FAA Terminal Area Forecast, 2004. Prepared by: Ricondo & Associates, Inc.
The TAF prepared by the FAA for PBI employed a regression-based approach using a number of variables, including a number of socioeconomic and aviation industry variables similar to those used in the 2001 Strategic Plan, although the FAA projections had the benefit of using a baseline of 2003 versus the 1976 baseline that was in the Strategic Plan. The FAA TAF is based on a fiscal year, while the Strategic Master Plan used a calendar-year basis to develop forecasts, which could explain the discrepancy that is apparent in the base-year data between the Strategic Master Plan enplanements level of 3,011,973 for calendar year 2003 and the FAA TAF enplanements level of 2,800,557 for fiscal year 2003. The FAA TAF displays a more conservative estimate of future passenger levels than was the case in the Strategic Master Plan, with a difference of approximately 1.2 million fewer passengers and approximately 31,000 fewer aircraft operations forecast for the 2020 timeframe. The TAF had the benefit of having an additional 6 years of trend data, including post-2001 activity and socioeconomic data on which to base the forecasts, which affected the outcome of the projections.
Given the changes in passenger levels that have occurred at PBI since 2001, a review of the TAF led to a perception that the forecasts of future passengers may be somewhat conservative. As noted previously, PBI has been affected by the strong low-cost/low-fare presence at FLL and by the disparity in fares that existed between the two airports in the

SECTION 1 - INTRODUCTION
2_PBI_FORECAST_DECEMBER2005 1-12
period before 2001/2002, which has tended to limit growth at the Airport. Because the historic trend data used by the FAA would reflect this limitation, the resultant projections would tend to be more conservative. Over the last 2 years, the differential in fares between what were historically low-cost/low-fare airlines and the “legacy carriers” has narrowed significantly. Airfares in many market pairs have actually equalized, with the legacy carriers meeting and, in some instances, actually beating the “low-fare” competitors. This equalization of fares is believed to have contributed to the surge in passenger enplanements over the past 2 years at PBI as the Airport recaptured market share in the southeast Florida market and as low fares facilitated additional air travel. It is believed that this situation was not considered fully in the FAA TAF because the most current TAF was based on 2003 fiscal year (October 2002 through September 2003) data. This consideration will be more fully reviewed in a subsequent section of this report.
1.3 Factors Influencing the Commercial Aviation Industry While an array of factors affect and/or influence the aviation industry to one degree or another, this section will investigate several of the more significant changes occurring in the industry and will identify their possible influence on the level and complexion of future activity at PBI. These factors include:
Changes in “Legacy carrier” airline business models Contributing factors Fleet commonality and downsizing Business model changes Expansion of the role and changes in the nature of regional airlines Altering the nature of aircraft in the regional airline fleet Changing relations with Legacy carriers Airfare equalization between Legacy and LCCs
Each of these factors will be reviewed briefly as they relate to potential influence on passenger and/or operations activity at PBI.
1.3.1 Changes in “Legacy” Airline Business Models Since 2001, the U.S. Aviation Industry has lost an estimated $32 billion and, if fuel prices remain at their current level (Fall 2005), the industry is projected to lose an additional $10 billion by the end of the year. As of September 2005, four of the nation’s largest seven airlines (Delta, United, Northwest, and US Airways) are in Chapter 11 bankruptcy protection. Clearly, the past 4 years have been exceedingly difficult for the traditional mainline Legacy carriers. Actions that the airlines have taken during previous periods of market upheaval (such as in 1990/1991) are no longer valid to address their problems. Fundamental changes in demand and in how the airlines must do business have emerged in the last several years and, as a result, there are basic structural changes to the business plans of these carriers that have been, and are continuing to be implemented. To understand the factors influencing the commercial aviation industry, it is important to understand what has brought about the changes that have taken the industry to its current status.

SECTION 1 - INTRODUCTION
2_PBI_FORECAST_DECEMBER2005 1-13
1.3.1.1 Contributing Factors The most significant event since the completion of the 2001 Strategic Plan for PBI has been the need to make significant structural changes to airline business models, a process that continues to occur on the part of the six main U.S. Legacy carriers that historically have been the dominant air carriers in the post-airline deregulation era. These Legacy carriers have consisted of six U.S. domestic airlines: Northwest, Delta, American, United, Continental and U.S. Airways. The extensive changes that are under way in the business plans within this sector of the aviation industry were not solely the result of the impact of the recession of 2001 or the events of September 11th. Key contributors to the business model changes were beginning to be seen in the increasing costs the airlines were incurring in the late 1990s and the beginnings of a defection of business travelers from the Legacy airlines in favor of the LCCs and electronic communication options. The impact of these changes were not felt until late 2000 and early 2001, or about the same time that the 2001 Strategic Plan was printed in final form.
Through the mid to late 1990s most of the group of Legacy carriers were experiencing unprecedented profitability and were expanding their fleets and enhancing their hubs in response to the strong demand, particularly within the historically high-yield business traveler segment of the market. As their profitability continued, the airlines faced increasing pressure from labor groups to share in the profits, resulting in significant increases in the compensation packages for pilots, maintenance personnel, and flight attendants at a number of these carriers. These labor contracts added hundreds of millions of dollars of cost to the airlines’ balance sheets just as the nation and the industry began to experience a slowing economy in 2000.
Over the latter half of the 1990s, the level of satisfaction with the perceived cost of business travel versus the quality of service being provided to the “high-yield” business traveler also began to erode. Considerable attention began to focus on the rapid rise in consumer complaints regarding airline service. Between 1997 and 1998, passenger complaints rose 25 percent, which was then eclipsed by a 75 percent increase in complaints between 1999 and 2000. Concerns about increasing flight delays and cancellations, change fees, ticket conditions, lost baggage, and the overall quality of the travel experience when compared against the cost, were combining to increasingly frustrate the traveling public. Congress entered the arena in early 1999 with proposed legislation to pass a Passenger’s Bill of Rights in an attempt to address the significant dissatisfaction on the part of travelers. While overall airfares had not increased dramatically, the cost of air travel for last-minute travelers, typified by those traveling on business, were viewed as being exceedingly high and the response of the business community was to look for other options. These other options were greatly facilitated by the growing LCC segment of the aviation industry, along with the ability to competitively shop for airfares via the Internet, which, for the first time, allowed the consumer to effectively price shop of airfares.
By late 2000, the Legacy carriers in the U.S. were facing projected financial losses from a sharp reduction in the level of high-yield business travel, which had historically provided the majority of Legacy airline revenues. By the end of 2000, the airline industry, and notably the Legacy carrier segment, was projecting $2 to $3 billion in losses by the end of 2001. On top of the factors noted previously, other contributors to the loss of the business-travel segment included the weakening of the U.S. economy in 2000, collapse of the “dot.com”

SECTION 1 - INTRODUCTION
2_PBI_FORECAST_DECEMBER2005 1-14
industry, airline labor/management relations, and significant weakness in the high-technology industry in the wake of the build up to address Y2K issues. Then came the events of September 11, 2001, and the aviation industry faced an entirely new environment. Not only did passenger activity drop sharply, but operating costs soared as new security requirements were instituted along with massive increases in the cost of insurance for the airlines. Financially, the Legacy carriers with their higher cost structures were significantly affected as weakness in travel demand, stemming from terrorism concerns and a weak economy combined with already high operational costs plus the impact of new costs, sent losses skyrocketing.
Massive and fundamental changes in how the Legacy carriers did business, the likes of which had not been seen since airline de-regulation, began to be discussed as the only viable manner for survival of many of the Legacy carriers. In the three years since September 11, 2001, the Legacy carriers have undertaken extensive evaluations of their business models and are in the process of making significant changes in their cost structures and the manner in which they operate. While there are a myriad of changes that have occurred and are continuing to take place, two key trends were identified for consideration in the forecast process for PBI, fleet commonality and downsizing, and business model changes. These two factors are identified and discussed below.
1.3.1.2 Fleet Commonality and Downsizing One factor is clear in the post-September 11, 2001 aviation industry, and that is the absolute necessity of controlling operations costs. One key area of focus by Legacy carriers is achieving greater aircraft fleet commonality. One of the most obvious differences between traditional low-cost airlines and the Legacy airlines is found in the number of different aircraft that make up their respective fleets. LCCs are typified by aircraft fleets that consist of either variations of one aircraft type, such as the reliance that Southwest Airlines has placed on its use of four Boeing 737 models, or by the use of just one or two aircraft types, such as Jet Blue’s use of two aircraft in its fleet—the Airbus A320 and the Embraer EMB-190, and AirTran’s use of the Boeing B717 and the Boeing B737-700. Frontier has completed a fleet transition to an all Airbus fleet composed of 42 A319 and 7 A318 aircraft, while America West, which remade itself into an LCC, had been in the process of reducing the number of aircraft types in its fleet from six to five aircraft types until its recent merger with US Airways. While this merger has added to the number of aircraft in the combined fleet, current plans indicate that fleet consolidation and a reduction in the types of aircraft will be a component of the merged airlines’ future plans.
Legacy carriers have historically employed an array of aircraft of varying sizes from various manufacturers in an attempt to match aircraft size with route densities. While on the surface this would not seem to be a significant issue, it does result in a significant cost to the airline. There is the need to maintain facilities to provide recurring training of their pilots for each of the aircraft types, which translates into simulators for an array of aircraft. For example, in 2001, Delta Airlines operated 14 different types of aircraft with more than 20 different cockpit configurations, which translated into high training costs along with the need for a wide array of parts, as well as trained mechanics to maintain the various aircraft and aircraft configurations. There is the need to also have mechanics trained to keep the various aircraft types maintained and to conduct the recurrent maintenance safety checks that are required, not to mention the maintenance of a wide variety of parts for various

SECTION 1 - INTRODUCTION
2_PBI_FORECAST_DECEMBER2005 1-15
aircraft types and models. The disparity between fleets of the Legacy carriers and the LCCs is evident when one considers that Northwest Airlines has 16 aircraft types/models from five different aircraft manufactures in its fleet. Delta, as noted, had 14 models in 2001 from two manufacturers, which, by 2005, had been reduced to 11 models with plans announced for a future reduction to 7 models by the end of 2006. Currently, both United and US Airways each operate eight different aircraft types/models from two different manufactures, although in the case of both airlines, some commonality exists between certain model within their fleets (for example, the A319 and A320 or Boeing 737-300/400/500).
The Legacy carriers have recognized this issue and several are now taking steps to reduce the number of different types of aircraft in their fleets to enhance commonality and reduce costs. Delta Airlines, which currently operates a mix of narrow-body and wide-body aircraft to PBI, has announced its plans to reduce the number of aircraft in their fleet by more than 80 aircraft by the end of 2006, as well as also announcing the retirement of all of its 767-200 aircraft by the end of 2005. American Airlines has already taken actions to reduce its fleet from a total of 14 aircraft types several years ago, intending to operate as few as 5 types within the next several years. American Airlines currently operates a fleet of seven aircraft types from three different manufacturers.
One item of interest is the enhanced reliance that the carriers are placing on the fleet of smaller narrow-body transports (A319, A320, B737-700/800) for increasingly longer domestic stage lengths. This trend had already been in place in the LCC segment for several years with Southwest Airlines employing the B737-300/700 on increasingly longer stage lengths, Frontier flying A319 aircraft to serve a number of markets having stage lengths of 1,500 to 2,000 miles, and Jet Blue employing the A320 for transcontinental service. In the wake of the September 11th attacks and the financial crisis that affected the Legacy carriers, Southwest Airlines commenced non-stop transcontinental service using its growing fleet of B737-700 aircraft. Legacy carriers are placing much greater emphasis on the use of narrow-body aircraft for domestic and transcontinental service as well, while refocusing their wide-body aircraft on international routes and some long-haul domestic routes.
This conversion of the fleet to a predominantly narrow-body domestic mix needs to be considered in the forecast process. The effect on a market such as PBI, which has historically experienced operations by wide-body aircraft on short-haul service (Delta) by its dominant carrier, could be significant. The future could bring a change/reduction in the gauge of the aircraft fleet and an increase in the frequency of service by smaller aircraft. The Air Transport Association (ATA) in its 2004 Economic Report noted that despite an 18.0 percent increase in scheduled airline departures in 2003 versus 2002, industry capacity growth was flat in 2003. The ATA noted that the “proliferation of smaller aircraft, most notably regional jets, drove this phenomenon, as the industry’s average aircraft size decreased from 136 seats in 2002 to 126 seats in 2003.”1 This would correspond to a near-term reduction in seats per departure and would likely see overall seats per departure growth be significantly reduced, or even potentially reversed. The potential affect of these changes has been considered in the review of the TAF and in the review of the assumptions that have been made by the FAA as a basis for TAF development.
1 2004 Economic Report, Air Transport Association.

SECTION 1 - INTRODUCTION
2_PBI_FORECAST_DECEMBER2005 1-16
1.3.1.3 Business Model Changes The adjustment to airline fleets and moves to enhance the commonality are just one element of the actions of the Legacy airlines to adjust their business models to respond to the changes in market demand. Other actions by these carriers will be discussed in this section. However, while the events of the past 4 years are resulting in fundamental changes in Legacy airline business models, it is not just the Legacy carriers, but also by the low-cost/low-fare carrier segment that is also altering their approach to doing business. The weakness within the Legacy airline group has led to opportunities for the LCCs to expand capacity, enter new markets and significantly enhance their share of market capture.
In the wake of the combined impact of the reduction in the business traveler segment, an economic recession, the impact of the September 11, 2001, terror attacks, SARS and the invasion of Iraq, and the ongoing insurgency, the Legacy airlines incurred, and continue to incur, massive financial losses. More recently, the position of the entire industry has been impacted by the rising cost of jet fuel, which has undermined the success of the cost-control measures implemented by the Legacy carriers and has reduced the yield and profitability of the LCCs. To date, U.S domestic airlines and, to a large extent, the six Legacy carriers have incurred $32 billion in losses since 2000 and are projected to incur as much as $10 billion in added loss by year end 2005. In the immediate wake of the events of September 11th, Legacy carriers began a series of major steps to respond to the rapidly changing conditions within both the domestic and international travel sectors. Legacy carriers reduced seat capacity within their respective systems, idling a number of aircraft and paying particular attention to removing from service older models that were less efficient and more costly to operate. In 2003, alone, the airlines reduced the size of their fleet with a net drop of 174 aircraft to 4,478—8 percent fewer aircraft than at the end of 2000. These changes were all basically aimed at adjusting the airlines’ seat mile capacities to more accurately match demand levels in the late 2001/2002 timeframe.
In addition to these actions, Legacy carriers also undertook more significant structural changes. Several airlines announced plans that included the de-peaking of a number of hubs, including those operated by Delta and American. In other instances, carriers reevaluated their systems and began downsizing or closing hubs within their systems. American closed its hub in St. Louis, while Delta announced closure of its hub operation at Dallas-Fort Worth International Airport in September of 2004, reducing operations from more than 200 daily flights to less than 30 daily flights. Even with the significant efforts at cost reduction and increasing efficiency, both United Airlines and US Airways entered Chapter 11 protection in 2002 to allow for consideration of additional cost-reduction measures.
Along with operational changes, the Legacy carriers embarked on the renegotiation of labor contracts with every segment of their employee base, resulting in several billion dollars of cost savings industry-wide. Other actions undertaken by the Legacy carriers included delaying the delivery of new aircraft, outsourcing various services, and the sale of assets including previously affiliated commuter carrier operations. The results of these cost reduction actions have been significant. For example, US Airways pilot pay rates are approximately 4 percent lower than Jet Blue and 20 percent below Southwest Airlines on similar equipment. US Airways and America West Airlines announced their intent to merge and re-constitute themselves as the single largest U.S. LCC. American, Continental,

SECTION 1 - INTRODUCTION
2_PBI_FORECAST_DECEMBER2005 1-17
Delta, Northwest, United, and US Airways have, in aggregate, reduced their unit costs to 1997 levels. By the summer of 2005, Delta Airlines alone had achieved an estimated $5 billion in cost savings. All of the aforementioned actions were beginning to result in stemming the Legacy carrier financial losses and several carriers were projecting a return to profitability.
The projected return to profitability discussed by the carriers in 2004 was effectively scuttled by rising cost of fuel, which jumped by more than 240 percent over the last 4 years. In 2001, Jet-A was $0.56 cents per gallon, which, by September 2005, had increased to $1.92 cents per gallon. As a rule, every $1.00 increase in the price of a barrel of oil adds $425 million in annual operating expenses for U.S. airlines. In 2004 alone, the airlines spent $9.93 billion more on jet fuel than they spent in the preceding year. With record high fuel prices in the wake of the two Gulf Coast hurricanes (Katrina and Rita), the impact on U.S. Legacy carriers has been significant and was a major contributing factor to decisions by both Delta and Northwest Airlines to seek Chapter 11 protection in September 2005.
The impact of unprecedented fuel costs in 2005 has led a number of carriers to once again look at the potential for operational changes and cost reductions both from operations and through additional concessions from employees. Notable for Palm Beach are the changes that have been announced by Delta Airlines as a part of the September 2005 bankruptcy filing. Delta is currently the dominant carrier at PBI and has historically served the airport with a mix of both regional aircraft and narrow-body and wide-body transports. Delta announced that it plans to use Chapter 11 to reconfigure it fleet and redefine both its domestic and international Legacy to maximize revenues. The airline is moving forward with plans to reduce service to short-haul markets, decrease domestic mainline capacity by between 15 to 20 percent, and intends to increase the use of regional commuter affiliates to increase point-to-point service and to serve a number of its current short-haul markets. Delta has announced plans to increase international capacity by 25 percent, which suggests that they will be shifting wide-body aircraft out of domestic service and onto international routes.
Specific actions that could affect PBI include the retirement of four aircraft types by the end of 2006, including the Boeing 767-200, which will be removed from operations by December 1, 2005. The airline has identified a 26 percent reduction in capacity at its Cincinnati hub, along with shrinking domestic capacity at Atlanta Hartsfield-Jackson International Airport by 10 percent. Notably, the winter schedule calls for cuts in dozens of non-stop routes from the Cincinnati hub, in smaller air service markets and to Florida destinations where competition from LCCs has become the most intense. In short, the airline is removing itself from a number of short-haul routes where they compete head-to-head with Air Tran. The airline is expected to backfill these routes with service to be provided by either regional carriers operating a mix of 50-seat and 70-seat aircraft and/or through the use of its own low-fare unit, Song. These changes have the potential to influence the fleet mix used by Delta, which has historically used a number of B767-300 aircraft in the PBI market. Should these aircraft be reduced, it is likely that seats per departure at PBI could decline, while the frequency of operations could increase as Delta employs smaller aircraft to serve demand.
While the period from 2001 through much of 2005 has been an exceedingly difficult one for the Legacy carriers, it has offered a number of opportunities that a number of LCCs have capitalized upon. One factor that was becoming increasingly evident prior to September 11,

SECTION 1 - INTRODUCTION
2_PBI_FORECAST_DECEMBER2005 1-18
2001, but has been brought into much sharper focus since, has been the emerging strength of low-fare carriers in the U.S. domestic airline industry. Unlike their more traditional competitors, airlines including Jet Blue, Frontier, Air Tran, and Southwest Airlines did not experience the massive financial losses that were typical of the Legacy carriers. However, the low-cost segment has not been totally immune to problems, as is evident by the bankruptcy of American Trans Air (ATA) in October of 2004. While ATA was significantly affected, others (including those noted above) quickly bounced back from the impacts of September 11, 2001 and have shown profits, albeit on a much smaller scale than in previous years. Furthermore, while the rising cost of fuel has adversely affected all airlines, LCCs given their much lower cost structure and better financial condition than Legacy carriers, LCCs have been able to hedge their fuel costs and weather the price increases without the more catastrophic affects that have faced Legacy carriers. As the Legacy airlines adjust their business models, reduce their hub presence, and transition a number of markets to their low-fare spin-offs or regional/commuter affiliates, the traditional low-fare\low-cost airlines have been taking the opportunity provided by the financial weakness of the Legacy carriers to expand their fleets and to expand the markets they service. Perhaps the most classic example of this strategy is the decision by Southwest Airlines to initiate service in the two traditionally strong US Airway hub markets of Pittsburgh and Philadelphia, Pennsylvania.
Several years ago Southwest Airlines was asked when the airline would launch non-stop transcontinental service. Their response was that transcontinental service would be launched when the competitive situation with the Legacy carriers was such that they could launch this service without a massive response from the mainline competitors. This condition occurred in the immediate aftermath of the demise of the high-yield business traveler in the 2000/2001 timeframe, the economic recession, and the events of September 11, 2001. The low-cost trend is not just limited to the U.S domestic market. Low-cost airlines are being considered in Latin American markets—a trend that could impact international travel both in Latin America and in the PBI market. Currently, a government/private partnership in Costa Rica is in the process of re-launching Aeropostal, the former Venezuelan carrier, to operate as a low-cost airline to initially serve destinations in Central America and the United States and to later expand into service to all of South America. The venture is well capitalized and is progressing toward a launch date. Not only are LCCs being considered overseas, U.S. domestic LCCs are beginning to initiate service to international destinations. Jet Blue serves five destinations in the Caribbean, while Frontier serves seven destinations in Mexico, and Air Tran serves Cancun and one destination in the Bahamas. While it currently does not provide international service, Southwest Airlines has also never made it a secret that it does not view international service out of the realm of its business plan.
As the Legacy carriers continue to face financial losses and are in the process of restructuring their operations and business models, LCCs have made major in-roads into markets that had previously been dominated by the Legacy carriers. For example, in 1991 the LCC segment accounted for approximately 4 percent of the U.S. aviation market, while as recently as 1999, this share had grown to an estimated 16 percent. Based on 2005 statistics, this share has increased to 25 percent of the market and is projected to reach 50 percent in a decade. The effect of this has been significant in markets served by the LCCs. For example, based on recent estimates by J.P Morgan and Company there are at least 600 market pairs in the U.S. where fares are capped at $299 or less, as a result of the entry of a

SECTION 1 - INTRODUCTION
2_PBI_FORECAST_DECEMBER2005 1-19
LCC. From this information, it can be seen how the continued expansion of LCC segment service has affected the profitability and financial condition of Legacy carriers whose cost structures have yet to be reduced to a level consistent with most of their LCC competition. Consideration of the implications of the changes in business models and the changing competitive environment within the industry for PBI will include such items as the future fleet mix of commercial activity at the Airport, the role of and trends within the regional airline industry, and the competitive stature of PBI versus other commercial airports in South Florida and, in particular, Fort Lauderdale-Hollywood International Airport.
1.3.2 Expansion of the Role and Changes in the Nature of Regional Airlines In the wake of myriad factors that have affected the airline industry from 2000 to 2005, the Legacy carriers began a process of reducing capacity with a corresponding reduction in the number of markets served with their fleet of narrow-body mainline transports. This process was magnified by the impact that enhanced security requirements with their associated longer wait times at airports had on short-haul markets (generally under 250 miles). Many travelers quickly found that it was as quick to drive between these markets and, in some cases, quicker than it was to fly. While removing mainline operations from service in many of these markets, the Legacy airlines did not wish to remove their brand name or their ability to feed passengers into their primary domestic hubs.
Increasingly, routes formerly served by Legacy carrier narrow-body transports were transferred to regional affiliates who operated at a lower cost structure using a fleet of either 37-seat, 44-seat or 50-seat regional jet aircraft. This trend has been accelerated as a result of current financial crisis on the part of the airlines. Delta’s recently announced plans to reduce its domestic capacity by up to 20 percent certainly supports the contention that the future will see even further focus on the role of regional airlines in both large and small short-haul markets, as well as in a variety of other markets where the regional jet can provide a better fit of capacity to demand. As the role of these carriers has increased, the regional carriers have begun to transform themselves into airlines having all-jet fleets and providing service with increasingly larger regional aircraft. In addition, not only are the Legacy carriers employing regional service, but several of the LCCs, including Frontier, Jet Blue, America West and Air Tran, have employed regional airlines to feed their respective systems. Actions such as these could result in an increase in the number and percentage of regional jets at PBI, with a corresponding impact on flight frequency, gate utilization, and seats per departure during the planning period.
1.3.2.1 Changing Nature of Aircraft in Regional Airline Fleet As the nature of markets being served by regional airlines has changed and expanded, so has the type of aircraft within the fleet of regional carriers changed and expanded to better fit market opportunities. Increasingly, the ability to discern a distinct difference between a regional commuter aircraft and what had formerly been considered a mainline narrow-body transport aircraft has been more and more difficult to define. When regional airlines, in their current form, first emerged in the years immediately after airline deregulation in 1978, these airlines employed a diverse variety of propeller and turbo-prop aircraft to compose their fleet. Most of these aircraft were not specifically intended for commuter service but, rather, consisted of aircraft such as nine-seat Cessna and Beechcraft models, 19-seat Embraer EMB-110, and Swearingen Metroliners, as well as older aircraft models including various

SECTION 1 - INTRODUCTION
2_PBI_FORECAST_DECEMBER2005 1-20
Convair variants, the Martin 404, and even the Douglas DC-3. In essence, the regional airline fleet in the early 1980s consisted of aircraft types that were available, rather than ones that were necessarily desirable for the role they were to serve.
As regional airlines continued to gain popularity, specific aircraft began to be developed to meet the unique requirements of what was then the regional marketplace. In the 1980s, a number of aircraft manufacturers introduced turbo-prop aircraft specifically designed for the regional airline market, including models such as the Dornier 228, Saab 340, and Embraer EMB-120, along with some larger commuter turbo-prop models including the BAE ATP, Dash 8 and ATR-42. It was not until the early 1990s that the concept of a jet specifically designed for regional airline service actually began to gain acceptance, and in 1993 the first 50-seat Canadair CRJ was delivered to Comair Airlines. Since that time, derivatives of this aircraft having 40 and 44 seats have been developed and have entered service, while other manufacturers including Embraer, Avro, and Dornier developed and deployed regional variants of varying sizes in the U.S. market. Introduction of the regional jet has had a phenomenal affect on the regional airline aircraft fleet. For example, in January 1995, there were 2,908 turbo-prop routes in the United States and only 76 routes served by regional jets. In January 2003, the number of turbo-prop routes had declined to 1,705, while regional jet routes had increased to 1,874 in the U.S. There is no significant basis for assuming that this trend is going to change in the future as airlines such as Jet Blue add to the inventory of commuter aircraft through their acquisition of the EMB 190 and other airlines as a part of their restructuring have gained relief from pilot scope clauses restricting use of regional jets.
Legacy airlines were quick to see the value of regional jet aircraft and to employ these aircraft to accomplish several goals, including moving traffic to and from hubs, bypassing/overflying competitor hubs, replacing turbo-props, bolstering point-to–point and non-stop service, and complementing their mainline fleets. As the major Legacy carriers continue their efforts to recover from the impacts of September 11, 2001, and the competition of the low-cost/low-fare airlines, it is anticipated that they will benefit from the extensive use of regional airline affiliates to respond to capacity fluctuations within their systems while allowing them to maintain the presence across their route network. This is clearly the stated intention of Delta in the recently announced plan to right-size hubs, reduce domestic capacity, and more effectively match available seats to seat demand in its domestic markets.
It is clear that in the cost-driven market that exists, Legacy carriers require the capability to meet the needs of specific routes and markets in smaller and more precise increments. Others besides Delta have specifically noted this need, including US Airways, United, American, Continental, and Northwest, along with smaller carriers such as Alaska Airlines and America West. As these realities have emerged in the industry, it has become increasingly apparent that a gap has existed in the size of regional versus mainline aircraft that needed to be filled to allow the carriers to continue to penetrate markets with aircraft sized for the demand in these markets. While the 50-seat regional jet revolutionized the regional airline industry, its cost of operation was somewhat high, given its limited seating.
The availability of existing aircraft in the 50- to 100-seat range has been extremely limited in the past, with models such as the DC9-10, and BAE 146 reaching an age that significantly undermines their operating viability or having operational costs that are no longer cost-

SECTION 1 - INTRODUCTION
2_PBI_FORECAST_DECEMBER2005 1-21
effective. These aircraft are in the process of being completely phased out. While some new aircraft such as the B737-500/600 and the Airbus A318 are available at the upper end of this segment, there still remains a considerable gap between much of the current regional fleet and the aircraft operated by the Legacy carriers. As regional airlines have stepped in to take on a greater share of service, the need for additional aircraft that bridge the gap between the traditional 50- and recently introduced 70-seat jets and those used by the single-aisle narrow-body transport has become apparent. New aircraft, including the Bombardier CRJ-900 and the Embraer EMB 190 and 195 series are just beginning to enter the market. These new aircraft will significantly improve the capability of regional carriers to serve markets that previously required multiple smaller regional aircraft or were being inefficiently served by aircraft that were too large to provide service profitably.
The idea of right-sizing service to allow for greater market penetration and to service markets with aircraft better suited to demand levels is the basis for the actions of US Airways and Delta to use 70-seat regional jets as a part of their regional service strategy and also was key in the decision by Jet Blue to purchase 100 EMB-190s with a 100-seat configuration. The EMB 190 purchase allows Jet Blue to serve markets it had not previously considered viable for service using its 156-seat A320 aircraft. Furthermore, it will allow the airline to more efficiently match aircraft size with demand at certain times of the day in many of its larger markets. The infusion of larger regional aircraft will also facilitate the use of these aircraft types on longer stage lengths, and will aid Jet Blue in competing with it major low-cost competitors in a number of markets.
Over the past 5 years, 50-seat regional jets have begun serving longer stage lengths with flights of 1,000 miles or longer. In the last 4 years, the number of origin and destination routes shorter than 400 miles served by Legacy carriers has dropped by 25 percent. Smaller regional aircraft are not generally configured to provide the comfort that was typically provided on a narrow-body transport. The new 70- to 110-seat regional jets are being designed and configured to provide the airfield performance, range, and cabin comfort necessary to provide an enhanced level and quality of service. This, in turn, renders these aircraft much more viable to fulfill the requirements of longer routes and enhance point-to-point service while the Legacy carriers focus on high-yield, longer-haul service employing their narrow-body and wide-body fleets. The emergence of larger versions of regional jet aircraft is anticipated to influence the fleet mix and size and, potentially, the level of operational activity and the markets served by these aircraft at many major airports including PBI.
1.3.2.2 Changing Relations with Legacy Carriers Historically, regional airlines operated either as owned subsidiaries of a major carrier or through code-share agreements with major airlines. The regional airline industry has been inextricably linked to major airline partners for its survival and this linkage has not significantly changed. During the mid-1990s there was an impetus by the major carriers to begin to purchase controlling interest in its regional affiliates with moves by Delta, Northwest, and Continental. As the decade ended, this strategy had been reevaluated and most of the carriers were in the process of divesting themselves of controlling ownership of regional airlines in favor of returning to the more traditional code-share arrangements. A major contributing factor to this trend was the pilot strike by Comair pilots over compensation, which, when settled, resulted in Comair having the highest salary structure
SECTION 1 - INTRODUCTION
2_PBI_FORECAST_DECEMBER2005 1-22
for pilots in the regional airline industry. This salary structure has recently been cited as one reason that Delta Airlines has been unable to find a buyer for Comair during recent attempts to sell its controlling interest in the airline, while being able to sell Atlantic Southeast Airline to SkyWest.
Overall, the regional airline industry has fared much better than the rest of the airline community over the past several years, in part because of the issues noted in previous sections. “The regional segment is firmly in the black. According to FAA data, that part of the industry enjoyed an aggregate operating profit of $1 billion and net earnings of $432.8 million in the fiscal year ended September 30, 2004.”2 Regional airlines carried some 129 million passengers in FY 04, up 18.7 percent over fiscal year 2003 and a 56 percent increase over fiscal year 2000. FAA says regional airlines now represent approximately 37 percent of commercial traffic at the 35 busiest U.S. airports, up from 30 percent in 2000. Over the next 2 years, their activity is expected to increase by 13.6 percent.3 As noted previously, not only is the role of regional airlines increasing, but the industry has been highly profitable over the past several years. Much of the reason for this profitability is associated with the contract arrangements between the regional carrier and the mainline carrier it feeds. Most regional carriers have operated under a fee-per-departure financial arrangement that was negotiated with the major airline partners in which the major carrier assumes much of the operating cost risk in return for a guaranteed level of service. This fee- per- departure arrangement has shielded regional carriers from much of the impact of the decrease in passengers and, more recently, increased fuel costs that have so impacted the Legacy carriers.
This situation is starting to change as the Legacy carriers are looking to all avenues for cost savings as a part of their business model restructuring. As the major airlines work to revamp their higher cost structures, competitive pricing may force regional airlines to cut their fee-for-departure rates, as happened between United Airlines and Atlantic Coast Airlines, which resulted in the launching of Independence Airlines. It should be noted that the circumstances with the former Atlantic Coast Airlines were somewhat unique and aided greatly in their ability to launch themselves as a new independent airline. Additionally, Independence Air has been experiencing significant financial problems, significantly reduced service, delayed aircraft deliveries, and is a possible candidate for entering Chapter 11, which could act to constrain others considering a similar course of action.
However, Atlantic Coast Airlines is not the only regional carrier that has considered launching an independent airline based on the foundation of the regional carrier. Mesa Airlines has expanded its contingencies based on the conditions at US Airways, one of its code-share partners, to include the possible launching of a discount airline. Mesa has been in discussions with its pilots about the possibility of operating B737s out of Pittsburgh and/or Charlotte in a manner similar to the Independence Air model. As these agreements between the carriers are evaluated, there will be an increasing focus by the regional airlines on operating their business models in a manner consistent with that typical with all other segments of the industry.
2 Air Transport World, May 2005, page 32. 3 Air Transport World, May 2005, Page 32.

SECTION 1 - INTRODUCTION
2_PBI_FORECAST_DECEMBER2005 1-23
Some of the implications of the changing relationship with Legacy carriers that could influence trends at PBI include the potential increase in the use of regional airlines to serve LCCs. Just as Jet Blue has recognized the value of a regional aircraft to its market strategies, so too have airlines such as Frontier (code sharing with Horizon Air) and America West (Big Sky and Mesa Airlines). Once the merger between America West and US Airways is fully completed the re-branded US Airways will be established as an LCC that will have an extensive network of regional airlines feeding its expanded route structure. Thus, the future will include regional airlines serving the surviving Legacy carriers under their new business models as well as an array of LCCs.
The ongoing efforts of the Legacy carriers to right-size and turn an increasing number of markets over to regional carriers have implications for markets such as PBI. One such implication could be an increase in point-to-point service by regional jets operating on behalf of their code-share partners, again with an attendant increase in non-stop service to a greater number of markets. This trend is already occurring in a number of small and mid-sized air travel markets. “Increasingly travelers are being presented itinerary options that have them connecting in airports such as Louisville, Little Rock, Tulsa or Akron-Canton….a national air travel system that relies increasingly on more flights by smaller planes gives air travelers more options in routing trips.”4 This trend can be seen in the percentage of increase in connecting passenger at a number of origin and destination airports between 2003 and 2004. Examples of increased connecting activity over this one-year period include: Tampa with an 11 percent increase, Myrtle Beach at a 71 percent increase, Birmingham at a 46 percent increase, Louisville at 11 percent, Sacramento at 24 percent, and Newport News with a 56 percent increase. A review of itinerary alternatives on several airline websites identified an increasing number of flight routings that would bypass hubs making use of regional jet service through one, and sometimes more, secondary markets. When the stated service changes of Delta are considered, it is likely that their current use of small hub and non-hub connections as options to connecting through one of their hubs is likely to expand. An increase in non-stop destinations bypassing congested hubs employing the increasingly sophisticated fleet of regional jets could contribute to the re-capturing of market share to PBI that has previously been lost to other commercial airports in south Florida.
Finally, PBI has a history of international service using regional aircraft. The potential entry into the market of a series of regional jets having enhanced airfield performance, range, and comfort could enhance the ability to serve multiple Caribbean destinations and, potentially, some other international routes using regional aircraft. Use of regional jet aircraft by carriers including Air Canada, Delta, and American is already occurring in several market pairs between U.S. and nearby international destinations.
1.3.3 Airfare Equalization between Legacy and LCCs One factor that has affected passenger activity levels at PBI in a dramatic fashion has been the strength of the Fort Lauderdale-Hollywood International Airport in capturing market share from PBI. The strength of FLL has been built largely upon the availability of a significant level of low-fare airline service, which, when compared to the typical Legacy carrier fare levels of the 1990s, placed PBI at a considerable cost disadvantage. As a result, FLL saw passenger levels increase consistently and dramatically, while PBI experience 4 USA Today, Money Section, September 13, 2005.

SECTION 1 - INTRODUCTION
2_PBI_FORECAST_DECEMBER2005 1-24
limited passenger growth. Throughout the 1990s, the success and expansion of Southwest Airlines, along with the entry of other low-cost/low-fare airlines including ValueJet in 1993, Frontier in 1994, Air Tran in 1995 and, Jet Blue in 1999, were based on capitalizing on the increasing costs of the Legacy carriers, which were translating into higher ticket prices, particularly those purchased by the high-yield business traveler.
As has been noted previously, a number of forces combined in the late 1990s to undermine Legacy carrier ticket pricing. These included consumer perceptions of poor service and Legacy carrier indifference, the transparency of pricing that is provided by the rapidly expanding use of the internet to book travel, a general unwillingness of business travelers to pay five to eight times the cost of the lowest fare available, and cutbacks that have reduced service quality differences between Legacy carriers and LCCs. As these factors undermined the pricing power of the Legacy carriers, low-fare airlines began to expand their market shares and increase their capture of both leisure and business travelers. Then 2001 came along with the terror attack and recession and the Legacy carriers were staggered by losses of passengers and high costs, and the low-fare carriers were quick to seize the opportunity to exploit the financial weakness of Legacy carriers by quickly expanding their fleets and their networks, a process that is still continuing, while at the same time Legacy carriers are reducing domestic capacity.
Legacy carriers are also significantly reducing their airfares, and it is this reduction in airfares that presents a significant factor that needs to be considered in the future projections of activity at PBI. Considerable attention has been given to the combination of events that have led to the current crisis in the commercial aviation industry, particularly as it relates to the non-low-fare carrier segment. It is clear that while their operational costs were considerably higher than the low-fare segment, these airlines were making significant profits from 1994 to 1999. While airfares for leisure travelers remained generally static, the cost to business travelers over this period increased, and in many markets these increases were dramatic. Were it not for the loss of pricing power in the business traveler segment, the Legacy carriers would likely not be in the dire condition they find themselves in today. Furthermore, the terror attacks of September 11th, while certainly causing significant impacts to the industry, cannot be blamed for the loss of business travel. This was already occurring before 2001. As noted by the Air Transport Association in its discussion of airline pricing; “One key factor is a newfound thriftiness among business travelers that has instilled in them more flexible purchasing habits. The emergence of low cost carriers as a viable and truly national product alternative has brought about lower fares, greater flexibility and increasingly competitive schedules. Traffic will soon rebound to pre 9/11 levels, but consumers on average paid 13 percent less to fly one mile in 2003 than in 2000. In fact they are paying less than they paid in 1988, even without adjusting for inflation”.5
Legacy carriers were quick to realize that, along with making significant reductions to their cost structure, they were also going to have to compete head to head with the LCCs, and this meant that they have to be price-competitive. The need to be price-competitive has clearly been displayed in the significant changes that have occurred in the price of a last-minute walk-up fare on the Legacy carriers. In January 2005, Delta implemented its Simplifares program, which capped the cost of last-minute walk-up fares at $499 one way.
5 Air Transport Association, 2004 Economic Report, page 16.
SECTION 1 - INTRODUCTION
2_PBI_FORECAST_DECEMBER2005 1-25
While still somewhat higher than some of the low-fare carriers’ cap of $299, the action by Delta significantly reduced airfares over what they had formerly been. Delta’s implementation of Simplifares and the resultant airfare price caps was matched by other Legacy carriers to varying degrees. The actions by the Legacy carriers have begun to level the playing field with the low-fare competitors. The difference in price between Legacy carrier service and low-fare carrier service that used to be significant in many market pairs has evened out and, in a number of instances, has been reversed with the Legacy carrier, actually under-pricing the low-fare carrier.
For PBI this means that the competitive advantage that an airport with significant low-fare service, such as FLL, which formerly enjoyed a considerable price advantage over PBI, no longer possesses the level of advantage that was typical of the late 1990s. This fact is borne out by a review of the Air Travel Price Index, which is maintained by the U.S. Department of Transportation’s Bureau of Transportation Statistics. Between the first quarter of 2004 and the first quarter of 2005 the cost of travel from PBI dropped an estimated 6.9 percent. While FLL experienced a 1.4 percent reduction in air travel cost, for the first time since the index was initiated, the cost of travel as listed in the Air Travel Price Index at PBI for the first quarter of 2005 was actually 1.7 percent lower than FLL. What is also notable is the fact that in the first quarter of 2004 the price index listed PBI as being a full 4.1 percent higher than FLL. It is believed that the influence of the reductions in airfares that have been taking place from 2001 to 2005 are a key contributor to the unprecedented increase in enplanements (532,110 additional enplaned passengers) at PBI over the past 2 years. One fact is clear, the increase in enplanements at PBI over the past 2 years, while potentially contributed to by the low-fare carriers, cannot be attributed solely to their influence. For example Southwest Airlines has been serving PBI since January 2001 and Jet Blue commenced operations at the airport in October 2000.
It is believed that the airfare playing field is leveling between the Legacy carriers and the low-fare carriers and that this leveling will reduce some of the luster that low-fare service used to have in generating demand in particular markets. The ability of one airport market to attract large numbers of passengers from another market as a result of differences in airfares, particularly in an area like Southeast Florida, will be less likely in the future. While fuel costs and domestic capacity reductions by Legacy carriers will undoubtedly result in the ability to raise airfares, these increases will have to be indexed to the price of the low-fare carrier segment and thus significant price differentials are not expected to emerge. Furthermore, as gas prices increase for commuters in the Southeast Florida metropolitan areas, the willingness to travel 50 or 60 miles for a marginal cost savings in airfare will evaporate and it is likely that market share once lost to FLL will return to PBI.

SECTION 2 Forecast Approach

2_PBI_FORECAST_DECEMBER2005 2-1
SECTION 2
Forecast Approach
2.1 Overview For planning purposes, it was determined that the FAA TAF would only be used as a guide for the development of a baseline projection of activity for PBI, primarily because the manner in which categories of operational data are tabulated in the TAF does not always allow the identification of discrete components of activity. For instance, under the TAF regional/commuter operations, other “for-hire activity” or so-called “air-taxi” activities are combined under the broader category of commuter activities. While this may serve the purpose for which the FAA uses the TAF, it is not always well suited for master planning purposes. Similarly, there was a need to disaggregate air cargo operations from the commercial aviation category so that both belly and all-cargo activities could be specifically identified for subsequent analyses of facility needs. Finally, discrepancies were also found between the FAA TAF, the FAA ATADS data, and the Airport traffic reports for general aviation operations. Based on the latter, it appears that the air taxi operations component was missing. As a result, some adjustments resulted in changes to the historic operations. For these reasons, it was determined that the FAA TAF would only serve as a guide and projections would be made based on adjusted local data sets.
All assumptions and projected activity levels developed for this system plan were prepared in close coordination with the FAA Forecast Branch in Washington, D.C.
2.2 Forecast Methodology The methodology adopted for the activity forecast at PBI focused on passenger enplanements as the primary determining factor in defining the level and complexion of commercial aircraft operations. As such, local socioeconomic factors, the air carriers’ current fleet orders obtained from the JP Airline-Fleets International, local trends observed at PBI, industry trends, as well as the influence of the Fort Lauderdale Airport, were also considered in developing enplaned passenger projections and the subsequent development of commercial operations projections at PBI. Historic passenger enplanements were obtained from the Airport traffic records, while the Department of Aviation’s (DOA) landing reports for the years 2000 to 2004 were used to better assess the airline fleet mix over the last 5 years, with particular attention being paid to changes in fleet mix that have occurred during this highly transitional period for the air carrier industry in the U.S. With the identification of base-year fleet mix and historic trends in fleet transition, future fleet mix was projected and expressed in terms of percentages of operations by aircraft in specified seat ranges. Passenger aircraft operations were then obtained based on established growth in passenger enplanements, projected fleet mix, and local and national trends in aircraft load factors projected over the planning period. From this information, a seat-per-departure value was developed and operations projections were developed for the threshold years over the forecast timeframe. To better estimate specific segments of the

SECTION 2 – FORECAST APPROACH
2_PBI_FORECAST_DECEMBER2005 2-2
commercial airline segment, individual projections employing the methodology noted above were developed for domestic mainline activity (Legacy and low-fare carriers combined), regional commuter activity, and international activity. The methodology and assumptions used to derive cargo volume and operations, general aviation activity, and military aircraft operations, are addressed in their respective sections.
The following sections present the different projection techniques/methodologies that were tested to project passenger enplanements at PBI. The various forecasting methodologies included time-series analyses, regression analyses employing multiple variables, and market-share approach analyses.
2.2.1 Time Series Analyses Time series analyses consists of examining trends and cycles of historic data, such as historic enplanement levels, and using mathematical techniques to extrapolate in the future. The underlying assumption of this methodology is that the activity patterns historically experienced at the Airport will continue into the future. These analyses use a regression-based approach, although the approach does not employ socioeconomic or other factors as independent variables, but rather just compares historic activity patterns over a specified timeframe and projects these patterns forward. Three time periods were selected to assess various historic growth patterns at the Airport:
5-year historic data from 2000 to 2004, to cover the effect of the aftermath of the September 11, 2001, attacks on the aviation industry
10-year historic data from 1995 to 2004, to account for the booming of the aviation industry in the mid 1990s, the recession that started timidly in the late 1990s, and the aftermath of September 11
25-year historic data from 1980 to 2004, to consider the impact of deregulation, the Persian Gulf War, as well as all of the factors noted in the previous two time-series analyses
Table 2-1 summarizes the results. As shown, the passenger enplanements resulted in the range of 4.7 million passengers in 2025 for all three time periods selected. The average annual growth rate over the planning period averaged approximately 1.8 percent.
TABLE 2-1 Trend Analysis Results
Year Total Enplanements1 Total Enplanements2 Total Enplanements3
Historic 1980 1,299,838
1981 1,304,257
1982 1,601,782
1983 1,867,794
1984 1,972,863
1985 1,901,839
1986 2,093,833

SECTION 2 – FORECAST APPROACH
2_PBI_FORECAST_DECEMBER2005 2-3
TABLE 2-1 Trend Analysis Results
Year Total Enplanements1 Total Enplanements2 Total Enplanements3
1987 2,332,750
1988 2,518,739
1989 2,583,523
1990 2,856,757
1991 2,541,922
1992 2,534,978
1993 2,544,757
1994 2,801,615
1995 2,729,122 2,729,122
1996 2,852,014 2,852,014
1997 2,917,014 2,917,014
1998 2,965,253 2,965,253
1999 2,879,246 2,879,246
2000 2,932,635 2,932,635 2,932,635
2001 2,978,763 2,978,763 2,978,763
2002 2,748,181 2,748,181 2,748,181
2003 3,011,973 3,011,973 3,011,973
2004 3,280,291 3,280,291 3,280,291
Forecast 2005 3,365,523 3,107,115 3,208,925
2010 3,705,313 3,624,236 3,765,669
2015 4,045,102 4,016,693 4,111,750
2020 4,384,892 4,377,284 4,444,261
2025 4,724,682 4,726,596 4,776,556
Average Annual Growth Rate (2004 – 2025): 1.75% 1.75% 1.81%
Sources: Airport Management Records; Ricondo & Associates, Inc. Prepared by: Ricondo & Associates, Inc. Notes: 1 Trend analysis of historic passenger enplanements from 1980 to 2004. 2 Trend analysis of historic passenger enplanements from 1995 to 2004. 3 Trend analysis of historic passenger enplanements from 2000 to 2004.
2.2.2 Multi-Variable and Single-Variable Regression Analyses The regression analyses entailed collecting and analyzing historic data and using standard statistical techniques to identify relationships between elements of historic data to project

SECTION 2 – FORECAST APPROACH
2_PBI_FORECAST_DECEMBER2005 2-4
future activity. For example, historic enplanement data from 1988 to 2004 were paired against socioeconomic variables that might influence aviation activity (e.g., population growth, personal income per capita, number of households, nonfarm employment) along with aviation-related factors (fuel costs, domestic yield, or average fare) to establish whether a statistical relationship between the socioeconomic variables and the demand for air travel existed and what the impact in terms of future activity might be. For the purpose of the regression analyses, the time frame of 1988 to 2004 sample period was the most extensive possible in order to have matching historic data for the various variables involved.
The regression analysis of socioeconomic data with aviation passenger statistics provides a structured set of relationships between these factors and air travel demand. Four steps were required to set up the regression analysis:
Selecting the dependent variable (the time frame of historic aviation data) Selecting the independent variables (socioeconomic and industry related data) Developing the regression equation Identifying forecast values for the independent variables
The dependent variable for this analysis was the Airport’s annual passenger enplanements. The independent variables included the socioeconomic and the aviation-related factors listed above. The historic and forecast socioeconomic data used in this study were obtained from the National Planning Association (NPA) Data Services, Inc. Appendix A provides the NPA detailed socioeconomic forecast data used for the regression analyses. The FAA Fiscal Years 2005-2016 Aerospace Forecasts were used for the fuel cost and yield forecasts. FAA data beyond fiscal year 2016 were trended based on the growth projected within the FAA analyses out to the forecast horizon of 2025.
Multiple regression equations involving various combinations of the independent variables to historic aviation demand at the Airport were created. Table 2-2 presents the results of the equations that provided the highest “R Square” value. The degree to which one or more predictors (independent or X variables) are related to the dependent (Y or annual passenger enplanements) variable is expressed in the correlation coefficient R, which is the square root of R-squared. In multiple regressions, R can have values between 0 and 1. The closer R is to 1 the better the variables are related, or, more simply put, the closer the R value is to 1 the more the independent variables are related to the trends occurring in dependent variable, which, in this case, is passenger activity. As shown in Table 2-2, however, the R square values obtained were not as high as typically desired, ranging from 0.66 to 0.74, which generally indicates that while there is some correlation of the variables, other factors influenced passenger activity at PBI. The regression based-projections also all resulted in low estimates of future passenger enplanements over the 20-year forecast period, particularly given the growth levels experienced over the past 2 years at PBI and other industry-wide changes discussed previously. The regressions analysis resulted in projected 2020 enplanement levels of approximately 3.9 million, corresponding to an average annual growth rate lower than one percent, which is below the FAA TAF.

SECTION 2 – FORECAST APPROACH
2_PBI_FORECAST_DECEMBER2005 2-5
TABLE 2-2 Regression Analysis Results—Multiple Independent Variables1
Equations1
Year
Historic Passenger
Enplanements Baseline 1 Baseline 2 Baseline 3 Baseline 4 Baseline 5 Baseline 6
1988 2,518,739
1989 2,583,523
1990 2,856,757
1991 2,541,922
1992 2,534,978
1993 2,544,757
1994 2,801,615
1995 2,729,122
1996 2,852,014
1997 2,917,014
1998 2,965,253
1999 2,879,246
2000 2,932,635
2001 2,978,763
2002 2,748,181
2003 3,011,973
2004 3,280,291
2005 3,447,434 3,155,843 3,443,374 3,458,057 3,443,374 3,158,654
2010 3,388,200 3,376,641 3,397,346 3,383,140 3,397,346 3,385,404
2015 3,507,496 3,576,812 3,526,269 3,492,284 3,526,269 3,592,430
2020 3,749,194 3,777,858 3,764,364 3,727,079 3,764,364 3,798,385
2025 3,922,024 3,970,155 3,934,747 3,887,907 3,934,747 3,997,710
Average Annual Growth Rate (2004-2025):
0.85% 1.18% 0.91% 0.99% 0.87% 0.95%
R Square 0.74 0.66 0.74 0.74 0.74 0.66
Sources: Airport Management Records; FAA Aerospace Forecasts FY 2005-2016; Ricondo & Associates, Inc. Prepared by: Ricondo & Associates, Inc. Note: 1 The equations were defined as follows: Baseline 1: Projected Enplanements = (Population*X1) + (Personal Income Per Capita*X2) + (Fuel Cost*X3) + Coeff. Baseline 2: Projected Enplanements = (Population*X1) + (Nonfarm Employment*X2) + (Yield*X3) + Coeff. Baseline 3: Projected Enplanements = (Population*X1) + (Nonfarm Employment*X2) + (Fuel Cost*X3) + Coeff. Baseline 4: Projected Enplanements = (Households*X1) + (Personal Income Per Capita*X2) + (Fuel Cost*X3) + Coeff. Baseline 5: Projected Enplanements = (Households*X1) + (Nonfarm Employment*X2) + (Fuel Cost*X3) + Coeff. Baseline 6: Projected Enplanements = (Households*X1) + (Nonfarm Employment*X2) + (Yield*X3) + Coeff.

SECTION 2 – FORECAST APPROACH
2_PBI_FORECAST_DECEMBER2005 2-6
The results of the regression projections were not selected for use in defining a baseline forecast for PBI. After reviewing the results of the analyses and considering past market conditions, it appeared that the analyses were skewed downward by lack of passenger enplanement growth that typified much of the 1990 through 2002 period. The regression analyses would likely be reasonable projections of future activity were it not for the fundamental changes occurring in the industry, including the equalization/reduction in airfares that have occurred over the past 2 years. There is considerable consensus that while some increase in airfares are likely in the future, the landscape of the industry has completely changed and conditions will not return to a pre-2000 environment that typically contributed to the lack of significant growth in the PBI marketplace. With the changes in airfares over the past 2 years PBI has seen a resurgence that will undoubtedly moderate in the future, but that does suggest a change in the dominance of FLL and a leveling of the playing field in the PBI/FLL market area. The regression-based projections do not reflect these emerging conditions and, for this reason, were not believed to adequately reflect the impact of the changes that are occurring in the industry and in the local market. As a result, the regression-based approaches were rejected.
Regression equations relating combinations of a single independent variable to historic aviation demand were also tested. Table 2-3 summarizes the results of these single independent-variable equations. Again, the R square values obtained were very low and passenger enplanements ranged from approximately 3.2 to 4.0 million in 2025, resulting in an average annual growth rate of less than one percent. These analyses were also rejected as a basis for the baseline activity forecasts for PBI.
TABLE 2-3 Regression Analysis Results—Single Independent Variables1
Enplanement Projections
Year Historic
Enplanements Baseline 7 Baseline 8 Baseline 9 Baseline 10 Baseline 11 Baseline 12
1988 2,518,739
1989 2,583,523
1990 2,856,757
1991 2,541,922
1992 2,534,978
1993 2,544,757
1994 2,801,615
1995 2,729,122
1996 2,852,014
1997 2,917,014
1998 2,965,253
1999 2,879,246
2000 2,932,635
2001 2,978,763

SECTION 2 – FORECAST APPROACH
2_PBI_FORECAST_DECEMBER2005 2-7
TABLE 2-3 Regression Analysis Results—Single Independent Variables1
Enplanement Projections
Year Historic
Enplanements Baseline 7 Baseline 8 Baseline 9 Baseline 10 Baseline 11 Baseline 12
2002 2,748,181
2003 3,011,973
2004 3,280,291
2005 3,120,731 3,089,395 3,152,935 3,466,305 3,248,814 3,132,032
2010 3,331,403 3,343,890 3,388,123 3,349,600 3,248,814 3,354,989
2015 3,538,348 3,523,249 3,594,589 3,456,893 3,248,814 3,578,559
2020 3,749,301 3,665,778 3,773,673 3,713,417 3,248,814 3,810,495
2025 3,965,622 3,804,227 3,945,352 3,897,781 3,248,814 4,052,362
Average Annual Growth Rate (2004-2025):
0.91% 0.71% 0.88% 0.82% -0.05% 1.01%
R Square 0.76567 0.5905 0.6626 0.7278 0.0758 0.6560
Sources: Airport Management Records; FAA Aerospace Forecasts FY 2005-2016; Ricondo & Associates, Inc. Prepared by: Ricondo & Associates, Inc. Note: 1 The equations were defined as follows: Baseline 7: Projected Enplanements = (Population*X1) + Coeff. Baseline 8: Projected Enplanements = (PIPC*X1) + Coeff. Baseline 9: Projected Enplanements = (Nonfarm Employment*1) + Coeff. Baseline 10: Projected Enplanements = (Fuel Cost*X1) + Coeff. Baseline 11: Projected Enplanements = (Yield*X1) + Coeff. Baseline 12: Projected Enplanements = (Households*X1) + Coeff.
2.2.3 Market-Share Approach A common methodology for forecasting aviation activity is the use of market-share analysis. This approach evaluates the extent to which a specific airport captures a portion of a defined market, whether that is at a national or regional level. Under the market-share analysis used in this forecast effort, PBI’s historic passenger enplanements were compared to a variety of markets including total U.S. domestic enplanements, total enplanements in the FAA Southern Region and total enplanements within the State of Florida over the period from 1988 to 1994. Local trends, as noted in the preceding discussions, have been identified and evaluated so that they could be incorporated into the assessment of each projection technique for review purposes. The historic share of the market is projected into the future, applying assumptions that result from a review of the historic data as to whether the market share may increase, remain static, or potentially decline. These shares are then multiplied by forecasts of the activity within the larger geographical area to produce a market-share projection.
For this study, several market-share ratios were analyzed:
PBI/U.S. constant market-share ratio for period 1980-2004

SECTION 2 – FORECAST APPROACH
2_PBI_FORECAST_DECEMBER2005 2-8
PBI/U.S. declining market-share ratio, for period 1995-2004
PBI/Southern Region constant market-share ratio, for period 1995-2004
PBI/Southern Region increasing market-share ratio, for period 1995-2004
PBI/Florida constant market-share ratio, for period 1990-2004
PBI/Florida increasing market-share ratio, for period 1995-2004
PBI/(PBI+FLL) increasing market-share ratio returning PBI to its former market capture rate of 1995/1996
The FAA TAF was used to obtain the historic enplanement data and the forecasts until year 2020 for the U.S., the Southern Region, Florida, and FLL. Beyond year 2020, a trend analysis was performed on the TAF data to project the number of enplanements for these markets. Table 2-4 summarizes the results for the various market-share ratios developed. As shown, annual passenger enplanements varied from 5.6 to 10.1 million in 2025, which corresponds to average annual growth rate ranging from 2.7 to 5.7 percent. Taking into consideration the concerns related to the time series and regression-based projection techniques, the use of the market-share projection approach was determined to provide the best means of developing a projection of future activity at PBI, while considering the changes occurring throughout commercial aviation and the dynamic nature of the marketplace in Southeast Florida. With the determination that market-share approaches provided the best means for projecting future activity, the question quickly focused on which of the market-share analyses should be considered as best representing the future baseline forecast for PBI. The basis of this determination is discussed in the next section.
More details of all of the regression and market-share approach analyses presented in this section are provided in Appendices B and C.
TABLE 2-4 Market Share Analysis Results
Enplanement Projections
PBI/US Market Share Ratio
PBI/FAA Southern Region Market Ratio PBI/Florida Market Ratio
PBI/FLL Market Ratio
Year Historic
Emplanements1 Constant
Ratio2 Declining
Ratio3 Constant
Ratio4 Increasing
Ratio5 Constant
Ratio6 Increasing
Ratio7 Increasing
Ratio8
1988 2,518,739
1989 2,583,523
1990 2,856,757
1991 2,541,922
1992 2,534,978
1993 2,544,757
1994 2,801,615
1995 2,729,122

SECTION 2 – FORECAST APPROACH
2_PBI_FORECAST_DECEMBER2005 2-9
TABLE 2-4 Market Share Analysis Results
Enplanement Projections
PBI/US Market Share Ratio
PBI/FAA Southern Region Market Ratio PBI/Florida Market Ratio
PBI/FLL Market Ratio
Year Historic
Emplanements1 Constant
Ratio2 Declining
Ratio3 Constant
Ratio4 Increasing
Ratio5 Constant
Ratio6 Increasing
Ratio7 Increasing
Ratio8
1996 2,852,014
1997 2,917,014
1998 2,965,253
1999 2,879,246
2000 2,932,635
2001 2,978,763
2002 2,748,181
2003 3,011,973
2004 3,280,291
2005 3,316,110 3,436,798 3,455,106 3,513,299 3,527,170 3,586,742 3,682,576
2010 3,854,216 4,023,592 4,066,403 4,189,342 4,138,729 4,260,395 4,726,860
2015 4,454,354 4,584,872 4,706,373 4,911,681 4,814,702 5,016,459 6,151,573
2020 5,093,422 5,168,074 5,414,999 5,723,728 5,585,580 5,889,502 7,943,644
2025 5,690,632 5,759,917 6,188,460 6,624,195 6,463,910 6,888,688 10,196,084
Average Annual Growth Rate (2004-2025):
2.7% 2.7% 3.1% 3.4% 3.3% 3.6% 5.7%
Sources: Airport Management Records; FAA Aerospace Forecasts FY 2005-2016; Ricondo & Associates, Inc. Prepared by: Ricondo & Associates, Inc. Notes: 1 FAA Terminal Area Forecasts. 2 Based on the constant PBI/US market share ratio of 0.4504% (Average market share ratio for the last 10 years 1995-2004). 3 Based on a decreasing PBI/US market share ratio of 0.4504% (Average market share ratio for the last 10 years 1995-2004). 4 Based on the constant PBI/FAA Southern region market share ratio of 2.0377% (Average market share ratio for the last 10 years 1995-2004). 5 Based on a decreasing PBI/FAA Southern region market share ratio of 2.1812% (Average market share ratio for the last 15 years 1990-2004). 6 Based on the constant PBI/Florida market share ratio of 5.3226% (Average market share ratio for the last 10 years 1995-2004). 7 Based on an increasing PBI/Florida market share ratio of 5.6787% (Average market share ratio for the last 15 years 1990-2004). 8 Based on an increasing PBI/FLL market share ratio.

SECTION 3 Passenger Enplanements Activity Forecast

2_PBI_FORECAST_DECEMBER2005 3-1
SECTION 3
Passenger Enplanements Activity Forecast
As noted in Section 1 of this report, passenger activity at PBI grew by approximately 2 million enplaned passengers over the past 25 years, however most of this growth occurred between 1979 and 1990 with airport enplanements increasing by approximately 1.65 million. Since 1990, the PBI market did not display the growth trend that was typified by other similar airport markets nationally or in the State of Florida. For example it was not until 1997, when PBI recorded 2,917,014 enplaned passengers, that the airport was able to exceed the 1990 enplanement level of 2,856,757. Between 1997 and the end of 2002, passenger levels fluctuated both above and below the 1997 figure, with year end 2002 enplanements totaling 2,748,181, somewhat below the level achieved in 1997.
Historically, through the 1980s and the first half of the 1990s, PBI and FLL both were experiencing increases in passenger levels. However, when the split of passenger enplanements between the two airports is reviewed, it is clear that their relative share of the pool of potential passengers was remaining relatively constant over the entire time frame. Essentially, both airports were serving their market areas, but neither airport was effectively stealing market from the other. This situation changed in the mid 1990s as FLL began to capture an increasing percentage of two-airport passenger pool. This change in market capture by FLL equates closely with the initiation of air service at FLL by Southwest Airlines, which provided a low-fare service option to travelers in Southeast Florida. As is typical of markets that experienced the introduction of low-fare service during this time, other airlines serving the airport were forced to adjust their airfares to compete with Southwest. These reductions in airfares at FLL resulted in the stimulation of passenger activity and an increased ability to capture an increased percentage of the overall market share. This led to a period of relatively flat year-to-year enplaned passenger levels at PBI.
Per the discussion contained in Section 1, the period 2000 through 2005 has been one of significant change for the commercial airline industry and the nature of the industry and the business models that guide the airlines are being rewritten. The trends that were contributing to the pattern of activity in the mid to late 1990s are, in a number of cases, no longer valid as airlines reinvent themselves to respond to the financial crisis they have faced over the past 5 years and to respond to the new realities of pricing their product. “Although passenger traffic nationally is back to 2000 levels, average fares per passenger-mile are down more than 21 percent from 2000, partly due to the drop in premium-fare business travel and increasing competition from low cost carriers. The [national] average fare for a 1,000-mile trip in May 2000 was $147; in May 2004, the average fare was $116.”6 The most recent update to the Department of Transportation Airline Industry Metrics noted that, “In
6 Office of the Inspector General Report Number CC-2004-006, “Airline Industry Metrics, Trends on Demand and Capacity,
Aviation System Performance, Airline Finances, and Service to Small Airports, August 10, 2004.

SECTION 3 – PASSENGER ENPLANEMENTS ACTIVITY FORECAST
2_PBI_FORECAST_DECEMBER2005 3-2
the third quarter of 2004, long haul fares averaged $153 and short-haul fares averaged $110 respectively, down 13.6 percent and 6 percent respectively, from the same period in 2000.”7
What the trend toward equalization of airfares has done, however, is to level the playing field in a considerable fashion between PBI and FLL, thereby removing much of the driving force behind the continued ability for FLL to erode the PBI market share. Other factors that may also contribute to an increased ability of PBI to regain its former market include the airfield capacity needs and increasing delay levels at FLL, along with traffic congestion on major roadways in the area and the increasing cost of automobile fuel, which render a commute to FLL a more significant consideration than in the past. It is believed that the combined influence of these factors is being seen in the enplaned passenger levels recorded in 2003 (3,011,973) and 2004 (3,280,291), both of which set all-time enplaned passenger records at PBI. This belief is further supported by the enplaned passenger levels.
Because of the inherently low enplanement values generated by the regression-based projections, a forecast approach involving the review of historic market capture was undertaken. Looking at the performance of PBI in relation to three defined markets, two market capture scenarios were applied in each of the three. The performance of PBI in relation to the total U.S. domestic market resulted in the lowest projection of the market share approaches. US domestic passenger growth is significantly driven by the operation of the major airline hub airports and the counting of connecting traffic enplanements in these hubs, which act to drive up total enplaned passenger counts. As a result, there is a tendency for a smaller origin and destination airport such as PBI to be significantly overshadowed by the immensity of the larger markets that are represented. These markets include such facilities as Chicago O’Hare (ORD), Hartsfield-Jackson Atlanta International Airport (ATL), and Dallas-Fort Worth International (DFW), to name just a few of the massive domestic hubs that significantly contribute to enplaned passenger growth on a national level. Thus, the size of the overall market becomes too large to be able to discern shifts in market share in a much smaller market such as PBI.
Given the historic performance of the PBI market from 1979 to 1990, a period before FLL low-cost service began to affect PBI traffic, it is clear that there was considerable potential for the market to grow. Over this 12-year period, enplanements increased by more than 1.6 million passengers. With the performance of the PBI marketplace over the past 2 and one-half years and the assumption that the playing field between PBI and FLL is being leveled as airfares equalize, it was believed that the 5.7 and 5.8 million enplaned passenger levels projected in these two analyses do not adequately represent the market potential, but they could be used as a basis for a low-growth estimate for PBI.
The second set of market-share projections were developed for a smaller data set consisting of enplaned passengers within the FAA’s Southern Region. While reflecting a smaller data set, the southern region remains a significant area encompassing an eight state region, which is home to the world’s busiest airport (ATL) operating as a hub for both Delta and Air Tran Airways along with four other of the nation’s major commercial airline hubs serving Northwest Airlines, American Airlines, Delta Airlines, and US Airways. While the projected passenger levels were higher, and, in one scenario, considerably higher, under the
7 Office of the Inspector General Report Number CC-2005-057, “Aviation Industry Performance, Trends in Demand Capacity,
Aviation System Performance, Airline Finances, and Service to Small Airports, June 30, 2005.
SECTION 3 – PASSENGER ENPLANEMENTS ACTIVITY FORECAST
2_PBI_FORECAST_DECEMBER2005 3-3
regional scenarios than for the nation as a whole, it was determined that the influence of the major hubs and the overall size of the sample required a further refinement to a more distinct market that would not be as influenced by the activity of multiple commercial airline hubs to gain a more accurate indication of the level to which PBI has captured passenger enplanement market share. The second regional market-share projection consisted of an increasing capture scenario that would have PBI increase its capture of regional market share returning to a level similar to that of the mid-1990s. This approach was interesting and appeared to have a basis in that it is apparent from historic data that PBI is certainly capable of the performance that was identified in the scenario. This second scenario resulted in a project passenger level of 6.6 million enplanements in 2025. Because of the concern over the influence of the hub airports, it was determined that a final market scenario would be developed based on PBI’s capture rate within the State of Florida.
The final market-share analysis considered the performance of PBI within the context of overall enplaned passengers within the State of Florida. Florida, while a smaller data set than those used in the two previous analyses, remains a highly dynamic and growing market. The State of Florida is home to a number of major airports including Orlando International, Miami International, and Tampa International Airport, along with a number of slightly smaller, but very active, airports that include Fort Lauderdale-Hollywood International, Southwest Florida International, Jacksonville International, and Palm Beach International Airport. Two market-capture scenarios were employed. The first approach assumed that PBI would maintain a constant capture rate estimated at 5.32 percent, which was the average of the PBI market capture over the period 1995 to 2004. This scenario resulted in an average annual growth rate of 3.28 percent in passenger enplanements and a projection of 6.5 million enplaned passengers in 2025. The most recent FAA Aerospace Forecasts project U.S. domestic enplanement growth to average 2.7 percent annually. While the growth rate shown for the constant ratio scenario is higher than that in the Aerospace Forecasts, this can be attributed to PBI regaining market share that had previously been captured by FLL. The basis for this assumption has been discussed previously.
The final market-share projection involved an increasing market-capture scenario, with PBI increasing its share of overall State of Florida passenger activity. This scenario resulted in an average annual growth rate of 3.6 percent, or almost one percent per year above the growth forecast domestically by the FAA. Under this scenario, future enplaned passengers would reach 6.9 million by 2025. Under this scenario the PBI market share would increase from an estimated 5.41 percent in 2005 to 5.68 percent in 2025. Both the constant market capture scenario and the increasing market capture scenario can be supported by the historic performance of the PBI market. However, after discussions with the FAA it was decided to opt for the slightly more conservative annual average growth rate typical of the constant market share as the basis for the baseline forecast at PBI. The enplaned passenger levels projected under this scenario are approximately 25 percent above the projections contained in the FAA TAF, but were considered to be reasonable given the changes that are occurring in the industry and in the local area. Thus, for purposes of defining a baseline forecast of total passenger activity at PBI, the constant market share of State of Florida enplanements scenario was selected, which results in a projection of future passenger enplanements reaching 6.5 million by 2025.

SECTION 3 – PASSENGER ENPLANEMENTS ACTIVITY FORECAST
2_PBI_FORECAST_DECEMBER2005 3-4
With the identification of the selected baseline passenger forecast, consideration was then given to the distribution of this activity to the three segments of commercial passenger activity at PBI consisting of mainline commercial passenger activity, regional commuter passenger activity, and international passenger activity. Historic data were reviewed relative to past levels and percentages of passengers within each of the three categories.
International passenger activity has been relatively limited at PBI over the past 25 years, reaching a high of 92,012 passengers and 3.22 percent of total passenger activity in 1990. Since that time, international passenger levels have averaged approximately 2.1 percent of total enplaned passengers. For planning purposes, the level of future international passengers was estimated to increase from a 2004 level of two to three percent of total passengers by 2025.
A similar process was employed to arrive at a projection of the percentage of total enplanements that would be associated with regional/commuter traffic at PBI. Regional/commuter passenger levels historically have not accounted for a high percentage of total passengers at PBI, unlike what has been typical of many similarly sized markets. By year-end 2004, regional commuter passengers accounted for just 1.7 percent of all passenger enplanements. This trend, however, was anticipated to change given the actions of a number of the Legacy carriers as they reduce domestic capacity and begin to re-orient their fleet mixes in domestic markets. Based on these considerations, it was projected that regional commuter passengers levels would grow as a percentage of total passengers over the planning period. Specifically, regional commuter passenger levels would increase from the current 1.7 percent level to an estimated 5 percent of total enplanements by 2025. Table 3-1 summarizes the projected passenger levels based on the historic distribution of activity by carrier category, in conjunction with the selected market share projection of future passenger levels.
TABLE 3-1 Projected Enplaned Passengers by Carrier Category
Fiscal Year 2005 2010 2015 2020 2025
Domestic Mainline 3,396,665 3,956,625 4,554,708 5,222,517 5,946,797
International (US Flat & Foreign Flag Carriers)
70,543 91,052 120,368 150,811 193,917
Regional/Commuter 59,962 91,052 139,626 212,252 323,196
Total 3,527,170 4,138,729 4,814,702 5,585,580 6,463,910
Prepared by: Ricondo & Associates, Inc. Source: Ricondo and Associates, Inc.

SECTION 4 Commercial Airlines Operations Forecast

2_PBI_FORECAST_DECEMBER2005 4-1
SECTION 4
Commercial Airlines Operations Forecast
Commercial passenger operations projections for this analysis are composed of operations conducted by scheduled domestic service and international service provided by both foreign flag carriers and U.S. Flag carriers flying international routes to and from PBI. For planning purposes, a further division within the domestic category was made to specifically project operations by regional/commuter carriers. It should be noted that regional operations at PBI have historically included flight activity in both the domestic markets and international markets, with service by commuter carriers to and from the Bahamas. The FAA defines an operation as either a single aircraft landing or a single aircraft takeoff. The following sections address the current and projected level of commercial operations expected to occur at PBI through the year 2025.
4.1 Classification of Commercial Airlines Operations For this study, commercial passenger service covers several different segments of aviation including air carrier activity by domestic mainline and low-cost/low-fare carriers, regional/commuter airline activity, and operations by U.S. flag carriers and foreign flag carriers to international markets. Each of these categories of activity was projected separately to make it easier to develop assessments of facility requirements for the unique aspects of each service component later in this study. Traditionally, the FAA has categorized all operations conducted by scheduled and nonscheduled passenger carriers using aircraft with more than 60 seats as Air Carrier. The FAA, recognizing the fact that regional aircraft are increasing in size, have adjusted their definition of regional aircraft upward in the last year to place the threshold at 70 seats. For this analysis, a 70-seat threshold was used and historic landing activity reports for PBI were reviewed to ensure consistency in the historic data that were used as a basis for defining historic regional/commuter operational activity at PBI. The FAA, following this same definition, has routinely classified scheduled and nonscheduled passenger service using aircraft having 70 seats or less, as Air Taxi/Commuter operations.
As a result of the method in which the Air Traffic Control Tower counts operations, air taxi and commuter operations also include a number of general aviation flights that are conducted on a commercial or “for-hire” basis by fractional jets, jet charters and others. Typically, these are non-scheduled flights carrying a small number of passengers to destination cities without scheduled airline service, or flights that use general aviation aircraft to bypass congested facilities. This class of service has become more popular in recent years as delays have plagued many commercial airlines at the primary hubs and businesses have begun to make greater use of charter services and fractional ownership of corporate aircraft. It should be noted that PBI is ranked in the top five airports in the nation for fractional ownership operations. The events of September 11, 2001, have also contributed to an increase in the potential use of these small charter operators. Thus, it was necessary to remove these general aviation types of operation from those conducted by
SECTION 4 – COMMERCIAL AIRLINES OPERATIONS FORECAST
2_PBI_FORECAST_DECEMBER2005 4-2
regional airlines in order to obtain an accurate depiction of regional/commuter operations. This was achieved using monthly landing reports covering all passenger and cargo operations from 2000 through July 2005.
4.2 Domestic-Mainline Air Carrier Operations and Fleet Mix Forecast
The projection of domestic air carrier passenger enplanements provides a starting point for determining future domestic air carrier aircraft operations. Projected passenger enplanements are considered in conjunction with other factors that influence the forecast level of airline operations, which include the aircraft type (fleet mix) and number of seats available on a per-departure basis. These data are then coupled with the average boarding load factor to determine the number of departures required to meet the anticipated enplanements. Fleet mix data and the historic load factors for PBI were derived from the DOA’s monthly activity statistics and landing reports as well as from FAA sources, along with information provided through the Official Airline Guide (OAG). Load factors were calculated for the airport based on enplanements versus total available seats per fleet as reported by the airlines on a monthly basis to the DOA. Information from the OAG and JP Fleets was used to determine the seats by aircraft type for the specific airlines serving PBI.
Boarding load factors for the domestic air carrier segment of activity at PBI follows a trend similar to that of most other major US airports. Through the early 1990s, load factors on domestic air carriers ranged consistently in the 55 to 60 percent range. During the 1990-1991 Persian Gulf War, the airlines faced a period of substantial financial losses, which resulted in several airline failures and bankruptcies. This led to the first major shakeup in operating philosophies by the airlines since deregulation. As a result of these changes, the industry began to experience rising load factors, a trend that also occurred at PBI. Prior to 1994, no one in the industry had ever forecast, or thought possible, that load factors industry-wide could average over 70 percent, but this was the case throughout the rest of the decade and through 2001.
With the attacks of September 11, 2001, and the massive impact that these events had on the airline industry, it could be anticipated that there would be a significant decrease in the load factors nationally and in the PBI market. While the overall load factor at PBI did drop in fiscal year 2001, the extent of the decrease was significantly moderated by the actions of the airlines to cut seat capacity in their attempt to balance available seats with demand. Discounting airfares, in conjunction with capacity adjustments, acted to minimize the decrease in load factors. These actions have resulted in the return to pre-9/11 load factor levels, which, by year-end 2004, was at 76 percent for domestic mainline activity.
For forecasting purposes it is necessary to project the future trend in average load factors for the domestic air carriers. While certain markets and certain airlines experience load factors in the 80 percentile range and, in some limited cases, there have been instances of an individual airline displaying load factors in the 90 percentile range, these levels are not considered sustainable for an entire market served by an array of carriers. For example, one factor that tends to moderate load factors in a number of markets is service by Southwest Airlines. When their system-wide load factors are compared against the Legacy carriers,

SECTION 4 – COMMERCIAL AIRLINES OPERATIONS FORECAST
2_PBI_FORECAST_DECEMBER2005 4-3
Southwest Airlines routinely displays a lower load factor. This results, in part, to the high frequency of service they provide to their various point-to-point markets. For example, system-wide data for the period from January through May 2005 showed the load factor for Southwest Airlines to be 67.6 percent, while American Airlines’ load factor was 77.6 percent, Delta’s was 75.6 percent, Continental’s was 79.1 percent, US Airways’ was 73.2 percent, and United Airline’s was 79.5 percent. Thus, it is anticipated that the PBI market’s growth in load factors will be moderated to some degree by the conditions that are typical of a high-frequency, point-to-point dominant carriers in the market.
Future load factors at PBI are projected to increase over the planning period, although, given the already high load factor level, the extent of this increase is not widespread. Given the continuing efforts of the airlines to increase their load factors to achieve, at a minimum, a break-even level between load factors and costs, it is anticipated that through the use of their yield management systems, load factors at PBI will increase from the current 76 percent level in 2004 to 77.25 percent in 2010, and finally 78.5 percent by 2025.
The airline fleet mix for PBI was derived from DOA landing reports for the year 2000 through July 2005. Using these data and comparing the fleet mix for 2004 to historic information for both pre- and post-September 11, 2001 conditions, it was determined that 2004 provided a reasonable base year to use as the foundation for projecting future fleet mix. Consideration was also given to fleet mix over the first 7 months of 2005 as fleet mix projections were being developed. The future fleet considered stated orders for new aircraft by the various airlines serving the airport, local trends observed at PBI, industry trends as analyzed by the FAA, industry publications, statements of specific airlines regarding orders, aircraft retirements and planned acquisitions, and projected trends defined by both Boeing and Airbus. This information provided a baseline by which the future airline fleet through 2025 was defined. Fundamental to this future fleet-mix projection was the belief that PBI will remain predominately a narrow-body aircraft market because of the preponderance of domestic service in the market. The fleet mix was expressed in terms of percentages of operations by aircraft in specified seat ranges. While growth in enplanements has been forecast, the projected increase in boarding load factors will act to moderate the extent of growth in passenger aircraft operations to some degree.
These percentages were then used in conjunction with the projected level of total passengers and load factor projections to arrive at a future forecast of mainline air carrier operations. Total passengers within the domestic air carrier category were then used in conjunction with load factors and seating ranges by fleet mix category to define seats per departure, which was subsequently employed to calculate the level of operations for domestic air carriers over the planning period for PBI. The result is a yearly forecast of departures, which is then doubled to arrive at projected domestic air carrier operations. The level of projected domestic air carrier operations is presented in Table 4-1, while the growth rates by time period are shown later in Table 4-4.

SECTION 4 – COMMERCIAL AIRLINES OPERATIONS FORECAST
2_PBI_FORECAST_DECEMBER2005 4-4
TABLE 4-1 Projection of Domestic Mainline Carrier Operations1
Forecast
Fleet Mix Seating Range 2005 2010 2015 220 2025
220 and above 3.50% 3.60% 3.750% 4.00% 4.50%
190-219 12.50% 13.00% 13.25% 13.50% 13.75%
170-189 8.00% 7.50% 7.00% 6.00% 6.00%
150-169 13.00% 15.50% 18.80% 20.50% 21.00%
140-149 23.50% 19.50% 17.50% 16.50% 15.50%
130-139 15.00% 16.00% 16.30% 16.50% 16.70%
120-129 15.50% 15.50% 15.50% 15,50% 15.50%
110-119 6.00% 5.40% 3.00% 2.00% 1.50%
100-109 3.00% 3.20% 3.50% 4.00% 4.00%
90-99 0.00% 0.30% 0.40% 0.50% 0.50%
71-89 0.00% 0.50% 1.00% 1.00% 1.00%
Average Seats per Departure 152 152 153 153 154
Boarding Load Factor 76.50% 77.25% 77.75% 78.25% 78.50%
Enplanements per Departure 112.07 117.76 119.11 120.08 120.34
Enplanements 3,396,665 3,956,625 4,554,708 5,222,517 5,946,797
Annual Departures 30,308 33,598 38,241 43,491 49,417
Annual Operations 60,616 67,196 76,482 86,982 98,834
Source: Ricondo and Associates. Prepared by: Ricondo & Associates, Inc. Note: 1 Totals may vary slightly because of rounding and impact of decimal calculations.
The level of air carrier operations increases over the planning period, although it is moderated by an increase in load factors. The projected fleet contained in Table 4-1 departs from the fleet that would be typical of the TAF projections. While FAA does not specifically define a projected fleet mix, it does employ an aggregate of seats per departure value in their estimates. By comparing seats per departure against those that are generated from Table 4-1, it is possible to determine that the fleet that would be typical of the mix of aircraft seating sizes presented in Table 4-1 consists of generally smaller aircraft than that in the FAA projections.
It is believed that growth in domestic seat departures will be moderated considerably by fleet commonality typical of the low-cost/low-fare airlines, as well as by the actions of the Legacy carriers to reduce the variety of aircraft in their fleets and to move some aircraft types out of domestic service and onto international routes. A review of new aircraft orders by the carriers confirms the continuation of commonality in their fleets and that the majority of new aircraft that they have on order consist of narrow-body transports with seating ranges in the 100-seat to 145-seat range. As discussed earlier, the Legacy carriers are anticipated to reduce the number of aircraft in their fleets. It is also anticipated that, for

SECTION 4 – COMMERCIAL AIRLINES OPERATIONS FORECAST
2_PBI_FORECAST_DECEMBER2005 4-5
domestic service, these carriers will focus on narrow-body transports such as the B737-300, 500, 700 and 800, A319, A320 and continued use of the MD-80 series. Finally, it is anticipated that much of the impact of the conversion of aircraft from two-class to single-class seating, such as occurred with the launch of TED and Song that materialized at PBI, has been absorbed. It was, in part, the introduction of service by these carriers that contributed to the growth in seats per departure between 2001 and 2002. For these reasons, it has been assumed that there would be very little growth in the level of seats per departure, and the growth that would actually occur would not take place until late in the planning period.
4.3 U.S. and Foreign Flag International Operations Forecast International activity at PBI has historically included operations to Canada operated by Air Canada and, more recently, CanJet Flights to the Bahamas were historically operated by a number of carriers, including Air Midwest, Lake Airways Limited, Henson Airlines, and Gulfstream International Airlines. As of 2004, service to Canada was still being provided by Air Canada and CanJet, and service to the Bahamas was being provide by Gulfstream International Airlines operating as Continental Express (using Beechcraft 1900 aircraft) and by Bahamas Air (flying almost exclusively 37-seat Bombardier Dash 8 aircraft). Gulfstream Airlines serves three destinations (Freeport, Marsh Harbor, and Nassau) in the Bahamas, while Bahamas Air serves Freeport and Nassau with connecting service to North Eleuthera. Overall, the majority of PBI’s international service over the past three years (2002-2004) has been to the Bahamas by Gulfstream and Bahamas Air. Over this period, service to the Bahamas accounted for 65 percent of all international enplaned passengers (2004) to a high of 70.2 percent (2003), with 2002 levels reaching 67.2 percent.
Based on historic PBI records, international enplaned passengers reached an all-time high of 92,012 enplaned passengers in 1990, then dropped sharply, likely as a result of the Persian Gulf War, to 67,138 in 1991. Passenger levels continued to decline through year-end 1993. Between 1993 and 2000, enplaned international passenger remained relatively static, ranging from 50,000 to 61,000 annually, displaying no discernible trend. International activity peaked again in 2001, reaching 73,357, dropped by more than 20,000 passengers in 2002, then finally rose again to 66,751 enplaned passengers by year-end 2004.
Historic airport activity statistics and information from the TAF confirmed that the load factors on international flights at PBI were somewhat lower than on the domestic mainline flights. It is believed that this is a result, in large measure, to the preponderance of turbo-prop aircraft in the Bahamian market and, in particular, the high percentage of small 19-seat turbo-prop aircraft that have typified the majority of international service to the Bahamas. Essentially, the load factors on these Caribbean flights are showing a closer relationship to what would typically be found in the regional commuter market than what would be typified by international activity. The high percentage of this activity can be seen in the seating range mix in the 0-89 seat range grouping for 2005. While it is anticipated that service by this class of aircraft will continue into the future, it is anticipated that the overall percentage of these types of aircraft will decrease over the planning period, being replaced by various business jet aircraft. The preference for business jets over turbo-props on the part of the traveling public will lead to an increase in the load factors in the Bahamian

SECTION 4 – COMMERCIAL AIRLINES OPERATIONS FORECAST
2_PBI_FORECAST_DECEMBER2005 4-6
market, as well as lead to the potential for other service to the Caribbean from PBI. Overall, load factors for international service from PBI are projected to increase over the planning period, but remain slightly less than domestic mainline levels given the use of regional aircraft to serve a significant component of the anticipated market.
The current fleet serving international destinations from PBI is a relatively limited mix of four aircraft. Historically, these have ranged from 19-seat turbo prop Beechcraft 1900s, to service by Air Canada operating a mix of Airbus A319 and A320 aircraft. By far, the dominant fleet component serving international destinations is currently composed of the Beechcraft 1900 and the Bombardier Dash 8 turbo-prop transports flying to destinations in the Bahamas. In developing fleet mix percentages, historic information was reviewed and potential opportunities for service were considered. Over the forecast period it is anticipated that the percentage of smaller aircraft will reduce significantly and be replaced by new aircraft variants in the 90- to 130-seat configuration. This fleet transition will likely coincide with the addition of new markets and the upgrade of some of the existing fleets serving international destinations with new aircraft types that will include larger regional jets. It has also been assumed that as overall demand in the PBI market increases, additional interest will arise for the use of larger aircraft. The potential may even exist for the initiation of a limited level of wide-body service to Canadian markets or to other longer-haul markets outside of the international destinations that are currently served. Table 4-2 summarizes the results of this analysis.
TABLE 4-2 Projection of U.S. and Foreign Flag International Carrier Operations1
Forecast
Fleet Mix Seating Range 2005 2010 2015 2020 2025
200 and above 0.00% 2.00% 2.50% 3.00% 3.50%
170-199 0.00% 1.50% 2.00% 3.00% 4.00%
130-169 29.00% 30.00% 31.00% 31.50% 32.00%
110-129 16.80% 18.50% 19.30% 20.50% 21.00%
90-109 0.00% 13.50% 27.50% 34.00% 35.00%
0-89 61.00% 40.00% 21.00% 11.00% 5.00%
Average Seats per Departure 87 103 115 122 128
Boarding Load Factor 70.00% 71.00% 71.50% 72.00% 72.50%
Enplanements per Departure 58.44 73.20 82.23 88.09 92.79
Enplanements 70,543 91,052 120,368 150,811 193,917
Annual Departures 1,207 1,244 1,464 1,712 2,090
Annual Operations 2,414 2,488 2,928 3,424 4,180
Source: Ricondo and Associates. Prepared by: Ricondo & Associates, Inc. Note: 1 Totals may vary slightly because of rounding and impact of decimal calculations.

SECTION 4 – COMMERCIAL AIRLINES OPERATIONS FORECAST
2_PBI_FORECAST_DECEMBER2005 4-7
4.4 Regional/Commuter Market Trends With the deregulation of the airline industry in 1978, for the first time airlines were allowed to make market- and service-related decisions with minimum governmental oversight. Commencing in the early 1980s an array of new airlines initiated operations in the United States. Some of these started service using larger commercial aircraft such as versions of the Boeing 737 or Douglas DC-9, while a number of others began service using a mix of small twin-engine models such as the Bandarante 110, Swearingen Metroliner and twin-engine Beechcraft and Cessnas. In some cases, these startup carriers employed older and larger twin-engine models, such as the Martin 404, Fokker F-27, Convair 240, 580, and even an occasional DC-3. A classic example of one such airline was Provincetown Boston Airways, which operated in south Florida through October of 1986 using a mix of aircraft, including a number of those noted above.
As the 1980s came to a close, regional/commuter service saw the introduction and conversion to a fleet of aircraft specifically designed for regional service, including a number of models that remain in service today. These included aircraft types such as the Saab 340, Embraer EMB-120, BAE-ATP, Jetstream J31, Jetstream J41, Dornier DO 228, DO328 and the DeHaviland Dash 8, several of which have served and, in some instances, continue to serve PBI. Some of these aircraft offered a number of the conveniences found on larger aircraft types, including galley service and bathroom facilities. With these aircraft came greater acceptance of the service provided by regional airlines, though most passengers continued to show a distinct preference for jet aircraft.
By the end of the 1980s, the nation had entered an economic recession and the airlines had begun to lose millions of dollars. Additionally, the failures and bankruptcies of the Legacy carriers in the early 1990s led those major airlines to re-think their allocation of aircraft to the markets they served. This resulted in the decision to transfer a number of markets and routes to regional/commuter airline partners. This adjustment in the airline business model is similar to, although not as extensive as, the adjustments that are currently under way.
At approximately the same time, the marketplace was seeing the beginning of an entirely new trend in regional service. With the introduction by Comair of regional jet aircraft in 1993, the ability to re-institute jet service into markets where such service had ceased became possible. The regional jets entered markets and quickly became highly favored over similarly sized turbo-prop aircraft. Since the introduction of regional jets by Comair in 1993, many of the other major regional airlines in the nation have undertaken fleet modernization, with regional jets that have seating capacities from 37 seats up to 70 seats forming the backbone of these fleets. While not as prevalent at PBI as at many other major airports, regional jets have begun to enter service in increasing numbers, with such models as the Embraer ERJ 135 and 145, Bombardier CRJ 100/200 and CRJ 700 being used.
During the course of this planning period, the most significant changes in PBI’s regional/commuter fleet mix are anticipated to include the expanded introduction of a variety of models of regional jet aircraft to replace significant portions of the service currently being provided by propeller or turbo-prop aircraft. It is anticipated in our projections that the service currently being provided by the 19-seat fleet of small turbo-prop aircraft will begin to transition out of service and will be replaced by smaller regional jet

SECTION 4 – COMMERCIAL AIRLINES OPERATIONS FORECAST
2_PBI_FORECAST_DECEMBER2005 4-8
derivatives and/or by some of the slightly larger turbo-props that will remain in the fleet. Currently, several of the commuter carriers serving PBI, as well as others that do not currently serve the market, have orders for larger variants of regional jets. These aircraft include versions up to 70 seats as well as a number of “regional” aircraft that will operate with between 84 and 110 seats. These are addressed in the forecasts under the mainline air carrier category in Section 4.2. With the relaxation of scope clauses in pilots’ contracts that previously presented a significant limitation to regional jet usage, and the potential for network carriers to shift an even greater share of their flight activity over to regional carriers, it is anticipated that additional growth in regional airline service and regional jet usage will occur. Furthermore, given rising fuel costs and concerns about the profitability of 50-seat regional jets, there will be an increasing move to shift traffic to larger versions of these aircraft. The regional jet aircraft fleet mix along with known orders for regional jet aircraft that currently exist, according to the 2005/2006 JP Fleets Directory, for the airlines currently serving PBI is discussed below:
US Airways Express − Canadair RJ 200ER (50 seats) − Canadair RJ 700 (70 seats) − Embraer EMB 170 (70 seats) − Embraer EMB 190 (90 seats)
Comair − Canadair RJ 100ER (50 seats) − Canadair RJ 700 (70 seats)
NW Airlink − Avro RJ85A (69 seats) − Canadair RJ 200ER (50-seats)
American Eagle − Embraer ERJ 135 (37 seats) − Embraer ERJ 140 (44 seats) − Embraer ERJ 145 (50 seats) − Canadair RJ 700 (70 seats)
Atlantic Southeast Airlines − Canadair RJ 200 (50 Seats) − Canadair RJ 700 (70 Seats)
Republic Airlines − Embraer EMB 170 (70 seats)
Jet Blue − Embraer EMB 190 (100 seats)
Mesa Airlines − Canadair RJ 200 (50 seats) − Embraer EMB 145 (50 seats) − Canadair RJ 700 (64 seats) − Canadair RJ 900 (80 seats)
Continental Express − Embraer ERJ 135 (37 seats) − Embraer ERJ 145 (50 seats)

SECTION 4 – COMMERCIAL AIRLINES OPERATIONS FORECAST
2_PBI_FORECAST_DECEMBER2005 4-9
Chautauqua − Embraer ERJ 135 (37 seats) − Embraer ERJ 140 (44 seats) − Embraer ERJ 145 (50 seats)
As indicated by this list, several of the existing carriers are increasing the size of the regional jet fleet to include new variants of the Bombardier CRJ 700, a 64- to 70-seat regional jet, while others are adding versions of the Embraer EMB 170, which is another 70-seat regional jet gaining considerable popularity. An additional and larger variant of the CRJ, the CRJ-900, is also under development. This aircraft will seat 80 to 86 passengers, depending on configuration, thereby moving into the seating ranges of former mainline air carrier aircraft such as the older DC 9-10 series. Other manufacturers are currently developing and launching larger versions of their regional jet aircraft fleets, most notably, Embraer, which has launched the EMB 170/175 and has delivered to Jet Blue the first of more than 100 EMB 190s, which have a 100-seat configuration.
In September 2005, US Airways overcame scope restriction and gained approval from their pilots to add the EMB 190 to the fleet of regional aircraft operated by their regional airline partners. The seating configurations on the fleet of EMB 170/175/190 and195 aircraft range from 70 seats to 110 seats, depending on the model. For purposes of this analysis and to remain consistent with recent changes in the classification of regional aircraft by the FAA, this analysis employs a threshold of 70 seats as the upper limit considered as a regional/commuter aircraft.
To define a future fleet mix for commuter aircraft at PBI, the current fleet mix was reviewed and consideration was given to a fleet of existing aircraft, actions by mainline partners, stated orders for new aircraft, and the potential for deployment of future aircraft models as derived from industry trends and FAA information. PBI has, in the past, been served by a mix of aircraft including small turbo-prop aircraft such as the service by Gulfstream and Air Midwest using the 19-seat Beechcraft 1900. Additionally, the Airport has seen increasing activity by several regional jet models, including the Embraer EMB-135, EMB-140, EMB-145 Canadair CRJ-200 and, occasionally, CRJ-700s. It is anticipated that, over time, the use of the very small turbo-prop aircraft will decrease because of their diminishing acceptability to many travelers, and the fact that even on short-haul intrastate markets the use of RJs will begin to predominate. This trend is clearly evident with the operation of significant intrastate regional jet-service such as occurs at Miami and Orlando International Airports.
Over the course of the planning period it is anticipated that the most discernible trend will consist of a change to emerging variants of existing regional aircraft models. It is anticipated that greater numbers of aircraft such as the CRJ-700 and EMB-170 will begin to operate at PBI as the airlines adjust domestic capacity and offer added point-to-point regional service that, to varying degrees, acts to provide a bypass capability around their more congested hub locations. It is projected that the CRJ-700 and the EMB 170, both of which are currently operating in the regional airline fleet in the U.S., will begin to be routinely seen toward the middle of the 20-year horizon. The larger variants of regional jet aircraft in excess of 70 seats are also anticipated to begin entering the market. However, because of the FAA classification, the extent of this activity is addressed under the projection of air carrier operations.

SECTION 4 – COMMERCIAL AIRLINES OPERATIONS FORECAST
2_PBI_FORECAST_DECEMBER2005 4-10
A reduction in activity by the smaller turbo-prop aircraft is anticipated over the planning period. It should be noted, however, that the baseline forecast does not project the immediate demise of this segment, but rather a phased reduction in activity has been anticipated. While nationally a reduction in turbo-prop usage is occurring, the general consensus is that the turbo-prop commuter aircraft can still fill a niche for regional airlines and will continue to be used, particularly in short-haul market pairs. A review of aircraft orders indicated that Gulfstream Airlines, the operator of these aircraft, had no orders for any other fleet type. As a result, it is anticipated that the lower end of the commuter aircraft spectrum, consisting of aircraft such as the Beech 1900, will still be used to serve some markets, or will have a place in the fleet filling a niche role for new startup commuter airlines, and thus may be in the fleet for some time. Other larger turbo-prop aircraft types including the Dash 8 and the ATR will also continue to see use within the commuter airline arena.
The load factor on regional commuter airlines has historically lagged behind that of the mainline carriers. This is true of the regional carriers at PBI, as well, but the load factors for the regional carriers have actually been somewhat below national trends. Historic load factors were identified and used to define a projected load factor for 2005. Given the increasing sophistication of the aircraft fleet and yield management at the regional level, load factors are anticipated to increase sharply over the planning period. Based on the operational percentages by seating range shown, and applying these seating ranges along with projected load factors, which were based in part on the FAA’s projected growth in load factors for the period 2005 to 2020, projected regional/commuter airline operations were determined. This is the same methodology that was employed for the projection of domestic air carrier and international operations. The projected regional/commuter operational activity over the planning period is summarized in Table 4-3.
TABLE 4-3 Projection of Regional/Commuter Carrier Operations1
Forecast
Fleet Mix Seating Range 2005 2010 2015 2020 2025
70 Seats 6.00% 9.00% 13.50% 15.50% 18.00%
60 – 69 0.00% 2.00% 4.00% 5.50% 6.00%
50 – 59 28.00% 30.00% 30.50% 31.00% 31.00%
40 – 49 1.00% 6.00% 10.00% 13.00% 15.00%
20 – 39 15.00% 17.00% 22.00% 26.00% 27.00%
0 – 19 50.00% 35.00% 20.00% 9.00% 3.00%
Average Seats per Departure 34 39 44 47 49
Boarding Load Factor 55.00% 58.00% 60.00% 62.00% 64.00%
Enplanements per Departure 17.80 22.50 26.16 29.09 31.42
Enplanements 59,962 91,052 139,626 212,252 323,196
Annual Departures 3,368 4,046 5,337 7,296 10,285
Annual Operations 6,735 8,092 10,675 14,593 20,570

SECTION 4 – COMMERCIAL AIRLINES OPERATIONS FORECAST
2_PBI_FORECAST_DECEMBER2005 4-11
TABLE 4-3 Projection of Regional/Commuter Carrier Operations1
Forecast
Fleet Mix Seating Range 2005 2010 2015 2020 2025
70 Seats 6.00% 9.00% 13.50% 15.50% 18.00%
Source: Ricondo and Associates. Prepared by: Ricondo & Associates, Inc. Note: 1 Totals may vary slightly because of rounding and impact of decimal calculations.
4.5 Summary of Commercial Airline Projections The combined results of the domestic air carrier projections, along with those for US and foreign flag international enplanements and operations, and regional/commuter enplanements and operations, are summarized in Table 4-4.
TABLE 4-4 Projection of Commercial Airline Activities Summary
Forecast
2005 2010 2015 2020 2025
Operations
Domestic-Mainline Air Carriers 60,616 67,196 76,482 86,982 98,834
International Carrier 2,414 2,488 2,928 3,424 4,180
Regional/Commuter 6,735 8,092 10,675 14,593 20,570
Total Operations 69,765 77,776 90,085 104,999 123,584
Enplanements
Domestic Air Carrier 3,396,665 3,956,625 4,554,708 5,222,517 5,946,797
International Carrier 70,543 91,052 120,368 150,811 193,917
Regional/Commuter 59,962 91,052 139,626 212,252 323,196
Total Enplanements 3,527,170 4,138,729 4,814,702 5,585,580 6,463,910
Source: Ricondo and Associates. Prepared by: Ricondo & Associates, Inc.

SECTION 5 Cargo Volume and Operations Forecast

2_PBI_FORECAST_DECEMBER2005 5-1
SECTION 5
Cargo Volume and Operations Forecast
Air cargo in general is separated into two primary categories: (1) belly cargo consisting of cargo transported in the belly of the various domestic and international passenger airlines and; (2) all-cargo accommodated by one of a number of all-cargo airlines (i.e. Federal Express, United Parcel Services, DHL, etc.) that may operate at the Airport. This section of the forecast assesses the historic belly cargo and all-cargo volume and operations at PBI, and summarizes the activity projections anticipated at the Airport.
5.1 Cargo Volume Since the events of September 11th and, in part, as a result of the significant increase in security concerns, the volume of cargo handled as belly cargo in the U.S. has declined. Requirements such as the “known shipper” criteria have been employed as a security enhancement measure for passenger airlines carrying belly haul cargo, which has constrained the airlines’ ability to access the cargo market in an unconstrained fashion. At PBI the impact of these requirements has not been as evident as has been the case at other airports of similar size and service levels. Table 5-1 summarizes the historic level of enplaned belly cargo and all-cargo for the period of CY 2000 through CY 2004.
TABLE 5-1 Historic Enplaned Belly and All Cargo Volumes (in tons)
Enplaned Belly Cargo Tonnage
Year Enplaned Mail Enplaned Freight Total Enplaned
Belly Cargo Enplaned All-Cargo
Tonnage Total Enplaned Cargo
Tonnage
2000 3,753 2,102 5,855 2,997 8,852
2001 3,443 1,973 5,416 2,902 8,318
2002 3,390 2,001 5,391 2,977 8,368
2003 3,584 2,294 5,878 2,359 8,237
2004 3,416 2,136 5,552 1,875 7,427
Source: Airport Management Records, Cargo Reports – CY 2000 through CY 2004. Prepared by: Ricondo & Associates, Inc.
Overall, total enplaned cargo volumes decreased at PBI. As shown, total belly cargo volumes dropped in 2001 because of the combined effect of the events of 9/11 and the economic recession that began in late 2000 and continued through 2001. While there was a decrease in the tonnage of enplaned belly freight in 2001, the airport had recovered to 2000 levels by 2003. All-cargo volumes remained relatively steady from 2000 through 2002, but dropped rather sharply in both 2003 and 2004. United Parcel Service (UPS) is the only all-cargo carrier serving PBI. Others, such as FEDEX and DHL, serve the market with their trucking networks. Because UPS began operations at the Airport in 1994, their fleet serving

SECTION 5 – CARGO VOLUME AND OPERATIONS FORECAST
2_PBI_FORECAST_DECEMBER2005 5-2
PBI has been composed of two primary aircraft types, consisting of the DC8 and B757 aircraft. Over the last 5 years, and including the enplaned mail tonnage, the average share of belly cargo versus all-cargo volume was 68 and 32 percent, respectively.
Future growth in belly cargo will be influenced by several major considerations, including the future security requirements for cargo on passenger airlines and the impact that yield management will have as it relates to load factors on passenger airlines and the resultant remaining capacity on the aircraft for use in accommodating belly cargo. Furthermore, as concerns about aircraft delay rise (like they have over the last 2 years), cargo shippers will increasingly opt to use all-cargo carriers to ensure the uninterrupted and timely delivery of their goods. This trend emerged in the late 1990s as commercial passenger aircraft were impacted to a much higher degree than all cargo carriers by delays at major airports. Each of these considerations could contribute to a decrease of belly cargo as a percentage of total cargo. As noted above, however, UPS is currently the only air cargo carrier at PBI. The small share of all-cargo activity at the Airport may be explained by the fact that PBI is located within relatively easy trucking distance from either Miami, Fort Lauderdale, or Orlando International Airports and, in the case of both Orlando and Miami, at least one major competitor to UPS operates regional and Latin American hubs in these airports, respectively.
The methodology used for projecting future belly cargo activity at PBI was based on an average ratio of historic belly cargo tonnage per air carrier departure over the past 5 years. This ratio that held constant over the planning horizon, was then paired with the baseline projections of total air carrier operations (presented in section 4.0) to generate projections of future belly cargo tonnage. In order to segregate mail tonnage from freight tonnage, the average share of these components relative to total belly cargo tonnage for the period between 2000 and 2004 was held constant during the planning horizon. Specifically, the average distribution of mail tons and freight tons relative to total belly cargo tons between 2000 and 2004 are 62.6 and 37.4 percent, respectively. The period between 2000 and 2004 was chosen because it is most reflective of the current cargo operating characteristics in the wake of new security requirements and their influence at the Airport. It is assumed that these characteristics will remain over the planning horizon. Table 5-2 summarizes the belly cargo projections at PBI.
TABLE 5-2 Projected Belly Cargo Volume (in tons)
Total Enplaned Belly Cargo Tonnage2
Year Total Enplaned Belly
Cargo Tonnage1 Total Commercial
Operations Total Enplaned Belly Cargo
Tons Per Departure Enplaned Mail Enplaned
Freight
2000 5,855 71,392 0.1640 3,753 2,102
2001 5,416 71,149 0.1522 3,443 1,973
2002 5,391 60,038 0.1796 3,390 2,001
2003 5,878 66,193 0.1776 3,584 2,294
2004 5,552 69,642 0.1594 3,416 2,136
2005 5,811 69,765 0.1666 3,638 2,173

SECTION 5 – CARGO VOLUME AND OPERATIONS FORECAST
2_PBI_FORECAST_DECEMBER2005 5-3
TABLE 5-2 Projected Belly Cargo Volume (in tons)
Total Enplaned Belly Cargo Tonnage2
Year Total Enplaned Belly
Cargo Tonnage1 Total Commercial
Operations Total Enplaned Belly Cargo
Tons Per Departure Enplaned Mail Enplaned
Freight
2010 6,478 77,776 0.1666 4,055 2,423
2015 7,503 90,084 0.1666 4,697 2,806
2020 8,746 104,999 0.1666 5,475 3,271
2025 10,294 123,583 0.1666 6,444 3,850
Average Annual Growth Rate (2004-2025): 3.0% 3.1% 2.8%
Sources: Airport Management Records, Cargo Reports – CY 2000 through CY 2004; Ricondo & Associates, Inc. Prepared by: Ricondo & Associates, Inc. Notes: 1 The total enplaned belly tonnage was derived by pairing the average enplaned belly tons per air carrier departure for the last five years to the air carrier baseline operations forecast. 2 The average share of mail and freight for the last five years account for 62.6 and 37.4 percent, respectively. This share is kept constant over the planning horizon.
As shown, total belly cargo tonnage increased from 5,552 tons in 2004 to 10,293 tons in 2025. This figure corresponds to an average annual growth of three percent over the planning horizon. Overall growth in both belly haul cargo and all-cargo activity will be fostered by the increase in business and residential development both within Palm Beach County and in rapidly developing counties to the north. Additionally, one factor that may contribute to the cargo stream over the planning period could be the Palm Beach County Technology Park, with its focus on biotechnology, medical technology development, pharmacology, and drug research, which will be centered on the activities of the Scripps Institute and a wide array of spin-off high-technology businesses.
A similar methodology was used to derive all-cargo volumes at PBI. The total enplaned all-cargo tonnage was derived by growing the existing (2004) enplaned all-cargo tons per departure to the average all-cargo tons per departure of the last 5 years in 2025. All-cargo operations projections were based on an average annual growth rate of 0.6 percent. This rate reflects the historic all-cargo operations growth between the lowest and highest operational activities that occurred at the Airport between 2000 and 2004. Finally, these operations were paired with the ratios of enplaned all-cargo tons per departure to derive all-cargo tonnage projections. Table 5-3 summarizes the all-cargo tonnage projections at PBI. As shown, all-cargo tonnage at PBI increases moderately from 1,875 tons in 2004 to 3,034 in 2025, corresponding to an average annual growth rate of 2.3 percent. Table 5-4 presents the total cargo tonnage forecast summary for PBI.

SECTION 5 – CARGO VOLUME AND OPERATIONS FORECAST
2_PBI_FORECAST_DECEMBER2005 5-4
TABLE 5-3 Projected All-Cargo Volume (in tons)
Year All-Cargo Tons All Cargo Operations1 Enplaned All Cargo Tons per
Departure2
2000 2,997 1,829 3.2772
2001 2,902 1,827 3.1768
2002 2,977 1,826 3.2607
2003 2,359 1,873 2.5190
2004 1,875 1,864 2.0118
2005 1,939 1,876 2.0672
2010 2,167 1,936 2.2378
2015 2,421 1,999 2.4223
2020 2,705 2,063 2.6222
2025 3,034 2,130 2.8491
Average Annual Growth Rate (2004-2025): 2.3% 0.6% 1.7%
Sources: Airport Management Records, Cargo Reports – CY 2000 through CY 2004; Ricondo & Associates, Inc. Prepared by: Ricondo & Associates, Inc. Notes: 1 The all cargo operations projections were based on the historic growth rates of the lowest and highest all cargo operations between 2000 and 2004. More details on the all-cargo operations forecast are provided in a subsequent section. 2 The total enplaned all cargo tonnage was derived by growing the enplaned all cargo tons per departure to the average all cargo tons per departure for the last five years in 2025.
TABLE 5-4 Total Cargo Volume (in tons) Forecast Summary
Enplaned Belly Cargo Tonnage
Year Enplaned Mail Enplaned Freight Total Enplaned
Belly Cargo Enplaned All-
Cargo Tonnage Total Enplaned Cargo
Tonnage
2004 3,416 2,136 5,552 1,875 7,427
2005 3,638 2,173 5,811 1,939 7,750 2010 4,055 2,423 6,478 2,167 8,645
2015 4,697 2,806 7,503 2,421 9,924 2020 5,475 3,271 8,746 2,705 11,451
2025 6,444 3,850 10,294 3,034 13,328
Source: Airport Management Records, Cargo Reports – CY 2000 through CY 2004. Prepared by: Ricondo & Associates, Inc.
5.2 All-Cargo Operations and Fleet Mix As previously noted, all-cargo operations at PBI have been performed by UPS since 1994. UPS has used two aircraft types for serving PBI—the DC8 or Boeing 757. Future operations by all-cargo carriers were defined based on the historic characteristics of all-cargo activities over the last 5 years. This period was chosen because it is most reflective of the current cargo characteristics at the Airport, under which all cargo operations have been relatively stable. As a result, the all-cargo operations projections for PBI translated into a moderately

SECTION 5 – CARGO VOLUME AND OPERATIONS FORECAST
2_PBI_FORECAST_DECEMBER2005 5-5
conservative forecast. This assumption is also based on the location of PBI relative to other major airports that are served by one or more of the all cargo carriers (i.e. UPS and/or Fedex locations at FLL, MIA and MCO). Table 5-5 presents the activity forecast for all-cargo operations at PBI. As shown, all cargo operations increase from 1,864 operations in 2004 to 2,130 operations in 2025, corresponding to a conservative average annual growth rate of just 0.6 percent per year.
TABLE 5-5 All-Cargo Carriers Operations Forecast1
Year All Cargo Operations
1990 0
1991 0
1992 0
1993 0
1994 542
1995 1,463
1996 1,501
1997 1,745
1998 1,793
1999 1,843
2000 1,829
2001 1,827
2002 1,826
2003 1,873
2004 1,864
2005 1,876
2010 1,936
2015 1,999
2020 2,063
2025 2,130
Average Annual Growth Rate (2004-2025): 0.6%
Sources: Airport Management Records, Cargo Reports – CY 2000 through CY 2004; Ricondo & Associates, Inc. Prepared by: Ricondo & Associates, Inc. Note: 1 The all cargo operations projections were based on the historic growth rates of the lowest and highest all cargo operations between 2000 and 2004.

SECTION 6 General Aviation and Air Taxi
2_PBI_FORECAST_DECEMBER2005 6-1
SECTION 6
General Aviation and Air Taxi
Another significant element of activity at PBI is associated with operations by GA and air taxi operators. This section of the report reviews historic activity at the Airport by this group and considers the various factors influencing this segment of the industry. From this review of historic activity and emerging trends, an analytical foundation is provided upon which future activities can be projected. The methodology and assumptions undertaken, as well as the based aircraft fleet mix projections, are discussed in the following sections.
A variety of aviation activities compose the broad definition of general aviation. General aviation includes all segments of the aviation industry except for commercial air carriers/regional/commuter service, cargo, air taxi, and the military. Non-scheduled air taxi operations are primarily associated with for-hire charter services or other commercial use (aerial photography, traffic advisory services, etc.). General aviation represents the largest percentage of civil aircraft in the United States and accounts for the majority of operations handled by towered and non-towered airports, as well as for the majority of certificated pilots in the U.S. Its activities include training new pilots, sightseeing, aerial photography, law enforcement, and medical flights, as well as business, corporate, and personal travel via non-commercial or charter operations. General aviation users operate a broad range of aircraft types, from small, single-engine piston aircraft to large corporate jets, as well as gliders and amateur-built aircraft. General aviation operations are typically divided into two subcategories—local and itinerant operations. Local operations are those arrivals or departures performed by aircraft that remain in the airport traffic pattern, or are within sight of the airport. This is assumed to generally cover an area within a 20 nautical mile radius of the airfield. Local operations are most often associated with training activity and flight instruction and include touch-and-go training operations.
Itinerant operations are arrivals or departures other than local operations, performed by either based or transient aircraft that do not remain in the airport traffic pattern or within a 20-nautical-mile radius.
6.1 Historic General Aviation Operations Historic data for PBI indicates that local general aviation operations have significantly decreased sharply between 1993 and 1995, which generally corresponds with the opening of the North County General Aviation Airport, located approximately 12 miles to the northwest of PBI. General aviation operations remained relatively static between 1995 through 1999, then rose in 2000 to approximately 122,800. Over the last 5 years, general aviation operations have decreased to their lowest level since 1990. The decrease in operations primarily results from the decline in local activity, which is indicative of a shift in training activity away from the PBI to other less-busy airports that do not have the mix of commercial and general aviation traffic. In 1994, local operations accounted for 25.5 percent of general aviation operational activity. By 2004, this percentage had decreased to 3.5 percent. Over the last 5 years, the average shares of itinerant versus local operations were

SECTION 6 – GENERAL AVIATION AND AIR TAX
2_PBI_FORECAST_DECEMBER2005 6-2
94.2 and 5.8 percent, respectively. This is not unusual given the predominance of operations by higher-performance general aviation turbo-props and corporate jets typical of the activity at PBI. Table 6-1 summarizes the historic general aviation operations data at PBI. It should be noted that air taxi operations are not included in Table 6-1. This segment of activity is presented in a subsequent section.
TABLE 6-1 Historic General Aviation Activity1
Fiscal Year Itinerant Share of Itinerant
(%) Local Share of Local
(%) Total
1990 117,811 83.9% 22,534 16.1% 140,345
1991 105,983 80.3% 26,041 19.7% 132,024
1992 115,801 79.0% 30,844 21.0% 146,645
1993 118,706 77.5% 34,366 22.5% 153,072
1994 96,491 74.5% 33,008 25.5% 129,499
1995 90,100 78.6% 24,517 21.4% 114,617
1996 93,598 81.8% 20,824 18.2% 114,422
1997 95,892 81.8% 21,288 18.2% 117,180
1998 98,299 87.7% 13,763 12.3% 112,062
1999 106,716 92.7% 8,424 7.3% 115,140
2000 114,436 93.2% 8,383 6.8% 122,819
2001 107,922 92.7% 8,537 7.3% 116,459
2002 98,025 93.2% 7,183 6.8% 105,208
2003 99,733 95.4% 4,781 4.6% 104,514
2004 96,377 96.5% 3,484 3.5% 99,861
Sources: FAA ATADS database. Prepared by: Ricondo & Associates, Inc. Note: 1 Does not include air taxi operations.
It is believed that the increase in activity at the Airport in late 2000 is related to the increased use of fractional ownership aircraft in the market. The FAA 2005 Annual Aerospace Forecasts identified PBI as being in the top five destinations of fractional ownership operations. The decrease in general aviation operations experienced at PBI does not mean that the Airport will experience a continued reduction in operational activity, but rather that there is a shift in the complexion of this activity away from light-piston aircraft towards a higher percentage of corporate jet activity. There are several factors that support the belief that some relative growth by the higher-end segment (business and corporate aviation) of the industry is likely to occur, and that this will manifest itself in a moderate increase in overall general aviation operational activity at PBI. These factors include industry-wide

SECTION 6 – GENERAL AVIATION AND AIR TAX
2_PBI_FORECAST_DECEMBER2005 6-3
developments, as well as events and considerations in the local market, including the influence of F45.
6.2 Factors Influencing the General Aviation Activity The general aviation industry has experienced its share of problems over the past 25 years as a result of product liability considerations, rising prices, and economic fluctuations. With the passage of the General Aviation Revitalization Act in 1994, the production of single-engine piston aircraft was revived, in addition to the continued growth and expansion of both turboprop and jet aircraft production. The combined effects of an overall economic downturn and the impact of the terrorist attacks in September 2001 resulted in an overall aviation industry downturn in production and growth. In 2004, consistent with many segments of the U.S business sector, the general aviation industry began to demonstrate mixed signs of recovery, stimulated by a relatively stronger U.S. economy; these signs have continued to improve in 2005. Continued strong demand for business jet aircraft, driven by an expanding use of these aircraft by individual corporations, the increase in fractional ownership, and emerging point to point charter operations, continues to indicate steady growth in jet aircraft deliveries.
Growth in corporate related-aviation activity including the continue expansion of fractional ownership and other techniques to make corporate aircraft available to a wider number of persons is the area that will be the most likely growth segment of activity to operate into and out of PBI. According to the 2005 FAA Aerospace Forecast, the number of aircraft in fractional ownership programs was up 5.4 percent in 2004, and up 65.6 percent since 2000. The growth in fractional ownership is occurring primarily in the upper end of the general aviation fleet, with significant expansion in the number of business jets and upper-end turbo-props being brought into fractional ownership use. Because of the sophistication of a significant component of these aircraft, their requirements for longer runways and first-class facilities, and the location of PBI relative to the central business district area and luxury resort facilities along the beach side, growth in activity by this segment of the general aviation industry is likely at PBI.
Furthermore, because the general aviation airports operated by the DOA currently do not have the runway length necessary to accommodate operations by many of the mid-sized to larger jet aircraft, or are restricted in use (i.e., no jet aircraft allowed at Palm Beach County Park Airport), operating in and out of PBI may likely remain as the most viable alternative for a portion of the corporate business fleet. It is believed, however, that the airspace complexity at PBI coupled with the existing airfield congestion could potentially cause some small jet aircraft (i.e. Cessna Citations, some Learjet models) to relocate. These considerations could lead to a reasonable share of these aircraft being captured by F45, where significant development in the Airport surroundings is currently under way. Development in the vicinity of F45 includes extensive roadway expansion and, particularly, the construction of a world-class biomedical research campus, the Scripps Institute, which will result in thousands of high-paying, high-technology jobs in the area. This expansion in the North County area is expected to spur Florida’s economic development in biotechnology, just as Scripps in La Jolla has stimulated the flourishing of the bioscience industry in San Diego. Associated with this growth will be an increase in corporate aviation

SECTION 6 – GENERAL AVIATION AND AIR TAX
2_PBI_FORECAST_DECEMBER2005 6-4
activity associated with those entities that would work with Scripps in the various research arenas. These include such businesses as Johnson and Johnson, Merck, and Pfizer, to name a few, all of which operate large corporate aircraft.
The following text identifies the methodology and assumptions undertaken for the development of general aviation forecast at the PBI. The F45 general aviation activity forecast is presented in a stand-alone document that can be referred to for comparative purposes. That report also provides more detail on general aviation trends at the national and local level.
6.3 Methodology and Assumptions The methodology adapted to project general aircraft operations at PBI involved the determination and calculation of operations per based aircraft at the Airport. Given F45’s potential influence in serving as a viable reliever airport for PBI, it was necessary to consider its role as it may relate to the following set of assumptions used to form the basis for the general aviation activity forecast for both airports:
• Based on the 2005 FAA Aerospace Forecast, PBI is among the top five destinations for fractional ownership destinations. Given the continued growth in this segment of the industry, it is assumed that PBI will retain its rank over the planning horizon.
• As a partial consequence to the above assumption, it is reasonable to assume that medium/large general aviation jet aircraft operations would continue to be primarily operating in and out of PBI. In addition, it is also believed that the sophistication of these aircraft, their requirements for longer runways and first-class facilities, and especially the location of PBI relative to the central business district area and luxury resorts along the beach front, would favor PBI over F45.
• Limited area for general aviation expansion coupled with demand for facilities have combined to place a price premium on ramp and hangar facilities. This has increased the price to users, which has resulted in operators of smaller aircraft considering alternative locations. Because of this natural supply/demand relationship and its affect on general aviation pricing at PBI, it is reasonable to assume that F45 will capture a significant share of the PBI single-/multi-engine piston aircraft, as well as a growing segment of light jet activity, including VLJs, which consist of relatively inexpensive one- or two-engine jet aircraft.
• Based aircraft at PBI are assumed to remain at their existing level (2004) of 129 aircraft (not including helicopters) over the planning horizon. The existing based aircraft at PBI consist of 57 percent jet aircraft, 13 percent multi-engine aircraft (including turbo-prop aircraft), and 30 percent of single-engine piston aircraft. Given the above assumptions, a decrease in the share of the two latter categories is anticipated. Conversely, the share of based jet aircraft at PBI is expected to increase.
• The last 5-year average split of 5.8 percent and 94.2 of local and itinerant operations, respectively, was held constant over the planning period.
• A moderate growth in operations per based aircraft is assumed. As such, a similar level of operations per based aircraft experienced at PBI a few years following the opening of F45 is assumed in 2025.

SECTION 6 – GENERAL AVIATION AND AIR TAX
2_PBI_FORECAST_DECEMBER2005 6-5
6.4 General Aviation Operations Table 6-2 presents the general aviation operations forecast for PBI. As shown, the based aircraft at the Airport are held constant at 129 aircraft over the planning period. Historic operations per based aircraft fluctuated from a low of 682 in 1995 to a high of 938 in 2000. The 682 operations per based aircraft coincided with the opening of F45, where total general aviation operations decreased at PBI. The 938 based aircraft per operation experienced in 2000 is believed to be associated with the significant growth of fractional ownership, where PBI ranked in the top five destinations for that segment of the industry, along with the attraction of the market both as a tourism location as well as for business and business meetings.
TABLE 6-2 General Aviation Operations Forecast1
Operations Years Total Operations2 Based Aircraft3
Operations per Based Aircraft Local Share Itinerant Share
1990 140,345 180 780 22,534 16.1% 117,811 83.9% 1991 132,024 160 825 26,041 19.7% 105,983 80.3% 1992 146,645 157 934 30,844 21.0% 115,801 79.0% 1993 153,072 170 900 34,366 22.5% 118,706 77.5% 1994 129,499 168 771 33,008 25.5% 96,491 74.5% 1995 114,617 168 682 24,517 21.4% 90,100 78.6% 1996 114,422 163 702 20,824 18.2% 93,598 81.8% 1997 117,180 163 719 21,288 18.2% 95,892 81.8% 1998 112,062 137 818 13,763 12.3% 98,299 87.7% 1999 115,140 130 886 8,424 7.3% 106,716 92.7% 2000 122,819 131 938 8,383 6.8% 114,436 93.2% 2001 116,459 133 876 8,537 7.3% 107,922 92.7% 2002 105,208 135 779 7,183 6.8% 98,025 93.2% 2003 104,514 131 798 4,781 4.6% 99,733 95.4%
2004 99,861 1294 775 3,484 3.5% 96,377 96.5% 2005 100,250 129 777 5,814 5.8% 94,435 94.2%
2010 101,636 129 788 5,895 5.8% 95,741 94.2%
2015 103,041 129 799 5,976 5.8% 97,064 94.2%
2020 104,465 129 810 6,059 5.8% 98,406 94.2%
2025 105,909 129 821 6,143 5.8% 99,766 94.2%
Average Annual Growth Rate (2004-2025): 0.27% 0.27% 2.73% 0.13% Sources: FAA ATADS database; Ricondo & Associates, Inc. Prepared by: Ricondo & Associates, Inc. Notes: 1 Assumes based aircraft at PBI remains constant. Shift of single engine piston aircraft, some multi engine piston aircraft, and small jet aircraft to F45.2 Based on FAA ATADS database. 3 Based on FAA TAF. 4 Actual 2004 based aircraft was based on ANOMS data.
As previously stated, the operations per based aircraft are anticipated toe increase moderately from an existing 775 operations per based aircraft to 821 in 2025. This value is

SECTION 6 – GENERAL AVIATION AND AIR TAX
2_PBI_FORECAST_DECEMBER2005 6-6
well within the recent experience of the airport, even as local operations were dropping sharply after 1999. This level of operational activity per based aircraft translated into an increase in general aviation operations of 99,861 in 2004 to 105,909 in 2025, corresponding to a conservative average annual growth rate of 0.27 percent.
6.5 Based Aircraft Fleet Mix General aviation and air-taxi-based aircraft at PBI is currently composed of 57 percent jet aircraft, 13 percent multi-engine piston (including turboprops) aircraft, and 30 percent single-engine piston aircraft. Based on the general aviation activity forecast assumptions above, a decrease in the share of single-engine piston aircraft is anticipated because of the expected shift of this activity to F45. The share of multi-engine aircraft, including turboprops, is also anticipated to slightly decrease. Conversely, based jet aircraft at PBI are expected to increase from an existing 74 to 84 in 2025. Table 6-3 summarizes the based aircraft fleet mix projection at PBI.
TABLE 6-3 Based Aircraft Fleet Mix Forecast1
Fixed-Wing Aircraft
Year
Single-Engine Piston
Share of Single-Engine
Piston (%) Multi Engine
Piston2
Share of Multi-Engine Piston
(%) Jet Share of Jet
(%) Total Based
Aircraft at PBI Helicopters
2004 Act.3 38 29.5% 17 13.2% 74 57.4% 129 19
2005 38 29.1% 17 13.1% 74 57.7% 129 19
2010 35 27.4% 16 12.7% 77 59.5% 129 21
2015 33 25.9% 16 12.4% 79 61.4% 129 22
2020 31 24.4% 16 12.0% 82 63.3% 129 23
2025 30 23.0% 15 11.7% 84 65.3% 129 25
Average Annual Growth Rate (2004-2025):
-1.17% -0.56% 0.62% 0.00% 1.32%
Sources: FAA ATADS database. Prepared by: Ricondo & Associates, Inc. Notes: 1 Assumes based aircraft at PBI remains constant and fleet mix change. Shift of single engine piston, some multi engine piston, and small jet aircraft to F45. Includes air taxi aircraft. 2 Includes turboprop aircraft. 3 Actual 2004 based aircraft is based on the ANOMS data, dated July 2005. Helicopters are not included in the total number of based aircraft.
6.6 Air Taxi Operations Air taxi operations are associated with non-scheduled for-hire charter services or other commercial use (aerial photography, traffic advisory services, sightseeing, etc). For the purpose of this forecast, air taxi operations are defined as the difference between the air taxi tower counts obtained from the FAA Air Traffic Data Activity System (ATADS) and

SECTION 6 – GENERAL AVIATION AND AIR TAX
2_PBI_FORECAST_DECEMBER2005 6-7
scheduled commuter activity reported. This segregation was necessary because the FAA combines both non-schedule air taxi operations and scheduled commuter activities under its TAF or ATADS.
Given the “on-demand” nature of air taxi services, a conservative approach was adopted to determine the air taxi activity projection at PBI. As such, the air taxi growth rate developed by the FAA in its TAF was adopted for this forecast. Table 6-4 summarizes the air taxi activity projection for PBI. As shown, air taxi operations increase at a moderate average annual growth rate of 0.95 percent from 28,304 operations in 2004 to 34,521 in 2025.
TABLE 6-4 Air Taxi Operations Summary
Year Air Taxi Operations
2004 28,3041
2005 28,573
2010 29,956
2015 31,406
2020 32,927
2025 34,521
Average Annual Growth Rate (2004-2025):
0.95%
Sources: FAA ATADS; FAA TAF; Ricondo & Associates, Inc. Prepared by: Ricondo & Associates, Inc. Note: 1 Represents the difference between air taxi tower counts obtained from the FAA Air Traffic Data Activity System (ATADS) and scheduled commuter operations reported.
6.7 General Aviation and Air Taxi Operations Summary Table 6-5 displays the general aviation and air taxi operations forecast for PBI. As shown, GA and air taxi operations are predicted to increase moderately from 128,165 in 2004 to 131,592 in 2010, and to 140,430 in 2025.
TABLE 6-5 General Aviation/Air Taxi Operations Summary
Year General Aviation Operations Air Taxi Operations Total Operations 2004 99,861 28,304 128,165 2005 100,250 28,573 128,823 2010 101,636 29,956 131,592 2015 103,041 31,406 134,447 2020 104,465 32,927 137,392 2025 105,909 34,521 140,430
Average Annual Growth Rate (2004-2025):
0.27% 0.95% 0.44%
Sources: FAA ATADS; FAA TAF; Ricondo & Associates, Inc. Prepared by: Ricondo & Associates, Inc.

SECTION 7 Military Activity

2_PBI_FORECAST_DECEMBER2005 7-1
SECTION 7
Military Activity
Military operations at PBI fluctuated from 982 to 2,127 total annual operations over the last 15 years, with an average of approximately 1,445 operations for the same period. The military activity at the Airport is related to the military activities and training practices at nearby bases, as well as national and international events. Table 7-1 summarizes the level of military activity recorded at PBI over the last 15 years.
TABLE 7-1 Historic Military Operations Activity
Year Local Operations Itinerant Operations Total Operations 1990 79 1,590 1,669 1991 28 1,692 1,720 1992 114 2,013 2,127
1993 16 1,632 1,648 1994 18 1,504 1,522
1995 95 1,537 1,632 1996 46 1,303 1,349
1997 17 1,124 1,141 1998 14 968 982
1999 234 763 997 2000 115 1,028 1,143
2001 157 1,385 1,542 2002 216 1,342 1,558
2003 171 1,177 1,348 2004 94 1,207 1,301
Source: FAA ATADS Database. Prepared by: Ricondo & Associates, Inc.
Military operations are difficult to forecast at any airfield, including military bases, because they rely so heavily on each year’s available budget and the status of events on a regional or worldwide basis. The FAA forecast the total military operations to be constant over the planning horizon at 1,403 annual operations. Since the completion of the 2001 Strategic Plan, no significant changes in operations were observed, therefore for consistency, it is assumed that military operations at PBI will average 1,500 operations annually. Table 7-2 presents the forecast level of military operations at PBI. As shown, the share of local operations (8 percent) versus itinerant operations (92 percent) was based on the FAA TAF. It is anticipated to hold constant over the planning horizon.

SECTION 7 – MILITARY ACTIVITY
2_PBI_FORECAST_DECEMBER2005 7-2
TABLE 7-2 Military Activity Forecast
Year Local Operations Itinerant Operations Annual Military Operations Act. 2004 94 1,207 1,301
2005 120 1,380 1,500
2010 120 1,380 1,500
2015 120 1,380 1,500
2020 120 1,380 1,500
2025 120 1,380 1,500
Source: FAA ATADS; Ricondo and Associates, Inc. Prepared by: Ricondo & Associates, Inc.

SECTION 8 Enplanements and Aircraft
Operations Peaking Activity

2_PBI_FORECAST_DECEMBER2005 8-1
SECTION 8
Enplanements and Aircraft Operations Peaking Activity
Peak operational activity, such as peak month, and peak month-average day forecasts, is used in airport planning to determine the facility requirements needed to accommodate projected demand and for sizing facilities. There are a number of different peaking analyses that can be conducted. For example, airfield evaluations require that every annual aircraft operation be considered, while passenger terminal facilities need only those operations associated with commercial passenger airlines. In order to properly plan, size, and design passenger terminal facilities, peaking analyses need to also include the level of enplanements. Basically, commercial service airports experience peaks in both passenger airline operations, as well as passenger enplanements. Therefore, each of these peaking elements must be evaluated separately because peak airline operations define the demand for airside facilities (gates and ramp), while peak enplanements pose a direct impact on terminal and landside facilities (roads and parking).
Historic monthly passenger enplanements were reviewed in order to identify the peak month for passenger activities. The month of March, corresponding to the spring break influx in South Florida, has been the busiest month for passenger enplanements over the last 5 years, averaging approximately 12 percent of the total annual enplaned passengers over this timeframe. While the peak month averaged 12 percent of total passengers, a review of airport landing reports noted that the distribution of the peak between domestic mainline, regional, and international varied, with the regional and international categories accounting for a slightly higher percentage of enplanements in the peak month than typical on an annual basis. For example, while, on average, regional commuter activity accounted for approximately 1.7 percent of total passengers annually, during the peak month at PBI regional/commuter passengers accounted for 2.1 percent of peak month activity. For peaking considerations, this higher level of activity has been used for regional commuter peaking and a similar adjustment was made for the international peaking analysis, with a corresponding adjustment to the domestic mainline values. Similarly, aircraft operations were also assessed. Again, the month of March experienced the highest level of aircraft operations, with approximately 10 percent of the total annual aircraft operations.
The following text provides individual peaking analyses for total passenger enplanements and aircraft operations. These projections are based on a combination of monthly historic data from the FAA ATADS and landing reports provided by the Airport.
8.1 Domestic-Mainline Passenger Peaking Characteristics From 2000 to 2004, the domestic-mainline passenger enplanements have averaged 96.4 percent of the total peak month enplaned passengers. As previously stated, however, this value was adjusted to 95.7 percent to account for a higher anticipated share of regional/commuter passengers over the planning period. This adjusted share is assumed to
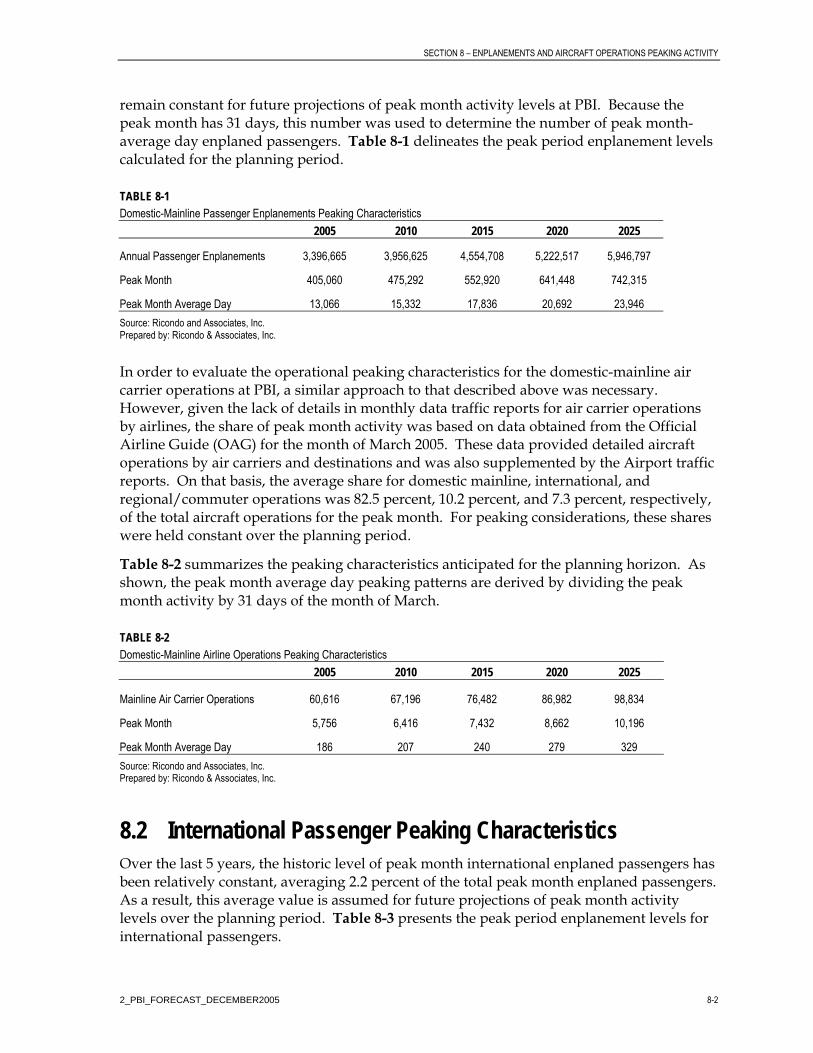
SECTION 8 – ENPLANEMENTS AND AIRCRAFT OPERATIONS PEAKING ACTIVITY
2_PBI_FORECAST_DECEMBER2005 8-2
remain constant for future projections of peak month activity levels at PBI. Because the peak month has 31 days, this number was used to determine the number of peak month-average day enplaned passengers. Table 8-1 delineates the peak period enplanement levels calculated for the planning period.
TABLE 8-1 Domestic-Mainline Passenger Enplanements Peaking Characteristics
2005 2010 2015 2020 2025
Annual Passenger Enplanements 3,396,665 3,956,625 4,554,708 5,222,517 5,946,797
Peak Month 405,060 475,292 552,920 641,448 742,315
Peak Month Average Day 13,066 15,332 17,836 20,692 23,946
Source: Ricondo and Associates, Inc. Prepared by: Ricondo & Associates, Inc.
In order to evaluate the operational peaking characteristics for the domestic-mainline air carrier operations at PBI, a similar approach to that described above was necessary. However, given the lack of details in monthly data traffic reports for air carrier operations by airlines, the share of peak month activity was based on data obtained from the Official Airline Guide (OAG) for the month of March 2005. These data provided detailed aircraft operations by air carriers and destinations and was also supplemented by the Airport traffic reports. On that basis, the average share for domestic mainline, international, and regional/commuter operations was 82.5 percent, 10.2 percent, and 7.3 percent, respectively, of the total aircraft operations for the peak month. For peaking considerations, these shares were held constant over the planning period.
Table 8-2 summarizes the peaking characteristics anticipated for the planning horizon. As shown, the peak month average day peaking patterns are derived by dividing the peak month activity by 31 days of the month of March.
TABLE 8-2 Domestic-Mainline Airline Operations Peaking Characteristics
2005 2010 2015 2020 2025
Mainline Air Carrier Operations 60,616 67,196 76,482 86,982 98,834
Peak Month 5,756 6,416 7,432 8,662 10,196
Peak Month Average Day 186 207 240 279 329
Source: Ricondo and Associates, Inc. Prepared by: Ricondo & Associates, Inc.
8.2 International Passenger Peaking Characteristics Over the last 5 years, the historic level of peak month international enplaned passengers has been relatively constant, averaging 2.2 percent of the total peak month enplaned passengers. As a result, this average value is assumed for future projections of peak month activity levels over the planning period. Table 8-3 presents the peak period enplanement levels for international passengers.
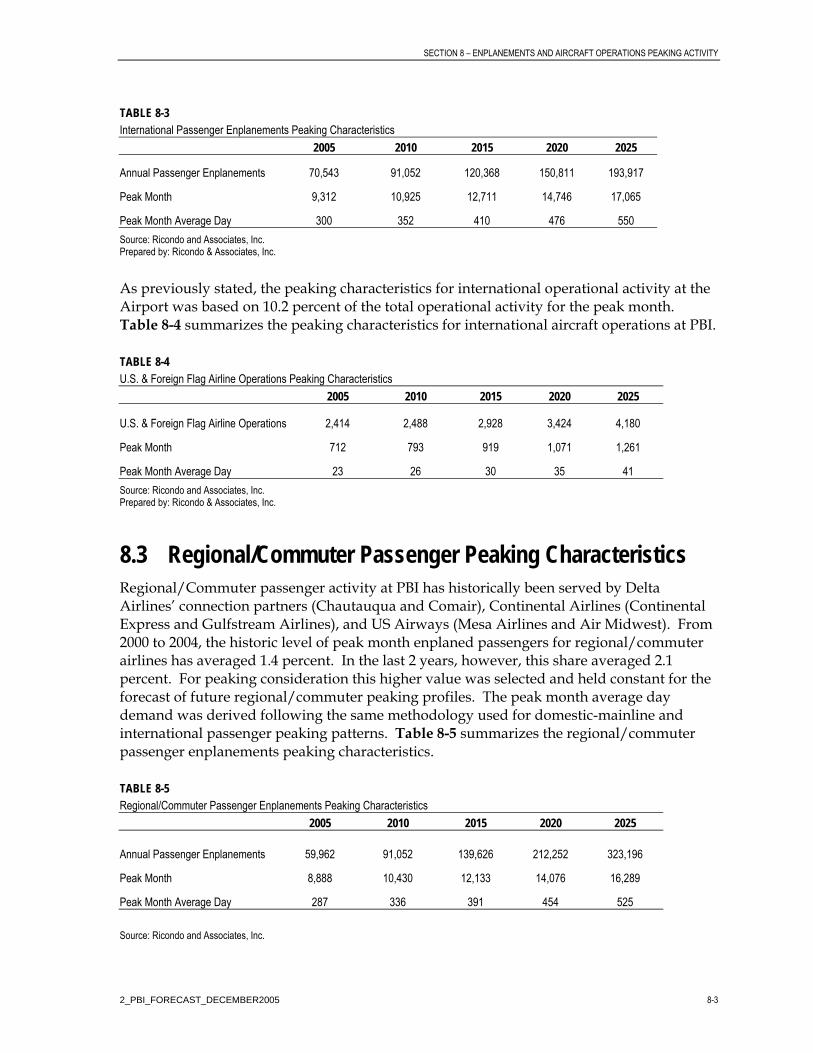
SECTION 8 – ENPLANEMENTS AND AIRCRAFT OPERATIONS PEAKING ACTIVITY
2_PBI_FORECAST_DECEMBER2005 8-3
TABLE 8-3 International Passenger Enplanements Peaking Characteristics
2005 2010 2015 2020 2025
Annual Passenger Enplanements 70,543 91,052 120,368 150,811 193,917
Peak Month 9,312 10,925 12,711 14,746 17,065
Peak Month Average Day 300 352 410 476 550
Source: Ricondo and Associates, Inc. Prepared by: Ricondo & Associates, Inc.
As previously stated, the peaking characteristics for international operational activity at the Airport was based on 10.2 percent of the total operational activity for the peak month. Table 8-4 summarizes the peaking characteristics for international aircraft operations at PBI.
TABLE 8-4 U.S. & Foreign Flag Airline Operations Peaking Characteristics
2005 2010 2015 2020 2025
U.S. & Foreign Flag Airline Operations 2,414 2,488 2,928 3,424 4,180
Peak Month 712 793 919 1,071 1,261
Peak Month Average Day 23 26 30 35 41
Source: Ricondo and Associates, Inc. Prepared by: Ricondo & Associates, Inc.
8.3 Regional/Commuter Passenger Peaking Characteristics Regional/Commuter passenger activity at PBI has historically been served by Delta Airlines’ connection partners (Chautauqua and Comair), Continental Airlines (Continental Express and Gulfstream Airlines), and US Airways (Mesa Airlines and Air Midwest). From 2000 to 2004, the historic level of peak month enplaned passengers for regional/commuter airlines has averaged 1.4 percent. In the last 2 years, however, this share averaged 2.1 percent. For peaking consideration this higher value was selected and held constant for the forecast of future regional/commuter peaking profiles. The peak month average day demand was derived following the same methodology used for domestic-mainline and international passenger peaking patterns. Table 8-5 summarizes the regional/commuter passenger enplanements peaking characteristics.
TABLE 8-5 Regional/Commuter Passenger Enplanements Peaking Characteristics
2005 2010 2015 2020 2025
Annual Passenger Enplanements 59,962 91,052 139,626 212,252 323,196
Peak Month 8,888 10,430 12,133 14,076 16,289
Peak Month Average Day 287 336 391 454 525
Source: Ricondo and Associates, Inc.

SECTION 8 – ENPLANEMENTS AND AIRCRAFT OPERATIONS PEAKING ACTIVITY
2_PBI_FORECAST_DECEMBER2005 8-4
Prepared by: Ricondo & Associates, Inc.
Similar to the methodology used for deriving the peaking characteristics for the domestic-mainline and international airline operation activity, Table 8-6 presents the regional/commuter operations peaking characteristics. As shown, the peak month activity is based on a 7.3 percent share of regional/commuter operations of the total peak month.
TABLE 8-6 Regional/Commuter Airline Operations Peaking Characteristics
2005 2010 2015 2020 2025
Regional/Commuter Operations 6,735 8,092 10,675 14,593 20,570
Peak Month 509 568 658 766 902
Peak Month Average Day 16 18 21 25 29
Source: Ricondo and Associates, Inc. Prepared by: Ricondo & Associates, Inc.
8.4 All-Cargo Air Carrier Peaking Characteristics UPS accounts for the total all-cargo activity at the airport. Based on a review of the all-cargo operations obtained from the airport landing reports and traffic reports, the peak month for cargo operations over the past 5 years has averaged 9.2 percent of total annual all-cargo operational activity. This value was held constant for the forecast level of annual all-cargo operations to derive peak month projections activity at PBI. Table 8-7 presents this information. As shown, the impact of all-cargo peaking operations is negligible.
TABLE 8-7 All-Cargo Air Carrier Operations Peaking Characteristics
2005 2010 2015 2020 2025
All-Cargo Air Carrier Operations 1,876 1,936 1,999 2,063 2,130
Peak Month 173 178 184 189 196
Peak Month Average Day 6 6 6 7 7
Source: Ricondo and Associates, Inc. Prepared by: Ricondo & Associates, Inc.
8.5 General Aviation and Air Taxi Peaking Characteristics The monthly FAA ATADS data from 2000 to 2004 were reviewed to define the peak month of each year and the level of operational activity that this peak month represents. General aviation peak month activity for this period occurred in March and averaged approximately 11.3 percent of the annual operational activity. This 5-year average share of peak month activity was used to define general aviation/air taxi peak month activity over the planning horizon. Table 8-8 summarizes the anticipated peaking patterns.
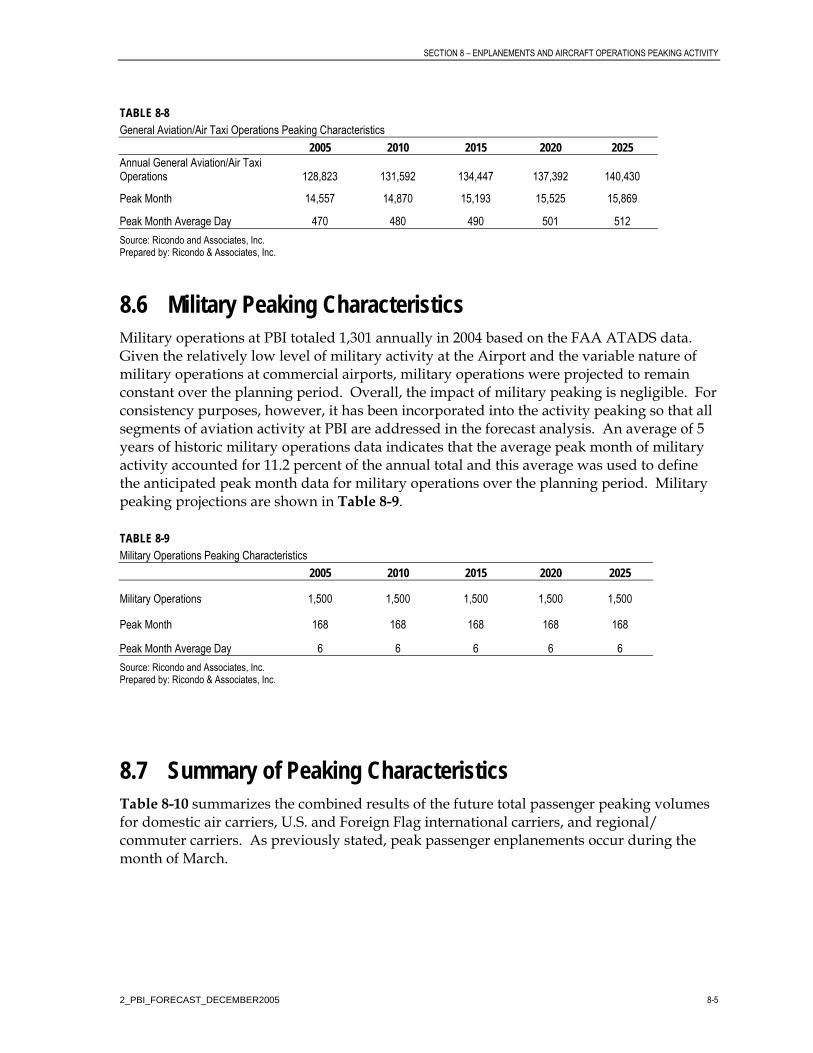
SECTION 8 – ENPLANEMENTS AND AIRCRAFT OPERATIONS PEAKING ACTIVITY
2_PBI_FORECAST_DECEMBER2005 8-5
TABLE 8-8 General Aviation/Air Taxi Operations Peaking Characteristics
2005 2010 2015 2020 2025 Annual General Aviation/Air Taxi Operations 128,823 131,592 134,447 137,392 140,430
Peak Month 14,557 14,870 15,193 15,525 15,869
Peak Month Average Day 470 480 490 501 512
Source: Ricondo and Associates, Inc. Prepared by: Ricondo & Associates, Inc.
8.6 Military Peaking Characteristics Military operations at PBI totaled 1,301 annually in 2004 based on the FAA ATADS data. Given the relatively low level of military activity at the Airport and the variable nature of military operations at commercial airports, military operations were projected to remain constant over the planning period. Overall, the impact of military peaking is negligible. For consistency purposes, however, it has been incorporated into the activity peaking so that all segments of aviation activity at PBI are addressed in the forecast analysis. An average of 5 years of historic military operations data indicates that the average peak month of military activity accounted for 11.2 percent of the annual total and this average was used to define the anticipated peak month data for military operations over the planning period. Military peaking projections are shown in Table 8-9.
TABLE 8-9 Military Operations Peaking Characteristics
2005 2010 2015 2020 2025
Military Operations 1,500 1,500 1,500 1,500 1,500
Peak Month 168 168 168 168 168
Peak Month Average Day 6 6 6 6 6
Source: Ricondo and Associates, Inc. Prepared by: Ricondo & Associates, Inc.
8.7 Summary of Peaking Characteristics Table 8-10 summarizes the combined results of the future total passenger peaking volumes for domestic air carriers, U.S. and Foreign Flag international carriers, and regional/ commuter carriers. As previously stated, peak passenger enplanements occur during the month of March.

SECTION 8 – ENPLANEMENTS AND AIRCRAFT OPERATIONS PEAKING ACTIVITY
2_PBI_FORECAST_DECEMBER2005 8-6
TABLE 8-10 Total Passenger Enplanements Peaking Characteristics
Passenger Enplanements: 2005 2010 2015 2020 2025 Annual Domestic-Mainline 3,396,665 3,956,625 4,554,708 5,222,517 5,946,797
International 70,543 91,052 120,368 150,811 193,917 Regional/Commuters 59,962 91,052 139,626 212,252 323,196
Total 3,527,170 4,138,729 4,814,702 5,585,580 6,463,910 Peak Month
Domestic-Mainline 405,060 475,292 552,920 641,448 742,315 International 9,312 10,925 12,711 14,746 17,065
Regional/Commuters 8,888 10,430 12,133 14,076 16,289
Total 423,260 496,647 577,764 670,270 775,669 Peak Month Average Day
Domestic-Mainline 13,066 15,332 17,836 20,692 23,946 International 300 352 410 476 550
Regional/Commuters 287 336 391 454 525
Total 13,653 16,020 18,637 21,622 25,021 Source: Ricondo and Associates, Inc. Prepared by: Ricondo & Associates, Inc.
While the peaks for the various categories of aircraft operations do not always occur in the same month, the compilation of the peaking levels from the preceding section indicate a maximum peak activity level for the various planning periods. Table 8-11 recapitulates the peaking profiles by operational category.
TABLE 8-11 Total Operations Peaking Characteristics
2005 2010 2015 2020 2025
Aircraft Operations Annual
Domestic-Mainline 60,616 67,196 76,482 86,982 98,834 International 2,414 2,488 2,928 3,424 4,180
Regional/Commuters 6,735 8,092 10,675 14,593 20,570
Total Air Carrier 69,765 77,776 90,085 104,999 123,584 All-Cargo 1,876 1,936 1,999 2,063 2,130 General Aviation/Air Taxi 128,823 131,592 134,447 137,392 140,430
Military 1,500 1,500 1,500 1,500 1,500
Total – All 201,964 212,804 228,031 245,954 267,644 Peak Month
Domestic-Mainline 5,756 6,416 7,432 8,662 10,196 International 712 793 919 1,071 1,261
Regional/Commuters 509 568 658 766 902
Total Air Carrier 6,977 7,777 9,009 10,499 12,359 All-Cargo 173 178 184 189 196
General Aviation/Air Taxi 14,557 14,870 15,193 15,525 15,869 Military 168 168 168 168 168
Total – All 21,875 22,993 24,554 26,381 28,592

SECTION 8 – ENPLANEMENTS AND AIRCRAFT OPERATIONS PEAKING ACTIVITY
2_PBI_FORECAST_DECEMBER2005 8-7
TABLE 8-11 Total Operations Peaking Characteristics
2005 2010 2015 2020 2025
Aircraft Operations
Peak Month Average Day Domestic-Mainline 186 207 240 279 329
International 23 26 30 35 41 Regional/Commuters 16 18 21 25 29
Total Air Carrier 225 251 291 339 399 All-Cargo 6 6 6 7 7
General Aviation/Air Taxi 470 480 490 501 512 Military 6 6 6 6 6
Total – All 707 743 793 853 924 Source: Ricondo and Associates, Inc. Prepared by: Ricondo & Associates, Inc.

SECTION 9 Summary of Aviation Activity Forecasts

2_PBI_FORECAST_DECEMBER2005 9-1
SECTION 9
Summary of Aviation Activity Forecasts
Tables 9-1 and 9-2 summarize the baseline activity forecast for PBI for passenger enplanements and aircraft operations, respectively. As shown, total passenger enplanements are anticipated to grow at an average annual growth rate of 3.3 percent, while total aircraft operations are expected to grow at an average annual growth rate of 1.4 percent.
TABLE 9-1 Passenger Enplanements Summary
Domestic Enplanements
Mainline Regional Total Domestic Enplanements
Total International Enplanements Total Enplanements
Act. 2004 3,157,971 55,569 3,213,540 66,751 3,280,291
2005 3,396,665 59,962 3,456,627 70,543 3,527,170 2010 3,956,625 91,052 4,047,677 91,052 4,138,729 2015 4,554,708 139,626 4,694,334 120,368 4,814,702
2020 5,222,517 212,252 5,434,769 150,811 5,585,580 2025 5,946,797 323,196 6,269,993 193,917 6,463,910
Average Annual Growth Rate (2004-2025): 3.1% 8.7% 3.2% 5.2% 3.3%
Source: Airport Traffic Reports; FAA TAF; FAA ATADS; Ricondo and Associates, Inc. Prepared by: Ricondo & Associates, Inc.
TABLE 9-2 Aircraft Operations Summary
Air Carrier All Cargo General Aviation Air Taxi Military Total
Act. 2004 67,7781 1,8642 99,8613 28,3044 1,3013 199,1085
2005 69,765 1,876 100,250 28,573 1,500 201,964 2010 77,776 1,936 101,636 29,956 1,500 212,804
2015 90,085 1,999 103,041 31,406 1,500 228,031 2020 104,999 2,063 104,465 32,927 1,500 245,954
2025 123,584 2,130 105,909 34,521 1,500 267,644 Average Annual Growth Rate (2004-2025):
2.9% 0.6% 0.3% 0.9% 0.3% 1.4%
Source: Airport Traffic Reports; FAA TAF; FAA ATADS; Ricondo and Associates, Inc. Prepared by: Ricondo & Associates, Inc. Notes: 1 Source: Airport traffic reports 2 Source: Airport traffic reports 3 Source: FAA ATADS 4 Source: Estimated based on the difference between the air taxi tower counts obtained from the FAA ATADS and scheduled commuter operations. 5 Total shown may vary from Airport traffic reports, TAF, or ATADS due to difference sources used.

SECTION 9 – SUMMARY OF AVIATION ACTIVITY FORECASTS
2_PBI_FORECAST_DECEMBER2005 9-2
With the completion of the forecast of future activity for the Airport, the next step in the master planning process is to define the extent to which existing and planned airport facilities can accommodate the current and projected levels of activity that have been identified herein. Ultimately, however, design-day schedules of hourly activity will be assessed to define PMAD peak hour activity levels for the determination of facility requirements. These analyses will be conducted in a subsequent phase of this System Plan study.

APPENDICESSHEETS.DOC
Appendix A: Historic and Forecast Socioeconomic Data
WPB310127161368.doc/063000015


Table A-1Population - Historical and Forecast
Total U. S. Growth
(%) FloridaGrowth
(%) Palm BeachGrowth
(%) MartinGrowth
(%) St. LucieGrowth
(%) Indian River Growth
(%) TotalGrowth
(%)
Historical:1967 196,942 6241.9 311 25 48 33 4171968 198,964 1.03% 6433.3 3.07% 322 3.31% 26 3.59% 48 1.05% 34 3.01% 430 3.04%1969 201,299 1.17% 6641.7 3.24% 337 4.70% 27 4.23% 50 3.33% 35 2.92% 449 4.37%1970 203,801 1.24% 6845.2 3.06% 352 4.66% 29 5.17% 51 3.23% 36 2.84% 468 4.39%1971 206,815 1.48% 7162.7 4.64% 372 5.42% 31 8.77% 54 4.69% 38 3.87% 494 5.42%1972 209,274 1.19% 7520.4 4.99% 392 5.46% 35 11.94% 55 3.36% 41 7.98% 523 5.83%1973 211,347 0.99% 7926.6 5.40% 428 9.21% 41 17.29% 62 12.27% 44 7.64% 575 9.95%1974 213,336 0.94% 8317.1 4.93% 457 6.73% 46 13.76% 67 6.91% 46 4.81% 615 7.10%1975 215,460 1.00% 8541.7 2.70% 475 4.01% 49 4.97% 69 4.06% 47 3.28% 640 4.03%1976 217,555 0.97% 8695.4 1.80% 488 2.69% 50 3.70% 72 3.61% 48 1.90% 658 2.81%1977 219,763 1.01% 8889.3 2.23% 500 2.46% 53 4.76% 74 3.49% 51 4.77% 677 2.92%1978 222,103 1.06% 9131.6 2.73% 518 3.70% 57 7.39% 77 4.18% 53 5.54% 706 4.18%1979 224,566 1.11% 9470.6 3.71% 551 6.29% 61 7.76% 82 6.21% 58 8.63% 752 6.58%1980 227,226 1.18% 9841.21 3.91% 586 6.34% 65 6.32% 89 8.20% 61 4.91% 800 6.43%1981 229,467 0.99% 10192.8 3.57% 621 5.93% 69 5.45% 95 7.26% 64 5.28% 848 5.99%1982 231,666 0.96% 10471.41 2.73% 646 4.08% 73 5.85% 101 6.10% 68 5.55% 887 4.56%1983 233,793 0.92% 10749.91 2.66% 667 3.34% 76 4.19% 106 4.73% 70 4.33% 919 3.64%1984 235,826 0.87% 11039.94 2.70% 694 3.96% 79 4.20% 111 5.00% 74 4.79% 958 4.16%1985 237,925 0.89% 11351.18 2.82% 723 4.20% 82 3.96% 116 4.31% 76 2.83% 997 4.09%1986 240,135 0.93% 11667.51 2.79% 753 4.20% 86 4.57% 121 4.68% 79 3.82% 1,039 4.26%1987 242,291 0.90% 11997.34 2.83% 785 4.18% 90 5.32% 128 5.22% 81 3.03% 1,084 4.30%1988 244,501 0.91% 12306.43 2.58% 815 3.85% 94 3.82% 134 4.98% 84 3.35% 1,127 3.94%1989 246,821 0.95% 12637.72 2.69% 842 3.32% 97 4.07% 142 5.80% 88 4.35% 1,169 3.76%1990 249,624 1.14% 13033.33 3.13% 872 3.50% 102 4.78% 153 7.63% 91 4.09% 1,217 4.15%1991 252,982 1.35% 13369.8 2.58% 899 3.13% 105 2.88% 158 3.60% 94 2.71% 1,256 3.14%1992 256,516 1.40% 13650.6 2.10% 926 3.07% 107 1.61% 163 3.09% 96 2.60% 1,292 2.92%1993 259,920 1.33% 13927.22 2.03% 957 3.30% 110 2.66% 168 2.87% 98 1.61% 1,332 3.07%1994 263,127 1.23% 14239.44 2.24% 988 3.24% 112 2.48% 173 3.01% 100 2.35% 1,373 3.08%1995 266,280 1.20% 14537.85 2.10% 1,014 2.61% 114 1.85% 176 1.99% 102 2.07% 1,406 2.43%1996 269,396 1.17% 14853.35 2.17% 1,040 2.60% 117 2.76% 181 2.42% 104 1.62% 1,442 2.52%1997 272,648 1.21% 15186.3 2.24% 1,070 2.84% 120 2.41% 185 2.29% 106 2.62% 1,481 2.72%1998 275,856 1.18% 15486.58 1.98% 1,096 2.47% 124 2.84% 187 1.55% 109 2.51% 1,516 2.39%1999 279,217 1.22% 15759.42 1.76% 1,117 1.90% 126 1.84% 190 1.52% 111 2.14% 1,545 1.86%2000 282,403 1.14% 16051.39 1.85% 1,136 1.72% 127 0.91% 194 1.66% 113 1.87% 1,570 1.66%2001 285,318 1.03% 16363.01 1.94% 1,161 2.18% 129 1.77% 198 2.46% 115 1.74% 1,604 2.15%2002 288,156 0.99% 16691.7 2.01% 1,188 2.36% 132 1.91% 205 3.50% 118 2.28% 1,643 2.46%2003 290,829 0.93% 17019.07 1.96% 1,216 2.35% 135 2.49% 213 4.02% 120 2.11% 1,685 2.56%
Forecast: 2004 293,847 1.04% 17206.35 1.10% 1,246 2.45% 142 5.26% 216 1.24% 124 2.53% 1,728 2.53%2005 296,893 1.04% 17555.03 2.03% 1,278 2.55% 147 3.27% 223 3.02% 127 2.48% 1,774 2.67%2006 299,976 1.04% 17910.82 2.03% 1,310 2.48% 152 3.18% 229 2.92% 130 2.41% 1,820 2.59%2007 303,097 1.04% 18269.66 2.00% 1,341 2.42% 156 3.06% 236 2.83% 133 2.35% 1,866 2.52%2008 306,261 1.04% 18631.58 1.98% 1,373 2.36% 161 2.96% 242 2.75% 136 2.30% 1,912 2.45%2009 309,261 0.98% 18983.96 1.89% 1,404 2.23% 165 2.81% 248 2.60% 139 2.17% 1,956 2.32%2010 312,303 0.98% 19339.08 1.87% 1,434 2.18% 170 2.71% 255 2.52% 142 2.13% 2,000 2.26%2011 315,388 0.99% 19697.24 1.85% 1,465 2.13% 174 2.64% 261 2.46% 145 2.07% 2,045 2.21%2012 318,517 0.99% 20058.8 1.84% 1,495 2.08% 179 2.56% 267 2.39% 148 2.04% 2,089 2.16%2013 321,691 1.00% 20423.63 1.82% 1,526 2.04% 183 2.48% 273 2.33% 150 1.99% 2,133 2.11%2014 325,025 1.04% 20799.42 1.84% 1,557 2.04% 188 2.46% 280 2.30% 153 2.00% 2,178 2.10%2015 328,407 1.04% 21178.83 1.82% 1,588 2.00% 192 2.39% 286 2.25% 156 1.96% 2,223 2.06%2016 331,837 1.04% 21561.88 1.81% 1,619 1.96% 197 2.33% 292 2.20% 159 1.92% 2,267 2.02%2017 335,313 1.05% 21948.63 1.79% 1,650 1.93% 201 2.28% 299 2.15% 162 1.89% 2,312 1.98%2018 338,837 1.05% 22339.23 1.78% 1,682 1.89% 206 2.22% 305 2.11% 165 1.86% 2,358 1.95%2019 342,492 1.08% 22739.33 1.79% 1,713 1.89% 210 2.20% 311 2.08% 169 1.86% 2,403 1.94%2020 346,197 1.08% 23143.25 1.78% 1,745 1.86% 215 2.15% 318 2.05% 172 1.84% 2,449 1.91%2021 349,953 1.08% 23551.58 1.76% 1,777 1.83% 219 2.10% 324 2.01% 175 1.81% 2,495 1.88%2022 353,759 1.09% 23963.9 1.75% 1,809 1.81% 224 2.06% 330 1.97% 178 1.78% 2,541 1.85%2023 357,618 1.09% 24380.91 1.74% 1,842 1.78% 228 2.03% 337 1.94% 181 1.76% 2,588 1.82%2024 361,562 1.10% 24803.91 1.73% 1,874 1.77% 233 2.00% 343 1.92% 184 1.75% 2,634 1.81%2025 365,565 1.11% 25231.94 1.73% 1,907 1.75% 237 1.96% 350 1.89% 187 1.73% 2,681 1.79%2026 369,627 1.11% 25665.06 1.72% 1,940 1.73% 242 1.93% 356 1.86% 191 1.71% 2,729 1.77%2027 373,751 1.12% 26103.28 1.71% 1,973 1.71% 247 1.90% 363 1.83% 194 1.70% 2,776 1.75%2028 377,941 1.12% 26546.89 1.70% 2,007 1.70% 251 1.87% 369 1.81% 197 1.68% 2,824 1.73%2029 382,281 1.15% 27001.85 1.71% 2,041 1.72% 256 1.89% 376 1.83% 200 1.70% 2,874 1.75%2030 386,695 1.15% 27463.24 1.71% 2,076 1.72% 261 1.90% 383 1.83% 204 1.70% 2,924 1.75%
Average Annual Growth Rate:1967-2003 1.09% 2.83% 3.86% 4.79% 4.26% 3.64% 3.96%2004-2005 1.04% 2.03% 2.55% 3.27% 3.02% 2.48% 2.67%2005-2010 1.02% 1.95% 2.33% 2.94% 2.72% 2.27% 2.43%2010-2015 1.01% 1.83% 2.06% 2.50% 2.35% 2.01% 2.13%2015-2020 1.06% 1.79% 1.91% 2.24% 2.12% 1.87% 1.96%2020-2025 1.09% 1.74% 1.79% 2.03% 1.94% 1.76% 1.83%2025-2030 1.13% 1.71% 1.72% 1.90% 1.83% 1.70% 1.75%2004-2030 1.06% 1.81% 1.98% 2.36% 2.22% 1.94% 2.04%
Source: National Planning Association (NPA).Prepared by: Ricondo & Associates, Inc.
Year
Palm Beach International Airport Market Area Counties
Total Population (in Thousands)
A-1
WPB310127161368.doc/063000015

Table A-2Nonfarm Employment - Historical and Forecast
Total U. S. Growth
(%) FloridaGrowth
(%) Palm BeachGrowth
(%) MartinGrowth
(%) St. LucieGrowth
(%) Indian River Growth
(%) TotalGrowth
(%)
Historical:1967 79,853 2,391 115.41 7.44 14.14 12.14 1421968 81,905 2.57% 2,509 4.97% 124.14 7.56% 8.22 10.48% 14.79 4.60% 12.53 3.21% 159 12.15%1969 87,077 6.31% 2,765 10.17% 142.17 14.52% 9.96 21.17% 17.87 20.82% 13.89 10.85% 182 14.63%1970 87,319 0.28% 2,873 3.93% 152.04 6.94% 10.99 10.34% 18.81 5.26% 13.78 -0.79% 195 6.83%1971 87,668 0.40% 2,991 4.09% 156.84 3.16% 11.88 8.10% 19.97 6.17% 14.96 8.56% 203 4.20%1972 90,444 3.17% 3,247 8.56% 170.15 8.49% 14.05 18.27% 22.30 11.67% 17.18 14.84% 222 9.25%1973 94,534 4.52% 3,574 10.06% 191.36 12.47% 16.45 17.08% 24.76 11.03% 19.68 14.55% 250 12.79%1974 96,148 1.71% 3,670 2.70% 197.54 3.23% 17.40 5.78% 25.30 2.18% 19.87 0.97% 259 3.73%1975 94,957 -1.24% 3,580 -2.44% 194.79 -1.39% 17.65 1.44% 24.95 -1.38% 19.65 -1.11% 257 -0.91%1976 97,623 2.81% 3,632 1.46% 198.71 2.01% 18.67 5.78% 25.95 4.01% 20.69 5.29% 263 2.42%1977 101,190 3.65% 3,831 5.47% 215.35 8.37% 20.63 10.50% 27.68 6.67% 22.12 6.91% 284 7.92%1978 105,929 4.68% 4,132 7.86% 239.05 11.01% 23.20 12.46% 30.15 8.92% 24.30 9.86% 314 10.68%1979 109,523 3.39% 4,352 5.31% 260.84 9.12% 25.70 10.78% 33.53 11.21% 25.89 6.54% 343 9.34%1980 110,432 0.83% 4,590 5.46% 279.52 7.16% 29.32 14.09% 36.00 7.37% 26.73 3.24% 368 7.13%1981 111,552 1.01% 4,780 4.14% 297.02 6.26% 30.93 5.49% 37.24 3.44% 28.67 7.26% 392 6.60%1982 110,898 -0.59% 4,871 1.92% 307.89 3.66% 33.16 7.21% 38.09 2.28% 28.98 1.08% 406 3.48%1983 112,175 1.15% 5,079 4.25% 327.89 6.50% 34.39 3.71% 40.21 5.57% 29.81 2.86% 431 6.20%1984 117,421 4.68% 5,430 6.91% 358.46 9.32% 36.99 7.56% 42.42 5.50% 31.90 7.01% 467 8.37%1985 121,044 3.09% 5,720 5.34% 381.33 6.38% 39.18 5.92% 45.13 6.39% 34.06 6.77% 498 6.49%1986 123,644 2.15% 5,966 4.30% 403.37 5.78% 41.25 5.28% 47.94 6.23% 36.40 6.87% 527 5.91%1987 127,139 2.83% 6,053 1.46% 414.27 2.70% 42.89 3.98% 49.75 3.78% 36.50 0.27% 542 2.82%1988 131,235 3.22% 6,344 4.82% 439.91 6.19% 46.57 8.58% 53.29 7.12% 40.10 9.86% 576 6.35%1989 134,039 2.14% 6,562 3.43% 452.55 2.87% 49.31 5.88% 56.73 6.46% 42.45 5.86% 598 3.84%1990 136,272 1.67% 6,710 2.26% 457.36 1.06% 50.76 2.94% 57.91 2.08% 43.28 1.96% 608 1.60%1991 135,549 -0.53% 6,686 -0.36% 457.63 0.06% 49.64 -2.21% 57.90 -0.02% 42.67 -1.41% 609 0.18%1992 136,243 0.51% 6,733 0.71% 457.31 -0.07% 49.94 0.60% 57.29 -1.05% 42.15 -1.22% 606 -0.42%1993 138,864 1.92% 6,974 3.59% 477.17 4.34% 51.31 2.74% 58.68 2.43% 43.07 2.18% 629 3.71%1994 142,480 2.60% 7,213 3.42% 494.29 3.59% 52.24 1.81% 60.27 2.71% 44.65 3.67% 651 3.44%1995 146,258 2.65% 7,482 3.73% 512.14 3.61% 55.02 5.32% 61.47 1.99% 46.99 5.24% 673 3.43%1996 149,540 2.24% 7,742 3.47% 538.06 5.06% 58.43 6.20% 63.54 3.37% 49.15 4.60% 706 4.89%1997 153,127 2.40% 8,023 3.62% 561.18 4.30% 60.51 3.56% 65.08 2.42% 51.57 4.92% 736 4.32%1998 157,087 2.59% 8,325 3.77% 586.38 4.49% 65.58 8.38% 67.19 3.24% 53.57 3.88% 768 4.26%1999 160,291 2.04% 8,582 3.08% 610.67 4.14% 69.04 5.28% 68.28 1.62% 54.57 1.87% 799 4.10%2000 164,275 2.49% 8,861 3.26% 639.90 4.79% 72.17 4.53% 70.61 3.41% 55.32 1.37% 835 4.48%2001 164,564 0.18% 8,988 1.43% 661.21 3.33% 74.32 2.98% 71.96 1.91% 55.69 0.67% 861 3.13%2002 164,061 -0.31% 9,092 1.15% 676.97 2.38% 75.26 1.26% 77.05 7.08% 57.28 2.85% 887 2.96%2003 163,956 -0.06% 9,239 1.61% 690.34 1.98% 79.61 5.77% 75.92 -1.47% 58.49 2.12% 904 2.01%
Forecast: 2004 167,721 2.30% 9,519 3.03% 715.14 3.59% 83.38 4.74% 79.19 4.31% 60.84 4.01% 939 3.78%2005 171,962 2.53% 9,853 3.51% 743.50 3.97% 87.40 4.82% 82.10 3.67% 63.17 3.83% 976 4.01%2006 175,740 2.20% 10,163 3.15% 769.92 3.55% 91.14 4.27% 84.74 3.21% 65.28 3.34% 1,011 3.58%2007 179,593 2.19% 10,481 3.12% 796.66 3.47% 94.96 4.20% 87.42 3.16% 67.45 3.33% 1,046 3.50%2008 183,138 1.97% 10,782 2.88% 821.98 3.18% 98.59 3.82% 89.96 2.90% 69.50 3.03% 1,080 3.20%2009 186,350 1.75% 11,065 2.63% 845.80 2.90% 102.03 3.49% 92.35 2.66% 71.39 2.73% 1,112 2.92%2010 189,618 1.75% 11,354 2.61% 869.87 2.85% 105.42 3.32% 94.76 2.61% 73.32 2.70% 1,143 2.86%2011 192,666 1.61% 11,631 2.44% 892.77 2.63% 108.73 3.13% 97.05 2.41% 75.13 2.48% 1,174 2.65%2012 195,485 1.46% 11,895 2.27% 914.48 2.43% 111.81 2.84% 99.16 2.17% 76.81 2.24% 1,202 2.44%2013 198,350 1.47% 12,163 2.26% 936.33 2.39% 114.92 2.78% 101.34 2.21% 78.56 2.28% 1,231 2.40%2014 201,337 1.51% 12,441 2.28% 958.59 2.38% 118.06 2.73% 103.59 2.22% 80.35 2.27% 1,261 2.39%2015 204,373 1.51% 12,722 2.26% 981.01 2.34% 121.18 2.64% 105.86 2.19% 82.12 2.20% 1,290 2.35%2016 207,165 1.37% 12,989 2.10% 1,002.11 2.15% 124.16 2.46% 107.97 1.99% 83.80 2.06% 1,318 2.16%2017 209,701 1.22% 13,241 1.94% 1,021.89 1.97% 126.95 2.25% 109.92 1.81% 85.37 1.87% 1,344 1.98%2018 211,971 1.08% 13,477 1.78% 1,040.25 1.80% 129.52 2.02% 111.78 1.69% 86.79 1.67% 1,368 1.80%2019 214,631 1.25% 13,738 1.94% 1,060.40 1.94% 132.34 2.18% 113.81 1.82% 88.41 1.87% 1,395 1.95%2020 216,709 0.97% 13,962 1.63% 1,077.50 1.61% 134.73 1.81% 115.50 1.49% 89.73 1.49% 1,417 1.61%2021 219,126 1.12% 14,208 1.77% 1,096.21 1.74% 137.34 1.94% 117.41 1.66% 91.20 1.63% 1,442 1.74%2022 221,574 1.12% 14,458 1.75% 1,115.09 1.72% 139.94 1.89% 119.33 1.63% 92.71 1.65% 1,467 1.73%2023 224,055 1.12% 14,709 1.74% 1,134.24 1.72% 142.59 1.90% 121.26 1.62% 94.22 1.63% 1,492 1.72%2024 226,265 0.99% 14,943 1.59% 1,152.02 1.57% 145.05 1.72% 123.06 1.48% 95.60 1.46% 1,516 1.57%2025 228,502 0.99% 15,180 1.58% 1,170.02 1.56% 147.58 1.74% 124.88 1.48% 97.05 1.52% 1,540 1.57%2026 230,434 0.85% 15,396 1.42% 1,186.53 1.41% 149.92 1.59% 126.49 1.30% 98.31 1.30% 1,561 1.41%2027 232,726 0.99% 15,636 1.56% 1,204.94 1.55% 152.53 1.74% 128.36 1.48% 99.76 1.47% 1,586 1.56%2028 235,051 1.00% 15,879 1.55% 1,223.58 1.55% 155.17 1.73% 130.22 1.45% 101.22 1.47% 1,610 1.55%2029 237,112 0.88% 16,104 1.42% 1,240.91 1.42% 157.67 1.61% 131.90 1.29% 102.59 1.35% 1,633 1.42%2030 239,202 0.88% 16,330 1.41% 1,258.45 1.41% 160.17 1.59% 133.68 1.35% 103.93 1.31% 1,656 1.42%
Average Annual Growth Rate:1967-2003 2.02% 3.83% 5.09% 6.81% 4.78% 4.46% 5.28%2004-2005 2.53% 3.51% 3.97% 4.82% 3.67% 3.83% 4.01%2005-2010 1.97% 2.88% 3.19% 3.82% 2.91% 3.02% 3.21%2010-2015 1.51% 2.30% 2.43% 2.82% 2.24% 2.29% 2.44%2015-2020 1.18% 1.88% 1.89% 2.14% 1.76% 1.79% 1.90%2020-2025 1.07% 1.69% 1.66% 1.84% 1.57% 1.58% 1.67%2025-2030 0.92% 1.47% 1.47% 1.65% 1.37% 1.38% 1.47%2004-2030 1.37% 2.10% 2.20% 2.54% 2.03% 2.08% 2.21%
Source: National Planning Association (NPA).Prepared by: Ricondo & Associates, Inc.
Year
Palm Beach International Airport Market Area Counties
Total Employment (in thousands of jobs)
A-2
WPB310127161368.doc/063000015

Table A-3Households - Historical and Forecast
Total U. S. Growth
(%) FloridaGrowth
(%) Palm BeachGrowth
(%) MartinGrowth
(%) St. LucieGrowth
(%) Indian River Growth
(%) TotalGrowth
(%)
Historical:1967 $59,623 2,018 105.91 8.67 15.20 10.97 1411968 $61,155 2.57% 2,115 4.81% 111.12 4.92% 9.12 5.19% 15.60 2.63% 11.47 4.56% 147 4.66%1969 $62,516 2.23% 2,207 4.36% 117.55 5.79% 9.60 5.26% 16.29 4.42% 11.93 4.01% 155 5.47%1970 $63,783 2.03% 2,295 3.98% 124.03 5.51% 10.18 6.04% 16.95 4.05% 12.37 3.69% 164 5.25%1971 $65,245 2.29% 2,423 5.57% 131.89 6.34% 11.15 9.53% 17.84 5.25% 12.94 4.61% 174 6.29%1972 $67,062 2.78% 2,586 6.72% 141.38 7.20% 12.65 13.45% 18.69 4.76% 14.19 9.66% 187 7.53%1973 $68,644 2.36% 2,666 3.09% 156.61 10.77% 15.02 18.74% 21.22 13.54% 15.47 9.02% 208 11.45%1974 $70,165 2.22% 2,941 10.31% 169.35 8.13% 17.28 15.05% 22.91 7.96% 16.40 6.01% 226 8.46%1975 $71,548 1.97% 3,050 3.71% 177.98 5.10% 18.28 5.79% 24.02 4.85% 17.10 4.27% 237 5.06%1976 $73,176 2.28% 3,145 3.10% 185.24 4.08% 19.18 4.92% 25.15 4.70% 17.63 3.10% 247 4.14%1977 $75,004 2.50% 3,262 3.74% 192.71 4.03% 20.36 6.15% 26.35 4.77% 18.74 6.30% 258 4.43%1978 $76,853 2.47% 3,398 4.18% 202.73 5.20% 22.14 8.74% 27.78 5.43% 20.04 6.94% 273 5.63%1979 $78,796 2.53% 3,575 5.20% 218.61 7.83% 24.16 9.12% 29.85 7.45% 22.06 10.08% 295 8.06%1980 $80,738 2.46% 3,785 5.86% 236.88 8.36% 26.14 8.20% 32.86 10.08% 23.58 6.89% 319 8.41%1981 $82,131 1.73% 3,948 4.31% 252.96 6.79% 27.85 6.54% 35.61 8.37% 25.16 6.70% 342 6.92%1982 $82,948 0.99% 4,059 2.81% 263.74 4.26% 29.58 6.21% 37.90 6.43% 26.73 6.24% 358 4.79%1983 $83,644 0.84% 4,165 2.61% 272.65 3.38% 30.88 4.39% 39.73 4.83% 28.02 4.83% 371 3.72%1984 $85,202 1.86% 4,325 3.84% 286.82 5.20% 32.59 5.54% 42.21 6.24% 29.83 6.46% 391 5.43%1985 $86,552 1.58% 4,473 3.42% 301.00 4.94% 34.15 4.79% 44.31 4.98% 31.01 3.96% 410 4.86%1986 $87,743 1.38% 4,608 3.02% 314.86 4.60% 35.87 5.04% 46.51 4.97% 32.43 4.58% 430 4.68%1987 $88,855 1.27% 4,748 3.04% 329.20 4.55% 37.94 5.77% 49.03 5.42% 33.64 3.73% 450 4.69%1988 $90,232 1.55% 4,886 2.91% 343.63 4.38% 39.62 4.43% 51.62 5.28% 35.05 4.19% 470 4.47%1989 $91,483 1.39% 5,033 3.01% 356.82 3.84% 41.46 4.64% 54.75 6.06% 36.88 5.22% 490 4.25%1990 $92,624 1.25% 5,184 2.99% 368.93 3.39% 43.54 5.02% 59.12 7.98% 38.50 4.39% 510 4.12%1991 $93,945 1.43% 5,320 2.63% 380.12 3.03% 44.89 3.10% 61.41 3.87% 39.65 2.99% 526 3.13%1992 $95,397 1.55% 5,431 2.10% 391.53 3.00% 45.73 1.87% 63.54 3.47% 40.82 2.95% 542 2.96%1993 $96,772 1.44% 5,542 2.03% 404.18 3.23% 47.06 2.91% 65.57 3.19% 41.61 1.94% 558 3.10%1994 $98,075 1.35% 5,664 2.21% 416.79 3.12% 48.34 2.72% 67.74 3.31% 42.70 2.62% 576 3.07%1995 $99,365 1.32% 5,780 2.06% 427.37 2.54% 49.33 2.05% 69.32 2.33% 43.73 2.41% 590 2.46%1996 $100,640 1.28% 5,903 2.11% 438.00 2.49% 50.81 3.00% 71.20 2.71% 44.56 1.90% 605 2.51%1997 $101,962 1.31% 6,033 2.22% 450.13 2.77% 52.15 2.64% 73.07 2.63% 45.87 2.94% 621 2.75%1998 $103,250 1.26% 6,151 1.94% 460.65 2.34% 53.75 3.07% 74.44 1.87% 47.16 2.81% 636 2.38%1999 $104,599 1.31% 6,259 1.77% 469.28 1.87% 54.89 2.12% 75.83 1.87% 48.33 2.48% 648 1.94%2000 $105,980 1.32% 6,381 1.94% 477.37 1.72% 55.61 1.31% 77.45 2.14% 49.47 2.36% 660 1.78%2001 $107,384 1.32% 6,546 2.58% 491.51 2.96% 57.22 2.90% 80.36 3.76% 51.01 3.11% 680 3.06%2002 $108,777 1.30% 6,667 1.86% 504.47 2.64% 59.21 3.48% 82.91 3.17% 52.31 2.55% 699 2.76%2003 $110,147 1.26% 6,791 1.86% 517.46 2.57% 61.22 3.39% 85.48 3.10% 53.61 2.49% 718 2.70%
Forecast: 2004 $111,298 1.05% 6,936 2.13% 531.18 2.65% 63.32 3.43% 88.17 3.15% 54.99 2.57% 738 2.77%2005 $112,666 1.23% 7,093 2.27% 545.86 2.76% 65.53 3.49% 91.03 3.24% 56.47 2.69% 759 2.88%2006 $114,053 1.23% 7,253 2.26% 560.55 2.69% 67.75 3.39% 93.88 3.13% 57.95 2.62% 780 2.80%2007 $115,461 1.23% 7,416 2.24% 575.27 2.63% 69.96 3.26% 96.73 3.04% 59.43 2.55% 801 2.73%2008 $116,889 1.24% 7,580 2.22% 590.04 2.57% 72.18 3.17% 99.59 2.96% 60.92 2.51% 823 2.66%2009 $118,260 1.17% 7,741 2.12% 604.44 2.44% 74.36 3.02% 102.39 2.81% 62.37 2.38% 844 2.53%2010 $119,653 1.18% 7,904 2.10% 618.87 2.39% 76.53 2.92% 105.19 2.73% 63.83 2.34% 864 2.47%2011 $121,068 1.18% 8,068 2.08% 633.33 2.34% 78.71 2.85% 109.99 4.56% 65.29 2.29% 887 2.65%2012 $122,504 1.19% 8,235 2.06% 647.85 2.29% 80.88 2.76% 110.79 0.73% 66.75 2.24% 906 2.14%2013 $123,964 1.19% 7,403 -10.10% 662.41 2.25% 83.06 2.70% 113.60 2.54% 68.22 2.20% 927 2.32%2014 $125,491 1.23% 8,577 15.85% 677.27 2.24% 85.27 2.66% 116.45 2.51% 69.72 2.20% 949 2.31%2015 $127,043 1.24% 8,753 2.05% 692.20 2.20% 87.49 2.60% 119.32 2.46% 71.23 2.17% 970 2.27%2016 $128,619 1.24% 8,930 2.03% 707.21 2.17% 89.71 2.54% 122.19 2.41% 72.75 2.13% 992 2.23%2017 $130,218 1.24% 9,111 2.02% 722.30 2.13% 91.94 2.49% 125.07 2.36% 74.28 2.10% 1,014 2.19%2018 $131,843 1.25% 9,293 2.00% 737.48 2.10% 94.17 2.43% 127.97 2.32% 75.81 2.06% 1,035 2.15%2019 $133,525 1.28% 9,480 2.01% 752.94 2.10% 96.44 2.41% 130.90 2.29% 77.38 2.07% 1,058 2.15%2020 $135,233 1.28% 9,669 2.00% 768.50 2.07% 98.71 2.35% 133.85 2.25% 78.96 2.04% 1,080 2.11%2021 $136,968 1.28% 9,861 1.98% 784.17 2.04% 100.99 2.31% 136.81 2.21% 80.55 2.01% 1,103 2.08%2022 $138,729 1.29% 10,055 1.97% 799.97 2.01% 103.28 2.27% 139.80 2.19% 82.15 1.99% 1,125 2.06%2023 $140,517 1.29% 10,252 1.96% 815.90 1.99% 105.59 2.24% 142.80 2.15% 83.76 1.96% 1,148 2.03%2024 $142,347 1.30% 10,453 1.95% 832.03 1.98% 107.92 2.21% 145.83 2.12% 85.40 1.96% 1,171 2.01%2025 $144,207 1.31% 10,656 1.94% 848.31 1.96% 110.26 2.17% 148.88 2.09% 87.05 1.93% 1,195 1.99%2026 $146,097 1.31% 10,862 1.93% 864.76 1.94% 112.62 2.14% 151.96 2.07% 88.72 1.92% 1,218 1.97%2027 $148,020 1.32% 11,071 1.93% 881.37 1.92% 114.99 2.10% 155.06 2.04% 90.41 1.90% 1,242 1.95%2028 $149,976 1.32% 11,283 1.92% 898.17 1.91% 117.39 2.09% 158.20 2.03% 92.11 1.88% 1,266 1.94%2029 $152,000 1.35% 11,501 1.93% 915.46 1.93% 119.85 2.10% 161.42 2.04% 93.87 1.91% 1,291 1.95%2030 $154,061 1.36% 11,723 1.93% 933.07 1.92% 122.37 2.10% 164.71 2.04% 95.66 1.91% 1,316 1.95%
Average Annual Growth Rate:1967-2003 1.72% 3.43% 4.51% 5.58% 4.91% 4.51% 4.63%2004-2005 1.23% 2.27% 2.76% 3.49% 3.24% 2.69% 2.88%2005-2010 1.21% 2.19% 2.54% 3.15% 2.93% 2.48% 2.64%2010-2015 1.21% 2.06% 2.26% 2.71% 2.55% 2.22% 2.34%2015-2020 1.26% 2.01% 2.11% 2.44% 2.32% 2.08% 2.17%2020-2025 1.29% 1.96% 2.00% 2.24% 2.15% 1.97% 2.04%2025-2030 1.33% 1.93% 1.92% 2.11% 2.04% 1.90% 1.95%2004-2030 1.26% 2.04% 2.19% 2.57% 2.43% 2.15% 2.25%
Source: National Planning Association (NPA).Prepared by: Ricondo & Associates, Inc.
Year
Palm Beach International Airport Market Area Counties
Households (Thousands)
A-3
WPB310127161368.doc/063000015

Table A-4Personal Income Per Capita - Historical and Forecast
Total U. S. Growth
(%) FloridaGrowth
(%) Palm BeachGrowth
(%) MartinGrowth
(%) St. LucieGrowth
(%) Indian River Growth
(%) TotalGrowth
(%)
Historical:1967 $13,464 $12,115 13,815 $11,399 $10,043 $12,472 $47,7291968 $14,073 4.52% $13,030 7.55% $14,972 8.37% $12,873 12.94% $10,926 8.79% $12,936 3.71% $51,706 8.33%1969 $15,376 9.26% $14,624 12.23% $17,662 17.97% $16,601 28.96% $13,035 19.31% $14,750 14.02% $62,048 20.00%1970 $15,631 1.66% $15,292 4.57% $18,707 5.92% $17,974 8.27% $13,301 2.04% $15,455 4.79% $65,437 5.46%1971 $15,917 1.83% $15,691 2.61% $19,318 3.26% $18,911 5.21% $13,840 4.05% $16,778 8.55% $68,846 5.21%1972 $16,705 4.95% $16,634 6.01% $20,485 6.04% $20,003 5.78% $15,404 11.30% $18,074 7.72% $73,966 7.44%1973 $17,589 5.29% $17,564 5.59% $21,267 3.82% $20,327 1.62% $15,564 1.03% $19,156 5.99% $76,314 3.17%1974 $17,403 -1.06% $17,090 -2.70% $20,887 -1.79% $18,837 -7.33% $14,956 -3.91% $18,588 -2.96% $73,269 -3.99%1975 $17,310 -0.54% $16,578 -2.99% $20,044 -4.04% $18,729 -0.57% $14,477 -3.20% $17,777 -4.37% $71,027 -3.06%1976 $18,018 4.09% $17,004 2.57% $20,922 4.38% $19,963 6.59% $15,046 3.93% $19,137 7.66% $75,069 5.69%1977 $18,565 3.04% $17,535 3.12% $21,858 4.47% $20,985 5.12% $15,561 3.42% $19,831 3.62% $78,235 4.22%1978 $19,358 4.27% $18,495 5.48% $23,489 7.46% $22,289 6.21% $16,487 5.95% $21,263 7.22% $83,528 6.77%1979 $19,801 2.29% $19,048 2.99% $24,627 4.85% $22,934 2.90% $17,330 5.12% $21,530 1.25% $86,422 3.46%1980 $19,716 -0.43% $19,454 2.13% $25,444 3.32% $24,925 8.68% $18,222 5.15% $22,269 3.43% $90,860 5.14%1981 $20,069 1.79% $19,918 2.39% $26,826 5.43% $25,617 2.78% $17,600 -3.41% $23,499 5.52% $93,542 2.95%1982 $20,039 -0.15% $19,852 -0.33% $26,634 -0.71% $25,469 -0.58% $17,478 -0.70% $22,155 -5.72% $91,736 -1.93%1983 $20,274 1.17% $20,408 2.80% $28,181 5.81% $26,011 2.13% $18,214 4.21% $22,753 2.70% $95,159 3.73%1984 $21,532 6.20% $21,438 5.05% $29,621 5.11% $27,444 5.51% $17,414 -4.39% $23,971 5.35% $98,450 3.46%1985 $22,142 2.84% $22,142 3.29% $31,156 5.18% $29,139 6.17% $17,859 2.55% $25,706 7.24% $103,860 5.49%1986 $22,633 2.22% $22,671 2.39% $31,904 2.40% $29,952 2.79% $18,472 3.44% $26,663 3.72% $106,992 3.02%1987 $23,059 1.88% $23,244 2.53% $33,415 4.74% $31,124 3.91% $118,825 543.25% $28,326 6.24% $211,690 97.86%1988 $23,716 2.85% $23,975 3.14% $35,009 4.77% $33,706 8.30% $20,551 -82.71% $30,787 8.69% $120,052 -43.29%1989 $24,244 2.23% $24,870 3.73% $36,652 4.69% $36,661 8.77% $20,569 0.09% $31,547 2.47% $125,429 4.48%1990 $24,432 0.78% $24,757 -0.45% $37,632 2.67% $37,697 2.83% $19,639 -4.52% $32,080 1.69% $127,048 1.29%1991 $24,073 -1.47% $24,127 -2.54% $37,871 0.63% $36,183 -4.02% $18,983 -3.34% $31,837 -0.76% $124,874 -1.71%1992 $24,455 1.59% $23,849 -1.16% $37,438 -1.14% $35,807 -1.04% $18,719 -1.39% $31,457 -1.19% $123,421 -1.16%1993 $24,546 0.37% $24,296 1.88% $37,012 -1.14% $35,436 -1.04% $18,701 -0.10% $30,997 -1.47% $122,146 -1.03%1994 $24,954 1.66% $24,467 0.70% $36,885 -0.34% $35,038 -1.12% $19,005 1.63% $31,575 1.87% $122,503 0.29%1995 $25,392 1.75% $25,050 2.38% $37,882 2.70% $36,985 5.56% $19,792 4.14% $33,144 4.97% $127,803 4.33%1996 $25,943 2.17% $25,558 2.03% $38,867 2.60% $37,670 1.85% $20,138 1.75% $34,155 3.05% $130,829 2.37%1997 $26,647 2.71% $26,079 2.04% $39,096 0.59% $38,752 2.87% $20,645 2.52% $35,125 2.84% $133,617 2.13%1998 $27,908 4.73% $27,143 4.08% $40,652 3.98% $40,229 3.81% $21,296 3.15% $36,160 2.95% $138,335 3.53%1999 $28,457 1.97% $27,536 1.45% $41,002 0.86% $41,061 2.07% $21,426 0.61% $36,642 1.33% $140,131 1.30%2000 $29,632 4.13% $28,235 2.54% $41,752 1.83% $41,501 1.07% $22,158 3.41% $36,703 0.17% $142,114 1.41%2001 $29,693 0.21% $28,359 0.44% $42,591 2.01% $41,419 -0.20% $22,342 0.83% $36,437 -0.73% $142,790 0.48%2002 $29,882 0.64% $28,771 1.45% $42,657 0.15% $42,899 3.57% $22,680 1.51% $38,509 5.69% $146,745 2.77%2003 $29,735 -0.49% $28,279 -1.71% $41,196 -3.43% $40,633 -5.28% $22,261 -1.85% $35,045 -9.00% $139,135 -5.19%
Forecast: 2004 $31,146 4.74% $29,689 4.99% $42,615 3.44% $40,937 0.75% $23,887 7.30% $36,232 3.39% $143,670 3.26%2005 $32,175 3.30% $30,580 3.00% $43,515 2.11% $41,709 1.88% $24,695 3.38% $36,906 1.86% $146,825 2.20%2006 $33,099 2.87% $31,431 2.78% $44,379 1.99% $42,461 1.80% $25,468 3.13% $37,581 1.83% $149,890 2.09%2007 $34,014 2.76% $32,285 2.72% $45,244 1.95% $43,223 1.79% $26,252 3.08% $38,263 1.81% $152,982 2.06%2008 $34,845 2.44% $33,059 2.40% $45,989 1.65% $43,868 1.49% $26,975 2.75% $38,845 1.52% $155,677 1.76%2009 $35,608 2.19% $33,773 2.16% $46,649 1.43% $44,421 1.26% $27,661 2.54% $39,354 1.31% $158,084 1.55%2010 $36,351 2.09% $34,478 2.09% $47,291 1.38% $44,959 1.21% $28,353 2.50% $39,849 1.26% $160,452 1.50%2011 $37,019 1.84% $35,111 1.84% $47,834 1.15% $45,400 0.98% $28,992 2.25% $40,265 1.04% $162,491 1.27%2012 $37,644 1.69% $35,704 1.69% $48,322 1.02% $45,791 0.86% $29,600 2.10% $40,633 0.91% $164,346 1.14%2013 $38,280 1.69% $36,313 1.70% $48,831 1.05% $46,203 0.90% $30,223 2.11% $41,027 0.97% $166,284 1.18%2014 $38,926 1.69% $36,931 1.70% $49,352 1.07% $46,623 0.91% $30,856 2.09% $41,429 0.98% $168,260 1.19%2015 $39,582 1.69% $37,559 1.70% $49,885 1.08% $47,056 0.93% $31,496 2.08% $41,844 1.00% $170,282 1.20%2016 $40,192 1.54% $38,144 1.56% $50,364 0.96% $47,437 0.81% $32,101 1.92% $42,214 0.88% $172,116 1.08%2017 $40,754 1.40% $38,683 1.41% $50,785 0.84% $47,763 0.69% $32,667 1.76% $42,542 0.78% $173,758 0.95%2018 $41,265 1.25% $39,174 1.27% $51,150 0.72% $48,043 0.59% $33,190 1.60% $42,822 0.66% $175,206 0.83%2019 $41,842 1.40% $39,727 1.41% $51,595 0.87% $48,392 0.73% $33,766 1.74% $43,169 0.81% $176,922 0.98%2020 $42,307 1.11% $40,174 1.13% $51,912 0.61% $48,626 0.48% $34,248 1.43% $43,411 0.56% $178,196 0.72%2021 $42,837 1.25% $40,683 1.27% $52,309 0.77% $48,934 0.63% $34,782 1.56% $43,721 0.71% $179,746 0.87%2022 $43,374 1.25% $41,198 1.27% $52,719 0.78% $49,258 0.66% $35,320 1.55% $44,041 0.73% $181,336 0.88%2023 $43,918 1.25% $41,719 1.26% $53,142 0.80% $49,594 0.68% $35,861 1.53% $44,371 0.75% $182,968 0.90%2024 $44,406 1.11% $42,186 1.12% $53,506 0.69% $49,881 0.58% $36,353 1.37% $44,651 0.63% $184,390 0.78%2025 $44,899 1.11% $42,658 1.12% $53,882 0.70% $50,181 0.60% $36,847 1.36% $44,938 0.64% $185,848 0.79%2026 $45,332 0.96% 43,072 0.97% $54,196 0.58% $50,428 0.49% $37,288 1.20% $45,176 0.53% $187,088 0.67%2027 $45,834 1.11% 43,552 1.11% $54,596 0.74% $50,756 0.65% $37,785 1.33% $45,480 0.67% $188,617 0.82%2028 $46,342 1.11% 44,036 1.11% $55,006 0.75% $51,097 0.67% $38,283 1.32% $45,794 0.69% $190,181 0.83%2029 $46,787 0.96% 44,461 0.97% $55,349 0.62% $51,380 0.55% $38,726 1.16% $46,054 0.57% $191,508 0.70%2030 $47,236 0.96% 44,889 0.96% $55,700 0.63% $51,666 0.56% $39,166 1.14% $46,316 0.57% $192,849 0.70%
Average Annual Growth Rate:1967-2003 2.23% 2.38% 3.08% 3.59% 2.24% 2.91% 3.02%2004-2005 3.30% 3.00% 2.11% 1.88% 3.38% 1.86% 2.20%2005-2010 2.47% 2.43% 1.68% 1.51% 2.80% 1.55% 1.79%2010-2015 1.72% 1.73% 1.07% 0.92% 2.13% 0.98% 1.20%2015-2020 1.34% 1.36% 0.80% 0.66% 1.69% 0.74% 0.91%2020-2025 1.20% 1.21% 0.75% 0.63% 1.47% 0.69% 0.84%2025-2030 1.02% 1.02% 0.67% 0.58% 1.23% 0.61% 0.74%2004-2030 1.61% 1.60% 1.04% 0.90% 1.92% 0.95% 1.14%
Source: National Planning Association (NPA).Prepared by: Ricondo & Associates, Inc.
Year
Palm Beach International Airport Market Area Counties
Personal Income Per Capita (2000 Dollars)
A-4
WPB310127161368.doc/063000015

Appendix B: Multiple and Single Regression Analyses
WPB310127161368.doc/063000015


Table B-1Projected O&D Enplanements = (Population*X1)+(Personal Income Per Capita*X2)+Coeff.
Historical Forecast PBI PBIYear Enplanements Enplanements Growth Rate Market Area Growth Rate Market Area Growth Rate1988 2,518,739 - 1,126.55 - $32,866 -1989 2,583,523 2.57% 1,168.86 3.76% $34,319 4.42%1990 2,856,757 10.58% 1,217.38 4.15% $34,966 1.88%1991 2,541,922 -11.02% 1,255.58 3.14% $34,901 -0.19%1992 2,534,978 -0.27% 1,292.19 2.92% $34,497 -1.16%1993 2,544,757 0.39% 1,331.82 3.07% $34,136 -1.05%1994 2,801,615 10.09% 1,372.88 3.08% $34,097 -0.11%1995 2,729,122 -2.59% 1,406.24 2.43% $35,198 3.23%1996 2,852,014 4.50% 1,441.67 2.52% $36,086 2.52%1997 2,917,014 2.28% 1,480.92 2.72% $36,483 1.10%1998 2,965,253 1.65% 1,516.26 2.39% $37,901 3.89%1999 2,879,246 -2.90% 1,544.51 1.86% $38,281 1.00%2000 2,932,635 1.85% 1,570.12 1.66% $38,952 1.75%2001 2,978,763 1.57% 1,603.84 2.15% $39,551 1.54%2002 2,748,181 -7.74% 1,643.32 2.46% $39,884 0.84%2003 3,011,973 9.60% 1,685.31 2.56% $38,313 -3.94%2004 3,280,291 8.91% 1,727.96 2.53% $39,678 3.56%2005 3,122,074 -4.82% 1,774.05 2.67% $40,532 2.15%2006 3,168,360 1.48% 1,819.98 2.59% $41,355 2.03%2007 3,214,613 1.46% 1,865.81 2.52% $42,180 2.00%2008 3,259,493 1.40% 1,911.61 2.45% $42,896 1.70%2009 3,302,312 1.31% 1,956.02 2.32% $43,532 1.48%2010 3,344,876 1.29% 2,000.31 2.26% $44,155 1.43%2011 3,386,265 1.24% 2,044.52 2.21% $44,687 1.20%2012 3,426,989 1.20% 2,088.68 2.16% $45,168 1.08%2013 3,467,932 1.19% 2,132.79 2.11% $45,670 1.11%2014 3,509,617 1.20% 2,177.66 2.10% $46,183 1.12%2015 3,551,472 1.19% 2,222.57 2.06% $46,709 1.14%2016 3,592,726 1.16% 2,267.50 2.02% $47,183 1.02%2017 3,633,385 1.13% 2,312.49 1.98% $47,604 0.89%2018 3,673,428 1.10% 2,357.53 1.95% $47,973 0.77%2019 3,714,934 1.13% 2,403.26 1.94% $48,416 0.92%2020 3,755,069 1.08% 2,449.13 1.91% $48,738 0.67%2021 3,796,228 1.10% 2,495.12 1.88% $49,135 0.82%2022 3,837,654 1.09% 2,541.27 1.85% $49,545 0.83%2023 3,879,395 1.09% 2,587.63 1.82% $49,966 0.85%2024 3,920,786 1.07% 2,634.42 1.81% $50,332 0.73%2025 3,962,508 1.06% 2,681.45 1.79% $50,708 0.75%
0.90%R-Square: 0.8120
Note:
Sources: Airport Management Records; FAA Aerospace Forecasts FY 2005-2016; Ricondo & Associates, Inc.Prepared by: Ricondo & Associates, Inc., May 2005
Average Annual Growth Rate 2004-2025:
1/ National Planning Association (NPA)
Total Population (in Thousands) 1/ Personal Income Per Capita 1/
B-1
WPB310127161368.doc/063000015
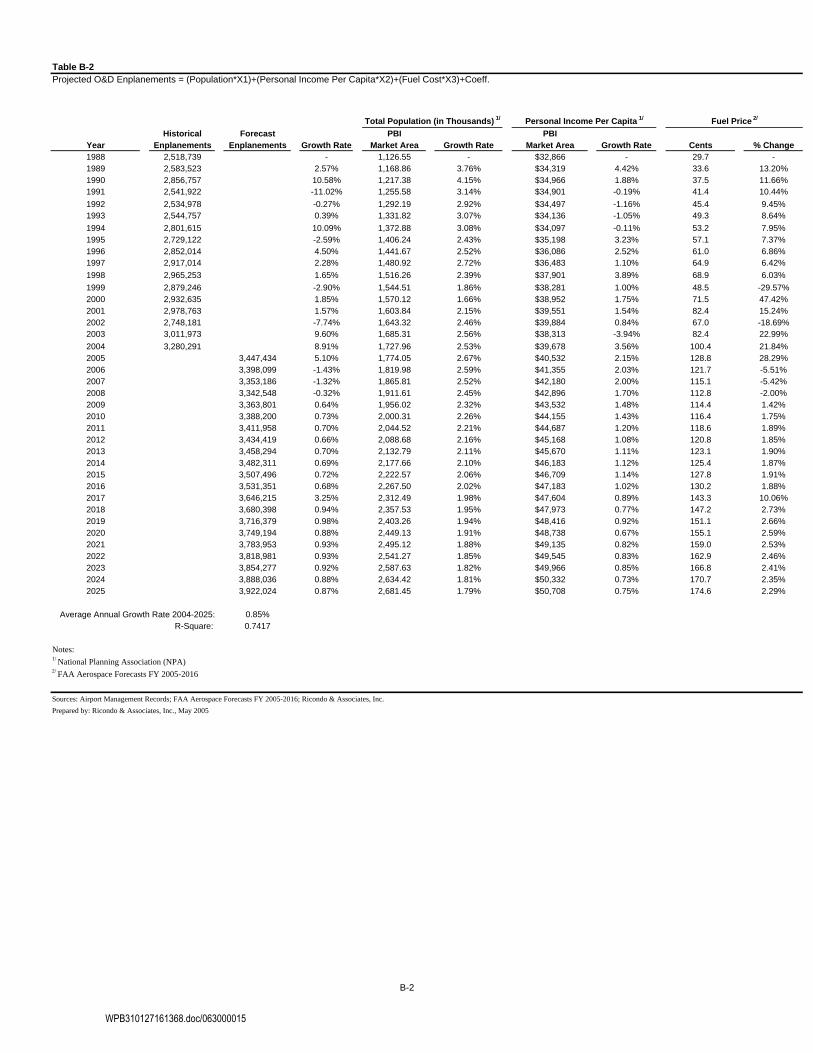
Table B-2Projected O&D Enplanements = (Population*X1)+(Personal Income Per Capita*X2)+(Fuel Cost*X3)+Coeff.
Historical Forecast PBI PBIYear Enplanements Enplanements Growth Rate Market Area Growth Rate Market Area Growth Rate Cents % Change1988 2,518,739 - 1,126.55 - $32,866 - 29.7 -1989 2,583,523 2.57% 1,168.86 3.76% $34,319 4.42% 33.6 13.20%1990 2,856,757 10.58% 1,217.38 4.15% $34,966 1.88% 37.5 11.66%1991 2,541,922 -11.02% 1,255.58 3.14% $34,901 -0.19% 41.4 10.44%1992 2,534,978 -0.27% 1,292.19 2.92% $34,497 -1.16% 45.4 9.45%1993 2,544,757 0.39% 1,331.82 3.07% $34,136 -1.05% 49.3 8.64%1994 2,801,615 10.09% 1,372.88 3.08% $34,097 -0.11% 53.2 7.95%1995 2,729,122 -2.59% 1,406.24 2.43% $35,198 3.23% 57.1 7.37%1996 2,852,014 4.50% 1,441.67 2.52% $36,086 2.52% 61.0 6.86%1997 2,917,014 2.28% 1,480.92 2.72% $36,483 1.10% 64.9 6.42%1998 2,965,253 1.65% 1,516.26 2.39% $37,901 3.89% 68.9 6.03%1999 2,879,246 -2.90% 1,544.51 1.86% $38,281 1.00% 48.5 -29.57%2000 2,932,635 1.85% 1,570.12 1.66% $38,952 1.75% 71.5 47.42%2001 2,978,763 1.57% 1,603.84 2.15% $39,551 1.54% 82.4 15.24%2002 2,748,181 -7.74% 1,643.32 2.46% $39,884 0.84% 67.0 -18.69%2003 3,011,973 9.60% 1,685.31 2.56% $38,313 -3.94% 82.4 22.99%2004 3,280,291 8.91% 1,727.96 2.53% $39,678 3.56% 100.4 21.84%2005 3,447,434 5.10% 1,774.05 2.67% $40,532 2.15% 128.8 28.29%2006 3,398,099 -1.43% 1,819.98 2.59% $41,355 2.03% 121.7 -5.51%2007 3,353,186 -1.32% 1,865.81 2.52% $42,180 2.00% 115.1 -5.42%2008 3,342,548 -0.32% 1,911.61 2.45% $42,896 1.70% 112.8 -2.00%2009 3,363,801 0.64% 1,956.02 2.32% $43,532 1.48% 114.4 1.42%2010 3,388,200 0.73% 2,000.31 2.26% $44,155 1.43% 116.4 1.75%2011 3,411,958 0.70% 2,044.52 2.21% $44,687 1.20% 118.6 1.89%2012 3,434,419 0.66% 2,088.68 2.16% $45,168 1.08% 120.8 1.85%2013 3,458,294 0.70% 2,132.79 2.11% $45,670 1.11% 123.1 1.90%2014 3,482,311 0.69% 2,177.66 2.10% $46,183 1.12% 125.4 1.87%2015 3,507,496 0.72% 2,222.57 2.06% $46,709 1.14% 127.8 1.91%2016 3,531,351 0.68% 2,267.50 2.02% $47,183 1.02% 130.2 1.88%2017 3,646,215 3.25% 2,312.49 1.98% $47,604 0.89% 143.3 10.06%2018 3,680,398 0.94% 2,357.53 1.95% $47,973 0.77% 147.2 2.73%2019 3,716,379 0.98% 2,403.26 1.94% $48,416 0.92% 151.1 2.66%2020 3,749,194 0.88% 2,449.13 1.91% $48,738 0.67% 155.1 2.59%2021 3,783,953 0.93% 2,495.12 1.88% $49,135 0.82% 159.0 2.53%2022 3,818,981 0.93% 2,541.27 1.85% $49,545 0.83% 162.9 2.46%2023 3,854,277 0.92% 2,587.63 1.82% $49,966 0.85% 166.8 2.41%2024 3,888,036 0.88% 2,634.42 1.81% $50,332 0.73% 170.7 2.35%2025 3,922,024 0.87% 2,681.45 1.79% $50,708 0.75% 174.6 2.29%
0.85%R-Square: 0.7417
Notes:
Sources: Airport Management Records; FAA Aerospace Forecasts FY 2005-2016; Ricondo & Associates, Inc.Prepared by: Ricondo & Associates, Inc., May 2005
Personal Income Per Capita 1/ Fuel Price 2/Total Population (in Thousands) 1/
2/ FAA Aerospace Forecasts FY 2005-2016
Average Annual Growth Rate 2004-2025:
1/ National Planning Association (NPA)
B-2
WPB310127161368.doc/063000015
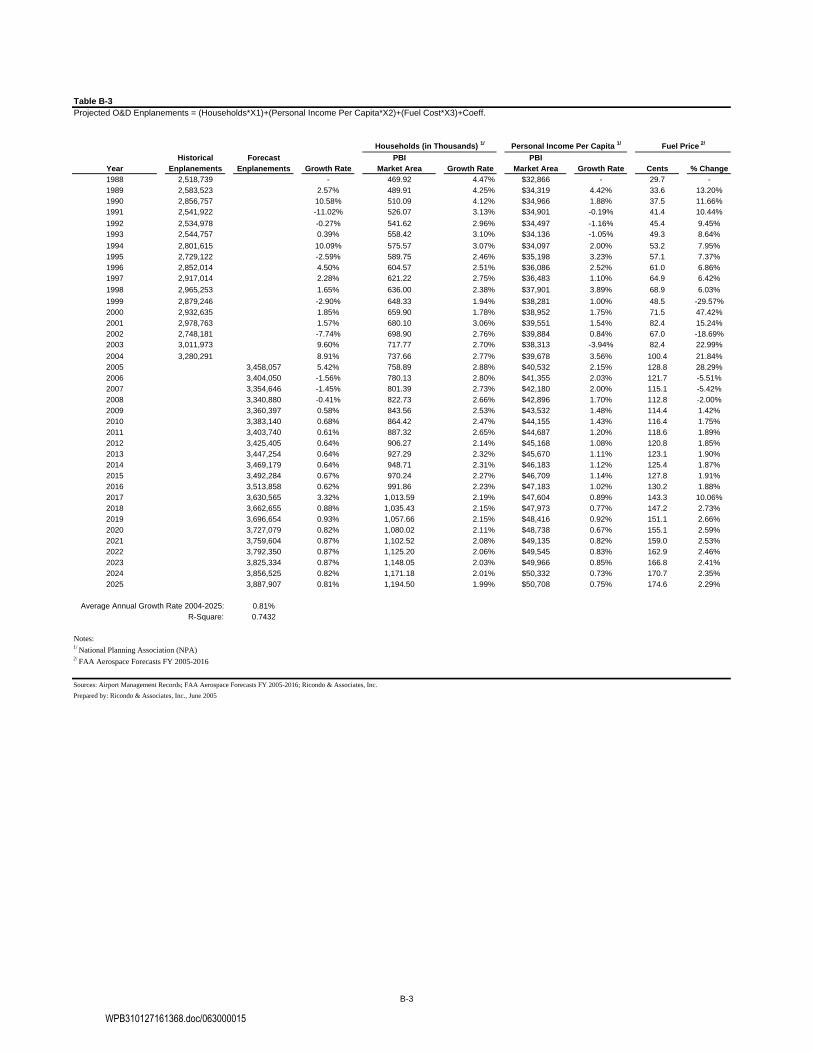
Table B-3Projected O&D Enplanements = (Households*X1)+(Personal Income Per Capita*X2)+(Fuel Cost*X3)+Coeff.
Historical Forecast PBI PBIYear Enplanements Enplanements Growth Rate Market Area Growth Rate Market Area Growth Rate Cents % Change1988 2,518,739 - 469.92 4.47% $32,866 - 29.7 -1989 2,583,523 2.57% 489.91 4.25% $34,319 4.42% 33.6 13.20%1990 2,856,757 10.58% 510.09 4.12% $34,966 1.88% 37.5 11.66%1991 2,541,922 -11.02% 526.07 3.13% $34,901 -0.19% 41.4 10.44%1992 2,534,978 -0.27% 541.62 2.96% $34,497 -1.16% 45.4 9.45%1993 2,544,757 0.39% 558.42 3.10% $34,136 -1.05% 49.3 8.64%1994 2,801,615 10.09% 575.57 3.07% $34,097 2.00% 53.2 7.95%1995 2,729,122 -2.59% 589.75 2.46% $35,198 3.23% 57.1 7.37%1996 2,852,014 4.50% 604.57 2.51% $36,086 2.52% 61.0 6.86%1997 2,917,014 2.28% 621.22 2.75% $36,483 1.10% 64.9 6.42%1998 2,965,253 1.65% 636.00 2.38% $37,901 3.89% 68.9 6.03%1999 2,879,246 -2.90% 648.33 1.94% $38,281 1.00% 48.5 -29.57%2000 2,932,635 1.85% 659.90 1.78% $38,952 1.75% 71.5 47.42%2001 2,978,763 1.57% 680.10 3.06% $39,551 1.54% 82.4 15.24%2002 2,748,181 -7.74% 698.90 2.76% $39,884 0.84% 67.0 -18.69%2003 3,011,973 9.60% 717.77 2.70% $38,313 -3.94% 82.4 22.99%2004 3,280,291 8.91% 737.66 2.77% $39,678 3.56% 100.4 21.84%2005 3,458,057 5.42% 758.89 2.88% $40,532 2.15% 128.8 28.29%2006 3,404,050 -1.56% 780.13 2.80% $41,355 2.03% 121.7 -5.51%2007 3,354,646 -1.45% 801.39 2.73% $42,180 2.00% 115.1 -5.42%2008 3,340,880 -0.41% 822.73 2.66% $42,896 1.70% 112.8 -2.00%2009 3,360,397 0.58% 843.56 2.53% $43,532 1.48% 114.4 1.42%2010 3,383,140 0.68% 864.42 2.47% $44,155 1.43% 116.4 1.75%2011 3,403,740 0.61% 887.32 2.65% $44,687 1.20% 118.6 1.89%2012 3,425,405 0.64% 906.27 2.14% $45,168 1.08% 120.8 1.85%2013 3,447,254 0.64% 927.29 2.32% $45,670 1.11% 123.1 1.90%2014 3,469,179 0.64% 948.71 2.31% $46,183 1.12% 125.4 1.87%2015 3,492,284 0.67% 970.24 2.27% $46,709 1.14% 127.8 1.91%2016 3,513,858 0.62% 991.86 2.23% $47,183 1.02% 130.2 1.88%2017 3,630,565 3.32% 1,013.59 2.19% $47,604 0.89% 143.3 10.06%2018 3,662,655 0.88% 1,035.43 2.15% $47,973 0.77% 147.2 2.73%2019 3,696,654 0.93% 1,057.66 2.15% $48,416 0.92% 151.1 2.66%2020 3,727,079 0.82% 1,080.02 2.11% $48,738 0.67% 155.1 2.59%2021 3,759,604 0.87% 1,102.52 2.08% $49,135 0.82% 159.0 2.53%2022 3,792,350 0.87% 1,125.20 2.06% $49,545 0.83% 162.9 2.46%2023 3,825,334 0.87% 1,148.05 2.03% $49,966 0.85% 166.8 2.41%2024 3,856,525 0.82% 1,171.18 2.01% $50,332 0.73% 170.7 2.35%2025 3,887,907 0.81% 1,194.50 1.99% $50,708 0.75% 174.6 2.29%
0.81%R-Square: 0.7432
Notes:
Sources: Airport Management Records; FAA Aerospace Forecasts FY 2005-2016; Ricondo & Associates, Inc.Prepared by: Ricondo & Associates, Inc., June 2005
Households (in Thousands) 1/ Personal Income Per Capita 1/ Fuel Price 2/
Average Annual Growth Rate 2004-2025:
2/ FAA Aerospace Forecasts FY 2005-2016
1/ National Planning Association (NPA)
B-3
WPB310127161368.doc/063000015

Table B-4Projected O&D Enplanements = (Households*X1)+(Nonfarm Employment*X2)+(Fuel Cost*X3)+Coeff.
Historical Forecast PBI PBIYear Enplanements Enplanements Growth Rate Market Area Growth Rate Market Area Growth Rate Cents % Change1988 2,518,739 - 1,126.55 - 576.19 - 29.7 -1989 2,583,523 2.57% 1,168.86 3.76% 598.30 3.84% 33.6 13.20%1990 2,856,757 10.58% 1,217.38 4.15% 607.86 1.60% 37.5 11.66%1991 2,541,922 -11.02% 1,255.58 3.14% 608.96 0.18% 41.4 10.44%1992 2,534,978 -0.27% 1,292.19 2.92% 606.39 -0.42% 45.4 9.45%1993 2,544,757 0.39% 1,331.82 3.07% 628.86 3.71% 49.3 8.64%1994 2,801,615 10.09% 1,372.88 3.08% 650.52 3.44% 53.2 7.95%1995 2,729,122 -2.59% 1,406.24 2.43% 672.84 3.43% 57.1 7.37%1996 2,852,014 4.50% 1,441.67 2.52% 705.77 4.89% 61.0 6.86%1997 2,917,014 2.28% 1,480.92 2.72% 736.26 4.32% 64.9 6.42%1998 2,965,253 1.65% 1,516.26 2.39% 767.65 4.26% 68.9 6.03%1999 2,879,246 -2.90% 1,544.51 1.86% 799.10 4.10% 48.5 -29.57%2000 2,932,635 1.85% 1,570.12 1.66% 834.87 4.48% 71.5 47.42%2001 2,978,763 1.57% 1,603.84 2.15% 861.03 3.13% 82.4 15.24%2002 2,748,181 -7.74% 1,643.32 2.46% 886.56 2.96% 67.0 -18.69%2003 3,011,973 9.60% 1,685.31 2.56% 904.37 2.01% 82.4 22.99%2004 3,280,291 8.91% 1,727.96 2.53% 938.55 3.78% 100.4 21.84%2005 3,443,374 4.97% 1,774.05 2.67% 976.17 4.01% 128.8 28.29%2006 3,398,194 -1.31% 1,819.98 2.59% 1,011.07 3.58% 121.7 -5.51%2007 3,357,470 -1.20% 1,865.81 2.52% 1,046.49 3.50% 115.1 -5.42%2008 3,349,571 -0.24% 1,911.61 2.45% 1,080.02 3.20% 112.8 -2.00%2009 3,371,734 0.66% 1,956.02 2.32% 1,111.57 2.92% 114.4 1.42%2010 3,397,346 0.76% 2,000.31 2.26% 1,143.37 2.86% 116.4 1.75%2011 3,423,349 0.77% 2,044.52 2.21% 1,173.67 2.65% 118.6 1.89%2012 3,447,975 0.72% 2,088.68 2.16% 1,202.26 2.44% 120.8 1.85%2013 3,473,663 0.75% 2,132.79 2.11% 1,231.15 2.40% 123.1 1.90%2014 3,499,520 0.74% 2,177.66 2.10% 1,260.59 2.39% 125.4 1.87%2015 3,526,269 0.76% 2,222.57 2.06% 1,290.16 2.35% 127.8 1.91%2016 3,551,631 0.72% 2,267.50 2.02% 1,318.04 2.16% 130.2 1.88%2017 3,661,024 3.08% 2,312.49 1.98% 1,344.13 1.98% 143.3 10.06%2018 3,695,463 0.94% 2,357.53 1.95% 1,368.34 1.80% 147.2 2.73%2019 3,731,620 0.98% 2,403.26 1.94% 1,394.96 1.95% 151.1 2.66%2020 3,764,364 0.88% 2,449.13 1.91% 1,417.47 1.61% 155.1 2.59%2021 3,798,844 0.92% 2,495.12 1.88% 1,442.16 1.74% 159.0 2.53%2022 3,833,438 0.91% 2,541.27 1.85% 1,467.06 1.73% 162.9 2.46%2023 3,868,243 0.91% 2,587.63 1.82% 1,492.31 1.72% 166.8 2.41%2024 3,901,383 0.86% 2,634.42 1.81% 1,515.72 1.57% 170.7 2.35%2025 3,934,747 0.86% 2,681.45 1.79% 1,539.52 1.57% 174.6 2.29%
0.87%R-Square: 0.7423
Notes:
Sources: Airport Management Records; FAA Aerospace Forecasts FY 2005-2016; Ricondo & Associates, Inc.Prepared by: Ricondo & Associates, Inc., May 2005
2/ FAA Aerospace Forecasts FY 2005-2016
Total Population (in Thousands) 1/ Nonfarm Employment (in Thousands) 1/ Fuel Price 2/
Average Annual Growth Rate 2004-2025:
1/ National Planning Association (NPA)
B-4
WPB310127161368.doc/063000015

Table B-5Projected O&D Enplanements = (Population*X1)+(Nonfarm Employment*X2)+(Yield*X3)+Coeff.
Historical Forecast PBI PBIYear Enplanements Enplanements Growth Rate Market Area Growth Rate Market Area Growth Rate Cents % Change1988 2,518,739 - 1,126.55 - 576.19 - 12.97 -1989 2,583,523 2.57% 1,168.86 3.76% 598.30 3.84% 12.92 -0.38%1990 2,856,757 10.58% 1,217.38 4.15% 607.86 1.60% 12.87 -0.38%1991 2,541,922 -11.02% 1,255.58 3.14% 608.96 0.18% 12.82 -0.38%1992 2,534,978 -0.27% 1,292.19 2.92% 606.39 -0.42% 12.77 -0.38%1993 2,544,757 0.39% 1,331.82 3.07% 628.86 3.71% 12.72 -0.38%1994 2,801,615 10.09% 1,372.88 3.08% 650.52 3.44% 12.67 -0.39%1995 2,729,122 -2.59% 1,406.24 2.43% 672.84 3.43% 12.63 -0.39%1996 2,852,014 4.50% 1,441.67 2.52% 705.77 4.89% 12.58 -0.39%1997 2,917,014 2.28% 1,480.92 2.72% 736.26 4.32% 12.53 -0.39%1998 2,965,253 1.65% 1,516.26 2.39% 767.65 4.26% 12.48 -0.39%1999 2,879,246 -2.90% 1,544.51 1.86% 799.10 4.10% 13.54 8.51%2000 2,932,635 1.85% 1,570.12 1.66% 834.87 4.48% 14.03 3.62%2001 2,978,763 1.57% 1,603.84 2.15% 861.03 3.13% 13.53 -3.56%2002 2,748,181 -7.74% 1,643.32 2.46% 886.56 2.96% 11.88 -12.20%2003 3,011,973 9.60% 1,685.31 2.56% 904.37 2.01% 11.73 -1.26%2004 3,280,291 8.91% 1,727.96 2.53% 938.55 3.78% 11.46 -2.30%2005 3,155,843 -3.79% 1,774.05 2.67% 976.17 4.01% 11.11 -3.05%2006 3,202,127 1.47% 1,819.98 2.59% 1,011.07 3.58% 11.15 0.36%2007 3,248,252 1.44% 1,865.81 2.52% 1,046.49 3.50% 11.25 0.90%2008 3,292,387 1.36% 1,911.61 2.45% 1,080.02 3.20% 11.39 1.24%2009 3,334,336 1.27% 1,956.02 2.32% 1,111.57 2.92% 11.53 1.23%2010 3,376,641 1.27% 2,000.31 2.26% 1,143.37 2.86% 11.65 1.04%2011 3,417,458 1.21% 2,044.52 2.21% 1,173.67 2.65% 11.79 1.20%2012 3,456,620 1.15% 2,088.68 2.16% 1,202.26 2.44% 11.95 1.36%2013 3,496,112 1.14% 2,132.79 2.11% 1,231.15 2.40% 12.10 1.26%2014 3,536,356 1.15% 2,177.66 2.10% 1,260.59 2.39% 12.25 1.24%2015 3,576,812 1.14% 2,222.57 2.06% 1,290.16 2.35% 12.39 1.14%2016 3,615,765 1.09% 2,267.50 2.02% 1,318.04 2.16% 12.54 1.21%2017 3,663,420 1.32% 2,312.49 1.98% 1,344.13 1.98% 11.60 -7.46%2018 3,701,173 1.03% 2,357.53 1.95% 1,368.34 1.80% 11.56 -0.42%2019 3,741,226 1.08% 2,403.26 1.94% 1,394.96 1.95% 11.51 -0.42%2020 3,777,858 0.98% 2,449.13 1.91% 1,417.47 1.61% 11.46 -0.43%2021 3,816,376 1.02% 2,495.12 1.88% 1,442.16 1.74% 11.41 -0.43%2022 3,855,132 1.02% 2,541.27 1.85% 1,467.06 1.73% 11.36 -0.43%2023 3,894,265 1.02% 2,587.63 1.82% 1,492.31 1.72% 11.31 -0.43%2024 3,931,999 0.97% 2,634.42 1.81% 1,515.72 1.57% 11.26 -0.43%2025 3,970,155 0.97% 2,681.45 1.79% 1,539.52 1.57% 11.21 -0.44%
0.91%R-Square: 0.6696
Notes:
Sources: Airport Management Records; FAA Aerospace Forecasts 2005-2016; Ricondo & Associates, Inc.Prepared by: Ricondo & Associates, Inc., May 2005
1/ National Planning Association (NPA)
Real Yield 2/
2/ FAA Aerospace Forecasts FY 2005-2016
Average Annual Growth Rate 2004-2025:
Total Population (in Thousands) 1/ Nonfarm Employment (in Thousands) 1/
B-5
WPB310127161368.doc/063000015
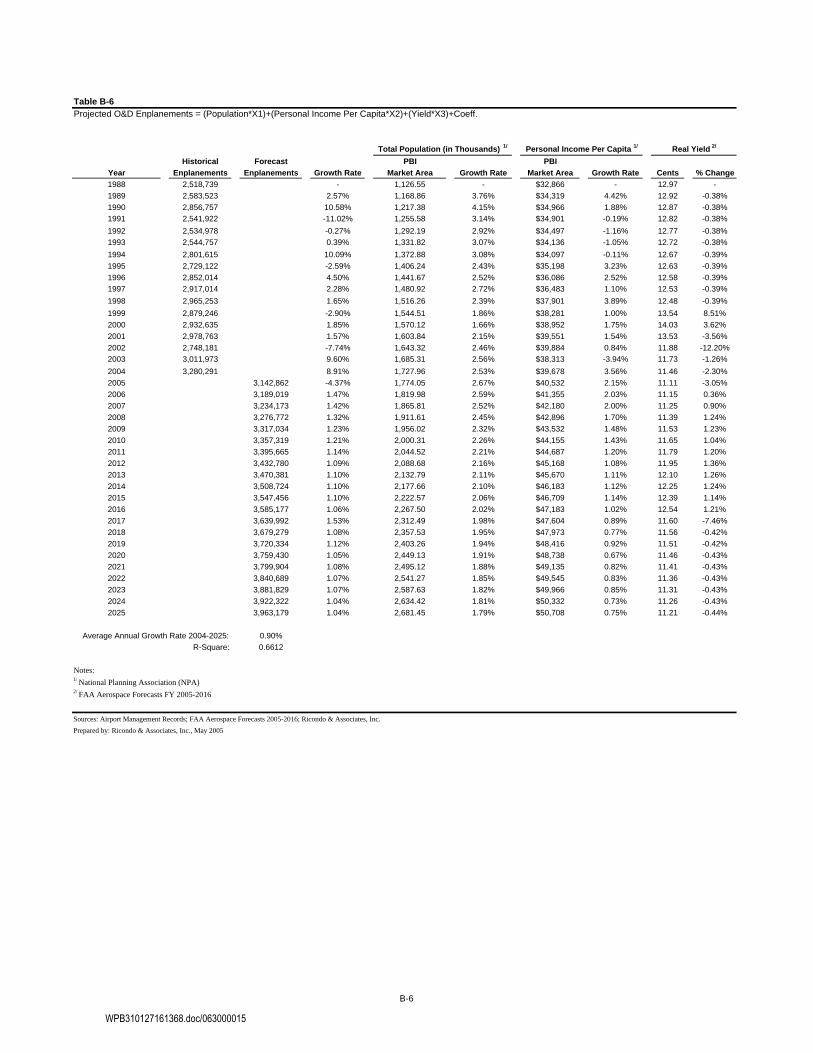
Table B-6Projected O&D Enplanements = (Population*X1)+(Personal Income Per Capita*X2)+(Yield*X3)+Coeff.
Historical Forecast PBI PBIYear Enplanements Enplanements Growth Rate Market Area Growth Rate Market Area Growth Rate Cents % Change1988 2,518,739 - 1,126.55 - $32,866 - 12.97 -1989 2,583,523 2.57% 1,168.86 3.76% $34,319 4.42% 12.92 -0.38%1990 2,856,757 10.58% 1,217.38 4.15% $34,966 1.88% 12.87 -0.38%1991 2,541,922 -11.02% 1,255.58 3.14% $34,901 -0.19% 12.82 -0.38%1992 2,534,978 -0.27% 1,292.19 2.92% $34,497 -1.16% 12.77 -0.38%1993 2,544,757 0.39% 1,331.82 3.07% $34,136 -1.05% 12.72 -0.38%1994 2,801,615 10.09% 1,372.88 3.08% $34,097 -0.11% 12.67 -0.39%1995 2,729,122 -2.59% 1,406.24 2.43% $35,198 3.23% 12.63 -0.39%1996 2,852,014 4.50% 1,441.67 2.52% $36,086 2.52% 12.58 -0.39%1997 2,917,014 2.28% 1,480.92 2.72% $36,483 1.10% 12.53 -0.39%1998 2,965,253 1.65% 1,516.26 2.39% $37,901 3.89% 12.48 -0.39%1999 2,879,246 -2.90% 1,544.51 1.86% $38,281 1.00% 13.54 8.51%2000 2,932,635 1.85% 1,570.12 1.66% $38,952 1.75% 14.03 3.62%2001 2,978,763 1.57% 1,603.84 2.15% $39,551 1.54% 13.53 -3.56%2002 2,748,181 -7.74% 1,643.32 2.46% $39,884 0.84% 11.88 -12.20%2003 3,011,973 9.60% 1,685.31 2.56% $38,313 -3.94% 11.73 -1.26%2004 3,280,291 8.91% 1,727.96 2.53% $39,678 3.56% 11.46 -2.30%2005 3,142,862 -4.37% 1,774.05 2.67% $40,532 2.15% 11.11 -3.05%2006 3,189,019 1.47% 1,819.98 2.59% $41,355 2.03% 11.15 0.36%2007 3,234,173 1.42% 1,865.81 2.52% $42,180 2.00% 11.25 0.90%2008 3,276,772 1.32% 1,911.61 2.45% $42,896 1.70% 11.39 1.24%2009 3,317,034 1.23% 1,956.02 2.32% $43,532 1.48% 11.53 1.23%2010 3,357,319 1.21% 2,000.31 2.26% $44,155 1.43% 11.65 1.04%2011 3,395,665 1.14% 2,044.52 2.21% $44,687 1.20% 11.79 1.20%2012 3,432,780 1.09% 2,088.68 2.16% $45,168 1.08% 11.95 1.36%2013 3,470,381 1.10% 2,132.79 2.11% $45,670 1.11% 12.10 1.26%2014 3,508,724 1.10% 2,177.66 2.10% $46,183 1.12% 12.25 1.24%2015 3,547,456 1.10% 2,222.57 2.06% $46,709 1.14% 12.39 1.14%2016 3,585,177 1.06% 2,267.50 2.02% $47,183 1.02% 12.54 1.21%2017 3,639,992 1.53% 2,312.49 1.98% $47,604 0.89% 11.60 -7.46%2018 3,679,279 1.08% 2,357.53 1.95% $47,973 0.77% 11.56 -0.42%2019 3,720,334 1.12% 2,403.26 1.94% $48,416 0.92% 11.51 -0.42%2020 3,759,430 1.05% 2,449.13 1.91% $48,738 0.67% 11.46 -0.43%2021 3,799,904 1.08% 2,495.12 1.88% $49,135 0.82% 11.41 -0.43%2022 3,840,689 1.07% 2,541.27 1.85% $49,545 0.83% 11.36 -0.43%2023 3,881,829 1.07% 2,587.63 1.82% $49,966 0.85% 11.31 -0.43%2024 3,922,322 1.04% 2,634.42 1.81% $50,332 0.73% 11.26 -0.43%2025 3,963,179 1.04% 2,681.45 1.79% $50,708 0.75% 11.21 -0.44%
0.90%R-Square: 0.6612
Notes:
Sources: Airport Management Records; FAA Aerospace Forecasts 2005-2016; Ricondo & Associates, Inc.Prepared by: Ricondo & Associates, Inc., May 2005
Total Population (in Thousands) 1/ Personal Income Per Capita 1/ Real Yield 2/
2/ FAA Aerospace Forecasts FY 2005-2016
Average Annual Growth Rate 2004-2025:
1/ National Planning Association (NPA)
B-6
WPB310127161368.doc/063000015

Table B-7Projected O&D Enplanements = (Households*X1)+(Personal Income Per Capita*X2)+(Yield*X3)+Coeff.
Historical Forecast PBI PBIYear Enplanements Enplanements Growth Rate Market Area Growth Rate Market Area Growth Rate Cents % Change1988 2,518,739 - 469.92 4.47% $32,866 - 12.97 -1989 2,583,523 2.57% 489.91 4.25% $34,319 4.42% 12.92 -0.38%1990 2,856,757 10.58% 510.09 4.12% $34,966 1.88% 12.87 -0.38%1991 2,541,922 -11.02% 526.07 3.13% $34,901 -0.19% 12.82 -0.38%1992 2,534,978 -0.27% 541.62 2.96% $34,497 -1.16% 12.77 -0.38%1993 2,544,757 0.39% 558.42 3.10% $34,136 -1.05% 12.72 -0.38%1994 2,801,615 10.09% 575.57 3.07% $34,097 -0.11% 12.67 -0.39%1995 2,729,122 -2.59% 589.75 2.46% $35,198 3.23% 12.63 -0.39%1996 2,852,014 4.50% 604.57 2.51% $36,086 2.52% 12.58 -0.39%1997 2,917,014 2.28% 621.22 2.75% $36,483 1.10% 12.53 -0.39%1998 2,965,253 1.65% 636.00 2.38% $37,901 3.89% 12.48 -0.39%1999 2,879,246 -2.90% 648.33 1.94% $38,281 1.00% 13.54 8.51%2000 2,932,635 1.85% 659.90 1.78% $38,952 1.75% 14.03 3.62%2001 2,978,763 1.57% 680.10 3.06% $39,551 1.54% 13.53 -3.56%2002 2,748,181 -7.74% 698.90 2.76% $39,884 0.84% 11.88 -12.20%2003 3,011,973 9.60% 717.77 2.70% $38,313 -3.94% 11.73 -1.26%2004 3,280,291 8.91% 737.66 2.77% $39,678 3.56% 11.46 -2.30%2005 3,145,599 -4.11% 758.89 2.88% $40,532 2.15% 11.11 -3.05%2006 3,193,506 1.52% 780.13 2.80% $41,355 2.03% 11.15 0.36%2007 3,240,785 1.48% 801.39 2.73% $42,180 2.00% 11.25 0.90%2008 3,285,961 1.39% 822.73 2.66% $42,896 1.70% 11.39 1.24%2009 3,329,020 1.31% 843.56 2.53% $43,532 1.48% 11.53 1.23%2010 3,372,162 1.30% 864.42 2.47% $44,155 1.43% 11.65 1.04%2011 3,416,980 1.33% 887.32 2.65% $44,687 1.20% 11.79 1.20%2012 3,454,201 1.09% 906.27 2.14% $45,168 1.08% 11.95 1.36%2013 3,495,307 1.19% 927.29 2.32% $45,670 1.11% 12.10 1.26%2014 3,537,261 1.20% 948.71 2.31% $46,183 1.12% 12.25 1.24%2015 3,579,708 1.20% 970.24 2.27% $46,709 1.14% 12.39 1.14%2016 3,621,369 1.16% 991.86 2.23% $47,183 1.02% 12.54 1.21%2017 3,675,291 1.49% 1,013.59 2.19% $47,604 0.89% 11.60 -7.46%2018 3,717,988 1.16% 1,035.43 2.15% $47,973 0.77% 11.56 -0.42%2019 3,762,529 1.20% 1,057.66 2.15% $48,416 0.92% 11.51 -0.42%2020 3,805,349 1.14% 1,080.02 2.11% $48,738 0.67% 11.46 -0.43%2021 3,849,615 1.16% 1,102.52 2.08% $49,135 0.82% 11.41 -0.43%2022 3,894,367 1.16% 1,125.20 2.06% $49,545 0.83% 11.36 -0.43%2023 3,939,592 1.16% 1,148.05 2.03% $49,966 0.85% 11.31 -0.43%2024 3,984,387 1.14% 1,171.18 2.01% $50,332 0.73% 11.26 -0.43%2025 4,029,669 1.14% 1,194.50 1.99% $50,708 0.75% 11.21 -0.44%
0.98%R-Square: 0.6594
Notes:
Sources: Airport Management Records; FAA Aerospace Forecasts FY 2005-2016; Ricondo & Associates, Inc.Prepared by: Ricondo & Associates, Inc., May 2005
Households (in Thousands) 1/ Personal Income Per Capita 1/ Real Yield 2/
Average Annual Growth Rate 2004-2025:
1/ National Planning Association (NPA)2/ FAA Aerospace Forecasts FY 2005-2016
B-7
WPB310127161368.doc/063000015

Table B-8Projected O&D Enplanements = (Households*X1)+(Nonfarm Employment*X2)+(Yield*X3)+Coeff.
Historical Forecast PBI PBIYear Enplanements Enplanements Growth Rate Market Area Growth Rate Market Area Growth Rate Cents % Change1988 2,518,739 - 469.92 4.47% 576.19 - 12.97 -1989 2,583,523 2.57% 489.91 4.25% 598.30 3.84% 12.92 -0.38%1990 2,856,757 10.58% 510.09 4.12% 607.86 1.60% 12.87 -0.38%1991 2,541,922 -11.02% 526.07 3.13% 608.96 0.18% 12.82 -0.38%1992 2,534,978 -0.27% 541.62 2.96% 606.39 -0.42% 12.77 -0.38%1993 2,544,757 0.39% 558.42 3.10% 628.86 3.71% 12.72 -0.38%1994 2,801,615 10.09% 575.57 3.07% 650.52 3.44% 12.67 -0.39%1995 2,729,122 -2.59% 589.75 2.46% 672.84 3.43% 12.63 -0.39%1996 2,852,014 4.50% 604.57 2.51% 705.77 4.89% 12.58 -0.39%1997 2,917,014 2.28% 621.22 2.75% 736.26 4.32% 12.53 -0.39%1998 2,965,253 1.65% 636.00 2.38% 767.65 4.26% 12.48 -0.39%1999 2,879,246 -2.90% 648.33 1.94% 799.10 4.10% 13.54 8.51%2000 2,932,635 1.85% 659.90 1.78% 834.87 4.48% 14.03 3.62%2001 2,978,763 1.57% 680.10 3.06% 861.03 3.13% 13.53 -3.56%2002 2,748,181 -7.74% 698.90 2.76% 886.56 2.96% 11.88 -12.20%2003 3,011,973 9.60% 717.77 2.70% 904.37 2.01% 11.73 -1.26%2004 3,280,291 8.91% 737.66 2.77% 938.55 3.78% 11.46 -2.30%2005 3,158,654 -3.71% 758.89 2.88% 976.17 4.01% 11.11 -3.05%2006 3,205,962 1.50% 780.13 2.80% 1,011.07 3.58% 11.15 0.36%2007 3,253,272 1.48% 801.39 2.73% 1,046.49 3.50% 11.25 0.90%2008 3,298,622 1.39% 822.73 2.66% 1,080.02 3.20% 11.39 1.24%2009 3,341,808 1.31% 843.56 2.53% 1,111.57 2.92% 11.53 1.23%2010 3,385,404 1.30% 864.42 2.47% 1,143.37 2.86% 11.65 1.04%2011 3,429,050 1.29% 887.32 2.65% 1,173.67 2.65% 11.79 1.20%2012 3,467,972 1.14% 906.27 2.14% 1,202.26 2.44% 11.95 1.36%2013 3,508,831 1.18% 927.29 2.32% 1,231.15 2.40% 12.10 1.26%2014 3,550,491 1.19% 948.71 2.31% 1,260.59 2.39% 12.25 1.24%2015 3,592,430 1.18% 970.24 2.27% 1,290.16 2.35% 12.39 1.14%2016 3,632,848 1.13% 991.86 2.23% 1,318.04 2.16% 12.54 1.21%2017 3,680,422 1.31% 1,013.59 2.19% 1,344.13 1.98% 11.60 -7.46%2018 3,719,296 1.06% 1,035.43 2.15% 1,368.34 1.80% 11.56 -0.42%2019 3,760,636 1.11% 1,057.66 2.15% 1,394.96 1.95% 11.51 -0.42%2020 3,798,385 1.00% 1,080.02 2.11% 1,417.47 1.61% 11.46 -0.43%2021 3,838,197 1.05% 1,102.52 2.08% 1,442.16 1.74% 11.41 -0.43%2022 3,878,336 1.05% 1,125.20 2.06% 1,467.06 1.73% 11.36 -0.43%2023 3,918,924 1.05% 1,148.05 2.03% 1,492.31 1.72% 11.31 -0.43%2024 3,958,070 1.00% 1,171.18 2.01% 1,515.72 1.57% 11.26 -0.43%2025 3,997,710 1.00% 1,194.50 1.99% 1,539.52 1.57% 11.21 -0.44%
0.95%R-Square: 0.6678
Notes:
Sources: Airport Management Records; FAA Aerospace Forecasts 2005-2016; Ricondo & Associates, Inc.Prepared by: Ricondo & Associates, Inc., May 2005
Real Yield 2/
2/ FAA Aerospace Forecasts FY 2005-2016
Average Annual Growth Rate 2004-2025:
Households (in Thousands) 1/ Nonfarm Employment (in Thousands) 1/
1/ National Planning Association (NPA)
B-8
WPB310127161368.doc/063000015
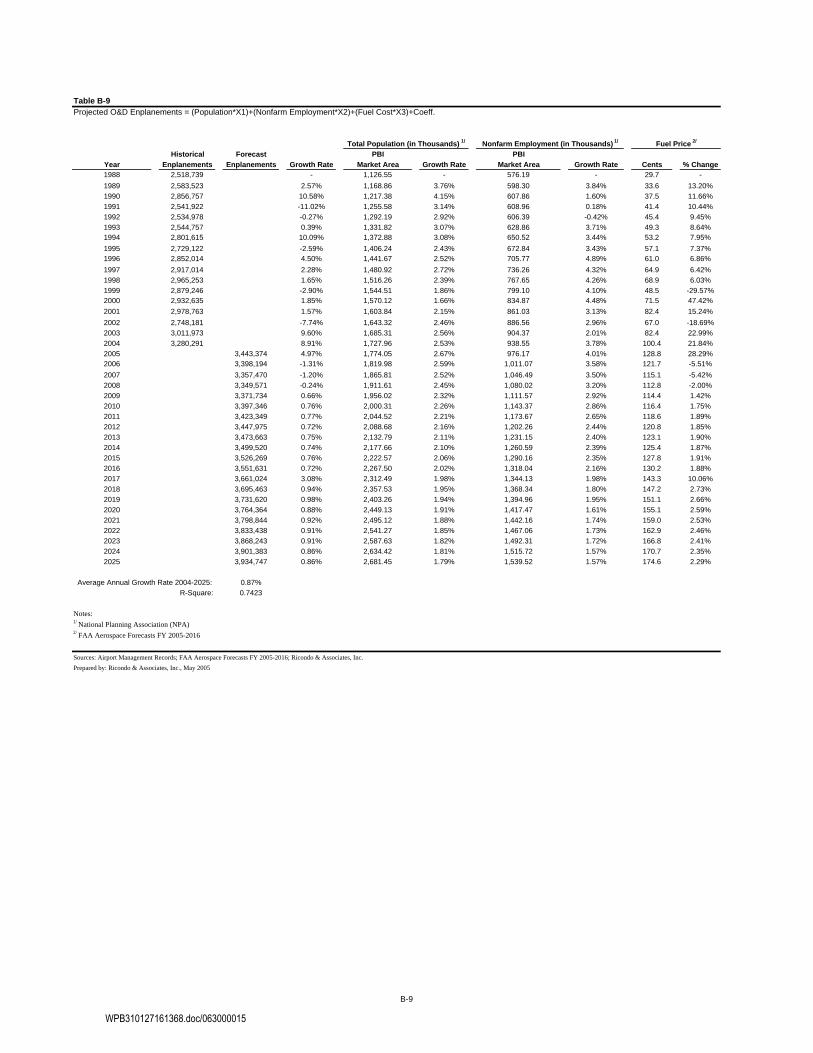
Table B-9Projected O&D Enplanements = (Population*X1)+(Nonfarm Employment*X2)+(Fuel Cost*X3)+Coeff.
Historical Forecast PBI PBIYear Enplanements Enplanements Growth Rate Market Area Growth Rate Market Area Growth Rate Cents % Change1988 2,518,739 - 1,126.55 - 576.19 - 29.7 -1989 2,583,523 2.57% 1,168.86 3.76% 598.30 3.84% 33.6 13.20%1990 2,856,757 10.58% 1,217.38 4.15% 607.86 1.60% 37.5 11.66%1991 2,541,922 -11.02% 1,255.58 3.14% 608.96 0.18% 41.4 10.44%1992 2,534,978 -0.27% 1,292.19 2.92% 606.39 -0.42% 45.4 9.45%1993 2,544,757 0.39% 1,331.82 3.07% 628.86 3.71% 49.3 8.64%1994 2,801,615 10.09% 1,372.88 3.08% 650.52 3.44% 53.2 7.95%1995 2,729,122 -2.59% 1,406.24 2.43% 672.84 3.43% 57.1 7.37%1996 2,852,014 4.50% 1,441.67 2.52% 705.77 4.89% 61.0 6.86%1997 2,917,014 2.28% 1,480.92 2.72% 736.26 4.32% 64.9 6.42%1998 2,965,253 1.65% 1,516.26 2.39% 767.65 4.26% 68.9 6.03%1999 2,879,246 -2.90% 1,544.51 1.86% 799.10 4.10% 48.5 -29.57%2000 2,932,635 1.85% 1,570.12 1.66% 834.87 4.48% 71.5 47.42%2001 2,978,763 1.57% 1,603.84 2.15% 861.03 3.13% 82.4 15.24%2002 2,748,181 -7.74% 1,643.32 2.46% 886.56 2.96% 67.0 -18.69%2003 3,011,973 9.60% 1,685.31 2.56% 904.37 2.01% 82.4 22.99%2004 3,280,291 8.91% 1,727.96 2.53% 938.55 3.78% 100.4 21.84%2005 3,443,374 4.97% 1,774.05 2.67% 976.17 4.01% 128.8 28.29%2006 3,398,194 -1.31% 1,819.98 2.59% 1,011.07 3.58% 121.7 -5.51%2007 3,357,470 -1.20% 1,865.81 2.52% 1,046.49 3.50% 115.1 -5.42%2008 3,349,571 -0.24% 1,911.61 2.45% 1,080.02 3.20% 112.8 -2.00%2009 3,371,734 0.66% 1,956.02 2.32% 1,111.57 2.92% 114.4 1.42%2010 3,397,346 0.76% 2,000.31 2.26% 1,143.37 2.86% 116.4 1.75%2011 3,423,349 0.77% 2,044.52 2.21% 1,173.67 2.65% 118.6 1.89%2012 3,447,975 0.72% 2,088.68 2.16% 1,202.26 2.44% 120.8 1.85%2013 3,473,663 0.75% 2,132.79 2.11% 1,231.15 2.40% 123.1 1.90%2014 3,499,520 0.74% 2,177.66 2.10% 1,260.59 2.39% 125.4 1.87%2015 3,526,269 0.76% 2,222.57 2.06% 1,290.16 2.35% 127.8 1.91%2016 3,551,631 0.72% 2,267.50 2.02% 1,318.04 2.16% 130.2 1.88%2017 3,661,024 3.08% 2,312.49 1.98% 1,344.13 1.98% 143.3 10.06%2018 3,695,463 0.94% 2,357.53 1.95% 1,368.34 1.80% 147.2 2.73%2019 3,731,620 0.98% 2,403.26 1.94% 1,394.96 1.95% 151.1 2.66%2020 3,764,364 0.88% 2,449.13 1.91% 1,417.47 1.61% 155.1 2.59%2021 3,798,844 0.92% 2,495.12 1.88% 1,442.16 1.74% 159.0 2.53%2022 3,833,438 0.91% 2,541.27 1.85% 1,467.06 1.73% 162.9 2.46%2023 3,868,243 0.91% 2,587.63 1.82% 1,492.31 1.72% 166.8 2.41%2024 3,901,383 0.86% 2,634.42 1.81% 1,515.72 1.57% 170.7 2.35%2025 3,934,747 0.86% 2,681.45 1.79% 1,539.52 1.57% 174.6 2.29%
0.87%R-Square: 0.7423
Notes:
Sources: Airport Management Records; FAA Aerospace Forecasts FY 2005-2016; Ricondo & Associates, Inc.Prepared by: Ricondo & Associates, Inc., May 2005
Average Annual Growth Rate 2004-2025:
1/ National Planning Association (NPA)2/ FAA Aerospace Forecasts FY 2005-2016
Total Population (in Thousands) 1/ Nonfarm Employment (in Thousands) 1/ Fuel Price 2/
B-9
WPB310127161368.doc/063000015
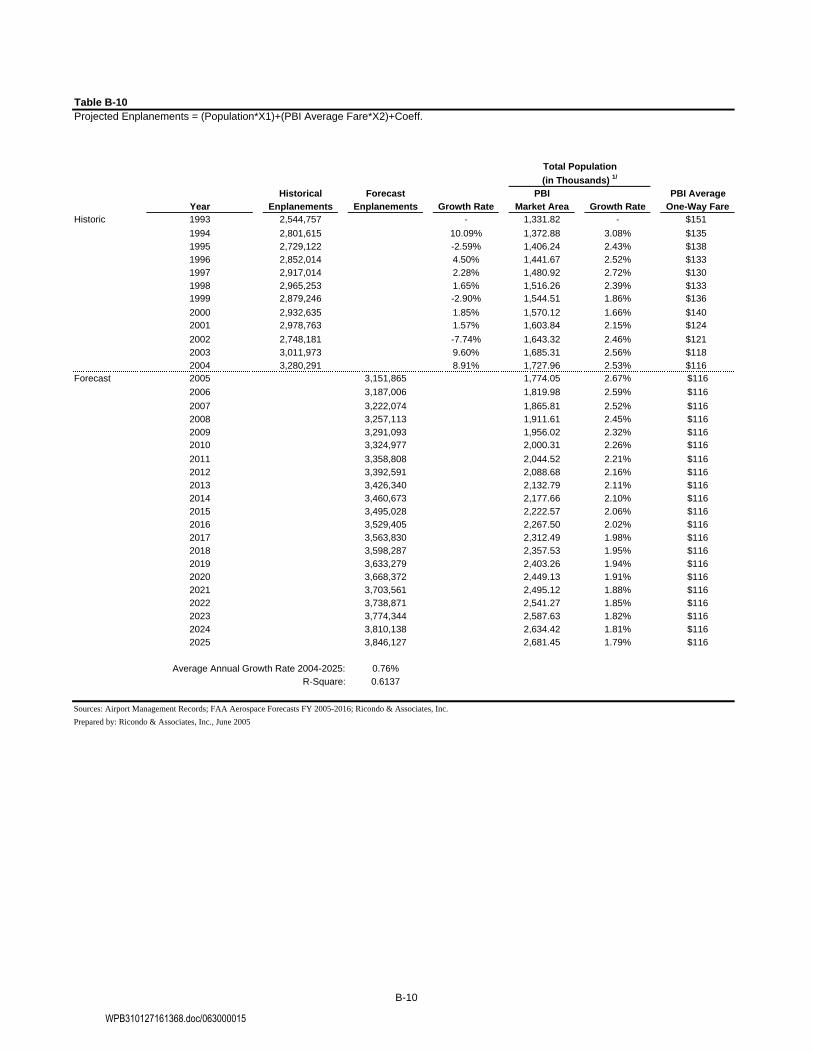
Projected Enplanements = (Population*X1)+(PBI Average Fare*X2)+Coeff.
Historical Forecast PBI PBI AverageYear Enplanements Enplanements Growth Rate Market Area Growth Rate One-Way Fare
Historic 1993 2,544,757 - 1,331.82 - $1511994 2,801,615 10.09% 1,372.88 3.08% $1351995 2,729,122 -2.59% 1,406.24 2.43% $1381996 2,852,014 4.50% 1,441.67 2.52% $1331997 2,917,014 2.28% 1,480.92 2.72% $1301998 2,965,253 1.65% 1,516.26 2.39% $1331999 2,879,246 -2.90% 1,544.51 1.86% $1362000 2,932,635 1.85% 1,570.12 1.66% $1402001 2,978,763 1.57% 1,603.84 2.15% $1242002 2,748,181 -7.74% 1,643.32 2.46% $1212003 3,011,973 9.60% 1,685.31 2.56% $1182004 3,280,291 8.91% 1,727.96 2.53% $116
Forecast 2005 3,151,865 1,774.05 2.67% $1162006 3,187,006 1,819.98 2.59% $1162007 3,222,074 1,865.81 2.52% $1162008 3,257,113 1,911.61 2.45% $1162009 3,291,093 1,956.02 2.32% $1162010 3,324,977 2,000.31 2.26% $1162011 3,358,808 2,044.52 2.21% $1162012 3,392,591 2,088.68 2.16% $1162013 3,426,340 2,132.79 2.11% $1162014 3,460,673 2,177.66 2.10% $1162015 3,495,028 2,222.57 2.06% $1162016 3,529,405 2,267.50 2.02% $1162017 3,563,830 2,312.49 1.98% $1162018 3,598,287 2,357.53 1.95% $1162019 3,633,279 2,403.26 1.94% $1162020 3,668,372 2,449.13 1.91% $1162021 3,703,561 2,495.12 1.88% $1162022 3,738,871 2,541.27 1.85% $1162023 3,774,344 2,587.63 1.82% $1162024 3,810,138 2,634.42 1.81% $1162025 3,846,127 2,681.45 1.79% $116
Average Annual Growth Rate 2004-2025: 0.76%R-Square: 0.6137
Sources: Airport Management Records; FAA Aerospace Forecasts FY 2005-2016; Ricondo & Associates, Inc.Prepared by: Ricondo & Associates, Inc., June 2005
Table B-10
Total Population (in Thousands) 1/
B-10
WPB310127161368.doc/063000015

Table B-11Enplanements Forecast - Regression Analysis with Individual Variables
Historical Enplanements = Enplanements = Enplanements = Enplanements = Enplanements = Enplanements =Year Enplanements (Population*X1)+Coeff. (PIPC*X1)+Coeff. (Nonfarm Employment*X1)+Coeff. (Fuel Cost*X1)+Coeff. (Yield*X1)+Coeff. (Households*X1)+Coeff.
Historic 1988 2,518,7391989 2,583,5231990 2,856,7571991 2,541,9221992 2,534,9781993 2,544,7571994 2,801,6151995 2,729,1221996 2,852,0141997 2,917,0141998 2,965,2531999 2,879,2462000 2,932,6352001 2,978,7632002 2,748,1812003 3,011,9732004 3,280,291
Forecast 2005 3,120,731 3,089,395 3,152,935 3,466,305 3,248,814 3,132,0322006 3,163,496 3,147,153 3,202,025 3,399,482 3,248,814 3,176,9062007 3,206,173 3,205,146 3,251,846 3,337,365 3,248,814 3,221,8232008 3,248,814 3,255,412 3,299,005 3,315,718 3,248,814 3,266,9092009 3,290,166 3,300,102 3,343,386 3,330,777 3,248,814 3,310,9172010 3,331,403 3,343,890 3,388,123 3,349,600 3,248,814 3,354,9892011 3,372,574 3,381,229 3,430,741 3,370,306 3,248,814 3,403,3712012 3,413,686 3,415,020 3,470,953 3,391,012 3,248,814 3,443,4072013 3,454,757 3,450,279 3,511,589 3,412,658 3,248,814 3,487,8172014 3,496,539 3,486,343 3,552,999 3,434,305 3,248,814 3,533,0722015 3,538,348 3,523,249 3,594,589 3,456,893 3,248,814 3,578,5592016 3,580,184 3,556,569 3,633,815 3,479,481 3,248,814 3,624,2362017 3,622,077 3,586,177 3,670,514 3,602,798 3,248,814 3,670,1462018 3,664,011 3,612,041 3,704,564 3,639,671 3,248,814 3,716,2882019 3,706,595 3,643,159 3,742,008 3,676,544 3,248,814 3,763,2552020 3,749,301 3,665,778 3,773,673 3,713,417 3,248,814 3,810,4952021 3,792,125 3,693,728 3,808,401 3,750,290 3,248,814 3,858,0322022 3,835,096 3,722,495 3,843,426 3,787,162 3,248,814 3,905,9492023 3,878,265 3,752,105 3,878,948 3,824,035 3,248,814 3,954,2252024 3,921,826 3,777,787 3,911,877 3,860,908 3,248,814 4,003,0932025 3,965,622 3,804,227 3,945,352 3,897,781 3,248,814 4,052,362
0.91% 0.71% 0.88% 0.82% -0.05% 1.01%
R-Square: 0.6567 0.5905 0.6626 0.7278 0.0758 0.6560
Sources: Airport Management Records; FAA Aerospace Forecasts FY 2005-2016; Ricondo & Associates, Inc.Prepared by: Ricondo & Associates, Inc., June 2005
O&D Enplanements Projections
Average Annual Growth Rate 2004-2025:
B-11
WPB310127161368.doc/063000015


Appendix C: Market Share Approach Analyses
WPB310127161368.doc/063000015


Table C1-1
Year PBI Total Enplanements Annual Growth US Total Enplanements 2/ Annual Growth PBI/US Market ShareHistoric 1980 1,299,838 - 309,873,558 - 0.4195%
1981 1,304,257 0.34% 291,823,728 -5.82% 0.4469%1982 1,601,782 22.81% 305,213,790 4.59% 0.5248%1983 1,867,794 16.61% 328,639,304 7.68% 0.5683%1984 1,972,863 5.63% 355,786,265 8.26% 0.5545%1985 1,901,839 -3.60% 399,557,821 12.30% 0.4760%1986 2,093,833 10.10% 431,448,116 7.98% 0.4853%1987 2,332,750 11.41% 470,284,152 9.00% 0.4960%1988 2,518,739 7.97% 481,821,941 2.45% 0.5228%1989 2,583,523 2.57% 481,130,649 -0.14% 0.5370%1990 2,856,757 10.58% 495,391,280 2.96% 0.5767%1991 2,541,922 -11.02% 489,152,394 -1.26% 0.5197%1992 2,534,978 -0.27% 510,594,585 4.38% 0.4965%1993 2,544,757 0.39% 520,033,971 1.85% 0.4893%1994 2,801,615 10.09% 562,054,855 8.08% 0.4985%1995 2,729,122 -2.59% 582,037,790 3.56% 0.4689%1996 2,852,014 4.50% 613,630,409 5.43% 0.4648%1997 2,917,014 2.28% 637,697,857 3.92% 0.4574%1998 2,965,253 1.65% 649,071,662 1.78% 0.4568%1999 2,879,246 -2.90% 675,566,091 4.08% 0.4262%2000 2,932,635 1.85% 704,897,797 4.34% 0.4160%2001 2,978,763 1.57% 693,186,394 -1.66% 0.4297%2002 2,748,181 -7.74% 627,675,721 -9.45% 0.4378%2003 3,011,973 9.60% 643,916,741 2.59% 0.4678%2004 3,280,291 8.91% 686,166,571 6.56% 0.4781%
Forecast 2005 3,316,110 1.09% 720,893,554 5.06% 0.4600%2006 3,375,767 1.80% 749,579,034 3.98% 0.4504%2007 3,496,706 3.58% 776,433,153 3.58% 0.4504%2008 3,614,669 3.37% 802,626,650 3.37% 0.4504%2009 3,732,142 3.25% 828,711,027 3.25% 0.4504%2010 3,854,216 3.27% 855,817,223 3.27% 0.4504%2011 3,970,963 3.03% 881,740,551 3.03% 0.4504%2012 4,089,437 2.98% 908,047,370 2.98% 0.4504%2013 4,210,002 2.95% 934,818,475 2.95% 0.4504%2014 4,331,858 2.89% 961,876,183 2.89% 0.4504%2015 4,454,354 2.83% 989,076,246 2.83% 0.4504%2016 4,578,806 2.79% 1,016,710,274 2.79% 0.4504%2017 4,705,154 2.76% 1,044,765,619 2.76% 0.4504%2018 4,832,683 2.71% 1,073,083,073 2.71% 0.4504%2019 4,961,889 2.67% 1,101,772,754 2.67% 0.4504%2020 5,093,422 2.65% 1,130,979,288 2.65% 0.4504%2021 5,200,100 2.09% 1,154,666,783 2.09% 0.4504%2022 5,322,733 2.36% 1,181,897,098 2.36% 0.4504%2023 5,445,366 2.30% 1,209,127,414 2.30% 0.4504%2024 5,567,999 2.25% 1,236,357,729 2.25% 0.4504%2025 5,690,632 2.20% 1,263,588,044 2.20% 0.4504%
Average Annual Growth Rate 2004-2025: 2.66%
Notes:
2/ FAA Terminal Area Forecasts.
Sources: Airport Management Records; FAA Terminal Area Forecasts; Ricondo & Associates, Inc.Prepared by: Ricondo & Associates, Inc., June 2005.
Total Passenger Enplanements Forecast - Market Share Approach (Constant PBI/U.S. Market Share Ratio) 1/
1/ Based on the constant PBI/US market share ratio of 0.4504% (Average market share ratio for the last 10 years 1995-2004). The 2005 ratio was adjusted to 0.46% to account for a positive annual growth rate for 2004.
C-1
WPB310127161368.doc/063000015
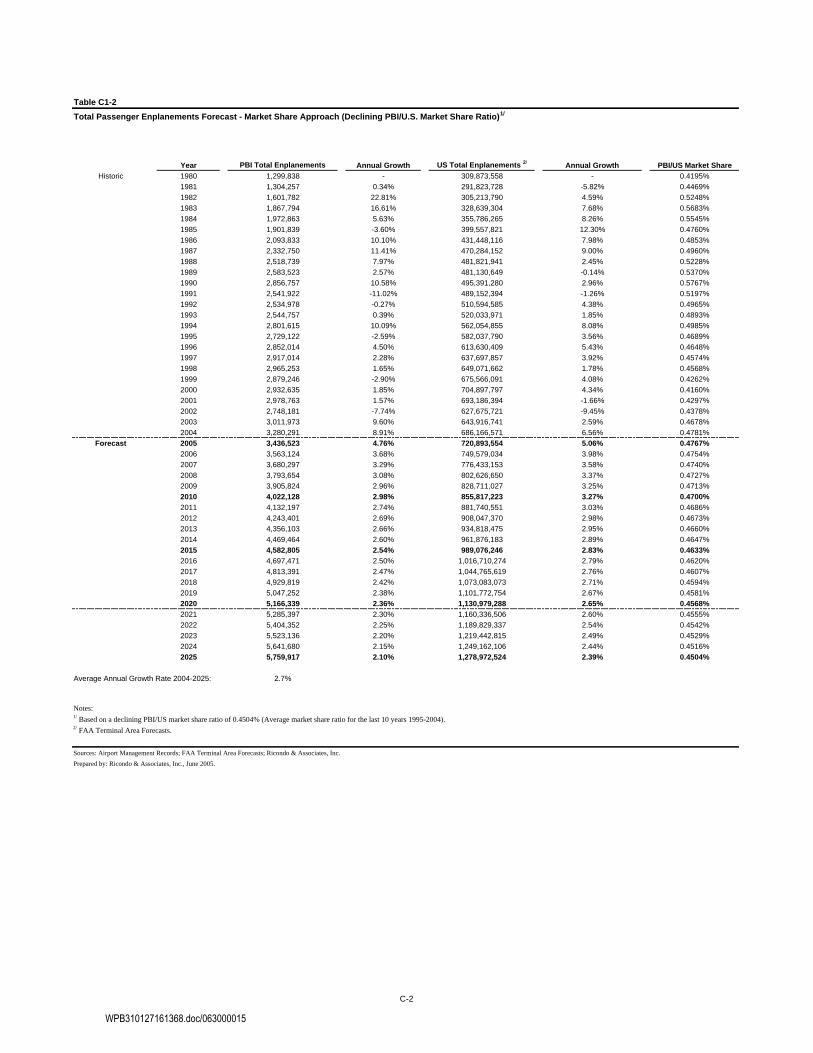
Table C1-2
Year PBI Total Enplanements Annual Growth US Total Enplanements 2/ Annual Growth PBI/US Market ShareHistoric 1980 1,299,838 - 309,873,558 - 0.4195%
1981 1,304,257 0.34% 291,823,728 -5.82% 0.4469%1982 1,601,782 22.81% 305,213,790 4.59% 0.5248%1983 1,867,794 16.61% 328,639,304 7.68% 0.5683%1984 1,972,863 5.63% 355,786,265 8.26% 0.5545%1985 1,901,839 -3.60% 399,557,821 12.30% 0.4760%1986 2,093,833 10.10% 431,448,116 7.98% 0.4853%1987 2,332,750 11.41% 470,284,152 9.00% 0.4960%1988 2,518,739 7.97% 481,821,941 2.45% 0.5228%1989 2,583,523 2.57% 481,130,649 -0.14% 0.5370%1990 2,856,757 10.58% 495,391,280 2.96% 0.5767%1991 2,541,922 -11.02% 489,152,394 -1.26% 0.5197%1992 2,534,978 -0.27% 510,594,585 4.38% 0.4965%1993 2,544,757 0.39% 520,033,971 1.85% 0.4893%1994 2,801,615 10.09% 562,054,855 8.08% 0.4985%1995 2,729,122 -2.59% 582,037,790 3.56% 0.4689%1996 2,852,014 4.50% 613,630,409 5.43% 0.4648%1997 2,917,014 2.28% 637,697,857 3.92% 0.4574%1998 2,965,253 1.65% 649,071,662 1.78% 0.4568%1999 2,879,246 -2.90% 675,566,091 4.08% 0.4262%2000 2,932,635 1.85% 704,897,797 4.34% 0.4160%2001 2,978,763 1.57% 693,186,394 -1.66% 0.4297%2002 2,748,181 -7.74% 627,675,721 -9.45% 0.4378%2003 3,011,973 9.60% 643,916,741 2.59% 0.4678%2004 3,280,291 8.91% 686,166,571 6.56% 0.4781%
Forecast 2005 3,436,523 4.76% 720,893,554 5.06% 0.4767%2006 3,563,124 3.68% 749,579,034 3.98% 0.4754%2007 3,680,297 3.29% 776,433,153 3.58% 0.4740%2008 3,793,654 3.08% 802,626,650 3.37% 0.4727%2009 3,905,824 2.96% 828,711,027 3.25% 0.4713%2010 4,022,128 2.98% 855,817,223 3.27% 0.4700%2011 4,132,197 2.74% 881,740,551 3.03% 0.4686%2012 4,243,401 2.69% 908,047,370 2.98% 0.4673%2013 4,356,103 2.66% 934,818,475 2.95% 0.4660%2014 4,469,464 2.60% 961,876,183 2.89% 0.4647%2015 4,582,805 2.54% 989,076,246 2.83% 0.4633%2016 4,697,471 2.50% 1,016,710,274 2.79% 0.4620%2017 4,813,391 2.47% 1,044,765,619 2.76% 0.4607%2018 4,929,819 2.42% 1,073,083,073 2.71% 0.4594%2019 5,047,252 2.38% 1,101,772,754 2.67% 0.4581%2020 5,166,339 2.36% 1,130,979,288 2.65% 0.4568%2021 5,285,397 2.30% 1,160,336,506 2.60% 0.4555%2022 5,404,352 2.25% 1,189,829,337 2.54% 0.4542%2023 5,523,136 2.20% 1,219,442,815 2.49% 0.4529%2024 5,641,680 2.15% 1,249,162,106 2.44% 0.4516%2025 5,759,917 2.10% 1,278,972,524 2.39% 0.4504%
Average Annual Growth Rate 2004-2025: 2.7%
Notes:
2/ FAA Terminal Area Forecasts.
Sources: Airport Management Records; FAA Terminal Area Forecasts; Ricondo & Associates, Inc.Prepared by: Ricondo & Associates, Inc., June 2005.
Total Passenger Enplanements Forecast - Market Share Approach (Declining PBI/U.S. Market Share Ratio) 1/
1/ Based on a declining PBI/US market share ratio of 0.4504% (Average market share ratio for the last 10 years 1995-2004).
C-2
WPB310127161368.doc/063000015

Table C2-1
Year PBI Total Enplanements Annual Growth
FAA Southern Region Scheduled
Enplanements 2/ Annual GrowthPBI/Southern Region Market
ShareHistoric 1980 1,299,838 - 64,991,208 - 2.0000%
1981 1,304,257 0.34% 60,459,563 -6.97% 2.1572%1982 1,601,782 22.81% 63,363,196 4.80% 2.5279%1983 1,867,794 16.61% 64,705,187 2.12% 2.8866%1984 1,972,863 5.63% 67,854,255 4.87% 2.9075%1985 1,901,839 -3.60% 75,801,353 11.71% 2.5090%1986 2,093,833 10.10% 83,250,008 9.83% 2.5151%1987 2,332,750 11.41% 95,412,950 14.61% 2.4449%1988 2,518,739 7.97% 99,790,924 4.59% 2.5240%1989 2,583,523 2.57% 98,362,345 -1.43% 2.6265%1990 2,856,757 10.58% 104,698,977 6.44% 2.7285%1991 2,541,922 -11.02% 100,611,452 -3.90% 2.5265%1992 2,534,978 -0.27% 105,373,670 4.73% 2.4057%1993 2,544,757 0.39% 108,714,678 3.17% 2.3408%1994 2,801,615 10.09% 119,765,973 10.17% 2.3392%1995 2,729,122 -2.59% 122,172,922 2.01% 2.2338%1996 2,852,014 4.50% 130,973,948 7.20% 2.1775%1997 2,917,014 2.28% 138,757,197 5.94% 2.1022%1998 2,965,253 1.65% 141,788,248 2.18% 2.0913%1999 2,879,246 -2.90% 149,195,553 5.22% 1.9298%2000 2,932,635 1.85% 156,222,430 4.71% 1.8772%2001 2,978,763 1.57% 155,323,730 -0.58% 1.9178%2002 2,748,181 -7.74% 142,220,317 -8.44% 1.9323%2003 3,011,973 9.60% 147,036,771 3.39% 2.0484%2004 3,280,291 8.91% 158,730,643 7.95% 2.0666%
Forecast 2005 3,455,106 5.33% 169,557,959 6.82% 2.0377%2006 3,581,445 3.66% 175,757,992 3.66% 2.0377%2007 3,699,549 3.30% 181,553,901 3.30% 2.0377%2008 3,819,165 3.23% 187,424,005 3.23% 2.0377%2009 3,941,531 3.20% 193,429,055 3.20% 2.0377%2010 4,066,403 3.17% 199,557,129 3.17% 2.0377%2011 4,189,327 3.02% 205,589,544 3.02% 2.0377%2012 4,314,696 2.99% 211,741,990 2.99% 2.0377%2013 4,442,735 2.97% 218,025,456 2.97% 2.0377%2014 4,573,289 2.94% 224,432,368 2.94% 2.0377%2015 4,706,373 2.91% 230,963,408 2.91% 2.0377%2016 4,842,286 2.89% 237,633,257 2.89% 2.0377%2017 4,981,052 2.87% 244,443,167 2.87% 2.0377%2018 5,122,605 2.84% 251,389,810 2.84% 2.0377%2019 5,267,193 2.82% 258,485,425 2.82% 2.0377%2020 5,414,999 2.81% 265,738,928 2.81% 2.0377%2021 5,565,120 2.77% 273,106,050 2.77% 2.0377%2022 5,717,542 2.74% 280,586,108 2.74% 2.0377%2023 5,872,250 2.71% 288,178,362 2.71% 2.0377%2024 6,029,229 2.67% 295,882,018 2.67% 2.0377%2025 6,188,460 2.64% 303,696,227 2.64% 2.0377%
3.1%
Notes:
2/ FAA Terminal Area Forecasts.
Sources: Airport Management Records; FAA Terminal Area Forecasts; Ricondo & Associates, Inc.Prepared by: Ricondo & Associates, Inc., June 2005.
Total Passenger Enplanements Forecast - Market Share Approach PBI/FAA Southern region (Constant PBI/FAA Southern Region Market Share Ratio) 1/
Average Annual Growth Rate 2004-2025:
1/ Based on the constant PBI/FAA Southern region market share ratio of 2.0377% (Average market share ratio for the last 10 years 1995-2004).
C-3
WPB310127161368.doc/063000015

Table C2-2
Year PBI Total Enplanements Annual Growth
FAA Southern Region Scheduled
Enplanements 2/ Annual GrowthPBI/Southern Region Market
ShareHistoric 1980 1,299,838 - 64,991,208 - 2.0000%
1981 1,304,257 0.34% 60,459,563 -6.97% 2.1572%1982 1,601,782 22.81% 63,363,196 4.80% 2.5279%1983 1,867,794 16.61% 64,705,187 2.12% 2.8866%1984 1,972,863 5.63% 67,854,255 4.87% 2.9075%1985 1,901,839 -3.60% 75,801,353 11.71% 2.5090%1986 2,093,833 10.10% 83,250,008 9.83% 2.5151%1987 2,332,750 11.41% 95,412,950 14.61% 2.4449%1988 2,518,739 7.97% 99,790,924 4.59% 2.5240%1989 2,583,523 2.57% 98,362,345 -1.43% 2.6265%1990 2,856,757 10.58% 104,698,977 6.44% 2.7285%1991 2,541,922 -11.02% 100,611,452 -3.90% 2.5265%1992 2,534,978 -0.27% 105,373,670 4.73% 2.4057%1993 2,544,757 0.39% 108,714,678 3.17% 2.3408%1994 2,801,615 10.09% 119,765,973 10.17% 2.3392%1995 2,729,122 -2.59% 122,172,922 2.01% 2.2338%1996 2,852,014 4.50% 130,973,948 7.20% 2.1775%1997 2,917,014 2.28% 138,757,197 5.94% 2.1022%1998 2,965,253 1.65% 141,788,248 2.18% 2.0913%1999 2,879,246 -2.90% 149,195,553 5.22% 1.9298%2000 2,932,635 1.85% 156,222,430 4.71% 1.8772%2001 2,978,763 1.57% 155,323,730 -0.58% 1.9178%2002 2,748,181 -7.74% 142,220,317 -8.44% 1.9323%2003 3,011,973 9.60% 147,036,771 3.39% 2.0484%2004 3,280,291 8.91% 158,730,643 7.95% 2.0666%
Forecast 2005 3,513,064 7.10% 169,557,959 6.82% 2.0719%2006 3,650,894 3.92% 175,757,992 3.66% 2.0772%2007 3,780,995 3.56% 181,553,901 3.30% 2.0826%2008 3,913,290 3.50% 187,424,005 3.23% 2.0879%2009 4,049,065 3.47% 193,429,055 3.20% 2.0933%2010 4,188,096 3.43% 199,557,129 3.17% 2.0987%2011 4,325,802 3.29% 205,589,544 3.02% 2.1041%2012 4,466,722 3.26% 211,741,990 2.99% 2.1095%2013 4,611,109 3.23% 218,025,456 2.97% 2.1149%2014 4,758,828 3.20% 224,432,368 2.94% 2.1204%2015 4,909,915 3.17% 230,963,408 2.91% 2.1258%2016 5,064,707 3.15% 237,633,257 2.89% 2.1313%2017 5,223,256 3.13% 244,443,167 2.87% 2.1368%2018 5,385,516 3.11% 251,389,810 2.84% 2.1423%2019 5,551,777 3.09% 258,485,425 2.82% 2.1478%2020 5,722,258 3.07% 265,738,928 2.81% 2.1533%2021 5,896,033 3.04% 273,106,050 2.77% 2.1589%2022 6,073,108 3.00% 280,586,108 2.74% 2.1644%2023 6,253,491 2.97% 288,178,362 2.71% 2.1700%2024 6,437,185 2.94% 295,882,018 2.67% 2.1756%2025 6,624,195 2.91% 303,696,227 2.64% 2.1812%
Average Annual Growth Rate 2004-2025: 3.4%
Notes:
2/ FAA Terminal Area Forecasts.
Sources: Airport Management Records; FAA Terminal Area Forecasts; Ricondo & Associates, Inc.Prepared by: Ricondo & Associates, Inc., June 2005.
Total Passenger Enplanements Forecast - Market Share Approach PBI/FAA Southern region (Increasing PBI/FAA Southern Region Market Share Ratio) 1/
1/ Based on a decreasing PBI/FAA Southern region market share ratio of 2.1812% (Average market share ratio for the last 15 years 1990-2004).
C-4
WPB310127161368.doc/063000015
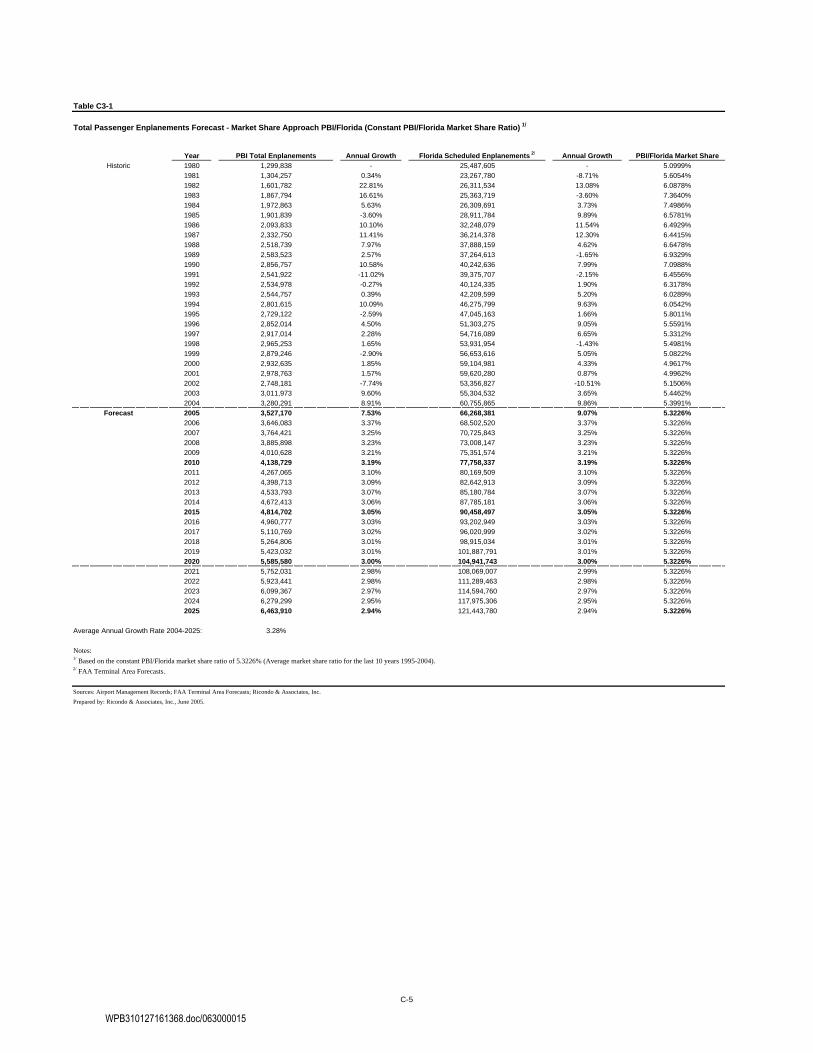
Table C3-1
Year PBI Total Enplanements Annual Growth Florida Scheduled Enplanements 2/ Annual Growth PBI/Florida Market ShareHistoric 1980 1,299,838 - 25,487,605 - 5.0999%
1981 1,304,257 0.34% 23,267,780 -8.71% 5.6054%1982 1,601,782 22.81% 26,311,534 13.08% 6.0878%1983 1,867,794 16.61% 25,363,719 -3.60% 7.3640%1984 1,972,863 5.63% 26,309,691 3.73% 7.4986%1985 1,901,839 -3.60% 28,911,784 9.89% 6.5781%1986 2,093,833 10.10% 32,248,079 11.54% 6.4929%1987 2,332,750 11.41% 36,214,378 12.30% 6.4415%1988 2,518,739 7.97% 37,888,159 4.62% 6.6478%1989 2,583,523 2.57% 37,264,613 -1.65% 6.9329%1990 2,856,757 10.58% 40,242,636 7.99% 7.0988%1991 2,541,922 -11.02% 39,375,707 -2.15% 6.4556%1992 2,534,978 -0.27% 40,124,335 1.90% 6.3178%1993 2,544,757 0.39% 42,209,599 5.20% 6.0289%1994 2,801,615 10.09% 46,275,799 9.63% 6.0542%1995 2,729,122 -2.59% 47,045,163 1.66% 5.8011%1996 2,852,014 4.50% 51,303,275 9.05% 5.5591%1997 2,917,014 2.28% 54,716,089 6.65% 5.3312%1998 2,965,253 1.65% 53,931,954 -1.43% 5.4981%1999 2,879,246 -2.90% 56,653,616 5.05% 5.0822%2000 2,932,635 1.85% 59,104,981 4.33% 4.9617%2001 2,978,763 1.57% 59,620,280 0.87% 4.9962%2002 2,748,181 -7.74% 53,356,827 -10.51% 5.1506%2003 3,011,973 9.60% 55,304,532 3.65% 5.4462%2004 3,280,291 8.91% 60,755,865 9.86% 5.3991%
Forecast 2005 3,527,170 7.53% 66,268,381 9.07% 5.3226%2006 3,646,083 3.37% 68,502,520 3.37% 5.3226%2007 3,764,421 3.25% 70,725,843 3.25% 5.3226%2008 3,885,898 3.23% 73,008,147 3.23% 5.3226%2009 4,010,628 3.21% 75,351,574 3.21% 5.3226%2010 4,138,729 3.19% 77,758,337 3.19% 5.3226%2011 4,267,065 3.10% 80,169,509 3.10% 5.3226%2012 4,398,713 3.09% 82,642,913 3.09% 5.3226%2013 4,533,793 3.07% 85,180,784 3.07% 5.3226%2014 4,672,413 3.06% 87,785,181 3.06% 5.3226%2015 4,814,702 3.05% 90,458,497 3.05% 5.3226%2016 4,960,777 3.03% 93,202,949 3.03% 5.3226%2017 5,110,769 3.02% 96,020,999 3.02% 5.3226%2018 5,264,806 3.01% 98,915,034 3.01% 5.3226%2019 5,423,032 3.01% 101,887,791 3.01% 5.3226%2020 5,585,580 3.00% 104,941,743 3.00% 5.3226%2021 5,752,031 2.98% 108,069,007 2.99% 5.3226%2022 5,923,441 2.98% 111,289,463 2.98% 5.3226%2023 6,099,367 2.97% 114,594,760 2.97% 5.3226%2024 6,279,299 2.95% 117,975,306 2.95% 5.3226%2025 6,463,910 2.94% 121,443,780 2.94% 5.3226%
Average Annual Growth Rate 2004-2025: 3.28%
Notes:1/ Based on the constant PBI/Florida market share ratio of 5.3226% (Average market share ratio for the last 10 years 1995-2004).2/ FAA Terminal Area Forecasts.
Sources: Airport Management Records; FAA Terminal Area Forecasts; Ricondo & Associates, Inc.Prepared by: Ricondo & Associates, Inc., June 2005.
Total Passenger Enplanements Forecast - Market Share Approach PBI/Florida (Constant PBI/Florida Market Share Ratio) 1/
C-5
WPB310127161368.doc/063000015

Table C3-2
Year PBI Total Enplanements Annual Growth Florida Scheduled Enplanements 2/ Annual Growth PBI/Florida Market ShareHistoric 1980 1,299,838 - 25,487,605 - 5.0999%
1981 1,304,257 0.34% 23,267,780 -8.71% 5.6054%1982 1,601,782 22.81% 26,311,534 13.08% 6.0878%1983 1,867,794 16.61% 25,363,719 -3.60% 7.3640%1984 1,972,863 5.63% 26,309,691 3.73% 7.4986%1985 1,901,839 -3.60% 28,911,784 9.89% 6.5781%1986 2,093,833 10.10% 32,248,079 11.54% 6.4929%1987 2,332,750 11.41% 36,214,378 12.30% 6.4415%1988 2,518,739 7.97% 37,888,159 4.62% 6.6478%1989 2,583,523 2.57% 37,264,613 -1.65% 6.9329%1990 2,856,757 10.58% 40,242,636 7.99% 7.0988%1991 2,541,922 -11.02% 39,375,707 -2.15% 6.4556%1992 2,534,978 -0.27% 40,124,335 1.90% 6.3178%1993 2,544,757 0.39% 42,209,599 5.20% 6.0289%1994 2,801,615 10.09% 46,275,799 9.63% 6.0542%1995 2,729,122 -2.59% 47,045,163 1.66% 5.8011%1996 2,852,014 4.50% 51,303,275 9.05% 5.5591%1997 2,917,014 2.28% 54,716,089 6.65% 5.3312%1998 2,965,253 1.65% 53,931,954 -1.43% 5.4981%1999 2,879,246 -2.90% 56,653,616 5.05% 5.0822%2000 2,932,635 1.85% 59,104,981 4.33% 4.9617%2001 2,978,763 1.57% 59,620,280 0.87% 4.9962%2002 2,748,181 -7.74% 53,356,827 -10.51% 5.1506%2003 3,011,973 9.60% 55,304,532 3.65% 5.4462%2004 3,280,291 8.91% 60,755,865 9.86% 5.3991%
Forecast 2005 3,586,742 9.34% 66,268,381 9.07% 5.4124%2006 3,716,785 3.63% 68,502,520 3.37% 5.4258%2007 3,846,833 3.50% 70,725,843 3.25% 5.4391%2008 3,980,690 3.48% 73,008,147 3.23% 5.4524%2009 4,118,496 3.46% 75,351,574 3.21% 5.4657%2010 4,260,395 3.45% 77,758,337 3.19% 5.4790%2011 4,403,178 3.35% 80,169,509 3.10% 5.4923%2012 4,550,029 3.34% 82,642,913 3.09% 5.5056%2013 4,701,096 3.32% 85,180,784 3.07% 5.5190%2014 4,856,520 3.31% 87,785,181 3.06% 5.5323%2015 5,016,459 3.29% 90,458,497 3.05% 5.5456%2016 5,181,064 3.28% 93,202,949 3.03% 5.5589%2017 5,350,502 3.27% 96,020,999 3.02% 5.5722%2018 5,524,933 3.26% 98,915,034 3.01% 5.5855%2019 5,704,543 3.25% 101,887,791 3.01% 5.5988%2020 5,889,502 3.24% 104,941,743 3.00% 5.6122%2021 6,079,302 3.22% 108,067,306 2.98% 5.6255%2022 6,274,034 3.20% 111,265,569 2.96% 5.6388%2023 6,473,788 3.18% 114,537,624 2.94% 5.6521%2024 6,678,656 3.16% 117,884,563 2.92% 5.6654%2025 6,888,688 3.14% 121,307,482 2.90% 5.6787%
Average Annual Growth Rate 2004-2025: 3.60%
Notes:1/ Based on an increasing PBI/Florida market share ratio of 5.6787% (Average market share ratio for the last 15 years 1990-2004).2/ FAA Terminal Area Forecasts.
Sources: Airport Management Records; FAA Terminal Area Forecasts; Ricondo & Associates, Inc.Prepared by: Ricondo & Associates, Inc., June 2005.
Total Passenger Enplanements Forecast - Market Share Approach PBI/Florida (Increasing PBI/Florida Market Share Ratio) 1/
C-6
WPB310127161368.doc/063000015
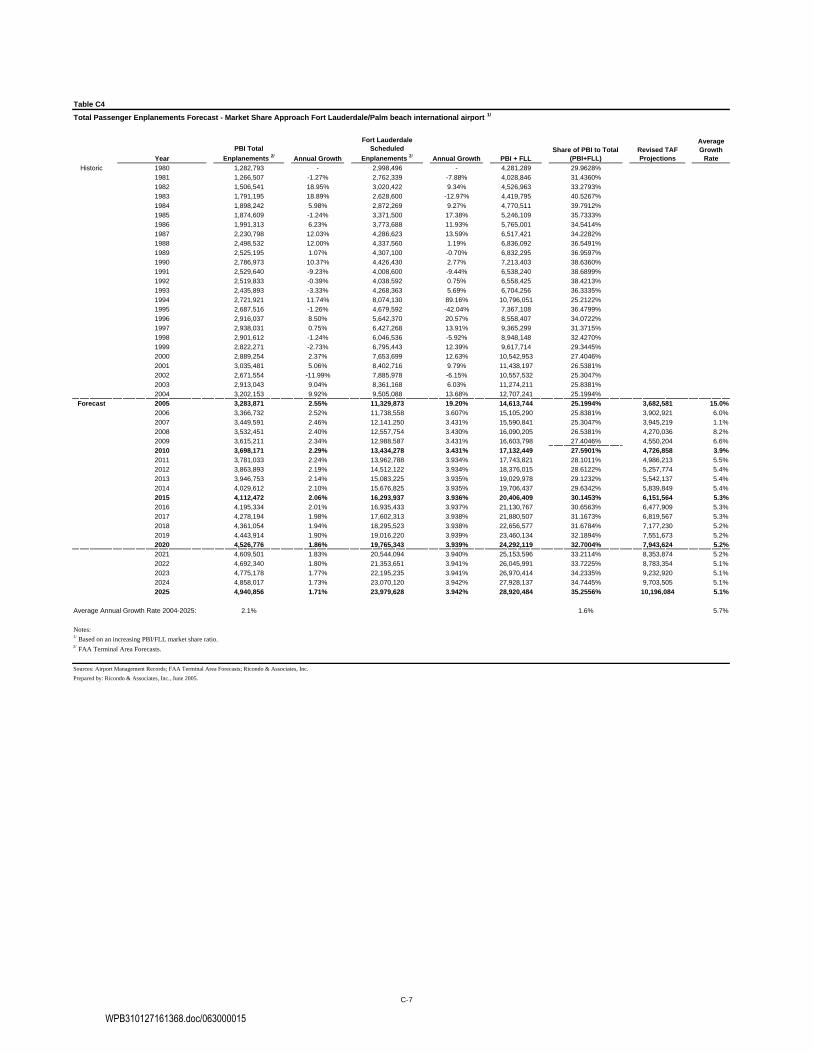
Table C4
YearPBI Total
Enplanements 2/ Annual Growth
Fort Lauderdale Scheduled
Enplanements 2/ Annual Growth PBI + FLLShare of PBI to Total
(PBI+FLL)Revised TAF Projections
Average Growth
RateHistoric 1980 1,282,793 - 2,998,496 - 4,281,289 29.9628%
1981 1,266,507 -1.27% 2,762,339 -7.88% 4,028,846 31.4360%1982 1,506,541 18.95% 3,020,422 9.34% 4,526,963 33.2793%1983 1,791,195 18.89% 2,628,600 -12.97% 4,419,795 40.5267%1984 1,898,242 5.98% 2,872,269 9.27% 4,770,511 39.7912%1985 1,874,609 -1.24% 3,371,500 17.38% 5,246,109 35.7333%1986 1,991,313 6.23% 3,773,688 11.93% 5,765,001 34.5414%1987 2,230,798 12.03% 4,286,623 13.59% 6,517,421 34.2282%1988 2,498,532 12.00% 4,337,560 1.19% 6,836,092 36.5491%1989 2,525,195 1.07% 4,307,100 -0.70% 6,832,295 36.9597%1990 2,786,973 10.37% 4,426,430 2.77% 7,213,403 38.6360%1991 2,529,640 -9.23% 4,008,600 -9.44% 6,538,240 38.6899%1992 2,519,833 -0.39% 4,038,592 0.75% 6,558,425 38.4213%1993 2,435,893 -3.33% 4,268,363 5.69% 6,704,256 36.3335%1994 2,721,921 11.74% 8,074,130 89.16% 10,796,051 25.2122%1995 2,687,516 -1.26% 4,679,592 -42.04% 7,367,108 36.4799%1996 2,916,037 8.50% 5,642,370 20.57% 8,558,407 34.0722%1997 2,938,031 0.75% 6,427,268 13.91% 9,365,299 31.3715%1998 2,901,612 -1.24% 6,046,536 -5.92% 8,948,148 32.4270%1999 2,822,271 -2.73% 6,795,443 12.39% 9,617,714 29.3445%2000 2,889,254 2.37% 7,653,699 12.63% 10,542,953 27.4046%2001 3,035,481 5.06% 8,402,716 9.79% 11,438,197 26.5381%2002 2,671,554 -11.99% 7,885,978 -6.15% 10,557,532 25.3047%2003 2,913,043 9.04% 8,361,168 6.03% 11,274,211 25.8381%2004 3,202,153 9.92% 9,505,088 13.68% 12,707,241 25.1994%
Forecast 2005 3,283,871 2.55% 11,329,873 19.20% 14,613,744 25.1994% 3,682,581 15.0%2006 3,366,732 2.52% 11,738,558 3.607% 15,105,290 25.8381% 3,902,921 6.0%2007 3,449,591 2.46% 12,141,250 3.431% 15,590,841 25.3047% 3,945,219 1.1%2008 3,532,451 2.40% 12,557,754 3.430% 16,090,205 26.5381% 4,270,036 8.2%2009 3,615,211 2.34% 12,988,587 3.431% 16,603,798 27.4046% 4,550,204 6.6%2010 3,698,171 2.29% 13,434,278 3.431% 17,132,449 27.5901% 4,726,858 3.9%2011 3,781,033 2.24% 13,962,788 3.934% 17,743,821 28.1011% 4,986,213 5.5%2012 3,863,893 2.19% 14,512,122 3.934% 18,376,015 28.6122% 5,257,774 5.4%2013 3,946,753 2.14% 15,083,225 3.935% 19,029,978 29.1232% 5,542,137 5.4%2014 4,029,612 2.10% 15,676,825 3.935% 19,706,437 29.6342% 5,839,849 5.4%2015 4,112,472 2.06% 16,293,937 3.936% 20,406,409 30.1453% 6,151,564 5.3%2016 4,195,334 2.01% 16,935,433 3.937% 21,130,767 30.6563% 6,477,909 5.3%2017 4,278,194 1.98% 17,602,313 3.938% 21,880,507 31.1673% 6,819,567 5.3%2018 4,361,054 1.94% 18,295,523 3.938% 22,656,577 31.6784% 7,177,230 5.2%2019 4,443,914 1.90% 19,016,220 3.939% 23,460,134 32.1894% 7,551,673 5.2%2020 4,526,776 1.86% 19,765,343 3.939% 24,292,119 32.7004% 7,943,624 5.2%2021 4,609,501 1.83% 20,544,094 3.940% 25,153,596 33.2114% 8,353,874 5.2%2022 4,692,340 1.80% 21,353,651 3.941% 26,045,991 33.7225% 8,783,354 5.1%2023 4,775,178 1.77% 22,195,235 3.941% 26,970,414 34.2335% 9,232,920 5.1%2024 4,858,017 1.73% 23,070,120 3.942% 27,928,137 34.7445% 9,703,505 5.1%2025 4,940,856 1.71% 23,979,628 3.942% 28,920,484 35.2556% 10,196,084 5.1%
2.1% 1.6% 5.7%
Notes:1/ Based on an increasing PBI/FLL market share ratio. 2/ FAA Terminal Area Forecasts.
Sources: Airport Management Records; FAA Terminal Area Forecasts; Ricondo & Associates, Inc.Prepared by: Ricondo & Associates, Inc., June 2005.
Average Annual Growth Rate 2004-2025:
Total Passenger Enplanements Forecast - Market Share Approach Fort Lauderdale/Palm beach international airport 1/
C-7
WPB310127161368.doc/063000015


Appendix D: Alternative Demand Scenarios
WPB310127161368.doc/063000015


Palm Beach International Airport
Appendix D Alternative Demand Scenarios
D-1
Two alternative demand scenarios were developed in addition to the baseline forecast defined for Palm Beach International Airport (PBI) in order to provide a basis for defining the level of flexibility to adjust to changing circumstances necessary for facility planning. While the baseline forecast represents the most likely growth scenario for the Airport, alternative demand scenarios are used to define potential alternate activity levels and demand characteristics that could materialize based on historic conditions and changes that are emerging in the industry. These changes could influence future activity in a manner different than that defined in the baseline condition. Therefore, demand scenarios are not intended to reflect a forecast of aviation demand, rather they are designed to illustrate a range of possibilities in aviation demand and activity that could occur during the planning horizon to ensure the ability of the airport to respond to changes in demand and activity patterns. Given the current state of the airline industry and the number of changes and factors affecting the aviation industry, as well as the influence of the Fort Lauderdale International Airport (FLL) over PBI, two alternative demand scenarios were developed. One scenario focused on the changing service patterns that are being driven by Legacy carrier business model changes and is based on potential changes in the fleet mix used to serve PBI in both the mainline domestic marketplace and in the regional commuter marketplace. The second scenario reviewed historic market-capture rates between PBI and FLL. It evaluated the affect of a return to the passenger market relationship that existed in the early 1990’s between FLL and PBI in terms of passenger volumes and the level of operational activity that would be required to meet this demand. A third scenario that combines the previous two scenarios was also assessed.
Fleet Mix Change Scenario This scenario assumes an aggressive growth in the use of the regional airline fleet to meet passenger activity at PBI, along with a conversion of the mainline carriers’ fleet to one consisting almost exclusively of smaller narrow body transports (A319, A320, B737, B757). Wide body aircraft activities are not considered in this scenario. Under this scenario, it was assumed that utilization of regional aircraft would increase over the planning period with regional enplanements accounting for 20 percent of total passenger enplanements by the end of the forecast period. The assumed increase in regional airline activity can be supported by a variety of factors, including ongoing domestic capacity reductions and fleet commonality actions on the part of legacy carriers, and the increasing use of regional airline partners to backfill markets that have seen reduced mainline gauge and operational activity. As discussed in Section 1 of this Report, under this scenario, the total passenger enplanements levels are assumed to be unchanged from the baseline forecast. While overall enplanements do not decrease, this scenario does result in a sharp increase in operational activity as it takes increased frequency to accommodate the level of projected passenger growth over the period.
High Growth Scenario This scenario was defined to illustrate PBI’s increased ability to effectively compete with FLL and to regain its market share from FLL. Factors that contribute to the plausibility of this scenario include the trend toward airfare equalization between the two airports, airfield capacity needs and increasing delays at FLL, along with traffic congestion on major roadways in the area and the increasing cost of fuel, which now plays a significant role in
WPB310127161368.doc/063000015
Palm Beach International Airport
Appendix D Alternative Demand Scenarios
D-2
considering a commute to FLL versus the use of PBI. The passenger enplanements levels resulting from the market share ratio of PBI/(PBI+FLL) (presented in Section 2 of this report) define the High Growth Scenario. Under this scenario, however, the aircraft fleet mix is assumed to remain consistent with that of the aircraft fleet mix developed under the baseline forecast. High Growth and Fleet Mix Change Scenario The final iteration of the scenario approach was to consider the affect on PBI should both the High Growth Scenario involving the recapture of market share from FLL were to occur, along with the fleet changes that are identified as a part of the Fleet Mix Change Scenario. As previously noted, the preceding scenarios developed in this analysis are founded on assumptions that are supported by historic market performance, along with documented trends and business model changes currently occurring in the airline industry. Development of the third scenario recognizes the fact that both scenarios are viable and that they would likely not occur independently of one another, but rather occur in an interdependent fashion. Thus, the third scenario is based on the combined impact of the two individual scenarios.
Aviation activities under the above demand scenarios were presented in terms of passenger enplanements, aircraft operations, fleet mix, and peaking characteristics. By assessing the potential impacts of these demand scenarios on facility requirements, it will be possible to determine development options that can be incrementally implemented, as demand dictates, to accommodate future activity.
D.1 Fleet Mix Change Scenario Over the period from 2001 through 2005, the commercial airline industry has experienced significant and fundamental changes in how they serve U.S. domestic markets. To some extent, these changes served as the rationale for the Fleet Mix Change Scenario that is presented in the following sections. Fundamental business model changes have occurred over the 2001-2005 time frame that have resulted in a number of actions, influencing how legacy and low-cost carriers are serving individual domestic markets. These changes include the following:
Legacy carriers have undertaken significant steps to achieve greater commonality in their aircraft fleets. American Airlines went from 14 aircraft types to just six over a four year period, and Delta is following much the same course with plans to have only seven aircraft types in their fleet (down from 14) in the very near future. This includes retirement of all of the airlines’ B767-200 series aircraft.
Airlines are replacing larger aircraft with regional jets on many routes with carriers such as
American Airlines, Delta Airlines, and US Airways leading the way in shifting service to regional commuter partners in both small and large markets. Even in the low cost segment, the acquisition of the 100 seat EMB-190 by Jet Blue suggests the possibility that service in a number of existing markets will be right-sized to better fit demand with the EMB-190 operating on those segments or during those times of day when an A320 would not be cost efficient.
WPB310127161368.doc/063000015
Palm Beach International Airport
Appendix D Alternative Demand Scenarios
D-3
Legacy carriers are implementing significant reductions in domestic capacity through shifting wide-body aircraft to international routes, while backfilling this service in domestic markets with narrow body aircraft and through the actions noted previously to better adjust seat availability to market demand. By year-end of 2005, it is estimated that Delta Airlines alone will have reduced its domestic seat capacity by 20 percent over what it was operating in 2000. Northwest Airlines, United, US Airways, and American Airlines have also taken actions to reduce their domestic capacities over this time frame by varying extents, generally ranging in the 7 to 15 percent range.
Low cost/low fare carriers, including Jet Blue, Southwest, Air Tran, and Frontier, continue
to operate fleets of one or two models of narrow-body single aisle commercial transports with seating ranges in the 100-seat to 160-seat range. The commonality of their fleets has been the hallmark of low cost/low fare service and is anticipated to continue as such. The specific aircraft operated by those carriers are as follows:1
Jet Blue Embraer 190 100 seats Airbus A320 156 seats
Frontier Airbus A319 132 seats Air Tran Boeing 717-200 117 seats
Boeing 737-700 137 seats Southwest Boeing 737-500 122 seats
Boeing 737-300 137 seats Boeing 737-700 137 seats
Spirit McDonnell Douglas MD80 150 seats
Airbus A319 138 seats
Regional commuter airlines will continue to see an increase in the size (seating capacity) of the fleet of aircraft that comprise their fleets as new models enter the market, including aircraft of up to 100-seat configurations. The popularity of 37-seat to 50-seat regional jets among carriers is, and will continue to decrease due to fuel costs and the cost per seat mile of operating these aircraft when compared with newly available larger regional jet models.
As regional carriers take on a larger role in the U.S. domestic marketplace and continue to
employ yield management strategies that have proven successful in the mainline carrier industry, load factors increase sharply when compared to historic levels. Load factors will increase to levels close to, but remain below that of, the domestic mainline market.
The major markets served from PBI all experience high levels of regional commuter
operations, with the exception of one which experiences less than 20 percent regional commuter operations. Examples of markets served from PBI with a high percent of regional commuter operations are listed below2:
1 Fleet data obtained from the JP Fleets Directory 2005/2006. 2 Data is for year 2002 as listed in the National Plan of Integrated Airport Systems 2005-2009, Page 16.
WPB310127161368.doc/063000015

Palm Beach International Airport
Appendix D Alternative Demand Scenarios
D-4
Houston (IAH) 38% Atlanta (ATL) 25% Chicago (ORD) 29% Dallas (DFW) 32% Baltimore (BWI) 21% Charlotte (CLT) 38% Philadelphia (PHL) 27% Tampa (TPA) 24% Cincinnati (DVG) 62% Cleveland (CLE) 35% Newark (EWR) 27% LaGuardia (LGA) 38% Detroit (DTW) 26% Orlando (MCO) 22% Pittsburgh (PIT) 50%
Wash. National (DCA) 30% John F. Kennedy (JFK) 13% Based on the preceding trends and characteristics of the U.S. domestic airline marketplace, the following assumptions were developed as a basis for defining the fleet mix change scenario:
PBI will see the percentage of passenger enplanements accommodated by regional/commuter aircraft increase to an estimated 20 percent of all passenger enplanements by the end of the 20-year planning period.
The size of the fleet of regional aircraft will grow over the planning period with the introduction of 60-seat to 70-seat regional aircraft, and the removal of the current fleet of 19-seat turbo-prop aircraft over the 20-year period.
While currently counted by the FAA as mainline aircraft, the regional fleet will also see an
increasing number of 80-seat, 90-seat, and 100-seat aircraft types such as the CRJ-900 and the EMB-175, EMB-190, and EMB-195.
Mainline legacy carriers will reduce the gauge (seating capacity) of the aircraft fleet serving
many U.S. domestic markets, including PBI, by removing wide body transports from these markets and replacing that service with more frequent regional and narrow body aircraft flights. . Balancing seat capacity with market demand will be a priority. Thus, load factors will remain in the mid to high 70 percent range for legacy carriers, and will increase even more aggressively for regional carriers.
In addition to feeding hubs of mainline partners, regional carriers will see an increasing role
providing point-to-point service between small and mid-sized markets.
The pattern of fleet commonality typical of the low cost/low fare airlines will not substantially change over the planning period.
Legacy carriers will continue to move towards fleet commonality, and that will be a typical
characteristic of those carriers over the planning period. The Fleet Mix Change Scenario developed using the above assumptions is presented in the following sections.
D.1-1 Passenger Enplanements Total annual passenger enplanement levels under this scenario were assumed to remain unchanged from the baseline forecast, totaling 6,463,910 in 2025, since the other markets that primarily compete with PBI are being influenced by the same industry changes. The
WPB310127161368.doc/063000015

Palm Beach International Airport
Appendix D Alternative Demand Scenarios
D-5
distribution by category, however, changed based on the assumptions previously discussed. As such, domestic-mainline, regional, and international passenger enplanements represent 77 percent, 20 percent, and 3 percent, respectively, of the total annual passenger enplanements in 2025, as summarized in Table D-1. TABLE D-1 Passenger Enplanements – Fleet Mix Change Scenario (Same as Baseline Forecast) Forecast 2004 Actual 2005 2010 2015 2020 2025
Domestic-Mainline 3,546,321 3,280,268 3,509,642 3,972,129 4,485,221 4,977,211
Regional 55,569 176,359 538,035 722,205 949,549 1,292,782
International 66,751 70,543 91,052 120,368 150,810 193,917
Total Passenger Enplanements 3,280,291 3,527,170 4,138,729 4,814,702 5,585,580 6,463,910 Source: Ricondo & Associates, Inc. Prepared by: Ricondo & Associates, Inc.
D.1-2 Fleet Mix and Aircraft Operations The methodology used to derive aircraft operations under this scenario is consistent with the approach used for developing aircraft operations projections for the baseline forecast. The Fleet Mix Change Scenario affects air carriers’ scheduled operations by adjusting the distribution of passengers between mainline and regional carriers and by revising assumed fleet composition through a reduction in the size of aircraft anticipated to serve the market. Tables D-2, D-3, and D-4 summarize the projection of mainline-domestic and regional aircraft operations based on the assumed changes in the fleet mix. The projected level of international traffic was not changed under the scenario. Table D-5 summarizes the total aircraft operations by type of activity. Compared to the baseline forecast, the Fleet Mix Change Scenario results in a projected 162,919 operations in 2025, which represent approximately a 32 percent increase from the baseline forecast of 123,584 operations for the same timeframe. This increase is due primarily to the increased role of the regional commuter aircraft as assumed in this scenario, while a smaller affect is associated with the reduction in the level of wide body activity as B757 aircraft are replaced with smaller narrow-body aircraft, such as the Boeing B717, B737 series, and the Airbus A319/A320 models. TABLE D-2 Projection of Domestic-Mainline Carrier Operations 1/ Forecast
Fleet Mix Seating Range 2005 2010 2015 2020 2025 220 and above 3.5% 0.0% 0.0% 1.0% 1.4%
190-219 12.5% 7.0% 5.0% 4.0% 2.0% 170-189 8.0% 5.0% 4.3% 2.0% 2.0%
160-169 0.0% 3.6% 4.0% 4.0% 4.0%
150-159 13.0% 16.0% 18.3% 20.5% 21.0% 140-149 23.5% 20.4% 19.9% 19.5% 19.0%
130-139 15.0% 16.0% 16.3% 16.5% 16.6% 120-129 15.5% 15.5% 15.5% 15.5% 15.5%
110-119 6.0% 5.4% 3.7% 3.0% 2.5%
WPB310127161368.doc/063000015

Palm Beach International Airport
Appendix D Alternative Demand Scenarios
D-6
TABLE D-2 Projection of Domestic-Mainline Carrier Operations 1/ Forecast
Fleet Mix Seating Range 2005 2010 2015 2020 2025 100-109 3.0% 5.6% 6.5% 7.0% 7.5%
90-99 0.0% 5.0% 5.5% 5.5% 6.5%
71-89 0.0% 0.5% 1.0% 1.5% 2.0% Average Seats per Departure 152 141 140 139 138
Boarding Load Factor 76.06% 77.0% 77.25% 77.5% 78.0% Enplanements per Departure 115.85 108.75 107.93 107.90 107.34
Enplanements 3,280,268 3,509,642 3,972,129 4,485,221 4,977,211 Annual Departures 28,315 32,274 36,804 41,567 46,367
Annual Operations 56,629 64,548 73,608 83,134 92,734 Notes: 1/ Totals may not add due to rounding. Source: Ricondo & Associates, Inc. Prepared by: Ricondo & Associates, Inc. TABLE D-3 Projection of U.S. and Foreign Flag International Carrier Operations 1/
Forecast Fleet Mix Seating Range 2005 2010 2015 2020 2025
220 and above 0.0% 2.0% 2.5% 3.0% 3.5% 170-199 0.0% 1.5% 2.0% 3.0% 4.0%
130-169 28.1% 30.0% 31.0% 31.5% 32.0% 110-129 9.4% 13.0% 16.0% 17.5% 20.5%
90-109 0.0% 13.5% 27.5% 34.0% 35.0% 0-89 62.5% 40.0% 21.0% 11.0% 5.0%
Average Seats per Departure 86 103 115 122 128
Boarding Load Factor 70.0% 71.0% 71.5% 72.0% 72.5% Enplanements per Departure 59.87 73.2 82.23 88.08 92.78
Enplanements 70,543 91,052 120,368 150,811 193,917 Annual Departures 1,178 1,244 1,464 1,712 2,091
Annual Operations 2,356 2,488 2,928 3,424 4,180 Notes: 1/ Totals may not add due to rounding. Source: Ricondo & Associates, Inc. Prepared by: Ricondo & Associates, Inc.
WPB310127161368.doc/063000015

Palm Beach International Airport
Appendix D Alternative Demand Scenarios
D-7
Table D-4 Projection of Regional/Commuter Carrier Operations 1/
Forecast Fleet Mix Seating Range 2005 2010 2015 2020 2025
70 seats 6.10% 15.0% 22.5% 26.0% 29.0% 60-69 0.0% 8.0% 14.0% 16.0% 18.0%
50-59 28.0% 30.0% 30.5% 30.0% 30.0% 40-49 0.0% 6.0% 8.0% 9.0% 9.0%
20-39 15.36% 16.0% 16.0% 15.0% 14.0% 0-19 50.54% 25.0% 9.0% 4.0% 0.0%
Average Seats per Departure 34 44 51 54 56
Boarding Load Factor 60.0% 64.0% 66.0% 68. 0% 70.0% Enplanements per Departure 20.136 28.115 33.732 36.523 39.172
Enplanements 176,359 538,035 722,205 949,549 1,292.782 Annual Departures 8,758 19,137 21,410 25,999 33,003
Annual Operations 17,516 38,274 42,819 51,998 66,006 Notes: 1/ Totals may not add due to rounding. Source: Ricondo & Associates, Inc. Prepared by: Ricondo & Associates, Inc.
TABLE D-5 Aircraft Operations Summary – Fleet Mix Change Scenario
Forecast 2005 2010 2015 2020 2025
Domestic-Mainline 56,629 64,548 73,608 83,134 92,734
Regional 17,516 38,274 42,819 51,998 66,005
International 2,356 2,488 2,928 3,424 4,180
Total Aircraft Operations 76,501 105,310 119,355 138,556 162,919 Notes: 1/ Totals may not add due to rounding. Source: Ricondo & Associates, Inc. Prepared by: Ricondo & Associates, Inc.
D.1-3 Peaking Characteristics Table D-6 summarizes the passenger enplanements peaking characteristics. As shown, the total aggregate numbers are somewhat similar to those of the baseline forecast in Table 8-10 of the main report. This reflects the unchanged nature of the annual passenger enplanement levels assumed under this scenario. The differences that do occur in the peaking characteristics are the result of the re-distribution of passenger enplanement activity between the domestic-mainline category and the regional/commuter category of passenger activity.
WPB310127161368.doc/063000015

Palm Beach International Airport
Appendix D Alternative Demand Scenarios
D-8
TABLE D-6 Total Passenger Enplanements Peaking Characteristics - Fleet Mix Change Scenario Forecast Passenger Enplanements: 2005 2010 2015 2020 2025 Annual Domestic-Mainline 3,280,268 3,509,642 3,972,129 4,485,221 4,977,211 International 70,543 91,052 120,368 150,810 193,917
Regional/Commuters 176,359 538,035 722,205 949,549 1,292,782
Total 3,527,170 4,138,729 4,814,702 5,585,580 6,463,910
Peak Month Domestic-Mainline 377,125 442,513 514,788 597,210 691,121
International 8,888 10,430 12,133 14,076 16,289 Regional/Commuters 37,247 43,705 50,843 58,984 68,259
Total 423,260 496,647 577,764 670,270 775,669
Peak Month Average Day Domestic-Mainline 12,165 14,275 16,606 19,265 22,294
International 287 336 391 454 525 Regional/Commuters 1,202 1,410 1,640 1,903 2,202
Total 13,654 16,021 18,638 21,622 25,022 Source: Ricondo & Associates, Inc. Prepared by: Ricondo & Associates, Inc. Table D-7 presents the aircraft operations peaking characteristics for the Fleet Mix Change Scenario. As shown, only the air carrier operations were affected. Based on the assumed re-allocation of enplaned passengers to a higher percentage of passengers being accommodated within the regional commuter category, annual operations, specifically for regional air carriers, grow at a more robust rate than under the baseline condition. For the Fleet Mix Change Scenario, regional commuter aircraft operations represent approximately 23 percent in 2005, 36 percent of commercial passenger operations in 2010 and 2015 respectively, 38 percent in 2020, and 41 percent of all passenger aircraft operations in 2025. TABLE D-7 Total Aircraft Operations Peaking Characteristics – Fleet Mix Change Scenario Forecast 2005 2010 2015 2020 2025
Aircraft Operations: Annual Domestic-Mainline 56,629 64,548 73,608 83,134 92,734
International 2,356 2,488 2,928 3,424 4,180 Regional/Commuters 17,516 38,274 42,819 51,998 66,005
Total Air Carrier 76,501 105,310 119,355 138,556 162,919 All-Cargo 1,876 1,936 1,999 2,063 2,130 General Aviation/Air Taxi 128,823 131,592 134,447 137,392 140,430
WPB310127161368.doc/063000015

Palm Beach International Airport
Appendix D Alternative Demand Scenarios
D-9
TABLE D-7 Total Aircraft Operations Peaking Characteristics – Fleet Mix Change Scenario Forecast 2005 2010 2015 2020 2025 Military 1,500 1,500 1,500 1,500 1,500
Total - All 208,700 240,338 257,301 279,511 306,979
Peak Month
Domestic-Mainline 5,891 8,109 9,190 10,669 12,545 International 230 316 358 416 489
Regional/Commuters 1,530 2,106 2,387 2,771 3,258
Total Air Carrier 7,650 10,531 11,936 13,856 16,292 All-Cargo 173 178 184 189 196
General Aviation/Air Taxi 14,557 14,870 15,193 15,525 15,869 Military 168 168 168 168 168
Total - All 22,548 25,747 27,481 29,738 32,525
Peak Month Average Day Domestic-Mainline 190 262 296 344 405
International 7 10 12 13 16 Regional/Commuters 49 68 77 89 105
Total Air Carrier 247 340 385 447 526 All-Cargo 6 6 6 7 7 General Aviation/Air Taxi 470 480 490 501 512
Military 6 6 6 6 6
Total - All 729 832 887 961 1,051 Source: Ricondo & Associates, Inc. Prepared by: Ricondo & Associates, Inc.
D.2 High Growth Scenario The level of passenger enplanements and aircraft operations, along with the aircraft fleet mix and peaking characteristics associated with the High Growth Scenario, are presented below. The assumptions supporting PBI’s increased ability to regain its market share from FLL are as follows:
Historically, FLL was identified as a low cost/low fare alternative to PBI. Through the last half of the 1990’s up through 2002, FLL had successfully increased its share of the passenger market in southeast Florida, capturing a significant component of passenger traffic, from what had previously been the PBI market. Since 2002, the gap between airfares on low cost/low fare carriers versus legacy carriers has narrowed considerably. Indications are that while legacy carriers may not reach fare levels of the low cost carriers in all markets, the disparity between low fare and legacy carriers, typical of the last half of the 1990’s, will not re-emerge. Thus, a key assumption of this assessment is that the trend toward airfare equalization between FLL and PBI, which has typified the last three years, will remain over the long term, and disparity in airfares between markets will be significantly reduced as a factor in choice of airport.
Airfield capacity deficiencies and increasing delays that have occurred at FLL over the last several years will contribute to PBI’s recapture of passenger traffic. The lack of flight
WPB310127161368.doc/063000015

Palm Beach International Airport
Appendix D Alternative Demand Scenarios
D-10
reliability, delay, and missed connections as a result of that delay, will contribute to passengers opting to consider the alternative use of PBI for their travel purposes. This is particularly true when the equalization of airfares is taken into consideration, and the fact that PBI is equally convenient to many consumers who use FLL solely because of price. Even if airfares were somewhat higher at PBI, a portion of the traveling public would choose to use PBI if it meant that the potential for missed connections due to delays could be avoided.
Traffic congestion on major roadways in the Fort Lauderdale area will impede and discourage access to the Airport. The roadway network in southeast Florida, particularly the interstate and major arterial routes, is heavily congested, and not just during typical peak periods throughout the morning and evening hours. This congestion translates into increased travel time to and from the airport and the need to factor this added commute time into the overall travel itinerary. While this may not be a major consideration for leisure travelers, it is a considerable factor for business travelers who realize higher costs due to lost productivity with increased travel time. With the equalization of airfares between the two markets, productivity costs can no longer be offset by airfare differential.
The increasing cost of fuel will negatively affect long commutes from Palm Beach, Martin, St. Lucie, and Indian River Counties to FLL. FLL has drawn passengers from relatively remote places due to the difference in airfares when compared to PBI. This was particularly true when the cost of auto fuel was in the one dollar to one dollar and fifty cent range. With the price of gas over two dollars a gallon and no expectation that it will drop below this level, the increased cost of commuting is a real consideration factored into consumer decisions with regard to choosing an airport.
It is assumed that the aircraft fleet mix developed under the PBI baseline forecast is unchanged for the High Growth Demand Scenario. Similarly, the methodology and assumptions utilized to derive the peaking characteristics are assumed unchanged. The High Growth Scenario developed, using the above assumptions, is presented in the following sections.
D.2-1 Passenger Enplanements As presented in Section 2.2 of this Forecast, passenger enplanement projections varied from 5.6 to 10.1 million in 2025 based on the various market share ratios. Specifically, the PBI/(PBI+FLL) increasing market share ratio assumed PBI would recover its former market capture rate that was last experienced in the mid 1990s. Based on this assumption, PBI would experience a projected 10.1 million passenger enplanements in 2025, as summarized in Table D-8. It is assumed that the shares of domestic-mainline, regional, and international passenger enplanements remain unchanged from those assumed under the baseline forecast for purposes of this scenario.
D.2-2 Fleet Mix and Aircraft Operations The fleet mix for this scenario is assumed unchanged from the baseline forecast, as summarized in Table 4-1 of the main report. Because the scenario is based on an assumed change in passenger enplanements, the net effect of the change is to increase the level of commercial passenger aircraft operations that would be required to accommodate the increased passenger
WPB310127161368.doc/063000015

Palm Beach International Airport
Appendix D Alternative Demand Scenarios
D-11
levels. Adjustments were made to the level of domestic mainline, regional commuter, and international carrier operations to reflect the higher level of activity assumed under the scenario. The methodology for developing the adjusted commercial operations projections was the same as that employed to project operations under the baseline forecast. Air cargo, general aviation, and military operations are assumed to be unchanged from the baseline forecast. Table D-9 summarizes the projections of aircraft operations by type of activity. Compared to the baseline forecast, air carrier aircraft operations increase by approximately 58 percent in 2025.
D.2-3 Peaking Characteristics The methodology and assumptions utilized to derive the peaking patterns under the baseline scenario were used to derive the peaking characteristics for the high growth scenario. Tables D-10 and D-11 summarize the annual passenger enplanements and aircraft operations peaking characteristics. TABLE D-8 Passenger Enplanements Summary – High Growth Scenario1/
Forecast 2004 Actual 2005 2010 2015 2020 2025
Domestic-Mainline 3,546,321 3,546,321 4,518,878 5,819,388 7,427,307 9,380,397
Regional 55,569 62,604 103,991 178,396 301,858 509,804
International 66,751 73,652 103,991 153,789 214,478 305,883
Total Passenger Enplanements 3,280,291 3,682,577 4,726,860 6,151,573 7,943,643 10,196,084 Total Passenger Enplanements -Average Annual Growth Rate (2004-2025): 5.7% Notes: Source: Ricondo & Associates, Inc. Prepared by: Ricondo & Associates, Inc. 1/ Based on PBI/(PBI+FLL) increasing market share ratio, returning PBI to its former market capture rate of 1995/1996 in 2025. The shares of
domestic-mainline, regional, and international passenger enplanements remain unchanged from those assumed under the baseline forecast. These are as follows:
Share of Passenger Enplanements
Mainline Domestic
Regional International Total
Actual 2004 96.3% 1.7% 2.0% 100.0%
2005 96.3% 1.7% 2.0% 100.0%
2010 95.6% 2.2% 2.2% 100.0%
2015 94.6% 2.9% 2.5% 100.0%
2020 93.5% 3.8% 2.7% 100.0%
2025 92.0% 5.0% 3.0% 100.0%
WPB310127161368.doc/063000015

Palm Beach International Airport
Appendix D Alternative Demand Scenarios
D-12
TABLE D-9 Aircraft Operations Summary – High Growth Scenario
Forecast 2005 2010 2015 2020 2025 Annual Aircraft Operations:
Domestic-Mainline 60,818 76,745 97,718 123,703 155,899
International 2,422 2,841 3,740 4,870 6,593
Regional/Commuters 6,757 9,242 13,639 20,753 32,447
Total Air Carrier 69,998 88,828 115,097 149,326 194,939
All-Cargo 1,876 1,936 1,999 2,063 2,130
General Aviation/Air Taxi 128,823 131,592 134,447 137,392 140,430
Military 1,500 1,500 1,500 1,500 1,500
Total - All 202,197 223,856 253,043 290,281 338,999 Source: Ricondo & Associates, Inc. Prepared by: Ricondo & Associates, Inc. TABLE D-10 Total Passenger Enplanements Peaking Characteristics – High Growth Scenario
Forecast 2005 2010 2015 2020 2025
Passenger Enplanements:
Annual
Domestic-Mainline 3,546,321 4,518,878 5,819,388 7,427,307 9,380,397
International 73,652 103,991 153,789 214,478 305,883
Regional/Commuters 62,604 103,991 178,396 301,858 509,804
Total 3,682,577 4,726,860 6,151,573 7,943,643 10,196,084
Peak Month
Domestic-Mainline 422,907 542,833 706,447 912,248 1,170,918
International 9,722 12,479 16,240 20,971 26,918
Regional/Commuters 9,280 11,912 15,502 20,018 25,694
Total 441,909 567,223 738,189 953,237 1,223,530
Peak Month Average Day
Domestic-Mainline 13,642 17,511 22,789 29,427 37,772
International 314 403 524 676 868
Regional/Commuters 299 384 500 646 829
Total 14,255 18,298 23,813 30,750 39,469 Source: Ricondo and Associates, Inc. Prepared by: Ricondo & Associates, Inc.
WPB310127161368.doc/063000015

Palm Beach International Airport
Appendix D Alternative Demand Scenarios
D-13
TABLE D-11 Total Operations Peaking Characteristics - High Growth Scenario Forecast 2005 2010 2015 2020 2025
Aircraft Operations:
Annual
Domestic-Mainline 60,818 76,745 97,718 123,703 155,899
International 2,422 2,841 3,740 4,870 6,593
Regional/Commuters 6,757 9,242 13,639 20,753 32,447
Total Air Carrier 69,998 88,828 115,097 149,326 194,939 All-Cargo 1,876 1,936 1,999 2,063 2,130
General Aviation/Air Taxi 128,823 131,592 134,447 137,392 140,430
Military 1,500 1,500 1,500 1,500 1,500
Total - All 202,197 223,856 253,043 290,281 338,999
Peak Month
Domestic-Mainline 5,775 7,328 9,496 12,319 16,082
International 714 906 1,174 1,523 1,988
Regional/Commuters 511 648 840 1,090 1,423
Total Air Carrier 7,000 8,883 11,510 14,933 19,494 All-Cargo 173 178 184 189 196
General Aviation/Air Taxi 14,557 14,870 15,193 15,525 15,869
Military 168 168 168 168 168
Total - All 21,898 24,099 27,055 30,815 35,727
Peak Month Average Day
Domestic-Mainline 186 236 306 397 519
International 23 29 38 49 64
Regional/Commuters 16 21 27 35 46
Total Air Carrier 226 287 371 482 629 All-Cargo 6 6 6 7 7
General Aviation/Air Taxi 470 480 490 501 512
Military 6 6 6 6 6
Total - All 708 779 873 996 1,154 Source: Ricondo and Associates, Inc. Prepared by: Ricondo & Associates, Inc.
D.3 High Growth and Fleet Mix Change Scenario The third scenario combines the High Growth and Fleet Mix Change Scenarios to consider the affect on PBI should both scenarios occur concurrently. While the majority of the assumptions generated under the two scenarios discussed previously would still apply to this scenario, some adjustments to the fleet mix scenario were made to reflect the potential fleet that would be associated with the PBI marketplace, assuming it were to recover all previously lost market share and reach a 2025 enplanement level of approximately 10.1 million passengers. While it is still assumed that much of the fleet serving PBI would consist of narrow-body transports, such
WPB310127161368.doc/063000015

Palm Beach International Airport
Appendix D Alternative Demand Scenarios
D-14
as the A319, B737 series and A320 along with the introduction of new aircraft, such as the EMB-190/195, the passenger enplanements demand level under this scenario would be sufficient to generate long-haul domestic non-stop service to west coast destinations such as Las Vegas, Los Angeles, San Francisco, and Seattle, which will continue to see some wide-body aircraft service. This consideration was reflected in the fleet mix assumptions under High Growth and Fleet Mix Change Scenario. Passenger enplanements, aircraft operations, and peaking characteristics are summarized in Tables D-12 through D-15. TABLE D-12 Passenger Enplanements Summary – High Growth and Fleet Mix Change Scenario
Forecast 2004 Actual 2005 2010 2015 2020 2025 Domestic-Mainline 3,157,971 3,424,800 4,008,376 5,075,040 6,378,730 7,850,985 Regional 55,569 184,129 614,492 922,735 1,350,416 2,039,217 International 66,751 73,652 103,991 153,789 214,478 305,883
Total Passenger Enplanements 3,280,291 3,682,581 4,726,858 6,151,564 7,943,624 10,196,084 Total Passenger Enplanements -Average Annual Growth Rate (2004-2025): 5.7% Source: Ricondo and Associates, Inc. Prepared by: Ricondo & Associates, Inc. As shown, total passenger enplanements remain unchanged from those assumed under the High Growth Scenario. However, the distribution between each category varies due to the impact of the change in the fleet mix. Table D-13 summarizes the air carrier aircraft operations. TABLE D-13 Aircraft Operations Summary - High Growth and Fleet Mix Change Scenario
Forecast 2005 2010 2015 2020 2025 Domestic-Mainline 58,734 72,965 91,924 114,241 140,059 Regional 18,288 43,712 54,709 73,949 104,116 International 2,422 2,841 3,740 4,870 6,593
Total Aircraft Operations 79,445 119,519 150,373 193,060 250,769 Source: Ricondo & Associates, Inc. Prepared by: Ricondo & Associates, Inc. TABLE D-14 Total Passenger Enplanements Peaking Characteristics – High Growth and Fleet Mix Change Scenario
Forecast 2005 2010 2015 2020 2025
Passenger Enplanements: Annual
Domestic-Mainline 3,424,800 4,008,376 5,075,040 6,378,730 7,850,985 International 73,652 103,991 153,789 214,478 305,883
Regional/Commuters 184,129 614,492 922,735 1,350,416 2,039,217
Total 3,682,581 4,726,858 6,151,564 7,943,624 10,196,084
WPB310127161368.doc/063000015

Palm Beach International Airport
Appendix D Alternative Demand Scenarios
D-15
TABLE D-14 Total Passenger Enplanements Peaking Characteristics – High Growth and Fleet Mix Change Scenario
Forecast 2005 2010 2015 2020 2025
Peak Month Domestic-Mainline 422,908 542,832 706,446 912,246 1,170,918 International 9,722 12,479 16,240 20,971 26,918
Regional/Commuters 9,280 11,912 15,502 20,018 25,694
Total 441,910 567,223 738,188 953,235 1,223,530
Peak Month Average Day Domestic-Mainline 13,642 17,511 22,789 29,427 37,772
International 314 403 524 676 868 Regional/Commuters 299 384 500 646 829
Total 14,255 18,298 23,813 30,750 39,469 Source: Ricondo and Associates, Inc. Prepared by: Ricondo & Associates, Inc. TABLE D-15 Total Operations Peaking Characteristics - High Growth and Fleet Mix Change Scenario Forecast 2005 2010 2015 2020 2025
Aircraft Operations:
Annual Domestic-Mainline 58,734 72,965 91,924 114,241 140,059
International 2,422 2,841 3,740 4,870 6,593 Regional/Commuters 18,288 43,712 54,709 73,949 104,116
Total Air Carrier 79,445 119,519 150,373 193,060 250,769 All-Cargo 1,876 1,936 1,999 2,063 2,130 General Aviation/Air Taxi 128,823 131,592 134,447 137,392 140,430
Military 1,500 1,500 1,500 1,500 1,500
Total - All 211,644 254,547 288,319 334,015 394,829
Peak Month Domestic-Mainline 6,554 9,860 12,406 15,927 20,688 International 810 1,219 1,534 1,969 2,558
Regional/Commuters 580 872 1,098 1,409 1,831
Total Air Carrier 7,944 11,952 15,037 19,306 25,077 All-Cargo 173 178 184 189 196 General Aviation/Air Taxi 14,557 14,870 15,193 15,525 15,869
Military 168 168 168 168 168
Total - All 22,842 27,168 30,582 35,188 41,310
Peak Month Average Day Domestic-Mainline 211 318 400 514 667
International 26 39 49 64 83 Regional/Commuters 19 28 35 45 59
WPB310127161368.doc/063000015

Palm Beach International Airport
Appendix D Alternative Demand Scenarios
D-16
TABLE D-15 Total Operations Peaking Characteristics - High Growth and Fleet Mix Change Scenario Forecast 2005 2010 2015 2020 2025 Total Air Carrier 256 386 485 623 809 All-Cargo 6 6 6 7 7
General Aviation/Air Taxi 470 480 490 501 512 Military 6 6 6 6 6
Total - All 738 878 987 1,137 1,334 Source: Ricondo and Associates, Inc. Prepared by: Ricondo & Associates, Inc.
D.4 Comparison Summary between Baseline and Demand Scenarios Table D-16 provides a comparison of the baseline forecast passenger enplanements and aircraft operations with those developed under the various demand scenarios previously presented.
WPB310127161368.doc/063000015

Palm Beach International Airport
Appendix D Alternative Demand Scenarios
D-17
TABLE D-16 Passenger Enplanements and Aircraft Operations Comparison Summary
Source: Ricondo & Associates, Inc. Prepared by: Ricondo & Associates, Inc.
2005 2010 2015 Baseline Scenario 11/ Scenario 22/ Scenario 33/ Baseline Scenario 11/ Scenario 22/ Scenario 33/ Baseline Scenario 11/ Scenario 22/ Scenario 33/ Passenger Enplanements: Domestic-Mainline 3,396,665 3,280,268 3,546,321 3,424,800 3,956,625 3,509,642 4,518,878 4,008,376 4,554,708 3,972,129 5,819,388 5,075,040 Regional 59,962 176,359 62,604 184,129 91,052 538,035 103,991 614,492 139,626 722,205 178,396 922,735 International 70,543 70,543 73,652 73,652 91,052 91,052 103,991 103,991 120,368 120,368 153,789 153,789 Total Passenger Enplanements 3,527,170 3,527,170 3,682,577 3,682,581 4,138,729 4,138,729 4,726,860 4,622,867 4,814,702 4,814,702 6,151,573 6,151,564 Percent Change from Baseline - 0.0% 4.4% 4.4% - 0.0% 14.2% 11.7% - 0.0% 27.8% 27.8% Aircraft Operations: Domestic-Mainline 60,616 56,629 60,818 58,734 67,196 64,548 76,745 72,965 76,482 73,608 97,718 91,924 Regional 6,735 17,516 6,757 18,288 8,092 38,274 9,242 43,712 10,675 42,819 13,639 43,712 International 2,414 2,356 2,422 2,422 2,488 2,488 2,841 2,422 2,928 2,928 3,740 2,841 Total Air Carrier Operations 69,765 76,501 69,998 79,445 77,776 105,310 88,828 119,100 90,085 119,355 115,097 138,477
All-Cargo 1,876 1,876 1,876 1,876 1,936 1,936 1,936 1,936 1,999 1,999 1,999 1,999 GA/Air Taxi 128,823 128,823 128,823 128,823 131,592 131,592 131,592 131,592 131,592 131,592 131,592 131,592 Military 1,500 1,500 1,500 1,500 1,500 1,500 1,500 1,500 1,500 1,500 1,500 1,500 Total Aircraft Operations 201,964 208,700 202,197 211,644 212,804 240,338 223,856 254,128 225,176 254,446 250,188 273,568 Percent Change from Baseline - 3.3% 0.1% 4.8% - 12.9% 5.2% 19.4% - 13.0% 11.1% 21.5% 2020 2025 Baseline Scenario 11/ Scenario 22/ Scenario 33/ Baseline Scenario 11/ Scenario 22/ Scenario 33/ Passenger Enplanements: Domestic-Mainline 5,222,517 4,485,221 7,427,307 6,378,730 5,946,797 4,977,211 9,380,397 7,850,985 Regional 212,252 949,549 301,858 1,350,416 323,196 1,292,782 509,804 2,039,217 International 150,811 150,810 214,478 214,478 193,917 193,917 305,883 305,883 Total Passenger Enplanements 5,585,580 5,585,580 7,943,643 7,943,624 6,463,910 6,463,910 10,196,084 10,196,084 Percent Change from Baseline - 0.0% 42.2% 42.2% - 0.0% 57.7% 57.7% Aircraft Operations: Domestic-Mainline 86,982 83,134 123,703 114,241 98,834 92,734 155,899 140,059 Regional 14,593 51,998 20,753 73,949 20,570 66,005 32,447 104,116 International 3,424 3,424 4,870 4,870 4,180 4,180 6,593 6,593 Total Air Carrier Operations 104,999 138,556 149,326 193,060 123,584 162,919 194,939 250,769
All-Carg 2,063 2,063 2,063 2,063 2,130 2,130 2,130 2,130 GA/Air Taxi 137,392 137,392 137,392 137,392 140,430 140,430 140,430 140,430 Military 1,500 1,500 1,500 1,500 1,500 1,500 1,500 1,500 Total Aircraft Operations 245,954 279,511 290,281 334,015 267,644 306,979 338,999 394,829 Percent Change from Baseline - 13.6% 18.0% 35.8% - 14.7% 26.7% 47.5%
Notes: 1/ Represents the Fleet Mix Change Scenario. 2/ Represents the High Growth Scenario 3/ Represents the combined Fleet Mix Change and High Growth Scenario.
WPB310127161368.doc/063000015