Embed Size (px)
Citation preview
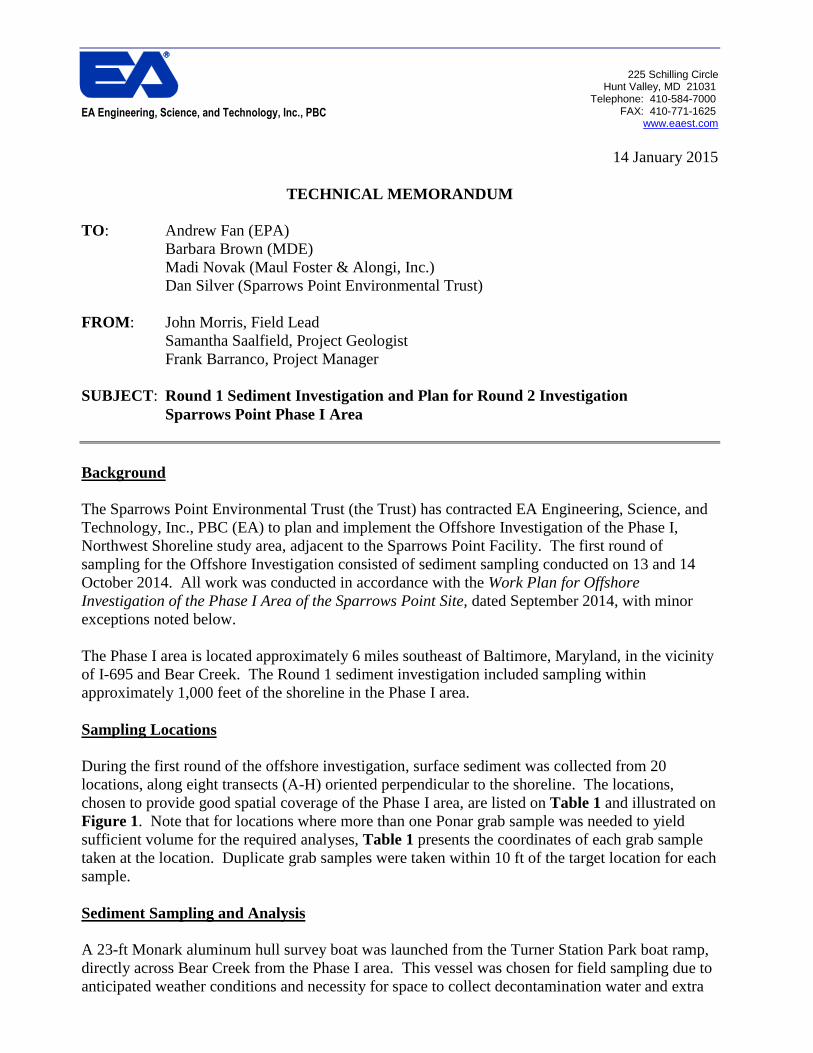
225 Schilling Circle
Hunt Valley, MD 21031 Telephone: 410-584-7000 FAX: 410-771-1625
www.eaest.com
EA Engineering, Science, and Technology, Inc., PBC
14 January 2015
TECHNICAL MEMORANDUM
TO: Andrew Fan (EPA)
Barbara Brown (MDE)
Madi Novak (Maul Foster & Alongi, Inc.)
Dan Silver (Sparrows Point Environmental Trust)
FROM: John Morris, Field Lead
Samantha Saalfield, Project Geologist
Frank Barranco, Project Manager
SUBJECT: Round 1 Sediment Investigation and Plan for Round 2 Investigation
Sparrows Point Phase I Area
Background
The Sparrows Point Environmental Trust (the Trust) has contracted EA Engineering, Science, and
Technology, Inc., PBC (EA) to plan and implement the Offshore Investigation of the Phase I,
Northwest Shoreline study area, adjacent to the Sparrows Point Facility. The first round of
sampling for the Offshore Investigation consisted of sediment sampling conducted on 13 and 14
October 2014. All work was conducted in accordance with the Work Plan for Offshore
Investigation of the Phase I Area of the Sparrows Point Site, dated September 2014, with minor
exceptions noted below.
The Phase I area is located approximately 6 miles southeast of Baltimore, Maryland, in the vicinity
of I-695 and Bear Creek. The Round 1 sediment investigation included sampling within
approximately 1,000 feet of the shoreline in the Phase I area.
Sampling Locations
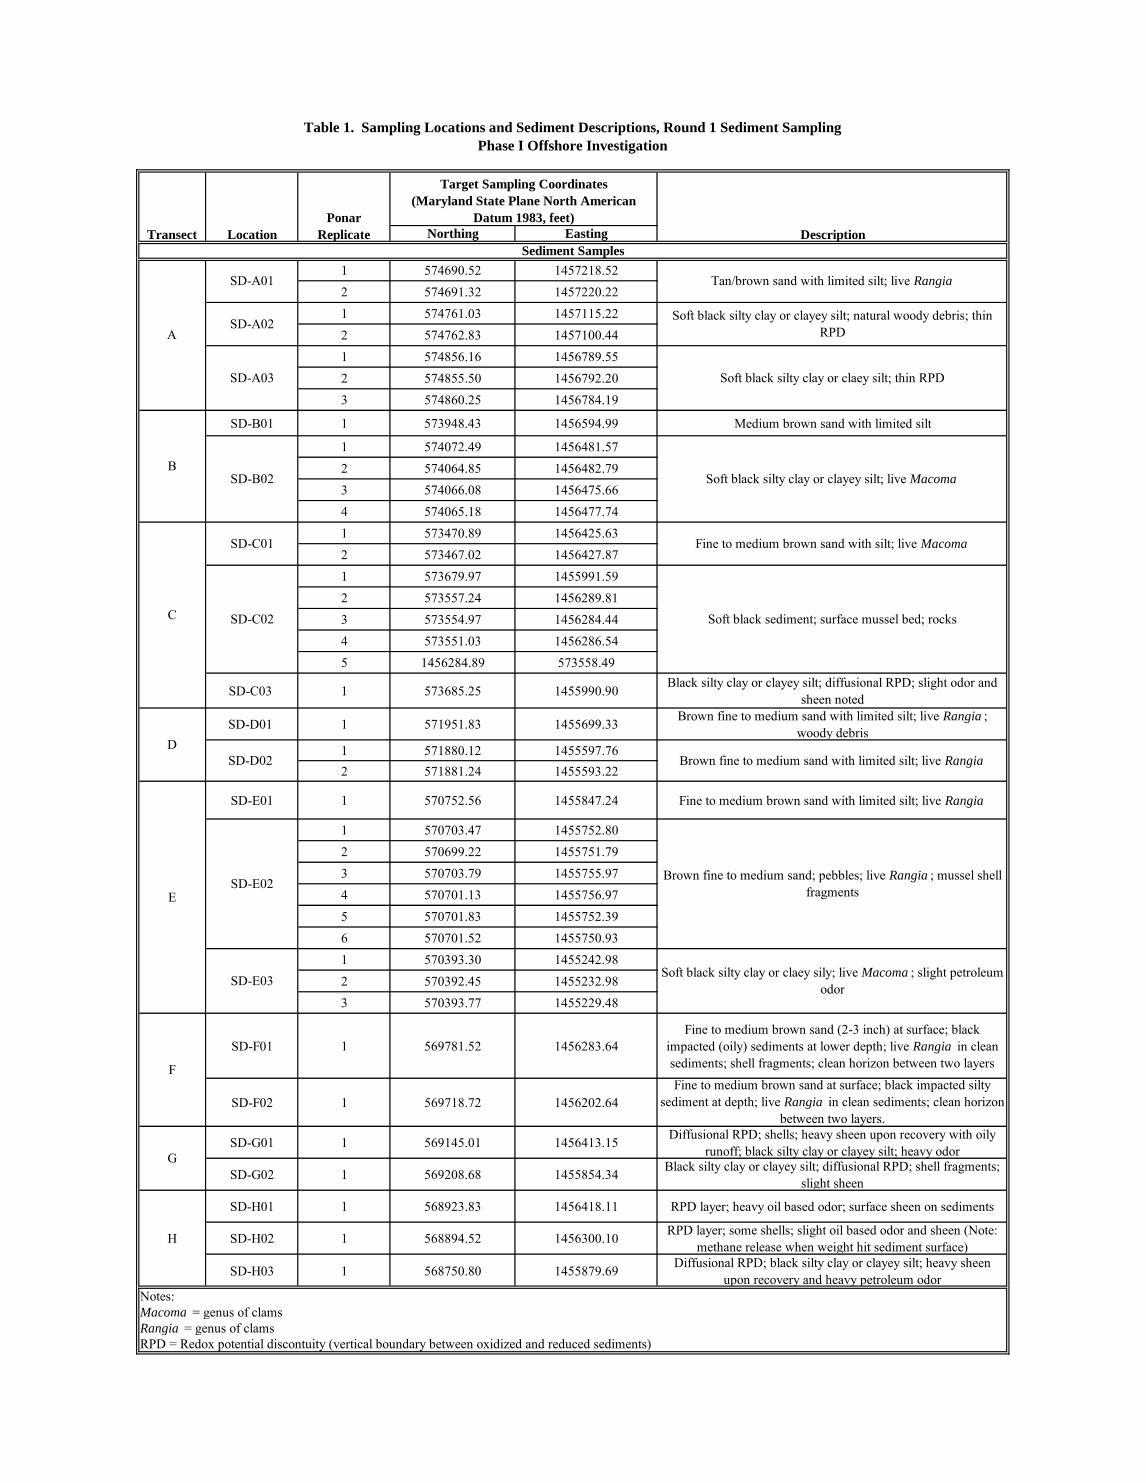
During the first round of the offshore investigation, surface sediment was collected from 20
locations, along eight transects (A-H) oriented perpendicular to the shoreline. The locations,
chosen to provide good spatial coverage of the Phase I area, are listed on Table 1 and illustrated on
Figure 1. Note that for locations where more than one Ponar grab sample was needed to yield
sufficient volume for the required analyses, Table 1 presents the coordinates of each grab sample
taken at the location. Duplicate grab samples were taken within 10 ft of the target location for each
sample.
Sediment Sampling and Analysis
A 23-ft Monark aluminum hull survey boat was launched from the Turner Station Park boat ramp,
directly across Bear Creek from the Phase I area. This vessel was chosen for field sampling due to
anticipated weather conditions and necessity for space to collect decontamination water and extra

14 January 2015
2
sediment volume for proper disposal. The roving Trimble SPS 461 global positioning system
(GPS) receiver was initialized and differential corrections for the satellite positioning data were
loaded. The GPS system was connected through HYPACK, and Beacon Marker 5 location was
collected as a daily check for the accuracy of the GPS unit.
The boat was navigated to each targeted sampling location and surface sediments were collected.
Surface sediment samples were collected to approximately 6 inches below the sediment surface
using a Ponar grab sampler. If needed, replicate grab samples were collected using the Ponar until
adequate volume had been obtained for the required analysis (including volume required for
quality control samples and for separate analysis by Chesapeake Bay Foundation [CBF]). Each
grab sample was taken within 10 ft of the target location for the sample; Table 1 presents the
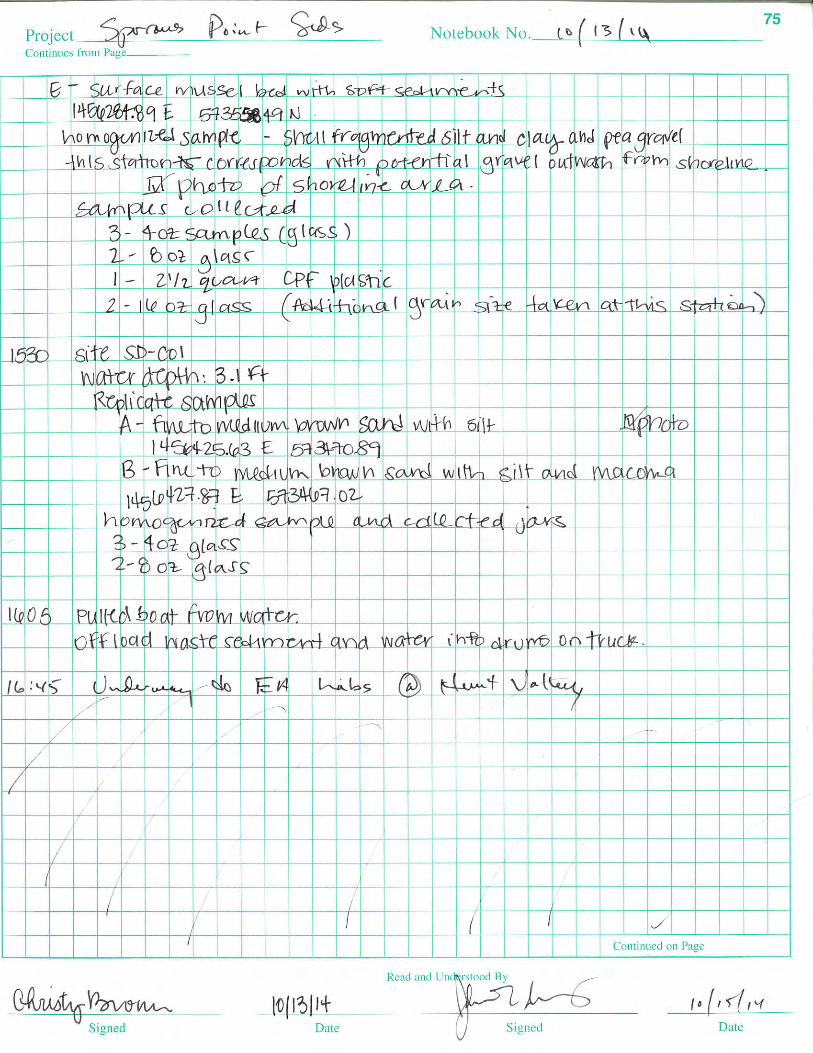
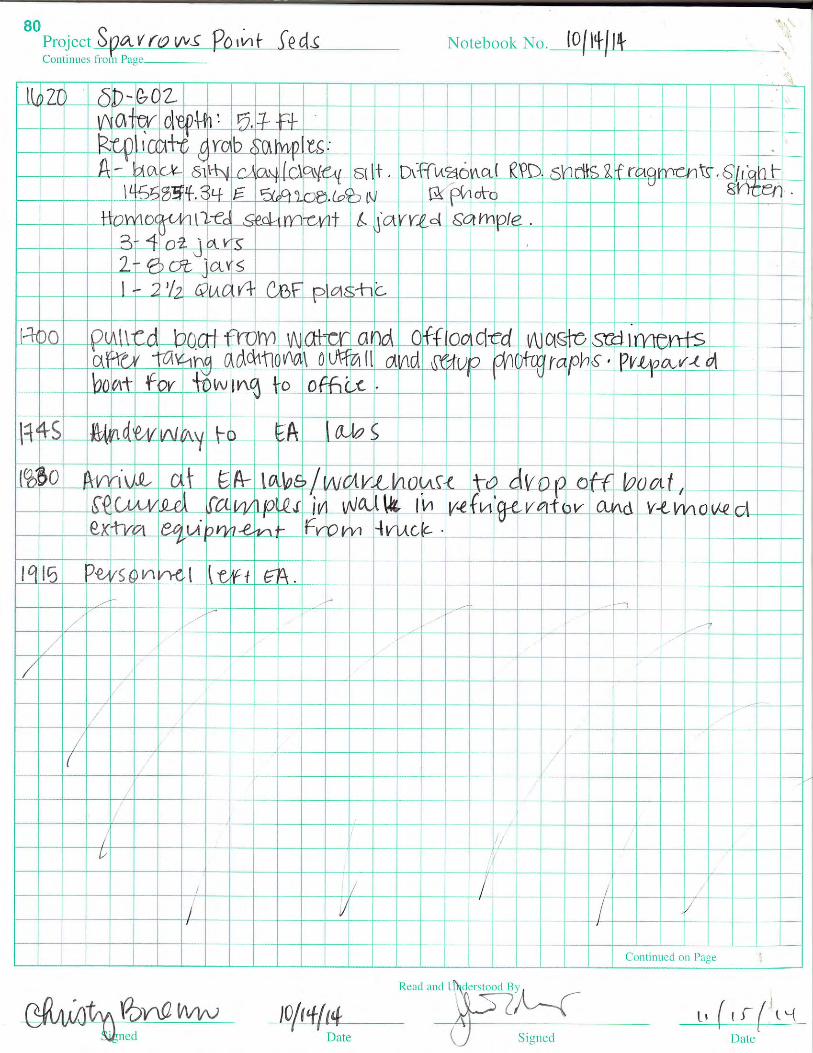
coordinates of each grab sample. The field logbook documenting the sampling is included in
Attachment A, and a photographic log is included in Attachment B. Descriptions of the sediment
grab samples collected are also recorded in Table 1.
Following collection of the required sample volume, the sample was homogenized using a
decontaminated stainless steel spoon in a stainless steel pot and immediately sub-sampled for
volatile organic compound (VOC) and simultaneously extracted metals/acid volatile sulfide
(SEM/AVS) analysis (as applicable). Note that these sub-samples were not collected prior to
homogenization, as indicated in the work plan, because of the heterogeneity within and between
Ponar samples at many of the sites (see Table 1 and photographic log, Attachment B). Rather,
they were collected expediently following homogenization, and placed in laboratory-cleaned 4-
ounce bottles with no headspace. The remainder of the sample was then sub-sampled into
appropriate laboratory-cleaned containers using stainless steel sampling tools. Sample processing
equipment that came into direct contact with the sediment (e.g., the Ponar sampler and stainless
steel pot) was decontaminated according to the protocols specified in the Work Plan.
Additional sample volume for the CBF was collected in 2.5-quart plastic containers from the
following 11 locations: SD-A02, SD-A03, SD-B02, SD-C02, SD-C03, SD-D02, SD-E02, SD-E03,
SD-G02, SD-H01, and SD-H03. These containers were taped to prevent leaking, and stored in a
separate cooler from project samples.
Unused sediment and decontamination water were containerized in 50-gallon drums, in accordance
with the special condition included in Maryland Wetlands License No. 14-0543, under which the
Maryland Board of Public Works authorized this sampling on 1 October 2014. The containerized
material was drummed and transported to a secure offsite staging area. The results of the sediment
sampling will be used to characterize the material for disposal.
Samples were placed in a cooler with ice to maintain a temperature of <40 C, and stored in the
cooler until delivery to the laboratory. Two field duplicate samples were collected, from locations
SD-B02 and SD-F01, and a trip blank was included in each cooler containing bottles for analyses
of VOCs. Two rinsate blanks were also collected after the sampling effort, one from the Ponar
sampler and one from the stainless steel pot used to homogenize the samples (note that the
analytical results from the rinsate blanks are not yet available).
14 January 2015
3
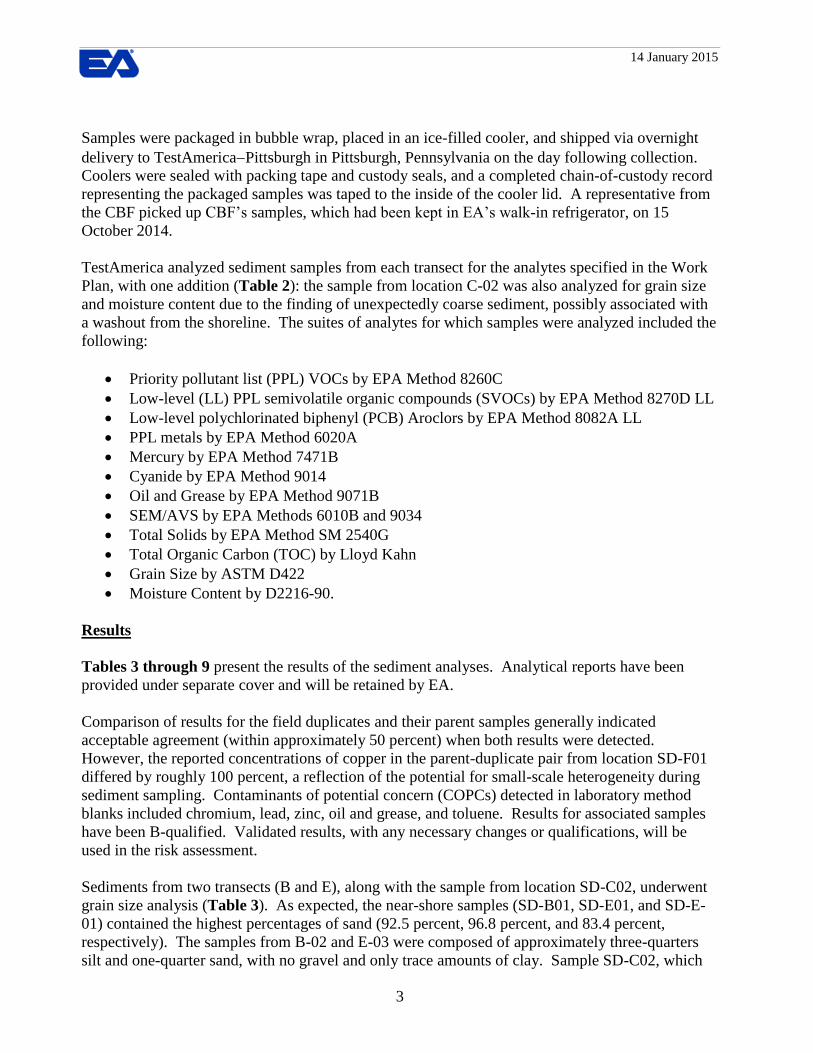
Samples were packaged in bubble wrap, placed in an ice-filled cooler, and shipped via overnight
delivery to TestAmericaPittsburgh in Pittsburgh, Pennsylvania on the day following collection.
Coolers were sealed with packing tape and custody seals, and a completed chain-of-custody record
representing the packaged samples was taped to the inside of the cooler lid. A representative from
the CBF picked up CBF’s samples, which had been kept in EA’s walk-in refrigerator, on 15
October 2014.
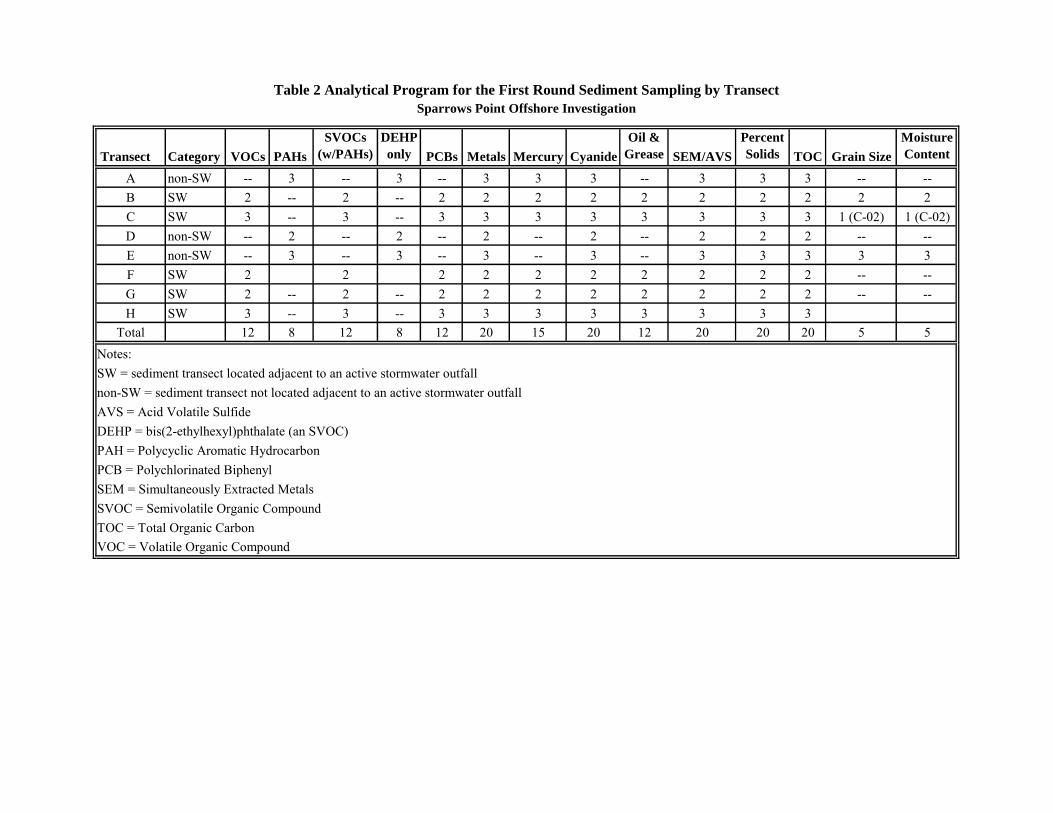
TestAmerica analyzed sediment samples from each transect for the analytes specified in the Work
Plan, with one addition (Table 2): the sample from location C-02 was also analyzed for grain size
and moisture content due to the finding of unexpectedly coarse sediment, possibly associated with
a washout from the shoreline. The suites of analytes for which samples were analyzed included the
following:
Priority pollutant list (PPL) VOCs by EPA Method 8260C
Low-level (LL) PPL semivolatile organic compounds (SVOCs) by EPA Method 8270D LL
Low-level polychlorinated biphenyl (PCB) Aroclors by EPA Method 8082A LL
PPL metals by EPA Method 6020A
Mercury by EPA Method 7471B
Cyanide by EPA Method 9014
Oil and Grease by EPA Method 9071B
SEM/AVS by EPA Methods 6010B and 9034
Total Solids by EPA Method SM 2540G
Total Organic Carbon (TOC) by Lloyd Kahn
Grain Size by ASTM D422
Moisture Content by D2216-90.
Results
Tables 3 through 9 present the results of the sediment analyses. Analytical reports have been
provided under separate cover and will be retained by EA.
Comparison of results for the field duplicates and their parent samples generally indicated
acceptable agreement (within approximately 50 percent) when both results were detected.
However, the reported concentrations of copper in the parent-duplicate pair from location SD-F01
differed by roughly 100 percent, a reflection of the potential for small-scale heterogeneity during
sediment sampling. Contaminants of potential concern (COPCs) detected in laboratory method
blanks included chromium, lead, zinc, oil and grease, and toluene. Results for associated samples
have been B-qualified. Validated results, with any necessary changes or qualifications, will be
used in the risk assessment.
Sediments from two transects (B and E), along with the sample from location SD-C02, underwent
grain size analysis (Table 3). As expected, the near-shore samples (SD-B01, SD-E01, and SD-E-
01) contained the highest percentages of sand (92.5 percent, 96.8 percent, and 83.4 percent,
respectively). The samples from B-02 and E-03 were composed of approximately three-quarters
silt and one-quarter sand, with no gravel and only trace amounts of clay. Sample SD-C02, which

14 January 2015
4
was added to the grain size analysis due to its unexpectedly coarse composition, was composed of
28.7 percent gravel and 56.6 percent sand.
All samples were analyzed for TOC (Table 3), and concentrations ranged from 2,300 mg/kg in the
sandy sediments from location E-01 to 180,000 mg/kg in the fine-grained sediments from locations
SD-G02 and SD-H03.
Figures 2 through 7 present the distribution of the concentrations of selected COPCs in the
surface sediment, across the Phase I area. Note that in these figures, results are presented using
color-coded concentration ranges to illustrate trends in relative concentrations. The data were also
screened against risk-based criteria following review of the draft version of this memorandum by
EPA and MDE. The screening methodology and results are summarized in the EPA comments
provided in Attachment C.
Nickel and zinc were chosen to represent metals in the figures (Figures 2 and 3, Table 4), as they
show spatial distribution similar to other metals. The highest concentrations of nickel and zinc
(170 mg/kg and 10,000 mg/kg respectively) were reported in sample SD-H03, from the southern
end of the Phase I area. Other samples from Transects G and H, as well as samples SD-A03, SD-
B02, SD-C03, and SD-E03, also contained elevated metals concentrations. All of these samples
were classified as fine-grained (silt and clay). Mercury, which was analyzed in samples from
transects A, B, C, F, G, and H, showed the same general trend as other metals, with the highest
concentrations in fine-grained sediments farther offshore, up to 0.83 mg/kg in sample SD-H03
(Table 4).
Cyanide concentrations showed a similar pattern to the metals (Figure 4, Table 4), with the
highest concentration (21 mg/kg) in the sample from SD-G02, and concentrations over 1 mg/kg
also in samples from SD-C03, SD-E03, SD-H01, and SD-H02.
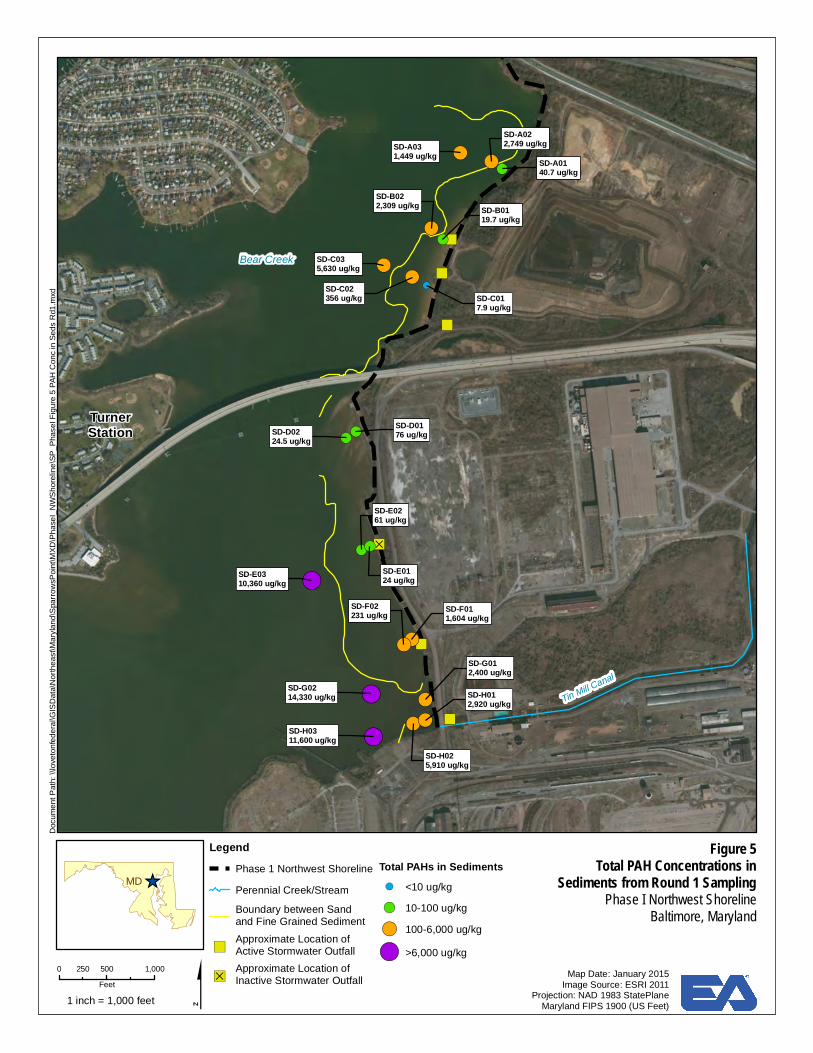
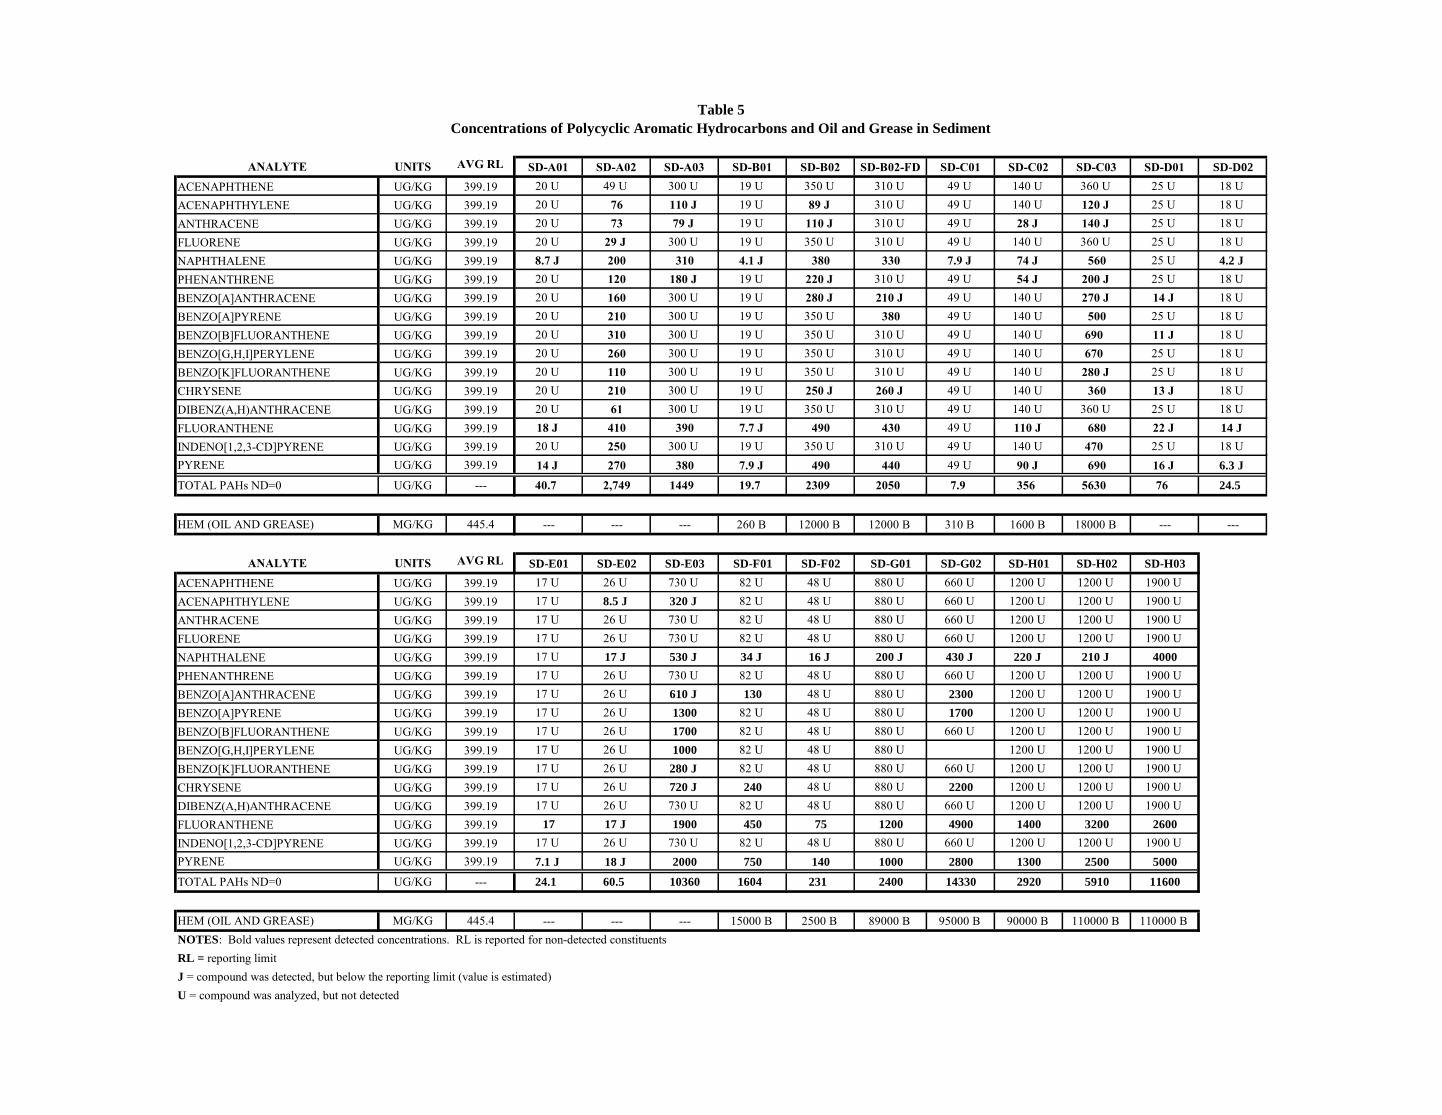
PAH concentrations exceeded 1,000 µg/kg in at least one sample from each transect except for the
D and E transects, with concentrations generally higher farther offshore, where sediment has higher
clay and silt content. The highest concentrations of Total PAHs (Figure 5, Table 5) were reported
in samples SD-E03, SD-G02, and SD-H03 (10,360, 14,330, and 11,600 µg/kg, respectively). SD-
E03 was observed to have a slight odor, SD-G02 had a slight sheen, and SD-H03 had a heavy
sheen and heavy petroleum odor. SD-G01 and SD-H01 were also observed to have a heavy
petroleum odor with sheen, while SD-H02 had a slight odor with sheen, and SD-G02 had slight
sheen but no observed odor. SD-F01 and SD-F02 contained sediment that appeared oily at depths
greater than a few inches. A slight odor and sheen were also noted in SD-C03.
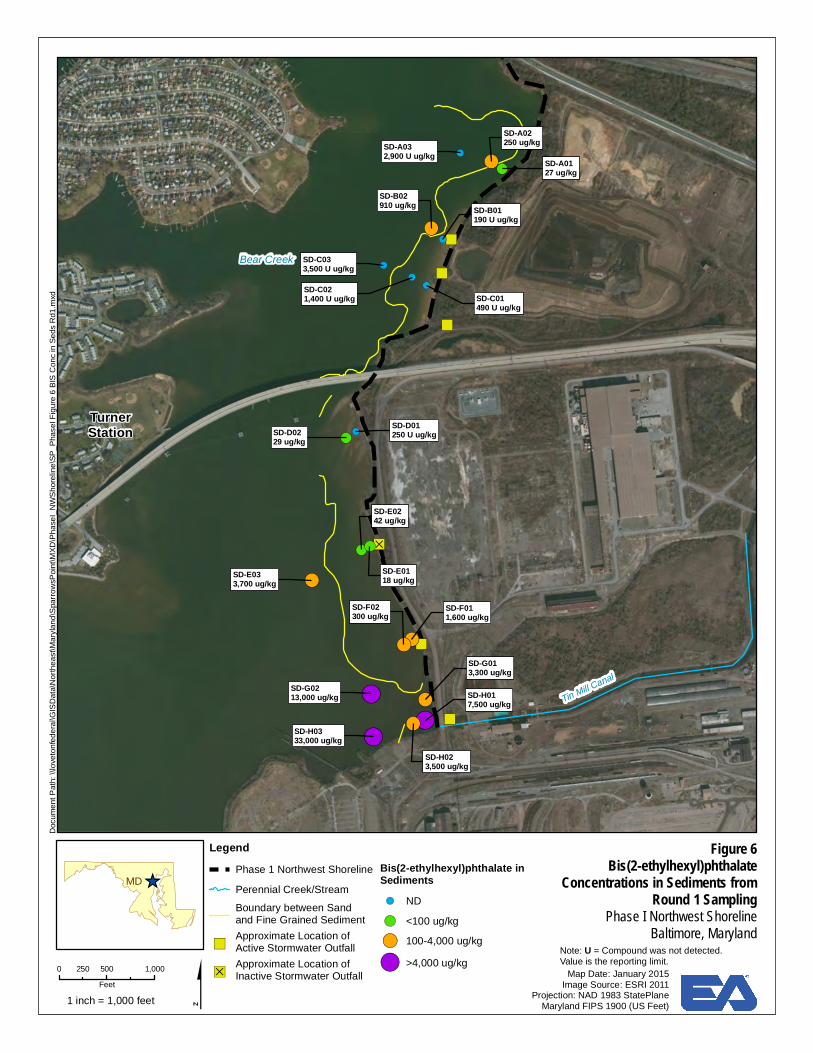
Bis(2-ethylhexyl)phthalate was the only SVOC detected. The sample from location SD-H03
contained the highest concentration of bis(2-ethylhexyl)phthalate (33,000 µg/kg) (Figure 6, Table
6). Concentrations exceeding 1,000 µg/kg were reported in all samples from the G and H transects,
in one sample each from the E and F transects, and in none of the samples collected farther north
(although for some samples the reporting limit for this compound exceeded 1,000 µg/kg).
14 January 2015
5
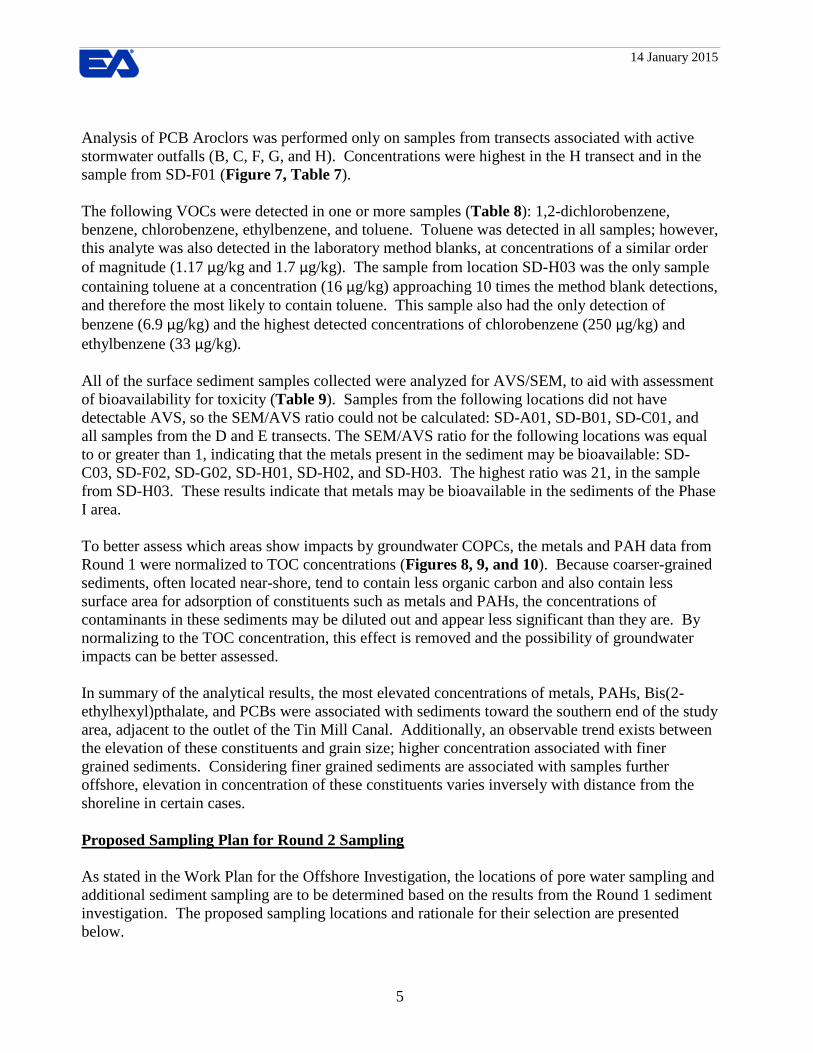
Analysis of PCB Aroclors was performed only on samples from transects associated with active
stormwater outfalls (B, C, F, G, and H). Concentrations were highest in the H transect and in the
sample from SD-F01 (Figure 7, Table 7).
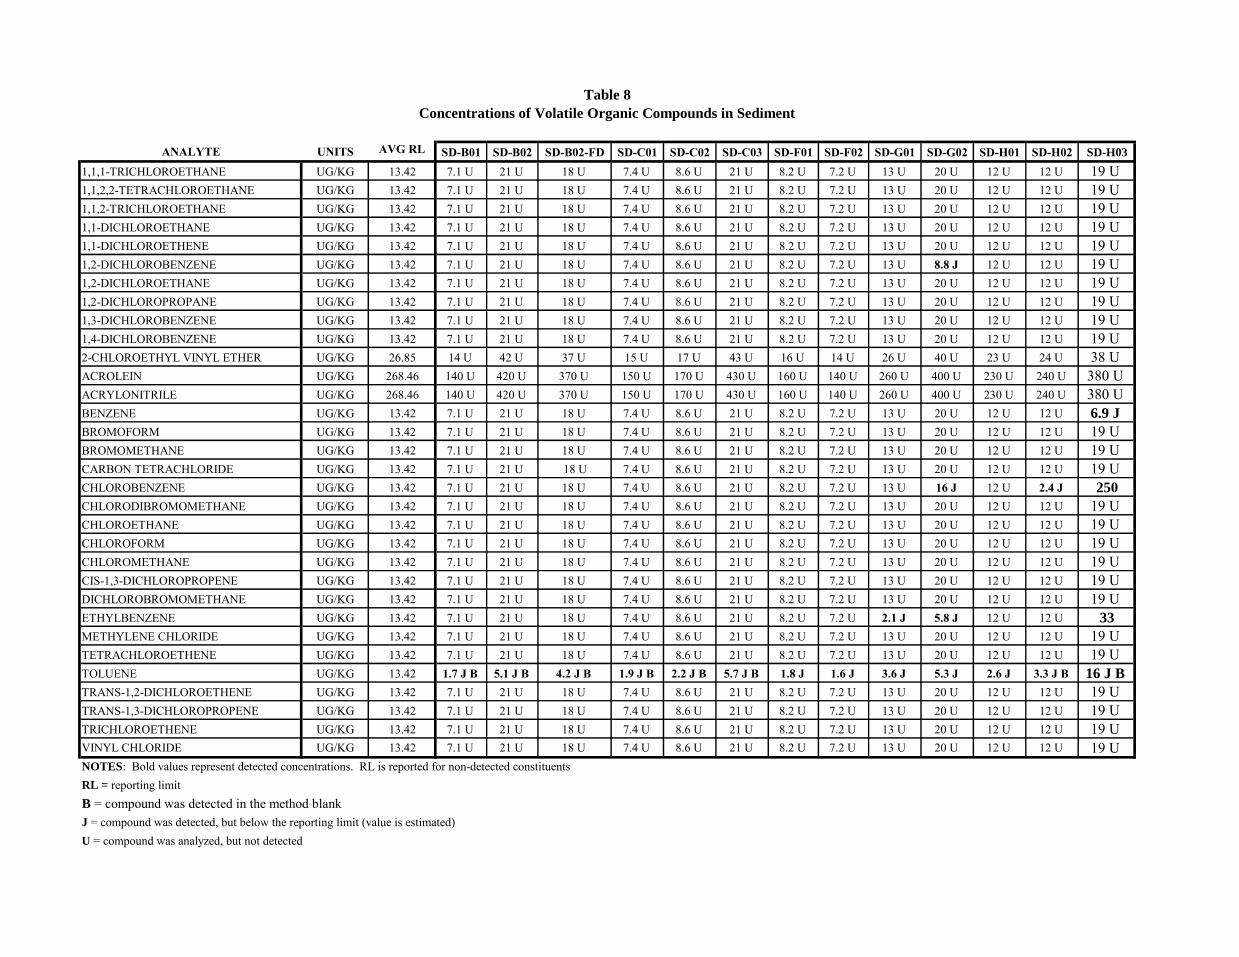
The following VOCs were detected in one or more samples (Table 8): 1,2-dichlorobenzene,
benzene, chlorobenzene, ethylbenzene, and toluene. Toluene was detected in all samples; however,
this analyte was also detected in the laboratory method blanks, at concentrations of a similar order
of magnitude (1.17 µg/kg and 1.7 µg/kg). The sample from location SD-H03 was the only sample
containing toluene at a concentration (16 µg/kg) approaching 10 times the method blank detections,
and therefore the most likely to contain toluene. This sample also had the only detection of
benzene (6.9 µg/kg) and the highest detected concentrations of chlorobenzene (250 µg/kg) and
ethylbenzene (33 µg/kg).
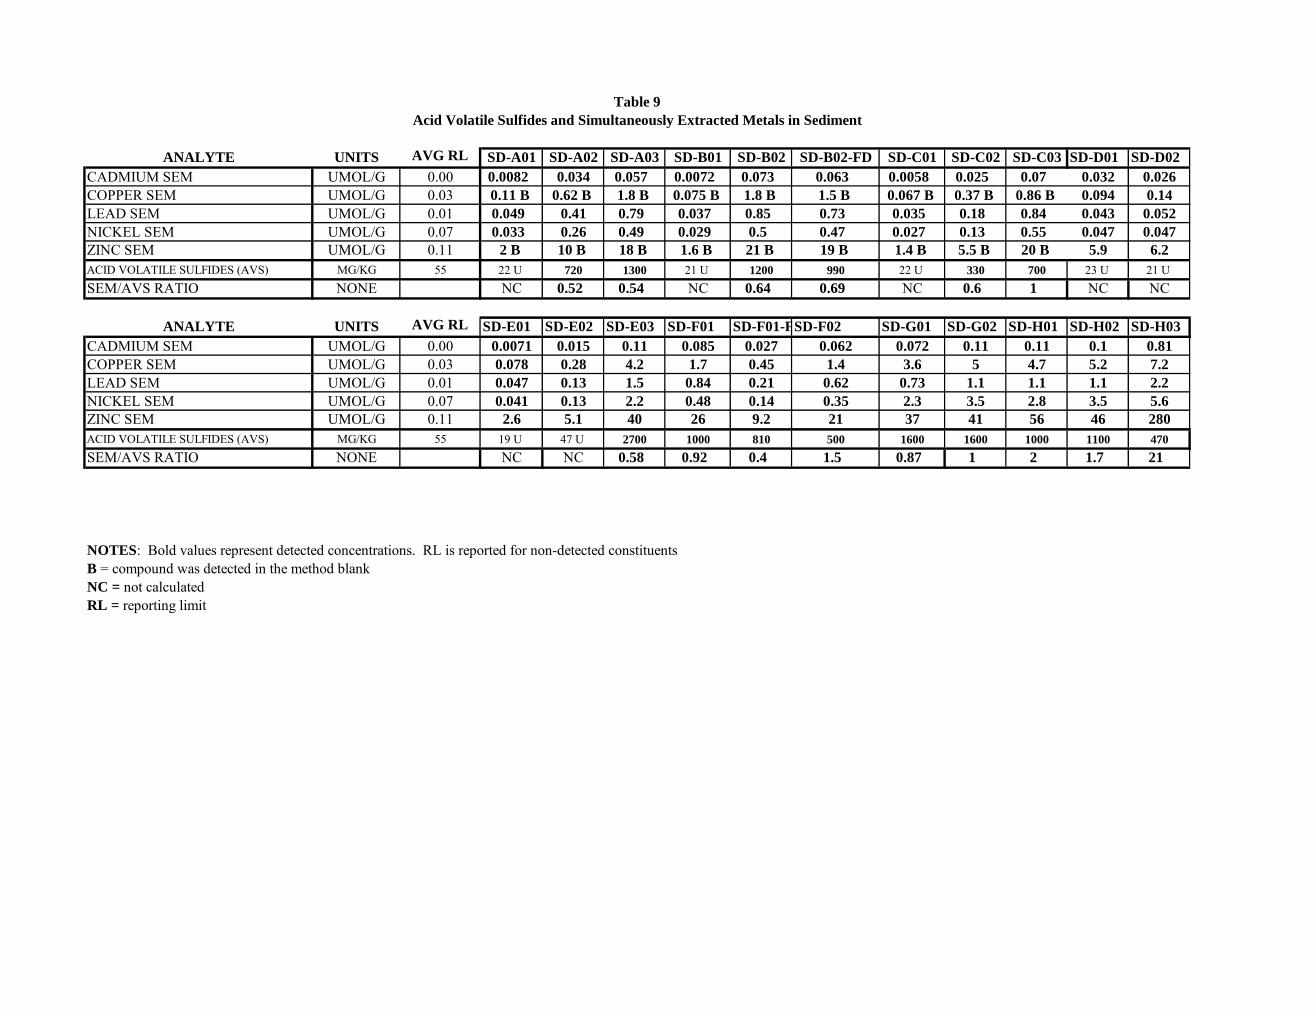
All of the surface sediment samples collected were analyzed for AVS/SEM, to aid with assessment
of bioavailability for toxicity (Table 9). Samples from the following locations did not have
detectable AVS, so the SEM/AVS ratio could not be calculated: SD-A01, SD-B01, SD-C01, and
all samples from the D and E transects. The SEM/AVS ratio for the following locations was equal
to or greater than 1, indicating that the metals present in the sediment may be bioavailable: SD-
C03, SD-F02, SD-G02, SD-H01, SD-H02, and SD-H03. The highest ratio was 21, in the sample
from SD-H03. These results indicate that metals may be bioavailable in the sediments of the Phase
I area.
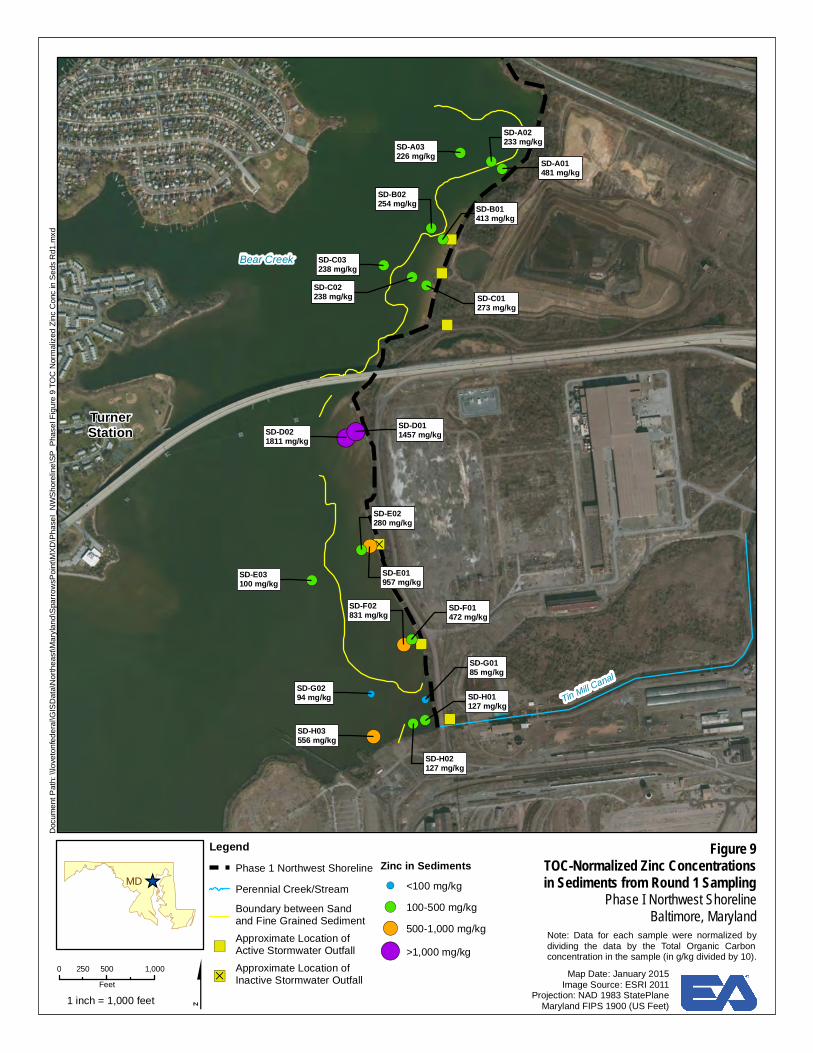
To better assess which areas show impacts by groundwater COPCs, the metals and PAH data from
Round 1 were normalized to TOC concentrations (Figures 8, 9, and 10). Because coarser-grained
sediments, often located near-shore, tend to contain less organic carbon and also contain less
surface area for adsorption of constituents such as metals and PAHs, the concentrations of
contaminants in these sediments may be diluted out and appear less significant than they are. By
normalizing to the TOC concentration, this effect is removed and the possibility of groundwater
impacts can be better assessed.
In summary of the analytical results, the most elevated concentrations of metals, PAHs, Bis(2-
ethylhexyl)pthalate, and PCBs were associated with sediments toward the southern end of the study
area, adjacent to the outlet of the Tin Mill Canal. Additionally, an observable trend exists between
the elevation of these constituents and grain size; higher concentration associated with finer
grained sediments. Considering finer grained sediments are associated with samples further
offshore, elevation in concentration of these constituents varies inversely with distance from the
shoreline in certain cases.
Proposed Sampling Plan for Round 2 Sampling
As stated in the Work Plan for the Offshore Investigation, the locations of pore water sampling and
additional sediment sampling are to be determined based on the results from the Round 1 sediment
investigation. The proposed sampling locations and rationale for their selection are presented
below.

14 January 2015
6
Pore Water
The following criteria were identified for selection of pore water sampling locations:
Locations near onshore areas where groundwater COPCs exceeding the BTAG surface
water screening criteria by at least five-fold (or consistently exceeding the criteria by two-
fold) have been identified (Attachment C). Note that if a chemical was not detected from
2010-2014, then any prior exceedances were excluded. However, prior exceedances were
taken into account if there were no analyses for the chemical from 2010-2014.
Sandy locations where pore water upwelling is thought to be likely.
The proposed locations for pore water sampling and the rationale for selecting each location are
presented in Table 10. The proposed locations are shown on Figure 11. All except one of
selected locations (F03) are within approximately 100 feet of the shoreline because this is thought
to be the most likely location of groundwater upwelling. This interpretation is based on the
underlying geology, which does not include prominent shallow confining layers, as well as the
sandy sediment lithology in the near-shore area. The water depth at all of the selected locations is
expected to be less than approximately 10 ft.
At each of these locations, a pore water sample will be collected using a push-point sampler, from
approximately 1 ft below the sediment-water interface. Collection of pore water from this depth
will produce data relevant to the biologically active zone for the risk assessment, while minimizing
any possible intrusion of surface water from above the sediment-water interface. As stated in the
Work Plan, in situ water quality measurements will be used to monitor for potential incursion of
surface water, which must be avoided during sampling.
Each pore water sample will be analyzed for the COPCs identified in the associated monitoring
wells identified in Table 10, and also for dissolved organic carbon (DOC) and magnesium and
calcium (to allow calculation of surface water screening criteria) (Table 11). The analytical
methods, total numbers of samples to be analyzed, and quality control samples are presented in
Table 12.
Sediment
The following criteria were identified for selection of additional sediment sampling locations:
Locations identified for pore water sampling where no sediment sample was collected
during Round 1.
Locations in the vicinity of Transects G and H, where the lateral and vertical extent of
contamination require delineation to support a future Corrective Measures Study for the
Phase I area.
The proposed locations for Round 2 sediment sampling and the rationale for selecting each location
are presented in Table 13. The proposed locations are shown on Figure 11.

14 January 2015
7
Surface sediment will be collected from one location identified for pore water analysis, where no
sediment sample was collected during Round 1. Surface sediment results from this location will be
collected for comparison to pore water. The Round 2 surface sediment samples will be collected
using the same methodology as were the Round 1 sediments.
Up to 12 sediment cores will be collected from the area of the G and H transects, where high
concentrations of oil and grease (up to 11%), observable sheen and petroleum odor, and metals
concentrations exceeding sediment PECs were reported in surface sediment. Additionally, two
cores, co-located with pore water analyses, will be collected from the F transect, where an oily
black sediment layer with 1.5% oil and grease was observed near the shoreline. Although the
Work Plan indicated that sediment cores, if required, would be collected using manual push cores
to a depth of approximately 2 ft, it was determined based on the Round 1 data that deeper
delineation is likely necessary to define the extent of contamination in the targeted area.
An electric vibracorer will be deployed from a 28-ft aluminum-hull survey and research vessel and
used to advance cores to a penetration depth of 5 to 6 feet below the sediment-water interface or
refusal. Upon recovery, the cores will be held at 4°C, transferred to a processing facility, then split,
described and photographed. Any observable impacts (sheen and/or odor) will be assessed and
recorded. Generally, sediment sub-samples will be generated based on 2-foot intervals below the
sediment-water interface (0-2 ft, 2-4 ft, 4-6 ft, etc.). A surface interval sample from every core will
be submitted for analysis. If a core has no observable impacts, then the next deeper interval (2-4 ft)
will also be submitted for analysis. Alternatively, if multiple intervals in the middle and bottom
portions of a core contain observable impacts, then only the lowest of the impacted intervals, and
any un-impacted intervals below the lowest impacted interval, will be submitted for laboratory
analysis. Each interval will be homogenized using decontaminated stainless steel mixing
equipment and transferred to pre-cleaned, 8 ounce jars for analytical testing.
Cores from locations F03, F04, G01, G01.5, G02, H01, H02.5, and H03 will be collected and
sampled first, followed by cores from locations G03 and H04. If no contamination (sheen or
petroleum odor) is apparent in cores G03 and H04 (at the edge of the subaqueous survey area), then
no more cores will be sampled. However, if contamination is apparent in these cores, cores will be
advanced at locations G04 and H05, and these cores will be sampled as described above. If no
contamination (obvious sheen or petroleum odor) is apparent in these cores, then no more cores
will be sampled. If contamination is apparent in cores from G04 and H05, then cores will be
advanced at locations G05 and H06, and all four of these cores will be sampled as described above.
Thus, up to 14 cores may be sampled. For planning purposes, it is assumed that an average of three
samples will be collected from each core; however, as described above, only two samples may be
required from some cores, based on field observations.
The sediment samples will be analyzed for the parameters indicated in Table 14. As in Round 1,
the analytical parameters for the surface sediment grab samples are based on whether they are
adjacent to an active stormwater outfall. Parameters to be analyzed in sediment core samples were
selected based on the primary contaminants identified in the area of the G and H transects, based
on Round 1 sampling, and potential historical releases from the Tin Mill Canal. The analytical
methods, total numbers of samples to be analyzed, and quality control samples are presented in
Table 12.

14 January 2015
8
If the findings of the Data Gaps Report, which will be based on the Round 1 and Round 2 results,
indicate that the Round 2 coring did not achieve delineation, further expansion of the investigation
area and/or use of a barge with larger vibracorer may be considered to obtain deeper cores.

!(!(
!(!(
!(!(
!(
!(!(
!(!(
!(
!(!(
!(
!( !(
!(!(!(
")
")
")
")D
")
")
@A@A
@A
@A@A@A
@A@A@A@A
@A@A
@A@A
@A@A
@A@A
@A@A
@A
Turner Station
Bear Creek
SD-A01SD-A02
SD-B01SD-B02
SD-D01
SD-D02
SD-E01
SD-E02
SD-F01
SD-F02
SD-H03
SD-G01
SD-C01SD-C02
SD-C03
SD-E03
SD-G02
SD-A03
TS-01(-7)
GL-02(-5)
RW18-PZM047
RW19-PZM020RW19-PZM050RW19-PZP000
TS04-PZM023
HI08-PZM003HI08-PZM060
TS04-PDM004
RW20-PZP000RW20-PZM020
GL-16(-6)
GL-12(-3)
GL-05(-7)
GL-12(-17)
GL-15(-6)
GL-16(-32)
GL-15(-36)GL-05(-25)
GL-02(-29)
Tin Mill Canal
SD-H02SD-H01
Outfall 071Outfall 070
Outfall 014
Outfall 018
Outfall UNNAMED
_̂MD
Map Date: January 2015Image Source: ESRI 2011
Projection: NAD 1983 StatePlaneMaryland FIPS 1900 (US Feet)
Figure 1Sampling Locations
for the First Round of theOffshore Investigation
Phase I Northwest ShorelineBaltimore, Maryland
1 inch = 1,200 feet
0 600 1,200300Feet
LegendPhase 1 Northwest ShorelinePerennial Creek/StreamBoundary between Sandand Fine Grained Sediment
!( Sediment Sampling Location
")Approximate Location ofActive Stormwater Outfall
")DApproximate Location ofInactive Stormwater Outfall
@A Greys Landfill Well
@AGroundwater Well Sampledin June 2014
$
Docu
ment
Path:
\\lov
etonfe
deral
\GISD
ata\N
orthe
ast\M
arylan
d\Spa
rrows
Point
\MXD
\Phas
eI_NW
Shore
line\S
P_Ph
aseI
Figure
1 Sa
mplin
g Loc
ation
s for
First
Roun
d.mxd

")
")
")
")D
")
")
!(
!(
!(!(
!(
!(
!(
!(
!(!(
!(!(
!(
!(
!(
!(
!(
!(
!(
!(
TurnerStation
SD-H0195 mg/kg
SD-G0163 mg/kg
SD-A0346 mg/kg
SD-F0119 mg/kg
SD-F0210 mg/kg
SD-E0376 mg/kg
SD-C0346 mg/kg
SD-B0246 mg/kg
SD-A0230 mg/kg
SD-H03170 mg/kg
SD-H02120 mg/kg
SD-G02130 mg/kg
SD-E025.6 mg/kg
SD-E014.9 mg/kg
SD-D015.5 mg/kgSD-D02
6.4 mg/kg
Bear Creek
SD-C028.6 mg/kg SD-C01
2.7 mg/kg
SD-B012.2 mg/kg
SD-A013.7 mg/kg
Tin Mill Canal
_̂MD
Map Date: January 2015Image Source: ESRI 2011
Projection: NAD 1983 StatePlaneMaryland FIPS 1900 (US Feet)
Figure 2Nickel Concentrations in Sediments
from Round 1 SamplingPhase I Northwest Shoreline
Baltimore, Maryland
1 inch = 1,000 feet
0 500 1,000250Feet
LegendPhase 1 Northwest ShorelinePerennial Creek/StreamBoundary between Sandand Fine Grained Sediment
")Approximate Location ofActive Stormwater Outfall
")DApproximate Location ofInactive Stormwater Outfall
Nickel in Sediments!( <10 mg/kg!( 10-50 mg/kg!( 50-100 mg/kg
!( >100 mg/kg
$
Docu
ment
Path:
\\lov
etonfe
deral
\GISD
ata\N
orthe
ast\M
arylan
d\Spa
rrows
Point
\MXD
\Phas
eI_NW
Shore
line\S
P_Ph
aseI
Figure
2 Nic
kel C
onc i
n Sed
s Rd1
.mxd

")
")
")
")D
")
")
!(!(!(
!(
!(
!(
!(
!(
!(
!(
!(
!(!(
!(
!(
!(!(
!(
!(
!(
SD-H011,900 mg/kg
SD-G011,100 mg/kg
SD-A031,400 mg/kg
SD-F01850 mg/kg
SD-F02490 mg/kg
SD-E031,200 mg/kg
SD-C031,500 mg/kg
SD-B021,600 mg/kg
SD-A02980 mg/kg
SD-H0310,000 mg/kg
SD-H021,900 mg/kg
SD-G021,700 mg/kg
SD-E02140 mg/kg
SD-E01220 mg/kg
SD-D01510 mg/kgSD-D02
670 mg/kg
TurnerStation
Bear Creek
SD-C02380 mg/kg SD-C01
98 mg/kg
SD-B0199 mg/kg
SD-A01130 mg/kg
Tin Mill Canal
_̂MD
Map Date: January 2015Image Source: ESRI 2011
Projection: NAD 1983 StatePlaneMaryland FIPS 1900 (US Feet)
Figure 3Zinc Concentrations in Sediments
from Round 1 SamplingPhase I Northwest Shoreline
Baltimore, Maryland
1 inch = 1,000 feet
0 500 1,000250Feet
LegendPhase 1 Northwest ShorelinePerennial Creek/StreamBoundary between Sand andFine Grained Sediment
")Approximate Location ofActive Stormwater Outfall
")DApproximate Location ofInactive Stormwater Outfall
Zinc in Sediments!( <500 mg/kg!( 500-1,000 mg/kg!( 1,000-2,000 mg/kg
!( >2,000 mg/kg
$
Docu
ment
Path:
\\lov
etonfe
deral
\GISD
ata\N
orthe
ast\M
arylan
d\Spa
rrows
Point
\MXD
\Phas
eI_NW
Shore
line\S
P_Ph
aseI
Figure
3 Zin
c Con
c in S
eds R
d1.m
xd

")
")
")
")D
")
")
!(
!(
!(
!(
!(
!(
!(
!(
!(
!(
!(
!(!(
!(!(
!(!(
!(
!(
!(
SD-H012.8 mg/kg
SD-G010.37 mg/kg
SD-A031.1 U mg/kg
SD-F010.4 mg/kg
SD-F020.31 mg/kg
SD-E037.3 mg/kg
SD-C031.5 mg/kg
SD-B021 U mg/kg
SD-A020.73 U mg/kg
SD-H0312 mg/kg
SD-H021.2 mg/kg
SD-G0221 mg/kg
SD-E020.18 mg/kg
SD-E010.21 mg/kg
SD-D010.38 U mg/kgSD-D02
0.66 mg/kg
TurnerStation
Bear Creek
SD-C020.36 mg/kg SD-C01
37 U mg/kg
SD-B010.35 U mg/kg
SD-A010.12 mg/kg
Tin Mill Canal
_̂MD
Map Date: January 2015Image Source: ESRI 2011
Projection: NAD 1983 StatePlaneMaryland FIPS 1900 (US Feet)
Figure 4Total Cyanide Concentrations in
Sediments from Round 1 SamplingPhase I Northwest Shoreline
Baltimore, Maryland
1 inch = 1,000 feet
0 500 1,000250Feet
LegendPhase 1 Northwest ShorelinePerennial Creek/StreamBoundary between Sandand Fine Grained Sediment
")Approximate Location ofActive Stormwater Outfall
")DApproximate Location ofInactive Stormwater Outfall
Total Cyanide in Sediments!( ND!( <1 mg/kg!( 1-10 mg/kg
!( >10 mg/kg
$
Docu
ment
Path:
\\lov
etonfe
deral
\GISD
ata\N
orthe
ast\M
arylan
d\Spa
rrows
Point
\MXD
\Phas
eI_NW
Shore
line\S
P_Ph
aseI
Figure
4 Cy
anide
Con
c in S
eds R
d1.m
xd
Note: U = Compound was not detected.Value is the reporting limit.
")
")
")
")D
")
")
!(
!(
!(
!(
!(
!(
!(
!(
!(
!(
!(
!(
!(
!(
!(
!(
!(
!(
!(
!(
SD-E0261 ug/kg
SD-E0124 ug/kg
SD-D0176 ug/kg
SD-F02231 ug/kg
SD-C02356 ug/kg SD-C01
7.9 ug/kg
SD-H025,910 ug/kg
SD-H012,920 ug/kg
SD-G012,400 ug/kg
SD-A031,449 ug/kg
SD-F011,604 ug/kg
SD-D0224.5 ug/kg
SD-C035,630 ug/kg
SD-B022,309 ug/kg SD-B01
19.7 ug/kg
SD-A022,749 ug/kg
TurnerStation
Bear Creek
SD-A0140.7 ug/kg
SD-H0311,600 ug/kg
SD-G0214,330 ug/kg
SD-E0310,360 ug/kg
Tin Mill Canal
_̂MD
Map Date: January 2015Image Source: ESRI 2011
Projection: NAD 1983 StatePlaneMaryland FIPS 1900 (US Feet)
Figure 5Total PAH Concentrations in
Sediments from Round 1 SamplingPhase I Northwest Shoreline
Baltimore, Maryland
1 inch = 1,000 feet
0 500 1,000250Feet
LegendPhase 1 Northwest ShorelinePerennial Creek/StreamBoundary between Sandand Fine Grained Sediment
")Approximate Location ofActive Stormwater Outfall
")DApproximate Location ofInactive Stormwater Outfall
Total PAHs in Sediments!( <10 ug/kg!( 10-100 ug/kg!( 100-6,000 ug/kg
!( >6,000 ug/kg
$
Docu
ment
Path:
\\lov
etonfe
deral
\GISD
ata\N
orthe
ast\M
arylan
d\Spa
rrows
Point
\MXD
\Phas
eI_NW
Shore
line\S
P_Ph
aseI
Figure
5 PA
H Co
nc in
Seds
Rd1
.mxd
")
")
")
")D
")
")
!(
!(!(
!(
!(
!(
!(
!(
!(
!(
!(
!(
!(
!(
!(
!(!(
!(
!(
!(
SD-E0242 ug/kg
SD-D0229 ug/kg
SD-A0127 ug/kg
SD-F02300 ug/kg
SD-B02910 ug/kg
SD-H023,500 ug/kg
SD-G013,300 ug/kg
SD-F011,600 ug/kg
SD-E033,700 ug/kg
SD-D01250 U ug/kg
SD-C01490 U ug/kg
SD-B01190 U ug/kg
SD-E0118 ug/kg
SD-A02250 ug/kg
SD-H017,500 ug/kg
SD-H0333,000 ug/kg
TurnerStation
Bear Creek
SD-G0213,000 ug/kg
SD-A032,900 U ug/kg
SD-C033,500 U ug/kg
SD-C021,400 U ug/kg
Tin Mill Canal
_̂MD
Map Date: January 2015Image Source: ESRI 2011
Projection: NAD 1983 StatePlaneMaryland FIPS 1900 (US Feet)
Figure 6Bis(2-ethylhexyl)phthalate
Concentrations in Sediments fromRound 1 Sampling
Phase I Northwest ShorelineBaltimore, Maryland
1 inch = 1,000 feet
0 500 1,000250Feet
LegendPhase 1 Northwest ShorelinePerennial Creek/StreamBoundary between Sandand Fine Grained Sediment
")Approximate Location ofActive Stormwater Outfall
")DApproximate Location ofInactive Stormwater Outfall
Bis(2-ethylhexyl)phthalate inSediments!( ND!( <100 ug/kg!( 100-4,000 ug/kg
!( >4,000 ug/kg
$
Docu
ment
Path:
\\lov
etonfe
deral
\GISD
ata\N
orthe
ast\M
arylan
d\Spa
rrows
Point
\MXD
\Phas
eI_NW
Shore
line\S
P_Ph
aseI
Figure
6 BIS
Con
c in S
eds R
d1.m
xd
Note: U = Compound was not detected.Value is the reporting limit.

")
")
")
")D
")
")
!(!(
!(!(
!(!(
!(
!(
!(
!(
!(!(
!(!(
!(
!(
!(
!(!(
!(
SD-E02
SD-D02
SD-A01
SD-F02190 ug/kg
SD-B02127 ug/kg
SD-H02570 ug/kg
SD-G01260 ug/kg
SD-F011,600 ug/kg
SD-E03
SD-D01
SD-C015.6 ug/kg
SD-B014.8 ug/kg
SD-E01
SD-A02
SD-H01680 ug/kg
SD-H031,910 ug/kg
TurnerStation
Bear Creek
SD-G02230 ug/kg
SD-A03
SD-C03228 ug/kg
SD-C0247 ug/kg
Tin Mill Canal
_̂MD
Map Date: January 2015Image Source: ESRI 2011
Projection: NAD 1983 StatePlaneMaryland FIPS 1900 (US Feet)
Figure 7Total PCB Concentrations in
Sediments from Round 1 SamplingPhase I Northwest Shoreline
Baltimore, Maryland
1 inch = 1,000 feet
0 500 1,000250Feet
LegendPhase 1 Northwest ShorelinePerennial Creek/StreamBoundary between Sandand Fine Grained Sediment
!( Not Sampled for PCBs
")Approximate Location ofActive Stormwater Outfall
")DApproximate Location ofInactive Stormwater Outfall
Total PCBs in Sediments!( <50 ug/kg!( 50-500 ug/kg!( 500-1,000 ug/kg
!( >1,000 ug/kg
$
Docu
ment
Path:
\\lov
etonfe
deral
\GISD
ata\N
orthe
ast\M
arylan
d\Spa
rrows
Point
\MXD
\Phas
eI_NW
Shore
line\S
P_Ph
aseI
Figure
7 PC
B Con
c in S
eds R
d1.m
xd

")
")
")
")D
")
")
!(
!(
!(
!(
!(
!(
!(
!(
!(
!(
!(
!(
!(
!(
!(
!(
!(
!(
!(
!(
SD-H028 mg/kg
SD-F0111 mg/kg
SD-F0217 mg/kg
SD-E0211 mg/kg
SD-E0121 mg/kg
SD-D0116 mg/kgSD-D02
17 mg/kg
SD-A0114 mg/kg
SD-G027.2 mg/kg
SD-E036.3 mg/kg
SD-C037.3 mg/kg
SD-C025.4 mg/kg
SD-B019.2 mg/kg
SD-H039.4 mg/kg
SD-H016.3 mg/kg
SD-G014.8 mg/kg
TurnerStation
Bear Creek
SD-A037.4 mg/kg
SD-C017.5 mg/kg
SD-B027.3 mg/kg
SD-A027.1 mg/kg
Tin Mill Canal
_̂MD
Map Date: January 2015Image Source: ESRI 2011
Projection: NAD 1983 StatePlaneMaryland FIPS 1900 (US Feet)
Figure 8TOC-Normalized Nickel Concentrations
in Sediments from Round 1 SamplingPhase I Northwest Shoreline
Baltimore, Maryland
1 inch = 1,000 feet
0 500 1,000250Feet
LegendPhase 1 Northwest ShorelinePerennial Creek/StreamBoundary between Sandand Fine Grained Sediment
")Approximate Location ofActive Stormwater Outfall
")DApproximate Location ofInactive Stormwater Outfall
Nickel in Sediments!( <5 mg/kg!( 5-10 mg/kg!( 10-15 mg/kg
!( >15 mg/kg
$
Docu
ment
Path:
\\lov
etonfe
deral
\GISD
ata\N
orthe
ast\M
arylan
d\Spa
rrows
Point
\MXD
\Phas
eI_NW
Shore
line\S
P_Ph
aseI
Figure
8 TO
C No
rmaliz
ed N
ickel
Conc
in Se
ds R
d1.m
xd
Note: Data for each sample were normalized bydividing the data by the Total Organic Carbonconcentration in the sample (in g/kg divided by 10).
")
")
")
")D
")
")
!(!(
!(
!(
!(
!(
!(
!(
!(
!(
!(
!(!(
!(!(
!(!(
!(
!(!(
SD-G0185 mg/kg
SD-G0294 mg/kg
SD-F01472 mg/kg
SD-F02831 mg/kg
SD-E03100 mg/kg
SD-E02280 mg/kg
SD-C03238 mg/kg
SD-C02238 mg/kg
SD-B01413 mg/kg
SD-A02233 mg/kg
SD-D011457 mg/kgSD-D02
1811 mg/kg
SD-H03556 mg/kg
SD-H02127 mg/kg
SD-H01127 mg/kg
SD-A03226 mg/kg
TurnerStation
Bear Creek
SD-E01957 mg/kg
SD-C01273 mg/kg
SD-B02254 mg/kg
SD-A01481 mg/kg
Tin Mill Canal
_̂MD
Map Date: January 2015Image Source: ESRI 2011
Projection: NAD 1983 StatePlaneMaryland FIPS 1900 (US Feet)
Figure 9TOC-Normalized Zinc Concentrationsin Sediments from Round 1 Sampling
Phase I Northwest ShorelineBaltimore, Maryland
1 inch = 1,000 feet
0 500 1,000250Feet
LegendPhase 1 Northwest ShorelinePerennial Creek/StreamBoundary between Sandand Fine Grained Sediment
")Approximate Location ofActive Stormwater Outfall
")DApproximate Location ofInactive Stormwater Outfall
Zinc in Sediments!( <100 mg/kg!( 100-500 mg/kg!( 500-1,000 mg/kg
!( >1,000 mg/kg
$
Docu
ment
Path:
\\lov
etonfe
deral
\GISD
ata\N
orthe
ast\M
arylan
d\Spa
rrows
Point
\MXD
\Phas
eI_NW
Shore
line\S
P_Ph
aseI
Figure
9 TO
C No
rmaliz
ed Zi
nc C
onc i
n Sed
s Rd1
.mxd
Note: Data for each sample were normalized bydividing the data by the Total Organic Carbonconcentration in the sample (in g/kg divided by 10).

")
")
")
")D
")
")!(!(
!(
!(
!(
!(
!(
!(
!(
!(
!(
!(
!(
!(
!(
!(
!(
!(
!(
!(
SD-C0125 ug/kg
SD-B0182 ug/kg
SD-H02394 ug/kg
SD-F01891 ug/kg
SD-F02116 ug/kg
SD-E03863 ug/kg
SD-E02121 ug/kg
SD-D01217 ug/kg
SD-C03894 ug/kg
SD-A02655 ug/kg
SD-G014068 ug/kg
SD-D0266 ug/kg
SD-H03773 ug/kg
SD-H01162 ug/kg
SD-A03234 ug/kg
SD-E01105 ug/kg
TurnerStation
Bear Creek
SD-C02223 ug/kg
SD-B02367 ug/kg
SD-A01151 ug/kg
SD-G021102 ug/kg Tin Mill Canal
_̂MD
Map Date: January 2015Image Source: ESRI 2011
Projection: NAD 1983 StatePlaneMaryland FIPS 1900 (US Feet)
Figure 10TOC-Normalized Total PAH Concentrations
in Sediments from Round 1 SamplingPhase I Northwest Shoreline
Baltimore, Maryland
1 inch = 1,000 feet
0 500 1,000250Feet
LegendPhase 1 Northwest ShorelinePerennial Creek/StreamBoundary between Sandand Fine Grained Sediment
")Approximate Location ofActive Stormwater Outfall
")DApproximate Location ofInactive Stormwater Outfall
Total PAH in Sediments!( <100 ug/kg!( 100-500 ug/kg!( 500-1,500 ug/kg
!( >1,500 ug/kg
$
Docu
ment
Path:
\\lov
etonfe
deral
\GISD
ata\N
orthe
ast\M
arylan
d\Spa
rrows
Point
\MXD
\Phas
eI_NW
Shore
line\S
P_Ph
aseI
Figure
10 TO
C No
rmali
zed P
AH C
onc i
n Sed
s Rd1
.mxd
Note: Data for each sample were normalized bydividing the data by the Total Organic Carbonconcentration in the sample (in g/kg divided by 10).

!(!(
!(!(
!(!(
!(
!(!(
!(!(
!(
!(!(
!(
!( !(
!(!(!(
")
")
")
")D
")
")
!(
!(!(
!(
!(
!(
!(
!(
!(!( !(
!(!(
!(
!(
#
#
#
#
#
#
#
#
# @A@A
@A
@A@A@A
@A@A@A@A
@A@A
@A@A
@A@A
@A@A
@A@A
@A
Turner Station
Bear Creek
SD-A01SD-A02
SD-B01SD-B02
SD-D01SD-D02
SD-E01
SD-E02
SD-F01SD-F02
SD-H03
SD-G01
SD-C01SD-C02
SD-C03
SD-E03
SD-G02
SD-A03
TS-01(-7)
GL-02(-5)
SD-F04
SD-G04
SD-H05
SD-G05
SD-H06
RW18-PZM047
RW19-PZM020RW19-PZM050RW19-PZP000
TS04-PZM023
HI08-PZM003HI08-PZM060
TS04-PDM004
RW20-PZP000RW20-PZM020
GL-16(-6)
GL-12(-3)
GL-05(-7)
GL-12(-17)
GL-15(-6)
GL-16(-32)
GL-15(-36)GL-05(-25)
GL-02(-29)
Tin Mill Canal
SD-H02SD-H01
Outfall 071Outfall 070
Outfall 014
Outfall 018
Outfall UNNAMED
SD-G03
SD-F03
SD-DE01
SD-H04
SD-H02.5
SD-G01.5
_̂MD
Map Date: January 2015Image Source: ESRI 2011
Projection: NAD 1983 StatePlaneMaryland FIPS 1900 (US Feet)
Figure 11Proposed Sampling Locations
for the Second Round of theOffshore Investigation
Phase I Northwest ShorelineBaltimore, Maryland
1 inch = 1,200 feet
0 600 1,200300Feet
LegendPhase 1 Northwest Shoreline
Perennial Creek/StreamBoundary between Sandand Fine Grained Sediment
!( Round 1 Sediment Sampling Location
!(Proposed Surface SedimentSampling Location
!( Proposed Sediment Coring Location
!(Proposed Sediment CoringContingency Location
# Proposed Pore Water Sampling Location
@A Greys Landfill Well
@A Groundwater Well Sampled in June 2014
")Approximate Location ofActive Stormwater Outfall
")DApproximate Location ofInactive Stormwater Outfall$
Docu
ment
Path:
\\lov
etonfe
deral
\GISD
ata\N
orthe
ast\M
arylan
d\Spa
rrows
Point
\MXD
\Phas
eI_NW
Shore
line\S
P_Ph
aseI
Figure
11 Pr
opos
ed Sa
mplin
g Loc
ation
s for
Seco
nd R
ound
.mxd
Target Sampling Coordinates
(Maryland State Plane North American
Datum 1983, feet)
Northing Easting
1 574690.52 1457218.522 574691.32 1457220.221 574761.03 1457115.222 574762.83 1457100.441 574856.16 1456789.552 574855.50 1456792.203 574860.25 1456784.19
SD-B01 1 573948.43 1456594.99 Medium brown sand with limited silt
1 574072.49 1456481.572 574064.85 1456482.793 574066.08 1456475.664 574065.18 1456477.741 573470.89 1456425.632 573467.02 1456427.871 573679.97 1455991.592 573557.24 1456289.813 573554.97 1456284.444 573551.03 1456286.545 1456284.89 573558.49
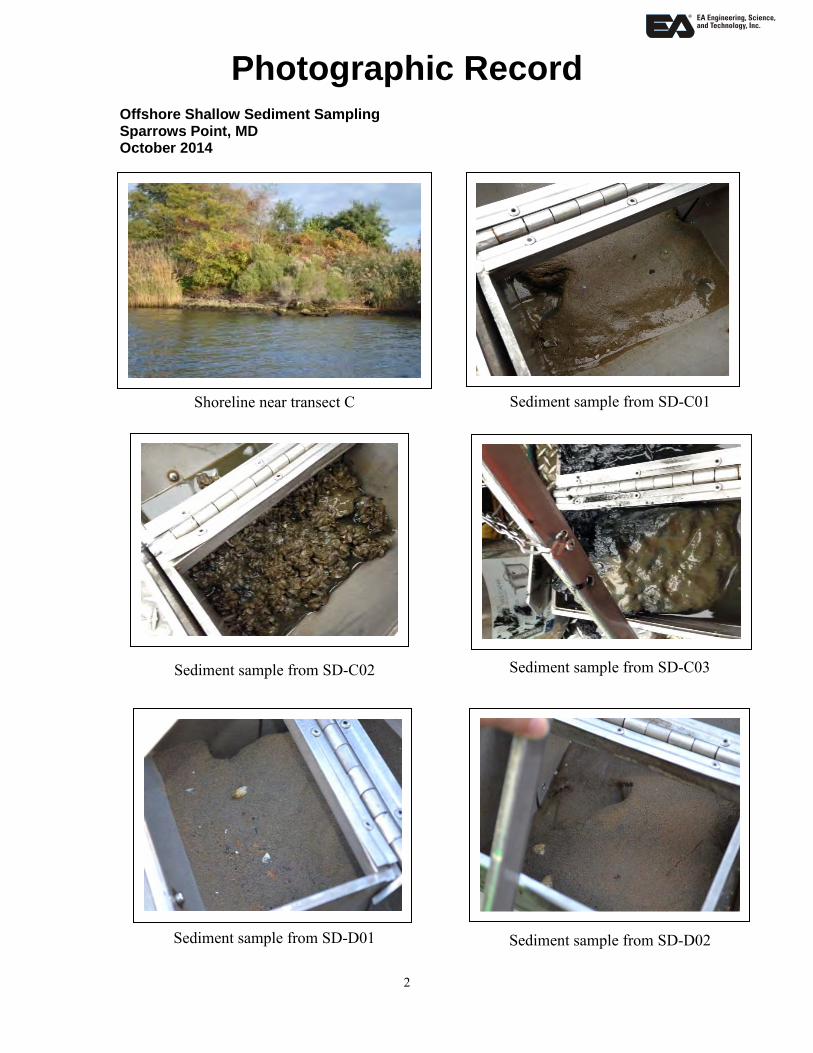
SD-C03 1 573685.25 1455990.90 Black silty clay or clayey silt; diffusional RPD; slight odor and sheen noted
SD-D01 1 571951.83 1455699.33 Brown fine to medium sand with limited silt; live Rangia ; woody debris
1 571880.12 1455597.762 571881.24 1455593.22
SD-E01 1 570752.56 1455847.24 Fine to medium brown sand with limited silt; live Rangia
1 570703.47 1455752.802 570699.22 1455751.793 570703.79 1455755.974 570701.13 1455756.975 570701.83 1455752.396 570701.52 1455750.931 570393.30 1455242.982 570392.45 1455232.983 570393.77 1455229.48
SD-F01 1 569781.52 1456283.64Fine to medium brown sand (2-3 inch) at surface; black
impacted (oily) sediments at lower depth; live Rangia in clean sediments; shell fragments; clean horizon between two layers
SD-F02 1 569718.72 1456202.64Fine to medium brown sand at surface; black impacted silty
sediment at depth; live Rangia in clean sediments; clean horizon between two layers.
SD-G01 1 569145.01 1456413.15 Diffusional RPD; shells; heavy sheen upon recovery with oily runoff; black silty clay or clayey silt; heavy odor
SD-G02 1 569208.68 1455854.34 Black silty clay or clayey silt; diffusional RPD; shell fragments; slight sheen
SD-H01 1 568923.83 1456418.11 RPD layer; heavy oil based odor; surface sheen on sediments
SD-H02 1 568894.52 1456300.10 RPD layer; some shells; slight oil based odor and sheen (Note: methane release when weight hit sediment surface)
SD-H03 1 568750.80 1455879.69 Diffusional RPD; black silty clay or clayey silt; heavy sheen upon recovery and heavy petroleum odor
Notes:Macoma = genus of clamsRangia = genus of clams RPD = Redox potential discontuity (vertical boundary between oxidized and reduced sediments)
Table 1. Sampling Locations and Sediment Descriptions, Round 1 Sediment Sampling
Phase I Offshore Investigation
Soft black silty clay or clayey silt; live Macoma
Soft black sediment; surface mussel bed; rocks
Fine to medium brown sand with silt; live Macoma
Brown fine to medium sand with limited silt; live Rangia
Soft black silty clay or claey sily; live Macoma ; slight petroleum odor
Brown fine to medium sand; pebbles; live Rangia ; mussel shell fragmentsSD-E02
SD-E03
Transect
F
G
H
C
D
E
Location
A
B
Ponar
Replicate
SD-A01
SD-A02
Description
Sediment Samples
SD-B02
SD-C01
SD-C02
SD-D02
SD-A03 Soft black silty clay or claey silt; thin RPD
Tan/brown sand with limited silt; live Rangia
Soft black silty clay or clayey silt; natural woody debris; thin RPD
Transect Category VOCs PAHs
SVOCs
(w/PAHs)
DEHP
only PCBs Metals Mercury Cyanide
Oil &
Grease SEM/AVS
Percent
Solids TOC Grain Size
Moisture
Content
A non-SW -- 3 -- 3 -- 3 3 3 -- 3 3 3 -- --B SW 2 -- 2 -- 2 2 2 2 2 2 2 2 2 2C SW 3 -- 3 -- 3 3 3 3 3 3 3 3 1 (C-02) 1 (C-02)D non-SW -- 2 -- 2 -- 2 -- 2 -- 2 2 2 -- --E non-SW -- 3 -- 3 -- 3 -- 3 -- 3 3 3 3 3F SW 2 2 2 2 2 2 2 2 2 2 -- --G SW 2 -- 2 -- 2 2 2 2 2 2 2 2 -- --H SW 3 -- 3 -- 3 3 3 3 3 3 3 3
Total 12 8 12 8 12 20 15 20 12 20 20 20 5 5Notes:SW = sediment transect located adjacent to an active stormwater outfallnon-SW = sediment transect not located adjacent to an active stormwater outfallAVS = Acid Volatile SulfideDEHP = bis(2-ethylhexyl)phthalate (an SVOC)PAH = Polycyclic Aromatic HydrocarbonPCB = Polychlorinated BiphenylSEM = Simultaneously Extracted MetalsSVOC = Semivolatile Organic CompoundTOC = Total Organic CarbonVOC = Volatile Organic Compound
Table 2 Analytical Program for the First Round Sediment Sampling by Transect
Sparrows Point Offshore Investigation

ANALYTE UNITS AVG RL SD-B01 SD-B02 SD-C02 SD-E01 SD-E02 SD-E03
Hydrometer Analysis
GRAVEL % --- 0 0 28.7 0 1.7 0
SAND % --- 92.5 22.6 56.6 96.8 83.4 26.3
SILT % --- 5.4 73.90 10.5 1.8 10 68.2
CLAY % --- 2.1 3.5 4.2 1.4 4.9 5.6
SILTCLAY % --- 7.5 77.4 14.7 3.2 14.9 73.8
General Chemistry UNITS AVG RL SD-A01 SD-A02 SD-A03 SD-B01 SD-B02 SD-B02-FD SD-C01 SD-C02 SD-C03 SD-D01 SD-D02
MOISTURE CONTENT % --- --- --- --- 36.6 228.7 --- --- 49.6 --- --- ---PERCENT MOISTURE % 0.1 32 66 77 29 76 73 32 42 77 34 27TOTAL ORGANIC CARBON MG/KG 2509.1 2700 42000 62000 2400 63000 55000 3100 16000 63000 3500 3700
General Chemistry UNITS AVG RL SD-E01 SD-E02 SD-E03 SD-F01 SD-F01-FD SD-F02 SD-G01 SD-G02 SD-H01 SD-H02 SD-H03
MOISTURE CONTENT % --- 29.5 29.1 312.6 --- --- --- --- --- --- --- ---PERCENT MOISTURE % 0.1 20 35 77 39 33 31 62 75 57 59 74TOTAL ORGANIC CARBON MG/KG 2509.1 2,300 5,000 120,000 18,000 20,000 5,900 130,000 180,000 150,000 150,000 180,000B = compound was detected in the method blank
Table 3
Sediment Chemical and Physical Parameters

ANALYTE UNITS AVG RL SD-A01 SD-A02 SD-A03 SD-B01 SD-B02 SD-B02-FD SD-C01 SD-C02 SD-C03 SD-D01 SD-D02
ANTIMONY MG/KG 0.77 0.17 1.500 2.5 0.12 J 2.7 2.5 0.13 0.41 2.6 0.27 B 0.36 B
ARSENIC MG/KG 0.12 1.8 17 26 1.7 27 24 1.6 7.1 28 4.8 5.4
BERYLLIUM MG/KG 0.38 0.082 0.72 1 0.053 J 1 0.94 0.056 J 0.24 1 0.15 0.13
CADMIUM MG/KG 0.42 0.94 5.4 7.1 0.78 9.2 8.3 0.73 3 8.5 4.4 4.8
CHROMIUM MG/KG 0.77 46 B 400 B 760 B 33 B 790 B 710 B 32 B 130 B 800 B 44 B 170 B
COPPER MG/KG 1.54 8.7 98.00 160 5.5 160 140 5.6 28 170 11 19
LEAD MG/KG 1.92 13 B 160 B 240 B 9.7 B 260 B 230 B 11 B 51 B 250 B 16 25
MERCURY MG/KG 0.04 0.018 J 0.26 0.36 0.0096 J 0.46 0.36 0.0079 J 0.086 0.42 NA NANICKEL MG/KG 7.10 3.7 30 46 2.2 46 41 2.7 8.6 46 5.5 6.4
SELENIUM MG/KG 1.92 0.17 J 2.00 2.8 0.12 J 3.1 2.6 0.12 J 0.77 3.1 0.22 J 0.25 J
SILVER MG/KG 0.38 0.047 J 0.86 1.6 0.026 J 1.7 1.5 0.03 J 0.23 1.7 0.071 J 0.16
THALLIUM MG/KG 0.38 0.047 J 0.40 0.55 0.033 J 0.58 0.52 0.034 J 0.11 0.54 0.039 J 0.062 J
ZINC MG/KG 8.36 130 B 980 B 1400 B 99 B 1600 B 1500 B 98 B 380 B 1500 B 510 670
CYANIDE, TOTAL MG/KG 0.62 0.12 J 0.73 U 1.1 U 0.35 U 1 U 0.95 U 0.37 U 0.36 J 1.5 0.38 U 0.66
ANALYTE UNITS AVG RL SD-E01 SD-E02 SD-E03 SD-F01 SD-F01-FD SD-F02 SD-G01 SD-G02 SD-H01 SD-H02 SD-H03
ANTIMONY MG/KG 0.77 0.27 B 0.22 B 4.1 B 1.1 B 1.1 B 0.68 B 7.8 B 7 B 6.1 B 6.6 B 6.8 B
ARSENIC MG/KG 0.12 3.5 2.8 25 9.7 10 6.1 17 23 20 23 27
BERYLLIUM MG/KG 0.38 0.082 0.15 0.92 0.18 0.16 0.13 0.24 J 0.46 J 0.35 J 0.31 J 0.29 J
CADMIUM MG/KG 0.42 0.97 0.72 5.3 4 4.1 2.5 2.5 5.7 4.9 4.5 45
CHROMIUM MG/KG 0.77 97 B 66 B 1400 B 530 B 530 B 250 B 800 B 2700 B 1400 B 1700 B 2600 B
COPPER MG/KG 1.54 9.1 11 190 77 80 29 110 260 180 190 470
LEAD MG/KG 1.92 16 16 190 110 110 46 67 130 110 120 260
MERCURY MG/KG 0.04 NA NA NA 0.26 0.17 0.072 0.26 0.53 0.38 0.36 0.83
NICKEL MG/KG 7.10 4.9 5.6 76 19 19 10 63 130 95 120 170
SELENIUM MG/KG 1.92 0.14 J 0.22 J 2.6 0.54 0.56 0.3 J 6 U 8.7 U 5.2 U 4.9 U 7.7 U SILVER MG/KG 0.38 0.063 0.075 J 2.5 1.1 1 0.28 0.89 J 5.4 1.9 2 4.8
THALLIUM MG/KG 0.38 0.032 J 0.054 J 0.49 0.12 0.11 0.079 0.14 J 0.3 J 0.3 J 0.27 J 0.2 J
ZINC MG/KG 8.36 220 140 1200 850 850 490 1100 1700 1900 1900 10000
CYANIDE, TOTAL MG/KG 0.62 0.21 J 0.18 J 7.3 0.4 0.22 J 0.31 J 0.37 J 21 2.8 1.2 12
NOTES: Bold values represent detected concentrations. RL is reported for non-detected constituentsNA = Not AnalyzedRL = reporting limitB = compound was detected in the method blankJ = compound was detected, but below the reporting limit (value is estimated)U = compound was analyzed, but not detected
Table 4
Concentrations of Inorganic Constituents in Sediment
ANALYTE UNITS AVG RL SD-A01 SD-A02 SD-A03 SD-B01 SD-B02 SD-B02-FD SD-C01 SD-C02 SD-C03 SD-D01 SD-D02
ACENAPHTHENE UG/KG 399.19 20 U 49 U 300 U 19 U 350 U 310 U 49 U 140 U 360 U 25 U 18 U ACENAPHTHYLENE UG/KG 399.19 20 U 76 110 J 19 U 89 J 310 U 49 U 140 U 120 J 25 U 18 U ANTHRACENE UG/KG 399.19 20 U 73 79 J 19 U 110 J 310 U 49 U 28 J 140 J 25 U 18 U FLUORENE UG/KG 399.19 20 U 29 J 300 U 19 U 350 U 310 U 49 U 140 U 360 U 25 U 18 U NAPHTHALENE UG/KG 399.19 8.7 J 200 310 4.1 J 380 330 7.9 J 74 J 560 25 U 4.2 J
PHENANTHRENE UG/KG 399.19 20 U 120 180 J 19 U 220 J 310 U 49 U 54 J 200 J 25 U 18 U BENZO[A]ANTHRACENE UG/KG 399.19 20 U 160 300 U 19 U 280 J 210 J 49 U 140 U 270 J 14 J 18 U BENZO[A]PYRENE UG/KG 399.19 20 U 210 300 U 19 U 350 U 380 49 U 140 U 500 25 U 18 U BENZO[B]FLUORANTHENE UG/KG 399.19 20 U 310 300 U 19 U 350 U 310 U 49 U 140 U 690 11 J 18 U BENZO[G,H,I]PERYLENE UG/KG 399.19 20 U 260 300 U 19 U 350 U 310 U 49 U 140 U 670 25 U 18 U BENZO[K]FLUORANTHENE UG/KG 399.19 20 U 110 300 U 19 U 350 U 310 U 49 U 140 U 280 J 25 U 18 U CHRYSENE UG/KG 399.19 20 U 210 300 U 19 U 250 J 260 J 49 U 140 U 360 13 J 18 U DIBENZ(A,H)ANTHRACENE UG/KG 399.19 20 U 61 300 U 19 U 350 U 310 U 49 U 140 U 360 U 25 U 18 U FLUORANTHENE UG/KG 399.19 18 J 410 390 7.7 J 490 430 49 U 110 J 680 22 J 14 J
INDENO[1,2,3-CD]PYRENE UG/KG 399.19 20 U 250 300 U 19 U 350 U 310 U 49 U 140 U 470 25 U 18 U PYRENE UG/KG 399.19 14 J 270 380 7.9 J 490 440 49 U 90 J 690 16 J 6.3 J
TOTAL PAHs ND=0 UG/KG --- 40.7 2,749 1449 19.7 2309 2050 7.9 356 5630 76 24.5
HEM (OIL AND GREASE) MG/KG 445.4 --- --- --- 260 B 12000 B 12000 B 310 B 1600 B 18000 B --- ---
ANALYTE UNITS AVG RL SD-E01 SD-E02 SD-E03 SD-F01 SD-F02 SD-G01 SD-G02 SD-H01 SD-H02 SD-H03
ACENAPHTHENE UG/KG 399.19 17 U 26 U 730 U 82 U 48 U 880 U 660 U 1200 U 1200 U 1900 U ACENAPHTHYLENE UG/KG 399.19 17 U 8.5 J 320 J 82 U 48 U 880 U 660 U 1200 U 1200 U 1900 U ANTHRACENE UG/KG 399.19 17 U 26 U 730 U 82 U 48 U 880 U 660 U 1200 U 1200 U 1900 U FLUORENE UG/KG 399.19 17 U 26 U 730 U 82 U 48 U 880 U 660 U 1200 U 1200 U 1900 U NAPHTHALENE UG/KG 399.19 17 U 17 J 530 J 34 J 16 J 200 J 430 J 220 J 210 J 4000
PHENANTHRENE UG/KG 399.19 17 U 26 U 730 U 82 U 48 U 880 U 660 U 1200 U 1200 U 1900 U BENZO[A]ANTHRACENE UG/KG 399.19 17 U 26 U 610 J 130 48 U 880 U 2300 1200 U 1200 U 1900 U BENZO[A]PYRENE UG/KG 399.19 17 U 26 U 1300 82 U 48 U 880 U 1700 1200 U 1200 U 1900 U BENZO[B]FLUORANTHENE UG/KG 399.19 17 U 26 U 1700 82 U 48 U 880 U 660 U 1200 U 1200 U 1900 U BENZO[G,H,I]PERYLENE UG/KG 399.19 17 U 26 U 1000 82 U 48 U 880 U 1200 U 1200 U 1900 U BENZO[K]FLUORANTHENE UG/KG 399.19 17 U 26 U 280 J 82 U 48 U 880 U 660 U 1200 U 1200 U 1900 U CHRYSENE UG/KG 399.19 17 U 26 U 720 J 240 48 U 880 U 2200 1200 U 1200 U 1900 U DIBENZ(A,H)ANTHRACENE UG/KG 399.19 17 U 26 U 730 U 82 U 48 U 880 U 660 U 1200 U 1200 U 1900 U FLUORANTHENE UG/KG 399.19 17 17 J 1900 450 75 1200 4900 1400 3200 2600
INDENO[1,2,3-CD]PYRENE UG/KG 399.19 17 U 26 U 730 U 82 U 48 U 880 U 660 U 1200 U 1200 U 1900 U PYRENE UG/KG 399.19 7.1 J 18 J 2000 750 140 1000 2800 1300 2500 5000
TOTAL PAHs ND=0 UG/KG --- 24.1 60.5 10360 1604 231 2400 14330 2920 5910 11600
HEM (OIL AND GREASE) MG/KG 445.4 --- --- --- 15000 B 2500 B 89000 B 95000 B 90000 B 110000 B 110000 B NOTES: Bold values represent detected concentrations. RL is reported for non-detected constituentsRL = reporting limitJ = compound was detected, but below the reporting limit (value is estimated)U = compound was analyzed, but not detected
Table 5
Concentrations of Polycyclic Aromatic Hydrocarbons and Oil and Grease in Sediment

ANALYTE UNITS AVG RL SD-A01 SD-A02 SD-A03 SD-B01 SD-B02 SD-B02-FD SD-C01 SD-C02 SD-C03 SD-D01 SD-D02 SD-E01 SD-E02 SD-E03 SD-F01 SD-F01-FD SD-F02 SD-G01 SD-G02 SD-H01 SD-H02 SD-H03
1,2,4-TRICHLOROBENZENE UG/KG 2722.54 --- --- --- 93 U 1700 U 1500 U 240 U 710 U 1800 U --- --- --- --- --- 410 U --- 240 U 4300 U 3300 U 5800 U 5900 U 9400 U 1,2-DIPHENYLHYDRAZINE(AS AZOBENZENE) UG/KG 2722.54 --- --- --- 93 U 1700 U 1500 U 240 U 710 U 1800 U --- --- --- --- --- 410 U --- 240 U 4300 U 3300 U 5800 U 5900 U 9400 U 2,2'-OXYBIS[1-CHLOROPROPANE] UG/KG 553.69 --- --- --- 19 U 350 U 310 U 49 U 140 U 360 U --- --- --- --- --- 82 U --- 48 U 880 U 660 U 1200 U 1200 U 1900 U 2,4,6-TRICHLOROPHENOL UG/KG 2722.54 --- --- --- 93 U 1700 U 1500 U 240 U 710 U 1800 U --- --- --- --- --- 410 U --- 240 U 4300 U 3300 U 5800 U 5900 U 9400 U 2,4-DICHLOROPHENOL UG/KG 553.69 --- --- --- 19 U 350 U 310 U 49 U 140 U 360 U --- --- --- --- --- 82 U --- 48 U 880 U 660 U 1200 U 1200 U 1900 U 2,4-DIMETHYLPHENOL UG/KG 2722.54 --- --- --- 93 U 1700 U 1500 U 240 U 710 U 1800 U --- --- --- --- --- 410 U --- 240 U 4300 U 3300 U 5800 U 5900 U 9400 U 2,4-DINITROPHENOL UG/KG 14098.46 --- --- --- 480 U 8800 U 7800 U 1200 U 3700 U 9000 U --- --- --- --- --- 2100 U --- 1200 U 22000 U 17000 U 30000 U 31000 U 49000 U 2,4-DINITROTOLUENE UG/KG 2722.54 --- --- --- 93 U 1700 U 1500 U 240 U 710 U 1800 U --- --- --- --- --- 410 U --- 240 U 4300 U 3300 U 5800 U 5900 U 9400 U 2,6-DINITROTOLUENE UG/KG 2722.54 --- --- --- 93 U 1700 U 1500 U 240 U 710 U 1800 U --- --- --- --- --- 410 U --- 240 U 4300 U 3300 U 5800 U 5900 U 9400 U 2-CHLORONAPHTHALENE UG/KG 553.69 --- --- --- 19 U 350 U 310 U 49 U 140 U 360 U --- --- --- --- --- 82 U --- 48 U 880 U 660 U 1200 U 1200 U 1900 U 2-CHLOROPHENOL UG/KG 2722.54 --- --- --- 93 U 1700 U 1500 U 240 U 710 U 1800 U --- --- --- --- --- 410 U --- 240 U 4300 U 3300 U 5800 U 5900 U 9400 U 2-NITROPHENOL UG/KG 2722.54 --- --- --- 93 U 1700 U 1500 U 240 U 710 U 1800 U --- --- --- --- --- 410 U --- 240 U 4300 U 3300 U 5800 U 5900 U 9400 U 3,3'-DICHLOROBENZIDINE UG/KG 2722.54 --- --- --- 93 U 1700 U 1500 U 240 U 710 U 1800 U --- --- --- --- --- 410 U --- 240 U 4300 U 3300 U 5800 U 5900 U 9400 U 4,6-DINITRO-2-METHYLPHENOL UG/KG 14098.46 --- --- --- 480 U 8800 U 7800 U 1200 U 3700 U 9000 U --- --- --- --- --- 2100 U --- 1200 U 22000 U 17000 U 30000 U 31000 U 49000 U 4-BROMOPHENYL PHENYL ETHER UG/KG 2722.54 --- --- --- 93 U 1700 U 1500 U 240 U 710 U 1800 U --- --- --- --- --- 410 U --- 240 U 4300 U 3300 U 5800 U 5900 U 9400 U 4-CHLORO-3-METHYLPHENOL UG/KG 2722.54 --- --- --- 93 U 1700 U 1500 U 240 U 710 U 1800 U --- --- --- --- --- 410 U --- 240 U 4300 U 3300 U 5800 U 5900 U 9400 U 4-CHLOROPHENYL PHENYL ETHER UG/KG 2722.54 --- --- --- 93 U 1700 U 1500 U 240 U 710 U 1800 U --- --- --- --- --- 410 U --- 240 U 4300 U 3300 U 5800 U 5900 U 9400 U 4-NITROPHENOL UG/KG 14098.46 --- --- --- 480 U 8800 U 7800 U 1200 U 3700 U 9000 U --- --- --- --- --- 2100 U --- 1200 U 22000 U 17000 U 30000 U 31000 U 49000 U BENZIDINE UG/KG 55369.23 --- --- --- 1900 U 35000 U 31000 U 4900 U 14000 U 36000 U --- --- --- --- --- 8200 U --- 4800 U 88000 U 66000 U 120000 U 120000 U 190000 U BENZOIC ACID UG/KG 14098.46 --- --- --- 480 U * 8800 U * 7800 U * 1200 U * 3700 U * 9000 U * --- --- --- --- --- 2100 U --- 1200 U 22000 U 17000 U 30000 U 31000 U 49000 U BIS(2-CHLOROETHOXY)METHANE UG/KG 2722.54 --- --- --- 93 U 1700 U 1500 U 240 U 710 U 1800 U --- --- --- --- --- 410 U --- 240 U 4300 U 3300 U 5800 U 5900 U 9400 U BIS(2-CHLOROETHYL)ETHER UG/KG 553.69 --- --- --- 19 U 350 U 310 U 49 U 140 U 360 U --- --- --- --- --- 82 U --- 48 U 880 U 660 U 1200 U 1200 U 1900 U BIS(2-ETHYLHEXYL) PHTHALATE UG/KG 3981.90 27 J 250 J 2900 U 190 U 910 J 3100 U 490 U 1400 U 3500 U 250 U 29 J 18 J 42 J 3700 J 1600 --- 300 J 3300 J 13000 7500 J 3500 J 33000
BUTYL BENZYL PHTHALATE UG/KG 2722.54 --- --- --- 93 U 1700 U 1500 U 240 U 710 U 1800 U --- --- --- --- --- 410 U --- 240 U 4300 U 3300 U 5800 U 5900 U 9400 U DIETHYL PHTHALATE UG/KG 2722.54 --- --- --- 93 U 1700 U 1500 U 240 U 710 U 1800 U --- --- --- --- --- 410 U --- 240 U 4300 U 3300 U 5800 U 5900 U 9400 U DIMETHYL PHTHALATE UG/KG 2722.54 --- --- --- 93 U 1700 U 1500 U 240 U 710 U 1800 U --- --- --- --- --- 410 U --- 240 U 4300 U 3300 U 5800 U 5900 U 9400 U DI-N-BUTYL PHTHALATE UG/KG 2722.54 --- --- --- 93 U 1700 U 1500 U 240 U 710 U 1800 U --- --- --- --- --- 410 U --- 240 U 4300 U 3300 U 5800 U 5900 U 9400 U DI-N-OCTYL PHTHALATE UG/KG 2722.54 --- --- --- 93 U 1700 U 1500 U 240 U 710 U 1800 U --- --- --- --- --- 410 U --- 240 U 4300 U 3300 U 5800 U 5900 U 9400 U HEXACHLOROBENZENE UG/KG 553.69 --- --- --- 19 U 350 U 310 U 49 U 140 U 360 U --- --- --- --- --- 82 U --- 48 U 880 U 660 U 1200 U 1200 U 1900 U HEXACHLOROBUTADIENE UG/KG 553.69 --- --- --- 19 U 350 U 310 U 49 U 140 U 360 U --- --- --- --- --- 82 U --- 48 U 880 U 660 U 1200 U 1200 U 1900 U HEXACHLOROCYCLOPENTADIENE UG/KG 2722.54 --- --- --- 93 U 1700 U 1500 U 240 U 710 U 1800 U --- --- --- --- --- 410 U --- 240 U 4300 U 3300 U 5800 U 5900 U 9400 U HEXACHLOROETHANE UG/KG 2722.54 --- --- --- 93 U 1700 U 1500 U 240 U 710 U 1800 U --- --- --- --- --- 410 U --- 240 U 4300 U 3300 U 5800 U 5900 U 9400 U ISOPHORONE UG/KG 2722.54 --- --- --- 93 U 1700 U 1500 U 240 U 710 U 1800 U --- --- --- --- --- 410 U --- 240 U 4300 U 3300 U 5800 U 5900 U 9400 U NITROBENZENE UG/KG 5529.23 --- --- --- 190 U 3500 U 3100 U 490 U 1400 U 3500 U --- --- --- --- --- 820 U --- 480 U 8800 U 6600 U 12000 U 12000 U 19000 U N-NITROSODIMETHYLAMINE UG/KG 2722.54 --- --- --- 93 U 1700 U 1500 U 240 U 710 U 1800 U --- --- --- --- --- 410 U --- 240 U 4300 U 3300 U 5800 U 5900 U 9400 U N-NITROSODI-N-PROPYLAMINE UG/KG 553.69 --- --- --- 19 U 350 U 310 U 49 U 140 U 360 U --- --- --- --- --- 82 U --- 48 U 880 U 660 U 1200 U 1200 U 1900 U N-NITROSODIPHENYLAMINE UG/KG 2722.54 --- --- --- 93 U 1700 U 1500 U 240 U 710 U 1800 U --- --- --- --- --- 410 U --- 240 U 4300 U 3300 U 5800 U 5900 U 9400 U PENTACHLOROPHENOL UG/KG 2722.54 --- --- --- 93 U 1700 U 1500 U 240 U 710 U 1800 U --- --- --- --- --- 410 U --- 240 U 4300 U 3300 U 5800 U 5900 U 9400 U PHENOL UG/KG 553.69 --- --- --- 19 U 350 U 310 U 49 U 140 U 360 U --- --- --- --- --- 82 U --- 48 U 880 U 660 U 1200 U 1200 U 1900 U NOTES: Bold values represent detected concentrations. RL is reported for non-detected constituentsRL = reporting limitJ = compound was detected, but below the reporting limit (value is estimated)U = compound was analyzed, but not detected
Table 6
Concentrations of Semivolatile Organic Compounds in Sediment

ANALYTE UNITS AVG RL SD-B01 SD-B02 SD-B02-FD SD-C01 SD-C02 SD-C03 SD-F01 SD-F02 SD-G01 SD-G02 SD-H01 SD-H02 SD-H03
PCB-1016 UG/KG 14.77 5.9 U 17 U 15 U 6.1 U 7.2 U 18 U 6.8 U 6 U 22 U 17 U 19 U 20 U 32 U PCB-1221 UG/KG 14.77 5.9 U 17 U 15 U 6.1 U 7.2 U 18 U 6.8 U 6 U 22 U 17 U 19 U 20 U 32 U PCB-1232 UG/KG 14.77 5.9 U 17 U 15 U 6.1 U 7.2 U 18 U 6.8 U 6 U 22 U 17 U 19 U 20 U 32 U PCB-1242 UG/KG 14.77 5.9 U 17 U 15 U 6.1 U 7.2 U 18 U 6.8 U 6 U 22 U 17 U 19 U 20 U 32 U PCB-1248 UG/KG 14.77 5.9 U 78 130 6.1 U 26 140 1600 190 260 230 680 570 910
PCB-1254 UG/KG 14.77 2.9 J 17 U 15 U 3.7 J 7.2 U 18 U 6.8 U 6 U 22 U 17 U 19 U 20 U 32 U PCB-1260 UG/KG 14.77 1.9 J 49 84 1.9 J 21 88 6.8 U 6 U 22 U 17 U 19 U 20 U 1000
Total PCBs ND=0 UG/KG --- 4.8 127 214 5.6 47 228 1600 190 260 230 680 570 1910NOTES: Bold values represent detected concentrations. RL is reported for non-detected constituentsRL = reporting limitJ = compound was detected, but below the reporting limit (value is estimated)U = compound was analyzed, but not detected
Table 7
Concentrations of Polychlorinated Biphenyl Aroclors in Sediment
ANALYTE UNITS AVG RL SD-B01 SD-B02 SD-B02-FD SD-C01 SD-C02 SD-C03 SD-F01 SD-F02 SD-G01 SD-G02 SD-H01 SD-H02 SD-H03
1,1,1-TRICHLOROETHANE UG/KG 13.42 7.1 U 21 U 18 U 7.4 U 8.6 U 21 U 8.2 U 7.2 U 13 U 20 U 12 U 12 U 19 U 1,1,2,2-TETRACHLOROETHANE UG/KG 13.42 7.1 U 21 U 18 U 7.4 U 8.6 U 21 U 8.2 U 7.2 U 13 U 20 U 12 U 12 U 19 U 1,1,2-TRICHLOROETHANE UG/KG 13.42 7.1 U 21 U 18 U 7.4 U 8.6 U 21 U 8.2 U 7.2 U 13 U 20 U 12 U 12 U 19 U 1,1-DICHLOROETHANE UG/KG 13.42 7.1 U 21 U 18 U 7.4 U 8.6 U 21 U 8.2 U 7.2 U 13 U 20 U 12 U 12 U 19 U 1,1-DICHLOROETHENE UG/KG 13.42 7.1 U 21 U 18 U 7.4 U 8.6 U 21 U 8.2 U 7.2 U 13 U 20 U 12 U 12 U 19 U 1,2-DICHLOROBENZENE UG/KG 13.42 7.1 U 21 U 18 U 7.4 U 8.6 U 21 U 8.2 U 7.2 U 13 U 8.8 J 12 U 12 U 19 U 1,2-DICHLOROETHANE UG/KG 13.42 7.1 U 21 U 18 U 7.4 U 8.6 U 21 U 8.2 U 7.2 U 13 U 20 U 12 U 12 U 19 U 1,2-DICHLOROPROPANE UG/KG 13.42 7.1 U 21 U 18 U 7.4 U 8.6 U 21 U 8.2 U 7.2 U 13 U 20 U 12 U 12 U 19 U 1,3-DICHLOROBENZENE UG/KG 13.42 7.1 U 21 U 18 U 7.4 U 8.6 U 21 U 8.2 U 7.2 U 13 U 20 U 12 U 12 U 19 U 1,4-DICHLOROBENZENE UG/KG 13.42 7.1 U 21 U 18 U 7.4 U 8.6 U 21 U 8.2 U 7.2 U 13 U 20 U 12 U 12 U 19 U 2-CHLOROETHYL VINYL ETHER UG/KG 26.85 14 U 42 U 37 U 15 U 17 U 43 U 16 U 14 U 26 U 40 U 23 U 24 U 38 U ACROLEIN UG/KG 268.46 140 U 420 U 370 U 150 U 170 U 430 U 160 U 140 U 260 U 400 U 230 U 240 U 380 U ACRYLONITRILE UG/KG 268.46 140 U 420 U 370 U 150 U 170 U 430 U 160 U 140 U 260 U 400 U 230 U 240 U 380 U BENZENE UG/KG 13.42 7.1 U 21 U 18 U 7.4 U 8.6 U 21 U 8.2 U 7.2 U 13 U 20 U 12 U 12 U 6.9 J
BROMOFORM UG/KG 13.42 7.1 U 21 U 18 U 7.4 U 8.6 U 21 U 8.2 U 7.2 U 13 U 20 U 12 U 12 U 19 U BROMOMETHANE UG/KG 13.42 7.1 U 21 U 18 U 7.4 U 8.6 U 21 U 8.2 U 7.2 U 13 U 20 U 12 U 12 U 19 U CARBON TETRACHLORIDE UG/KG 13.42 7.1 U 21 U 18 U 7.4 U 8.6 U 21 U 8.2 U 7.2 U 13 U 20 U 12 U 12 U 19 U CHLOROBENZENE UG/KG 13.42 7.1 U 21 U 18 U 7.4 U 8.6 U 21 U 8.2 U 7.2 U 13 U 16 J 12 U 2.4 J 250
CHLORODIBROMOMETHANE UG/KG 13.42 7.1 U 21 U 18 U 7.4 U 8.6 U 21 U 8.2 U 7.2 U 13 U 20 U 12 U 12 U 19 U CHLOROETHANE UG/KG 13.42 7.1 U 21 U 18 U 7.4 U 8.6 U 21 U 8.2 U 7.2 U 13 U 20 U 12 U 12 U 19 U CHLOROFORM UG/KG 13.42 7.1 U 21 U 18 U 7.4 U 8.6 U 21 U 8.2 U 7.2 U 13 U 20 U 12 U 12 U 19 U CHLOROMETHANE UG/KG 13.42 7.1 U 21 U 18 U 7.4 U 8.6 U 21 U 8.2 U 7.2 U 13 U 20 U 12 U 12 U 19 U CIS-1,3-DICHLOROPROPENE UG/KG 13.42 7.1 U 21 U 18 U 7.4 U 8.6 U 21 U 8.2 U 7.2 U 13 U 20 U 12 U 12 U 19 U DICHLOROBROMOMETHANE UG/KG 13.42 7.1 U 21 U 18 U 7.4 U 8.6 U 21 U 8.2 U 7.2 U 13 U 20 U 12 U 12 U 19 U ETHYLBENZENE UG/KG 13.42 7.1 U 21 U 18 U 7.4 U 8.6 U 21 U 8.2 U 7.2 U 2.1 J 5.8 J 12 U 12 U 33
METHYLENE CHLORIDE UG/KG 13.42 7.1 U 21 U 18 U 7.4 U 8.6 U 21 U 8.2 U 7.2 U 13 U 20 U 12 U 12 U 19 U TETRACHLOROETHENE UG/KG 13.42 7.1 U 21 U 18 U 7.4 U 8.6 U 21 U 8.2 U 7.2 U 13 U 20 U 12 U 12 U 19 U TOLUENE UG/KG 13.42 1.7 J B 5.1 J B 4.2 J B 1.9 J B 2.2 J B 5.7 J B 1.8 J 1.6 J 3.6 J 5.3 J 2.6 J 3.3 J B 16 J B
TRANS-1,2-DICHLOROETHENE UG/KG 13.42 7.1 U 21 U 18 U 7.4 U 8.6 U 21 U 8.2 U 7.2 U 13 U 20 U 12 U 12 U 19 U TRANS-1,3-DICHLOROPROPENE UG/KG 13.42 7.1 U 21 U 18 U 7.4 U 8.6 U 21 U 8.2 U 7.2 U 13 U 20 U 12 U 12 U 19 U TRICHLOROETHENE UG/KG 13.42 7.1 U 21 U 18 U 7.4 U 8.6 U 21 U 8.2 U 7.2 U 13 U 20 U 12 U 12 U 19 U VINYL CHLORIDE UG/KG 13.42 7.1 U 21 U 18 U 7.4 U 8.6 U 21 U 8.2 U 7.2 U 13 U 20 U 12 U 12 U 19 U NOTES: Bold values represent detected concentrations. RL is reported for non-detected constituentsRL = reporting limitB = compound was detected in the method blankJ = compound was detected, but below the reporting limit (value is estimated)U = compound was analyzed, but not detected
Table 8
Concentrations of Volatile Organic Compounds in Sediment
ANALYTE UNITS AVG RL SD-A01 SD-A02 SD-A03 SD-B01 SD-B02 SD-B02-FD SD-C01 SD-C02 SD-C03 SD-D01 SD-D02
CADMIUM SEM UMOL/G 0.00 0.0082 0.034 0.057 0.0072 0.073 0.063 0.0058 0.025 0.07 0.032 0.026
COPPER SEM UMOL/G 0.03 0.11 B 0.62 B 1.8 B 0.075 B 1.8 B 1.5 B 0.067 B 0.37 B 0.86 B 0.094 0.14
LEAD SEM UMOL/G 0.01 0.049 0.41 0.79 0.037 0.85 0.73 0.035 0.18 0.84 0.043 0.052
NICKEL SEM UMOL/G 0.07 0.033 0.26 0.49 0.029 0.5 0.47 0.027 0.13 0.55 0.047 0.047
ZINC SEM UMOL/G 0.11 2 B 10 B 18 B 1.6 B 21 B 19 B 1.4 B 5.5 B 20 B 5.9 6.2
ACID VOLATILE SULFIDES (AVS) MG/KG 55 22 U 720 1300 21 U 1200 990 22 U 330 700 23 U 21 U SEM/AVS RATIO NONE NC 0.52 0.54 NC 0.64 0.69 NC 0.6 1 NC NC
ANALYTE UNITS AVG RL SD-E01 SD-E02 SD-E03 SD-F01 SD-F01-FDSD-F02 SD-G01 SD-G02 SD-H01 SD-H02 SD-H03
CADMIUM SEM UMOL/G 0.00 0.0071 0.015 0.11 0.085 0.027 0.062 0.072 0.11 0.11 0.1 0.81
COPPER SEM UMOL/G 0.03 0.078 0.28 4.2 1.7 0.45 1.4 3.6 5 4.7 5.2 7.2
LEAD SEM UMOL/G 0.01 0.047 0.13 1.5 0.84 0.21 0.62 0.73 1.1 1.1 1.1 2.2
NICKEL SEM UMOL/G 0.07 0.041 0.13 2.2 0.48 0.14 0.35 2.3 3.5 2.8 3.5 5.6
ZINC SEM UMOL/G 0.11 2.6 5.1 40 26 9.2 21 37 41 56 46 280
ACID VOLATILE SULFIDES (AVS) MG/KG 55 19 U 47 U 2700 1000 810 500 1600 1600 1000 1100 470
SEM/AVS RATIO NONE NC NC 0.58 0.92 0.4 1.5 0.87 1 2 1.7 21
NOTES: Bold values represent detected concentrations. RL is reported for non-detected constituentsB = compound was detected in the method blankNC = not calculatedRL = reporting limit
Table 9
Acid Volatile Sulfides and Simultaneously Extracted Metals in Sediment

Table 10 Pore Water Sampling Locations and Rationale
Location
Associated
Monitoring
Well(s)
Rationale
A01 GL16, GL02, TS01
Near GL16, GL02, and TS01 well clusters, where copper, nickel, zinc, and bis(2-ethylhexyl)phthalate were identified as groundwater COPCs
B01 GL05, GL15 Near GL05 and GL15 well clusters, where chromium, copper, nickel, zinc, and bis(2-ethylhexyl)phthalate were identified as groundwater COPCs
C01 GL12 Near GL12 well cluster, where mercury, zinc, and bis(2-ethylhexyl)phthalate were identified as groundwater COPCs
D01 RW18-20, TS04
Near RW18, RW19, RW20, and TS04 well clusters, where cadmium, copper, lead, nickel, zinc, cyanide, PAHs, and bis(2-ethylhexyl)phthalate were identified as groundwater COPCs
DE01 RW18-20, TS04
Near RW18, RW19, RW20, and TS04 well clusters, where cadmium, copper, lead, nickel, zinc, cyanide, PAHs, and bis(2-ethylhexyl)phthalate were identified as groundwater COPCs
E01 RW18-20, TS04
South of RW18, RW19, RW20, and TS04 well clusters, where cadmium, copper, lead, nickel, zinc, cyanide, PAHs, and bis(2-ethylhexyl)phthalate were identified as groundwater COPCs
F01 HI08 Near well HI08, where copper, lead, cyanide, PAHs, and bis(2-ethylhexyl)phthalate were identified as groundwater COPCs
F03 HI08 Offshore of well HI08, where copper, lead, cyanide, PAHs, and bis(2-ethylhexyl)phthalate were identified as groundwater COPCs; assess changes in pore water composition with distance from shore and along a depth gradient, relative to F01
F04 HI08 Directly offshore from impacted well HI08, where copper, lead, cyanide, PAHs, and bis(2-ethylhexyl)phthalate were identified as groundwater COPCs

Location PAHs DEHP Cadmium Chromium Copper Lead Mercury Nickel Zinc Cyanide DOC
Hardness
(Ca+Mg)
A01 1 1 1 1 1 1B01 1 1 1 1 1 1 1C01 1 1 1 1 1D01 1 1 1 1 1 1 1 1 1 1
DE01 1 1 1 1 1 1 1 1 1 1E01 1 1 1 1 1 1 1 1 1 1F01 1 1 1 1 1 1 1F03 1 1 1 1 1 1 1F04 1 1 1 1 1 1 1
Total 6 9 3 1 8 6 1 5 6 6 9 9Notes:DEHP = bis(2-ethylhexyl)phthalate (an SVOC)DOC = Dissolved Organic CarbonPAH = Polycyclic Aromatic Hydrocarbon
Table 11 Analytical Program for the Second Round Pore Water Sampling by Transect
Sparrows Point Offshore Investigation

Parameter Method
Sediment
Grab
Samples
Sediment
Core
Samples1
Field
Duplicates
Rinsate
BlanksTrip Blanks
Total
Sediment1 Pore Water
Rinsate
Blanks
Field
Duplicates
Total Pore
Water
VOCs SW846 8260C -- 30 3 3 3 39 -- -- -- --
PPL PAHs SW846 8270D Low-Level 1 -- -- -- -- 1 6 1 1 8
PPL SVOCs (including PAHs) SW846 8270D Low-Level -- 30 3 3 -- 36 -- -- -- --
SVOCs (bis(2-ethylhexyl)phthalate only) SW846 8270D Low-Level 1 -- -- -- -- 1 9 1 1 11
PCB Aroclors SW846 8082A -- 30 3 3 -- 36 -- -- -- --
PPL Metals SW846 6020A 1 30 3 3 -- 37 9 1 1 11
Mercury SW846 7470A/7471B -- 30 3 3 -- 36 1 -- -- 1
Cyanide EPA 9014 1 30 3 3 -- 37 6 1 1 8
Oil and Grease SW846 1664B/9071B -- 30 3 3 -- 36 -- -- -- --
SEM/AVS SW846 6010B/9034 1 10 -- -- -- 11 -- -- -- --
Percent Solids SW846 2540G 1 30 -- -- -- 31 -- -- -- --
Total Organic Carbon Lloyd Kahn 1 30 -- -- -- 31 -- -- -- --
Dissolved Organic Carbon SM 5310C -- -- -- -- -- -- 9 1 1 11
Notes:AVS = Acid Volatile SulfidePAH = Polycyclic Aromatic HydrocarbonPCB = Polychlorinated BiphenylPPL = Priority Pollutant ListSEM = Simultaneously Extracted MetalsSVOC = Semivolatile Organic CompoundVOC = Volatile Organic Compound
Table 12 Analytical Summary for the Second Round of Phase I Offshore Sampling
Sparrows Point Offshore Investigation
1 Sample number is approximate, and may change based on field observations. Approximately 12 additional samples may be collected from sediment cores, in addition to those indicated, based on field evidence of contamination along the G and H transects. The quantities of quality control samples will be adjusted as needed to maintain a rate of approximately 10 percent.

Table 13 Round 2 Sediment Sampling Locations and Rationale
Transect
Location
Type Rationale
DE DE01 Surface Grab Co-located surface sediment for correlation with pore water
F F03 Vibracore Co-located surface sediment for correlation with pore water
and horizontal and vertical delineation of contaminated sediments north of the G transect. F04 Vibracore
G G01 Vibracore
Horizontal and vertical delineation of contaminated sediments along the G and H transects.
G01.5 Vibracore G02 Vibracore G03 Vibracore G04 Vibracore
(contingency) G05 Vibracore
(contingency) H H01 Vibracore
H02.5 Vibracore H03 Vibracore H04 Vibracore H05 Vibracore
(contingency) H06 Vibracore
(contingency)

Transect Category VOCs PAHs
SVOCs
(w/PAHs)
DEHP
only PCBs Metals Mercury Cyanide
Oil &
Grease SEM/AVS
Percent
Solids TOC
DE non-SW -- 1 -- 1 -- 1 -- 1 -- 1 1 1Total 0 1 0 1 0 1 0 1 0 1 1 1
F SW 6 -- 6 -- 6 6 6 6 6 2 6 6G SW 12 -- 12 -- 12 12 12 12 12 4 12 12H SW 12 -- 12 -- 12 12 12 12 12 4 12 12
Total230 0 30 0 30 30 30 30 30 10 30 30
Notes:SW = sediment transect located adjacent to an active stormwater outfallnon-SW = sediment transect not located adjacent to an active stormwater outfallAVS = Acid Volatile SulfideDEHP = bis(2-ethylhexyl)phthalate (an SVOC)PAH = Polycyclic Aromatic HydrocarbonPCB = Polychlorinated BiphenylSEM = Simultaneously Extracted MetalsSVOC = Semivolatile Organic CompoundTOC = Total Organic CarbonVOC = Volatile Organic Compound
2 Approximately 12 additional samples may be collected (from up to 4 cores from contingency locations), in addition to the 30 indicated, based on field evidence of contamination along the G and H transects.
Table 14 Analytical Program for the Second Round Sediment Sampling by Transect
Sparrows Point Offshore Investigation
Surface Sediment Grab Samples
Sediment Core Samples 1
1 Estimates of sample numbers for cores are approximate and are based on an average core depth of 5-6 ft, yielding an average of 3 samples (each on a 2-ft interval) per core.
30 December 2014
8
ATTACHMENT A
FIELD LOGBOOK


30 December 2014
9
ATTACHMENT B
PHOTOGRAPHIC LOG

Photographic Record Offshore Shallow Sediment Sampling Sparrows Point, MD October 2014
1
Sediment sample from SD-A01
Sediment sample from SD-A03 Sediment sample from SD-B01
Sediment sample from SD-B02, first grab Sediment sample from SD-B02, second grab
Sediment sample from SD-A02
Photographic Record Offshore Shallow Sediment Sampling Sparrows Point, MD October 2014
2
Shoreline near transect C Sediment sample from SD-C01
Sediment sample from SD-C02 Sediment sample from SD-C03
Sediment sample from SD-D01 Sediment sample from SD-D02

Photographic Record Offshore Shallow Sediment Sampling Sparrows Point, MD October 2014
3
Sediment sample from SD-E01
Sediment sample from SD-E01 (zoomed in view) Sediment sample from SD-E02
Sediment sample from SD-F01 Sediment interface from SD-F01
Sediment sample from SD-D02

Photographic Record Offshore Shallow Sediment Sampling Sparrows Point, MD October 2014
4
Sediment interface from SD-F01
Sediment interface from SD-F01
Sediment sample from SD-F02
SD-F02 interface
SD-F02 Interface
Sediment sample from SD-G01

Photographic Record Offshore Shallow Sediment Sampling Sparrows Point, MD October 2014
5
Sediment sample from SD-G01 Sediment sample from SD-G02
Sediment sample from SD-G02 Sediment sample from SD-H01
Sediment sample from SD-H02 Sediment sample from SD-H03

Photographic Record Offshore Shallow Sediment Sampling Sparrows Point, MD October 2014
6
Sample collected in stainless steel pot Homogenized sediment sample in stainless steel pot
Homogenized sediment sample Samples collected for sample location SD-E02
Sampling area with rinsate collection tub Five gallon buckets for collection of extra volume of sediments to be transferred to 55
gallon drums

Photographic Record Offshore Shallow Sediment Sampling Sparrows Point, MD October 2014
7
Rinsate water collection at back of boat Ponar deployment
Ponar deployment

30 December 2014
10
ATTACHMENT C
EPA AND MDE COMMENTS ON THE DRAFT MEMORANDUM

December 5, 2014 Review of Sparrows Point Offshore Investigation Round 1 Sediment Investigation and Plan for Round 2 Investigation Technical Memorandum dated November 25, 2014 Ruth Prince, Toxicologist Land and Chemicals Division EPA Region III Mark Mank, Toxicologist Land Management Administration Maryland Department of the Environment EPA and MDE have reviewed the Offshore Investigation Technical Memorandum, and have the following comments on the Plan for Round 2: First, it is unclear how EA could have formulated plans for additional sediment sampling without screening the initial sediment data. This was, therefore, a deficiency of this Technical Memorandum that the Agencies had to make up for in order to review and comment on the Round 2 locations. Sediment results were initially screened with the BTAG marine sediment screening benchmarks. For final screening, the Probable Effect Concentrations (PECs) were used from Development and Evaluation of Consensus-Based Sediment Quality Guidelines for
Freshwater Ecosystems, MacDonald et al, 2000, Arch. Environ. Contam. Toxicol. 39:20-31. It should be noted that a 1996 MacDonald et al publication for coastal sediment entitled Development and Evaluation of Sediment Quality Guidelines for Florida Coastal Waters is available. While these values (which are similar to the 2000 PECs) may be better suited to estuarine sediment, they are not consensus-based and thus are less widely applicable. Therefore, the 2000 consensus-based PECs were used for final screening. There is no need to revise the Technical Memorandum to demonstrate this screening. Instead, it is recommended that this comment letter be attached to the final Technical Memorandum for documentation purposes. This screening method will be expected in the Offshore Investigation risk assessment. Table 10, Pore Water Sampling Locations and Rationale
The criteria described in this Technical Memorandum for selection of pore water sampling locations includes “locations where sediments were found to be impacted by groundwater COPCs (PAHs, metals, cyanide, bis[2-ethylhexyl]phthalate).” However, there appeared to be no discrimination regarding the particular well contaminant compared to adjacent sediment locations, such that EA proposes to sample all pore water locations for all potential groundwater COPCs. This does not satisfy the goal of this investigation, which is to track contaminants from on-site sources to the offshore environment. In addition, by not screening the sediment results, erroneous statements were made regarding sediment impacts in Table 10.
For proposed pore water locations A02, B01, and C02, there are no groundwater-related
sediment PEC exceedances. The wells in these areas (GL16, GL05, and GL12) only had nickel
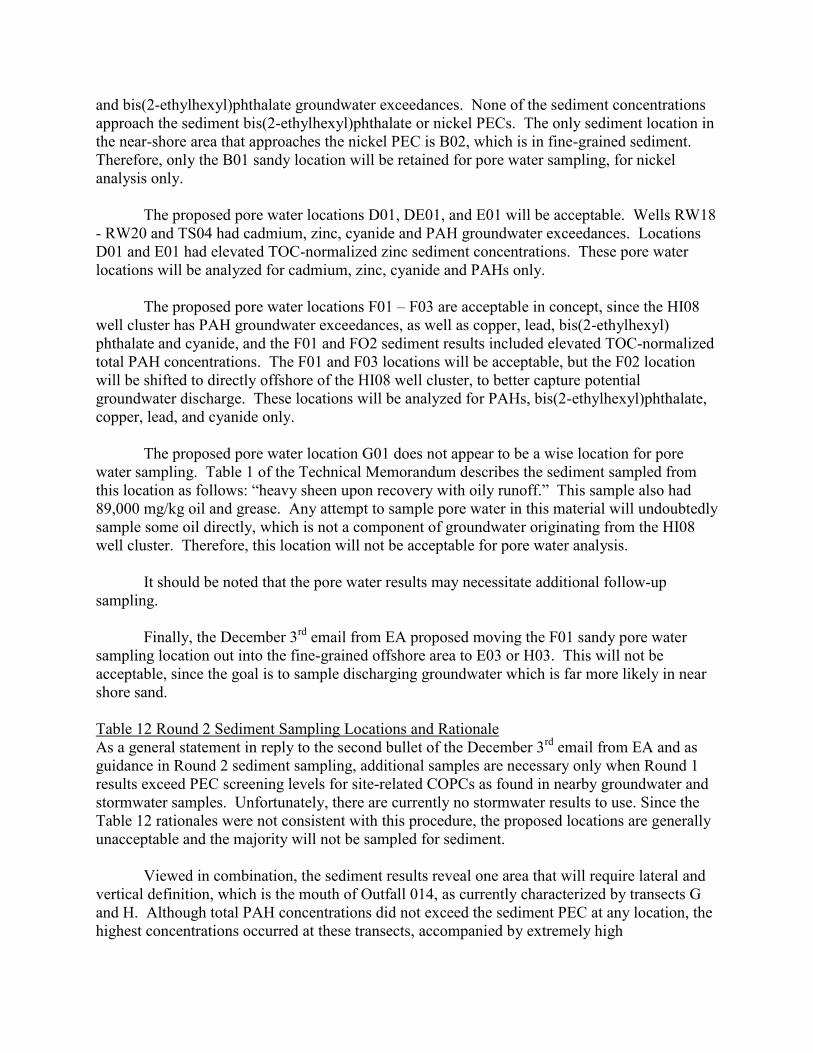
and bis(2-ethylhexyl)phthalate groundwater exceedances. None of the sediment concentrations approach the sediment bis(2-ethylhexyl)phthalate or nickel PECs. The only sediment location in the near-shore area that approaches the nickel PEC is B02, which is in fine-grained sediment. Therefore, only the B01 sandy location will be retained for pore water sampling, for nickel analysis only.
The proposed pore water locations D01, DE01, and E01 will be acceptable. Wells RW18
- RW20 and TS04 had cadmium, zinc, cyanide and PAH groundwater exceedances. Locations D01 and E01 had elevated TOC-normalized zinc sediment concentrations. These pore water locations will be analyzed for cadmium, zinc, cyanide and PAHs only.
The proposed pore water locations F01 – F03 are acceptable in concept, since the HI08
well cluster has PAH groundwater exceedances, as well as copper, lead, bis(2-ethylhexyl) phthalate and cyanide, and the F01 and FO2 sediment results included elevated TOC-normalized total PAH concentrations. The F01 and F03 locations will be acceptable, but the F02 location will be shifted to directly offshore of the HI08 well cluster, to better capture potential groundwater discharge. These locations will be analyzed for PAHs, bis(2-ethylhexyl)phthalate, copper, lead, and cyanide only.
The proposed pore water location G01 does not appear to be a wise location for pore
water sampling. Table 1 of the Technical Memorandum describes the sediment sampled from this location as follows: “heavy sheen upon recovery with oily runoff.” This sample also had 89,000 mg/kg oil and grease. Any attempt to sample pore water in this material will undoubtedly sample some oil directly, which is not a component of groundwater originating from the HI08 well cluster. Therefore, this location will not be acceptable for pore water analysis.
It should be noted that the pore water results may necessitate additional follow-up
sampling. Finally, the December 3rd email from EA proposed moving the F01 sandy pore water
sampling location out into the fine-grained offshore area to E03 or H03. This will not be acceptable, since the goal is to sample discharging groundwater which is far more likely in near shore sand.
Table 12 Round 2 Sediment Sampling Locations and Rationale As a general statement in reply to the second bullet of the December 3rd email from EA and as guidance in Round 2 sediment sampling, additional samples are necessary only when Round 1 results exceed PEC screening levels for site-related COPCs as found in nearby groundwater and stormwater samples. Unfortunately, there are currently no stormwater results to use. Since the Table 12 rationales were not consistent with this procedure, the proposed locations are generally unacceptable and the majority will not be sampled for sediment. Viewed in combination, the sediment results reveal one area that will require lateral and vertical definition, which is the mouth of Outfall 014, as currently characterized by transects G and H. Although total PAH concentrations did not exceed the sediment PEC at any location, the highest concentrations occurred at these transects, accompanied by extremely high

concentrations of oil and grease, up to 11%. All site-related metals (zinc, cadmium, nickel, copper), cyanide, and bis[2-ethylhexyl]phthalate also exceeded sediment PECs on these transects. While chromium is currently not a site-related COPC, since it is not found in any perimeter wells, the highest chromium sediment concentrations also occurred at transects G and H, possibly representing historical Outfall 014 discharge. The defining characteristic of this area is the very elevated oil and grease, and so oil and grease will also be used as the bounding analyte for lateral and vertical extent. Round 2 sediment samples for this area will include oil and grease, PAHs, bis(2-ethylhexyl)phthalate, metals, and cyanide. Tables 10 – 12 and Figure 11 should be revised according to the comments above. For Round 2 sediment sampling, Figure 11 should only show the additional sediment sample locations necessary to fill in the Outfall 014 mouth currently characterized by the G and H transects. It is also recommended that the actual field sampling include visual assessment of each sample for oil and grease presence, to be used for both lateral and vertical characterization. This method will reduce, if not eliminate, the need for another round of sediment sampling following Round 2.

Sparrows Point Offshore Investigation Round 1 Sediment Investigation and Plan for Round 2 Investigation: Re-screening based on EA comments emailed 12/9/14 December 12, 2014 Ruth Prince, Toxicologist Land and Chemicals Division EPA Region III Mark Mank, Toxicologist Land Management Administration Maryland Department of the Environment This review is in response to the 12/9/14 email from Samantha Saalfield, EA to Ruth Prince, EPA, in which Samantha re-screened the groundwater and sediment data following the process we briefly outlined. She was correct in assuming we originally only considered the groundwater results that exceeded screening criteria by at least 10-fold. This is a common practice to take into account the attenuation and dilution that occurs as groundwater travels through substrate prior to potential discharge to surface waters. Samantha’s re-screening took into account all groundwater exceedances since 2009. In order to apply a more conservative approach, we re-screened the groundwater results at a five-fold factor to take into account attenuation and dilution. Additional screening considerations included excluding prior exceedances if not detected from 2010 – 2014. However, prior exceedances were taken into account if there were no analyses for those chemicals from 2010 – 2014. Also, there were a few instances of including groundwater chemicals that did not exceed screening criteria by five-fold, yet were consistently detected greater than two-fold screening criteria in every sampling event. Sediment PEC exceedances were only identified if the chemical was screened in from nearby groundwater, and if the PEC exceedance was at least two-fold. Samantha included a screening summary table documenting her re-screening in the 12/9/14 email. Footnotes to this table brought up the following issues. It was noted that there are no sediment PECs for cyanide or DEHP. For cyanide, the only available value is the freshwater sediment BTAG value of 0.1 mg/kg, which is used with great uncertainty. For DEHP, the 1996 MacDonald et al coastal sediment quality guideline reference provides a PEC of 2,647 ug/kg. PAHs were identified as sediment PEC exceedances because it was noted that “at least one PAH exceeded the HHRA screening criteria presented in Appendix E of the Work Plan.” However, the only PAHs detected in any well were benzo(a)anthracene, chrysene, and naphthalene. No transect D, E or F sediment concentration for these chemicals exceeded the HHRA screening values in Appendix E. Below are EPA and MDE’s re-screening results compared to Samantha’s results.

Screening Summary Table
Sediment
Sample/Associated
Wells
Groundwater
COPC
Not a Groundwater
COPC
Sediment PEC
Exceedance
A01-A03 GL16, GL02, TS01
copper, DEHP, nickel, zinc
cyanide, lead, silver, thallium
zinc
B01-B02 GL05, GL15
chromium, copper, DEHP, nickel, zinc
arsenic, lead, silver chromium, zinc
C01-C03 GL12
DEHP, mercury, zinc copper, nickel, silver zinc
D01-D02, E01-E03 RW18-20, TS04
cadmium, copper, cyanide, DEHP, lead,
nickel, PAHs, zinc
arsenic zinc
F01-F02 HI08
copper, cyanide, DEHP, lead, PAHs
chromium, nickel, zinc
----
Based on this re-screening, below is a correction to the Porewater Analytical Summary table included in the 12/9/14 email. Note we prefer the sample label F04 instead of FG01 for the new transect F porewater sample location directly offshore of well HI08.
Porewater Analytical Summary
Location Cd Cr Cu CN DEHP Hg Pb Ni PAHs Zn A01 1 1 1 1 B01 1 1 1 1 1 C01 1 1 1 D01 1 1 1 1 1 1 1 1
DE01 1 1 1 1 1 1 1 1 E01 1 1 1 1 1 1 1 1 F01 1 1 1 1 1 F03 1 1 1 1 1 F04 1 1 1 1 1
Total 3 1 8 6 9 1 6 5 6 6
Please incorporate this information into the revised Technical Memorandum for Round 2 sampling. The Round 2 sediment sampling will not include follow-up to the PEC exceedances shown in the revised Screening Summary Table above. Rather, follow-up sampling for those locations are dependent upon the pore water results. Finally, EPA and MDE would like to point out that pore water results are often not straight forward. The in situ water quality measurements in Section 5.5.1 of the Work Plan for the Offshore Investigation must show a distinct difference between the pore water samples and surface water samples to demonstrate that discharging groundwater is actually being sampled. Otherwise, it will be assumed that the sample represents surface water.
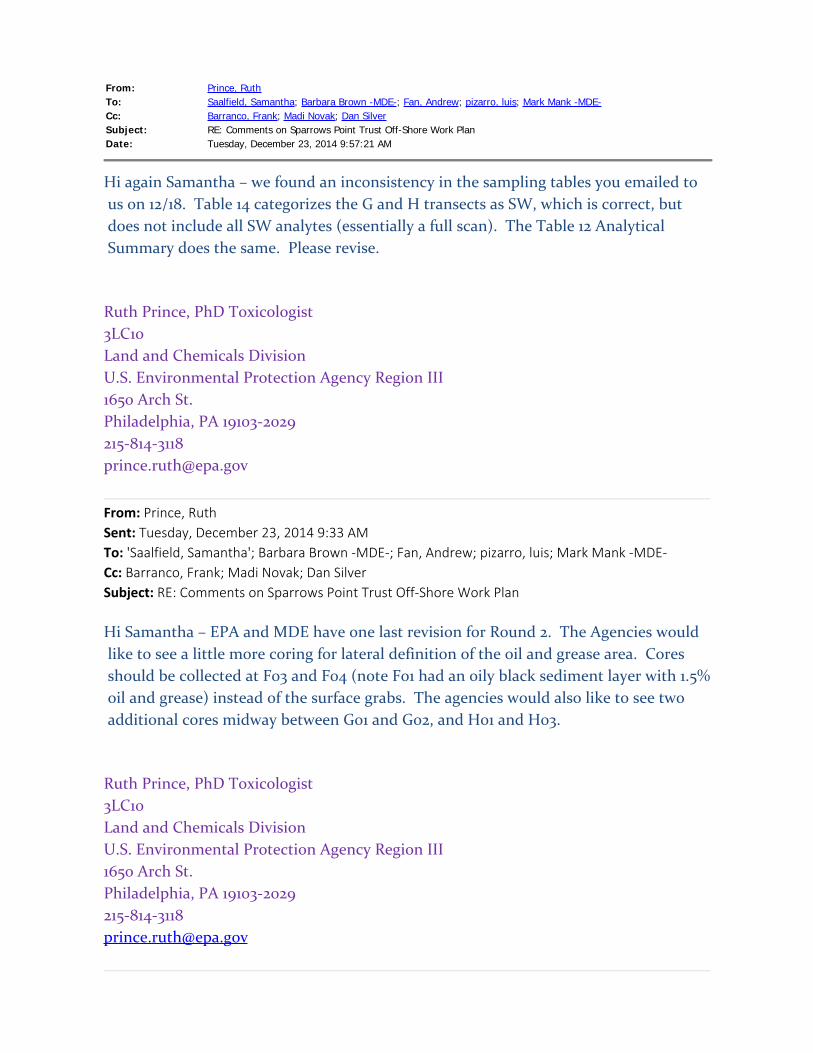
From: Prince, RuthTo: Saalfield, Samantha; Barbara Brown -MDE-; Fan, Andrew; pizarro, luis; Mark Mank -MDE-Cc: Barranco, Frank; Madi Novak; Dan SilverSubject: RE: Comments on Sparrows Point Trust Off-Shore Work PlanDate: Tuesday, December 23, 2014 9:57:21 AM
Hi again Samantha – we found an inconsistency in the sampling tables you emailed to us on 12/18. Table 14 categorizes the G and H transects as SW, which is correct, but does not include all SW analytes (essentially a full scan). The Table 12 Analytical Summary does the same. Please revise. Ruth Prince, PhD Toxicologist3LC10Land and Chemicals DivisionU.S. Environmental Protection Agency Region III1650 Arch St.Philadelphia, PA [email protected] From: Prince, Ruth Sent: Tuesday, December 23, 2014 9:33 AMTo: 'Saalfield, Samantha'; Barbara Brown -MDE-; Fan, Andrew; pizarro, luis; Mark Mank -MDE-Cc: Barranco, Frank; Madi Novak; Dan SilverSubject: RE: Comments on Sparrows Point Trust Off-Shore Work Plan Hi Samantha – EPA and MDE have one last revision for Round 2. The Agencies would like to see a little more coring for lateral definition of the oil and grease area. Cores should be collected at F03 and F04 (note Fo1 had an oily black sediment layer with 1.5% oil and grease) instead of the surface grabs. The agencies would also like to see two additional cores midway between G01 and G02, and H01 and H03. Ruth Prince, PhD Toxicologist3LC10Land and Chemicals DivisionU.S. Environmental Protection Agency Region III1650 Arch St.Philadelphia, PA [email protected]
From: Saalfield, Samantha [mailto:[email protected]] Sent: Friday, December 19, 2014 11:59 AMTo: Prince, Ruth; Barbara Brown -MDE-; Fan, Andrew; pizarro, luis; Mark Mank -MDE-Cc: Barranco, Frank; Madi Novak; Dan SilverSubject: RE: Comments on Sparrows Point Trust Off-Shore Work Plan Thank you for sending the preliminary comments, Ruth. The equipment that EA has available is typically only capable of advancing cores to 5-6 ft. In order to achieve a greater depth of coring, we would likely need to obtain a larger boat or barge with a larger vibracorer. This could be done if the findings of the Data Gaps Report indicate that the initial characterization with our equipment does not fully delineate the contamination. We will plan to deliver the revised Technical Memorandum by next Tuesday if possible. thanks,Samantha
From: Prince, Ruth [mailto:[email protected]] Sent: Friday, December 19, 2014 11:53 AMTo: Saalfield, Samantha; Barbara Brown -MDE-; Fan, Andrew; pizarro, luis; Mark Mank -MDE-Cc: Barranco, Frank; Madi Novak; Dan SilverSubject: RE: Comments on Sparrows Point Trust Off-Shore Work Plan Samantha – one more preliminary comment – EA is proposing a vertical depth of 5-6 ft for the transect G and H characterization. Should we consider having a contingency to extend to a greater depth if visual assessment continues to show obvious oil and grease at 5-6 ft? Ruth Prince, PhD Toxicologist3LC10Land and Chemicals DivisionU.S. Environmental Protection Agency Region III1650 Arch St.Philadelphia, PA [email protected] From: Saalfield, Samantha [mailto:[email protected]] Sent: Thursday, December 18, 2014 10:54 AMTo: Prince, Ruth; Barbara Brown -MDE-; Fan, Andrew; pizarro, luis; Mark Mank -MDE-; Horacio Tablada -MDE-Cc: Barranco, Frank; Madi Novak; Dan SilverSubject: RE: Comments on Sparrows Point Trust Off-Shore Work Plan

Hello all - Attached are the revised sampling tables for pore water and sediment, based on EPA and MDE comments and clarifications received on the draft memo. A figure illustrating the sampling locations is also attached. The pore water and co-located surface sediment sampling locations are as discussed in previous communications. The proposed approach for the subsurface sediment investigation is discussed below. As shown in the tables, we propose that up to 10 sediment cores be collected from the area of the G and H transects, where high concentrations of oil and grease (up to 11%), observable sheen and petroleum odor, and metals concentrations exceeding sediment PECs were reported in surface sediment. Although the Work Plan indicated that sediment cores, if required, would be collected using manual push cores to a depth of approximately 2 ft, the Round 1 data indicate that deeper delineation is likely necessary to define the extent of contamination in the targeted area. An electric vibracorer will be deployed from a 28-ft aluminum-hull survey and research vessel and used to advance cores to a penetration depth of 5 to 6 feet below the sediment-water interface or refusal. Cores will be split, described and photographed, and sediment sub-samples will be generated based on 2-foot intervals below the sediment-water interface (0-2 ft, 2-4 ft, 4-6 ft, etc.). Each interval will be homogenized using decontaminated stainless steel mixing equipment and transferred to pre-cleaned jars for analytical testing. Cores from locations G01, G02, H01, and H03 will be collected and sampled first, followed by cores from locations G03 and H04. If no contamination (sheen or petroleum odor) is apparent in cores G03 and H04 (at the edge of the subaqueous survey area), then these cores will also be sampled for laboratory analyses as described above, and no more cores will be collected. The absence of contamination at these locations will be interpreted as the western limit of oil and grease impacts. However, if contamination is apparent in these cores, they will be logged, described, and retained but not sampled, and cores will be advanced at step-out locations G04 and H05. If no contamination (obvious sheen or petroleum odor) is apparent in these cores, then these cores will also be sampled at the described intervals, and no additional step-out cores will be collected. If contamination is apparent in cores from G04 and H05, these cores will be logged, described, and retained but not sampled, and step-out cores will be advanced at locations G05 and H06. If these step-out locations are advanced, the cores from G05 and H06 will be sampled on the intervals described above, regardless of the presence or absence of contamination. Thus, up to ten cores may be collected, but only six cores will be sampled for laboratory analyses. Because oil and grease impacts are readily apparent, field observations will be used to delineate impacts in the absence of analytical data. For planning purposes, it is assumed that an average of three samples will be collected from each core. Note that the contingency step-out locations (G04, G05, H05, H06) would extend the delineation to approximately 2,000 offshore from the Phase I area. If this coring effort does not achieve delineation, EA would need to discuss further expansion of the investigation area and/or whether use of a barge with larger vibracorer to obtain deeper cores. Additionally, we targeted the coring

locations on the G and H transects, as requested in the EPA and MDE comments on the draft memo. However, petroleum odor was noted during sampling of location E03 (the only other fine-grained sediment location sampled in the southern area during Round 1). Based on this, it is possible that the oil and grease contamination extends north toward the Key Bridge. Please let us know if the plans for pore water and co-located surface sediment grab samples (as discussed previously) are acceptable, and whether you would recommend any revisions to the proposed approach to sediment coring. We are planning to begin sampling as soon as December 27, so are hoping to have by then an approved sampling approach as well as CBF feedback on where they require samples. thank you,Samantha
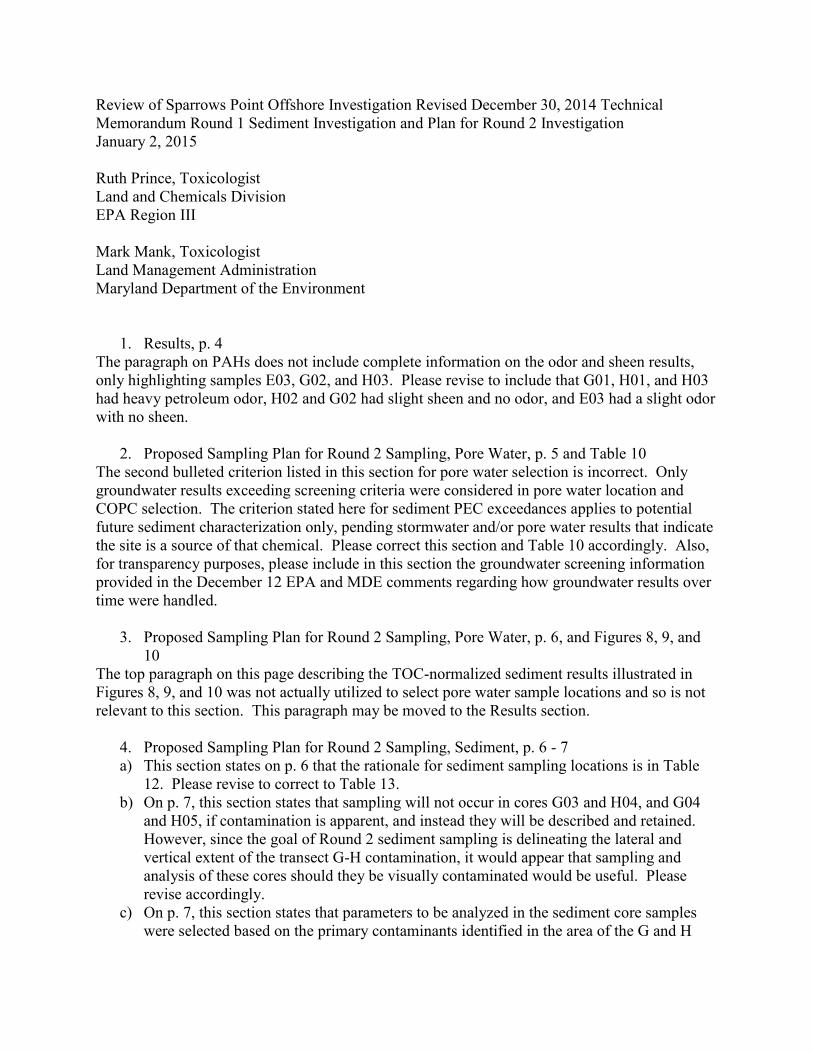
Review of Sparrows Point Offshore Investigation Revised December 30, 2014 Technical Memorandum Round 1 Sediment Investigation and Plan for Round 2 Investigation January 2, 2015 Ruth Prince, Toxicologist Land and Chemicals Division EPA Region III Mark Mank, Toxicologist Land Management Administration Maryland Department of the Environment
1. Results, p. 4 The paragraph on PAHs does not include complete information on the odor and sheen results, only highlighting samples E03, G02, and H03. Please revise to include that G01, H01, and H03 had heavy petroleum odor, H02 and G02 had slight sheen and no odor, and E03 had a slight odor with no sheen.
2. Proposed Sampling Plan for Round 2 Sampling, Pore Water, p. 5 and Table 10 The second bulleted criterion listed in this section for pore water selection is incorrect. Only groundwater results exceeding screening criteria were considered in pore water location and COPC selection. The criterion stated here for sediment PEC exceedances applies to potential future sediment characterization only, pending stormwater and/or pore water results that indicate the site is a source of that chemical. Please correct this section and Table 10 accordingly. Also, for transparency purposes, please include in this section the groundwater screening information provided in the December 12 EPA and MDE comments regarding how groundwater results over time were handled.
3. Proposed Sampling Plan for Round 2 Sampling, Pore Water, p. 6, and Figures 8, 9, and 10
The top paragraph on this page describing the TOC-normalized sediment results illustrated in Figures 8, 9, and 10 was not actually utilized to select pore water sample locations and so is not relevant to this section. This paragraph may be moved to the Results section.
4. Proposed Sampling Plan for Round 2 Sampling, Sediment, p. 6 - 7 a) This section states on p. 6 that the rationale for sediment sampling locations is in Table
12. Please revise to correct to Table 13. b) On p. 7, this section states that sampling will not occur in cores G03 and H04, and G04
and H05, if contamination is apparent, and instead they will be described and retained. However, since the goal of Round 2 sediment sampling is delineating the lateral and vertical extent of the transect G-H contamination, it would appear that sampling and analysis of these cores should they be visually contaminated would be useful. Please revise accordingly.
c) On p. 7, this section states that parameters to be analyzed in the sediment core samples were selected based on the primary contaminants identified in the area of the G and H

transects in Round 1. Please revise to add that parameters were also selected based upon potential historical Tin Mill Canal releases.
5. All Site Figures
The site figures all label the Tin Mill Canal as Humphrey’s Creek. Please revise to correctly label the Tin Mill Canal.

From: Prince, RuthTo: Saalfield, Samantha; Barranco, Frank; Barbara Brown -MDE-; Fan, Andrew; pizarro, luis; Mark Mank -MDE-Cc: Madi Novak; Dan Silver; Morris, John; Corum, SanitaSubject: RE: Comments on Sparrows Point Trust Off-Shore Work PlanDate: Tuesday, January 13, 2015 10:20:23 AM
Hi Samantha – I think I may be over-thinking at this point, and we haven’t establishedany action levels. See my strikethrough below, let’s just leave it that for cores with noobservable impacts, only the surface interval and the interval directly below that willbe analyzed. Please go ahead and send the revised memo. Ruth Prince, PhD Toxicologist3LC10Land and Chemicals DivisionU.S. Environmental Protection Agency Region III1650 Arch St.Philadelphia, PA [email protected] From: Saalfield, Samantha [mailto:[email protected]] Sent: Tuesday, January 13, 2015 10:02 AMTo: Prince, Ruth; Barranco, Frank; Barbara Brown -MDE-; Fan, Andrew; pizarro, luis; Mark Mank -MDE-Cc: Madi Novak; Dan Silver; Morris, John; Corum, SanitaSubject: RE: Comments on Sparrows Point Trust Off-Shore Work Plan
Ruth – Thank you for your reply. The revised language below reflects your requested change. It may alsobe worth creating a flow chart to convey the various analytical scenarios. Samantha An electric vibracorer will be deployed from a 28-ft aluminum-hull survey and researchvessel and used to advance cores to a penetration depth of 5 to 6 feet below the sediment-water interface or refusal. Upon recovery, the cores will be held at 4°C, transferred to aprocessing facility, then split, described and photographed. Any observable impacts (sheenand/or odor) will be assessed and recorded. Generally, sediment sub-samples will begenerated based on 2-foot intervals below the sediment-water interface (0-2 ft, 2-4 ft, 4-6 ft,etc.). A surface interval sample from every core will be submitted for analysis. If a core hasno observable impacts, then the next deeper interval (2-4 ft) will also be submitted for

analysis, and the lower intervals will be submitted to the laboratory for possible contingencyanalysis. If the 2-4 ft interval is found through laboratory analyses to contain one or morecontaminants at concentrations exceeding action levels, then the lower intervals will also beanalyzed; if laboratory analyses indicate that the 2-4 ft interval does not exceed action levels,then the bottom intervals will not be analyzed. (Note that under a scenario in which thebottom intervals are analyzed on a timeframe that exceeds holding times for one or moreanalyses, affected analyses will not be performed. This is not expected to affect Oil andGrease, which has a 28 day holding time.) Alternatively, if multiple intervals in the middleand bottom portions of a core contain observable impacts, then only the lowest of theimpacted intervals, and any un-impacted intervals below the lowest impacted interval, will besampled for laboratory analysis. Each interval will be homogenized using decontaminatedstainless steel mixing equipment and transferred to pre-cleaned, 8 ounce jars for analyticaltesting.
From: Prince, Ruth [mailto:[email protected]]Sent: Tuesday, January 13, 2015 9:01 AMTo: Saalfield, Samantha; Barranco, Frank; Barbara Brown -MDE-; Fan, Andrew; pizarro, luis; Mark Mank-MDE-Cc: Madi Novak; Dan Silver; Morris, John; Corum, SanitaSubject: RE: Comments on Sparrows Point Trust Off-Shore Work Plan
Hi Samantha – the new text below includes “Additionally, if a core has no observableimpacts, all intervals will be submitted for analysis.” Analyzing the potential threeintervals for bounding purposes does not seem necessary. Instead, the surface intervaland interval directly below that should first be analyzed for delineation purposes. Thelowest interval can be retained for potential analysis should unexpectedcontamination be found in the lower interval. Ruth Prince, PhD Toxicologist3LC10Land and Chemicals DivisionU.S. Environmental Protection Agency Region III1650 Arch St.Philadelphia, PA [email protected] From: Saalfield, Samantha [mailto:[email protected]] Sent: Friday, January 09, 2015 2:56 PMTo: Prince, Ruth; Barranco, Frank; Barbara Brown -MDE-; Fan, Andrew; pizarro, luis; Mark Mank -MDE-Cc: Madi Novak; Dan Silver; Morris, John; Corum, SanitaSubject: RE: Comments on Sparrows Point Trust Off-Shore Work Plan

Ruth –
We have revised the description of sediment core sampling in the memo, in accordance withyour comments. The revised text is below. Highlighted portions were added or substantiallychanged.
Please let us know if this revised text is acceptable, and we will issue the revised memo.
thank you,Samantha
Revised text:
An electric vibracorer will be deployed from a 28-ft aluminum-hull survey and researchvessel and used to advance cores to a penetration depth of 5 to 6 feet below the sediment-water interface or refusal. Upon recovery, the cores will be held at 4°C, transferred to aprocessing facility, then split, described and photographed. Any observable impacts (sheenand/or odor) will be assessed and recorded. Generally, sediment sub-samples will begenerated based on 2-foot intervals below the sediment-water interface (0-2 ft, 2-4 ft, 4-6 ft,etc.). A surface interval sample from every core will be submitted for analysis. Additionally,if a core has no observable impacts, all intervals will be submitted for analysis. However, ifthere are multiple impacted intervals in the middle and bottom portions of a core, then onlythe lowest of the impacted intervals, and any un-impacted intervals below the lowestimpacted interval, will be sampled for laboratory analysis. Each interval will behomogenized using decontaminated stainless steel mixing equipment and transferred to pre-cleaned, 8 ounce jars for analytical testing.
Cores from locations F03, F04, G01, G01.5, G02, H01, H02.5, and H03 will be collected andsampled first, followed by cores from locations G03 and H04. If no contamination (sheen orpetroleum odor) is apparent in cores G03 and H04 (at the edge of the subaqueous surveyarea), then no more cores will be collected. However, if contamination is apparent in thesecores, cores will be advanced at locations G04 and H05, and these cores will be sampled asdescribed above. If no contamination (obvious sheen or petroleum odor) is apparent in thesecores, then no more cores will be collected. If contamination is apparent in cores from G04and H05, then cores will be advanced at locations G05 and H06, and all four of these coreswill be sampled as described above. Thus, up to 14 cores may be collected and sampled. Forplanning purposes, it is assumed that an average of three samples will be collected from eachcore; however, as described above, fewer samples may be required if contamination isobserved in multiple intervals in the cores.
From: Prince, Ruth [mailto:[email protected]]Sent: Wednesday, January 07, 2015 2:14 PMTo: Saalfield, Samantha; Barranco, Frank; Barbara Brown -MDE-; Fan, Andrew; pizarro, luis; Mark Mank-MDE-Cc: Madi Novak; Dan Silver; Morris, John; Corum, SanitaSubject: RE: Comments on Sparrows Point Trust Off-Shore Work Plan
Hi Samantha – the responses are acceptable excepting of course 4(b).

We would still like the surface interval only analyzed for those potential interimcontaminated core locations. It also does not seem necessary to assume that everycore will require three intervals for analyses. For delineation purposes, if the middleinterval of the core has observable sheen/odor, then analysis of that interval does notreally provide any necessary information, since the lowest interval would then beanalyzed for vertical delineation. Analysis of mid-core contamination would notprovide us information necessary for either risk assessment or vertical delineation, sowe recommend elimination of those proposed analyses. Ruth Prince, PhD Toxicologist3LC10Land and Chemicals DivisionU.S. Environmental Protection Agency Region III1650 Arch St.Philadelphia, PA [email protected] From: Saalfield, Samantha [mailto:[email protected]] Sent: Wednesday, January 07, 2015 12:59 PMTo: Prince, Ruth; Barranco, Frank; Barbara Brown -MDE-; Fan, Andrew; pizarro, luis; Mark Mank -MDE-Cc: Madi Novak; Dan Silver; Morris, John; Corum, SanitaSubject: RE: Comments on Sparrows Point Trust Off-Shore Work Plan
Below are our responses to the EPA and MDE comments provided last Friday. If you can providefeedback this week, that would be much appreciated. When we have concurrence, we will issueanother revised version of the memo. thank you,Samantha Responses to EPA and MDE Comments Provided on 2 January 2015
1. The referenced paragraph has been revised as requested, to reflect all reported occurrencesof sheen and/or odor in the Round 1 sediment samples.
2. The second bulleted criterion listed for the selection of pore water sampling locations hasbeen removed, and references to sediment results have been removed from Table 10. Texthas been added to the first bulleted criterion, regarding how groundwater results over timewere handled in the screening.
3. The paragraph regarding TOC-normalized sediment results has been moved to the Results
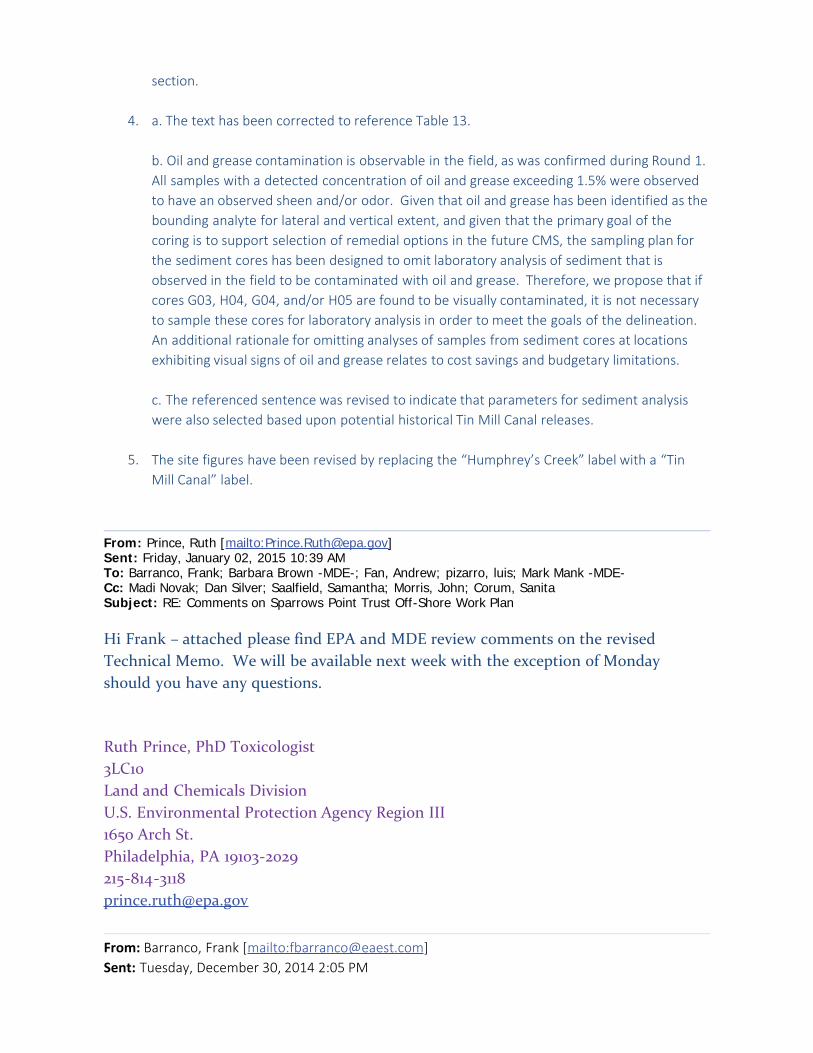
section.
4. a. The text has been corrected to reference Table 13. b. Oil and grease contamination is observable in the field, as was confirmed during Round 1. All samples with a detected concentration of oil and grease exceeding 1.5% were observedto have an observed sheen and/or odor. Given that oil and grease has been identified as thebounding analyte for lateral and vertical extent, and given that the primary goal of thecoring is to support selection of remedial options in the future CMS, the sampling plan forthe sediment cores has been designed to omit laboratory analysis of sediment that isobserved in the field to be contaminated with oil and grease. Therefore, we propose that ifcores G03, H04, G04, and/or H05 are found to be visually contaminated, it is not necessaryto sample these cores for laboratory analysis in order to meet the goals of the delineation.An additional rationale for omitting analyses of samples from sediment cores at locationsexhibiting visual signs of oil and grease relates to cost savings and budgetary limitations. c. The referenced sentence was revised to indicate that parameters for sediment analysiswere also selected based upon potential historical Tin Mill Canal releases.
5. The site figures have been revised by replacing the “Humphrey’s Creek” label with a “Tin
Mill Canal” label.
From: Prince, Ruth [mailto:[email protected]]Sent: Friday, January 02, 2015 10:39 AMTo: Barranco, Frank; Barbara Brown -MDE-; Fan, Andrew; pizarro, luis; Mark Mank -MDE-Cc: Madi Novak; Dan Silver; Saalfield, Samantha; Morris, John; Corum, SanitaSubject: RE: Comments on Sparrows Point Trust Off-Shore Work Plan
Hi Frank – attached please find EPA and MDE review comments on the revisedTechnical Memo. We will be available next week with the exception of Mondayshould you have any questions. Ruth Prince, PhD Toxicologist3LC10Land and Chemicals DivisionU.S. Environmental Protection Agency Region III1650 Arch St.Philadelphia, PA [email protected] From: Barranco, Frank [mailto:[email protected]] Sent: Tuesday, December 30, 2014 2:05 PM

1
Saalfield, Samantha
From: Barbara Brown -MDE- <[email protected]>Sent: Wednesday, January 14, 2015 2:46 PMTo: Saalfield, SamanthaCc: Prince, Ruth; Barranco, Frank; Fan, Andrew; pizarro, luis; Mark Mank -MDE-; Madi
Novak; Dan Silver; Morris, John; Corum, SanitaSubject: Re: Comments on Sparrows Point Trust Off-Shore Work Plan
Hello Samantha EPA and MDE have reviewed the Jan 13 revised work plan and it is approved with the following revisions:
1. Pg. 4, Results – Please delete the last sentence in the PAH paragraph regarding the correlation of high PAH concentrations with oil and grease concentrations exceeding 80,000 mg/kg. A review of the PAH results shows that those “high” concentrations are actually a broad range ‐ 2,400 to 14,330 ug/kg – the lower end of which also occurs with low concentrations of oil and grease.
2. Pg. 5, Results – Please revise Humphrey’s Creek in the last paragraph to Tin Mill Canal.
Please provide a final version with the corrections both electronically and in hard copy to the Agencies.
Once MDE receives the final version we will provide to CBF for them to determine in a reasonable period of time if they wish to split soil or pore water samples.
If you have any questions please contact either Andrew Fan, EPA region III or myself
Regards
Barbara Brown
MDE Project Coordinator
On Tue, Jan 13, 2015 at 1:50 PM, Saalfield, Samantha <[email protected]> wrote:
Thank you, Ruth.
Attached is the revised memo, reflecting all revisions required based on EPA and MDE comments.