Embed Size (px)
Citation preview
Technical Assistance Consultant’s Report
This consultant’s report does not necessarily reflect the views of ADB or the Government concerned, and ADB and the Government cannot be held liable for its contents.
Project Number: 48323-001 January 2018
Republic of Indonesia: Sustainable and Inclusive Energy Program (Financed by the Agence Française de Développement and the
Technical Assistance Special Fund)
Appendix J: Electricity Access Plan for Papua, Papua Barat, Maluku and Maluku Utara
Prepared by Castlerock Consulting, Indonesia in association with Economic Consulting Associates Ltd, United Kingdom and PT. Q Energy South East Asia, Indonesia
For Coordinating Ministry for Economic Affairs Ministry of Energy and Mineral Resources Ministry of Finance Perusahaan Listrik Negara

2
Electrification Plan for Papua and Papua Barat Presentation to PLN
23 October 2017
Elements of an electrification paradigm

4
1. Accuracy
2. Timeliness
3. Coverage
4. Granularity
5. Optimality (least-cost)
6. Funding requirements
3
1. To determine the least-cost means to achieve regional electrification targets by considering three technologies
– Grid extension
– PV mini-grids (conservative case: micro-hydro would be more cost
effective)
– Individual household PV systems (solar home systems, SHS)
2. To determine the amount of capital investment and operating costs required
– By technology
– By administrative unit
3. To identify for each settlement the least cost means to serve that settlement
4. To provide a detailed geospatial baseline of recent household and facility locations that can be used later by PLN, government and small-scale suppliers a basis for implementation planning, e.g. identification of wilayah usaha under Permen ESDM 38/2016.
What do we need from an electrification plan?
What infrastru ture…
…should be built where…
….and how much it will cost
Objectives

6
• Hydro is site specific (but less costly if available)
• Less costly than diesel
2.50
2.00
1.50
1.00
0.50
0.00 0 100 200 300 400 500
Number of Households in Settlement Served
5
Rooftop tagging
Settlement delineation
Identification of existing
assets
Unit
Costing & Demand
Forecasting
Optimiza-
tion
Least-cost electrification
plan
• Carried out with PLN for provinces of Papua and West Papua
– Approx. 459,000 km2 (bigger than California, smaller than Spain)
– Approx. 4.3 million inhabitants
• Supported by ADB and AFD
• 8 months to carry out
Why PV mini-grids?
The planning methodology
No
min
al
LCO
E,
USD
/kW
h
PV (Low) PV (High) Diesel USD 0.70/li Diesel USD 1.40/li Diesel USD 2.80/li

1. Rooftop Tagging
8
• Manual identification of households
• Machine learning also possible
• Issues – Low resolution
– Cloud cover
– Old imagery
• Three imagery sources – Google Earth
– Bing Maps
– HERE Maps
• Low resolution data can be augmented by cartometric inference
7
Rooftop tagging results
• PLN service territory
– 675,000 HH tags vs. 738,000 HH
listed (< 10% variance)
Approximately 5% of listed HH
located in areas with poor image
quality
• Kabupaten service territory (Papua province only) 80,000 HH tags vs. 212,000 listed HH
Approximately 53% of listed HH located in areas with poorimage quality
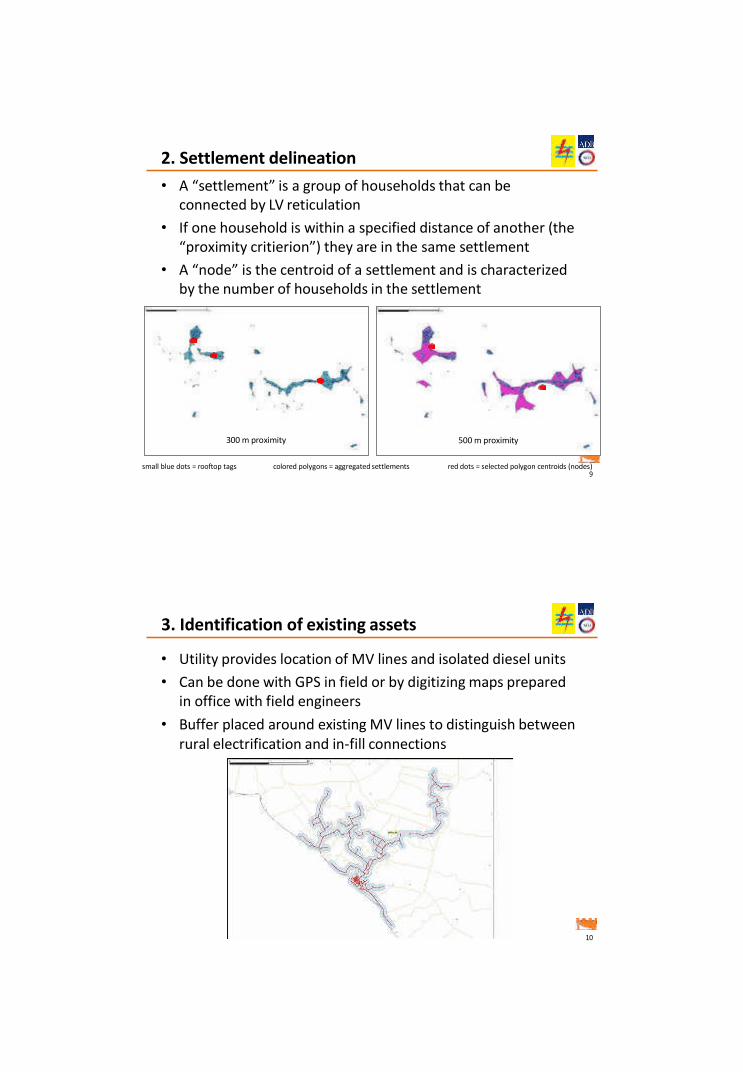
2. Settlement delineation
• A settle ent is a group of households that can be
connected by LV reticulation
• If one household is within a specified distance of another (the
pro i ity critierion ) they are in the same settlement
• A node is the centroid of a settlement and is characterized
by the number of households in the settlement
small blue dots = rooftop tags colored polygons = aggregated settlements red dots = selected polygon centroids (nodes) 9
• Utility provides location of MV lines and isolated diesel units
• Can be done with GPS in field or by digitizing maps prepared
in office with field engineers
• Buffer placed around existing MV lines to distinguish between
rural electrification and in-fill connections
10
300 m proximity
500 m proximity
3. Identification of existing assets

4. Unit costing & demand forecasting
• Compile unit costs and performance of candidate
technologies
– Grid extension
– PV mini-grids (other mini-grid technologies could be defined)
– Solar home systems
• Define settlement demand model
– Settlement population
– Economic growth
– Population growth
– Based on power sales on existing mini-grids: sales vs. number of
consumers
– Other social and commercial infrastructure can be explicitly modeled
11
• Apply Network Planner
– Developed by The Earth Institute at Columbia University
(http://networkplanner.modilabs.org/)
– Enter nodes, technology costs and performance, demand model,
financial parameters
– Applies Kruskal’s algorithm to determine minimum spanning tree and
determines least-cost technology for each node
• An economic, not engineering, model
12
5. Optimization

14
Results – technology by settlement
Assumes 90-96%
electrification
ratio depending on region
Number of
HH
Number of
settlements
(nodes)
Initial capital
cost (USD)
Present value
of recurring
costs (USD)
SHS systems
17,098
5,957
$5,430,361
$12,425,053
PV mini-grids
53,799
1,147
$110,689,664
$104,564,585
Grid extension (connected
to existing grid)
128,189
541
$185,569,034
$183,772,778
Grid extension (new – not
connected to existing grid)
47,095 347
$69,081,704
$65,410,590 (81 systems)
Within existing grid buffer
428,440
473
n/a
n/a
Grid extension
New isolated grid
Existing 20 kV grid 2,589 kms
Future 20 kV grid 1,583 kms (straight line distances)
Existing Grid in buffer connected (473 nodes)
Future Grid 888 nodes ( 541 grid extension nodes + 347
isolated MV grid nodes)
Future mini-grid 1,147 nodes
Future off grid (SHS/SEHEN) 2,004 nodes
Future Individual building (SHS/SEHEN) 3,953 nodes
Excludes
service areas
13
Results – program costs

16
Conclusions
• Grid extension is least cost for more than half of households without electricity
• Nonetheless a large number of PV mini-grids are identified – Average size of 16 kWp serving 47 households – More than half 10 kWp or less, serving 15 to 32 households – Largest is 266 kWp serving 477 households
• Solar home systems play smallest role – only about 7% of unelectrified households
• USD 371 million of investment is required – Of which USD 249 million is for grid extension
• Present value of operation costs is as high as capex
• Enabling mechanisms are required
• Results must be combined with local knowledge and field studies – confir atory studies – These results can serve as guide for planning teams going to field
• Additional studies are needed to ensure adequate generation and transmission
15
• Report review and finalization
– Status of Maluku work
• Creation of website
• What data to be made available?
• Co-branding with PLN
Discussion Items

Least‐Cost Ele trifi atio Pla for Papua, Papua Barat, Maluku a d Maluku Utara
Draft Fi al Report De e er 7
ADB TA 8826-INO: Sustainable and Inclusive Energy Program

ADB TA 8826-INO: Sustainable and Inclusive Energy Program
Least-Cost Electrification Plan for Papua, Papua Barat, Maluku and Maluku Utara
Final Report
31 December 2017
Prepared for: Prepared by:
The Government of Indonesia and Asian Development Bank PT. Castlerock Consulting
Castlerock Consulting Graha Iskandarsyah, 7th floor
Jl. Iskandarsyah Raya No. 66C Jakarta 12160
Indonesia Tel: +62 21 270 2404
Fax: +62 21 270 2405 www.castlerockasia.com
Version: 2.0
Cover photo: PV mini-grid in Sentani, Papua. Photo courtesy of Electric Vine Industries.

i
Least-Cost Electrification Plan for Papua, Papua Barat, Maluku and Maluku Utara – December 2017
FOREWORD
This report has been prepared by Castlerock Consulting for the Government of Indonesia and the Asian Development Bank (ADB) under ADB Technical Assistance (TA) No. 8826-INO: Sustainable and Inclusive Energy Program (SIEP). Funding for this TA was provided by ADB and Agence Française de Développement (AFD).
The terms of reference for this study were agreed between ADB and the Program Implementation Unit for National Electrification Development (Unit Pelaksana Program Pembangunan Ketenagalistrikan Nasional, UP3KN) of the Ministry of Energy and Mineral Resources in April 2016. The principal day-to-day counterpart for the study was the Regional Development Division for Maluku and Papua (Divisi Pengembangan Regional Maluku dan Papua), a headquarters unit of the Indonesian national utility, PT PLN (Persero).
Initial results for Papua Barat were presented to PLN in September 2016 and to the Directorate General of New and Renewable Energy and Energy Conservation (Direktorat Jendral Energi Baru dan Terbarukan dan Konservasi Energi, EBTKE) and the Directorate General of Electricity (Direktorat Jendral Ketenagalistrikan, DJK) in November 2016. Complete results for Papua and Papua Barat were subsequently presented and discussed with the PLN Regional Office for Papua and West Papua (PLN Wilayah Papua dan Papua Barat) in Jayapura in March 2017, and findings refined based on additional information provided by them over the subsequent months. A draft report was submitted to ADB in August 2017. This report incorporates comments from ADB and AFD on that draft, as well as comments received from PLN’s Regional Development Division for Maluku and Papua on the draft version of the report submitted to them in October 2017. Results for Maluku and Maluku Utara have also been incorporated in this final version of the report.
The Castlerock team gratefully acknowledges the collaboration with and support from Messrs. Nur Pamudji, Agung Wicaksono, and Amrul Hakim of UP3KN; Mr. Hot Martua Bakara (head), Mr Ari Dartomo (senior manager) and staff of PLN’s Regional Development Division for Maluku and Papua; Ms. Maritje Hutapea, director of EBTKE; Mr. Yohanes Sukrislismono (general manager), Mr. Supardi Limbong (manager for planning), and staff of PLN Wilayah Papua and Papua Barat; Mr. Winner Sianipar (manager for planning) and staff of PLN Wilayah Maluku and Maluku Utara; and Dr. Pradeep Tharakan, Senior Energy Specialist (Climate Change), of the ADB.

ii
Least-Cost Electrification Plan for Papua, Papua Barat, Maluku and Maluku Utara – December 2017
EXECUTIVE SUMMARY / RINGKASAN EKSEKUTIF
ES.1 Background and Objectives
The Government of Indonesia aims to achieve near-universal electricity access by 2020. Although progress towards this goal has been impressive, as of the end of 2016 approximately 5.9 million households across the country remained without electricity.
The provinces of eastern Indonesia, and in particular Papua, are characterized by the lowest electrification ratios in the country, and are therefore a focus of Government electrification efforts. As part of these efforts, the Government has directed PLN to accelerate rural electrification activities. In addition, the Ministry of Energy and Mineral Resources has issued Ministerial Regulation 38/2016, which outlines how the private sector can provide off-grid supply.
As described in other recent reports regarding electrification in Indonesia1, a single, comprehensive electrification plan is needed to guide and coordinate stakeholder activities and determine the investment required to achieve electrification targets.
This report describes the preparation of an electrification plan for the provinces of Papua, Papua Barat, Maluku and Maluku Utara, and the resulting capital and operating costs of implementation. This planning exercise identifies nearly 8,000 settlements and isolated households outside the reach of the existing grid in Papua and Papua Barat, and 2,865 in Maluku and Maluku Utara, and determines the least-cost means to supply each of
ES. 1 Latar Belakang dan Tujuan
Pemerintah Indonesia menargetkan untuk memberikan akses listrik kepada hampir seluruh rakyat Indonesia pada tahun 2020. Walaupun kemajuan untuk mencapai target tersebut mengesankan, masih ada 5.9 juta rumah tangga di Indonesia yang belum memiliki akses listrik pada akhir tahun 2016.
Propinsi-propinsi yang terletak di bagian timur Indonesia, khususnya Papua, memiliki rasio elektrifikasi terendah di seluruh Indonesia, sehingga menjadi fokus dalam usaha elektrifikasi Pemerintah. Sebagai bagian dari usaha tersebut, Pemerintah telah memberikan instruksi kepada PLN untuk mempercepat elektrifikasi desa-desa yang belum berlistrik. Kementrian Energi dan Sumber Daya Mineral juga telah menerbitkan Peraturan Menteri No. 38 Tahun 2016 yang merumuskan penyediaan listrik secara off-grid oleh pihak swasta.
Seperti yang dijelaskan di dalam laporan lain mengenai elektrifikasi di Indonesia1, suatu rencana komprehensif untuk usaha elektrifikasi di Indonesia dibutuhkan untuk mengarahkan dan mengkoordinasikan kegiatan para pemangku kepentingan dan menentukan investasi yang dibutuhkan untuk mencapai target elektrifikasi.
Laporan ini menggambarkan persiapan sebuah rencana elektrifikasi untuk provinsi Papua, Papua Barat, Maluku dan Maluku Utara, termasuk modal dan biaya operasi yang dibutuhkan untuk implementasi. Perencanaan ini telah mengidentifikasi hampir 8.000 pemukiman dan rumah tangga terisolasi yang terletak di luar jangkauan jaringan listrik yang ada di Papua dan Papua Barat, dan 2,865 di Maluku dan Maluku Utara, serta metoda
1 See for example, Asian Development Bank, Achieving Universal Electricity Access In Indonesia, 2016, https://www.adb.org/sites/default/files/publication/182314/achieving-electricity-access-ino.pdf.

Executive Summary / Ringkasan Eksekutif…
iii
Least-Cost Electrification Plan for Papua, Papua Barat, Maluku and Maluku Utara – December 2017
them. Three supply technologies are considered: grid extension, isolated photovoltaic (PV)-power mini-grids and solar home systems (SHS) for individual households.
termurah untuk memberikan akses listrik kepada pemukiman dan rumah tangga tersebut. Tiga teknologi yang dipertimbangkan adalah: perluasan jaringan, photovoltaic (PV) mini-grid, dan solar home systems (SHS) untuk rumah tangga individual.
ES.2 Methodology Exhibit ES.1 shows the five-step approach used for preparation of this least-cost plan. It starts with rooftop tagging, i.e. the geolocation of households based on satellite imagery. This was done manually using free, publicly available satellite imagery from Google Earth, Bing Maps and HERE Maps. Tagging results are within 10% of the Indonesian Central Statistics Agency’s population estimates for each of these provinces. These individual tags are then aggregated into clusters or settlements that can be served by low-voltage (LV) reticulation. Each settlement is represented by a single point (“node”) that is characterized by settlement population and geolocation. Existing medium-voltage (MV) lines are then geolocated. Next the performance and unit costs of the three supply options are compiled, and a demand model is developed that calculates settlement electricity demand based on population, economic growth and population growth. Only project direct costs are counted; programmatic and overhead costs such as licensing, administration, project management and profit are excluded.
ES.2 Metodologi Exhibit ES.1 menunjukkan pendekatan lima langkah yang digunakan untuk mempersiapkan rencana dengan biaya terendah ini. Persiapan dimulai dengan penandaan pada atap rumah, yaitu identifikasi dan penandaan lokasi geografis dari rumah tangga berdasarkan citra satelit. Proses ini dilakukan secara manual menggunakan citra satelit yang terbuka gratis untuk umum, yaitu dari Google Earth, Bing Maps, dan HERE Maps. Hasil penandaan berada dalam 10% dari perkiraan populasi Badan Pusat Statistik (BPS) untuk masing-masing provinsi-provinsi ini. Penanda dari masing-masing rumah tangga lalu diagregasikan kedalam kelompok atau pemukiman yang dapat dilayani oleh retikulasi jaringan tegangan rendah (JTR). Setiap pemukiman diwakili oleh sebuah titik yang memberikan karakteristik populasi dan lokasi geografis pemukiman. Selanjutnya, dilakukan identifikasi lokasi geografis jaringan tegangan menengah (JTM) yang telah ada. Lalu, kinerja diperkirakan dan biaya satuan dari tiga pilihan teknologi yang dipertimbangkan tersebut dikompilasikan. Sebuah model kebutuhan listrik juga dikembangkan untuk memperhitungkan kebutuhkan listrik setiap pemukiman berdasarkan populasi, pertumbuhan ekonomi, dan pertumbuhan populasi. Hanya biaya langsung proyek yang diperhitungkan. Sehingga, biaya programatik dan overhead, seperti lisensi, administrasi, manajemen proyek, dan keuntungan, tidak diperhitungkan.

Executive Summary / Ringkasan Eksekutif…
iv
Least-Cost Electrification Plan for Papua, Papua Barat, Maluku and Maluku Utara – December 2017
This information is then entered into Network Planner2, a model developed by The Earth Institute of Columbia University, which uses an optimization algorithm to determine the least-cost means to serve each settlement that does not yet have electricity. Settlements within 1.5 km of either side of existing medium voltage (MV) lines are excluded from the analysis, since the focus of the analysis is on new service to unserved areas rather than in-fill of areas with existing supply. The model identifies the least-cost supply technology for each these settlements, and summarizes capital and operating costs by technology and administrative unit. Solar home systems (SHS) have been automatically assigned to all isolated households as well as settlements of less than or equal to 15 households outside of the existing grid buffers. Network Planner has not identified any settlements larger than 15 households where SHS would be least-cost.
Informasi ini lalu dimasukkan ke dalam Network Planner2, sebuah model yang dikembangkan oleh The Earth Institute of Columbia University yang menggunakan algoritma optimasi untuk menentukan metoda dengan biaya terendah untuk memberikan akses listrik kepada setiap pemukiman yang belum berlistrik. Pemukiman dengan jarak 1,5 km atau kurang di kedua sisi JTM yang sudah ada tidak dipertimbangkan di dalam analisis ini. Hal tersebut dikarenakan fokus analisis adalah terhadap pelayanan baru untuk area yang belum mendapatkan listrik, dan bukan pengisian area melalui jaringan yang sudah ada (in-fill connections). Model ini mengidentifikasi teknologi penyediaan listrik termurah untuk setiap pemukiman. Model ini juga merangkum modal dan biaya operasi berdasarkan teknologi dan unit administrasi.
Solar home systems (SHS) diperuntukkan secara otomatis untuk rumah tangga terisolasi dan pemukiman dengan jumlah rumah tangga 15 atau kurang di luar 1,5 km di kedua sisi JTM yang sudah ada. Network Planner tidak mengidentifikasikan SHS sebagai teknologi termurah untuk pemukiman lebih besar dari 15 rumah tangga.
Exhibit ES.1: The Planning Methodology
ES.3 Principal Results – Papua and Papua Barat Exhibit ES.2 summarizes the capital and operating costs by type of technology to achieve 90 to 96% electrification ratio across Papua and Papua Barat (excluding in-fill connections). Exhibit ES.3 shows the results for Maluku and Maluku Utara. Each category of electrification option is
ES.3 Hasil Utama – Papua dan Papua Barat Exhibit ES.2 merangkum biaya modal dan operasi berdasarkan jenis teknologi untuk mencapai 90-96% rasio elektrifikasi di Papua dan Papua Barat, kecuali area dengan in-fill connections. Exhibit ES.3 merangkum hasil untuk Maluku dan Maluku Utara. Setiap kategori opsi elektrifikasi
2 Further information on Network Planner is available at http://qsel.columbia.edu/network-planner/. The model itself can be accessed at http://optimus.modilabs.org.
Opti iza‐tio
U it Costi g & De a d
Fore asti g
Ide tifi atio of e isti g assets
Settle e t deli eatio
Rooftop taggi g
Least‐ ost ele trifi atio
pla

Executive Summary / Ringkasan Eksekutif…
v
Least-Cost Electrification Plan for Papua, Papua Barat, Maluku and Maluku Utara – December 2017
described as follows:
There is a large number of PV mini-grids. The average number of households served by these systems in Papua and Papua Barat is 47. Further details on the size distribution of these mini-grids are presented below.
“Grid extension (connected to existing grid)” represents conventional electrification by PLN in which the existing grid is extended.
“Grid extension (new, not connected to existing grid)” represents settlements that would be connected by 20 kV line, but as new, isolated systems that would not be connected to the existing grid. These systems serve an average of 581 households each in Papua and Papua Barat. However, this assumes that the cost of energy at the point of injection to the 20 kV network is the same as for the existing 20 kV systems in each region. This is likely to be over-optimistic since these are remote groups of settlements where fuel transport costs are likely to be considerably higher than for the existing systems of Papua and Papua Barat. These may be candidates for diesel-PV hybrid generation.
There are seven key findings arising from this analysis:
1. Approximately USD 404 million of capital investment is required to achieve near-universal access in Papua and Papua Barat. The pace at which this can be funded will in part determine when these electrification targets can be achieved. USD 249 million of this requirement is associated with grid extension or new 20 kV isolated grids, which will likely be the responsibility of PLN. Given PLN’s other capital investment requirements such as the 35 GW program, the Government of
dijelaskan sebagai berikut:
Ada sejumlah besar PV mini-grid. Jumlah rata-rata rumah tangga yang dilayani oleh jenis sistem ini adalah 47 di Papua dan Papua Barat. Rincian mengenai ukuran dari setiap sistem ini dijelaskan di bawah.
“Perluasan jaringan (tersambung ke jaringan yang sudah ada)” merepresentasikan eletkrifikasi konvensional oleh PLN, dimana jaringan yang sudah ada diperluas.
“Perluasan jaringan (baru, tidak tersambung ke jaringan yang sudah ada)” merepresentasikan pemukiman yang akan disambungkan ke jaringan 20 kV, tetapi sebagai sistem baru dan terisolasi yang tidak akan disambungkan dengan jaringan yang sudah ada. Setiap sistem ini melayani rata-rata 581 rumah tangga di Papua dan Papua Barat. Namun, asumsi yang digunakan adalah biaya energi di titik penyambungan ke jaringan 20 kV adalah sama untuk semua sistem 20 kV di setiap wilayah. Asumsi ini mungkin menjadi terlalu optimis dikarenakan pemukiman-pemukiman ini bersifat terpencil, sehingga biaya transportasi bahan bakar dapat menjadi lebih tinggi dibandingkan dengan sistem yang sudah ada di Papua dan Papua Barat. Sistem-sistem ini dapat menjadi pilihan untuk pembangkit hybrid diesel-PV.
Tujuh temuan utama dari analisis ini adalah sebagai berikut:
1. Sekitar USD 404 juta investasi untuk modal dibutuhkan untuk memberikan akses listrik untuk hampir seluruh Papua dan Papua Barat. Kecepatan pendanaan akan menentukan secara sebagian kapan target elektrifikasi dapat dicapai. USD 249 juta dari kebutuhan pendanaan tersebut adalah terkait dengan perluasan jaringan atau jaringan 20 kV terisolasi, yang mungkin akan menjadi tanggung jawab PLN. Namun, dikarenakan kebutuhan modal PLN yang lain, misalnya terkait dengan

Executive Summary / Ringkasan Eksekutif…
vi
Least-Cost Electrification Plan for Papua, Papua Barat, Maluku and Maluku Utara – December 2017
Indonesia may have to consider equity injections to ensure PLN’s ability to finance this capital investment.
program 35 GW, Pemerintah Indonesia dapat mempertimbangkan suntikan ekuitas untuk memastikan kemampuan PLN dalam mendanai kebutuhan investasi tersebut.
Exhibit ES.2: Capital & Operating Costs by Type of Supply – Papua & Papua Barat
2. The present value of operating costs is as large or larger than capital costs. The sustainability of these systems therefore depends on availability of funding for operations and maintenance. For grid extension, the largest component of operating costs is fuel, whereas for PV mini-grids and SHS, the largest component is battery replacement. These costs will need to be funded by either government (through subsidies to PLN and private suppliers) or by consumers through their tariffs. The nominal levelized cost of supply from the PV mini-grids exceeds USD 1.00/kWh, so that full cost recovery tariffs would be higher than IDR 15,000/kWh. This is approximately 36 times higher than the effective R-1 450VA tariff now in effect.
2. Biaya operasional saat ini adalah
sebesar, atau lebih besar dari, modal. Oleh karena itu, keberlanjutan dari sistem-sistem ini bergantung pada tersedianya pendanaan untuk operasi dan perawatan. Untuk perluasan jaringan, komponen terbesar dari biaya operasional adalah bahan bakar. Sedangkan untuk PV mini-grid dan SHS, komponen operasional terbesar adalah pergantian batere. Biaya ini harus didanai oleh Pemerintah melalui subsidi kepada PLN dan penyedia listrik swasta, atau oleh pelanggan melalui tarif. Tingkat biaya nominal penyediaan listrik dari PV mini-grid melebihi USD 1,00/kWh, sehingga tarif untuk memulihkan biaya secara keseluruhan (full cost recovery tariff) akan lebih dari Rp 15.000/kWh. Tarif tersebut sekitar 36 kali lebih tinggi dari tarif R-1 450VA yang berlaku saat ini.
Assu es ‐ %ele trifi atio
ratio depe di g o PLN Area
Nu er of households
tags
Nu er of settle e ts
odes
I itial apital ost USD
Prese t alue of re urri g osts USD
SHS s ste s 7, , 7* , 7 , , ,
PV i i‐grids ,7 , 7 , , , ,
Grid e te sio o e ted to e isti g grid , , , ,77 ,77
Grid e te sio e – ot o e ted to e isti g grid 7, 7
s ste s , ,7 , ,
Withi e isti g grid uffer , 7 /a /a
* I ludes isolated households

Executive Summary / Ringkasan Eksekutif…
vii
Least-Cost Electrification Plan for Papua, Papua Barat, Maluku and Maluku Utara – December 2017
3. Grid extension is the least-cost means of supply for most households. 52% of households outside of grid buffers would be supplied by extension of the existing grids, while 19% would be served by new conventional isolated 20 kV grids (though as noted previously this may be an overestimate, since it assumes that the cost of energy in these grids would be the same as for the existing 20 kV grids, when in fact due to the remote location of these settlements it would likely be higher, making PV mini-grids relatively more attractive).
4. ….but mini-grids play an important
role. PV mini-grids on the other hand would be least-cost for 22% of households outside of the existing grid buffer. Permen ESDM 38/2016 provides for private sector participation. Implementation of that regulation will require PLN to delineate areas which it wishes to retain for its own operations, and to identify areas it will release to the private sector. The resulting geospatial data files from this analysis can be used by PLN and provincial governments to define these respective areas.
5. PV mini-grids are required in a wide range of sizes. Section 5.4 of this report presents histograms of the size of PV mini-grids in terms of the installed capacity (kWp) as well as number of households served per system. Though the average size of a PV mini-grid system is nearly 16 kWp and serves an average of 47 households, and the largest is 266 kWp serving 477 households, slightly more than half of all systems identified are less than 10 kWp and serve between 15 and 32 households. Given the remote location of these settlements, the installation, operation, maintenance, billing and
3. Perluasan jaringan adalah teknologi termurah untuk memberikan akses listrik kepada sebagian besar rumah tangga. 52% dari rumah tangga yang terletak di luar penyangga jaringan akan disambungkan ke jaringan yang sudah ada, sedangkan 19% dari rumah tangga akan dilayani oleh jaringan 20 kV terisolasi yang baru. Namun, seperti yang sudah dijelaskan sebelumnya, angka ini mungkin merupakan penaksiran yang terlalu tinggi dikarenakan harga energi di sistem-sistem ini disamakan dengan jaringan 20 kV yang sudah ada. Sedangkan faktanya adalah biaya energi untuk pemukiman terpencil ini mungkin lebih tinggi, sehingga membuat teknologi PV mini-grid lebih menarik.
4. Namun, mini-grid memiliki peran yang penting. PV mini-grid menjadi pilihan dengan biaya terendah untuk 22% rumah tangga di luar area penyangga jaringan PLN yang sudah ada. Permen ESDM 38/2016 memberikan kesempatan untuk partisipasi swasta. Namun, implementasi dari regulasi ini akan membutuhkan PLN untuk mendefinisikan area yang diinginkan untuk operasi PLN, dan area yang dapat dimasuki oleh pihak swasta. Data geospasial yang dihasilkan dari analisis ini dapat digunakan PLN dan pemerintah propinsi untuk mendefinisikan area-area tersebut.
5. PV mini-grid dibutuhkan dalam
berbagai ukuran. Bab 5.4 dari laporan ini memberikan histogram dari ukuran PV mini-grid dalam kapasitas terpasang (kWp) dan jumlah rumah tangga yang dilayani setiap sistem. Ukuran rata-rata dari sistem PV mini-grid adalah hampir 16 kWp yang melayani rata-rata 47 rumah tangga. Ukuran terbesar dari sistem adalah 266 kWp yang melayani 477 rumah tangga. Namun, hampir lebih dari separuh dari semua sistem teridentifikasi berukuran kurang dari 10 kWp, dan melayani 15-32 rumah tangga. Mempertimbangkan lokasi pemukiman-pemukiman yang terpencil,

Executive Summary / Ringkasan Eksekutif…
viii
Least-Cost Electrification Plan for Papua, Papua Barat, Maluku and Maluku Utara – December 2017
collections for these systems will be a logistical challenge.
6. Enabling mechanisms are needed. The Government of Indonesia has set a universal access target for the country, PLN is actively planning how to meet this target, and Permen ESDM 38/2016 has been issued to facilitate private sector participation in rural electrification. Additional enabling mechanisms are needed:
o As noted under item (1) above, PLN likely requires additional funding to meet the capital investment needs for grid extension and new 20 kV networks. Approximately IDR 3.3 trillion of capital injections would be the simplest and most expedient means of providing this funding.
o While Permen ESDM 38/2016 provides for both subsidized and non-subsidized private sector supply, as a practical matter some subsidy will likely be required to maximize the economic benefits of supply to communities. A regulation is required from the Ministry of Finance regarding the budgeting, administration and verification of such subsidies, and the national legislature (Dewan Perwakilan Rakyat, DPR) would have to approve such subsidies on an annual basis as part of the state budget.
o Extensive institutional capacity building will be required both at the national and regional levels to facilitate implementation of the subsidy scheme.
7. Field confirmation is required. In planning for this government-mandated electrification program, PLN Wilayah Papua has already started field surveys
instalasi, operasi, perawatan, penagihan dan pengumpulan untuk sistem-sistem ini akan menjadi tantangan secara logistik.
6. Dibutuhkan mekanisme yang
mendukung. Pemerintah Indonesia telah memberikan target akses listrik universal. PLN juga telah melakukan perencanaan aktif untuk mencapai target ini. Permen ESDM 38/2016 telah diterbitkan untuk memfasilitasi partisipasi pihak swasta di dalam elektrifikasi desa. Maka, mekanisme pendukung tambahan berikut dibutuhkan:
o Seperti disampaikan di dalam poin
(1), PLN mungkin akan membutuhkan pendanaan tambahan untuk mencapai kebutuhan investasi untuk perluasan jaringan dan jaringan 20 kV baru. Sekitar Rp 3,3 triliun injeksi modal merupakan cara yang mudah dan tercepat untuk memberikan pendanaan ini.
o Permen ESDM 38/2016
menyediakan skema subsidi dan non-subsidi untuk pihak swasta. Namun, dibutuhkan subsidi untuk memaksimalkan manfaat eknonomi dari akses listrik kepada komunitas. Sebuah regulasi dari Kementrian Keuangan dibutuhkan terkait dengan penganggaran, administrasi dan verifikasi dari subsidi-subsidi tersebut. Dewan Perwakilan Rakyat (DPR) harus menyetujui subsidi tersebut per tahun sebagai bagian dari anggaran negara.
o Pengembangan kapasitas institusi
secara ekstensif dibutuhkan di tingkat nasional dan daerah untuk memfasilitasi implementasi dari skema subsidi.
7. Konfirmasi lapangan dibutuhkan. Dalam perencanaan program elektrifikasi yang dimandatkan oleh Pemerintah, PLN Wilayah Papua telah

Executive Summary / Ringkasan Eksekutif…
ix
Least-Cost Electrification Plan for Papua, Papua Barat, Maluku and Maluku Utara – December 2017
of communities to be electrified. This study compares the findings of PLN field surveys with results from this study for 21 randomly selected settlements. A number of observations arise from this comparison:
o In most cases, the estimate of settlement population varies greatly, often by a factor of 3 or more. It is understood that PLN personnel did not conduct a census count of households, but rather asked the kepala desa or other village representative the number of households in the settlement.
o Unsurprisingly, given the widely divergent population estimates, the selected technology is the same in only a few cases, and in those cases the sizing differs substantially.
o In none of the cases did PLN identify grid extension as the preferred method of supply. Even though PLN prioritizes grid extension, PLN identified only PV or diesel systems for supplying the selected settlements. However, according to this analysis, grid extension is the least-cost means of supplying the majority of communities in the currently unserved areas that were sampled.
There are of course a number assumptions and caveats associated with this analysis, as described in this report. Clearly, ground truthing is required prior to implementation of any electrification plan. By the same token, rapid field surveys alone can miss critical information and may lack consistent assumptions and a systematic planning approach. It is therefore suggested that the results of this study be used to guide field
memulai survey lapangan masyarakat yang akan dielektrifikasi. Studi ini membandingkan temuan dari survey lapangan PLN dengan hasil dari studi ini untuk 21 pemukiman yang dipilih secara acak. Hasil pengamatan dari perbandingan tersebut adalah sebagai berikut: o Pada umumnya, perkiraan populasi
permukiman sangat berbeda, dengan perbedaan yang sering mencapai lebih dari tiga kali. Pemahaman yang didapatkan adalah staff PLN bukan melakukan sensus untuk menghitung rumah tangga, tetapi meminta informasi dari kepala desa atau perwakilan desa lainnya mengenai jumlah rumah tangga.
o Dengan adanya perbedaan perkiraan populasi yang cukup besar, jenis teknologi yang terpilih hanya sama di beberapa kasus. Bahkan untuk kasus-kasus tersebut, ukuran dari teknologi atau sistem dapat memiliki perbedaan yang signifikan.
o Untuk semua kasus, PLN tidak memilih perluasan jaringan sebagai pasokan listrik yang disukai. Walaupun PLN memprioritisasikan perluasan jaringan, hanya sistem PV atau diesel dipilih untuk pasokan listrik di pemukiman-pemukiman ini. Namun, berdasarkan analisa ini, perluasan jaringan adalah metoda termurah untuk menyediakan listrik bagi sebagian besar masyarakat yang belum memilikinya dalam pemukiman yang disampel.
Studi ini tentunya memiliki berbagai asumsi dan keterbatasan yang selanjutnya akan digambarkan di dalam laporan ini. Observasi langsung di lapangan untuk mendapatkan informasi empiris dibutuhkan sebelum implementasi setiap rencana elektrifikasi. Sama halnya dengan survey lapangan secara cepat yang dapat melewatkan informasi penting, dan mungkin tidak memiliki asumsi yang

Executive Summary / Ringkasan Eksekutif…
x
Least-Cost Electrification Plan for Papua, Papua Barat, Maluku and Maluku Utara – December 2017
surveys and the electrification planning effort more generally. Field survey teams can use these results as a hypothesis to be confirmed or rejected through field work.
ES.4 Principal Results – Maluku and Maluku Utara
Given the archipelagic nature of these two provinces, the analysis was conducted by island. There are 126 islands with settlements in these two provinces, and these were classified according to whether (i) no settlement on the island has PLN supply, (ii) all settlements are within the existing PLN MV grid buffer (“fully electrified”), (iii) there is a mix of served and unserved settlements (as determined by whether the settlement is in the grid buffer), with a total island population greater than 2,500 households, and (iv) there is a mix of served and unserved settlements, with a total island population less than 2,500 households.
Islands with no PLN supply have an average of 1.9 settlements with an average size of 135 households each. It is therefore assumed these islands will be served by PV mini-grids. Islands that are already fully electrified are not considered further for this electrification plan, although there may be households on these islands that are not yet connected to the grid.
The islands with a mix of served and unserved settlements were modelled individually with Network Planner, with technical performance and cost parameters set for each PLN Area. The cost of grid energy on islands with populations greater than 2,500 households was taken at PLN’s generation production cost (BPP pembangkit) reported for 2016, whereas on islands with less than 2,500 households a
konsisten serta pendekatan perencanaan yang sistematis. Oleh karena itu, hasil dari studi ini disarankan untuk digunakan sebagai arahan untuk survey lapangan, dan perencanaan elektrifikasi secara umum. Tim survey lapangan dapat menggunakan hasil studi ini sebagai hipotesa yang akan dikonfirmasi atau ditolak berdasarkan temuan lapangan.
ES.4 Hasil Utama – Maluku dan Maluku Utara
Dikarenakan bentuk kepulauan dari kedua propinsi ini, analisa dilakukan berdasarkan pulau. Di dalam kedua propinsi ini, terdapat 126 pulau yang berpenghuni. Pulau-pulau ini diklasifikasikan sebagai berikut: (i) pulau yang tidak memiliki layanan PLN untuk seluruh pemukiman; (ii) pulau yang semua pemukimannya terletak di dalam penyangga jaringan tegangan menengah PLN (“sepenuhnya terelektrifikasi”); (iii) pulau yang sebagian dari pemukimannya dilayani oleh PLN, dengan populasi pulau lebih besar dari 2.500 rumah tangga; dan (v) pulau yang sebagian dari pemukimannya dilayani oleh PLN, dengan populasi pulau kurang dari 2.500 rumah tangga.
Pulau-pulau yang tidak terlayani oleh PLN rata-rata memiliki 1.9 pemukiman dengan setiap pemukiman memiliki rata-rata 135 rumah tangga. Oleh karena itu, pulau-pulau tersebut diasumsikan akan dilayani oleh PV mini-grid. Pulau-pulau yang telah sepenuhnya terelektrifikasi tidak dipertimbangkan lebih jauh di dalam rencana elektrifikasi ini, walaupun ada kemungkinan terdapatnya rumah tangga yang belum tersambung ke jaringan PLN di pulau tersebut.
Untuk pulau-pulau yang sebagian dari pemukimannya sudah dilayani PLN, pemodelan menggunakan Network Planner dilakukan untuk setiap pulau dengan performa teknis dan parameter biaya yang ditentukan untuk setiap area PLN. Untuk pulau-pulau dengan populasi lebih besar dari 2.500 rumah tangga, biaya produksi energi di dalam jaringan adalah biaya pokok produksi pembangkit (BPP

Executive Summary / Ringkasan Eksekutif…
xi
Least-Cost Electrification Plan for Papua, Papua Barat, Maluku and Maluku Utara – December 2017
grid energy cost of USD 0.25/kWh was used to reflect the higher cost of fuel transport and handling on these small islands.
Exhibit ES.3 shows the summary capital and operating cost results for Maluku and Maluku Utara.
Pembangkit) tahun 2016. Sedangkan untuk pulau-pulau dengan populasi lebih kecil dari 2.500 rumah tangga, biaya produksi energi di dalam jaringan ditetapkan sebesar US$ 0,25/kWh untuk merefleksikan biaya yang lebih tinggi untuk transportasi bahan bakar dan penanganan di pulau-pulau kecil ini.
Exhibit ES.3 menunjukkan ringkasan modal dan biaya operasi berdasarkan hasil analisa untuk Maluku dan Maluku Utara.
Exhibit ES.3: Capital & Operating Costs by Type of Supply – Maluku & Maluku Utara
The total capital cost required for achieving near-universal access in Maluku and Maluku Utara is approximately USD 105 million. As with Papua and Papua Barat, the present value of operating costs is comparable to the capital cost. Similarly, the pace at which this can be funded will in part determine how quickly these electrification targets can be achieved. Approximately USD 70 million of this required capital investment is associated with grid extension or new 20 kV isolated grids, which will likely be the responsibility of PLN.
75% of households outside of grid buffers would be supplied by extension of the existing grids, while only 2% would be
Modal total yang diperlukan untuk memberikan akses listrik untuk hampir seluruh Maluku dan Maluku Utara adalah US$ 105. Seperti yang ditemukan di Papua dan Papua Barat, biaya operasional saat ini sebanding dengan modal. Kecepatan pendanaan secara sebagian akan menentukan kapan target elektrifikasi dapat dicapai. US$ 70 juta dari penanaman modal yang diperlukan terkait dengan perluasan jaringan, atau pembangunan jaringan 20 kV terisolasi baru, yang mungkin akan menjadi tanggung jawab PLN.
75% dari rumah tangga yang berada di luar penyangga jaringan akan dilayani oleh perluasan jaringan yang sudah ada.
Assu es ‐ % ele trifi atio ratio
depe di g o PLN Area
Nu er of HH
Nu er of settle e ts
odes
I itial apital ost USD
Prese t alue of re urri g osts USD
SHS s ste s , 7 7 * , ,7 , ,
PV i i‐grids , , , 7 , 7 ,
Grid e te sio o e ted to e isti g grid , 7, 77, , ,
Grid e te sio e – ot o e ted to e isti g grid ,
s ste s , , , ,
Withi e isti g grid uffer , ,7 /a /a
* I ludes isolated households

Executive Summary / Ringkasan Eksekutif…
xii
Least-Cost Electrification Plan for Papua, Papua Barat, Maluku and Maluku Utara – December 2017
served by new conventional isolated 20 kV grids. PV mini-grids on the other hand would be least-cost for 19% of households outside of the existing grid buffer, and individual SHS for 4%. The average size of settlements to be served by PV mini-grids is 111 households, larger than for Papua and Papua Barat.
While PV mini-grids in Maluku and Maluku Utara would supply a similar percentage of currently unelectrified households as in Papua and Papua Barat, in overall terms their contribution would be much smaller. Only 2.5% of all households in Maluku and Maluku Utara would be served by PV mini-grids, whereas in Papua and Papua Barat the figure is 8.0%.
The same caveats that were identified above for Papua and Papua Barat also apply for Maluku and Maluku Utara. Specifically:
Enabling mechanisms are required to implement that plan; and
Field confirmation is necessary. As noted previously, this study can serve as a hypothesis to be tested by field visits.
Sedangkan hanya 2% dari rumah tangga tersebut akan dilayani oleh jaringan terisolasi 20 kV konvensional yang baru. Metoda elektrifikasi termurah untuk 19% dari rumah tangga di luar penyangga jaringan adalah PV mini-grid. Sedangkan untuk 4% dari rumah tangga di luar penyangga jaringan, metoda elektrifikasi termurah adalah panel surya individu, atau SHS. Ukuran rata-rata permukiman yang akan dilayani oleh grid mini PV adalah 111 rumah tangga, lebih besar dari pada Papua dan Papua Barat.
Walaupun teknologi PV mini-grid di Maluku dan Maluku Utara secara persentase sebanding dengan Papua dan Papua Barat dalam melayani rumah tangga yang belum terlektrifikasi, kontribusi teknologi tersebut akan jauh lebih kecil. Hanya 2.5% dari seluruh rumah tangga di Maluku dan Maluku Utara akan dilayani oleh PV mini-grid. Sedangkan, persentase di Papua dan Papua Barat mencapai 8,0%.
Keterbatasan yang berlaku pada analisa Papua dan Papua Barat juga berlaku untuk Maluku dan Maluku Utara, yaitu:
Dibutuhkannya mekanisme pendukung untuk pengimplementasian rencana elektrifikasi; dan
Diperlukannya konfirmasi lapangan. Seperti sebelumnya disampaikan, studi ini dapat digunakan sebagai hipotesa untuk dibuktikan melalui kunjungan lapangan.

xiii
Least-Cost Electrification Plan for Papua, Papua Barat, Maluku and Maluku Utara – December 2017
TABLE OF CONTENTS
Foreword i
Executive Summary / Ringkasan Eksekutif ii
1. Introduction 1-1 1.1 Background 1-1 1.2 Objectives 1-2 1.3 Principal Counterparts 1-3 1.4 Methodology 1-3 1.5 Key Assumptions and Caveats 1-6
2. Rooftop Tagging 2-1 2.1 Data Sources and Processing 2-1 2.2 Image Quality Issues 2-3 2.3 Tagging Result Accuracy 2-5
3. Settlement Identification and Demand Forecasting 3-1 3.1 Settlement Definition 3-1 3.2 Proximity Analysis and Settlement Nodes 3-1 3.3 Demand Forecasting 3-4
4. Technology and Resource Characterization 4-1 4.1 Grid Extension and Existing Grids 4-3 4.2 PV Mini-Grids 4-3 4.3 Individual Solar Home Systems 4-3 4.4 The Solar Resource 4-4
5. Network Planner Results 5-1 5.1 The Network Planner Algorithm 5-1 5.2 Grid Buffers 5-1 5.3 Results for Papua and Papua Barat 5-2 5.4 Results for Maluku and Maluku Utara 5-5 5.5 Interpretation and Application of the Results 5-12
Appendices
APPENDIX A: Terms of Reference A-1
APPENDIX B: Differences with Earlier World Bank and ADB Studies B-1
APPENDIX C: Mini-Grid Economic Model C-1
APPENDIX D: Network Planner Inputs for Papua and Papua Barat D-1

TABLE OF CONTENTS…
xiv
Least-Cost Electrification Plan for Papua, Papua Barat, Maluku and Maluku Utara – December 2017
APPENDIX E: Classification of Islands in Maluku and Maluku Utara E-1
APPENDIX F: Network Planner Inputs for Maluku and Maluku Utara F-1
APPENDIX G: Review of Permen ESDM 38/2016 G-1

1-1
Least-Cost Electrification Plan for Papua, Papua Barat, Maluku and Maluku Utara – December 2017
1. INTRODUCTION
1.1 BACKGROUND
Indonesia has achieved remarkable success in bringing electricity to its people. Despite being an archipelagic nation of some 17,000 islands spanning 5,000 km, by the end of 2016 Indonesia had attained a 91.2% electrification ratio3. In the past 10 years alone, PLN, the national electric utility, has managed to connect approximately 20 million new households, representing 78 million people. Over the three-year period 2014 through 2016, PLN connected an average of approximately 3.0 million new household consumers per year.
Given the benefits of electrification for economic development and household welfare, the Government of Indonesia aims for near-universal access by 2020. The National Energy Policy (Kebijakan Energi Nasional, KEN) adopted in 2014 states that Indonesia should “approach” 100% electrification ratio by 2020. Meanwhile, the 2015–2019 National Medium Term Development Plan (Rencana Pembangunan Jangka Menengah Nasional, RPJMN) targets an electrification ratio of 96.6% by the end of 2019.
These are ambitious targets. Despite the progress that Indonesia has made in expanding electricity access, by the beginning of 2017 approximately 5.9 million Indonesian households remained without access to electricity4. Experience throughout the world has shown that the last 10 to 15% of the population is the most difficult and costly to supply. Countries such as China, Mexico and Thailand needed 20 years to provide electricity service to the last 10 to 15% of their respective populations. Experience in these and other countries shows that government leadership, an enabling institutional environment, sustained public funding and engagement of all stakeholders under a single plan are required to achieve universal access.
In February, 2016, the Minister of Energy and Mineral Resources launched the Program Indonesia Terang (PIT) to accelerate universal access using off-grid renewable energy in the six easternmost provinces of Indonesia5, which are characterized by the lowest electrification rates in the country. The Unit Pelaksana Program Pembangunan Ketenagalistrikan Nasional (UP3KN) together with Satuan Tugas Percepatan Pengembangan Energi Baru dan Terbarukan (P2EBT) within the Ministry of Energy and Mineral Resources (Kementerian Energi dan Sumber Daya Mineral, ESDM) were assigned to take a leading role in the technical and commercial design of PIT.
UP3KN and P2EBT were going to support a new unit which was established under ESDM Decree 5672 K/73/MEM/2016 to implement the PIT. Subsequently, though, the minister of ESDM was changed three times during 2016. Although increased electricity access in eastern Indonesia remained a government policy priority throughout these reshuffles, several institutional changes took place:
3 Ministry of Energy and Mineral Resources, Laporan Kinerja Kementerian ESDM 2016, downloaded from https://www.esdm.go.id/assets/media/content/content-laporan-akuntabilitas-kinerja-instansi-pemerintah-kementerian-esdm-tahun-2016-.pdf on 9 August 2017.
4 Ibid.
5 Papua, Papua Barat, Maluku, Maluku Utara, Nusa Tenggara Timur and Nusa Tenggara Barat.

1. Introduction. . ..
1-2
Least-Cost Electrification Plan for Papua, Papua Barat, Maluku and Maluku Utara – December 2017
In April of 2016, UP3KN sought the assistance of ADB to develop a least-cost electrification plan for Papua and Papua Barat. Papua in particular is characterized by the lowest provincial electrification ratio in Indonesia: 48.3% as of the start of 2017 compared to 92% nationwide. ADB agreed to provide support under its Sustainable and Includes Energy Program (SIEP), and began work with PLN Division for Regional Development of Maluku and Papua. The agreed terms of reference for this support are presented in Appendix A.
In August 2016, UP3KN, P2EBT and the PIT implementation team were dissolved, and sole responsibility for electrification policy and programs retained by structural staff in the ministry. The ADB team continued to work directly with PLN.
In November 2016, ESDM Ministerial Regulation (Peraturan Menteri Energi dan Sumber Daya Mineral, Permen ESDM) 38/2016 on Acceleration of Electrification for Villages and Underdeveloped Areas established a framework for private provision of off-grid supply, building upon Law 30/2009 on Electricity and Government Regulation 14/2012 on Electricity Business Activities. Though several key aspects of the regulation require further development, e.g. definition by the Ministry of Finance on subsidy administration, this is an important milestone towards accelerating electrification efforts. PLN also requested extension of the study to cover Maluku and Maluku Utara during that month.
In early 2017, ESDM rebranded the eastern Indonesia off-grid electrification program covered by PIT as the “2500 village electrification program”6.
1.2 OBJECTIVES
Following the lessons learned from electrification programs around the world, Indonesia would benefit from the preparation of single electricity access plan to guide investment in and implementation of both grid extension and off-grid solutions7. The plan presented here covers the provinces of Papua, Papua Barat, Maluku and Maluku Utara. As of March 2017, ESDM report electrification ratios of 48.3%, 89.1%, 87.5% and 98.7% respectively8. The principal objectives for preparing this plan are to:
Determine the least-cost means to achieve regional electrification targets by considering three technologies
o Grid extension o PV mini-grids o Individual household PV systems (solar home systems, SHS)
Determine the amount of capital investment and operating costs required o By technology
6 Press Release of the Ministry of Energy and Mineral Resources No. 006.Pers/04/SJI/2017, 16 January 2017.
7 Asian Development Bank, Achieving Universal Electricity Access in Indonesia, Publication Stock No. RPT167922, 2016. https://www.adb.org/publications/achieving-universal-electricity-access-indonesia.
8 “Updates on Indonesian Electricity Policy”, presentation by Ir. Alihuddin Sitompul, MM, Director of Electicity Program Supervision, First Indonesia-Russia Join Working Group on Energy, 10 May 2017.

1. Introduction. . ..
1-3
Least-Cost Electrification Plan for Papua, Papua Barat, Maluku and Maluku Utara – December 2017
o By administrative unit
Identify for each settlement the least-cost means to serve that settlement; and
Provide a detailed geospatial baseline of recent household and facility locations that can be used later by PLN, government and off-grid system developers as a basis for implementation planning, e.g. identification of business areas (wilayah usaha) under Permen ESDM 38/2016.
This study does not address the regulatory and financing mechanisms required for the funding and implementation of the least-cost electrification solutions identified through this analysis. These mechanisms include:
While PLN is the obvious candidate to continue grid extension, streamlined means of funding the associated investment are required; and
For off-grid solutions, legal/commercial models must be developed for the selection, public funding/subsidies, tariff setting, construction, future operations and maintenance and performance management of entities to carry out off-grid supply.
The quantum of investment ultimately required may vary from the estimates presented in this report depending upon the regulatory mechanisms and commercial models that are ultimately adopted.
1.3 PRINCIPAL COUNTERPARTS
The principal counterpart for this study has been PLN Division for Regional Development of Maluku and Papua together with the PLN Regional Office for Papua and Papua Barat.
The study will need to be socialized and coordinated with a number of agencies to ensure subsequent implementation. These other agencies include the Directorate General of Electricity (Direktorat Jenderal Ketenagalistrikan, DJK) and the Directorate General of New and Renewable Energy and Energy Conservation (Direktorat Jenderal Energi Baru dan Terbarukan dan Konservasi Energi, EBTKE) within the Ministry of Energy and Mineral Resources (Kementerian Energi dan Sumber Daya Mineral, ESDM), the Ministry of State-Owned Enterprises (as the Government’s shareholder representative in PLN), the Ministry of Finance (as the administrator of public funding), the national legislature (Dewan Perwakilan Rakyat, DPR) (as the approver of public funding), provincial governments, PLN and prospective private sector suppliers (for market sounding).
1.4 METHODOLOGY
The methodology applied for this study builds on previous ADB and World Bank studies on geospatial electricity planning in Indonesia. World Bank financed an electricity access plan for the provinces of Maluku, Maluku Utara and Nusa Tenggara Timur (NTT) using geospatial methods that was completed in 2014. ADB financed a more detailed plan for the island of Sumba also in 20149. The analysis conducted under this activity greatly
9 The “Least-Cost Electrification Plan for the Iconic Island” may be downloaded from http://sumbaiconicisland.org/unduh/ or http://castlerockasia.com/sumba/sii.html.

1. Introduction. . ..
1-4
Least-Cost Electrification Plan for Papua, Papua Barat, Maluku and Maluku Utara – December 2017
improves upon that earlier work by (i) using rooftop tagging to determine the actual geospatial distribution of population, and (ii) updating inputs based on experience with energy demand, improvements in off-grid technologies, and changes in energy costs. Appendix B compares in detail the approach applied here to the previous studies.
Exhibit 1.1 shows the five-step approach used for preparation of the least-cost plan. It starts with rooftop tagging (i.e. the geolocation of households based on satellite imagery). These individual tags are then aggregated into clusters or settlements that can be served by low-voltage (LV) reticulation. Each settlement is represented by a single point (“node”) that is characterized by settlement population and geolocation. Existing medium-voltage (MV) lines are then geolocated. Next the performance and unit costs of the three supply options are compiled, and a demand model is developed that calculates settlement electricity demand based on population, economic growth and population growth. This information is then entered into Network Planner10, a model developed by The Earth Institute of Columbia University, which uses an optimization algorithm to determine the least-cost means to serve each settlement that does not yet have electricity.
Exhibit 1.1: Analytical Approach to Plan Formulation
The detailed work flow entails the following tasks, as shown in Exhibit 1.2: 1. A software application was developed that enables users to tag rooftops on
publicly available satellite imagery from Google Earth, Bing Maps and HERE Maps, and saves the geo-coordinates to a file. The application allows three types of rooftops to be identified: smaller than a household (e.g. an animal shed), likely to be a household, and larger than a household (e.g. a school or place of worship).
2. Personnel were then trained in the use of the software application. These included students from PLN’s Technical College as well as geography students from University of Indonesia.
3. These personnel then carried out the roof top tagging…. 4. ….and the results were checked for quality by the team’s senior GIS specialist.
Errors were returned to the tagging team for correction. 5. Once the integrity of the rooftop tags has been confirmed, the individual tags must
be aggregated into settlements consisting of groups of households that can be served by LV reticulation, i.e. no more than approximately 3 km in diameter. This is done by manually testing “proximity criteria” of various distances. The “proximity criterion” is the maximum distance from one rooftop tag to the next closest one such that if the actual distance is shorter than the proximity criterion then the two tags are aggregated into the same settlement.
6. The selected proximity criterion is then applied through a rooftop tag aggregation algorithm to identify settlements. Each of these settlements are then represented by a single point node located at the centroid of the aggregation and characterized by the geographical coordinates and population of the settlement.
10 Further information on Network Planner is available at http://qsel.columbia.edu/network-planner/. The model itself can be accessed at http://optimus.modilabs.org.
Opti iza‐tio
U it Costi g & De a d
Fore asti g
Ide tifi atio of e isti g assets
Settle e t deli eatio
Rooftop taggi g
Least‐ ost ele trifi atio
pla
1. Introduction. . ..
1-5
Least-Cost Electrification Plan for Papua, Papua Barat, Maluku and Maluku Utara – December 2017
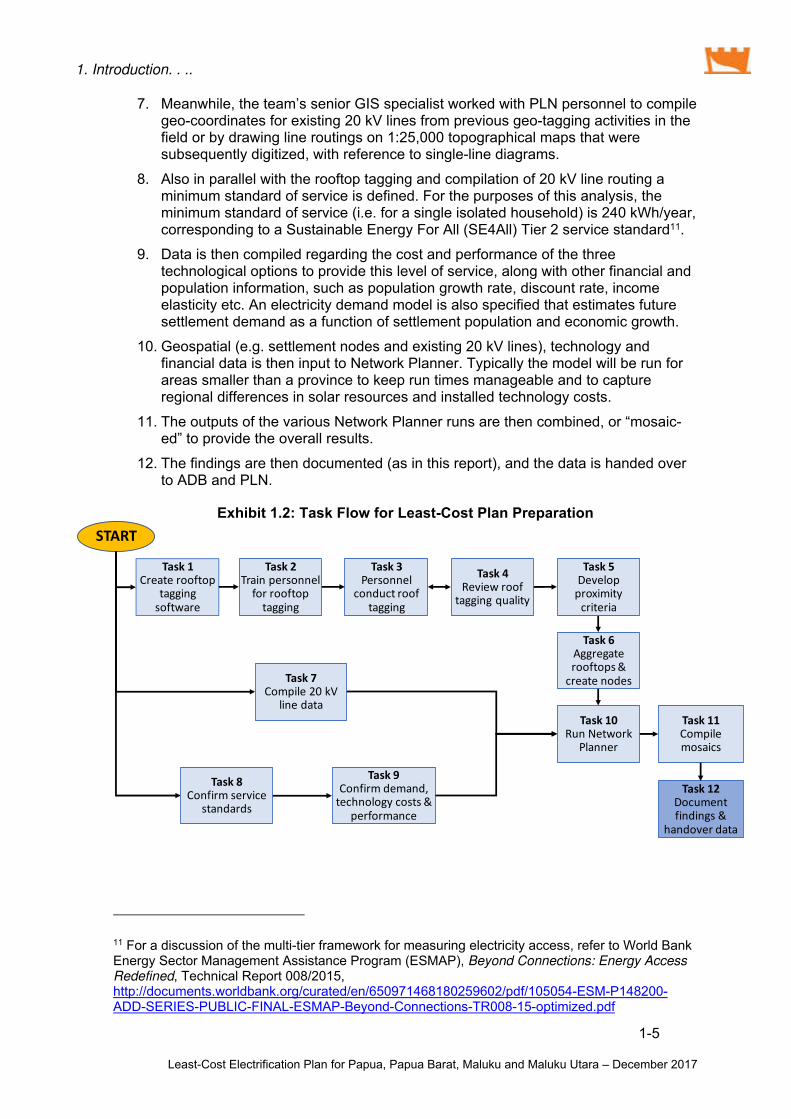
7. Meanwhile, the team’s senior GIS specialist worked with PLN personnel to compile geo-coordinates for existing 20 kV lines from previous geo-tagging activities in the field or by drawing line routings on 1:25,000 topographical maps that were subsequently digitized, with reference to single-line diagrams.
8. Also in parallel with the rooftop tagging and compilation of 20 kV line routing a minimum standard of service is defined. For the purposes of this analysis, the minimum standard of service (i.e. for a single isolated household) is 240 kWh/year, corresponding to a Sustainable Energy For All (SE4All) Tier 2 service standard11.
9. Data is then compiled regarding the cost and performance of the three technological options to provide this level of service, along with other financial and population information, such as population growth rate, discount rate, income elasticity etc. An electricity demand model is also specified that estimates future settlement demand as a function of settlement population and economic growth.
10. Geospatial (e.g. settlement nodes and existing 20 kV lines), technology and financial data is then input to Network Planner. Typically the model will be run for areas smaller than a province to keep run times manageable and to capture regional differences in solar resources and installed technology costs.
11. The outputs of the various Network Planner runs are then combined, or “mosaic-ed” to provide the overall results.
12. The findings are then documented (as in this report), and the data is handed over to ADB and PLN.
Exhibit 1.2: Task Flow for Least-Cost Plan Preparation
11 For a discussion of the multi-tier framework for measuring electricity access, refer to World Bank Energy Sector Management Assistance Program (ESMAP), Beyond Connections: Energy Access Redefined, Technical Report 008/2015, http://documents.worldbank.org/curated/en/650971468180259602/pdf/105054-ESM-P148200-ADD-SERIES-PUBLIC-FINAL-ESMAP-Beyond-Connections-TR008-15-optimized.pdf
Task Create rooftop
taggi g soft are
Task Trai perso el for rooftop taggi g
Task Perso el o du t roof taggi g
Task Revie roof
taggi g uality
Task 7Co pile kV
li e data
START
Task Develop pro i ity riteria
Task Aggregate rooftops & reate odes
Task Co fir servi e
sta dards
Task Co fir de a d, te h ology osts &
perfor a e
Task Ru Net ork
Pla er
Task Co pile osai s
Task Do u e t fi di gs &
ha dover data
1. Introduction. . ..
1-6
Least-Cost Electrification Plan for Papua, Papua Barat, Maluku and Maluku Utara – December 2017
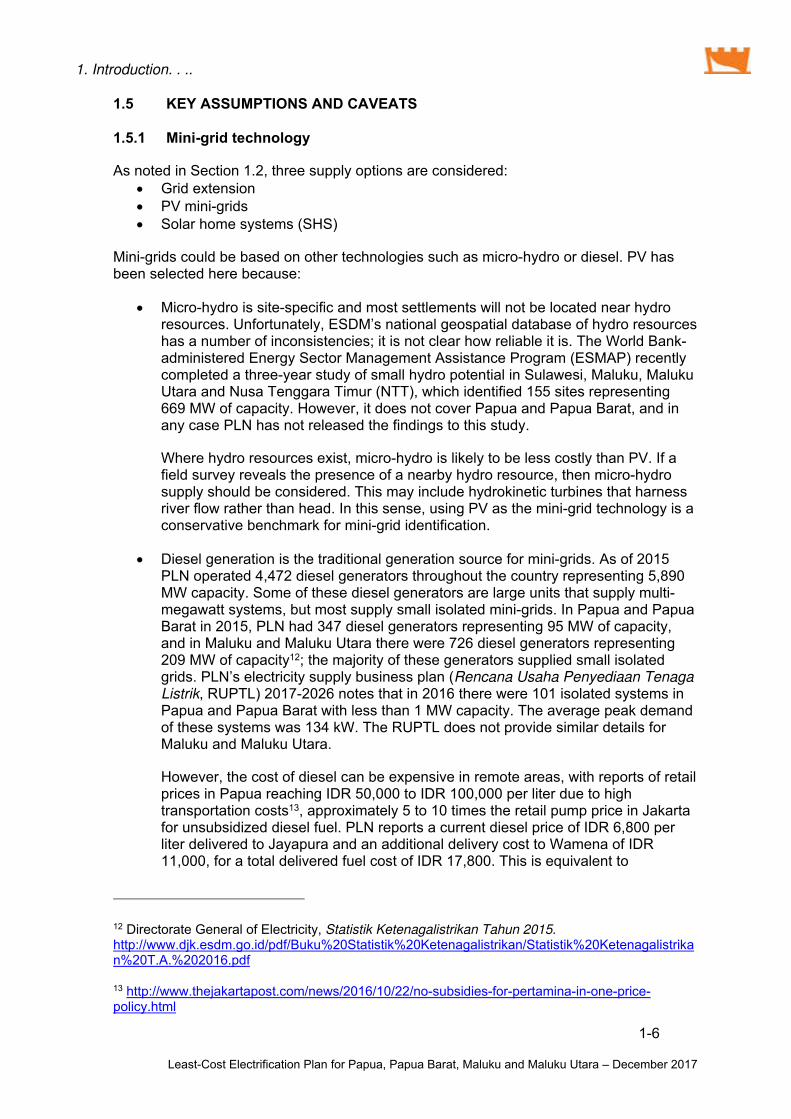
1.5 KEY ASSUMPTIONS AND CAVEATS
1.5.1 Mini-grid technology
As noted in Section 1.2, three supply options are considered: Grid extension PV mini-grids Solar home systems (SHS)
Mini-grids could be based on other technologies such as micro-hydro or diesel. PV has been selected here because:
Micro-hydro is site-specific and most settlements will not be located near hydro resources. Unfortunately, ESDM’s national geospatial database of hydro resources has a number of inconsistencies; it is not clear how reliable it is. The World Bank-administered Energy Sector Management Assistance Program (ESMAP) recently completed a three-year study of small hydro potential in Sulawesi, Maluku, Maluku Utara and Nusa Tenggara Timur (NTT), which identified 155 sites representing 669 MW of capacity. However, it does not cover Papua and Papua Barat, and in any case PLN has not released the findings to this study.
Where hydro resources exist, micro-hydro is likely to be less costly than PV. If a field survey reveals the presence of a nearby hydro resource, then micro-hydro supply should be considered. This may include hydrokinetic turbines that harness river flow rather than head. In this sense, using PV as the mini-grid technology is a conservative benchmark for mini-grid identification.
Diesel generation is the traditional generation source for mini-grids. As of 2015 PLN operated 4,472 diesel generators throughout the country representing 5,890 MW capacity. Some of these diesel generators are large units that supply multi-megawatt systems, but most supply small isolated mini-grids. In Papua and Papua Barat in 2015, PLN had 347 diesel generators representing 95 MW of capacity, and in Maluku and Maluku Utara there were 726 diesel generators representing 209 MW of capacity12; the majority of these generators supplied small isolated grids. PLN’s electricity supply business plan (Rencana Usaha Penyediaan Tenaga Listrik, RUPTL) 2017-2026 notes that in 2016 there were 101 isolated systems in Papua and Papua Barat with less than 1 MW capacity. The average peak demand of these systems was 134 kW. The RUPTL does not provide similar details for Maluku and Maluku Utara.
However, the cost of diesel can be expensive in remote areas, with reports of retail prices in Papua reaching IDR 50,000 to IDR 100,000 per liter due to high transportation costs13, approximately 5 to 10 times the retail pump price in Jakarta for unsubsidized diesel fuel. PLN reports a current diesel price of IDR 6,800 per liter delivered to Jayapura and an additional delivery cost to Wamena of IDR 11,000, for a total delivered fuel cost of IDR 17,800. This is equivalent to
12 Directorate General of Electricity, Statistik Ketenagalistrikan Tahun 2015. http://www.djk.esdm.go.id/pdf/Buku%20Statistik%20Ketenagalistrikan/Statistik%20Ketenagalistrikan%20T.A.%202016.pdf
13 http://www.thejakartapost.com/news/2016/10/22/no-subsidies-for-pertamina-in-one-price-policy.html

1. Introduction. . ..
1-7
Least-Cost Electrification Plan for Papua, Papua Barat, Maluku and Maluku Utara – December 2017
approximately USD 1.34/li. Delivery to more remote locations that do not yet have electricity supply would likely be higher. Although not as acute as in Papua, fuel transportation costs in Maluku and Maluku Utara can add 15% to 40% to fuel prices, especially for smaller islands without dedicated fuel handling facilities. Consequently, PLN states in the RUPTL 2017-2026 that part of its generation development strategy is to minimize the use of diesel and increasingly utilize renewable energy.
Hybrid diesel-PV systems have not been considered in this study, but may be candidates for the new isolated 20 kV systems identified by this analysis. As discussed in Section 5.3, this study identifies 81 such systems in Papua and Papua Barat. These are collections of settlements for which Network Planner has determined it is less costly to connect to one another by 20 kV on the assumption that the cost of energy is the same as on the existing grids. However, because these are typically remote settlements, the cost of energy is expected to be higher than for the existing grids due to the cost of fuel transport. Hybrid systems could perhaps be least-cost for these settlements by displacing a portion of costly fuel consumption.
Exhibit 1.3 compares the levelized cost of electricity from PV and diesel systems for isolated settlements as a function of the number of households served. The model underlying this analysis is presented in Appendix C and compared ESDM PV mini-grid systems. The “high” and “low” PV costs represent the range of PV mini-grid costs considered in this report, which are principally a function of insolation and site accessibility; for example, “high” PV costs should be compared to diesel systems with higher fuel costs. This analysis considers only generation costs, and does not take into account distribution and connection costs, nor the costs of project development, as these are expected to be the same regardless of the generation technology used. At higher diesel costs of USD 1.40/li and above, such as expected in remote areas of Papua and Papua Barat, PV offers a cost advantage even at the relatively low international market prices that currently prevail for diesel.
Exhibit 1.3: Comparison of Diesel and PV Mini-grid Generation Costs
.
.
.
.
.
.
.
.
.
No
ial LC
OE, U
SD/kWh
Nu er of Households i Settle e t ServedPV Lo PV High Diesel USD . /li
Diesel USD . /li Diesel USD . /li

1. Introduction. . ..
1-8
Least-Cost Electrification Plan for Papua, Papua Barat, Maluku and Maluku Utara – December 2017
1.5.2 Data and modelling
The analysis presented in this report is based on data and modelling that faces certain limitations or caveats as described below:
1. With respect to the rooftop tagging data:
a. The imagery used is typically 1 to 3 years old, and is continually being updated on the respective websites. Imagery available tomorrow may differ from the imagery used for this analysis, and current or future settlement patterns may vary somewhat from the data used here.
b. The rooftop tags have not been ground truthed. While in most cases houses can be clearly identified, no doubt there are cases in which houses have been mis-identified as other types of buildings or vice versa. However, as discussed in Section 2.3, the results align well with population data from other sources, indicating that mis-identification is not a serious problem.
c. As discussed in Section 2.2, not all free imagery is useable. Sometimes settlement patterns are inferred, as described in that section. Imagery could be purchased to overcome this.
2. With respect to the technology cost and performance data:
a. Technology cost and performance parameters are defined separately for each of the PLN operating areas described in Section 2.1. However, within each of these areas actual technology capital and operating costs and the available insolation for any given site may vary.
b. Technology cost data used here represents current costs. Future costs for PV panels and batteries may be lower; fuel prices could be higher.
3. With respect to the Network Planner modelling:
a. The only supply options considered are grid extension, PV mini-grids and solar home systems. The selection of PV for the mini-grids rather than some other generating technology is discussed above in Section 1.4.
b. The analysis does not assess the additional investment in transmission that may be required to meet the new demand arising from electrification through grid extension. Given the relatively small, fragmented nature of grids in the targeted provinces, the bulk of network investment will be in MV and LV lines14, and these costs are explicitly taken into account in the analysis. Transmission investment to support electrification is unlikely to be
14 The only existing transmission system in Papua and Papua Barat is a 70 kV system to supply Jayapura from a hydro project, otherwise networks operate at 20 and 0.4 kV. According to RUPTL 2017-2026, PLN is planning 150 kV systems for the Wamena area of the Papuan highlands in 2023, areas around Jayapura and Timika in 2018-2020, areas around Sorong in 2018 and areas around Manokwari in 2019-2023. For Papua and Papua Barat combined PLN plans to add 1,046 km of transmission lines between now and 2026, compared to additions of 7,287 km of MV lines and 17,887 km of LV lines.

1. Introduction. . ..
1-9
Least-Cost Electrification Plan for Papua, Papua Barat, Maluku and Maluku Utara – December 2017
significant in Maluku and Maluku Utara due to the archipelagic nature of these provinces.
c. Grid energy available for consumption is valued at PLN’s accounting cost (biaya pokok produksi, BPP) for generation within the PLN’s operating areas in Papua and Papua Barat, and on islands with more than 2,500 households in Maluku and Maluku Utara. However, BPP is based on depreciation rather than financing costs, and hence may not represent the true cost of generation to PLN. It is also based on average production-weighted fuel costs, and hence does not accurately represent the cost of supply for remote, isolated grids. Moreover, the future generation mix and cost structure may vary from historical composition. Finally, using an energy-only cost to represent generation does not capture capital investment requirements. Regions with low electrification ratios such as Papua may require substantial investment in additional generating capacity to electrification targets. These future generation costs could be better assessed through preparation of a complementary least-cost generation expansion plan15.
d. For grid extension, all new line distances are assumed to be straight line. In reality, lines typically follow roads, or must otherwise navigate mountains, rivers, lakes and other geophysical features. This can be addressed by placing a multiplier on line costs such that on average straight-line costs represent actual point-to-point line costs.
e. The model does not take into account the cost of or scope for in-fill connections (i.e. connecting households that are in areas that already have access to LV supply). Rather, the model seeks to determine the least-cost means of supplying areas with no access whatsoever. The focus of this analysis is on areas of new supply rather than in-fill.
f. Network Planner is an economic, not engineering, model. While it does estimate the demand at any given node, and associated mini-grid, SHS or grid MV/LV transformer capacity to serve that node, it does not determine conductor sizes or line losses. It may be that higher voltages are required to serve some settlements identified as candidates for grid connection. This can be addressed by conducting load flow and other network planning studies based on Network Planner results, as was done in the Sumba work. Further studies will of course be necessary for engineering design of the supply investments identified here.
Despite these limitations and caveats, the use of Network Planner with the data that has been compiled is well-suited to achieving the objectives enumerated in Section 1.2.
15 Work conducted by ADB for the island of Sumba under ADB TA 8287-INO: Scaling Up Renewable Energy Access in Eastern Indonesia used Network Planner to determine electrification modalities to achieve 95% electrification. Based on this a load forecast was prepared for the grid, which in turn was used for a least-cost generation expansion plan. Given that the Network Planner results showed the locations and quanta of future loads and that the generation expansion plan identified the locations of new and existing generation, a load flow analysis was then carried out to determine transmission investment needs to connect generation with loads. A detailed “least-cost plan” report presenting the complete analysis may be downloaded from http://castlerockasia.com/sumba/sii.html as an example of a fully integrated planning approach.

1. Introduction. . ..
1-10
Least-Cost Electrification Plan for Papua, Papua Barat, Maluku and Maluku Utara – December 2017
1.5.3 Exclusion of Non-PLN Kabupaten in Papua
There are nine kabupaten in Papua that until this year have had no PLN supply. Apart from any self-generation, local governments have been the only sources of electricity supply in these kabupaten. Exhibit 1.4 shows the coverage of PLN operating areas in Papua and Papua Barat, the 20 kV systems within these areas, and the kabupaten that until now have been unserved by PLN. Note that PLN Area Manokwari crosses the provinces of Papua and Papua Barat.
In the absence of site visits, data on local government generation or existing 20 kV networks (if any exist) in the areas unserved by PLN is unavailable. Since existing MV lines are an important input to Network Planner, it was not possible to include these areas in the analysis. Moreover, the principal focus of this study is to assess the scope for extension of the PLN grid relative to PV mini-grid and SHS options so that these areas that have not been served by PLN until now are longer term candidates for PLN electrification. Finally, as discussed further in Section 2.2, these non-PLN kabupaten where characterized by poor imagery. As a result of these factors, the results presented in this report exclude these nine kabupaten.
Exhibit 1.4: PLN Operating Regions and Kabupaten Not Served by PLN

2-1
Least-Cost Electrification Plan for Papua, Papua Barat, Maluku and Maluku Utara – December 2017
2. ROOFTOP TAGGING
2.1 DATA SOURCES AND PROCESSING
The land areas of Papua and Papua Barat are 319,030 km2 and 99,665 km2 respectively. Excluding the nine kabupaten in Papua currently unserved by PLN, this analysis covers a land area of 350,400 km2. This area is slightly smaller than all of Sumatera, about the same size as Germany, and significantly larger than the state of California. The land areas of Maluku and Maluku Utara are 46,914 km2 and 31,982 km2 respectively.
Electrification planning requires knowledge of where people live. Previous electrification planning efforts for eastern Indonesia such as Program Indonesia Terang (PIT) relied on desa-level administrative boundaries and population statistics to represent the geospatial distribution of households. The Central Statistics Agency (Badan Pusat Statistik, BPS reports that as of 2015 there were 4,293 and 1,531 desa in Papua and Papua Barat, respectively16. BPS reported 1,149 and 1,181 desa in Maluku and Maluku Utara, respectively.
A desa is the smallest government administrative unit in Indonesia. Although desa is commonly translated into English as “village”, the meaning of these two terms is quite different: “village” connotes a single rural settlement of households in close proximity, whereas a desa typically contains many settlements. Desa in Papua and Papua Barat range in size up to 3,030 km2, with an average of 79 km2. In terms of number of households, desa in Papua and Papua Barat range from just a few households to 8,294, with an average of 166 households consisting of 770 people.
If the average size desa is represented as a circle, the radius of that circle would be approximately 5 km. This is farther than LV reticulation can normally be extended, hence grid service across a typical desa will require MV lines. Alternatively, assuming that all households within a desa are concentrated at a single point artificially aggregates households into fewer settlements than exist in reality. This creates a systematic bias towards grid extension. Consequently, desa-level statistics do not provide the granularity required for electrification planning.
Therefore, to avoid ambiguity this report does not refer to “villages”, but rather desa or “settlements” depending on whether the reference is to the smallest government administrative unit or to clusters of households that can be served by LV reticulation.
The availability of free, fairly high-resolution and recent satellite imagery through such on-line sources as Google Earth, Bing Maps and HERE Maps provides an alternative source of data on the geospatial distribution of population. All of these sources utilize imagery from the same set of remote sensing satellites, but acquisition dates vary between them for any particular area.
Extracting population data from satellite imagery is a process of identifying households by their distinctive color and shape, or “signature”, as viewed from above. However, households are not the only structures in rural areas. Households must be distinguished from livestock pens, schools, places of worship and government offices. Moreover, household signatures vary depending on cultural and societal norms, available building
16 The number of desa increases yearly as the population grows and existing desa are split into new ones. For example, in 2012, the most recent year for which desa boundaries are available as geospatial data (.shp) files from BPS, there were 3,561 desa in Papua and 1,436 in Papua Barat.

2. Rooftop Tagging. . ..
2-2
Least-Cost Electrification Plan for Papua, Papua Barat, Maluku and Maluku Utara – December 2017
materials, welfare levels, etc. Even within a region of cultural and geophysical uniformity, traditional and modern housing styles may co-exist with very different signatures.
Machine learning has been applied to this problem with good results17. However, this requires preparation of training sets for image processing and the derivation of rules that are then applied in an automated process. Given the resources available to this study and the variability in image quality and housing signatures across the area covered here, a manual process of rooftop tagging was adopted as a lower risk approach.
A software application was created in the programming language Python that saves to a local file the coordinates of any point that a user may click on while viewing imagery from Google Earth, Bing Maps or HERE Maps. Moreover, the app provided for three types of structures: smaller than a household (e.g. a livestock pen), probably a household, and larger than a household (e.g. a school or place of worship). Exhibit 2.1 shows how these distinctions would be made, with the blue ring designating a structure smaller than a household, the yellow rings designating likely households, and the red rings designating structures larger than households.
Exhibit 2.1: Example of Structure Differentiation in the Wamena Area
Engineering students from the PLN technical college (Sekolah Tinggi Teknik PLN, STT PLN) and geography students from University of Indonesia were trained in the use of the tagging app and assigned areas to cover. If one source of imagery was not of sufficient quality to facilitate tagging, the tagger would check data from one of other two sources. The STT PLN students worked as part of PLN’s contribution to the project, while the University of Indonesia students were paid on a per-tag basis. A tagger could typically complete 400 tags per hour.
The imagery for Papua Barat was accessed during the period July-August 2016, and the imagery for Papua was accessed October-November 2016. Imagery for Maluku and Maluku was accessed during the period February-March 2017. Most of this imagery was 1
17 For example, see Varshney KR, Chen GH, Abelson B, Nowocin K, Sakhrani V, Xu L, Spatocco BL (2015) Targeting villages for rural development using satellite image analysis. Big Data 3:1, 41–53, DOI: 10.1089/big.2014.0061.

2. Rooftop Tagging. . ..
2-3
Least-Cost Electrification Plan for Papua, Papua Barat, Maluku and Maluku Utara – December 2017
to 3 years old, and in no case was it older than 5 years. Because these publicly available sources of satellite imagery are continually being updated with more recent imagery, the imagery that is currently available on-line may differ from what was used in this study.
Taggers would periodically upload their geo-coordinate files to the cloud and the team’s senior GIS specialist would check the results for quality. Files missing areas or with incorrect tags were returned for re-work.
2.2 IMAGE QUALITY ISSUES
The availability of imagery from three different sources helped overcome many problems with image quality or age. Exhibit 2.2 compares imagery from each of the three sources for the Dogiyai area of Papua to show the range of quality that could exist for a particular area. In this case the combination of HERE and Bing provided the best coverage.
Exhibit 2.2: Imagery Quality Varied Between Sources

2. Rooftop Tagging. . ..
2-4
Least-Cost Electrification Plan for Papua, Papua Barat, Maluku and Maluku Utara – December 2017
In some cases, the availability of imagery from multiple sources helped ensure the use of the most recent imagery. Exhibit 2.3 compares imagery from the Merauke area of Papua showing that although both of comparable quality, the Bing imagery is more recent.
However, in some regions none of the three sources offered imagery of adequate quality for tagging. If the imagery was clear enough to discern settlement patterns but not individual rooftops, a “cartometric method” was applied to infer the geospatial distribution of households. With this approach, known settlement patterns are filled into these low resolution settlement areas. Results were subsequently confirmed against desa-level population data and BPS 1:50,000 maps (though they are of limited use because settlement data on these maps is approximately 20 years old).
Exhibit 2.3: Imagery Age Varies Between Sources for Any Given Location
Exhibit 2.4 shows an application of the cartometric method in the Nabire area of Papua. The blue dots show the original rooftop tags, the yellow area the settlement with low resolution imagery, and the red dots the rooftop tags that were ultimately used by inferring rooftop where low resolution settlement patterns can be seen.

2. Rooftop Tagging. . ..
2-5
Least-Cost Electrification Plan for Papua, Papua Barat, Maluku and Maluku Utara – December 2017
Exhibit 2.4: Example of the Cartometric Method to Infer Rooftops
2.3 TAGGING RESULT ACCURACY
The rooftop tagging identified 473,180 households in the kabupaten of Papua where PLN currently operates, 80,010 in the non-PLN kabupaten, and 217,374 households in Papua Barat. Exhibit 2.5 shows a summary map of these tags.
These results were then compared to government population data at the desa and kabupaten levels to assess the accuracy of the rooftop tagging. Population data is available from three sources. The differences in these data sources is summarized in Exhibit 2.6:
The Potensi Desa (PODES, Desa Potential) survey conducted by Badan Pusat Statistik (BPS, Central Statistics Agency). The 2014 PODES data was used by PIT and is referenced here.
The civil records compiled from local government by Ministry of Home Affairs (MoHA), as of 2015.
The Survei Penduduk Antar Sensus (SUPAS, Between-Census Population Survey) conducted by BPS in 2015.

2. Rooftop Tagging. . ..
2-6
Least-Cost Electrification Plan for Papua, Papua Barat, Maluku and Maluku Utara – December 2017
Exhibit 2.5: Rooftop Tags for Papua and Papua Barat
Exhibit 2.6: Sources of Population Data
Purpose
Age
Defi itio of Household
Data Colle tio Method
Period of Co pilatio
Date of Release ‐Nov‐ Nov‐ De ‐
‐ May
Civil registratio of vital a tivity su h as death, irth, igratio reported to desa ad i istratio
A ually
Dire t i tervie ith kepala desa/lurah/ agari , desa
‐ April
MoHA
Legal registratio a d re og itio of desa y Mi istry of Ho e
Affairs
Regio al Offi e of Civil Registry a d Populatio Duk apil a d
MoHA
S allest u it i a o u ity, hi h o sists of hus a d, ife,
hildre a d other fa ily e ers a u lear fa ily
Dire t i tervie ith HH sa ple , HH atio ide
PODES
A alysis of e o o i pote tial of desa atio ide, a d to prepare E o o i Ce sus to ide tify e o o i se tors a d su se tors
BPS
S allest u it i a o u ity hi h o sists of hus a d & ife; or hus a d, ife a d their hildre ; or father a d his hildre ; or other a d her
hildre .
SUPAS
Mid‐ter survey et ee ivil e sus o du ted every years to esti ate total populatio a d
de ografi i di ators
BPS
A group of people that lives together i a stru ture a d eats
fro the sa e kit he .

2. Rooftop Tagging. . ..
2-7
Least-Cost Electrification Plan for Papua, Papua Barat, Maluku and Maluku Utara – December 2017
PODES data was used by P2EBT for designing the PIT. However, PODES data is compiled through interviews with the kepala desa or other civil servants, rather than through a census or sample survey of households. BPS’s technical documentation for PODES states explicitly that the data should not be used for population estimates18.
The MoHA data counts nuclear families (keluarga inti) based on civil records. Given that civil records in remote areas may be incomplete and that there may be more than one nuclear family living in a home, this data is also of questionable usefulness.
The SUPAS data on the other hand uses a statistically-based sample survey to estimate population and the number of households between the national census that is conducted every ten years. In SUPAS, a household is a group of people that take meals from a common kitchen, which is closer to the definition of a household to be electrified. It is the principal reference used here. The discrepancy between SUPAS and PODES by kabupaten is shown in Exhibit 2.7 in percentage terms. In some kabupaten in Papua and Papua Barat the discrepancy exceeds 80% further indicating the unreliability of the PODES data for electrification planning purposes.
Exhibit 2.7: Population Discrepancy Between SUPAS and PODES
18 BPS, Penjelasan Teknis PODES 2014 (Technical Clarifications for PODES 2014), states in Chapter 4: Data Yang Tidak Diseminasikan (Data That Is Not Disseminated), p. 60, that the accuracy of data such as population taken from administrative records or resource person estimates cannot be ensured, therefore if such data is used there is the potential to cause errors in interpretation of the data use. (“Beberapa variabel seperti luas wilayah dan jumlah penduduk dikumpulkan dari catatan administrasi atau hasil perkiraan narasumber yang tidak dapat dipastikan akurasi datanya, sehingga apabila digunakan akan berpotensi menyebabkan kesalahan interpretasi penggunaan datanya”).

2. Rooftop Tagging. . ..
2-8
Least-Cost Electrification Plan for Papua, Papua Barat, Maluku and Maluku Utara – December 2017
217,374 household rooftop tags were identified in Papua Barat compared to 208,148 households estimated by SUPAS, so that the actual number of households estimated by SUPAS were within 4.2% of the number of household rooftop tags. It is estimated that approximately 5% of the population of Papua Barat lives in areas where satellite imagery from the sources used here was not of sufficient quality to allow for rooftop tagging.
In the portion of Papua currently served by PLN, there were 473,180 household tags compared to a SUPAS estimate of 520,120. This is also less than a 10% variance between tagging results and SUPAS. Approximately 6.1% of households (as counted by SUPAS) in this area was located in areas with poor image quality.
In contrast, in the kabupaten not currently served by PLN, there were only 80,010 rooftop tags compared to a SUPAS estimate of 211,778 households. This is largely due to the poor quality of satellite imagery in this region; approximately 53% of SUPAS households within these kabupaten are located in areas with poor image quality.
The breakdown of rooftop tagging accuracy by kabupaten is shown in Exhibit 2.8. This exhibit shows the ratio of household counts from SUPAS (i.e. BPS PBDT), PODES and MoHA to rooftop tags for each kabupaten in Papua and Papua Barat. With the exception of Kabupaten Nduga, the kabupaten with the greatest discrepancies are located in the highlands area not currently served by PLN. Note also the variation in population estimates between data sources for these areas. This is indicative of the region’s remote location and the difficulty of conducting field operations there.
Exhibit 2.8: Comparison of Rooftop Tagging and Survey Results by Kabupaten
.
.
.
.
.
.
.
.
.
Ratio
of R
eported Po
pulatio
to Ta
gs
Dis repa y et ee BPS PBDT a d tags Dis repa y et ee BPS Podes a d tagsDis repa y et ee MoHA a d Tags No ‐PLN Ka upate
2. Rooftop Tagging. . ..
2-9
Least-Cost Electrification Plan for Papua, Papua Barat, Maluku and Maluku Utara – December 2017
Overall, in regions where approximately 95% of the population lives in areas with satellite imagery good enough to facilitate rooftop tagging, manual rooftop tagging yields household counts that are within ±10% of the best available population data. Some of this discrepancy is no doubt due to the differences in counting households in the small areas with poor satellite imagery. In any case, rooftop tagging for Papua and Papua Barat using free satellite imagery appears to offer a reliable basis for household identification and electrification planning on a regional scale.
Based on available population data19, similar accuracy was achieved in Maluku and Maluku Utara. Usable imagery available for more than 95% of the land area of these provinces. For Maluku, rooftop tags were only 6% below the number of households reported by BPS for 2015, while for Maluku Utara rooftop tags were 10% below the number of households reported by BPS.
19 BPS, Maluku dan Maluku Utara dalam Angka 2016.

3-1
Least-Cost Electrification Plan for Papua, Papua Barat, Maluku and Maluku Utara – December 2017
3. SETTLEMENT IDENTIFICATION AND DEMAND FORECASTING
3.1 SETTLEMENT DEFINITION
The population size and geospatial distribution of settlements (rather than simply individual households) are key determinants of the least-cost means to supply households in any given region.
Size is important because total demand per consumer increases as settlement size increases, because larger settlements are characterized by greater economic activity. This affects technology selection since different electricity supply technologies typically benefit in varying degrees from economies of scale, i.e. decreasing unit costs of supply as total demand increases.
Geospatial distribution is important because of the physical characteristics of grid extension. The supply of larger loads over longer distances requires higher voltage levels to prevent unacceptable voltage drop or energy losses.
For the purposes of this analysis, a “settlement” is a collection of households that can be served solely by LV reticulation. In reality, the geographical extent of a settlement so defined depends on settlement specific characteristics such as load density as well as conductor types and sizes. However, as a general guideline this analysis assumes that a settlement should not exceed approximately 3 km in diameter, so that if an MV/LV transformer is placed at the center of the settlement the radial distance of LV lines will not exceed 1.5 km.
This formulation facilitates the application of Network Planner, as discussed further in Chapter 5. Network Planner calculates the cost of grid extension to a given settlement as the sum of the following parameters:
The length of MV line required assuming a straight-line distance from the nearest settlement with existing MV grid;
The cost of the MV/LV transformer for that settlement, sized to serve settlement load;
The cost of LV reticulation and household connections within the settlement based on the number of households in the settlement and the defined unit cost per household; and
The cost of energy supplied.
3.2 PROXIMITY ANALYSIS AND SETTLEMENT NODES
The challenge, then, is to define an algorithm that aggregates individual households into settlements. This algorithm can then be applied using a geographical information system (GIS) to demarcate settlements, which can then be represented as single-point nodes. Those nodal locations and populations will then be combined with existing MV line routes in the geospatial data file (.shp file) that is subsequently uploaded to Network Planner.
The simplest algorithm for this purpose aggregates households based on their proximity to one another. The maximum distance such that two households are aggregated into the same settlement is referred to as the “proximity criterion”. It is necessary to test various proximity criteria to ensure that the resulting settlements are generally no larger than 3 km in diameter. Modelling experience in eastern Indonesia suggests a proximity criterion somewhere in the range of 300 to 500 m. The appropriate proximity criterion will be a function of geospatial settlement patterns, and therefore will depend on cultural, social and geophysical conditions that vary region to region. Denser settlements will allow a

3. Settlement Identification and Demand Forecasting
3-2
Least-Cost Electrification Plan for Papua, Papua Barat, Maluku and Maluku Utara – December 2017
lower proximity criterion, whereas greater dispersion amongst households will usually call for a higher proximity criterion.
Once an appropriate proximity criterion has been defined and households aggregated into settlements accordingly, the aggregations are then represented by single nodes placed at the centroid of the settlement. These settlement nodes are characterized by the population and centroid geo-coordinates of the settlement. These nodes are considered by Network Planner as candidate locations for MV/LV transformers and the points along which any MV line extension would run.
Exhibit 3.1 shows the application of two different proximity criteria to the same set of households. The blue dots are individual household tags, the shaded polygons are the settlement aggregations and the red dots are the resulting nodes for the principal aggregations shown. The 300 m criterion defines two nodes for the households on the left, but when the MV system is extended to this area, only one MV/LV transformer would be needed to supply these households. In contrast, the 500 m criterion is more reasonable in that it defines only one node, consistent with the need for only one MV/LV transformer to serve this area. A 500 m proximity criterion was applied throughout the four provinces considered here.
Exhibit 3.1: Selecting a Proximity Criterion

3. Settlement Identification and Demand Forecasting
3-3
Least-Cost Electrification Plan for Papua, Papua Barat, Maluku and Maluku Utara – December 2017
For Papua Barat, the 217,374 household rooftop tags were aggregated into 1,519 nodes with a residual 1,830 isolated households. For the PLN areas of Papua, the 473,180 household tags were aggregated into 1,763 nodes with a residual of 2,123 isolated households. Manual adjustments were made to node placements for major towns and certain settlements where resulting centroids were placed in impractical locations such as the middle of a lake.
In Maluku, 368,735 household tags were aggregated into 1,333 nodes with a residual of 364 isolated households. In Maluku Utara, 251,145 household tags were aggregated into 1,084 nodes with a residual 954 isolated households.
Many settlement aggregations straddle administrative boundaries such as kabupaten, but the resulting nodes will be located exclusively in one administrative unit or the other. Where a node is placed depends on where the centroid of the settlement aggregation appears. Consequently, the population of any given administrative unit based on nodes in that unit may vary from the population for the unit reported from other sources.
Exhibit 3.2 maps all settlement nodes and 20 kV systems throughout Papua and Papua Barat (excluding kabupaten not served by PLN in 2016). Similar maps were prepared for Maluku and Maluku Utara, but due to the archipelagic nature of these provinces these maps are not reproduced here due to the scale required for legibility.
Exhibit 3.2: Settlement Nodes and 20 kV Systems in Papua and Papua Barat

3. Settlement Identification and Demand Forecasting
3-4
Least-Cost Electrification Plan for Papua, Papua Barat, Maluku and Maluku Utara – December 2017
A frequency analysis of the number of households per desa and the number of households per node further demonstrates the higher granularity of the rooftop tagging approach compared to a desa-based approach such as that had been used by PIT. Exhibit 3.3 presents histograms of desa and nodes by the number of households each contains. (The histogram of nodes excludes isolated households). Interestingly, there a number of desa in Papua and Papua Barat with fewer than 15 households. While the number of nodes is about the same as the number of desa (5,286 nodes versus 5,394 desa) the differences in these histograms indicates that in general settlements have smaller populations than desa. Reliance on desa for electrification planning overstates population clustering and results in a bias towards grid extension.
Exhibit 3.3: Histograms of Desa and Nodes by Number of Households
3.3 DEMAND FORECASTING
The sizing of electricity supply options for each settlement depends upon the electricity demand that is projected for each settlement. Network Planner can forecast demand separately for household and productive uses along with consumption for commercial, health, education and other public facilities. However, since data on commercial, health, education and public facilities is not readily available by settlement, total settlement demand (including non-household demand) for this study is projected solely on the basis of households in the settlement, taking into account population growth, income growth and income elasticity of demand.
The fundamental premise is that total electricity demand is a function of the population of a settlement (as represented by the number of households). This is intuitive because larger settlements are characterized by greater economic activity. On a per household basis, total electricity consumption will be greater in a settlement of 1,000 households than a settlement of 10 households because of far greater non-residential demand along with the higher household incomes that result from the higher level of economic activity.

3. Settlement Identification and Demand Forecasting
3-5
Least-Cost Electrification Plan for Papua, Papua Barat, Maluku and Maluku Utara – December 2017
Network Planner allows demand to be specified as a logistic, linear or combined logistic-linear function of the number of households in a settlement. In this case, the combined logistic-linear model is used. The logistic function is applied for settlements smaller than 2,500 households, and the linear function is used for settlements larger than 2,500 households.
The logistic portion of the demand function, i.e. for settlements smaller than 2,500 households has been specified taking into account the following:
Electricity sales data for seven PLN isolated diesel systems in Sumba, ranging in size from approximately 150 to 500 residential consumers, with average total system generation per residential consumer ranging from approximately 12 to 42 kWh/month;
Electricity sales data from a PV mini-grid serving approximately 50 households in the Sentani, Papua, at full cost recovery tariffs (i.e. exceeding USD 1.50/kWh). The system has been operating for nearly 3 years. The initial average consumption per residential consumer was approximately 10 kWh/month, which has increased to about 15 kWh/month with the addition of new loads such as streetlighting, increasing productive uses, greater household adoption of appliances other than lighting, etc.;
Average R-1 450 VA sales of 61 kWh/month/consumer in Papua, recognizing that the vast majority of these consumers live in towns and cities with higher income levels than consumers in remote rural areas; this figure therefore represents a consumption ceiling;
Exhibit 3.4 shows the logistic demand function for these smaller settlements, including the actually operating data from the seven PLN diesel mini-grids. For a single, isolated household, the corresponding annual consumption would be approximately 240 kWh/year.
Exhibit 3.4: Demand as a Function of Population for Smaller Settlements
The linear part of the demand function, i.e. for settlements larger than 2,500 households, is based on sales data for each of the sixteen 20 kV systems operating in Papua and Papua Barat. Exhibit 3.5 shows the regression relating total annual system demand to the number of residential consumers on each system.
,
,
,
,
, , , , ,
Aua
l Syste
Eergy De
ad / N
uer
of Reside
tial C
osu
ers, kW
h/HH
‐yr
Reside tial Co su ers i the Settle e t
Li ear Model Logisti Model PLN Isolated Syste Data

3. Settlement Identification and Demand Forecasting
3-6
Least-Cost Electrification Plan for Papua, Papua Barat, Maluku and Maluku Utara – December 2017
To validate the model, the geospatial database of nodes was overlaid with desa boundaries and information from PODES 2014 on estimated percentage of households served by PLN in each desa. When applied to that data, the combined logistic-linear demand model calculated total PLN sales for Papua and Papua Barat to within 5% of actual PLN sales. The same demand model was applied in Maluku and Maluku Utara.
Exhibit 3.5: Demand as a Function of Population for Larger Settlements
R² = .
y = . + .
,
,
,
,
,
,
, , , , , ,
Total A
ual Syste
Prod
utio
/ Nu
er of R
eside
tial Co
suers,
kWh/HH
‐yr
Nu er of Reside tial Co su ers o Syste

4-1
Least-Cost Electrification Plan for Papua, Papua Barat, Maluku and Maluku Utara – December 2017
4. TECHNOLOGY AND RESOURCE CHARACTERIZATION
Cost and performance characteristics for each of the three supply options must be defined within Network Planner. Because installed costs and solar resources vary throughout Papua and Papua Barat depending on accessibility and local climatic conditions, each of the following regions was characterized by its own cost and performance values:
1. PLN Area Sorong, 2. PLN Area Manokwari, excluding Kabupaten Nabire 3. Kabupaten Nabire 4. PLN Area Biak 5. PLN Area Timika 6. PLN Area Jayapura, excluding Kabupaten Jayawijaya 7. Kabupaten Jayawijaya 8. PLN Area Merauke, excluding Kabupaten Mappi 9. Kabupaten Mappi
Exhibit 1.4 indicates the location of each PLN area and kabupaten.
Appendix D provides the detailed Network Planner data entered for each of these regions, and presents further information regarding the meaning of these parameters and source of these input values. The characterization of each of the supply technologies is summarized below.
Whereas Papua and Papua Barat are largely contiguous land masses, Maluku and Maluku Utara are archipelagic. The analysis for these provinces was therefore conducted by island. There are 126 settled islands or groups of proximate islands within these two provinces. These were classified as follows; Appendix E presents details by island:
44 islands with no PLN supply; 39 islands that have been fully supplied by PLN or community systems (e.g.
supplied by national or regional government) in the sense that all settlement nodes are within the 1.5 km buffer of existing 20 kV lines, or that every settlement has supply. There may be households on these islands that are not connected to PLN, but this is an issue of promoting in-fill and not an issue of rural electrification;
24 islands with fewer than 2,500 households that have a mix of settlements, some within the existing grid buffer, others outside that are unserved by PLN; and
19 islands with more than 2,500 households that have a mix of electrified and unelectrified settlements.
Islands with mixed electrified and unelectrified settlements were disaggregated into populations less than or greater than 2,500 households to reflect the additional costs of fuel delivery to islands without dedicated fuel handling facilities. The threshold of 2,500 households is based on review of satellite imagery for a sample of a dozen islands from across all classes and of various populations to identify dedicated fuel handling facilities such as tank farms and tanker offloading jetties. Islands of less than 2,500 households are therefore assumed to have higher diesel generation costs due to the additional cost of fuel delivery.
Islands in each class were then identified according to the PLN Area serving them. Technology costs and insolation were distinguished by PLN Area. Exhibit 4.1 shows the distribution of islands by electricity supply class and PLN Area; the number of households indicated refers to household rooftop tags. Appendix F presents the Network Planner input values used for islands with mixed supply. Islands that are “fully electrified”, i.e. all settlements are within the existing grid buffer, were not analyzed, while islands with no

4. Technology and Resource Characterization
4-2
Least-Cost Electrification Plan for Papua, Papua Barat, Maluku and Maluku Utara – December 2017
PLN supply were all assumed to be supplied by mini-grids since these islands averaged 1.9 settlements per island and 135 households per settlement.
Exhibit 4.1: Allocation of islands by PLN Area and supply class
PLN Area No PLN Supply Fully Ele trified Mi ed > , HH Mi ed < , HHA o Buru Kela gSaparuaHarukuNusa LautMa ipaA elau
Total , HH Total , HH Total , HH Total HHPa dja g Kep Cera Laut Sera Ma a okaRu Ai Kep Ba da Naira Kep Boa oPara g Roze gai Goro g
Total , HH Total , HH Total , HH Total , HH Total , HHDoi Bau Hal ahera KasirutaLalui Ma oat O ira BisaDagasuli Miti Ma dioli MorotaiMuari Da ar KajoaDo ora Tapat Ge eTagalaja Ju Kep. Gurai iTolo uu Kep. Djoro gaBo ale O ilatuLatalata Go u uSala gadekeNusa KahatolaGu a ge
Total , HH Total , HH Total , HH Total , Total ,Mare Ter ate TidorePaga a Moti Batja
Hiri Sula esMaitara Tali u
Ma goliMakia
Total , HH Total HH Total , HH Total , HHWorkai Kai Dulah Ja de a Tra gaKep Ko a Kisar War ar Woka Aduar Ba ar Kai Ketjil Da arToja du Leti Ko roor Ro a gWatu ela Selaru Wetar Ser ataTaa Moa Kai Besar KolaUdjir Kasiui KurDa ellor Larat MaselaKu ul Weta FordateDa era He iaar LakorDai Meati iara g TioorDjursia Duroa Lira gKara eira Besar Molu Baraka SeraMa ggur War alKai eer UtirLai o ar MaririTurtutjuri g Bi aarTa ar WuliaruWotap Pe a ulaiFadolWodi uNa aaNurseeMitakMaruWalir
Total , HH Total , HH Total , HH Total , HH Total , HHTotal , HH Total , HH Total , HH Total , HH Total ,
Class
A o
Masohi‐Sera
Sofifi
Ter ate
Tual

4. Technology and Resource Characterization
4-3
Least-Cost Electrification Plan for Papua, Papua Barat, Maluku and Maluku Utara – December 2017
Costs used in this analysis are purely project material, construction and operations and maintenance costs, taking into account transport and logistics costs. Programmatic costs such as planning, project management, licensing, administration, land access or acquisition, profit, or other indirect project costs are not included.
4.1 GRID EXTENSION AND EXISTING GRIDS
Grid extension is characterized by the following components: 20 kV line costed per meter installed, including poles, insulators, and conductors.
As noted previously, Network Planner applies straight-line routing between nodes; MV/LV transformers, costed per kW of capacity required to serve nodal demand
and assuming that only certain sizes are available; LV reticulation costed per meter installed, including poles, and cable. The length of
LV line required for any settlement is a function of the number of households in the settlement and an assumed distance between households;
Connection per household, costed per household to cover droplines and meters, including installation;
A levelized energy cost to cover generation capital, fuel and operating costs, expressed in USD/kWh, taken at the point of supply to the 20 kV system; and
Losses, lifetime and operation and maintenance (O&M) costs expressed as percentages of capital components.
The values for these inputs were defined by PLN and are differentiated by region to capture geographical differences in access, delivered cost, etc.
Geocoordinates for existing 20 kV line routes were prepared based on coordinates for 20 kV poles that PLN had already prepared. These individual pole coordinates were entered into a GIS and were connected by line segments to create the line routes.
4.2 PV MINI-GRIDS
PV mini-grids are characterized by the following components: Panels and balance-of-system (BOS), expressed as a cost per kWp; A capacity factor, which depends upon assumed panel efficiency and insolation as
well as the portion of load that must be served through batteries; Installation cost, expressed as a multiple of the cost of panels and BOS; Batteries, expressed as levelized cost per kWh delivered; The portion of daily load that served by storage; and PV system lifetime and annual O&M cost, expressed as a percentage of panel and
BOS capital cost.
In addition, PV mini-grids have the same distribution components as grid extension: LV reticulation; Connection per household; and Distribution losses, lifetime and O&M.
The values for these parameters are based on price quotations in the Indonesian market, with region-specific allowances for transportation to site and installation.
4.3 INDIVIDUAL SOLAR HOME SYSTEMS
Solar home systems are characterized as follows: A PV panel and BOS, with BOS cost expressed as a multiple of panel cost;

4. Technology and Resource Characterization
4-4
Least-Cost Electrification Plan for Papua, Papua Barat, Maluku and Maluku Utara – December 2017
A battery, costed per kWh capacity of storage and sized as an energy multiple of panel capacity. This takes into account depth of discharge and battery round-trip efficiency;
Lifetimes for PV panels, BOS and batteries; BOS losses; and The solar resource, expressed as equivalent peak sun hours per year;
The systems that have been specified yield alternating current (AC) supply of about 20 kWh/month on average. This is a relatively large SHS, with approximately 250 Wp of capacity per household given assumed panel sizes, so that there is more PV capacity in the community than required for simply a couple of light points and phone charging per household. For example, this sizing could represent basic lighting and phone charging in households alongside community loads for water pumping, street lighting, community television, etc.
The values for these parameters are based on price quotations in the Indonesian market, with region-specific allowances for transportation to site and installation.
4.4 THE SOLAR RESOURCE
The solar resource has been defined on a regional basis using data from the 3TIER Global Solar Dataset 3km. Exhibit 4.2 shows the irradiance map for Indonesia.
Exhibit 4.2: 3TIER Global Solar Dataset for Indonesia
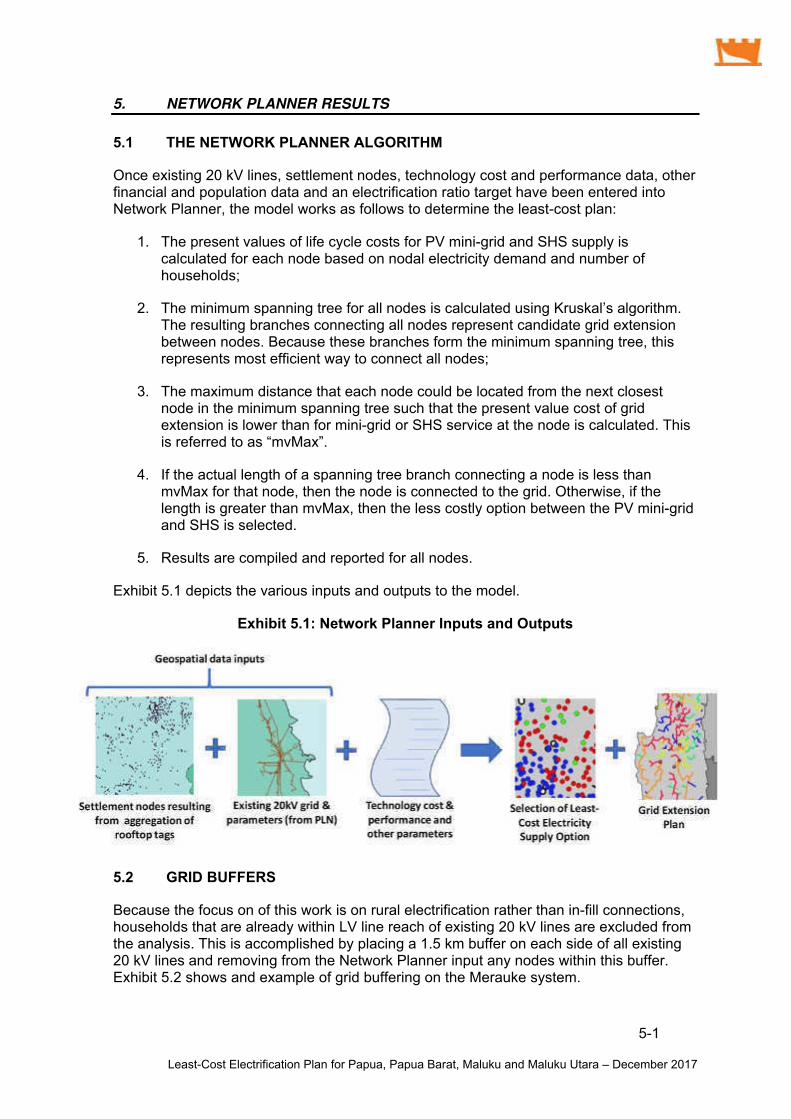
5-1
Least-Cost Electrification Plan for Papua, Papua Barat, Maluku and Maluku Utara – December 2017
5. NETWORK PLANNER RESULTS
5.1 THE NETWORK PLANNER ALGORITHM
Once existing 20 kV lines, settlement nodes, technology cost and performance data, other financial and population data and an electrification ratio target have been entered into Network Planner, the model works as follows to determine the least-cost plan:
1. The present values of life cycle costs for PV mini-grid and SHS supply is calculated for each node based on nodal electricity demand and number of households;
2. The minimum spanning tree for all nodes is calculated using Kruskal’s algorithm. The resulting branches connecting all nodes represent candidate grid extension between nodes. Because these branches form the minimum spanning tree, this represents most efficient way to connect all nodes;
3. The maximum distance that each node could be located from the next closest node in the minimum spanning tree such that the present value cost of grid extension is lower than for mini-grid or SHS service at the node is calculated. This is referred to as “mvMax”.
4. If the actual length of a spanning tree branch connecting a node is less than mvMax for that node, then the node is connected to the grid. Otherwise, if the length is greater than mvMax, then the less costly option between the PV mini-grid and SHS is selected.
5. Results are compiled and reported for all nodes.
Exhibit 5.1 depicts the various inputs and outputs to the model.
Exhibit 5.1: Network Planner Inputs and Outputs
5.2 GRID BUFFERS
Because the focus on of this work is on rural electrification rather than in-fill connections, households that are already within LV line reach of existing 20 kV lines are excluded from the analysis. This is accomplished by placing a 1.5 km buffer on each side of all existing 20 kV lines and removing from the Network Planner input any nodes within this buffer. Exhibit 5.2 shows and example of grid buffering on the Merauke system.

5. Network Planner Results
5-2
Least-Cost Electrification Plan for Papua, Papua Barat, Maluku and Maluku Utara – December 2017
Exhibit 5.2: Grid Buffering Example on the Merauke Systems
It is also assumed that for all isolated households and for all settlements of less than 15 households outside of grid buffers, SHS is automatically the least cost option. These isolated households and the nodes are also removed from the Network Planner input file, but are reported in the results.
5.3 RESULTS FOR PAPUA AND PAPUA BARAT
Exhibit 5.3 shows a sample of Network Planner output screenshot for Papua Barat. It includes a map showing all nodes color-coded by selected supply technology, a summary by technology for the entire region, and details for each node. The complete results are downloaded in to spreadsheets to facilitate consolidation of results across both provinces.
Exhibit 5.3: Sample Network Planner Output for Papua Barat
Exhibit 5.4 compiles all of these individual regional outputs into a single mosaic for the Papua and Papua Barat combined.

5-3
Least-Cost Electrification Plan for Papua, Papua Barat, Maluku and Maluku Utara – December 2017
Exhibit 5.4: Combined Result for Papua and Papua Barat

5-4
Least-Cost Electrification Plan for Papua, Papua Barat, Maluku and Maluku Utara – December 2017
Exhibit 5.5 summarizes the investment and operating costs by type of technology to achieve 90 to 96% electrification ratios across Papua and Papua Barat (excluding in-fill connections). (PLN defined different target ratios for different PLN Areas). Each category of electrification option is described as follows:
Solar home systems (SHS) have been automatically assigned to all isolated households as well as settlements of less than or equal to 15 households. Network Planner has not identified any settlements larger than 15 households where SHS would be least-cost.
There is a large number of PV mini-grids. The average number of households served by these systems is 47; further details on the size distribution of these mini-grids are presented below.
“Grid extension (connected to existing grid)” represents conventional electrification by PLN in which the existing grid is extended.
“Grid extension (new, not connected to existing grid)” represents settlements that would be connected by 20 kV line, but as new, isolated systems that would not be connected to the existing grid. These systems serve an average of 581 households each. However, this assumes that the cost of energy at the point of injection to the 20 kV network is the same as for the existing 20 kV systems in each region. This is likely to be over-optimistic since these are remote groups of settlements where fuel transport costs are likely to be considerably higher than for the existing systems of Papua and Papua Barat.
Exhibit 5.5: Investment Requirements by Type of Supply – Papua and Papua Barat
Excluding the non-PLN kabupaten in Papua, the results indicate that 63.5% of households (428,440 out of 674,621 based on nodes) are within the PLN grid buffers of Papua and Papua Barat combined, whereas the overall PLN electrification ratio reported by DJK for 2015 for Papua and Papua Barat is 61.6%, implying an electrification ratio within the grid buffers of approximately 97%.
Assu es ‐ %ele trifi atio
ratio depe di g o PLN Area
Nu er of households
tags
Nu er of settle e ts
odes
I itial apital ost USD
Prese t alue of re urri g osts USD
SHS s ste s 7, , 7* , 7 , , ,
PV i i‐grids ,7 , 7 , , , ,
Grid e te sio o e ted to e isti g grid , , , ,77 ,77
Grid e te sio e – ot o e ted to e isti g grid 7, 7
s ste s , ,7 , ,
Withi e isti g grid uffer , 7 /a /a
* I ludes isolated households

5. Network Planner Results
5-5
Least-Cost Electrification Plan for Papua, Papua Barat, Maluku and Maluku Utara – December 2017
5.4 RESULTS FOR MALUKU AND MALUKU UTARA
As discussed in Chapter 4, the methodology described in Section 5.1 was applied only to the islands of Maluku and Maluku Utara that have a mix of electrified and unelectrified settlement nodes, as determined by whether there are nodes both within the existing 20 kV grid buffers as well as nodes outside of them. For these islands the cost of grid energy was then adjusted depending on whether the island had a population of fewer than or more than 2,500 households. For islands with populations of greater than 2,500 households, the generation BPP for that island was used, as reported by PLN for 2016. If the population is less than 2,500 households, a grid energy cost of USD 0.25/kWh was applied to reflect the higher fuel transport costs on these islands given the lack of dedicated fuel handling infrastructure.
PV mini-grids were assumed for islands without any PLN supply, since these islands have few settlements (1.9 on average) with small populations (135 households per settlement on average). Islands on which all settlements nodes are already within grid buffers were not included in the analysis, since this plan focusses on rural electrification rather than in-fill connections.
Exhibit 5.6 summarizes the capital and operating costs required to achieve near-universal access in Maluku and Maluku Utara. Exhibits 5.7 through 5.11 present maps of each PLN Area showing the least-cost means of serving each settlement.
Exhibit 5.6: Investment Requirements by Type of Supply – Maluku and Maluku Utara
The five PLN Areas of Maluku and Maluku Utara are shown in Exhibit 5.7. The least-cost supply plan for all settlements in each of these PLN Areas is shown in Exhibit 5.8 through 5.12. Insets on Exhibits 5.8 and 5.12 show examples of new “isolated” 20 kV grids that would not be connected to the existing grid.
Assu es ‐ % ele trifi atio ratio
depe di g o PLN Area
Nu er of HH
Nu er of settle e ts
odes
I itial apital ost USD
Prese t alue of re urri g osts USD
SHS s ste s , 7 7 * , ,7 , ,
PV i i‐grids , , , 7 , 7 ,
Grid e te sio o e ted to e isti g grid , 7, 77, , ,
Grid e te sio e – ot o e ted to e isti g grid ,
s ste s , , , ,
Withi e isti g grid uffer , ,7 /a /a
* I ludes isolated households
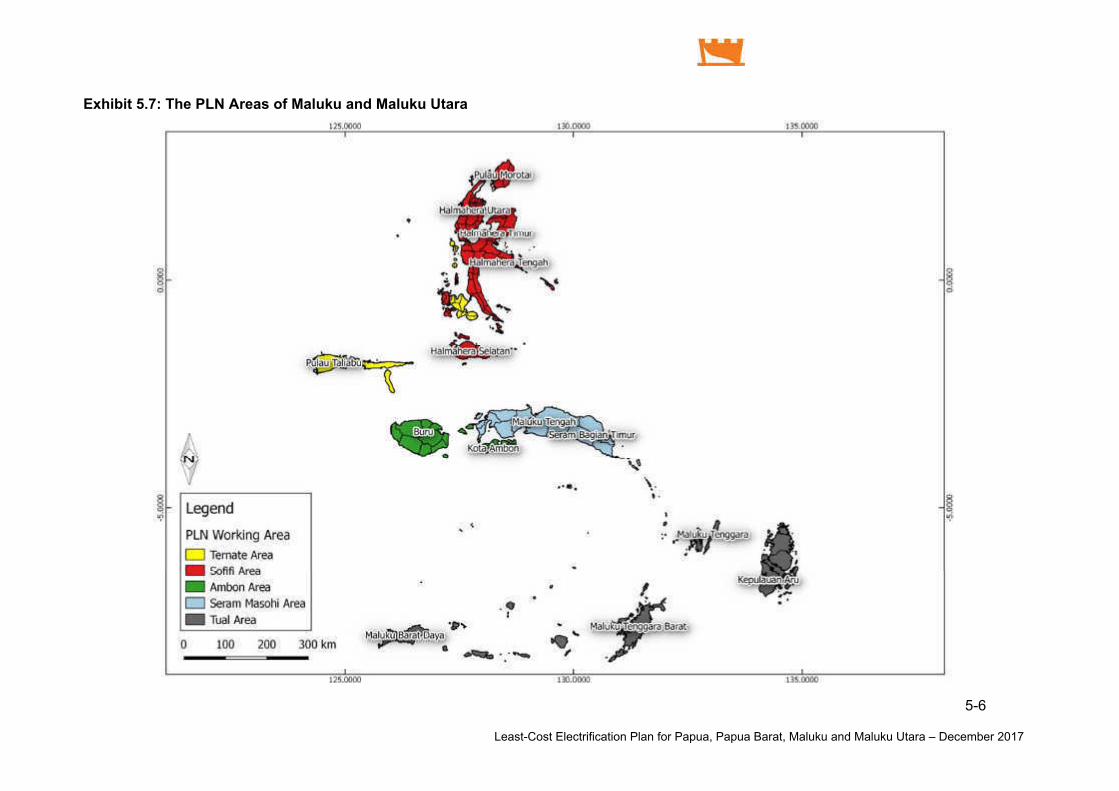
5-6
Least-Cost Electrification Plan for Papua, Papua Barat, Maluku and Maluku Utara – December 2017
Exhibit 5.7: The PLN Areas of Maluku and Maluku Utara

5. Network Planner Results
5-7
Least-Cost Electrification Plan for Papua, Papua Barat, Maluku and Maluku Utara – December 2017
Exhibit 5.8: Electrification Plan for PLN Area Ambon

5. Network Planner Results
5-8
Least-Cost Electrification Plan for Papua, Papua Barat, Maluku and Maluku Utara – December 2017
Exhibit 5.9: Electrification Plan for PLN Area Seram-Masohi

5. Network Planner Results
5-9
Least-Cost Electrification Plan for Papua, Papua Barat, Maluku and Maluku Utara – December 2017
Exhibit 5.10: Electrification Plan for PLN Area Sofifi
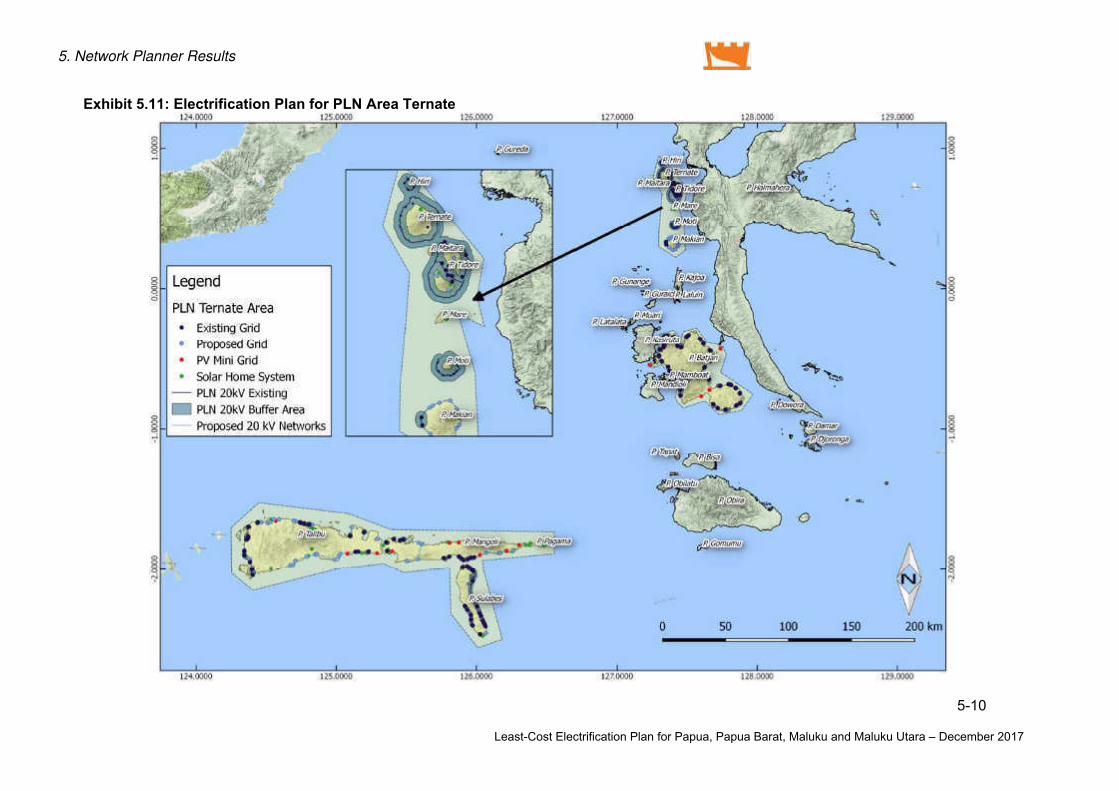
5. Network Planner Results
5-10
Least-Cost Electrification Plan for Papua, Papua Barat, Maluku and Maluku Utara – December 2017
Exhibit 5.11: Electrification Plan for PLN Area Ternate

5. Network Planner Results
5-11
Least-Cost Electrification Plan for Papua, Papua Barat, Maluku and Maluku Utara – December 2017
Exhibit 5.12: Electrification Plan for PLN Area Tual

5-12
Least-Cost Electrification Plan for Papua, Papua Barat, Maluku and Maluku Utara – December 2017
5.5 INTERPRETATION AND APPLICATION OF THE RESULTS
There are eight key findings arising from this analysis:
1. Approximately USD 404 million of capital investment is required to achieve near-universal access in Papua and Papua Barat. This does not include the cost of new generation and transmission that may be required to serve the incremental load arising from rural electrification. The pace at which this can be funded will in part determine when these electrification targets can be achieved. USD 249 million of this requirement is associated with grid extension or new 20 kV isolated grids, which will likely be the responsibility of PLN. Given PLN’s other capital investment requirements such as the 35 GW program, the Government of Indonesia may have to consider equity injections to ensure PLN’s ability to finance this capital investment.
2. Approximately USD 105 million of capital investment is required to achieve near-universal access in Maluku and Maluku Utara. As with Papua and Papua Barat, this figure does not include the capital cost of new generation and transmission required to serve the additional load resulting from these new consumers. Approximately USD 70 million of this requirement is associated with grid extension or new 20 kV isolated grids, which will likely be the responsibility of PLN.
3. The present value of operating costs is as large or larger than capital costs. The sustainability of these systems therefore depends on availability of funding for operations and maintenance. For grid extension, the largest component of operating costs is fuel, whereas for PV mini-grids and SHS, the largest component is battery replacement. These costs will need to be funded by either government (through subsidies to PLN and private suppliers) or by consumers through their tariffs. As indicated by Exhibit 1.3, the nominal levelized cost of supply from the PV mini-grids exceeds USD 1.00/kWh, so that full cost recovery tariffs would exceed IDR 15,000/kWh. This is approximately 36 times higher than the effective R-1 450VA tariff now in effect.
4. Grid extension is the least-cost means of supply for most households. In Papua and Papua Barat, 52% of households outside of grid buffers would be supplied by extension of the existing grids, while 19% would be served by new conventional isolated 20 kV grids (though as noted previously this may be an overestimate, since it assumes that the cost of energy in these grids would be the same as for the existing 20 kV grids, when in fact due to the remote location of these settlements it would likely be higher, making PV mini-grids relatively more attractive).
In Maluku and Maluku Utara 75% of households outside of current grid buffers would be served by extension of existing grids, while only 2% would be served by new conventional isolated 20 kV grids.
5. ….but mini-grids play an important role. PV mini-grids on the other hand would be least-cost for 22% of households outside of the existing grid buffer in Papua and Papua Barat, and 19% of households outside the existing grid buffer in Maluku and Maluku Utara. Permen ESDM 38/2016 provides for private sector participation. Implementation of that regulation will require PLN to delineate areas which it wishes to retain for its own operations, and to identify areas it will release to the private sector. The resulting geospatial data files from this analysis can be used by PLN and provincial governments to define these respective areas.
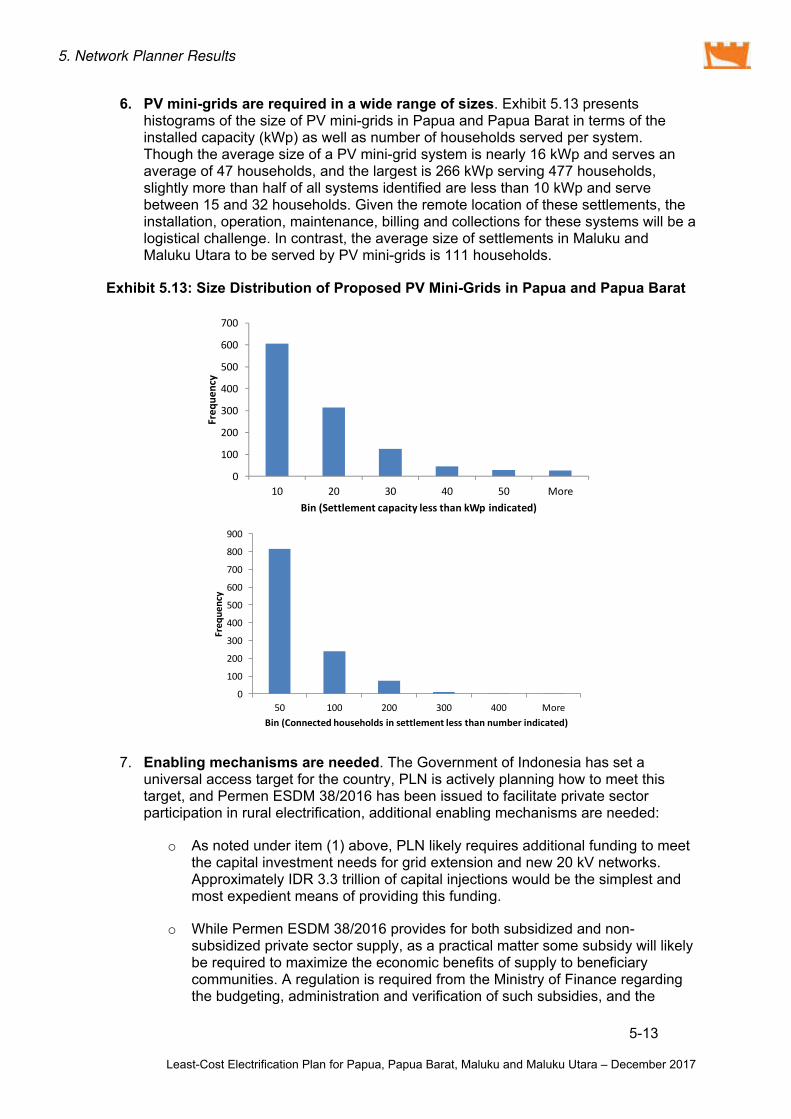
5. Network Planner Results
5-13
Least-Cost Electrification Plan for Papua, Papua Barat, Maluku and Maluku Utara – December 2017
6. PV mini-grids are required in a wide range of sizes. Exhibit 5.13 presents histograms of the size of PV mini-grids in Papua and Papua Barat in terms of the installed capacity (kWp) as well as number of households served per system. Though the average size of a PV mini-grid system is nearly 16 kWp and serves an average of 47 households, and the largest is 266 kWp serving 477 households, slightly more than half of all systems identified are less than 10 kWp and serve between 15 and 32 households. Given the remote location of these settlements, the installation, operation, maintenance, billing and collections for these systems will be a logistical challenge. In contrast, the average size of settlements in Maluku and Maluku Utara to be served by PV mini-grids is 111 households.
Exhibit 5.13: Size Distribution of Proposed PV Mini-Grids in Papua and Papua Barat
7. Enabling mechanisms are needed. The Government of Indonesia has set a universal access target for the country, PLN is actively planning how to meet this target, and Permen ESDM 38/2016 has been issued to facilitate private sector participation in rural electrification, additional enabling mechanisms are needed:
o As noted under item (1) above, PLN likely requires additional funding to meet the capital investment needs for grid extension and new 20 kV networks. Approximately IDR 3.3 trillion of capital injections would be the simplest and most expedient means of providing this funding.
o While Permen ESDM 38/2016 provides for both subsidized and non-subsidized private sector supply, as a practical matter some subsidy will likely be required to maximize the economic benefits of supply to beneficiary communities. A regulation is required from the Ministry of Finance regarding the budgeting, administration and verification of such subsidies, and the
More
Fre
ue
Bi Settle e t apa it less tha kWp i di ated
More
Fre
ue
Bi Co e ted households i settle e t less tha u er i di ated

5. Network Planner Results
5-14
Least-Cost Electrification Plan for Papua, Papua Barat, Maluku and Maluku Utara – December 2017
national legislature (Dewan Perwakilan Rakyat, DPR) would have to approve such subsidies on an annual basis.
o Extensive institutional capacity building will be required both at the national and regional levels to facilitate implementation of the subsidy scheme.
Appendix G reviews Permen ESDM 38/2016 and highlights these implementation issues and needs.
8. Field confirmation is required. In planning for this government-mandated electrification program, PLN Wilayah Papua has already started field surveys of communities to be electrified. Exhibit 5.14 compares the findings of PLN field surveys with results from this study for 21 randomly selected settlements. A number of observations arise from this comparison:
o In most cases, the estimate of settlement population varies greatly, often by a factor of 3 or more. It is understood that PLN personnel did not conduct a census count of households, but rather asked the kepala desa or other village representative the number of households in the settlement.
o Unsurprisingly given this discrepancy in settlement sizes, the selected technology is the same in only a few cases, and in those cases the sizing differs substantially.
o In none of the cases did PLN identify grid extension as the preferred method of supply. Even though PLN prioritizes grid extension, PLN identified only PV or diesel systems for supplying the selected settlements. (It is not known on what basis PLN designated PV or diesel for a given settlement). However, according to analysis in this report, grid extension is the least-cost means of supplying the majority of communities in the currently unserved areas that were sampled.
Section 1.5 described the assumptions and caveats associated with this analysis. Clearly, ground truthing is required prior to implementation of any electrification plan. By the same token, field surveys alone can miss critical information and may lack consistent assumptions and a systematic planning approach. It is therefore suggested that the results of this study be used to guide field surveys and the electrification planning effort more generally. Field survey teams can use these results as a hypothesis to be confirmed or rejected through field work.
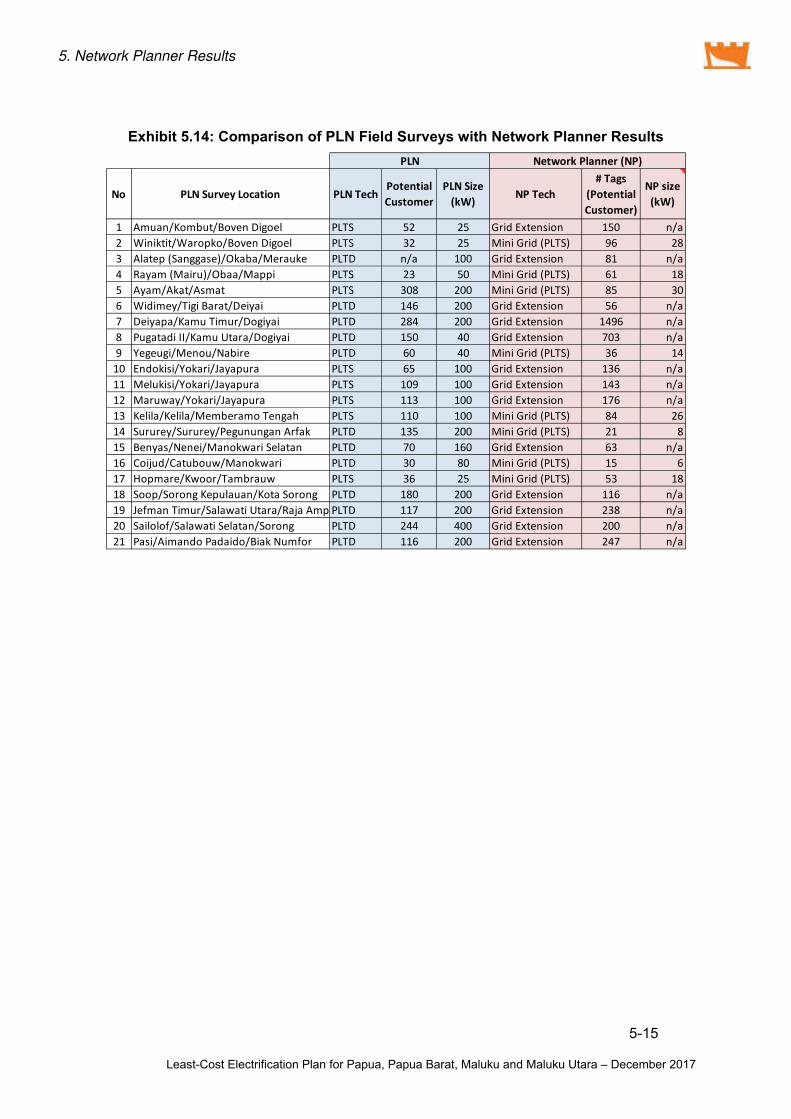
5. Network Planner Results
5-15
Least-Cost Electrification Plan for Papua, Papua Barat, Maluku and Maluku Utara – December 2017
Exhibit 5.14: Comparison of PLN Field Surveys with Network Planner Results
No PLN Sur e Lo atio PLN Te h Pote tial Custo er
PLN Size kW NP Te h
# Tags Pote tial Custo er
NP size kW
A ua /Ko ut/Bove Digoel PLTS Grid E te sio /aWi iktit/Waropko/Bove Digoel PLTS Mi i Grid PLTSAlatep Sa ggase /Oka a/Merauke PLTD /a Grid E te sio /aRaya Mairu /O aa/Mappi PLTS Mi i Grid PLTSAya /Akat/As at PLTS Mi i Grid PLTSWidi ey/Tigi Barat/Deiyai PLTD Grid E te sio /aDeiyapa/Ka u Ti ur/Dogiyai PLTD Grid E te sio /aPugatadi II/Ka u Utara/Dogiyai PLTD Grid E te sio /aYegeugi/Me ou/Na ire PLTD Mi i Grid PLTSE dokisi/Yokari/Jayapura PLTS Grid E te sio /aMelukisi/Yokari/Jayapura PLTS Grid E te sio /aMaru ay/Yokari/Jayapura PLTS Grid E te sio /aKelila/Kelila/Me era o Te gah PLTS Mi i Grid PLTSSururey/Sururey/Pegu u ga Arfak PLTD Mi i Grid PLTSBe yas/Ne ei/Ma ok ari Selata PLTD Grid E te sio /aCoijud/Catu ou /Ma ok ari PLTD Mi i Grid PLTSHop are/K oor/Ta rau PLTS Mi i Grid PLTSSoop/Soro g Kepulaua /Kota Soro g PLTD Grid E te sio /aJef a Ti ur/Sala ati Utara/Raja A p PLTD Grid E te sio /aSailolof/Sala ati Selata /Soro g PLTD Grid E te sio /aPasi/Ai a do Padaido/Biak Nu for PLTD Grid E te sio /a
Net ork Pla er NPPLN

A-1
Least-Cost Electrification Plan for Papua, Papua Barat, Maluku and Maluku Utara – December 2017
APPENDIX A: TERMS OF REFERENCE
Terms of Reference
Preparation of an Electricity Access Plan for Eastern Indonesia, Phase 1
23 April 2016
Background
Indonesia has achieved remarkable success in bringing electricity to its people. Despite being an archipelagic nation of some 17,000 islands spanning 5,000 km, by the end of 2014 Indonesia had attained an 84% electrification ratio20. In the past 10 years alone, PLN, the national electric utility, has managed to connect approximately 20 million new households, representing 78 million people. In 2013 alone, PLN connected 3.7 million new consumers.
Given the benefits of electrification for economic development and household welfare, the Government of Indonesia aims for near-universal access by 2020. The National Energy Policy (Kebijakan Energi Nasional, KEN) adopted in 2014 states that Indonesia should “approach” 100% electrification ratio by 2020. Meanwhile, the 2015–2019 National Medium Term Development Plan (Rencana Pembangunan Jangka Menengah Nasional, RPJMN) targets an electrification ratio of 96.6% by the end of 2019.
These are ambitious targets. Experience throughout the world has shown that the last 10 to 15% of the population is the most difficult and costly to supply. Countries such as China, Mexico and Thailand needed 20 years to provide electricity service to the last 10 to 15% of their respective populations. Experience in these and other countries shows that government leadership, an enabling institutional environment, sustained public funding and engagement of all stakeholders under a single plan are required to achieve universal access.
At the start of 2015, approximately 10 million Indonesian households remained without access to electricity21. In February, 2016, the Minister of Energy and Mineral Resources launched the Program Indonesia Terang (PIT) to accelerate universal access using renewable energy in the six easternmost provinces of Indonesia, which are characterized by the lowest electrification rates in the country. The Unit Pelaksana Program Pembangunan Ketenagalistrikan Nasional (UP3KN) together with Satuan Tugas Percepatan Pengembangan Energi Baru dan Terbarukan (P2EBT) within the Ministry of Energy and Mineral Resources (MEMR) have been assigned to take a leading role in the technical and commercial design of PIT. These two units will support a new unit which will be setup by ESDM to implement the PIT. Following the lessons learned from electrification programs around the world, a key element of PIT is the preparation of single electricity access plan to guide investment in and implementation of both grid extension and off-grid solutions22.
20 Directorate General of Electricity, Statistik Ketenagalistrikan 2014, Edition No. 28, Budget year 2015.
21 Ibid.
22 Asian Development Bank, Achieving Universal Electricity Access in Indonesia, Publication Stock No. RPT167922, 2016.

A: Terms of Reference
A-2
Least-Cost Electrification Plan for Papua, Papua Barat, Maluku and Maluku Utara – December 2017
Objectives
The first phase of this activity will focus on three of the six target provinces: Papua, Papua Barat and Nusa Tenggara Barat (NTB). The second phase of this work will cover Maluku, Maluku Utara and Nusa Tenggara Timur (NTT). Coverage of these provinces is being split into groups since the World Bank completed a study of the second group in 2014. UP3KN will review that study to determine whether further analysis is needed for those three provinces, possibly as a second phase to this activity.
The objectives of this activity are as follows: 1. To determine the amount of capital investment required for grid extension and off-
grid solutions to achieve a target level of electricity access in these provinces as an input to budgeting the funding required from some mix of public and private sources;
2. To identify individual settlements that can be supplied on a least-cost basis by grid extension, isolated micro-grids and individual solar home systems. This can be used to define business areas for various suppliers (e.g. PLN and private companies); and
3. To provide a detailed geospatial baseline of recent household and facility locations that can be used later by suppliers for implementation planning.
Approach
This activity is part of a series of activities required to achieve the Government’s electricity access targets for these provinces. In addition to this planning activity, regulatory mechanisms will need to be established to facilitate the funding and implementation of the least-cost electrification solutions identified through this analysis:
While PLN is the obvious candidate to continue grid extension, streamlined means of funding the associated investment are required; and
For off-grid solutions, legal/commercial models must be developed for the selection, public funding, tariff setting, construction, future operations and maintenance and performance management of entities to carry out off-grid supply.
The development of these regulatory mechanisms and commercial models can be done in parallel with the preparation of this plan (though the quantum of public funding ultimately shown by this study to be required may influence the design of these regulatory mechanisms and commercial models).
The study will need to be socialized and coordinated with a number of agencies to ensure subsequent implementation. These other agencies include the Directorate General of Electricity and the Directorate General of New and Renewable Energy and Energy Conservation within the Ministry of Energy and Mineral Resources (MEMR), the Ministry of State-Owned Enterprises (as the Government’s shareholder representative in PLN), the Ministry of Finance (as the administrator of public funding), the national legislature (Dewan Perwakilan Rakyat, DPR) (as the approver of public funding), provincial governments, PLN and prospective private sector suppliers (for market sounding).
UP3KN will serve as the principal counterpart for this activity, and has already started socialization of PIT with regional governments as well as PLN both in its headquarters as well as its regional offices. In addition, MEMR’s Pusat Data dan Informasi (Pusdatin) and Badan Penelitian dan Pengembangan (Balitbang) will play important roles for the final compilation of data and hosting of systems required to conduct the analysis.
Through the Sustainable and Inclusive Energy Program (SIEP), ADB will provide an Electricity Access Specialist, Senior GIS Specialist, Renewable Energy Engineer and

A: Terms of Reference
A-3
Least-Cost Electrification Plan for Papua, Papua Barat, Maluku and Maluku Utara – December 2017
Research Assistant, referred to below collectively as the “consultant”, to work with these counterparts. The Electricity Access Specialist is the SIEP consultant team leader.
The methodology to be used builds on the work previously done by ADB and the World Bank on geospatial electricity planning in Indonesia. World Bank financed an electricity access plan for the provinces of Maluku, Maluku Utara and NTT using geospatial methods in 2014. ADB financed a more detailed plan for the island of Sumba also in 201423. The work to be conducted under this activity greatly improves upon that earlier work by (i) using rooftop tagging to determine the actual geospatial distribution of population, and (ii) updating inputs based on experience with energy demand, improvements in off-grid technologies, and changes in energy costs. Attachment A provides a more detailed comparison of the approach proposed here to the previous studies.
Scope of Work
The first phase activity will consist of the following tasks. Whether there is a second phase to prepare plans for the other three provinces will depend on UP3KN’s review of the previous World Bank study:
1. The consultant shall develop and hand-over software for manual rooftop tagging using Google Earth imagery. This software will provide for compilation of metadata about the date and coverage of the imagery, the person conducting the rooftop tagging, etc. Attachment B describes the suitability of Google Earth imagery for the three target provinces.
2. The consultant shall train PLN personnel to be arranged by UP3KN on the use of the rooftop tagging software as well as the overall planning methodology, and shall assist PLN with the set-up and use of its computers to carry out the rooftop tagging and compile the results.
3. The PLN personnel shall carry out the rooftop tagging, delivering these inputs to the consultant as either .kml or .gpx files. The number of personnel made available will determine the duration of this task. It is assumed here that 40 people are made available so as to complete this task within 3 weeks. UP3KN, PLN and ADB will discuss the number of people that PLN will provide; if necessary ADB can also contribute additional resources to ensure that the task is completed within an acceptable duration.
4. The consultant shall compile data on the location and characteristics of 20 kV lines. 5. The consultant will spot check the quality of these roof tagging results, and provide
feedback to the UP3KN and PLN personnel as appropriate. 6. The consultant will develop and document a procedure for the application of a
proximity criterion to cluster sets of rooftop tags into settlements that can be served by low-voltage distribution (“settlement aggregations”).
7. The consultant or other resources provided by ADB will then convert the rooftop tagging files into settlement polygons using the agreed procedure, will determine the centroid of each settlement polygon and will then provide these results as .shp files that indicate the location and current population of each centroid.
8. The consultant shall assist Pusdatin and/or Balitbang with the set-up of servers to receive, manage and utilize the final data series.
9. The consultant shall work UP3KN and other stakeholders as appropriate to set service standards that will serve as a basis for sizing and costing the grid extension,
23 The “Least-Cost Electrification Plan for the Iconic Island” may be downloaded from http://sumbaiconicisland.org/unduh/.

A: Terms of Reference
A-4
Least-Cost Electrification Plan for Papua, Papua Barat, Maluku and Maluku Utara – December 2017
micro-grid and individual household supply options, as well as the time horizon for achieving the target electrification ratio.
10. The consultant shall then propose and agree with UP3KN and other stakeholders as appropriate on the unit costs and technical performance that will characterize each electrification option, as well as on the settlement demand model.
11. The consultant will then set-up and run Network Planner for individual regions (taking into account limitations in the number of settlements that Network Planner can accommodate in each run) using
a. The 20 kV line from task (task 4) b. The .shp files showing the population of each settlement aggregation and the
location of the aggregation centroid from task (task 6) c. The settlement demand model, and unit costs and technical performance of
each electrification option from task (tasks 9 and 10) d. Population and economic growth projections from the Central Statistics
Agency (Badan Pusat Statistik, BPS) 12. The consultant will then mosaic the individual Network Planner results into a single
.shp file. 13. The consultant shall provide:
a. A report: i. documenting the above activities ii. determining the location and number of households by kabupaten24
and province to be served by each technology iii. the capital investment required and operating costs by technology,
kabupaten and province, as well as per household iv. proposing areas for off-grid concessions
b. all data such as .shp files and Network Planner inputs.
It is expected the consultant will convene meetings with counterparts at least once every two weeks to report progress in performing the above work.
Timing
The schedule below shows the expected timing of the above activities. Red bars indicate ADB consultant tasks, blue bars indicate tasks to be conducted by PLN (under UP3KN). The results for Papua, Papua Barat and NTB will be available in about 3 months, assuming that all 20 kV line data can be compiled from these regions within 3 weeks.
24 There are 22 kabupaten/kota in NTT, 10 in Maluku Utara, 11 in Maluku, 29 in Papua, 13 in Papua Barat and 10 in NTB.

A: Terms of Reference
A-5
Least-Cost Electrification Plan for Papua, Papua Barat, Maluku and Maluku Utara – December 2017
Budget
Personnel from UP3KN and other counterparts mentioned above will be paid and provided by their respective agencies. All data shall be provided by each counterpart to the consultant at no charge.
ADB shall provide: 4 person-months of the Senior GIS Specialist 1.5 person-month of the Electricity Access Specialist/Team Leader 1 person-month of the Renewable Energy Engineer 1 person-month of the Research Assistant. Resources required for application of the proximity criterion to create settlement
aggregations.
Confidentiality and Data Security
All 20 kV data will be owned by UP3KN and PT PLN (Persero). The consultant shall maintain the confidentiality of 20 kV maps and location data.
Tasks / WeeksCreate roof taggi g soft areTrai PLN perso el i use of soft arePLN perso el o du t roof taggi g P, PB, NTBCo sulta t to o pile kV li e data P, PB, NTBCo sulta t he ks roof taggi g uality P, PB, NTBCo sulta t develops pro i ity riteriaCo sulta t or other ADB resour es o vert rooftops to Co sulta t assists ith set‐up of Pusdati serversCo sulta t o fir s servi e sta dards ith UP KN a d othersCo sulta t o fir s osts, te h ology perfor a e & de a d Co sulta t ru s Net ork Pla er P, PB, NTBCo sulta t osai s i dividual NP results P, PB, NTBCo sulta t prepares a report do u e ti g the a ove P, PB, NTB
A: Terms of Reference
A-6
Least-Cost Electrification Plan for Papua, Papua Barat, Maluku and Maluku Utara – December 2017
Attachment A
Comparison of the Proposed Approach with Earlier World Bank and ADB Studies
Further details on the differences between the activity proposed here and the earlier World Bank and ADB studies are as follows:
1. The geospatial representation of population distribution. The three-province analysis funded by World Bank represented the geospatial distribution of households only by either (i) recognizing the “settlement polygons” already identified on 1:25,000 maps from the Geospatial Information Agency (Badan Informasi Geospatial, BIG), and then allocating desa population to the polygons proportional to the size of each, or (ii) simply assuming that the entire population in a desa is concentrated at the centroid. The principal shortcoming of this approach is that is clusters the population much more than in reality, resulting in a systematic bias towards grid extension. Moreover, the settlement and building data shown in the BIG maps is from 1997.
The ADB study for Sumba took a more granular approach which recognized both BIG settlement polygons as well as individual buildings/structures identified on the BIG maps. In eastern Indonesia, many people in fact live outside of BIG settlement polygons (and certainly are not clustered at the desa centroid). The ADB Sumba results indicate that about 20% of the Sumba population will be served by off-grid solutions, whereas the World Bank three-province analysis suggests that 3% will be served by off-grid solutions across the region. Clearly there are significant policy and funding implications for these different results.
This new work will go beyond both the earlier World Bank and ADB work by using actual roof tagging, which will provide the most accurate geospatial representation of population distribution. Moreover, the Google Earth satellite imagery that will be used for this is typically only 1 to 3 years old, compared to the BIG 1:25,000 maps which were created in the mid-1990s.
The figure on the following page compares the three methods for a sample area taken in Sumba. The box in the lower left hand corner compares the number of nodes identified for Sumba from three different sources:
The World Bank study of the three provinces The ADB Sumba study The data contained in the 1:25,000 BIG maps for Sumba
Clearly each of these representations will lead to very different technology choices, levels of investment and policies. Moreover, a rooftop tagging approach can be used for implementation planning, while the World Bank and ADB Sumba approaches bear little resemblance to current settlement patterns.
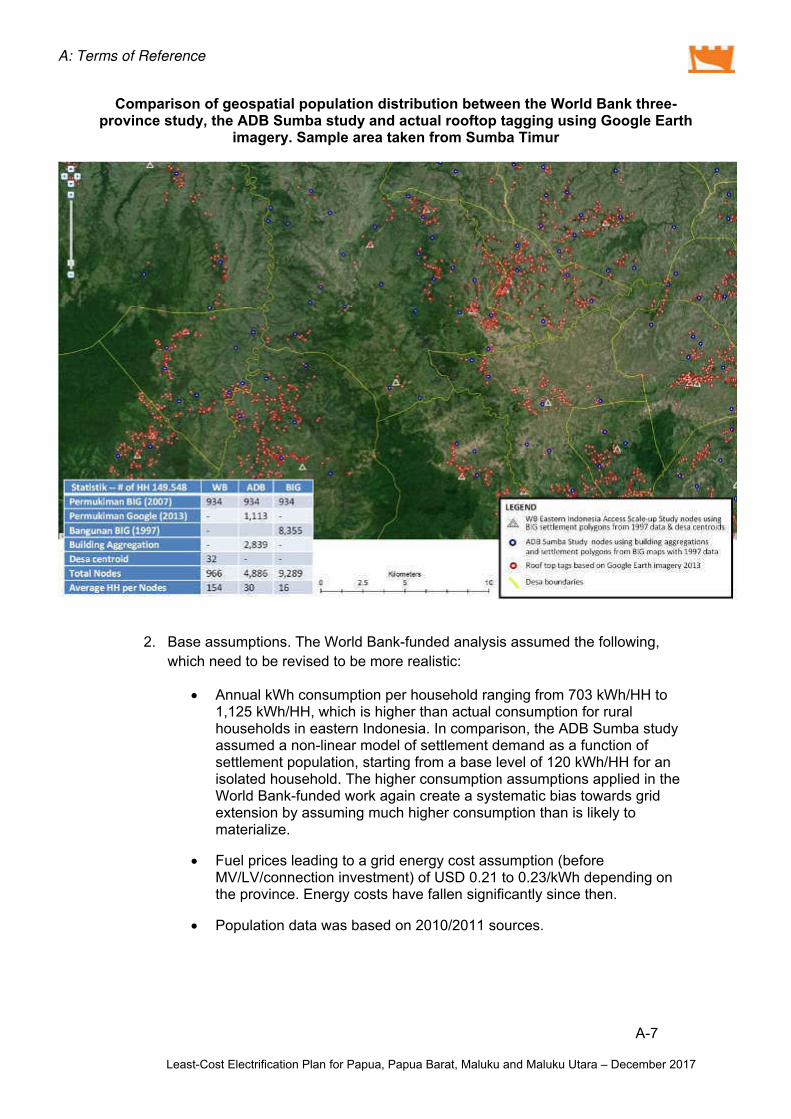
A: Terms of Reference
A-7
Least-Cost Electrification Plan for Papua, Papua Barat, Maluku and Maluku Utara – December 2017
Comparison of geospatial population distribution between the World Bank three-province study, the ADB Sumba study and actual rooftop tagging using Google Earth
imagery. Sample area taken from Sumba Timur
2. Base assumptions. The World Bank-funded analysis assumed the following,
which need to be revised to be more realistic:
Annual kWh consumption per household ranging from 703 kWh/HH to 1,125 kWh/HH, which is higher than actual consumption for rural households in eastern Indonesia. In comparison, the ADB Sumba study assumed a non-linear model of settlement demand as a function of settlement population, starting from a base level of 120 kWh/HH for an isolated household. The higher consumption assumptions applied in the World Bank-funded work again create a systematic bias towards grid extension by assuming much higher consumption than is likely to materialize.
Fuel prices leading to a grid energy cost assumption (before MV/LV/connection investment) of USD 0.21 to 0.23/kWh depending on the province. Energy costs have fallen significantly since then.
Population data was based on 2010/2011 sources.
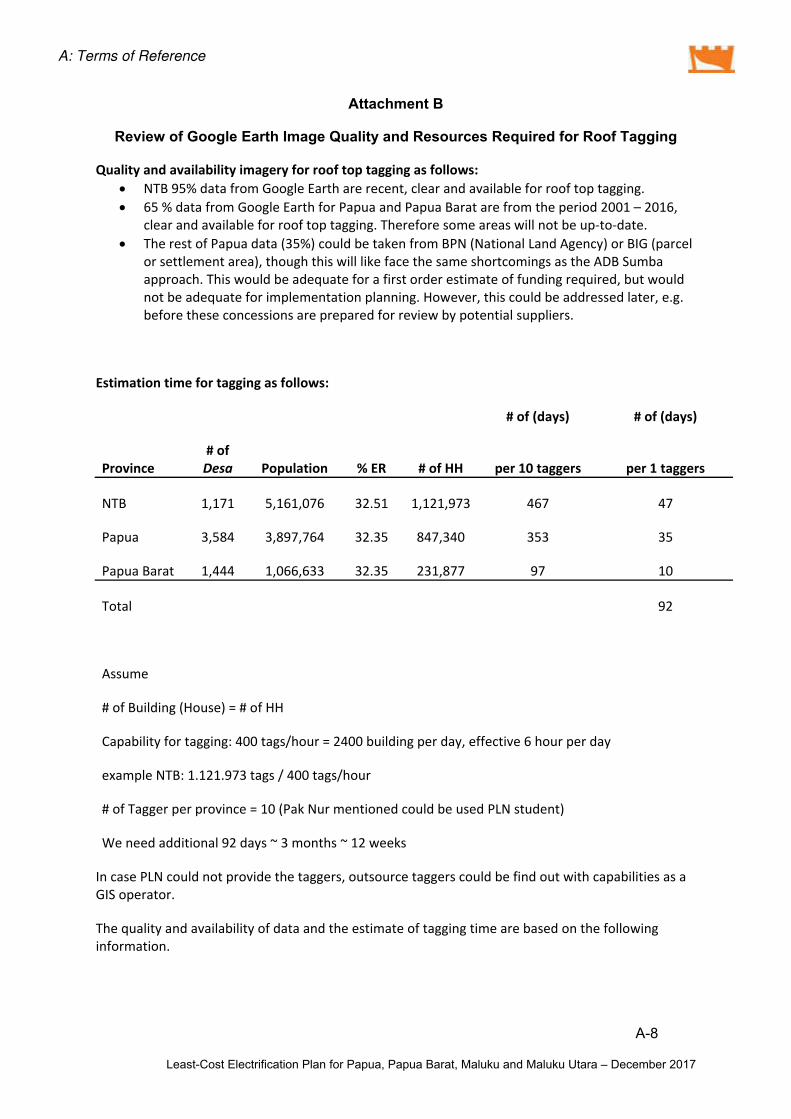
A: Terms of Reference
A-8
Least-Cost Electrification Plan for Papua, Papua Barat, Maluku and Maluku Utara – December 2017
Attachment B
Review of Google Earth Image Quality and Resources Required for Roof Tagging
Qualit a d a aila ilit i ager for roof top taggi g as follo s: NTB % data fro Google Earth are re e t, lear a d availa le for roof top taggi g. % data fro Google Earth for Papua a d Papua Barat are fro the period – ,
lear a d availa le for roof top taggi g. Therefore so e areas ill ot e up‐to‐date. The rest of Papua data % ould e take fro BPN Natio al La d Age y or BIG par el
or settle e t area , though this ill like fa e the sa e short o i gs as the ADB Su a approa h. This ould e ade uate for a first order esti ate of fu di g re uired, ut ould ot e ade uate for i ple e tatio pla i g. Ho ever, this ould e addressed later, e.g. efore these o essio s are prepared for revie y pote tial suppliers.
Esti atio ti e for taggi g as follo s:
# of da s # of da s
Pro i e # of Desa Populatio % ER # of HH per taggers per taggers
NTB , , , . , ,
Papua , , , . ,
Papua Barat , , , . ,
Total
Assu e
# of Buildi g House = # of HH
Capa ility for taggi g: tags/hour = uildi g per day, effe tive hour per day
e a ple NTB: . . tags / tags/hour
# of Tagger per provi e = Pak Nur e tio ed ould e used PLN stude t
We eed additio al days ~ o ths ~ eeks
I ase PLN ould ot provide the taggers, outsour e taggers ould e fi d out ith apa ilities as a GIS operator.
The uality a d availa ility of data a d the esti ate of taggi g ti e are ased o the follo i g i for atio .

A: Terms of Reference
A-9
Least-Cost Electrification Plan for Papua, Papua Barat, Maluku and Maluku Utara – December 2017

A: Terms of Reference
A-10
Least-Cost Electrification Plan for Papua, Papua Barat, Maluku and Maluku Utara – December 2017

A: Terms of Reference
A-11
Least-Cost Electrification Plan for Papua, Papua Barat, Maluku and Maluku Utara – December 2017

B-1
Least-Cost Electrification Plan for Papua, Papua Barat, Maluku and Maluku Utara – December 2017
APPENDIX B: DIFFERENCES WITH EARLIER WORLD BANK AND ADB STUDIES
Further details on the differences between this analysis and the earlier World Bank and ADB studies are as follows:
1. The geospatial representation of population distribution. The three-province analysis funded by World Bank represented the geospatial distribution of households only by either (i) recognizing the “settlement polygons” already identified on 1:25,000 maps from the Geospatial Information Agency (Badan Informasi Geospatial, BIG), and then allocating desa population to the polygons proportional to the size of each polygon, or (ii) simply assuming that the entire population in a desa is concentrated at the centroid of the desa. The principal shortcoming of this approach is that is clusters the population much more than in reality, resulting in a systematic bias towards grid extension. Moreover, the settlement and building data shown in the BIG maps is based on photogrammetric surveys conducted in 1996 to 1997.
The ADB study for Sumba took a more granular approach which recognized both BIG settlement polygons as well as individual buildings/structures identified on the BIG maps. In eastern Indonesia, many people in fact live outside of BIG settlement polygons (and certainly are not clustered at the desa centroid). The ADB Sumba results indicate that about 20% of the Sumba population will be served by off-grid solutions, whereas the World Bank three-province analysis suggests that 3% will be served by off-grid solutions across the region. Clearly there are significant policy and funding implications for these different results.
This study goes beyond both the earlier World Bank and ADB work by using actual rooftop tagging to provide a far more accurate geospatial representation of population distribution. Moreover, the Google Earth satellite imagery used for this study is typically only 1 to 3 years old, compared to the BIG 1:25,000 maps which were created in the mid-1990s.
Exhibit B.1 on the following page compares the three methods for a sample area taken in Sumba. The box in the lower left-hand corner compares the number of nodes identified for Sumba from three different sources:
The World Bank study of the three provinces
The ADB Sumba study
The data contained in the 1:25,000 BIG maps for Sumba
Clearly each of these representations will lead to very different technology choices, levels of investment and policies. Moreover, a rooftop tagging approach can be used for implementation planning, while the World Bank and ADB Sumba approaches bear little resemblance to current settlement patterns and hence would be of limited use for actual implementation planning.

B: Differences with Earlier World Bank and ADB Studies
B-2
Least-Cost Electrification Plan for Papua, Papua Barat, Maluku and Maluku Utara – December 2017
Exhibit B.1: Comparison of geospatial population distribution between the World Bank three-province study, the ADB Sumba study and actual rooftop tagging using Google Earth imagery. Sample area taken from Sumba Timur
2. Base assumptions. The World Bank-funded analysis assumed the following, which need to be revised to be more realistic:
Annual kWh consumption per household ranging from 703 kWh/HH to 1,125 kWh/HH, which is higher than actual consumption for rural households in eastern Indonesia. In comparison, the ADB Sumba study assumed a non-linear model of settlement demand as a function of settlement population, starting from a base level of 120 kWh/yr for single isolated household. The higher consumption assumptions applied in the World Bank-funded work again create a systematic bias towards grid extension by assuming much higher consumption than is likely to materialize.
Assumed grid energy costs (before MV/LV/connection investment) of USD 0.21 to 0.23/kWh depending on the province. Energy costs have fallen significantly since then; PLN reports 2016 generation costs of USD 0.173/kWh for Maluku and Maluku Utara, and USD 0.135/kWh for Papua and Papua Barat
Population data was based on 2010/2011 sources.
The least-cost plan results for Maluku and Maluku Utara in this study may invite comparison with the results of the earlier World Bank study for these same provinces. However, it is

B: Differences with Earlier World Bank and ADB Studies
B-3
Least-Cost Electrification Plan for Papua, Papua Barat, Maluku and Maluku Utara – December 2017
difficult to draw any conclusions from such a comparison given that that World Bank study was carried out four years earlier with data that was up to six years older. For example, the World Bank study started from a baseline of 63% electrification ratio in Maluku and 60% in Maluku Utara, whereas the values reported by the Directorate General of Electricity for end of 2015 were 84.8% and 94.5% respectively. Technology costs have changed significantly.
That said, there are significant differences in the results of the two studies. For example, the less granular approach taken in the World Bank study resulted in grid expansion plans that included interconnection between islands. Exhibit B.2 compares the geospatial results for an area around Ternate; the map on the left shows the result of this study, while the map on the right shows the result from the World Bank study. Clearly this affects the resulting plan and investment requirements.
Exhibit B.2: Sample Comparison of Results from This Study and Earlier World Bank Analysis

C-1
Least-Cost Electrification Plan for Papua, Papua Barat, Maluku and Maluku Utara – December 2017
APPENDIX C: MINI-GRID ECONOMIC MODEL
A simple model was developed to compare the nominal levelized cost of electricity from PV and diesel mini-grid generation. The inputs to the model are listed below. Yellow shaded cells are inputs that were varied within data tables to generate contours showing how levelized cost varies with the number of households served at selected fuel costs. Green shaded cells are user inputs. Cells without shading are intermediate calculations. Settlement demand was calculated using the model described in Section 3.3 of this report, and model results shown in Exhibit 1.3.
These results were compared to the 2017 budget for ESDM mini-grid systems with respect to the following metrics, as shown on the following page:
Installed PV capacity per household as a function of settlement size; Installed cost as a function of PV system capacity; Installed cost per kWp of PV capacity, as a function of number of households in the
settlement; and Installed cost per connection, as a function of the number of households in the
settlement.
These results align well taking into account that: ESDM systems are budgeted in only three sizes: 50, 75 and 100 kWp; ESDM systems appear to be oversized by as much as 65%25, hence kWp per
household for optimally sized systems is expected to be less that the ESDM budget; and
25 Amalia Suryani, “Promoting Technical Quality Measures for PV Mini-grid Development in Indonesia”, presentation for Off-Grid Power Conference at Intersolar 2017, Munich, 31 May 2017.
PV Mi i‐grid Diesel Mi i‐gridNu er of households Nu er of householdsAvg a ual o su ptio per HH . kWh/yr Avg o su ptio per HH . kWh/yrTotal daily settle e t o su ptio . kWh/day Total daily settle e t o s. . kWh/dayAvg daily peak su hours . hours/day Spe ifi fuel o su ptio . li/kWhBOS effi ie y % A ual O&M ost % of ap ostDayti e load portio % Delivered fuel pri e . USD/liBattery rou d trip effi ie y % No i al fuel pri e es alatio %Depth of dis harge % Ge erator apital ost USD/kWBattery lifeti e years I stallatio ost USD/kWPa els re uired kWp Shippi g/tra sport to site . ultiplierPa el pri e USD/kWp Ge erator size kW/HHI stallatio ost USD/kWp Civil orks , kWPV i verter pri e USD/kWp i flatio %Battery i verter pri e USD/kWp Dis ou t rate %Battery pri e USD/kWh Prese t Value Life‐Cy le Cost ,Shippi g/tra sport ost to site . ultiplier Prese t Value E ergy Produ tio ,Civil orks , USD LCOE . USD/kWhDis ou t rate %A ual O&M . % of ap ost Pa el degradatio . % *** ot used ***A ual USD i flatio %Cost per kWp i stalled , USD/kWpI stalled Cost per Co e tio , USD/ o e tiokWp per o e tio .Prese t Value Life‐Cy le Cost ,Prese t Value E ergy Produ tio ,LCOE . USD/kWh

C: Mini-Grid Economic Model
C-2
Least-Cost Electrification Plan for Papua, Papua Barat, Maluku and Maluku Utara – December 2017
The ESDM budget includes LV reticulation, whereas this model excludes it.
.
.
.
.
.
.
.
.
.
.
.
Istalled kW
p pe
r Hou
seho
ld
Nu er of Households i Settle e t
ESDM Budget Model
,
,
,
,
,
,
,
,
Istalled Co
st, U
SD
Syste Size, kWp
,
,
,
,
,
,
,
Istalled Co
st per kW
p, USD
/kWp
Nu er of Households i Settle e t

C: Mini-Grid Economic Model
C-3
Least-Cost Electrification Plan for Papua, Papua Barat, Maluku and Maluku Utara – December 2017
Network Planner inputs are shown in Appendices D and F by PLN area for Papua/Papua Barat and Maluku/Maluku Utara respectively. Network Planner does not use cost per Wp as a capital cost parameter, but generation capital costs have been calculated separately in terms of USD per Wp consistent with these Network Planner inputs. These vary by PLN Area based primarily on differences in insolation and accessibility.
The installed capital cost of PV mini-grids shown here by the orange contours is about USD 7/Wp, decreasing for larger settlements. This is consistent with PLN Area Jayapura, but somewhat higher than the least costly plants considered for Papua and Papua Barat. For example, the corresponding installed capital costs for PV mini-grid generation only in relatively accessible PLN areas such as Sorong and Manokwari works out to around USD 6.50/Wp, whereas for the least accessible areas such as Kabupaten Jayawijaya it increases to approximately USD 8.50/Wp. Costs for the other PLN Areas in Papua and Papua Barat fall in between, whereas costs for Maluku and Maluku Utara are at the lower end of this range.
‐
,
,
,
,
,
,
,
Istalled Co
st per Co
etio
, USD
Nu er of Households i Settle e t

D-1
Least-Cost Electrification Plan for Papua, Papua Barat, Maluku and Maluku Utara – December 2017
APPENDIX D: NETWORK PLANNER INPUTS FOR PAPUA AND PAPUA BARAT
This appendix presents the inputs to Network Planner, which are defined separately by PLN operational area. General assumptions also include the following:
1. Productive use and consumption by commercial, health, education and other public facilities are subsumed in “household” consumption;
2. All households are characterized the “rural” household parameters; there are no separate “urban” households in this analysis;
3. Population is expressed in number of households, not number of people; 4. Costs are expressed in USD; and 5. Mini-grids are assumed to be PV with batteries, though Network Planner can
accommodate diesel generation. However, as explained in Appendix C, PV mini-grids are used here.

D-2
Least-Cost Electrification Plan for Papua, Papua Barat, Maluku and Maluku Utara – December 2017
Net ork Pla er
Para eter
PLN Area Soro g
PLN Area Ma ok ari
e l. Ka upate Na ire
Ka upate Na ire
PLN Area Biak
PLN Area Ti ika
PLN Area Ja apura e ludi g Ka upate Ja a ija a
Ka upate Ja a ija a
PLN Area Merauke Area, e l. Ka upate Mappi
Ka upate Mappi Note
De ographi s, De a d & Fi a ial Para eters De a d urve poi ts populatio a d ultiplier
. . ; .
. ; .
. ; .
.
. . ; . . ; .
. ; .
.
. . ; . . ; .
. ; .
.
. . ; .
. ; .
. ; .
.
. . ; .
. ; .
. ; .
.
. . ; . . ; .
. ; .
.
. . ; . . ; .
. ; .
.
. . ; . . ; .
. ; .
.
. . ; . . ; .
. ; .
.
Represe ts o su ptio of appro i ately kWh/ o. for a isolated household, i reasi g as the u er of households i the settle e t i reases.
De a d urve type
)eroLogisti Li ear
)eroLogistiLi ear
)eroLogistiLi ear
)eroLogisti Li ear
)eroLogisti Li ear
)eroLogistiLi ear
)eroLogistiLi ear
)eroLogistiLi ear
)eroLogistiLi ear
)ero Logisti Li ear used si e it provides est represe tatio ; see Se . .
Household u it de a d per household per year
Whe this ase figure is applied i o ju tio ith the de a d urve spe ified a ove, the resulti g de a d starts at kWh/hh‐ o.
Target household pe etratio rate
. . . . . . . . . Based o dis ussio ith PLN Divisi Maluku & Papua
Peak de a d as fra tio of odal
de a d o urri g
. . . . . . . . . Nu er ased o dis ussio ith PLN Divisi Maluku &
Papua

D: Network Planner Inputs for Papua and Papua Barat
D-3
Least-Cost Electrification Plan for Papua, Papua Barat, Maluku and Maluku Utara – December 2017
Net ork Pla er
Para eter
PLN Area Soro g
PLN Area Ma ok ari
e l. Ka upate Na ire
Ka upate Na ire
PLN Area Biak
PLN Area Ti ika
PLN Area Ja apura e ludi g Ka upate Ja a ija a
Ka upate Ja a ija a
PLN Area Merauke Area, e l. Ka upate Mappi
Ka upate Mappi Note
duri g peak hours rural Peak ele tri al hours of operatio per year hours
Data take fro PLN Wilayah Papua & Papua Barat, a d fi alized ased o dis ussio ith PLN Divisi Maluku Papua
Mea household size – rural perso / household
This a alysis o du ted o asis of u er of
households rather tha u er of people i
settle e t Mea i ter‐household dista e
eters
Esti ated ased o revie of dista e et ee tags i a sa ple of settle e ts
Populatio ou t
, , , , , , , , , Nu er of household tags per regio .
Populatio gro th rate per year rural
. . . . . . . . . Take fro BPS Ka upate a ual pu li atio series, Ka upate dala A gka
. E o o i gro th rate per year
. . . . . . . . . Take fro BPS Ka upate a ual pu li atio series, the Ka upate dala A gka
.

D: Network Planner Inputs for Papua and Papua Barat
D-4
Least-Cost Electrification Plan for Papua, Papua Barat, Maluku and Maluku Utara – December 2017
Net ork Pla er
Para eter
PLN Area Soro g
PLN Area Ma ok ari
e l. Ka upate Na ire
Ka upate Na ire
PLN Area Biak
PLN Area Ti ika
PLN Area Ja apura e ludi g Ka upate Ja a ija a
Ka upate Ja a ija a
PLN Area Merauke Area, e l. Ka upate Mappi
Ka upate Mappi Note
I o e elasti ity of ele tri ity de a d
. . . . . . . . . Based o lo g‐ter e o o etri a alysis of PLN sales a d GDP data.
Dis ou t rate real
. . . . . . . . . Co siste t ith real WACC for PLN
Ti e horizo years
Provided y PLN Wilayah Papua & Papua Barat P B a d o fir ed ith PLN Divisi Maluku Papua
Ele tri it Distri utio Para eters Grid E te sio & PV Mi i Grid Lo voltage li e ost per eter
USD/ eter
. . . Provided y PLN Wilayah P B & o fir ed ith PLN Divisi Maluku Papua
Lo voltage li e e uip e t ost per o e tio USD/ o e tio
. . . . . . . . . Provided y PLN Wilayah P B & o fir ed ith PLN Divisi Maluku Papua
Lo voltage li e e uip e t operatio s &
. . . . . . . . . Provided y PLN Wilayah P B & o fir ed ith PLN Divisi Maluku Papua

D: Network Planner Inputs for Papua and Papua Barat
D-5
Least-Cost Electrification Plan for Papua, Papua Barat, Maluku and Maluku Utara – December 2017
Net ork Pla er
Para eter
PLN Area Soro g
PLN Area Ma ok ari
e l. Ka upate Na ire
Ka upate Na ire
PLN Area Biak
PLN Area Ti ika
PLN Area Ja apura e ludi g Ka upate Ja a ija a
Ka upate Ja a ija a
PLN Area Merauke Area, e l. Ka upate Mappi
Ka upate Mappi Note
ai te a e ost as fra tio of e uip e t ost Lo voltage li e lifeti e years
Provided y PLN Wilayah P B & o fir ed ith PLN Divisi Maluku Papua
Lo voltage li e operatio s a d ai te a e ost per year as fra tio of li e ost
. . . . . . . . . Provided y PLN Wilayah P B & o fir ed ith PLN Divisi Maluku Papua
Grid E te sio Para eters Availa le syste apa ities tra sfor er ‐ kW
.
.
.
.
. . . .
.
.
.
.
. . . .
.
.
.
.
. . . .
.
. .
.
. .
.
. . . . .
.
. . . . .
Provided y PLN Wilayah P B & o fir ed ith PLN Divisi Maluku Papua. Assu ed that kVa rati g is e uivale t to kW give short ter overload apa ility
Distri utio loss
. . . . . . . . . Provided y PLN Wilayah P B & o fir ed ith PLN

D: Network Planner Inputs for Papua and Papua Barat
D-6
Least-Cost Electrification Plan for Papua, Papua Barat, Maluku and Maluku Utara – December 2017
Net ork Pla er
Para eter
PLN Area Soro g
PLN Area Ma ok ari
e l. Ka upate Na ire
Ka upate Na ire
PLN Area Biak
PLN Area Ti ika
PLN Area Ja apura e ludi g Ka upate Ja a ija a
Ka upate Ja a ija a
PLN Area Merauke Area, e l. Ka upate Mappi
Ka upate Mappi Note
Divisi Maluku Papua
Ele tri ity ost per kilo att‐hour USD/kWh
. . . . . . . . . Provided y PLN Wilayah P B & o fir ed ith PLN Divisi Maluku Papua
I stallatio ost per o e tio USD/ o etio
Not used as it ould dou le ou t distri utio osts
Mediu voltage li e ost per eter
USD/ eter
. . . . . . . . . Provided y PLN Wilayah P B & o fir ed ith PLN Divisi Maluku Papua. I ludes o du tor, poles, i sulators, i stallatio a d la d a ess.
Mediu voltage li e lifeti e years
Provided y PLN Wilayah P B & o fir ed ith PLN Divisi Maluku Papua
Mediu voltage li e operatio s a d ai te a e ost per year
. . . . . . . . . Provided y PLN Wilayah P B & o fir ed ith PLN Divisi Maluku Papua

D: Network Planner Inputs for Papua and Papua Barat
D-7
Least-Cost Electrification Plan for Papua, Papua Barat, Maluku and Maluku Utara – December 2017
Net ork Pla er
Para eter
PLN Area Soro g
PLN Area Ma ok ari
e l. Ka upate Na ire
Ka upate Na ire
PLN Area Biak
PLN Area Ti ika
PLN Area Ja apura e ludi g Ka upate Ja a ija a
Ka upate Ja a ija a
PLN Area Merauke Area, e l. Ka upate Mappi
Ka upate Mappi Note
as fra tio of li e ost Tra sfor er ost per grid syste kilo att USD/kW
. . Provided y PLN Wilayah P B & o fir ed ith PLN Divisi Maluku Papua
Tra sfor er lifeti e years
Provided y PLN Wilayah P B & o fir ed ith PLN Divisi Maluku Papua
Tra sfor er operatio s a d ai te a e ost per year as fra tio of tra sfor er ost
. . . . . . . . . Provided y PLN Wilayah P B & o fir ed ith PLN Divisi Maluku Papua
PV Mi i Grid Para eters Availa le po er ge eratio syste apa ities kW
Based o the availa ility of the s allest off‐grid i verter that has so e grid o trol syste apa ility. A kW o ti uous load syste a e used as the fou datio of
a i i‐grid syste

D: Network Planner Inputs for Papua and Papua Barat
D-8
Least-Cost Electrification Plan for Papua, Papua Barat, Maluku and Maluku Utara – December 2017
Net ork Pla er
Para eter
PLN Area Soro g
PLN Area Ma ok ari
e l. Ka upate Na ire
Ka upate Na ire
PLN Area Biak
PLN Area Ti ika
PLN Area Ja apura e ludi g Ka upate Ja a ija a
Ka upate Ja a ija a
PLN Area Merauke Area, e l. Ka upate Mappi
Ka upate Mappi Note
Capa ity fa tor of ge eratio as fa tor of a eplate
output
. . . . . . . . . Based o usa le e ergy ge erated after all losses i ludi g pa el’s ther al losses a d rou d‐trip attery effi ie y. Usa le
e ergy ge erated is the divided y the a eplate po er rati g of the syste ultiplied y hours
Distri utio loss
. . . . . . . . . I do esia ’s ele tri al ode PUIL , . . . allo s up to % voltage loss i the e tra lo voltage et ork. I ge eral, the voltage loss a ot e eed % PUIL
, . . . E ergy storage ost per kWh USD/kWh
. . . . . . . . . LCOE al ulatio of the storage ost ased o the follo i g assu ptio s a d varia les: ‐ i stalled ost i ludi g tra sport to site ‐ % a i u DoD ‐ day of auto o y ‐ % dis ou t rate ‐ year syste lifeti e ‐ year attery repla e e t
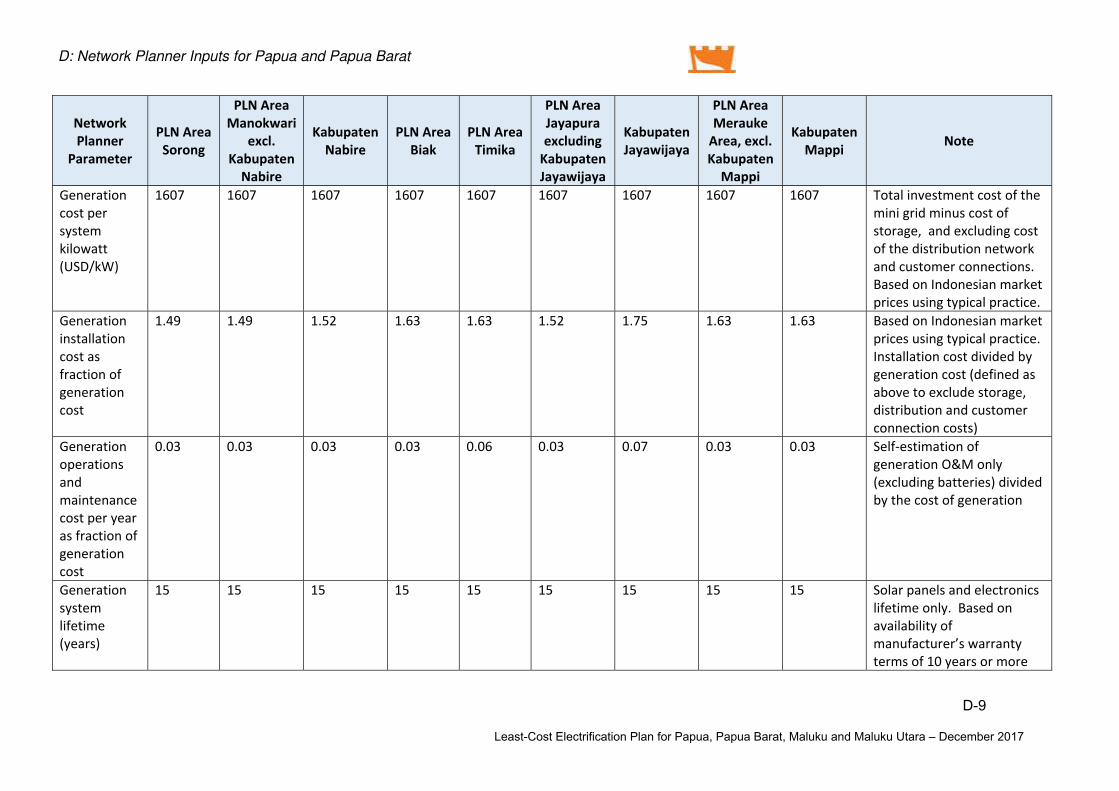
D: Network Planner Inputs for Papua and Papua Barat
D-9
Least-Cost Electrification Plan for Papua, Papua Barat, Maluku and Maluku Utara – December 2017
Net ork Pla er
Para eter
PLN Area Soro g
PLN Area Ma ok ari
e l. Ka upate Na ire
Ka upate Na ire
PLN Area Biak
PLN Area Ti ika
PLN Area Ja apura e ludi g Ka upate Ja a ija a
Ka upate Ja a ija a
PLN Area Merauke Area, e l. Ka upate Mappi
Ka upate Mappi Note
Ge eratio ost per syste kilo att USD/kW
Total i vest e t ost of the i i grid i us ost of
storage, a d e ludi g ost of the distri utio et ork a d usto er o e tio s. Based o I do esia arket pri es usi g typi al pra ti e.
Ge eratio i stallatio ost as fra tio of ge eratio ost
. . . . . . . . . Based o I do esia arket pri es usi g typi al pra ti e. I stallatio ost divided y ge eratio ost defi ed as a ove to e lude storage, distri utio a d usto er o e tio osts
Ge eratio operatio s a d ai te a e ost per year as fra tio of ge eratio ost
. . . . . . . . . Self‐esti atio of ge eratio O&M o ly e ludi g atteries divided y the ost of ge eratio
Ge eratio syste lifeti e years
Solar pa els a d ele tro i s lifeti e o ly. Based o availa ility of a ufa turer’s arra ty
ter s of years or ore

D: Network Planner Inputs for Papua and Papua Barat
D-10
Least-Cost Electrification Plan for Papua, Papua Barat, Maluku and Maluku Utara – December 2017
Net ork Pla er
Para eter
PLN Area Soro g
PLN Area Ma ok ari
e l. Ka upate Na ire
Ka upate Na ire
PLN Area Biak
PLN Area Ti ika
PLN Area Ja apura e ludi g Ka upate Ja a ija a
Ka upate Ja a ija a
PLN Area Merauke Area, e l. Ka upate Mappi
Ka upate Mappi Note
oth solar pa els a d ele tro i s
Mi i u size of daily apa ity of e ergy storage syste kWh
. . . . . . . . . To al ays refle t Net ork Pla er’s al ulated value this is set to . kWh per day. U less the NP al ulatio retur s a ythi g less tha . kWh per year, the odel ill al ays use NP’s al ulated value
Per e t of daily load that re uires storage or fuel
. . . . . . . . . Assu es that ost of the solar PV i i grid’s storage is for use at ight, ut that there ill e so e dayti e use ithi the settle e t for o ‐lighti g produ tive loads
Utilizatio fa tor of po er ge eratio as fa tor of a eplate
output
Solar PV a d atteries have a ear u ity . utilizatio fa tor due to havi g ele tro i s dispat hi g the e ergy i stead of e ha i al syste s. A kW
i verter ill produ e kW of po er

D: Network Planner Inputs for Papua and Papua Barat
D-11
Least-Cost Electrification Plan for Papua, Papua Barat, Maluku and Maluku Utara – December 2017
Net ork Pla er
Para eter
PLN Area Soro g
PLN Area Ma ok ari
e l. Ka upate Na ire
Ka upate Na ire
PLN Area Biak
PLN Area Ti ika
PLN Area Ja apura e ludi g Ka upate Ja a ija a
Ka upate Ja a ija a
PLN Area Merauke Area, e l. Ka upate Mappi
Ka upate Mappi Note
Off Grid Para eter Solar Ho e S ste Availa le syste apa ities ‐ diesel ge erator kW
Diesel is ot o sidered here for off‐grid, so this value is set to a ar itrarily high threshold to preve t i orporatio of diesel i to the osti g.
Availa le syste apa ities ‐ photovoltai pa el kWp
. . . . . . . . . SolarWorld Off‐grid spe ifi solar PV odules are urre tly availa le i atts a d atts
i re e ts; a average is used here. This is a Tier solar PV odule fro Ger a y As ertified y Bloo erg Ne E ergy Fi a e
Diesel fuel ost per liter USD/liter
Off grid does ot use diesel fuel i this a alysis, so value set to
Diesel fuel liters o su ed per kilo att‐hour liter/kWh
Off grid does ot use diesel fuel i this a alysis, so value set to

D: Network Planner Inputs for Papua and Papua Barat
D-12
Least-Cost Electrification Plan for Papua, Papua Barat, Maluku and Maluku Utara – December 2017
Net ork Pla er
Para eter
PLN Area Soro g
PLN Area Ma ok ari
e l. Ka upate Na ire
Ka upate Na ire
PLN Area Biak
PLN Area Ti ika
PLN Area Ja apura e ludi g Ka upate Ja a ija a
Ka upate Ja a ija a
PLN Area Merauke Area, e l. Ka upate Mappi
Ka upate Mappi Note
Diesel ge erator ost per diesel syste kilo att USD/kW
Off grid does ot use diesel fuel i this a alysis, so value set to
Diesel ge erator hours of operatio per year – i i u
hours
Off grid does ot use diesel fuel i this a alysis, so value set to
Diesel ge erator i stallatio ost as fra tio of ge erator ost
Off grid does ot use diesel fuel i this a alysis, so value set to
Diesel ge erator lifeti e years
Although diesel is ot used i this a alysis, ust e set > other ise ge erates a divide‐ y‐zero error.
Diesel ge erator operatio s
Off grid does ot use diesel fuel i this a alysis, so value set to

D: Network Planner Inputs for Papua and Papua Barat
D-13
Least-Cost Electrification Plan for Papua, Papua Barat, Maluku and Maluku Utara – December 2017
Net ork Pla er
Para eter
PLN Area Soro g
PLN Area Ma ok ari
e l. Ka upate Na ire
Ka upate Na ire
PLN Area Biak
PLN Area Ti ika
PLN Area Ja apura e ludi g Ka upate Ja a ija a
Ka upate Ja a ija a
PLN Area Merauke Area, e l. Ka upate Mappi
Ka upate Mappi Note
a d ai te a e ost per year as fra tio of ge erator ost Peak su hours per year hours/year
TIER Glo al Solar Dataset k ; see Se tio .
Photovoltai ala e ost
as fra tio of pa el ost
. . . . . . . . . Bala e of syste ost ost of syste i us pa els a d atteries ased o arket
pri es i I do esia. I ludes e pe ted ost ultiplier i getti g the o po e ts to the site a d i ludes la or osts
Photovoltai ala e
lifeti e years
High uality o po e ts typi ally have fa tory arra ties of to years,
a d u der or al o ditio s i I do esia a last years. Batteries typi ally fail efore the ele tro i s assu i g the i stallatio as do e

D: Network Planner Inputs for Papua and Papua Barat
D-14
Least-Cost Electrification Plan for Papua, Papua Barat, Maluku and Maluku Utara – December 2017
Net ork Pla er
Para eter
PLN Area Soro g
PLN Area Ma ok ari
e l. Ka upate Na ire
Ka upate Na ire
PLN Area Biak
PLN Area Ti ika
PLN Area Ja apura e ludi g Ka upate Ja a ija a
Ka upate Ja a ija a
PLN Area Merauke Area, e l. Ka upate Mappi
Ka upate Mappi Note
properly a d the o ditio s are ot e tre e
Photovoltai attery ost
per kilo att‐hour USD/kWh
This is a o su er arket pri e i I do esia for a
VDC VRLA Flooded Lead A id atteries of a average uality that is spe ifi ally
desig ed for re e a le e ergy use ith daily dis harges. Tra sportatio ost i luded.
Photovoltai attery
kilo att‐hours per photovoltai o po e t kilo att kWh/kW
. . . . . . Cal ulated ased o the kWh of storage re uired per kilo att of solar PV pa els i stalled. Takes i to a ou t all losses i ludi g rou d‐trip effi ie y a d o po e t losses a d ‐day of auto o y ith % a i u depth of
dis harge Photovoltai attery
lifeti e years
Assu i g Daily dis harge of % a d °C, lifeti e to % i itial apa ity, usi g V VRLA ells usi g a
typi al re e a le e ergy attery. Lifeti e y le

D: Network Planner Inputs for Papua and Papua Barat
D-15
Least-Cost Electrification Plan for Papua, Papua Barat, Maluku and Maluku Utara – December 2017
Net ork Pla er
Para eter
PLN Area Soro g
PLN Area Ma ok ari
e l. Ka upate Na ire
Ka upate Na ire
PLN Area Biak
PLN Area Ti ika
PLN Area Ja apura e ludi g Ka upate Ja a ija a
Ka upate Ja a ija a
PLN Area Merauke Area, e l. Ka upate Mappi
Ka upate Mappi Note
adjusted fro spe ified urve fro a ufa turer do e at °C ith a ultiplier of . a ufa turer supplied
Photovoltai o po e t effi ie y loss
. . . . . . . . . Losses take i to a ou t pa el ther al losses % plus other BOS losses % e ludi g attery rou d‐trip effi ie y. Derived fro a ufa turers’ spe ifi atio
Photovoltai o po e t operatio s a d ai te a e ost per year as fra tio of o po e t ost
. . . . . . . . . Co sulta t’s al ulatio taki g i to a ou t travel, lo al staff, re ote o itori g a d other osts
re uired to eet the syste ’s lifeti e esti atio as used i other i puts
Photovoltai pa el ost per photovoltai o po e t kilo att USD/kW
, , , , , , , , , Ma ufa turer’s uotatio for CIF ost Jakarta plus osts to get it to the site

D: Network Planner Inputs for Papua and Papua Barat
D-16
Least-Cost Electrification Plan for Papua, Papua Barat, Maluku and Maluku Utara – December 2017
Net ork Pla er
Para eter
PLN Area Soro g
PLN Area Ma ok ari
e l. Ka upate Na ire
Ka upate Na ire
PLN Area Biak
PLN Area Ti ika
PLN Area Ja apura e ludi g Ka upate Ja a ija a
Ka upate Ja a ija a
PLN Area Merauke Area, e l. Ka upate Mappi
Ka upate Mappi Note
Photovoltai pa el lifeti e years
Typi al perfor a e arra ty period ith prove
la oratory a elerated tests a d field perfor a e of years or lo ger. O ly valid for good uality pa els; heap pa els fre ue tly fail or sig ifi a tly u derperfor
Note
. Groupi g of Net ork Pla er Para eter is ased o PLN Worki g Area
. Ka upate Jaya ijaya is u der PLN Area Jayapura; ho ever the a alysis is separated due to differe t tra sportatio ost i this area as Jaya ijaya is ou tai ous area
. Ka upate Mappi is u der PLN Area Merauke orki g area. The a alysis is separated as groupi g i to o e a alysis resulted i to u realisti pla there is o e lo g dire t grid o e tio fro Merauke ity to Mappi
. Ka upate Na ire is u der PLN Area Ma ok ari Papua Barat Provi e ; the a alysis is separated as Ka upate Na ire is at Papua Provi e

E-1
Least-Cost Electrification Plan for Papua, Papua Barat, Maluku and Maluku Utara – December 2017
APPENDIX E: CLASSIFICATION OF ISLANDS IN MALUKU AND MALUKU UTARA
The following table classifies 126 populated islands in Maluku and Maluku Utara according to their electricity supply status:
Islands with no PLN supply Islands for which all settlements are within the existing PLN MV grid buffer (“Fully
Electrified”). Settlements of 15 households or less as well as individual isolated households are excluded from this analysis.
Islands with a mix of settlements of greater than 15 households within and outside of the existing PLN MV grid buffer, and a total island population of greater than 2,500 households.
Islands with a mix of settlements of greater than 15 households within and outside of the existing PLN MV grid buffer, and a total island population of less than 2,500 households.
The classification of each island is based on the characterization of settlement nodes and number of households as measured by household rooftop tags for each island as provided in the table. Note that some islands with electricity supply have “community” supply in addition to PLN. This typically consists of diesel or PV mini-grids that have been supplied through national or local government programs without the involvement of PLN.
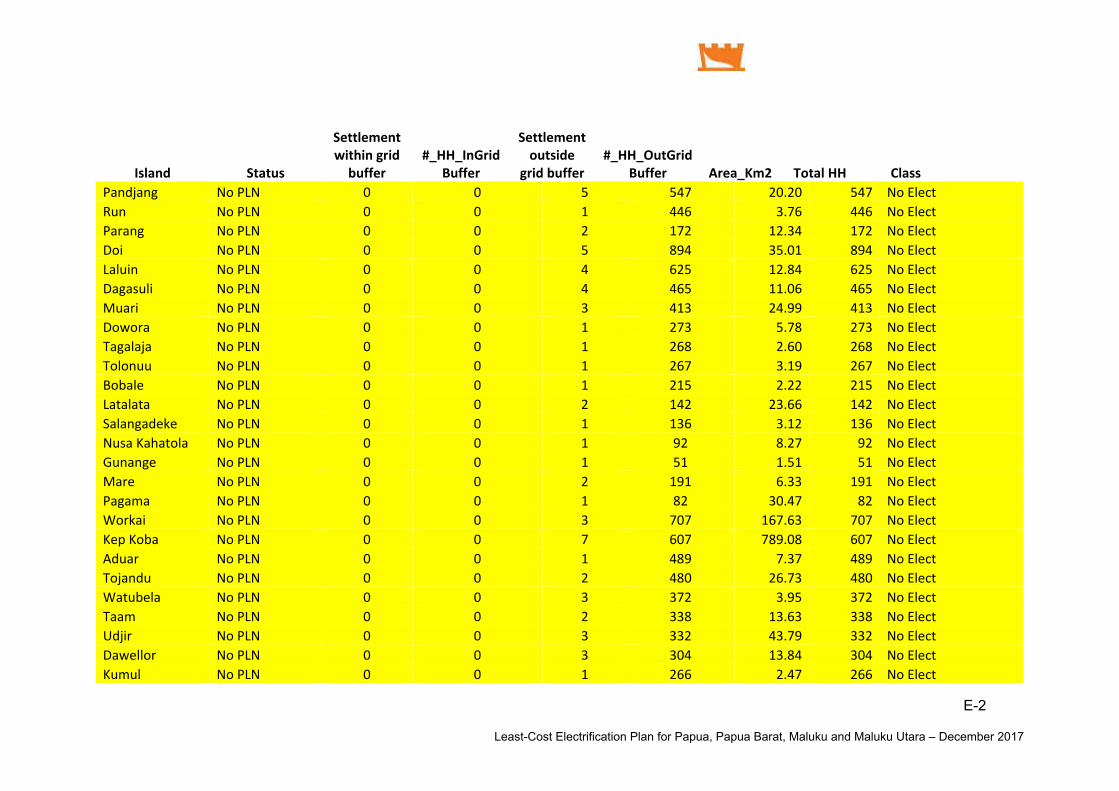
E-2
Least-Cost Electrification Plan for Papua, Papua Barat, Maluku and Maluku Utara – December 2017
Isla d Status
Settle e t ithi grid uffer
#_HH_I GridBuffer
Settle e t outside
grid uffer #_HH_OutGrid
Buffer Area_K Total HH Class Pa dja g No PLN . No Ele t Ru No PLN . No Ele t Para g No PLN . No Ele t Doi No PLN . No Ele t Lalui No PLN . No Ele t Dagasuli No PLN . No Ele t Muari No PLN . No Ele t Do ora No PLN . No Ele t Tagalaja No PLN . No Ele t Tolo uu No PLN . No Ele t Bo ale No PLN . No Ele t Latalata No PLN . No Ele t Sala gadeke No PLN . No Ele t Nusa Kahatola No PLN . No Ele t Gu a ge No PLN . No Ele t Mare No PLN . No Ele t Paga a No PLN . No Ele t Workai No PLN . No Ele t Kep Ko a No PLN . No Ele t Aduar No PLN . No Ele t Toja du No PLN . No Ele t Watu ela No PLN . No Ele t Taa No PLN . No Ele t Udjir No PLN . No Ele t Da ellor No PLN . No Ele t Ku ul No PLN . No Ele t

E: Classification of Islands in Maluku and Maluku Utara
E-3
Least-Cost Electrification Plan for Papua, Papua Barat, Maluku and Maluku Utara – December 2017
Isla d Status
Settle e t ithi grid uffer
#_HH_I GridBuffer
Settle e t outside
grid uffer #_HH_OutGrid
Buffer Area_K Total HH Class Da era No PLN . No Ele t Dai No PLN . No Ele t Djursia No PLN . No Ele t Kara eira Besar No PLN . No Ele t Baraka No PLN . No Ele t Ma ggur No PLN . No Ele t Kai eer No PLN . No Ele t Lai o ar No PLN . No Ele t Turtutjuri g No PLN . No Ele t Ta ar No PLN . No Ele t Wotap No PLN . No Ele t Fadol No PLN . No Ele t Wodi u No PLN . No Ele t Na aa No PLN . No Ele t Nursee No PLN . No Ele t Mitak No PLN . No Ele t Maru No PLN . No Ele t Walir No PLN . No Ele t Buru PLN , , , . , Mi ed > , HH Sera PLN , , , . , Mi ed > , HH Kep Ba da Naira PLN , . , Mi ed > , HH Goro g PLN , . , Mi ed > , HH Hal ahera PLN , , , . , Mi ed > , HH O ira PLN , , . , Mi ed > , HH Ma dioli PLN , . , Mi ed > , HH Tidore PLN , , . , Mi ed > , HH Batja PLN , . , Mi ed > , HH

E: Classification of Islands in Maluku and Maluku Utara
E-4
Least-Cost Electrification Plan for Papua, Papua Barat, Maluku and Maluku Utara – December 2017
Isla d Status
Settle e t ithi grid uffer
#_HH_I GridBuffer
Settle e t outside
grid uffer #_HH_OutGrid
Buffer Area_K Total HH Class Sula es PLN , . , Mi ed > , HH Tali u PLN , , . , Mi ed > , HH Ma goli PLN , , . , Mi ed > , HH Makia PLN , . , Mi ed > , HH Ja de a PLN , , . , Mi ed > , HH War ar PLN/Co u ity , . , Mi ed > , HH Kai Ketjil PLN , . , Mi ed > , HH Ko roor PLN , , , . , Mi ed > , HH Wetar PLN , , . , Mi ed > , HH Kai Besar PLN , , . , Mi ed > , HH Kela g PLN . Mi ed < , HH Ma a oka PLN , . , Mi ed < , HH Kep Boa o PLN . Mi ed < , HH Kasiruta PLN , . , Mi ed < , HH Bisa PLN/Co u ity , . , Mi ed < , HH Morotai PLN/Co u ity , , . , Mi ed < , HH Kajoa PLN . , Mi ed < , HH Ge e PLN/Co u ity . Mi ed < , HH Kep. Gurai i PLN . Mi ed < , HH Kep. Djoro ga PLN/Co u ity . Mi ed < , HH O ilatu PLN/Co u ity . Mi ed < , HH Go u u PLN/Co u ity . Mi ed < , HH Tra ga PLN/Co u ity , , . , Mi ed < , HH Woka PLN/Co u ity , , . , Mi ed < , HH Da ar PLN/Co u ity . , Mi ed < , HH Ro a g PLN/Co u ity . , Mi ed < , HH Ser ata PLN , . , Mi ed < , HH

E: Classification of Islands in Maluku and Maluku Utara
E-5
Least-Cost Electrification Plan for Papua, Papua Barat, Maluku and Maluku Utara – December 2017
Isla d Status
Settle e t ithi grid uffer
#_HH_I GridBuffer
Settle e t outside
grid uffer #_HH_OutGrid
Buffer Area_K Total HH Class Kola PLN/Co u ity . Mi ed < , HH Kur PLN/Co u ity . Mi ed < , HH Masela PLN/Co u ity . Mi ed < , HH Fordate PLN/Co u ity . Mi ed < , HH Lakor PLN . Mi ed < , HH Tioor PLN/Co u ity . Mi ed < , HH Lira g PLN . Mi ed < , HH A o PLN , . , Full Ele t. Saparua PLN , . , Full Ele t. Haruku PLN , . , Full Ele t. Nusa Laut PLN , . , Full Ele t. Ma ipa PLN , . , Full Ele t. A elau PLN . Full Ele t. Kep Cera Laut PLN , . , Full Ele t. Ai PLN . Full Ele t. Roze gai PLN . Full Ele t. Bau PLN/Co u ity , . , Full Ele t. Ma oat PLN/Co u ity , . , Full Ele t. Miti PLN . Full Ele t. Da ar PLN/Co u ity . Full Ele t. Tapat PLN/Co u ity . Full Ele t. Ju PLN/Co u ity . Full Ele t. Ter ate PLN , , Full Ele t. Moti PLN , . , Full Ele t. Hiri PLN . Full Ele t. Maitara PLN . Full Ele t. Kai Dulah PLN , . , Full Ele t.

E: Classification of Islands in Maluku and Maluku Utara
E-6
Least-Cost Electrification Plan for Papua, Papua Barat, Maluku and Maluku Utara – December 2017
Isla d Status
Settle e t ithi grid uffer
#_HH_I GridBuffer
Settle e t outside
grid uffer #_HH_OutGrid
Buffer Area_K Total HH Class Kisar PLN , . , Full Ele t. Ba ar PLN , . , Full Ele t. Leti PLN , . , Full Ele t. Selaru PLN/Co u ity , . , Full Ele t. Moa PLN/Co u ity , . , Full Ele t. Kasiui PLN . Full Ele t. Larat PLN/Co u ity . Full Ele t. Weta PLN . Full Ele t. He iaar PLN/Co u ity . Full Ele t. Meati iara g PLN . Full Ele t. Duroa PLN . Full Ele t. Molu PLN . Full Ele t. Sera PLN/Co u ity . Full Ele t. War al PLN/Co u ity . Full Ele t. Utir PLN/Co u ity . Full Ele t. Mariri PLN/Co u ity . Full Ele t. Bi aar PLN/Co u ity . Full Ele t. Wuliaru PLN/Co u ity . Full Ele t. Pe a ulai PLN/Co u ity . Full Ele t.

F-1
Least-Cost Electrification Plan for Papua, Papua Barat, Maluku and Maluku Utara – December 2017
APPENDIX F: NETWORK PLANNER INPUTS FOR MALUKU AND MALUKU UTARA

F-2
Least-Cost Electrification Plan for Papua, Papua Barat, Maluku and Maluku Utara – December 2017
Para eter U it Area A o
Area Masohi ‐ Sera
Area Sofifi
Area Ter ate Area Tual Co e t
Fi a e
A ual e o o i gro th
per e tage as de i al per year
. . . . . Maluku Utara Dala A gka tahu p. & Maluku Dala A gka tahu
p.
I o e elasti ity of de a d ‐ . . . . .
Based o e o o etri a alysis of total PLN sales; sa e value used for Papua & Papua Barat
Real dis ou t rate per e tage as de i al per year
. . . . . Co siste t ith real WACC for PLN
Pla i g period years . . . . .
Refle ts PLN's target progra o pletio date. Co fir ed y PLN Wilayah Papua & Papua Barat a d PLN Divisi Maluku Papua
De ographi s
Average u er of fa ily e ers per household ‐ rural
u er . . . . .
This a alysis o du ted o asis of u er of households rather tha u er of people i settle e t. No
disti tio is ade et ee rural a d ur a areas.
Average u er of fa ily e ers per household ‐ ur a
u er . . . . . As a ove.

F: Network Planner Inputs for Maluku and Maluku Utara
F-3
Least-Cost Electrification Plan for Papua, Papua Barat, Maluku and Maluku Utara – December 2017
Para eter U it Area A o
Area Masohi ‐ Sera
Area Sofifi
Area Ter ate Area Tual Co e t
Average dista e et ee households Meter . . . . .
Based o satellite i agery of a sa ple of settle e ts through Maluku a d Maluku Utara
Total populatio Households , , , , , Total u er of rooftop tags
Populatio gro th rate ‐ rural
per e tage as de i al per year
. . . . .
Figures for Areas Sofifi a d Ter ate take fro BPS populatio gro th proje tio for Maluku Utara. For Areas A o , Masohi a d Tual proje ted populatio gro th for Maluku is used.
Populatio gro th rate ‐ ur a
per e tage as de i al per year
. . . . . As a ove. No disti tio ade et ee rural a d ur a areas.
Ur a populatio threshold Households , , , , ,
This value is ot releva t, si e the sa e values for other para eters are used for oth rural a d ur a varia les.
Ele tri it De a d
E ergy o su ptio duri g peak period as a portio of total o su ptio ‐ rural
fra tio . . . . . Follo s typi al rural load shape; agreed ith PLN Divisio for Maluku a d Papua
E ergy o su ptio duri g peak period as a portio of total o su ptio ‐ ur a
fra tio . . . . . As a ove ‐ o disti tio et ee rural a d ur a areas i this a alysis.
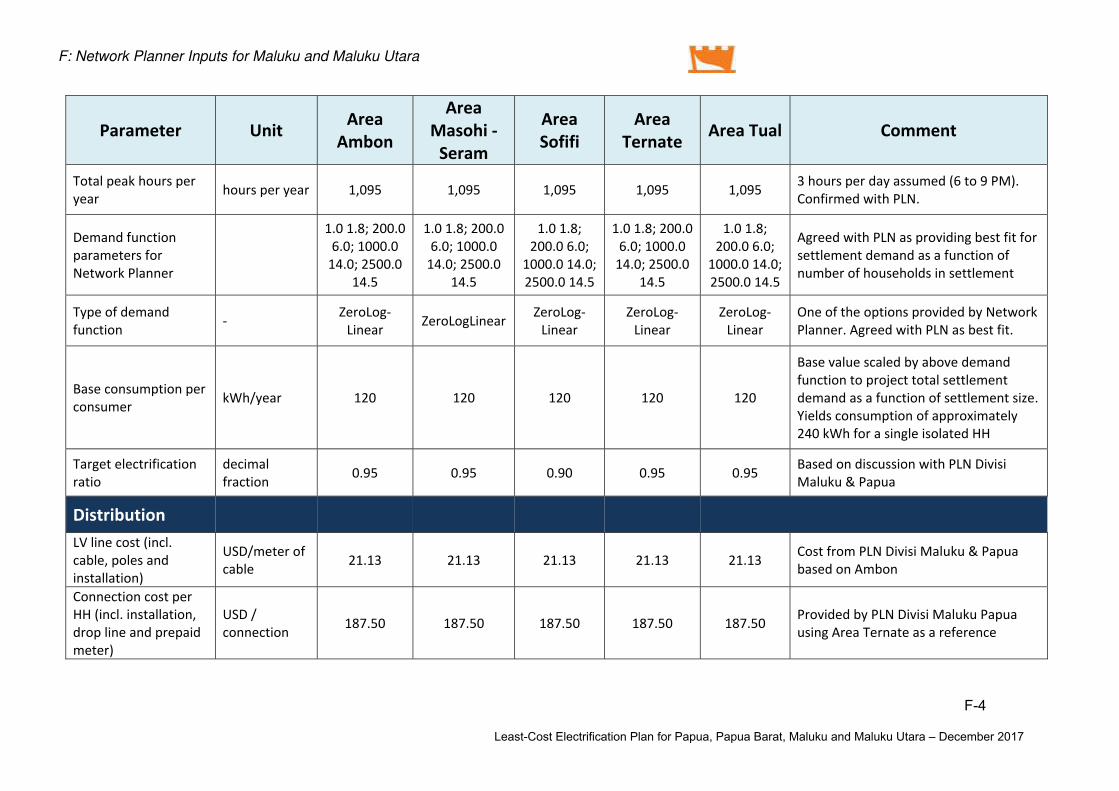
F: Network Planner Inputs for Maluku and Maluku Utara
F-4
Least-Cost Electrification Plan for Papua, Papua Barat, Maluku and Maluku Utara – December 2017
Para eter U it Area A o
Area Masohi ‐ Sera
Area Sofifi
Area Ter ate Area Tual Co e t
Total peak hours per year hours per year , , , , , hours per day assu ed to PM .
Co fir ed ith PLN.
De a d fu tio para eters for Net ork Pla er
. . ; . . ; . . ; .
.
. . ; . . ; . . ; .
.
. . ; . . ; . . ; . .
. . ; . . ; . . ; .
.
. . ; . . ; . . ; . .
Agreed ith PLN as providi g est fit for settle e t de a d as a fu tio of u er of households i settle e t
Type of de a d fu tio ‐ )eroLog‐
Li ear )eroLogLi ear )eroLog‐Li ear
)eroLog‐Li ear
)eroLog‐Li ear
O e of the optio s provided y Net ork Pla er. Agreed ith PLN as est fit.
Base o su ptio per o su er kWh/year
Base value s aled y a ove de a d fu tio to proje t total settle e t de a d as a fu tio of settle e t size. Yields o su ptio of appro i ately
kWh for a si gle isolated HH
Target ele trifi atio ratio
de i al fra tio . . . . . Based o dis ussio ith PLN Divisi
Maluku & Papua
Distri utio
LV li e ost i l. a le, poles a d i stallatio
USD/ eter of a le . . . . . Cost fro PLN Divisi Maluku & Papua
ased o A o
Co e tio ost per HH i l. i stallatio , drop li e a d prepaid eter
USD / o e tio . . . . . Provided y PLN Divisi Maluku Papua
usi g Area Ter ate as a refere e

F: Network Planner Inputs for Maluku and Maluku Utara
F-5
Least-Cost Electrification Plan for Papua, Papua Barat, Maluku and Maluku Utara – December 2017
Para eter U it Area A o
Area Masohi ‐ Sera
Area Sofifi
Area Ter ate Area Tual Co e t
O&M ost for usto er o e tio s
de i al fra tio of total i stalled ost
. . . . . Provided y PLN Divisi Maluku Papua usi g Area Ter ate as a refere e
LV li e lifeti e years Provided y PLN Divisi Maluku Papua usi g Area Ter ate as a refere e
O&M ost for LV li e
de i al fra tio of total i stalled ost
. . . . .
Provided y PLN Divisi Maluku Papua usi g Area Ter ate as a refere e
Off‐grid S ste s Solar Ho e S ste s
Availa le Syste Capa ities diesel ge erator
kVA , , , , ,
Diesel is ot o sidered here for off‐grid, so this value is set to a ar itrarily high threshold to preve t i orporatio of diesel i to the osti g
Availa le Syste Capa ities PV pa els kWp . . . . .
SolarWorld Off‐grid spe ifi solar PV odules are urre tly availa le i atts a d atts i re e ts; a
average is used here. This is a Tier solar PV odule fro Ger a y As ertified y Bloo erg Ne E ergy Fi a e
Diesel fuel ost USD/li . . . . . Off grid does ot use diesel fuel i this a alysis, so value set to

F: Network Planner Inputs for Maluku and Maluku Utara
F-6
Least-Cost Electrification Plan for Papua, Papua Barat, Maluku and Maluku Utara – December 2017
Para eter U it Area A o
Area Masohi ‐ Sera
Area Sofifi
Area Ter ate Area Tual Co e t
Diesel fuel o su ptio li/kWh . . . . . Off grid does ot use diesel fuel i this
a alysis, so value set to Diesel ge erator ost per diesel syste kilo att
USD/kW . . . . . Off grid does ot use diesel fuel i this a alysis, so value set to
Diesel ge erator hours of operatio per year i i u
hours . . . . . Off grid does ot use diesel fuel i this a alysis, so value set to
Diesel ge erator i stallatio ost as a fra tio of ge erator ost
fra tio . . . . . Off grid does ot use diesel fuel i this a alysis, so value set to
Diesel ge erator lifeti e year
Although diesel is ot used i this a alysis, ust e set > other ise ge erates a divide‐ y‐zero error.
Diesel ge erator O&M ost per year
fra tio of ge ost . . . . . Off grid does ot use diesel fuel i this
a alysis, so value set to
Peak su hours per year hours , , , , ,
Take fro https://ire a. asdar.a .ae/gallery/# ap/ TIER Glo al Solar Dataset k
Photovoltai ala e ost as fra tio of pa el ost
fra tio . . . . .
Bala e of syste ost ost of syste i us pa els a d atteries ased o arket pri es i I do esia. I ludes
e pe ted ost ultiplier i getti g the o po e ts to the site a d i ludes i stallatio osts

F: Network Planner Inputs for Maluku and Maluku Utara
F-7
Least-Cost Electrification Plan for Papua, Papua Barat, Maluku and Maluku Utara – December 2017
Para eter U it Area A o
Area Masohi ‐ Sera
Area Sofifi
Area Ter ate Area Tual Co e t
Photovoltai ala e lifeti e years
High uality o po e ts typi ally have fa tory arra ties of to years, a d u der or al o ditio s i I do esia a last years.
Photovoltai attery ost per kWh USD/kWh . . . . .
Co su er arket pri e i I do esia for a VDC VRLA Flooded Lead A id atteries of average uality spe ifi ally
desig ed for re e a le e ergy use ith daily dis harges. Tra sportatio ost i luded.
Photovoltai attery kilo att‐hours per photovoltai o po e t kilo att
kWh/kWp . . . . .
Takes i to a ou t all losses i ludi g rou d‐trip effi ie y a d o po e t losses a d ‐day of auto o y ith % a i u depth of dis harge
Photovoltai attery lifeti e years . . . . .
Ma ufa turer data assu i g daily dis harge of % a d °C, lifeti e to
% i itial apa ity, usi g V VRLA ells
Photovoltai o po e t effi ie y loss
fra tio . . . . .
Assu es % pa el ther al loss a d % BOS loss. Battery rou d trip
effi ie y i luded i attery kWh apa ity per PV kWp
PV o po e t O&M ost per year fra tio . . . . .
I ludes tra sport osts, lo al staff, atio al e pert staff, o itori g, et ..
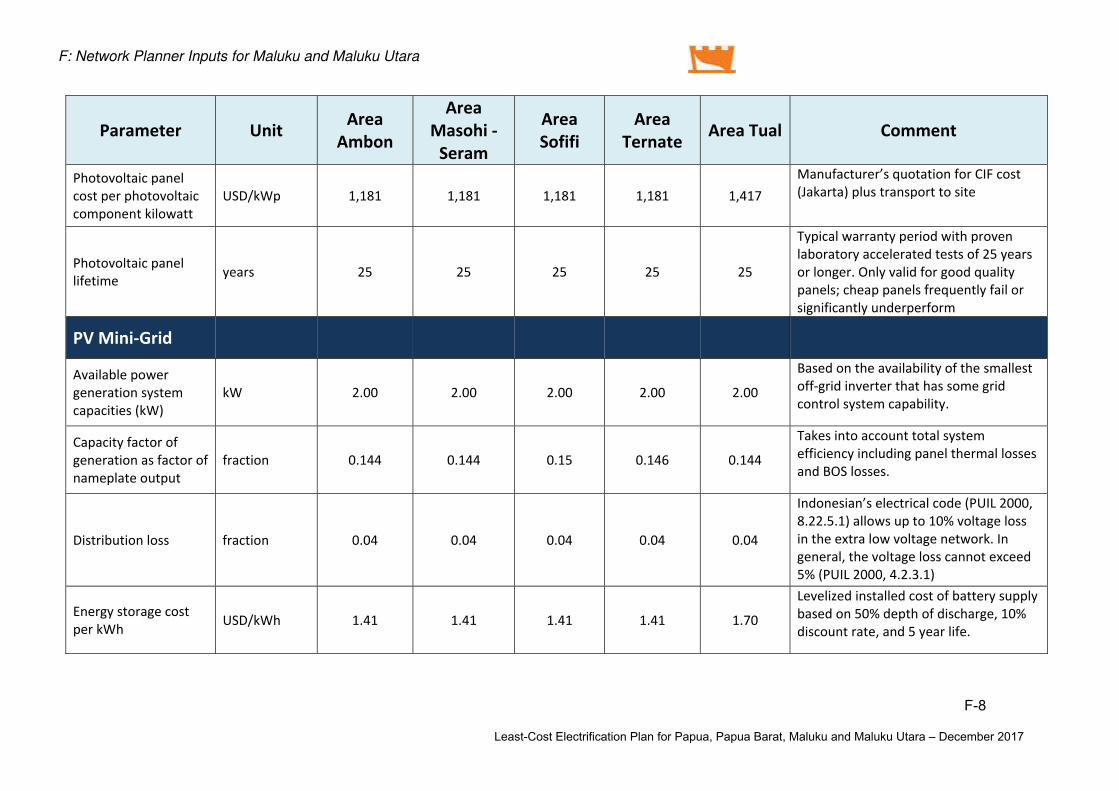
F: Network Planner Inputs for Maluku and Maluku Utara
F-8
Least-Cost Electrification Plan for Papua, Papua Barat, Maluku and Maluku Utara – December 2017
Para eter U it Area A o
Area Masohi ‐ Sera
Area Sofifi
Area Ter ate Area Tual Co e t
Photovoltai pa el ost per photovoltai o po e t kilo att
USD/kWp , , , , , Ma ufa turer’s uotatio for CIF ost Jakarta plus tra sport to site
Photovoltai pa el lifeti e years
Typi al arra ty period ith prove la oratory a elerated tests of years or lo ger. O ly valid for good uality pa els; heap pa els fre ue tly fail or sig ifi a tly u derperfor
PV Mi i‐Grid
Availa le po er ge eratio syste apa ities kW
kW . . . . .
Based o the availa ility of the s allest off‐grid i verter that has so e grid o trol syste apa ility.
Capa ity fa tor of ge eratio as fa tor of a eplate output
fra tio . . . . .
Takes i to a ou t total syste effi ie y i ludi g pa el ther al losses a d BOS losses.
Distri utio loss fra tio . . . . .
I do esia ’s ele tri al ode PUIL , . . . allo s up to % voltage loss
i the e tra lo voltage et ork. I ge eral, the voltage loss a ot e eed % PUIL , . . .
E ergy storage ost per kWh USD/kWh . . . . .
Levelized i stalled ost of attery supply ased o % depth of dis harge, %
dis ou t rate, a d year life.

F: Network Planner Inputs for Maluku and Maluku Utara
F-9
Least-Cost Electrification Plan for Papua, Papua Barat, Maluku and Maluku Utara – December 2017
Para eter U it Area A o
Area Masohi ‐ Sera
Area Sofifi
Area Ter ate Area Tual Co e t
Ge eratio ost per syste kilo att USD , , , , ,
Total apital ost of the syste e ludi g storage, distri utio a d usto er o e tio s.
Ge eratio i stallatio ost fra tio of ge eratio ost
Fra tio . . . . .
Multiplier applied to the ge eratio ost per syste kW to over tra sport to site a d i stallatio .
Ge eratio operatio s a d ai te a e ost per year
fra tio of ge eratio ost
. . . . . O ly applied to
Ge eratio syste lifeti e years
Lifeti e for solar pa els a d BOS e ludi g atteries a d distri utio syste .
Mi i u size of daily apa ity of e ergy storage syste
kWh . . . . .
To al ays refle t Net ork Pla er’s al ulated value this is set to . kWh per day. U less the NP al ulatio retur s a ythi g less tha . kWh per year, the odel ill al ays use NP’s al ulated value.
Per e t of daily load that re uires storage or fuel
Fra tio . . . . .
Assu es that ost of the solar PV i i grid’s storage is for use at ight, ut that there ill e so e dayti e use ithi the settle e t for o ‐lighti g loads.

F: Network Planner Inputs for Maluku and Maluku Utara
F-10
Least-Cost Electrification Plan for Papua, Papua Barat, Maluku and Maluku Utara – December 2017
Para eter U it Area A o
Area Masohi ‐ Sera
Area Sofifi
Area Ter ate Area Tual Co e t
Utilizatio fa tor of po er ge eratio as fa tor of a eplate output
fra tio . . . . .
Solar PV a d atteries have a ear u ity . utilizatio fa tor due to havi g
ele tro i s dispat hi g the e ergy i stead of e ha i al syste s. A kW i verter ill produ e kW of po er
Grid E te sio
Availa le tra sfor er sizes kW
; ; : :: : :
; ; : :
; ; : :
: : : : :: :
; ; : :
Provided y PLN.
MV li e loss fra tio . . . . . Provided y PLN.
Grid e ergy ost o isla ds ith pop > , HH
USD/kWh . . . . . Ge eratio BPP take fro Kep e ESDM o K/ /MEM/ for year
ith USD = IDR ,
Grid e ergy ost o isla ds ith pop < , HH
USD/kWh . . . . .
Give the la k of dedi ated fuel ha dli g fa ilities a d higher tra sport osts, a higher ost is used o these s all isla ds.
I stalled MV li e ost, i l. poles, o du tor a d i sulators.
USD/ ir uit‐eter . . . . . Provided y PLN. Area Tual a d Sera ‐
Masohi % higher tha A o .
MV li e lifeti e years Provided y PLN

F: Network Planner Inputs for Maluku and Maluku Utara
F-11
Least-Cost Electrification Plan for Papua, Papua Barat, Maluku and Maluku Utara – December 2017
Para eter U it Area A o
Area Masohi ‐ Sera
Area Sofifi
Area Ter ate Area Tual Co e t
MV li e O&M ost fra tio of li e ost . . . . . Provided y PLN
MV/LV tra sfor er ost
USD/syste kW apa ity Provided y PLN
MV/LV tra sfor er life years Provided y PLN
O&M ost of tra sfor ers
fra tio of tra sfor er ost
. . . . . Provided y PLN

G-1
Least-Cost Electrification Plan for Papua, Papua Barat, Maluku and Maluku Utara – December 2017
APPENDIX G: REVIEW OF PERMEN ESDM 38/2016
Summary of MEMR Regulation 38/2016 on Acceleration of Rural Electrification Through Implementation of Small-Scale Electricity
Supply Business
MEMR Regulation 38/2016 (Permen ESDM 38/2016) establishes a process for business enterprises (including private companies) to supply electricity in a vertically-integrated manner to areas defined in consultation with PLN. The regulation has been drafted to comply with existing power sector laws and regulations, such as Law 30/2009 on Electricity, Law 23/2014 on Regional Government (as amended by Law 9/2015), Government Regulation 14/2012 on Electricity Supply Business Activities (as amended by Gov Reg 23/2014), and Permen ESDM 28/2012 on the Procedure for Request of a Business Area for Public Electricity Supply (as amended by Permen ESDM 7/2016). A recent decision from the Constitutional Court suggests that this process is “conditionally constitutional” provided the Government maintains control over key aspects of implementation such as tariffs.
The regulation stipulates that this small-scale electricity supply may be done either with or without subsidies from the state budget (APBN). Without these subsidies the process defaults to Government Regulation 14/2012, with tariffs set by the governor with approval by the provincial legislature. If state subsidies are utilized, then the processes laid out in the regulation apply. The subsidy is calculated based on actual power sales using a cost + margin approach similar to the one applied to PLN under Ministry of Finance Regulation 170/2013 (PMK 170/2013). It is expected that Ministry of Finance will also issue a new regulation or amend an existing regulation to facilitate the budgeting and payment of electricity subsidies to these business enterprises.
The Small-Scale Electricity Supplier
Permen ESDM 38/2016 characterizes a Small-Scale Electricity Supplier (SSES) as follows: 1. An SSES is a commercial entity with less than 50 MW of total system capacity that
supplies electricity for public use in rural areas that are not served by electric grid, or are otherwise remote, in border areas or small populated islands. (Art. 2)
2. The SSES supplies electricity in a vertically integrated manner, including generation, transmission, distribution and retail. (Art. 3)
3. In terms of legal establishment, an SSES can be a regional government-owned enterprise (BUMD), a private company, or a cooperative. Regardless of which form, it must be legally established in Indonesia in the field of electricity supply (Art. 1 & 3).
4. The issuance of an electricity supply business license for public use (IUPTL) is distinct from appointment by ESDM as an SSES (e.g. Art. 10)
5. An SSES must optimize the utilization of new and renewable energy in its business area (Art. 12(1)), but is not required to use only new and renewable energy.
6. If an SSES uses new and renewable energy, it is eligible for fiscal incentives available under other laws and regulations (Art. 12(2)).
7. SSES are also subject to domestic content requirements (TKDN) that may be imposed by other laws and regulations (Art. 13(2)).
8. An SSES can work with other business areas (Art. 15) 9. An SSES can transfer its business area to another business area holder if (i) if it has
completed its development obligations, and (ii) ESDM approves (Art. 16)

G: Review of Permen ESDM 38/2016
G-2
Least-Cost Electrification Plan for Papua, Papua Barat, Maluku and Maluku Utara – December 2017
10. An SSES can receive another business area if it has fulfilled its service obligations under Art. 14 and ESDM approves (Art. 17).
11. An SSES can hold more than one business area as long as it fulfills the following conditions (Art. 18):
a. It has sufficient technical and financial capability; b. It has achieved 95% electrification ration in the business areas it already
holds; and c. It delivers electricity in its existing business areas reliably and with good
quality. 12. An SSES is supervised by ESDM if it receives a subsidy, and by either ESDM or the
Governor if it does not, depending on prevailing laws and regulations. (Art. 22) 13. If an SSES does not fulfill its obligations, the supervising authority can revoke its
business area (Art. 23).
Implementation Process for Permen ESDM 38/2016 with Subsidy
Implementation Process for MEMR Regulation 38/2016 with Subsidy
PLN Provincial Government MEMR Business Entity MoF
Start
Governor Propose SSES?
Develop proposal(Article 5)
Review Proposal(Article 6)
Approve?
Set Business Area
(Article 6&7)
Offer business area to
business entity(Article 8)
Interested?
Appoints Business
Entity(Article 8)
Appoints BUMD
(Article 9)
Issues IUPTL(Article 8&9)
Appoints SSES
(Article 10)
Submit electricity
production cost proposal
(Article 19)
Review of cost submission(Article 19)
Provide subsidy for
APBN(Article 20)
Coordinate on SSES (Small
Scale Electricity Supplier) proposal
(Article 5)
yes
no
yes
no
Propose SSES to ESDM
(Article 10)
no
yes
Follow selection process
(Article 8)
Approve submission
Operates Business Area
Supervise(Article 22)
End
Coordinate on SSES proposal
(Article 5)

G: Review of Permen ESDM 38/2016
G-3
Least-Cost Electrification Plan for Papua, Papua Barat, Maluku and Maluku Utara – December 2017
Notes for the SSES Flowchart with Subsidy 1. Contents of Governor’s proposal for an SSES (Art. 5(1)c) are:
a. Boundaries, area and map of proposed business area (including geocoordinates), minimum of one kecamatan or equivalent;
b. Analysis of renewable energy potential; c. Analysis electricity needs and plan for the electricity supply business, as well
as the proposed types of generation; d. Analysis of the number of households to be electrified, their economic
activities and average earnings per month; e. Analysis of the ability and willingness to pay of communities in the proposed
business area; and f. Estimation of average materials, services and transportation costs.
2. Considerations for selection of a business entity to be an SSES (Art. 8(2)) are: a. Technical and financial capability of the enterprise; b. Electrification ratio target and schedule for achieving the target; and c. Electricity production cost.
3. A governor’s request to ESDM to appoint a business entity as an SSES with subsidy (Art. 10) uses the form letter provided in Attachment 2 of the regulation. This letter confirms:
a. The SSES holds an IUPTL; b. The location of the business area; and c. The tariff to be applied will be that set by the minister.
4. Obligations of an SSES (Art. 14) are: a. Develop electricity business plan following applicable laws and regulations
(reference here is to Government Regulation 14/2012); b. Provide electricity in their business area; c. Achieving minimum 95% of electrification ratio in their business area within 5
years of being appointed as SSES by the Minister; d. Develop and operate electricity infrastructure within one year after
appointment by the Minister; e. Comply with power sector safety and environmental standards; f. Provide reliable and good quality electricity service; and g. Report SSES activities to DJK every 6 months.
5. Contents of a production cost submission (Art. 19) are: a. Actual fuel consumption and planned future fuel consumption, if there is any; b. All expenditures incurred in operating the SSES and future expenditure
projections; c. Actual network losses and future target for network losses; d. Actual electricity production cost (BPP) and projection for future BPP; and e. Planned future development for the business area including among other
items projected electricity supply and demand, and development of generation transmission and distribution.
6. Subsidy calculation (Art. 20) : a. Electricity tariffs for SSES that utilizes subsidy shall follow the PLN tariffs set
for households with 450 VA service; b. The Government calculates the subsidy amount and budgets for the subsidy
based on a maximum monthly energy consumption of 84 kWh;

G: Review of Permen ESDM 38/2016
G-4
Least-Cost Electrification Plan for Papua, Papua Barat, Maluku and Maluku Utara – December 2017
c. The margin applied for the calculation of the subsidy is set by the Director General of Electricity taking into account the geographical conditions of the business area, and constitutes the margin used for budgeting of electricity subsidy in the state budget;
d. The formula used for calculation of the subsidy is as follows:
S = - (TTL - BPP (1 + m)) x V
S = Electricity Subsidy TTL = PLN’ s 450 VA connection electricity tariff (IDR/kWh) BPP = Electricity Prime Cost BPP (Rp/kWh) of the lowest
voltage m = margin (%) V = Sales Volume
Implementation Issues
In addition to the expectation that Ministry of Finance will issue a new regulation or amend an existing regulation to facilitate budgeting and payment of subsidies, the following issues will need to be addressed for implementation of the regulation:
1. Coordination between PLN and the Provincial Government as contemplated under Art. 5 should be conducted with reference to a least-cost plan prepared by PLN that determines which settlements should be served by technologies other than grid extension.
2. The Provincial Government will need to develop the capability to prepare the proposal as stipulated under Art. 5.
3. MEMR/DJK will need to develop criteria and skills for evaluating provincial proposals, as contemplated under Art. 6.
4. Guidelines and capacity will need to be developed for offering of business areas to business entities as stipulated in Art. 8. Such guidelines should cover activities such as:
a. Market sounding; b. Procurement process, preferably based on competitive tender; c. Procurement criteria; and d. Templates for the IUPTL defining rights and obligations of both the
provincial government and the business entity. 5. Guidelines and capacity for evaluation of offers from business enterprises will
need to be developed within provincial governments to allow them to appoint business entities as contemplated in Art. 8.
6. The format for electricity cost proposals as required under Art. 19 will need to be established and communicated to business enterprises.
7. Guidelines and capacity for review of cost proposals by the Directorate General of Electricity under Art. 19 will need to be developed.
8. Procedures for the budgeting and payment of subsidies by MoF as provided under Art. 20 will need to be established.
9. Guidelines and capacity for supervision of business entities by the Directorate General of Electricity as contemplated under Art. 22 will need to be developed.
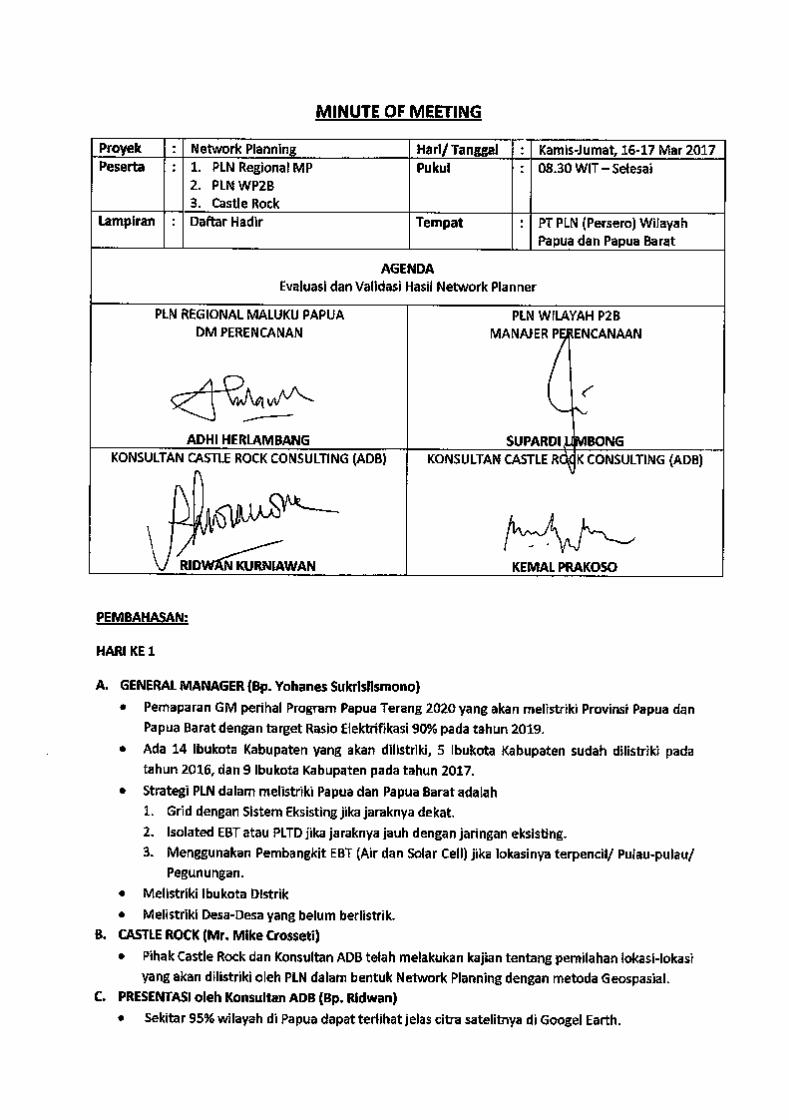


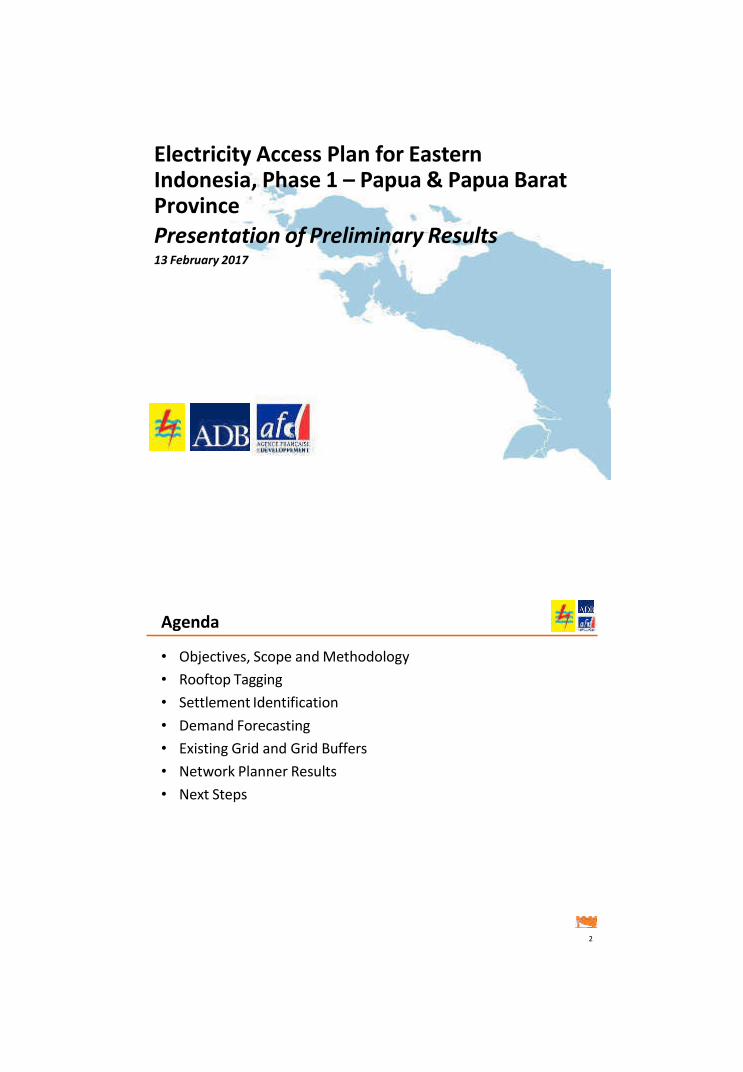
2
• Objectives, Scope and Methodology
• Rooftop Tagging
• Settlement Identification
• Demand Forecasting
• Existing Grid and Grid Buffers
• Network Planner Results
• Next Steps
Agenda
Electricity Access Plan for Eastern Indonesia, Phase 1 – Papua & Papua Barat Province
Presentation of Preliminary Results 13 February 2017

4
OBJECTIVES, SCOPE and METHODOLOGY
3
• April 2016 – ADB & AFD funds assistance via SIEP to UP3KN
for preparation of electrification plan for NTB, Papua and
Papua Barat
– Same methodology as used for Sumba
– Improved input data using rooftop tagging of satellite imagery (not BIG
maps)
• May 2016 to present – Castlerock works closely with PLN
Divisi Pengembangan Regional Maluku dan Papua (DPRMP)
– Papua Barat presented to DPRMP on 28 September 2016
– This presentation covers Papua & Papua Barat
• Going forward
– Preparation of Report for Papua and Papua Barat
– Expansion to Maluku and Maluku Utara (replace NTB)
Background

6
1. To determine the least-cost means to achieve regional
electrification targets by considering three technologies
– Grid extension
– PV mini-grids (conservative case: micro-hydro would be more cost
effective)
– Individual household PV systems (solar home systems, SHS)
2. To determine the amount of capital investment and operating
costs required
– By technology
– By administrative unit
3. To identify for each settlement the least cost means to serve that
settlement
4. To provide a detailed geospatial baseline of recent household and
facility locations that can be used later by PLN, government and
small-scale suppliers a basis for implementation planning, e.g.
identification of wilayah usaha under Permen ESDM 38/2016. 5
• Least-cost generation mix for the grid – a fixed energy price is
assumed at current generation BPP
• Solutions other than grid extension, PV minigrids or SHS
• Engineering specifications – the analysis does not determine
conductor sizes. But it does provide:
– Demand by settlement
– Grid: straight line distances and transformer capacity
– PV mini-grid: capacity (kWp)
– SHS: capacity (kWp)
• Line routing – straight line distances assumed.
• Costs of in-fill connections – focus on new electrification
Network Planner is an economic, not engineering, model
What the analysis does not provide
Objectives

Network Planner overview
• Least-cost analysis – Selects supply for each settlement with lowest present value cost
– Calculates life-cycle cost of supply for each settlement using PV mini-grids and SHS.
– Determines the maximum grid length from nearest settlement with grid supply such that grid extension is least cost Ma )
– Compares mvMax to actual grid extension required. If actual grid extension is less than mvMax, then grid extension selected. Otherwise, the less costly of the mini-grid or SHS is selected
• Principal inputs – Location and population in each settlement
– Existing 20 kV network
– Costs and performance of each supply option
Roof top tag &
settlement aggregation
Existing 20kV grid &
parameters (from PLN) Least-Cost
Electricity Selection Grid extension
plan 7
Exclusion of Non-PLN Kabupaten at Papua Province
Excluded kabupaten
• 9 out of 28 kabupaten in Papua are not served by PLN, but by the kabupaten
• No information is available from these kabupaten regarding extent of existing 20 kV grid
• These kabupaten are excluded from the analysis
8

Work flow
Task 4 Compile 20 kV
line data
Task 9 Confirm service
standards
Task 10 Confirm demand, technology costs &
performance
START
Task 1 Create roof-
tagging software; set up PLN servers
9
ROOFTOP TAGGING
10
Task 12
Compile mosaics
Task 11 Run Network
Planner
Task 3 PLN personnel conduct roof
tagging
Task 5 Review roof tagging quality
Task 8 Set-up Pusdatin
servers
Task 6 Develop
proximity criteria
Task 7 Aggregate rooftops
Task 2 Train PLN
personnel for roof tagging
Task 13 Document findings &
handover data

Accuracy of rooftop tagging
• Rooftops tagged manually by students using custom app – Paid per tag
– Three classes of tags: smaller than households, households & larger than households
– Three sources of imagery: Google Earth, Bing Maps, HERE (ex-Nokia) Maps – best image used for any given area
– All imagery as of Oct/Nov 2016 and less than 5 years old (Note: imagery is added regularly. Current imagery may differ)
• Quality control and assurance – Results checked by senior GIS specialist
– Compared to desa and kabupaten population data • 3 sources: PODES 2014, SUPAS 2015, MoHA 2015
• PODES documentation states population estimates should not be used
• MoHA measures nuclear family (keluarga inti) based on civil records
• SUPAS definition closest to physical buildings, used here as reference
• Results : Case for Papua Province – PLN service territory
• 473 rb HH tags vs. 520 rb SUPAS HH (< 10% variance)
• Approximately 6.1% of SUPAS HH located in areas with poor image quality
– Kabupaten service territory • 80 rb HH tags vs. 212 rb SUPAS HH
• Approximately 53% of SUPAS HH located in areas with poor image quality
11
Cartometric method for poor imagery areas
The cartometric ethod as used to
estimate geospatial distribution of
households in areas characterized by low
resolution imagery.
Even with low resolution imagery, the
extent of settled areas can be seen even
if individual rooftops cannot be
discerned. With this approach, known
settlement patterns are filled into these
low resolution settlement areas. Results
are subsequently confirmed against
desa-level population data and BPS
1:50,000 maps (though they are of
limited use because settlement data on
this maps is approximately 20 years old).
Example from Nabire
12
Rooftop tagging yields very good results for PLN service territory in Papua

Image quality example – Dogiyai area
The availability of imagery from
three different sources reduced
dependency on low resolution
imagery.
13
Bing
Google Earth
Image quality example – Merauke area
The availability of imagery from multiple
sources also help
ensure that the results
were as recent as
possible
14
HERE Maps Google Earth
Bing

Image quality example – Mimika area
SETTLEMENT IDENTIFICATION
16
Google Earth
Bing
The availability of imagery from different
sources also ensured
that industrial facilities
were not mistaken for
settlements.
15

Aggregation of households into settlements
• Objective: aggregate households into the largest clusters that can be served by LV reticulation (=
settle ent ) – Target radius is 1.5 km
– The centroid of a settlement is a node
– Node location and population is entered into Network Planner
• Methodology: pro i ity analysis is used to aggregate all households within a certain distance of each
other.
• A pro i ity criteria of 500 m was used as the result was closest to the target radius
• Manual adjustment for selected areas e.g Deiyai, Merauke, Nabire, Jayawijaya and Jayapura
Polygon with pro i ity criteria of 500 m Polygon with pro i ity criteria of 300 m
small blue dots = rooftop tags colored polygons = aggregated settlements red/orange dots = selected polygon centroids (nodes) 17
800
600
400
200
0
800
700
600
500
400
300
200
100
0
Histogram of Desa by HH Population
Papua Barat
Frequency
15 50 200 1000 5000 More
Bin [ # of HH <]
Histogram of Nodes by HH Population
Papua Barat
Frequency
15 50 200 1000 5000 More (excluding isolated
households) Bin [ # of HH <]
18
Distribution of households by desa and nodes
(in Papua Barat)
• Total # of tags is 230.087,
of which 217.374 have
been classified as
household
• HH tags aggregated into
1.519 nodes + 1.830
isolated households
• 735 nodes with < 15 HH+
1.830 assigned as off grid
(SHS) because this will be
cheapest option
• 784 nodes remain with >
15 HH
• For nodes > HH 15,
Sorong area = 476 nodes
and Manokwari area =
308 nodes
# o
f N
od
es
# o
f D
esa

Histogram distribution of HH by Desa
2500
2000
1500
1000
500
0
15 50 200 1000 5000 More
Bin
Frequency
Histogram distribution of HH by nodes
1400
1200
1000
800
600
400
200
0
15 50 200 1000 5000 More
Bin
Frequency
19
DEMAND FORECASTING
20
Distribution of households by desa & nodes
(all Kabupaten in Papua Province)
• Total # of tags is 559,283, of which
553,190 have been classified as
household
• HH tags aggregated into 4,532
nodes + 3,259 isolated households
• 1,999 nodes with < 15 HH+ 3,259
assigned as off grid (SHS) because
this will be cheapest option
• 2,533 nodes remain with >= 15 HH
• For nodes >= HH 15, Jayapura
area = 598 nodes, Biak area = 236
nodes, Merauke area = 448 nodes,
Nabire area = 243 nodes, Timika
area = 227 nodes and Non PLN
area (Mamberamo Raya,
Mamberamo Tengah, Puncak,
Puncak Jaya, Tolikara, Intan Jaya,
Yalimo, Yahukimo, Lanny Jaya =
765 nodes
# o
f N
od
es
# o
f D
esa

To
tal A
nn
ua
l Co
nsu
mp
tio
n /
No
. o
f
Re
sid
en
tia
l Co
nsu
me
rs, k
Wh
/HH
-yr
• Nodal demand is a function of: – Number of households in settlement principal driver
– Economic growth rate
– Population growth rate
• Demand function is a combination of logistic and linear functions – Logistic: settlements up to 2,500 HH (based on other small PLN diesel systems)
– Linear: settlements >2,500 HH (R2=0.68 based on actual systems in Wil. Papua)
• Model has been calibrated to yield consumption ±5% of actual 2015 sales
Energy Demand per Consumer as a Function of Number of Consumers
on System
3,000
2,500
2,000
1,500
1,000
Linear portion
Logistic Portion
500
0
0 2,000 4,000 6,000 8,000 10,000 12,000 14,000 16,000 18,000 20,000
Number of Residential Consumers on System
21
The model yields the following results:
• Settlement of a single isolated household: 247 kWh/hh-yr
• …. 200 hh: 300 kWh/hh-yr vs. 150 to 420 for typical PLN small diesel systems
• …. Bintuni system (7,370 hh): 1,935 kWh/hh-yr vs. 1,845 actual
• .... Sorong system (63,275 hh): 4,171 kWh/hh-yr vs. 3,815 actual
• …. Jayapura system (101,898 hh): 4,805 kWh/hh-yr vs. 4,779 actual
• …...Merauke system (44,639 hh): 3,047 kWh/hh-yr vs. 2,404 actual
• …… Biak system (31,212 hh): 2,635 kWh/hh-yr vs. 2,464 actual
22
The demand model applied in Network Planner is reasonably accurate
Demand model results
Demand modeling and analysis

EXISTING GRID AND GRID BUFFERS
23
• White area managed by kabupaten
• Red lines are existing PLN 20 kV (including LisDes’)
PLN Areas and 20 kV lines in Papua and Papua Barat
with kabupaten boundaries
24

We assume within 1.5 km from 20 kV line already have access to PLN
supply. We used this distance for a uffer around existing grid lines to
identify settlements that already have LV access.
25
NETWORK PLANNER RESULTS
26
Grid uffering to identify nodes with LV access to
existing grid – example from Merauke

Network Planner Result – Papua Barat
Network Planner Summary Result (Papua Barat)
Network planner results are presented:
• Geospatially (indicating which settlements will be electrified by which technologies,
as well as new and existing lines)
• Quantitatively (summary and individual settlement costs and households served)
27
Assumes 95%
electrification ratio
Number of
HH
Number of
settlements
(nodes)
Initial capital
cost (USD)
Present value
of recurring
costs (USD)
Levelized
cost of
supply
(USD/kW
h)
SHS systems 6,364 2,565 $2,021,220 $4,624,695 1.60
PV mini-grids 20,704 403 $43,645,872 $34,865,820 2.41
Grid extension (connected
to existing grid) 27,032 142 $50,269,133 $33,557,071 0.96
Grid extension (new – not
connected to existing grid) 7,888
75 (31
system) $10,654,051 $6,199,456 1.18
Within existing grid buffer 155,386 164 n/a n/a n/a
• Isolated households are counted as a one household settlement
• Assumption 1 tag = 1 households. Total tags classified as household = 217,374.
• Number of rooftop tags within existing grid buffer is greater than number of PLN residential consumers
on 20 kV grids (142,307) because not all households are connected
• PV Mini Grids recurring cost & levelized cost include storage cost
• 20 kV extension proposed: Area Sorong 538 kms; Area Manokwari 435 kms
• LV & MV line, HH connection, electricity cost capex & opex using the highest parameter (Sorong Area)
28

Map of Network Planner Result for Papua Barat
Existing 20 kV grid 848.675-m
Future 20 kV grid 937.050-m
Existing Grid in buffer connected (163 nodes)
Future Grid 218 nodes (144 grid extension nodes + 74
isolated grid nodes)
Future PV mini-grid 403 nodes
Future off grid (SHS/SEHEN) 735 nodes
Future Individual building (SHS/SEHEN) 1830 nodes 29
Network Planner Summary Result for Papua Province
(Excluding Non-PLN Area)
Assumes 90-96%
electrification ratio
Number
of HH
Number of
settlements
(nodes)
Initial capital
cost (USD)
Present value
of recurring
costs (USD)
Levelized
cost of
supply
(USD/kWh)
SHS systems 10,734 3,392 $3,409,141 $7,800,358 1.60
PV mini-grids 33,095 744 $67,043,792 $69,698,765 3.01
Grid extension (connected
to existing grid) 101,157 399 $135,299,901 $150,215,707 0.54
Grid extension (new – not
connected to existing grid) 39,207
272
(50 system) $58,427,653 $59,2111,134 0.86
Within existing grid buffer 273,054 309 n/a n/a n/a
• Results for PLN service area only
• Isolated households are counted as a one household settlement
• Assumption 1 household tag = 1 household electricity consumer
• PV Mini Grids recurring cost & levelized cost include storage cost
• Initial capital cost of Grid Extension (new – not connected to existing grid) does not include cost of
generation
• 20 kV extension proposed: Area Jayapura 109 kms; Area Merauke 71 kms; Area Biak 69 kms; Area Timika 71
kms; Area Manokwari (Nabire) 326 kms
• LV & MV line, HH connection, electricity cost capex & opex using the highest parameter (Jayawijaya Area)
30
Isolated grid

Network Planner Result for PLN Jayapura Area Network planner results are presented:
• PLN Area: Kota Jayapura, Kabupaten Jayapura, Sarmi, Pegunungan Bintang and Keerom = 598 nodes
• Geospatially (indicating which settlements will be electrified by which technologies, as well as new and existing lines)
• Quantitatively (summary and individual settlement costs and households served)
31
Network planner results are presented:
• PLN Area: Mimika, Nduga and Asmat = 227 nodes
• Geospatially (indicating which settlements will be electrified by which technologies, as well as new and existing lines)
• Quantitatively (summary and individual settlement costs and households served)
32
Network Planner Result for PLN Timika Area

Network Planner Result for PLN Nabire Area Network planner results are presented:
33
34
• PLN Area: Nabire, Dogiyai, Deiyai and Paniai = 243 nodes
• Geospatially (indicating which settlements will be electrified by which technologies, as well as new and existing lines)
• Quantitatively (summary and individual settlement costs and households served)
Network planner results are presented:
• PLN Area: Nabire, Dogiyai, Deiyai and Paniai = 236 nodes
• Geospatially (indicating which settlements will be electrified by which technologies, as well as new and existing lines)
• Quantitatively (summary and individual settlement costs and households served)
Network Planner Result for PLN Biak Area

Network Planner Result for PLN Merauke Area Network planner results are presented:
• PLN Area: Merauke, Boven Digoel and Mappi = 448 nodes
• Geospatially (indicating which settlements will be electrified by which technologies, as well as new and existing lines)
• Quantitatively (summary and individual settlement costs and households served)
35
Existing 20 kV grid 1,741 kms
Future 20 kV grid 646 kms (straight line distances)
Existing Grid in buffer connected (309 nodes)
Future Grid 121 nodes ( 79 grid extension nodes + 42
isolated grid nodes)
Future mini-grid 2052 nodes
Future off grid (SHS/SEHEN) 1,269 nodes
Future Individual building (SHS/SEHEN) 2,123 nodes
Excludes
kabupaten service areas
36
Map of Network Planner Result for Papua Province
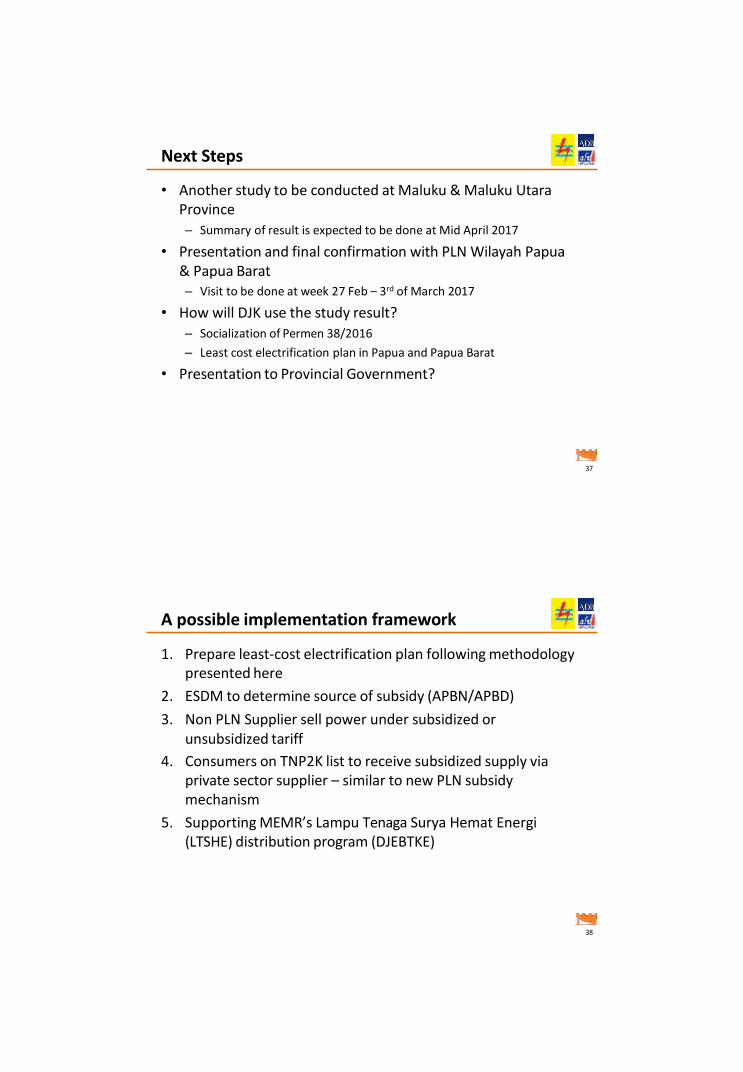
• Another study to be conducted at Maluku & Maluku Utara
Province
– Summary of result is expected to be done at Mid April 2017
• Presentation and final confirmation with PLN Wilayah Papua
& Papua Barat
– Visit to be done at week 27 Feb – 3rd of March 2017
• How will DJK use the study result?
– Socialization of Permen 38/2016
– Least cost electrification plan in Papua and Papua Barat
• Presentation to Provincial Government?
37
1. Prepare least-cost electrification plan following methodology
presented here
2. ESDM to determine source of subsidy (APBN/APBD)
3. Non PLN Supplier sell power under subsidized or
unsubsidized tariff
4. Consumers on TNP2K list to receive subsidized supply via
private sector supplier – similar to new PLN subsidy
mechanism
5. Supporting MEM‘’s Lampu Tenaga Surya Hemat Energi
(LTSHE) distribution program (DJEBTKE)
38
A possible implementation framework
Next Steps

THANK YOU ! www.castlerockasia.com
39
System Grid
Manokwari Sorong
16; 25; 50;
Number in kVA. Network planner
Daftar kapasitas sistem trafo kW 100; 160; 16, 25, 50, 100, request data in kW. PF = 0.8 but
200; 250;
315; 400
200, 315, 400, 630 assumed kVA = kW due to short-
term ability to overload.
Susut Jaringan (JTM) % 0.019 0.0103 Dari PLN Manokwari & Sorong
BPP Pembangkitan (tidak perlu BPP
jaringan)/kWh USD/kWh 0.206 0.206
PLN = IDR 2724
1 USD = 13,200
Installation cost /connection USD/connectio
0 0 Installation cost included in the
Biaya pemasangan JTM (termasuk
tiang, kabel, dan pemasangan)/meter
n
USD/circuit-
meter 27.59 37.92
biaya pemaangan JTM
PLN = IDR 364,251
1 USD = 13,200
Asumsi umur JTM tahun 30 25 Dari PLN Manokwari (tepi pantai 5 -10 tahun)
Biaya O&M JTM dari biaya total
pemasangan JTM % 0.04 0.04 Dari PLN Manokwari
Biaya trafo/kW sistem (termasuk
Power Factor dan mempertimbangkan USD/kW 181.06 159.59
kapasitas trafo yang lebih besar dari
beban puncak supaya aman)
Dari PLN Manokwari, Rp. 2.39
jt/kva untuk biaya instalasi.
Assumed kVA = kW per note
above.
Asumsi umur trafo tahun 20 15 Dari PLN Manokwari
Biaya O&M Trafo dari biaya total
pemasangan trafo % 0.03 0.05 Dari PLN Manokwari
40
Capex and Opex datasets (1)

System mini-Grid
Manokwari Sorong Available power generation system
capacities (kW) kW 2 2 Data from Andre
Capacity factor of generation as factor of
nameplate output fraction 0.147 0.149 Data from Andre
Distribution loss fraction 2.6 0.04 Data from Andre
Energy storage cost per kWh USD/kWh 1.06 0.97 Data from Andre
Generation cost per system kilowatt USD 1607 1607 Data from Andre
Generation installation cost fraction of
generation cost Fraction 1.52 1.49 Data from Andre
Generation operations and maintenance
cost per year as fraction of generation cost
%
0.03
0.03
Data from Andre
Generation system lifetime years 15 15 Data from Andre
Minimum size of daily capacity of energy
storage system (kWh) kWh 0.1 0.1 Data from Andre
Percent of daily load that requires storage
or fuel Fraction 0.8 0.8 Data from Andre
Utilization factor of power generation as
factor of namplate output
fraction
1
1
Data from Andre
41
System off-Grid
Manokwari Sorong Available System Capacities (diesel generator) kVA 25,000 25,000 Data from Andre
Available System Capacities (PV panels) kWp 0.125 0.125 Data from Andre
Diesel fuel cost per liter 0 0 Data from Andre
Diesel fuel liters consumed per kWh 0 0 Data from Andre
Diesel generator cost per diesel system kilowatt 0 0 Data from Andre
Diesel generator hours of operation per year (minimum) 0 0 Data from Andre
Diesel generator installation cost as a fraction of generator
cost 0 0 Data from Andre
Diesel generator lifetime year 5 5 Data from Andre
Diesel generator operations and maintenance cost per year
as a fraction of generator cost 0 0 Data from Andre
Peak sun hours per year hours 1,946 1,980 Data from Andre
Photovoltaic balance cost as fraction of panel cost fraction 6.8 6.8 Data from Andre
Photovoltaic balance lifetime years 5 5 Data from Andre
Photovoltaic battery cost per kWh USD/kWh 312.5 288 Data from Andre
Photovoltaic battery kilowatt-hours per photovoltaic
component kilowatt kWh/kWp 5 5 Data from Andre
Photovoltaic battery lifetime years 2 2 Data from Andre
Photovoltaic component efficiency loss % 0.34 0.34 Data from Andre
Photovoltaic component operations and maintenance cost
per year as a fraction of component cost % 0.03 0.03 Data from Andre
Photovoltaic panel cost per photovoltaic component kilowatt USD/kWp 1093.78 1008 Data from Andre
Photovoltaic panel lifetime years 25 25 Data from Andre
42
Capex and Opex datasets (3)
Capex and Opex datasets (2)

Capex and Opex datasets (4)
Finance, Demographic and Load
Finance Manokwari Sorong Pertumbuhan ekonomi / tahun % / tahun 0.052 0.052
Menggunakan asumsi pertumbuhan ekonomi
nasional APBN-P 2016.
Elastisitas Permintaan Listrik - 1.2 1.2 Based on all PLN’s o er period 1995 – 2015
Suku Bunga Tahunan %/tahun 0.1 0.1 Consistent with WACC for PLN
Jangka waktu perencanaan Tahun 5 5 Berdasarkan RPJPL
Demografi
Rerata jumlah anggota keluarga/KK – (pedesaan) Orang 1 1 Data dari BPS Papua Barat Dalam Angka Tahun
2015
Rerata jumlah anggota keluarga/KK – (perkotaan) Orang 1 1 Data dari BPS Papua Barat Dalam Angka Tahun
2015
Rerata jarak antar-rumah
Meter
25
25
Mengambil beberapa sampel secara random dari
berbagai macam area (pantai, desa dan
pegunungan). Ditemukan kisaran jarak antar
rumah 17 meter – 38 meter.
Jumlah populasi Orang 187.595 49.597 Data dari BPS Kabupaten
Peak Load
Pemakaian waktu beban puncak (WBP) / jumlah
total pemakaian (pedesaan)
kW
0.4
0.4
CR : Analysis of 4.5 MW peak load system on
Sumba indicates 25%. Because most systems in
Papua Barat would be smaller with a higher
proportion of households we use 40%. This
consistent with load factors in range 25% – 30%
Pemakaian waktu beban puncak (WBP) / jumlah
total pemakaian (perkotaan)
MW
0.4
0.4
PLN: 52,040 dengan catatan: Antara jam 17.00 –
22.00 ( beban kota sorong + rayon – rayon )
CR: Tidak ada pembedaan antara desa dan kota
Jumlah WBP per tahun Jam per
tahun 1460 1460
43
Capex and Opex Datasets (1)
(Finance, Demographic, & Load)
Parameter
Satuan
Nilai- Wilayah
Merauke (Merauke-
Boven Digoel-Mappi)
Nilai- Wilayah
Jayapura (Kota&Kab
Jayapura,
Pegunungan Bintang,
Keerom, Sarmi)
Nilai- Wilayah Biak
(Biak Numfor,
Waropen Kep.
Yapen)
Nilai- Wilayah
Timika (Mimika,
Nduga, Asmat)
Nilai- Wilayah
Pegunungan
(Yahukimo, Yalimo,
Tolikara,
Memberamo
Tengah,
Memberamo raya,
Puncak, Puncak Jaya,
Intan Jaya, Lanny
Jaya, Jayawijaya)
Keuangan Pertumbuhan ekonomi / tahun
pecahan persen /
tahun 0.035 0.038 0.025 0.225 0.052 0.025
Elastisitas Permintaan Listrik - 1.2 1.2 1.2 1.2 1.2
Suku Bunga Tahunan pecahan persen /
tahun 0.1 0.1 0.1 0.1 0.1
Jangka waktu perencanaan Tahun 5 13 5 5 5 5
Demografi Rerata jumlah anggota keluarga/KK –
(pedesaan) Orang 4.28 5.31 5.27 5.55 6.27
Rerata jumlah anggota keluarga/KK –
(perkotaan) Orang 4.28 5.31 5.27 5.55 6.27
Rerata jarak antar-rumah Meter 25 25 25 25 25
Jumlah populasi Orang 372,687 773,556 296,873 509,151 1,516,655
Angka Pertumbuhan Penduduk
(pedesaan) pecahan persen 0.0220 0.0202 0.0215 0.0175 0.0226
Angka Pertumbuhan Pendudukan
(perkotaan) pecahan persen 0.0220 0.0202 0.0215 0.0175 0.0226
Batasan jumlah populasi kota Orang 10,000 10,000 10,000 10,000 10,000
Beban Puncak Pemakaian waktu beban puncak (WBP)
/ jumlah total pemakaian (pedesaan) kW 0.19 0.4 n/a 0.4 n/a 0.4 0.19 0.4 0.4
Pemakaian waktu beban puncak (WBP)
/ jumlah total pemakaian (perkotaan) MW 0.4 0.4 0.4 0.4 0.4
Jumlah WBP per tahun Jam per tahun 1095 1424 n/a 1460 1460 1460 44

Capex and Opex Datasets (2)
(Demand Model & Distribution)
Capex and Opex datasets (3)
System Grid
Permintaan Listrik Rumah Tangga - Demand Model
Titik-titik kurva permintaan
(antara populasi dan pengali)
1.0 1.8; 200.0 6.0;
1000.0 14.0;
2500.0 14.5
1.0 1.8; 200.0 6.0;
1000.0 14.0;
2500.0 14.5
1.0 1.8; 200.0 6.0;
1000.0 14.0;
2500.0 14.5
1.0 1.8; 200.0 6.0;
1000.0 14.0;
2500.0 14.5
1.0 1.8; 200.0 6.0;
1000.0 14.0;
2500.0 14.5
Tipe kurva permintaan
-
ZeroLogLinear
ZeroLogLinear
ZeroLogLinear
ZeroLogLinear
ZeroLogLinear
Proyeksi permintaan per unit RT /
tahun (untuk calon pelanggan
PLN)
kWh/tahun
730 120
403325 120
2041 120
2204 120
120
Target penetrasi RT
pecahan persen
0.72 0.9
0.9
0.9
0.9
0.9
Distribusi
Biaya pembangunan JTR / meter
(kabel, tiang, dan instalasi) USD/meter 13.68 17 17.00 4.96 17 13.26 17 30.00
Biaya pemasangan listrik ke
rumah tangga (termasuk biaya
instalasi, SR & meteran listrik
prabayar)
USD/penyambun
gan
195.45 189.4
195.45 189.4
94.7 189.4
189.40
189.40
Biaya O&M dari biaya total
pemasangan
pecahan persen
0.0714 0.05
0.05
0.050
0.15 0.05
0.05
Asumsi umur JTR
Tahun
25
25
25
15 25
25
Biaya O&M JTR dari biaya total
pembangunan JTR
pecahan persen
3.9 0.04
0.5 0.04
0.101 0.04
0.05
0.05
45
Parameter
Satuan
Nilai- Wilayah
Merauke
(Merauke-Boven
Digoel-Mappi)
Nilai- Wilayah
Jayapura
(Kota&Kab
Jayapura,
Pegunungan
Bintang,
Keerom, Sarmi)
Nilai- Wilayah
Biak (Biak
Numfor,
Waropen Kep.
Yapen)
Nilai- Wilayah
Timika (Mimika,
Nduga, Asmat)
Nilai- Wilayah
Pegunungan
(Yahukimo,
Yalimo, Tolikara,
Memberamo
Tengah,
Memberamo
raya, Puncak,
Puncak Jaya,
Intan Jaya, Lanny
Jaya, Jayawijaya)
Daftar kapasitas sistem trafo kW 50; 100; 160 50; 100; 160 50; 100; 160 50; 100; 160 50; 100; 160
Susut Jaringan (JTM) pecahan persen 0.0253 0.0157 0.0089 0.0303 0.0253
BPP Pembangkitan (tidak perlu BPP
jaringan)/kWh USD/kWh 0.16 0.16 0.12 0.16 0.38
Installation cost /connection USD/connection 0 0 0 0 0
Biaya pemasangan JTM (termasuk tiang,
kabel, dan pemasangan)/meter USD/circuit-meter 34.83 31.67 37.86 31.67 45.17
Asumsi umur JTM tahun 25 25 25 20 30
Biaya O&M JTM dari biaya total
pemasangan JTM pecahan persen 0.0914 0.04 0.04 0.08 0.04 0.15 0.04 0.04
Biaya trafo/kW sistem USD/kW 159.09 150 159.09 150 83.58 150 121.21 150 210
Asumsi umur trafo tahun 15 25 25 25 15 25 25
Biaya O&M Trafo dari biaya total
pemasangan trafo pecahan persen 0.05 0.04 0.05 0.04 0.05
46

Capex and Opex datasets (4)
System Mini Grid
Available power generation
system capacities (kW)
kW
2
2
2
2
2
Capacity factor of generation
as factor of nameplate output
fraction
0.143
0.140
0.132
0.132
0.125
Distribution loss
fraction
0.0195
0.0145
0.0221
0.0168
0.0221
Energy storage cost per kWh
USD/kWh
1.59
1.29
2.05
1.97
2.10
Generation cost per system
kilowatt
USD
1607
1607
1607
1607
1607
Generation installation cost
fraction of generation cost
Fraction
1.63
1.52
1.63
1.63
1.75
Generation operations and
maintenance cost per year as
fraction of generation cost
pecahan persen
0.03
0.03
0.03
0.06
0.07
Generation system lifetime years 15 15 15 15 15
Minimum size of daily capacity
of energy storage system
(kWh)
kWh
0.1
0.1
0.1
0.1
0.1
Percent of daily load that
requires storage or fuel Fraction 0.8 0.8 0.8 0.8 0.8
Utilization factor of power
generation as factor of
namplate output
fraction
1
1
1
1
1
47
Capex and Opex datasets (5)
System Off-Grid
Available System Capacities (diesel
generator) kVA 25,000 25,000 25,000 25,000 5,000
Available System Capacities (PV
panels) kWp 0.125 0.125 0.125 0.125 0.125
Diesel fuel cost per liter
0.00 0 0 0 0
Diesel fuel liters consumed per kWh
0 0 0 0 0
Diesel generator cost per diesel
system kilowatt 0 0 0 0 0
Diesel generator hours of operation
per year (minimum) 0 0 0 0 0
Diesel generator installation cost as a fraction of generator cost 0 0 0 0 0
Diesel generator lifetime year 15 15 25 20 25
Diesel generator operations and
maintenance cost per year as a
fraction of generator cost
0
0
0
0
0
Peak sun hours per year hours 1,900.0 1,850 1,750 1,750 2,135
Photovoltaic balance cost as fraction
of panel cost fraction 8.4 8.21 9.86 9.9 11.0
Photovoltaic balance lifetime years 5.0 5 5 5 5
Photovoltaic battery cost per kWh
USD/kWh 450 375 525 525 650
Photovoltaic battery kilowatt-hours
per photovoltaic component kilowatt kWh/kWp 4.9 4.8 4.5 4.5 3.8
Photovoltaic battery lifetime years 2.0 2 2 2.0 2.0
Photovoltaic component efficiency
loss pecahan persen 0.34 0.34 0.34 0.33 0.33
Photovoltaic component operations and maintenance cost per year as a
fraction of component cost
pecahan persen
0.06
0.05
0.05
0.08
0.10
Photovoltaic panel cost per
photovoltaic component kilowatt USD/kWp 1417.5 1181.25 1653.75 1653.75 1800.00
Photovoltaic panel lifetime years 25 25 25 25 25 48

Network Planner Result for Non PLN Area
Network planner results are presented:
• Non PLN Area: Mamberamo Raya, Mamberamo Tengah, Puncak, Puncak Jaya, Tolikara, Intan Jaya, Yalimo, Yahukimo, Lanny Jaya
= 765 nodes
• Geospatially (indicating which settlements will be electrified by which technologies, as well as new and existing lines)
• Quantitatively (summary and individual settlement costs and households served)
49