Embed Size (px)
Citation preview

February 14th, 2012
Important: All disclosures, including analyst certification can be found on pages 13-14 of this document.
Technical Analysis
Analyst
Barry M. Sine, CFA, CMT
646-422-1333
What’s Really Going on With US Listed Chinese Equities?
With a spate of recent fraud allegations, US listed Chinese stocks are some of the most toxic investments in the market
today.
But investing in out of favor sectors can yield the greatest rewards.
Today’s visit of incoming Chinese President Xi Jinping to the White House may bring a reset in US – China relations
and spur renewed interest in Chinese equities.
In this report we examine the major Chinese Indexes:
o The Shanghai Stock Exchange bottomed in January and is 10% off its low
o The Taiwan Stock Exchange bottomed in December and is 19% off its low
o The Hang Seng Index bottomed in October and is 29% off its low
o The USX China Index of US listed Chinese companies bottomed in October and is 25% off its low
We also examine the 14 largest US listed Chinese stocks, those with market caps above $5 billion:
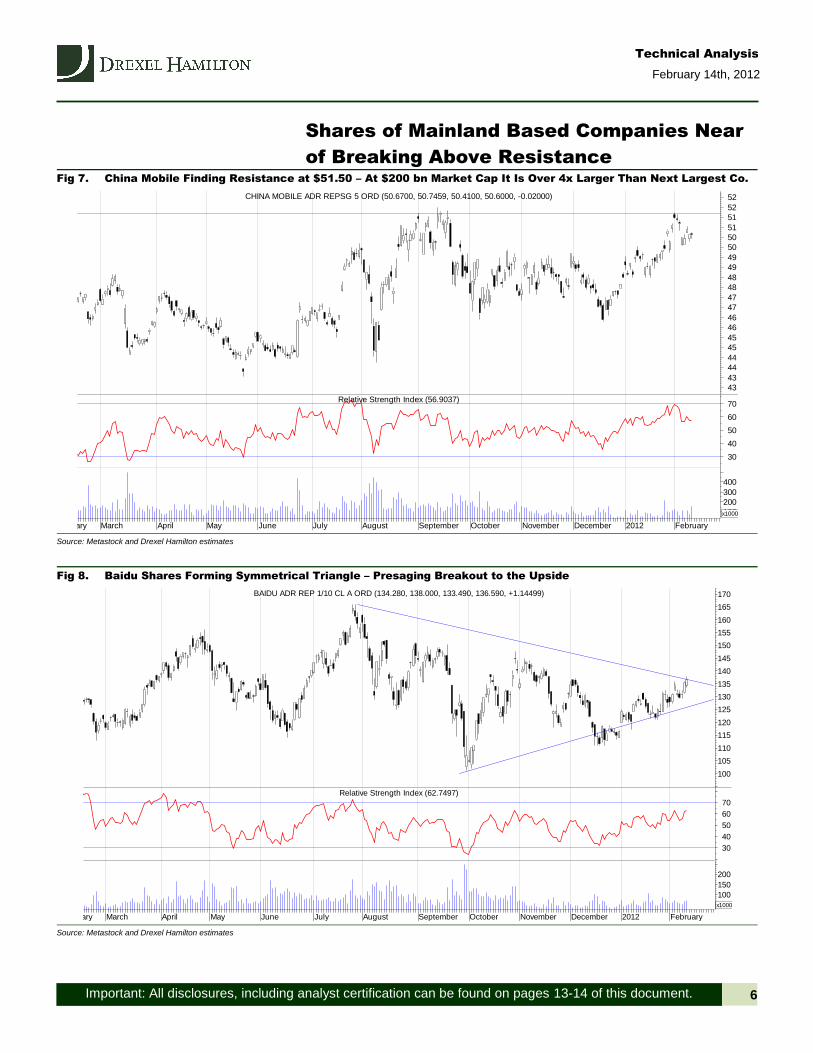
o China Mobile is the dominant stock at $200 billion market cap and is at resistance of $51
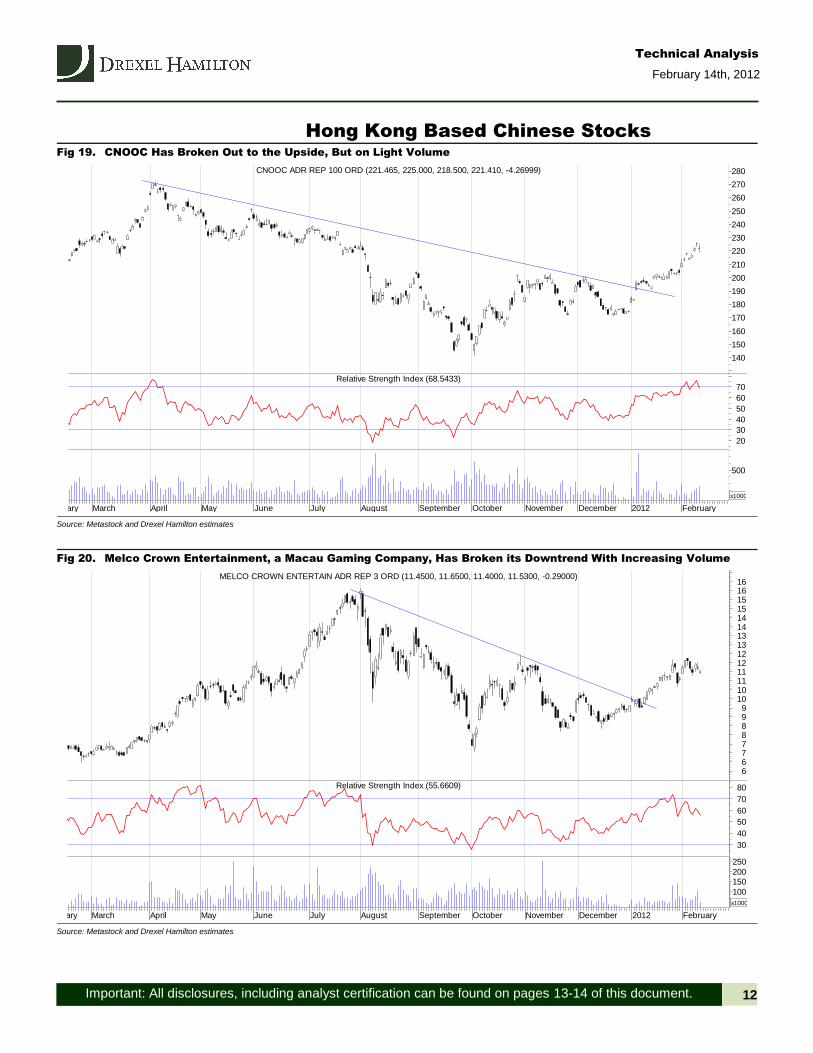
o Next largest, at $100 billion, energy company CNOOC has broken its downtrend, but on light volume
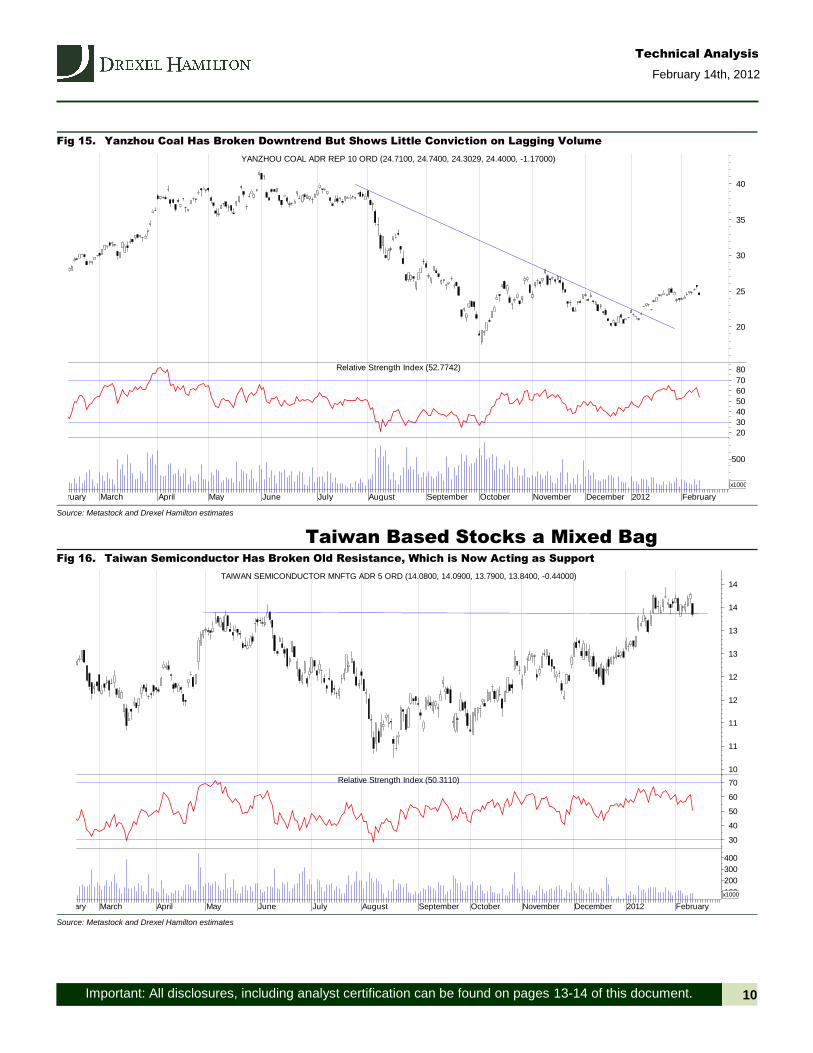
o Taiwan Semiconductor broke old resistance just below $14, with this level now serving as support
o Google’s China counterpart Baidu has formed a symmetrical triangle pattern with upside breakout likely
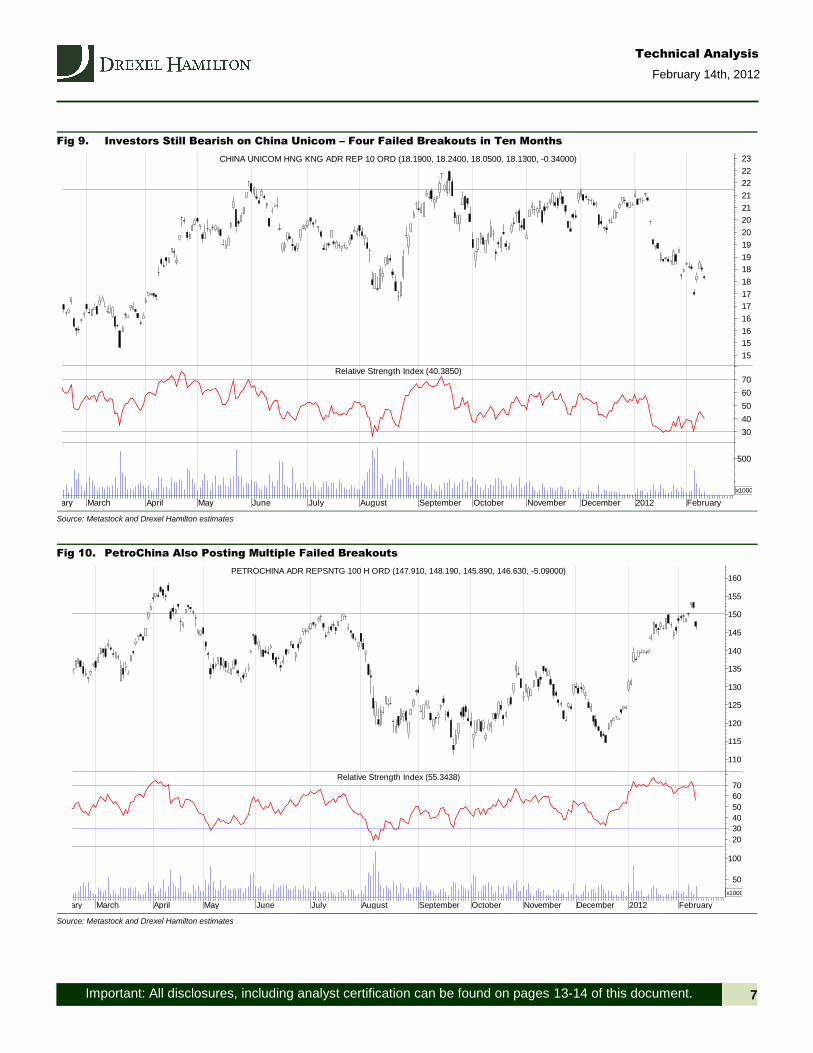
o China Unicom has experienced multiple failed breakouts
o PetroChina is unable to break above resistance at $150
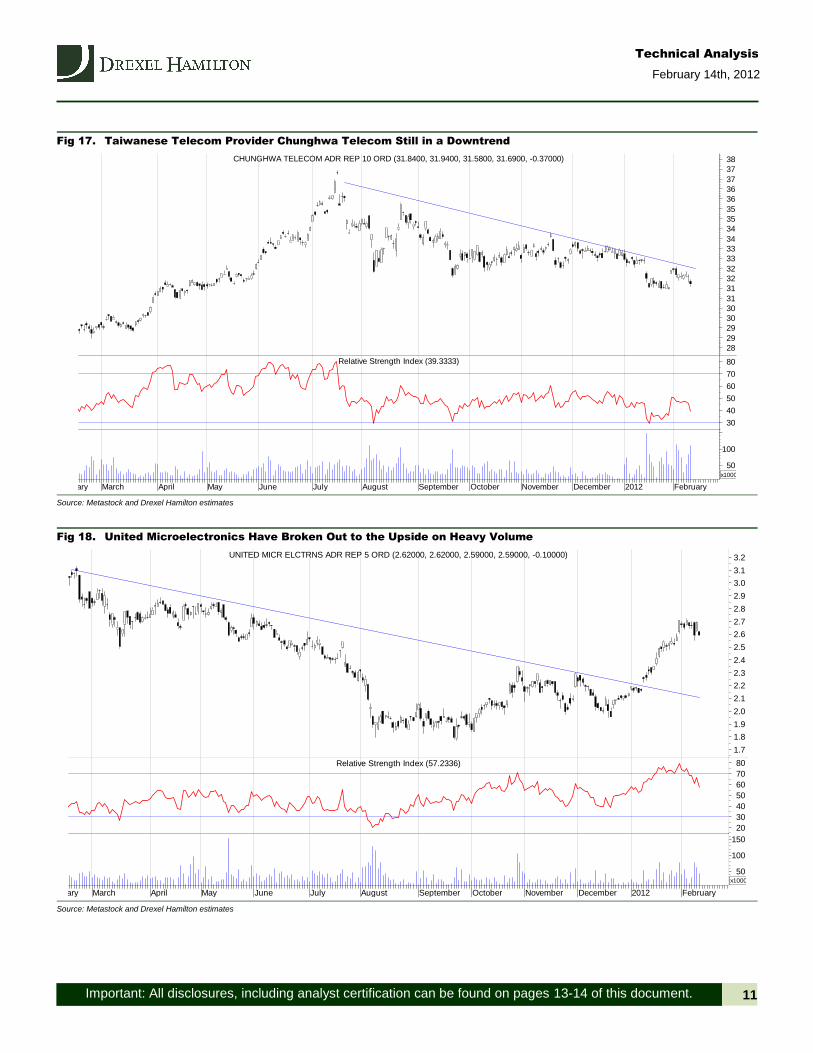
o Taiwanese telecom provider Chunghwa Telecom is still trending down
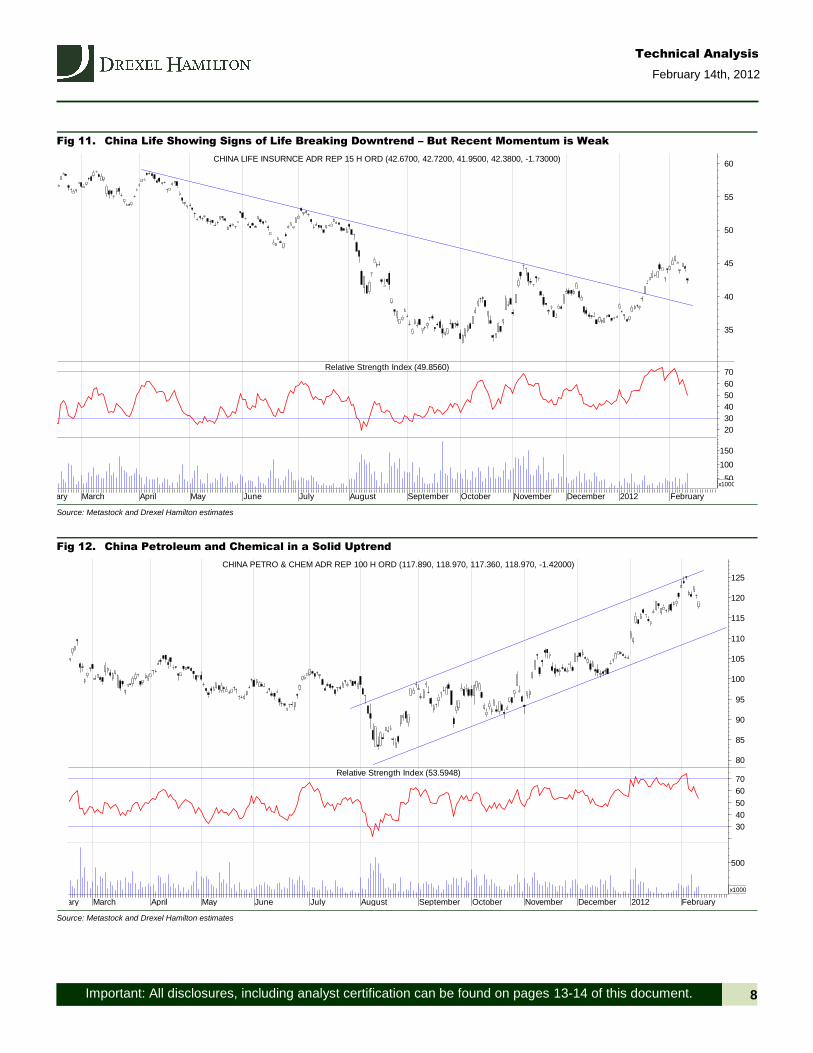
o China Life has also broken its downtrend
o China Petroleum and Chemical is the best looking chart with a solid uptrend in place since August
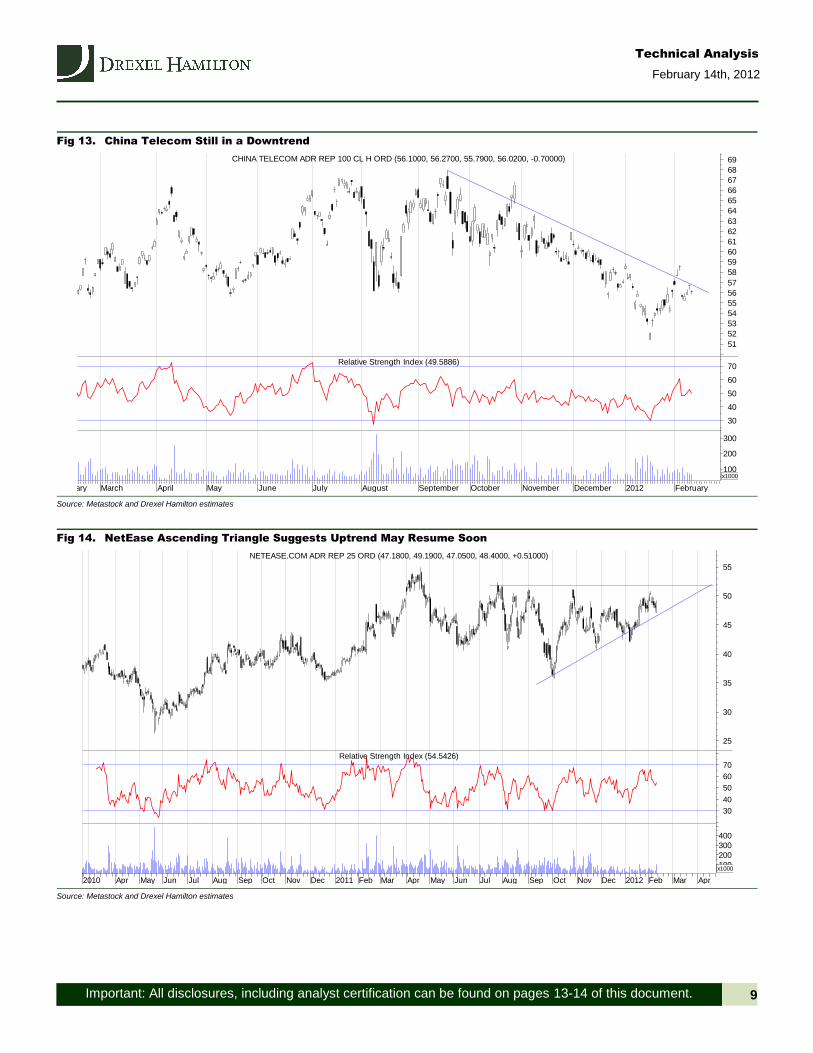
o China Telecom shares are still in a downtrend
o Taiwan-based United Microelectronics broke its downtrend line on heavy volume, signaling conviction
o NetEase is in a bullish ascending triangle pattern with a breakout to the upside expected
o Melco Crown Entertainment, which is a Macau casino operator, has broken out on heavy volume
o Yanzhou Coal has broken its downtrend but lacks conviction as volume is light
Important: All disclosures, including analyst certification can be found on pages 13-14 of this document.
Technical Analysis
February 14th, 2012
2
What’s Really Going on With US
Listed Chinese Stocks?
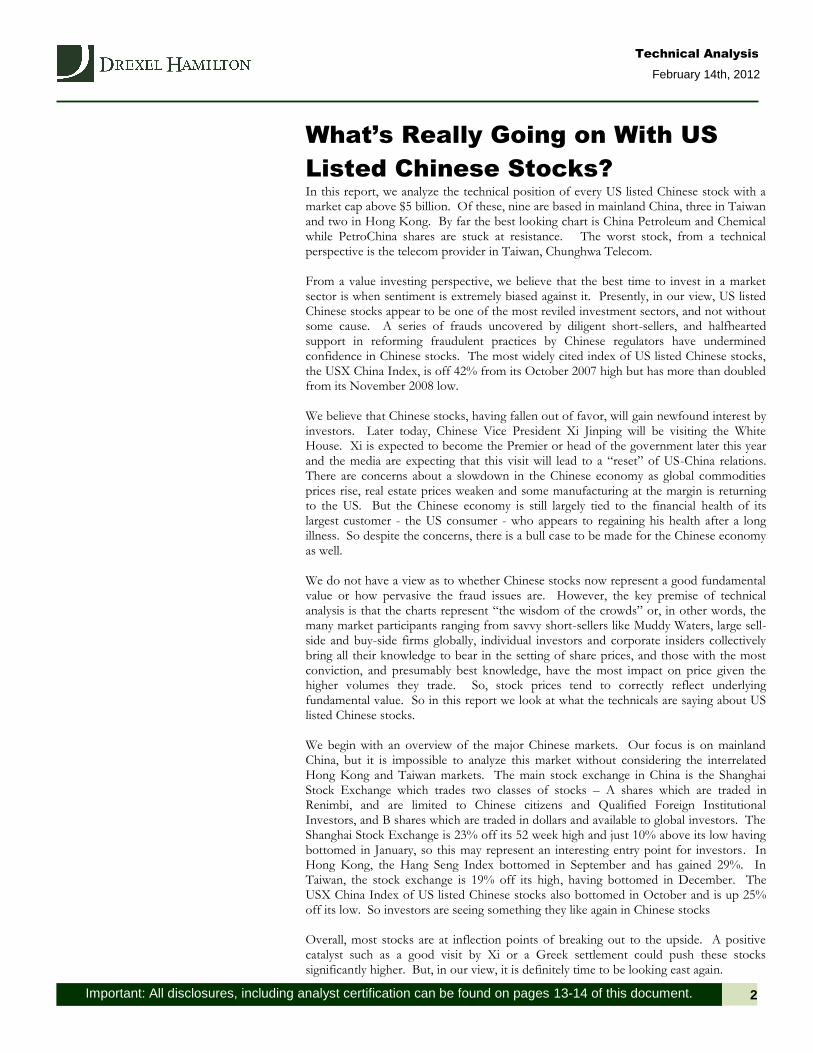
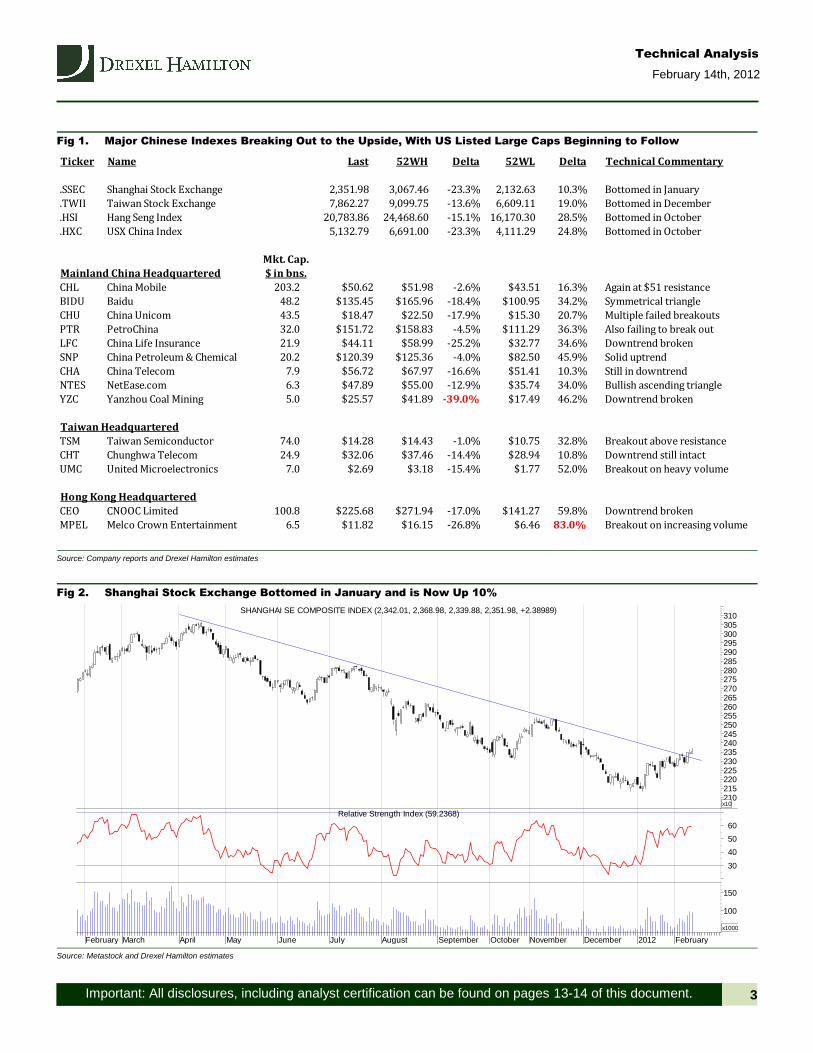
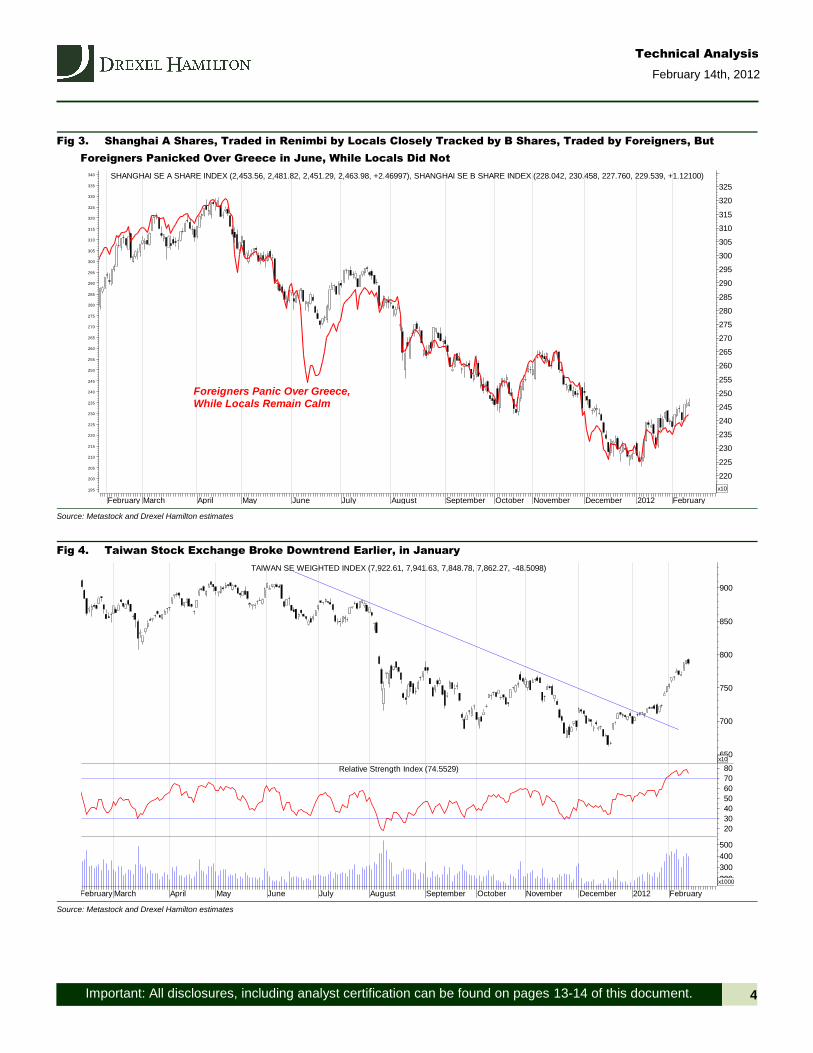
In this report, we analyze the technical position of every US listed Chinese stock with a market cap above $5 billion. Of these, nine are based in mainland China, three in Taiwan and two in Hong Kong. By far the best looking chart is China Petroleum and Chemical while PetroChina shares are stuck at resistance. The worst stock, from a technical perspective is the telecom provider in Taiwan, Chunghwa Telecom. From a value investing perspective, we believe that the best time to invest in a market sector is when sentiment is extremely biased against it. Presently, in our view, US listed Chinese stocks appear to be one of the most reviled investment sectors, and not without some cause. A series of frauds uncovered by diligent short-sellers, and halfhearted support in reforming fraudulent practices by Chinese regulators have undermined confidence in Chinese stocks. The most widely cited index of US listed Chinese stocks, the USX China Index, is off 42% from its October 2007 high but has more than doubled from its November 2008 low. We believe that Chinese stocks, having fallen out of favor, will gain newfound interest by investors. Later today, Chinese Vice President Xi Jinping will be visiting the White House. Xi is expected to become the Premier or head of the government later this year and the media are expecting that this visit will lead to a “reset” of US-China relations. There are concerns about a slowdown in the Chinese economy as global commodities prices rise, real estate prices weaken and some manufacturing at the margin is returning to the US. But the Chinese economy is still largely tied to the financial health of its largest customer - the US consumer - who appears to regaining his health after a long illness. So despite the concerns, there is a bull case to be made for the Chinese economy as well. We do not have a view as to whether Chinese stocks now represent a good fundamental value or how pervasive the fraud issues are. However, the key premise of technical analysis is that the charts represent “the wisdom of the crowds” or, in other words, the many market participants ranging from savvy short-sellers like Muddy Waters, large sell-side and buy-side firms globally, individual investors and corporate insiders collectively bring all their knowledge to bear in the setting of share prices, and those with the most conviction, and presumably best knowledge, have the most impact on price given the higher volumes they trade. So, stock prices tend to correctly reflect underlying fundamental value. So in this report we look at what the technicals are saying about US listed Chinese stocks. We begin with an overview of the major Chinese markets. Our focus is on mainland China, but it is impossible to analyze this market without considering the interrelated Hong Kong and Taiwan markets. The main stock exchange in China is the Shanghai Stock Exchange which trades two classes of stocks – A shares which are traded in Renimbi, and are limited to Chinese citizens and Qualified Foreign Institutional Investors, and B shares which are traded in dollars and available to global investors. The Shanghai Stock Exchange is 23% off its 52 week high and just 10% above its low having bottomed in January, so this may represent an interesting entry point for investors. In Hong Kong, the Hang Seng Index bottomed in September and has gained 29%. In Taiwan, the stock exchange is 19% off its high, having bottomed in December. The USX China Index of US listed Chinese stocks also bottomed in October and is up 25% off its low. So investors are seeing something they like again in Chinese stocks Overall, most stocks are at inflection points of breaking out to the upside. A positive catalyst such as a good visit by Xi or a Greek settlement could push these stocks significantly higher. But, in our view, it is definitely time to be looking east again.
Important: All disclosures, including analyst certification can be found on pages 13-14 of this document.
Technical Analysis
February 14th, 2012
3
Fig 1. Major Chinese Indexes Breaking Out to the Upside, With US Listed Large Caps Beginning to Follow
Source: Company reports and Drexel Hamilton estimates
Fig 2. Shanghai Stock Exchange Bottomed in January and is Now Up 10%
Source: Metastock and Drexel Hamilton estimates
Ticker Name Last 52WH Delta 52WL Delta Technical Commentary
.SSEC Shanghai Stock Exchange 2,351.98 3,067.46 -23.3% 2,132.63 10.3% Bottomed in January
.TWII Taiwan Stock Exchange 7,862.27 9,099.75 -13.6% 6,609.11 19.0% Bottomed in December
.HSI Hang Seng Index 20,783.86 24,468.60 -15.1% 16,170.30 28.5% Bottomed in October
.HXC USX China Index 5,132.79 6,691.00 -23.3% 4,111.29 24.8% Bottomed in October
Mkt. Cap.
Mainland China Headquartered $ in bns.
CHL China Mobile 203.2 $50.62 $51.98 -2.6% $43.51 16.3% Again at $51 resistance
BIDU Baidu 48.2 $135.45 $165.96 -18.4% $100.95 34.2% Symmetrical triangle
CHU China Unicom 43.5 $18.47 $22.50 -17.9% $15.30 20.7% Multiple failed breakouts
PTR PetroChina 32.0 $151.72 $158.83 -4.5% $111.29 36.3% Also failing to break out
LFC China Life Insurance 21.9 $44.11 $58.99 -25.2% $32.77 34.6% Downtrend broken
SNP China Petroleum & Chemical 20.2 $120.39 $125.36 -4.0% $82.50 45.9% Solid uptrend
CHA China Telecom 7.9 $56.72 $67.97 -16.6% $51.41 10.3% Still in downtrend
NTES NetEase.com 6.3 $47.89 $55.00 -12.9% $35.74 34.0% Bullish ascending triangle
YZC Yanzhou Coal Mining 5.0 $25.57 $41.89 -39.0% $17.49 46.2% Downtrend broken
Taiwan Headquartered
TSM Taiwan Semiconductor 74.0 $14.28 $14.43 -1.0% $10.75 32.8% Breakout above resistance
CHT Chunghwa Telecom 24.9 $32.06 $37.46 -14.4% $28.94 10.8% Downtrend still intact
UMC United Microelectronics 7.0 $2.69 $3.18 -15.4% $1.77 52.0% Breakout on heavy volume
Hong Kong Headquartered
CEO CNOOC Limited 100.8 $225.68 $271.94 -17.0% $141.27 59.8% Downtrend broken
MPEL Melco Crown Entertainment 6.5 $11.82 $16.15 -26.8% $6.46 83.0% Breakout on increasing volume
February March April May June July August September October November December 2012 February
100
150
x1000
30
40
50
60
Relative Strength Index (59.2368)
210215220225230235240245250255260265270275280285290295300305310
x10
SHANGHAI SE COMPOSITE INDEX (2,342.01, 2,368.98, 2,339.88, 2,351.98, +2.38989)
Important: All disclosures, including analyst certification can be found on pages 13-14 of this document.
Technical Analysis
February 14th, 2012
4
Fig 3. Shanghai A Shares, Traded in Renimbi by Locals Closely Tracked by B Shares, Traded by Foreigners, But
Foreigners Panicked Over Greece in June, While Locals Did Not
Source: Metastock and Drexel Hamilton estimates
Fig 4. Taiwan Stock Exchange Broke Downtrend Earlier, in January
Source: Metastock and Drexel Hamilton estimates
February March April May June July August September October November December 2012 February
195
200
205
210
215
220
225
230
235
240
245
250
255
260
265
270
275
280
285
290
295
300
305
310
315
320
325
330
335
340
220
225
230
235
240
245
250
255
260
265
270
275
280
285
290
295
300
305
310
315
320
325
x10
Foreigners Panic Over Greece,While Locals Remain Calm
SHANGHAI SE A SHARE INDEX (2,453.56, 2,481.82, 2,451.29, 2,463.98, +2.46997), SHANGHAI SE B SHARE INDEX (228.042, 230.458, 227.760, 229.539, +1.12100)
February March April May June July August September October November December 2012 February
200
300
400
500
x10000
20
30
40
50
60
70
80Relative Strength Index (74.5529)
650
700
750
800
850
900
x10
TAIWAN SE WEIGHTED INDEX (7,922.61, 7,941.63, 7,848.78, 7,862.27, -48.5098)

Important: All disclosures, including analyst certification can be found on pages 13-14 of this document.
Technical Analysis
February 14th, 2012
5
Fig 5. Hang Seng Bottomed Much Earlier, Presaging Shanghai Rally
Source: Metastock and Drexel Hamilton estimates
Fig 6. USX China Index of US Listed Chinese Equities Bottomed in October and Broke its Downtrend in January
Source: Metastock and Drexel Hamilton estimates
February March April May June July August September October November December 2012 February
500
x10000000
20
30
40
50
60
70Relative Strength Index (66.5457)
160
165
170
175
180
185
190
195
200
205
210
215
220
225
230
235
240
245
250
x100
HANG SENG INDEX (20,986.20, 21,002.30, 20,703.80, 20,783.90, -226.100)
September November 2011 February March April May June July August September November 2012 February
20
30
40
50
60
70
80Relative Strength Index (58.4955)
400
450
500
550
600
650
x10
USX CHINA INDEX (5,172.84, 5,172.84, 5,117.95, 5,132.79, -97.1401)
Important: All disclosures, including analyst certification can be found on pages 13-14 of this document.
Technical Analysis
February 14th, 2012
6
Shares of Mainland Based Companies Near
of Breaking Above Resistance
Fig 7. China Mobile Finding Resistance at $51.50 – At $200 bn Market Cap It Is Over 4x Larger Than Next Largest Co.
Source: Metastock and Drexel Hamilton estimates
Fig 8. Baidu Shares Forming Symmetrical Triangle – Presaging Breakout to the Upside
Source: Metastock and Drexel Hamilton estimates
February March April May June July August September October November December 2012 February
100
200
300
400
x10000
30
40
50
60
70Relative Strength Index (56.9037)
43
43
44
44
45
45
46
46
47
47
48
48
49
49
50
50
51
51
52
52CHINA MOBILE ADR REPSG 5 ORD (50.6700, 50.7459, 50.4100, 50.6000, -0.02000)
February March April May June July August September October November December 2012 February
50
100
150
200
x100000
30
40
50
60
70
Relative Strength Index (62.7497)
100
105
110
115
120
125
130
135
140
145
150
155
160
165
170BAIDU ADR REP 1/10 CL A ORD (134.280, 138.000, 133.490, 136.590, +1.14499)
Important: All disclosures, including analyst certification can be found on pages 13-14 of this document.
Technical Analysis
February 14th, 2012
7
Fig 9. Investors Still Bearish on China Unicom – Four Failed Breakouts in Ten Months
Source: Metastock and Drexel Hamilton estimates
Fig 10. PetroChina Also Posting Multiple Failed Breakouts
Source: Metastock and Drexel Hamilton estimates
February March April May June July August September October November December 2012 February
500
x10000
30
40
50
60
70Relative Strength Index (40.3850)
15
15
16
16
17
17
18
18
19
19
20
20
21
21
22
22
23CHINA UNICOM HNG KNG ADR REP 10 ORD (18.1900, 18.2400, 18.0500, 18.1300, -0.34000)
February March April May June July August September October November December 2012 February
50
100
x10000
20
30
40
50
60
70Relative Strength Index (55.3438)
110
115
120
125
130
135
140
145
150
155
160PETROCHINA ADR REPSNTG 100 H ORD (147.910, 148.190, 145.890, 146.630, -5.09000)
Important: All disclosures, including analyst certification can be found on pages 13-14 of this document.
Technical Analysis
February 14th, 2012
8
Fig 11. China Life Showing Signs of Life Breaking Downtrend – But Recent Momentum is Weak
Source: Metastock and Drexel Hamilton estimates
Fig 12. China Petroleum and Chemical in a Solid Uptrend
Source: Metastock and Drexel Hamilton estimates
February March April May June July August September October November December 2012 February
50
100
150
x10000
20
30
40
50
60
70Relative Strength Index (49.8560)
35
40
45
50
55
60CHINA LIFE INSURNCE ADR REP 15 H ORD (42.6700, 42.7200, 41.9500, 42.3800, -1.73000)
February March April May June July August September October November December 2012 February
500
x1000
30
40
50
60
70Relative Strength Index (53.5948)
80
85
90
95
100
105
110
115
120
125
CHINA PETRO & CHEM ADR REP 100 H ORD (117.890, 118.970, 117.360, 118.970, -1.42000)
Important: All disclosures, including analyst certification can be found on pages 13-14 of this document.
Technical Analysis
February 14th, 2012
9
Fig 13. China Telecom Still in a Downtrend
Source: Metastock and Drexel Hamilton estimates
Fig 14. NetEase Ascending Triangle Suggests Uptrend May Resume Soon
Source: Metastock and Drexel Hamilton estimates
February March April May June July August September October November December 2012 February
100
200
300
x1000
30
40
50
60
70Relative Strength Index (49.5886)
51
52
53
54
55
56
57
58
59
60
61
62
63
64
65
66
67
68
69CHINA TELECOM ADR REP 100 CL H ORD (56.1000, 56.2700, 55.7900, 56.0200, -0.70000)
2010 Apr May Jun Jul Aug Sep Oct Nov Dec 2011 Feb Mar Apr May Jun Jul Aug Sep Oct Nov Dec 2012 Feb Mar Apr
100
200
300
400
x10000
30
40
50
60
70Relative Strength Index (54.5426)
25
30
35
40
45
50
55
NETEASE.COM ADR REP 25 ORD (47.1800, 49.1900, 47.0500, 48.4000, +0.51000)
Important: All disclosures, including analyst certification can be found on pages 13-14 of this document.
Technical Analysis
February 14th, 2012
10
Fig 15. Yanzhou Coal Has Broken Downtrend But Shows Little Conviction on Lagging Volume
Source: Metastock and Drexel Hamilton estimates
Taiwan Based Stocks a Mixed Bag
Fig 16. Taiwan Semiconductor Has Broken Old Resistance, Which is Now Acting as Support
Source: Metastock and Drexel Hamilton estimates
February March April May June July August September October November December 2012 February
500
x1000
20
30
40
50
60
70
80Relative Strength Index (52.7742)
20
25
30
35
40
YANZHOU COAL ADR REP 10 ORD (24.7100, 24.7400, 24.3029, 24.4000, -1.17000)
February March April May June July August September October November December 2012 February
100
200
300
400
x100000
30
40
50
60
70Relative Strength Index (50.3110)
10
11
11
12
12
13
13
14
14TAIWAN SEMICONDUCTOR MNFTG ADR 5 ORD (14.0800, 14.0900, 13.7900, 13.8400, -0.44000)
Important: All disclosures, including analyst certification can be found on pages 13-14 of this document.
Technical Analysis
February 14th, 2012
11
Fig 17. Taiwanese Telecom Provider Chunghwa Telecom Still in a Downtrend
Source: Metastock and Drexel Hamilton estimates
Fig 18. United Microelectronics Have Broken Out to the Upside on Heavy Volume
Source: Metastock and Drexel Hamilton estimates
February March April May June July August September October November December 2012 February
50
100
x10000
30
40
50
60
70
80Relative Strength Index (39.3333)
28
29
29
30
30
31
31
32
32
33
33
34
34
35
35
36
36
37
37
38CHUNGHWA TELECOM ADR REP 10 ORD (31.8400, 31.9400, 31.5800, 31.6900, -0.37000)
February March April May June July August September October November December 2012 February
50
100
150
x100000
20
30
40
50
60
70
80Relative Strength Index (57.2336)
1.7
1.8
1.9
2.0
2.1
2.2
2.3
2.4
2.5
2.6
2.7
2.8
2.9
3.0
3.1
3.2UNITED MICR ELCTRNS ADR REP 5 ORD (2.62000, 2.62000, 2.59000, 2.59000, -0.10000)
Important: All disclosures, including analyst certification can be found on pages 13-14 of this document.
Technical Analysis
February 14th, 2012
12
Hong Kong Based Chinese Stocks
Fig 19. CNOOC Has Broken Out to the Upside, But on Light Volume
Source: Metastock and Drexel Hamilton estimates
Fig 20. Melco Crown Entertainment, a Macau Gaming Company, Has Broken its Downtrend With Increasing Volume
Source: Metastock and Drexel Hamilton estimates
February March April May June July August September October November December 2012 February
500
x1000
20
30
40
50
60
70Relative Strength Index (68.5433)
140
150
160
170
180
190
200
210
220
230
240
250
260
270
280CNOOC ADR REP 100 ORD (221.465, 225.000, 218.500, 221.410, -4.26999)
February March April May June July August September October November December 2012 February
50
100
150200
250
x100000
30
40
50
60
70
80Relative Strength Index (55.6609)
66778899
1010111112121313141415151616
MELCO CROWN ENTERTAIN ADR REP 3 ORD (11.4500, 11.6500, 11.4000, 11.5300, -0.29000)
Technical Analysis
February 14th, 2012
13
Company Disclosure
Equity Research Disclosure Legend
1. Drexel Hamilton makes a market in the securities of the subject company.
2. The analyst or a member of the analyst's household serves as an officer, director, or advisory board member of the subject company.
3. The analyst or a member of the analyst's household owns shares of the subject company.
4. Drexel Hamilton has managed or co-managed a public offering of securities for the subject company in the last 12 months.
5. Drexel Hamilton has received compensation for investment banking services from the subject company in the last 12 months.
6. Drexel Hamilton expects to receive or intends to seek compensation for investment banking services from the subject company in the
next three months.
7. Drexel Hamilton or its affiliates beneficially own 1% or more of the common stock of the subject company as calculated in accordance
with Section 13(d) of the Securities Exchange Act of 1934.
8. The subject company is, or during the past 12 months was, a client of Drexel Hamilton, which provided non-investment banking,
securities-related services to, and received compensation from, the subject company for such services. The analyst or employees of
Drexel Hamilton with the ability to influence the substance of this report knows the foregoing facts.
9. An affiliate of Drexel Hamilton received compensation from the subject company for products or services other than investment banking
services during the past 12 months. The analyst or employees of Drexel Hamilton with the ability to influence the substance of this
report know or have reason to know the foregoing facts.
For valuation methodology and related risk factors, please refer to the body text of this report or to individual reports on any covered companies referenced in this report.
The analyst(s) principally responsible for preparation of this report received compensation that is based upon many factors, including the firm’s overall revenue.
Analyst Certification
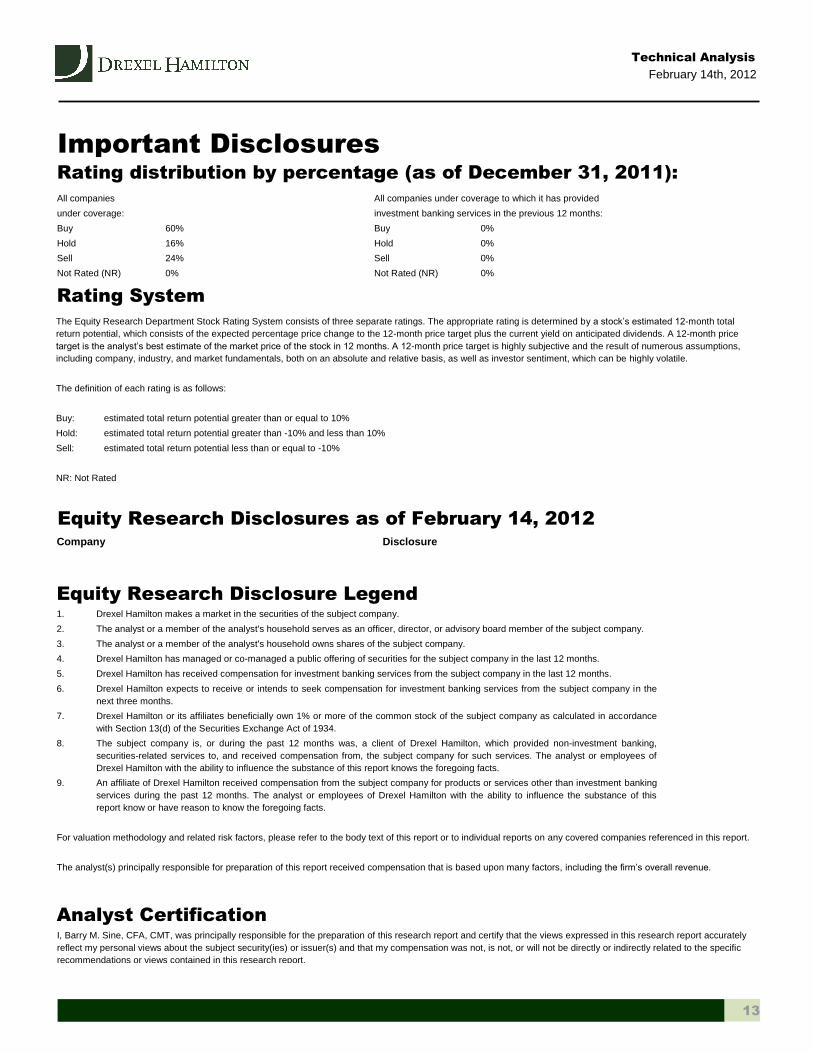
Important Disclosures
Rating distribution by percentage (as of December 31, 2011):
All companies All companies under coverage to which it has provided
under coverage: investment banking services in the previous 12 months:
Buy 60% Buy 0%
Hold 16% Hold 0%
Sell 24% Sell 0%
Not Rated (NR) 0% Not Rated (NR) 0%
Rating System
The Equity Research Department Stock Rating System consists of three separate ratings. The appropriate rating is determined by a stock’s estimated 12-month total
return potential, which consists of the expected percentage price change to the 12-month price target plus the current yield on anticipated dividends. A 12-month price
target is the analyst’s best estimate of the market price of the stock in 12 months. A 12-month price target is highly subjective and the result of numerous assumptions,
including company, industry, and market fundamentals, both on an absolute and relative basis, as well as investor sentiment, which can be highly volatile.
The definition of each rating is as follows:
Buy: estimated total return potential greater than or equal to 10%
Hold: estimated total return potential greater than -10% and less than 10%
Sell: estimated total return potential less than or equal to -10%
NR: Not Rated
Equity Research Disclosures as of February 14, 2012
I, Barry M. Sine, CFA, CMT, was principally responsible for the preparation of this research report and certify that the views expressed in this research report accurately
reflect my personal views about the subject security(ies) or issuer(s) and that my compensation was not, is not, or will not be directly or indirectly related to the specific
recommendations or views contained in this research report.

Technical Analysis
February 14th, 2012
14
Other Disclosures
The information and statistics in this report have been obtained from sources we believe are reliable but we do not warrant their accuracy or completeness. We do not
undertake to advise the reader as to changes in figures or our views. This is not a solicitation of an order to buy or sell any securities.
FINRA Regulation has adopted rules that will prohibit research analysts from trading in securities of covered companies during specified time periods before and after the
publication of research.
Drexel Hamilton will effect agency transactions in the securities mentioned, on behalf of its clients submitting orders to buy or sell.
Drexel Hamilton makes its research reports available to institutional investors through Bloomberg, Thomson Reuters, FactSet, and Capital IQ.
This report or any portion hereof may not be reprinted, sold, or redistributed without the written consent of Drexel Hamilton.
Copyright © Drexel Hamilton 2012. Member FINRA and SIPC.