Embed Size (px)
DESCRIPTION
A Presentation to illustrate the importance of Data Analysis in designing Warehouses, DC's, or Factories.
Citation preview
Email: [email protected] Phone: 801-869-0712 Address: 4844 Pinewood Drive Taylorsville, UT 84123-4311
Techniques and Methods in Analyzing Data for use in Designing
Warehouses and Distribution Centers
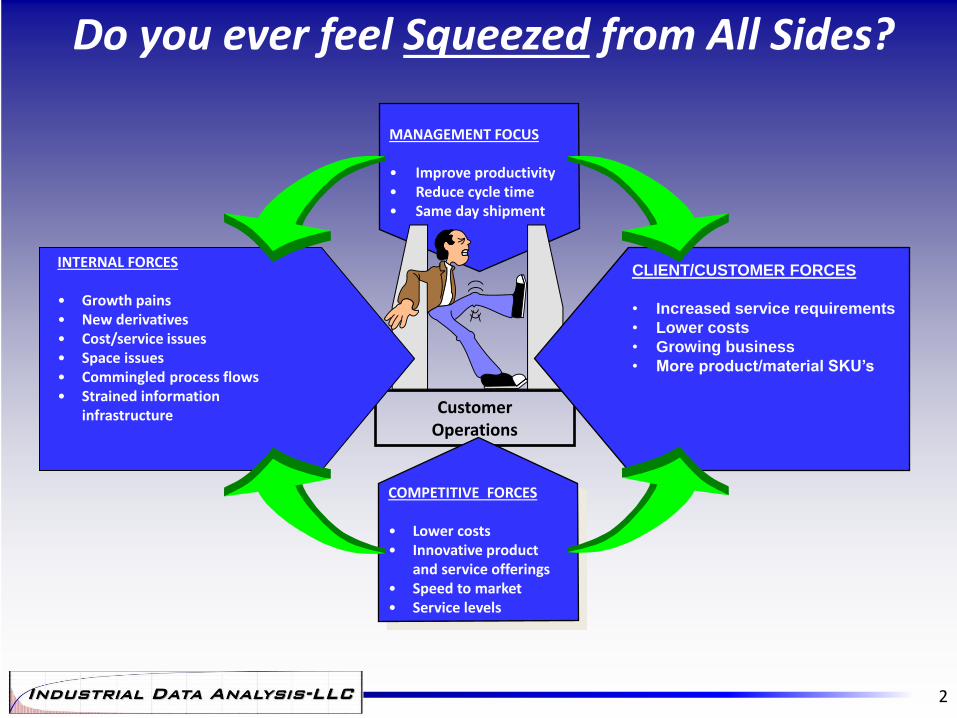
Do you ever feel Squeezed from All Sides?
2
Customer Operations
CLIENT/CUSTOMER FORCES
• Increased service requirements
• Lower costs
• Growing business
• More product/material SKU’s
INTERNAL FORCES • Growth pains • New derivatives • Cost/service issues • Space issues • Commingled process flows • Strained information
infrastructure
COMPETITIVE FORCES • Lower costs • Innovative product
and service offerings • Speed to market • Service levels
MANAGEMENT FOCUS • Improve productivity • Reduce cycle time • Same day shipment
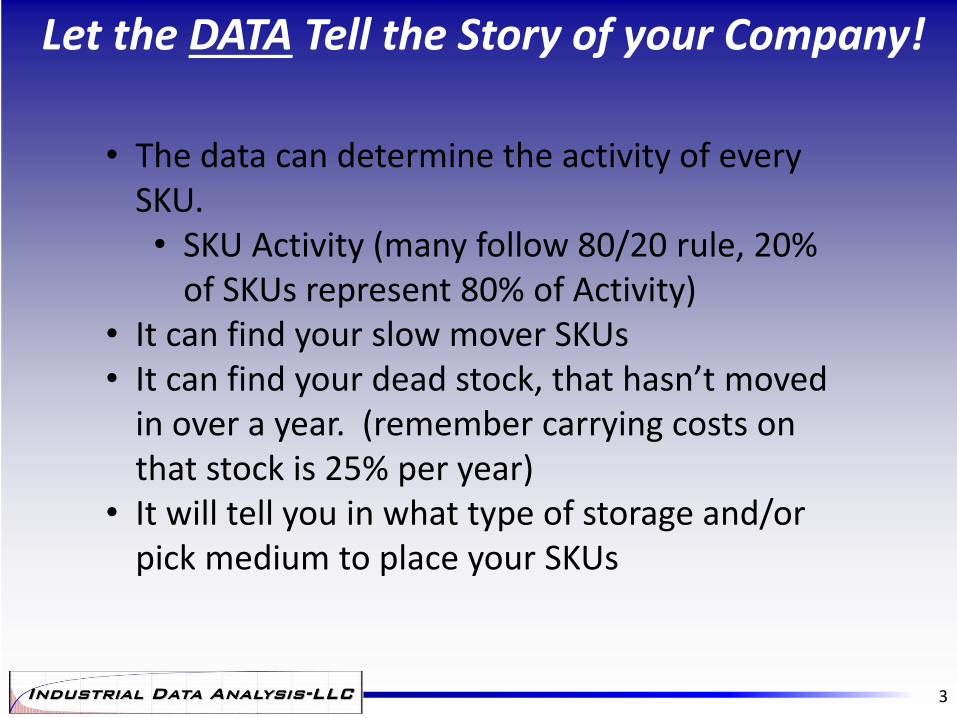
Let the DATA Tell the Story of your Company!
3
• The data can determine the activity of every SKU. • SKU Activity (many follow 80/20 rule, 20%
of SKUs represent 80% of Activity) • It can find your slow mover SKUs • It can find your dead stock, that hasn’t moved
in over a year. (remember carrying costs on that stock is 25% per year)
• It will tell you in what type of storage and/or pick medium to place your SKUs
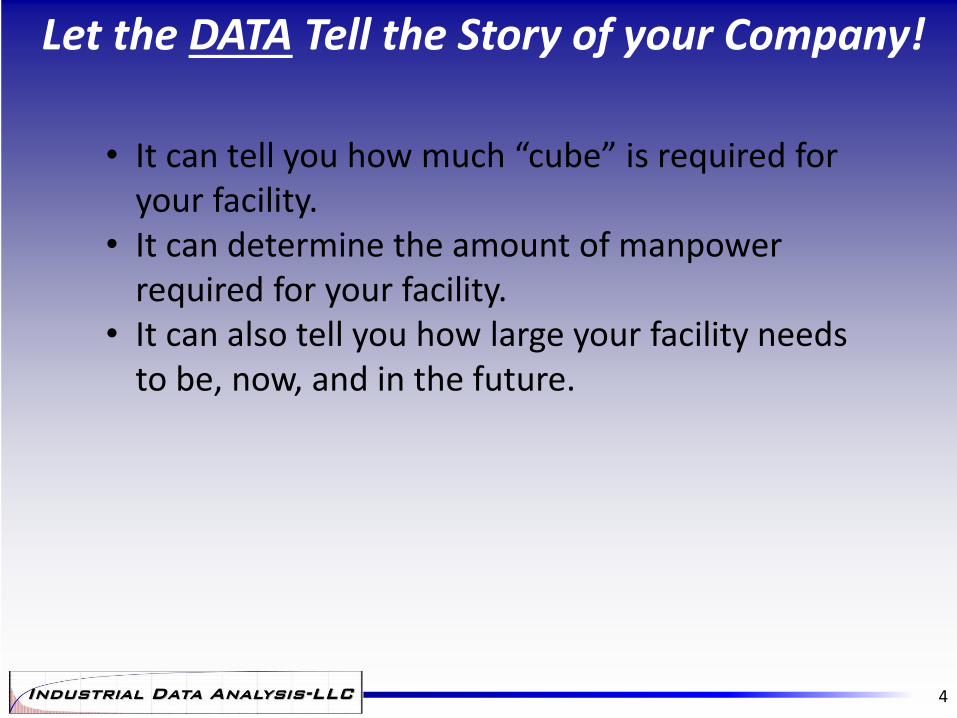
Let the DATA Tell the Story of your Company!
4
• It can tell you how much “cube” is required for your facility.
• It can determine the amount of manpower required for your facility.
• It can also tell you how large your facility needs to be, now, and in the future.
What Kind of File Type is Needed
5
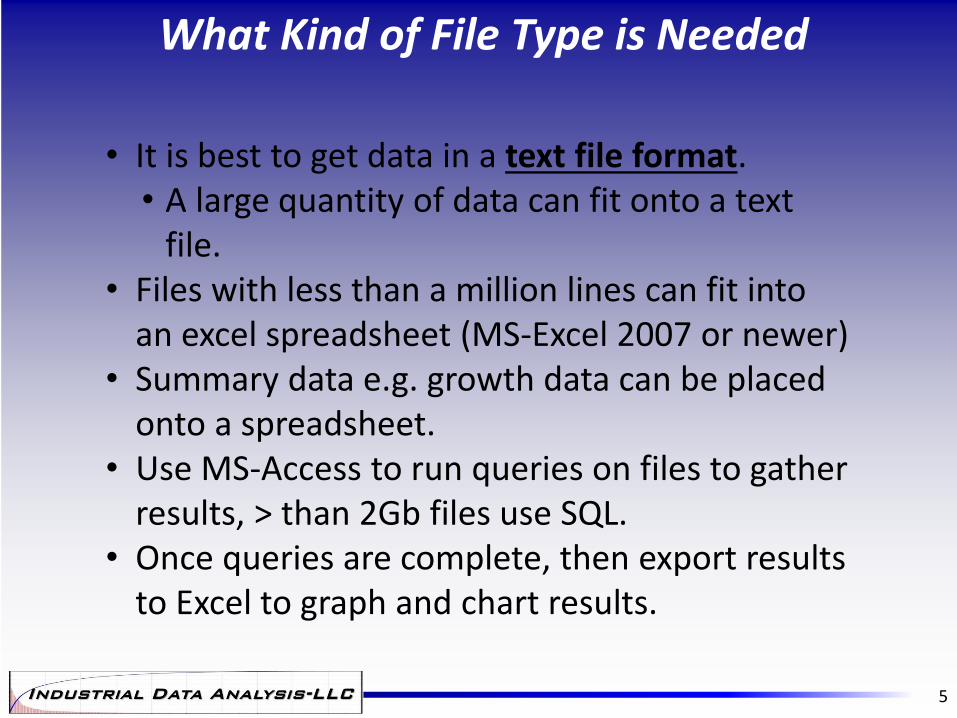
• It is best to get data in a text file format. • A large quantity of data can fit onto a text
file. • Files with less than a million lines can fit into
an excel spreadsheet (MS-Excel 2007 or newer) • Summary data e.g. growth data can be placed
onto a spreadsheet. • Use MS-Access to run queries on files to gather
results, > than 2Gb files use SQL. • Once queries are complete, then export results
to Excel to graph and chart results.
What Needs to be in the Data?
6
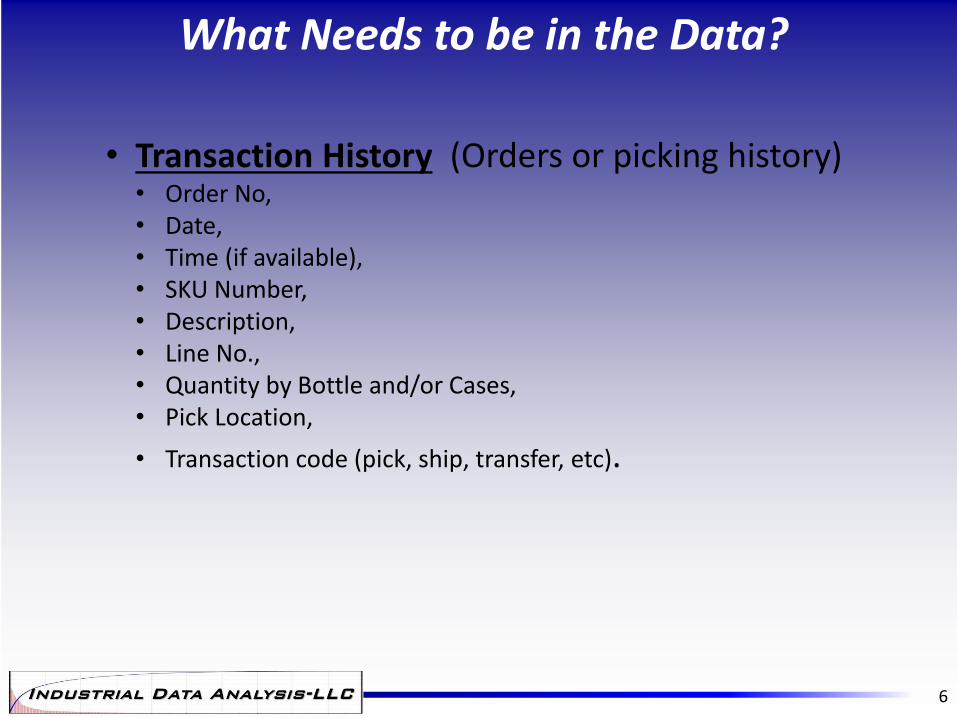
• Transaction History (Orders or picking history) • Order No, • Date, • Time (if available), • SKU Number, • Description, • Line No., • Quantity by Bottle and/or Cases, • Pick Location,
• Transaction code (pick, ship, transfer, etc).
What Needs to be in the Data?
7
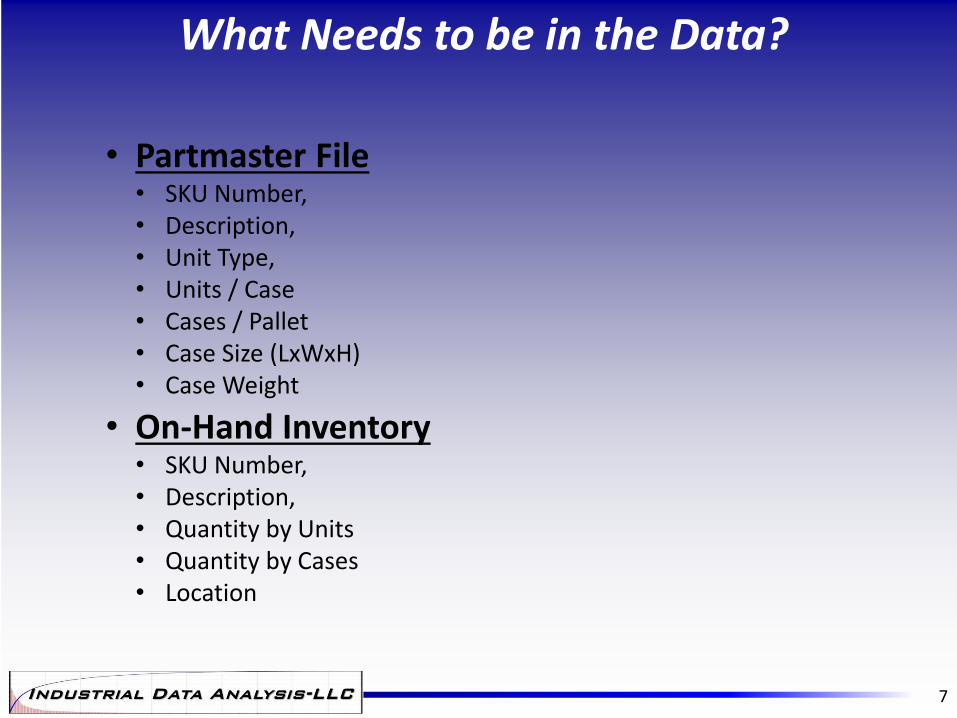
• Partmaster File • SKU Number, • Description, • Unit Type, • Units / Case • Cases / Pallet • Case Size (LxWxH) • Case Weight
• On-Hand Inventory • SKU Number, • Description, • Quantity by Units • Quantity by Cases • Location
What Needs to be in the Data?
8
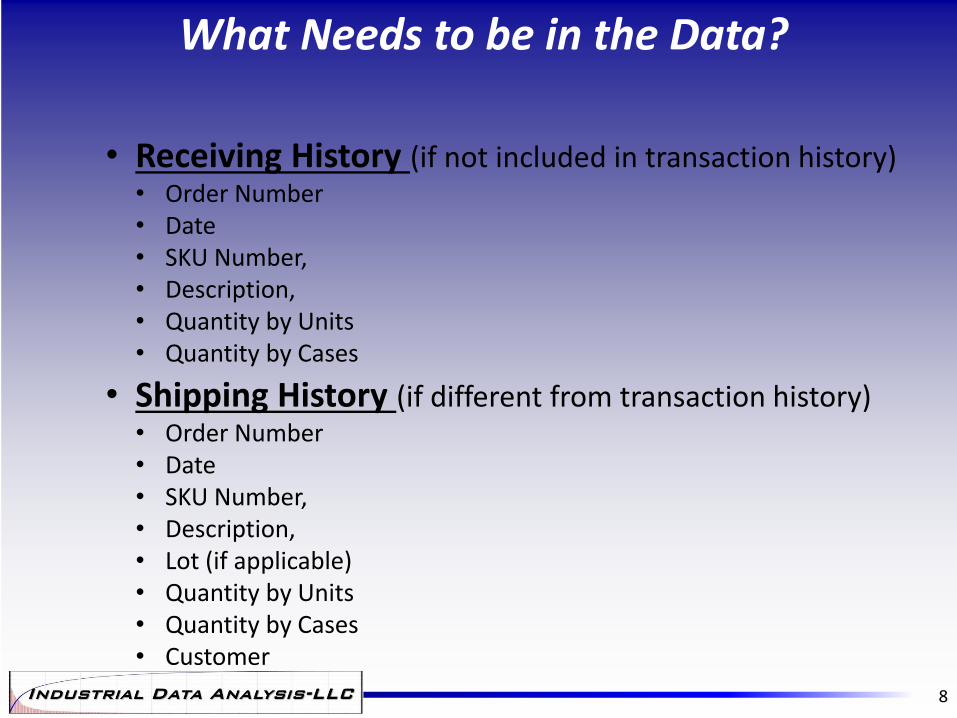
• Receiving History (if not included in transaction history) • Order Number • Date • SKU Number, • Description, • Quantity by Units • Quantity by Cases
• Shipping History (if different from transaction history) • Order Number • Date • SKU Number, • Description, • Lot (if applicable) • Quantity by Units • Quantity by Cases • Customer
Types of Graphs & Charts
9
Types of Graphs & Charts
10
Summary of Data Analysis
11
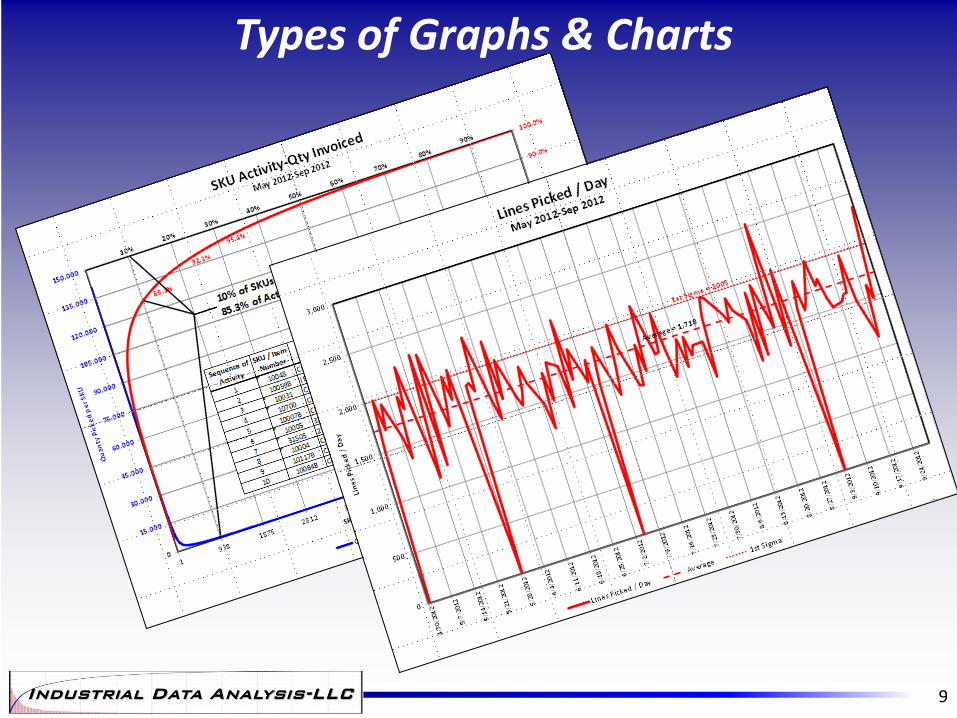
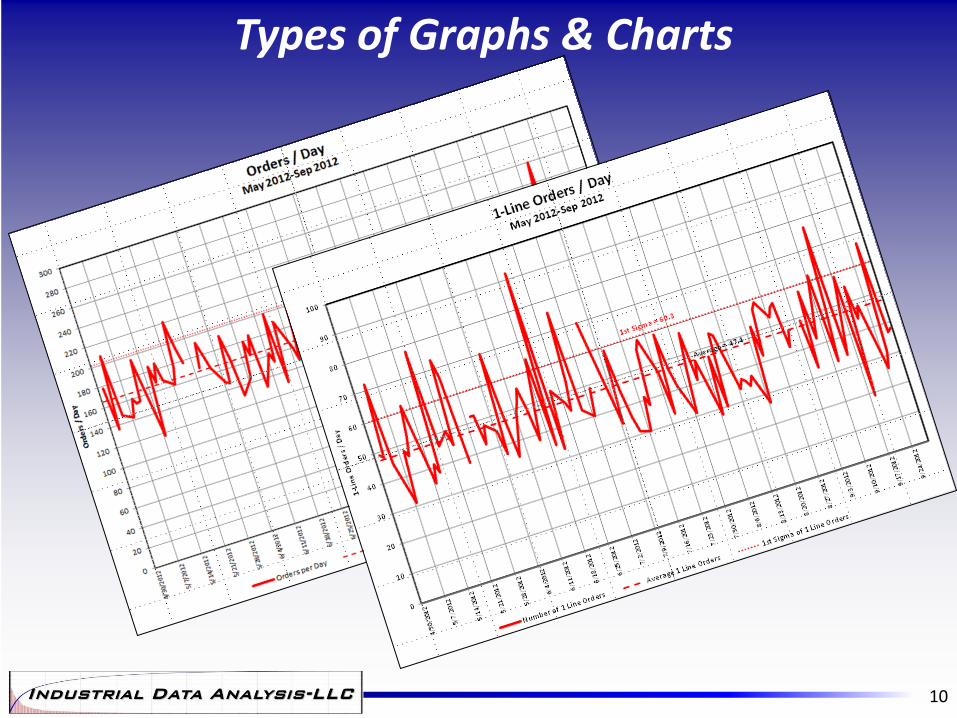
• Summary identifies: • Actual Data of each analysis • Average of Data • 1st Sigma of data, this compensates for highs and lows in the
data, and allows you to design to a realistic level. • Where applicable, use a moving average to identify seasonal
trends
• By activity and cube of data, it can determine
the amount of manpower required for your facility.
• It can also tell you how large your facility needs to be, now, and in the future.
Using Data to Design a System
12
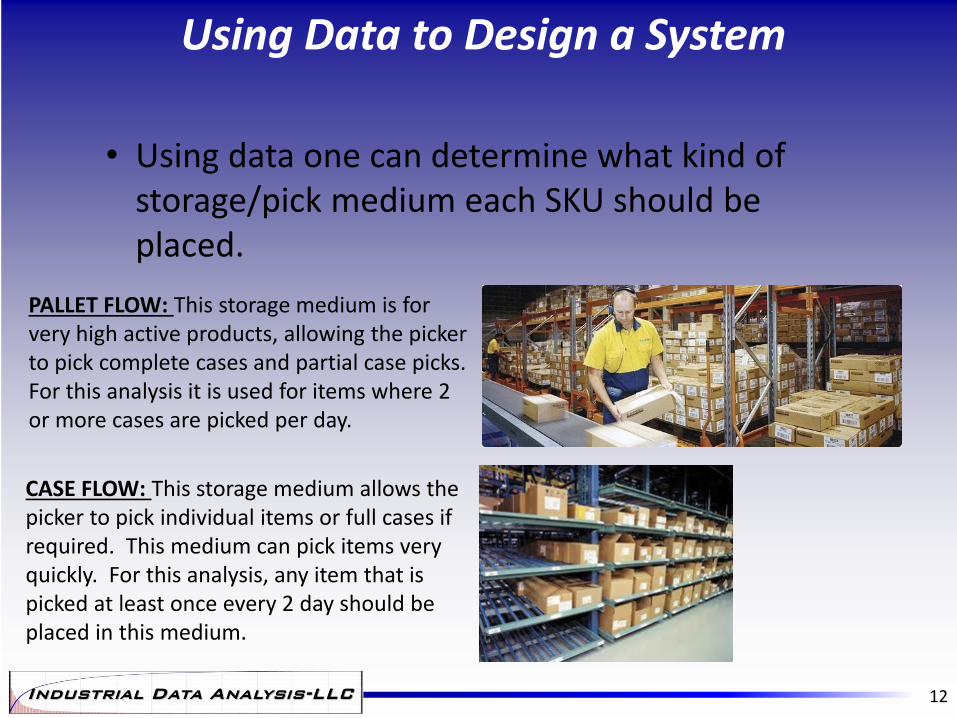
• Using data one can determine what kind of storage/pick medium each SKU should be placed.
PALLET FLOW: This storage medium is for very high active products, allowing the picker to pick complete cases and partial case picks. For this analysis it is used for items where 2 or more cases are picked per day.
CASE FLOW: This storage medium allows the picker to pick individual items or full cases if required. This medium can pick items very quickly. For this analysis, any item that is picked at least once every 2 day should be placed in this medium.
Using Data to Design a System
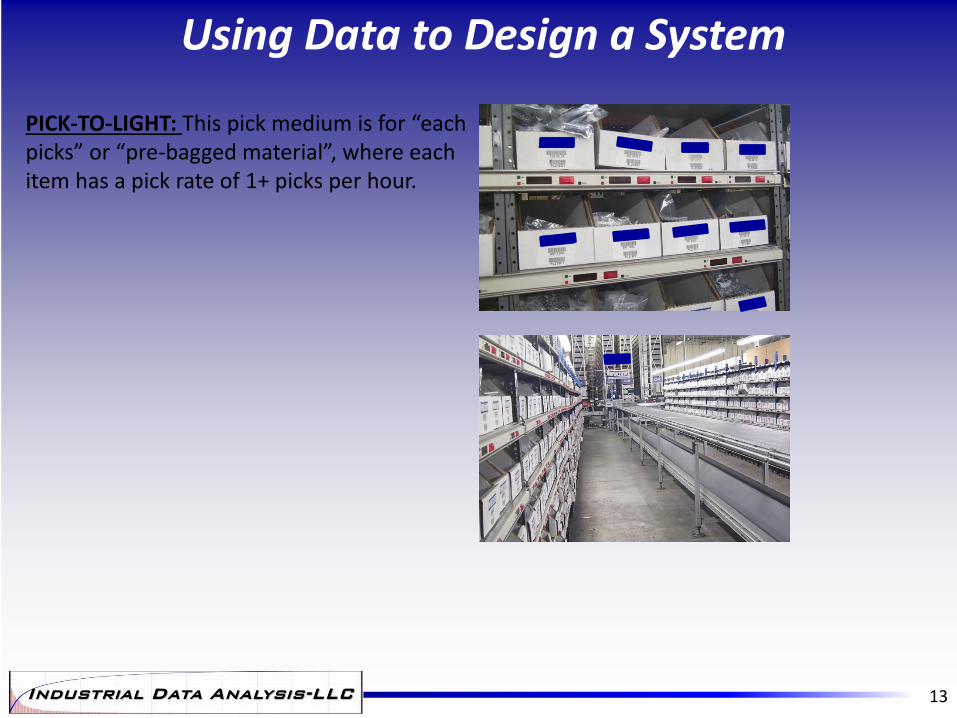
PICK-TO-LIGHT: This pick medium is for “each picks” or “pre-bagged material”, where each item has a pick rate of 1+ picks per hour.
13
Using Data to Design a System
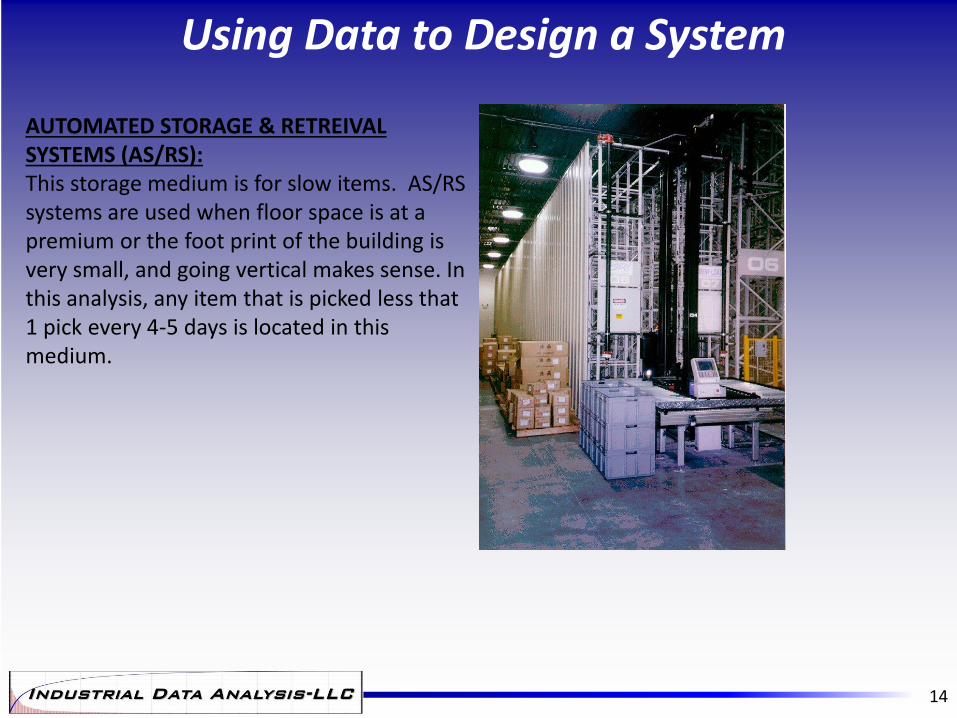
AUTOMATED STORAGE & RETREIVAL SYSTEMS (AS/RS): This storage medium is for slow items. AS/RS systems are used when floor space is at a premium or the foot print of the building is very small, and going vertical makes sense. In this analysis, any item that is picked less that 1 pick every 4-5 days is located in this medium.
14
Using Data to Design a System
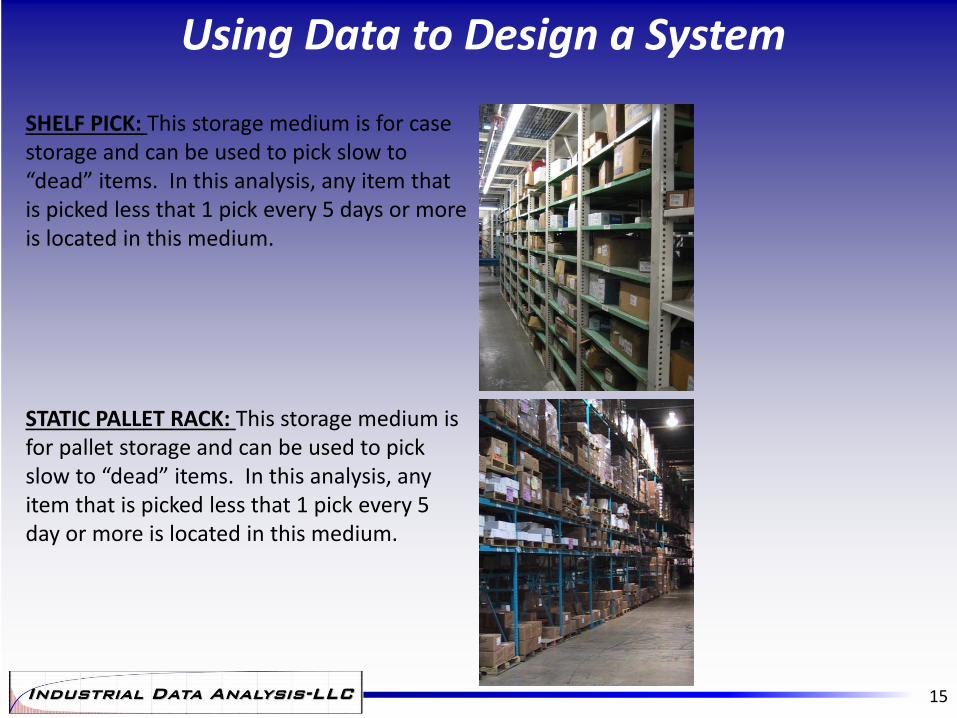
STATIC PALLET RACK: This storage medium is for pallet storage and can be used to pick slow to “dead” items. In this analysis, any item that is picked less that 1 pick every 5 day or more is located in this medium.
SHELF PICK: This storage medium is for case storage and can be used to pick slow to “dead” items. In this analysis, any item that is picked less that 1 pick every 5 days or more is located in this medium.
15
Using Data to Design a System
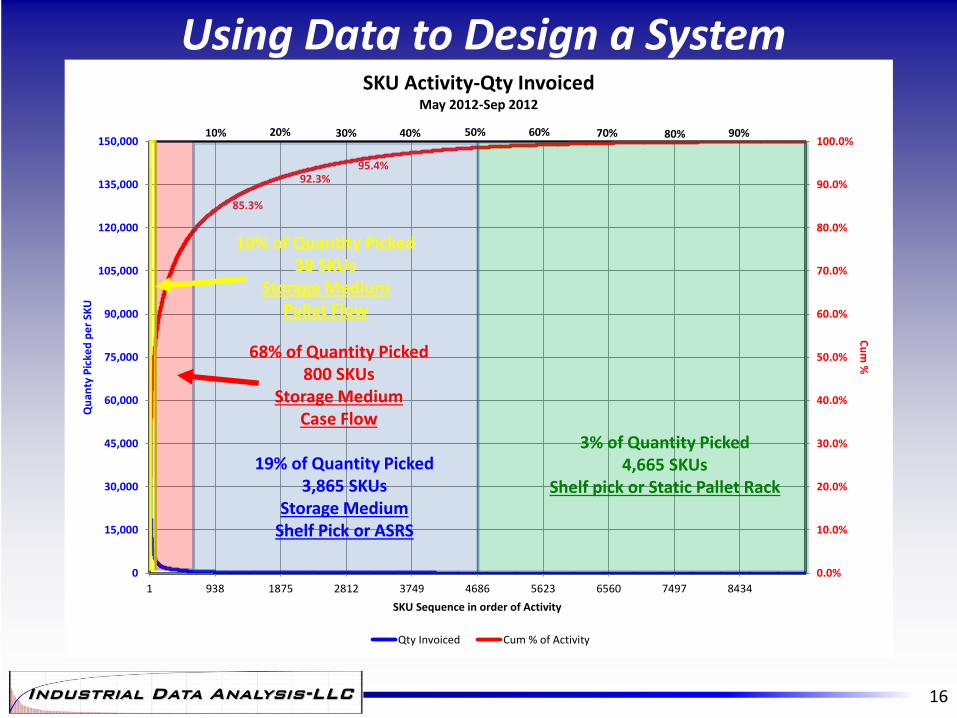
85.3%
92.3%95.4%
0.0%
10.0%
20.0%
30.0%
40.0%
50.0%
60.0%
70.0%
80.0%
90.0%
100.0%
0
15,000
30,000
45,000
60,000
75,000
90,000
105,000
120,000
135,000
150,000
1 938 1875 2812 3749 4686 5623 6560 7497 8434
Cu
m %
Qu
anty
Pic
ked
pe
r SK
U
SKU Sequence in order of Activity
SKU Activity-Qty InvoicedMay 2012-Sep 2012
Qty Invoiced Cum % of Activity
10% 20% 30% 40% 50% 60% 70% 80% 90%
19% of Quantity Picked 3,865 SKUs
Storage Medium Shelf Pick or ASRS
68% of Quantity Picked 800 SKUs
Storage Medium Case Flow
10% of Quantity Picked 38 SKUs
Storage Medium Pallet Flow
3% of Quantity Picked 4,665 SKUs
Shelf pick or Static Pallet Rack
16
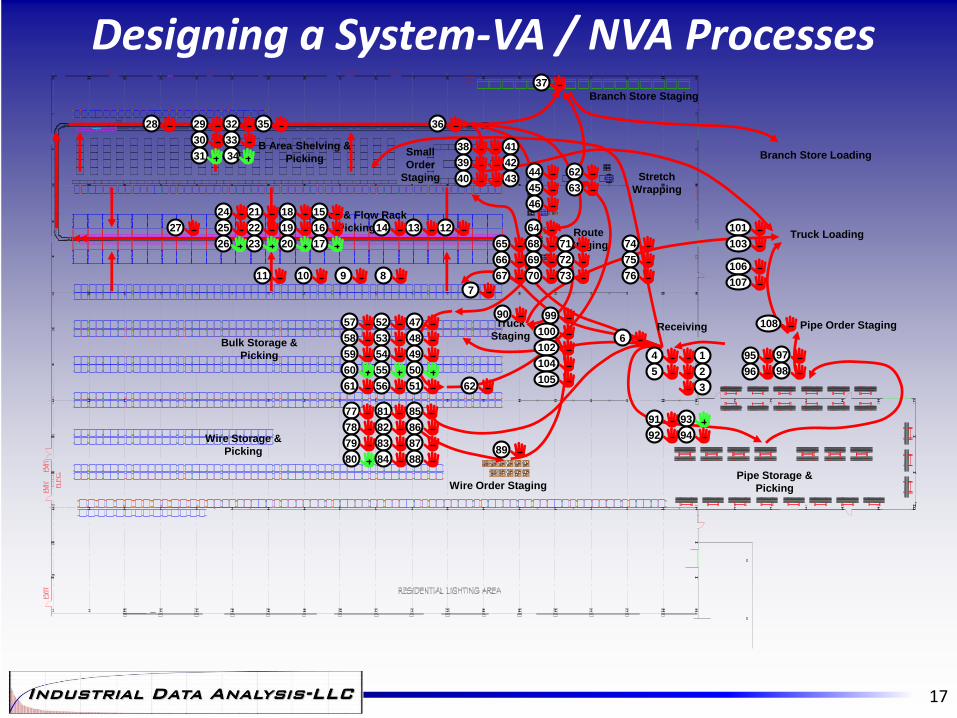
Designing a System-VA / NVA Processes
A Area & Flow Rack
Picking
Receiving
Wire Storage &
Picking
Bulk Storage &
Picking
B Area Shelving &
Picking
Branch Store Staging
Branch Store LoadingSmall
Order
Staging
Truck Loading
Pipe Order Staging
Pipe Storage &
Picking
Stretch
Wrapping
Route
Staging
Truck
Staging
Wire Order Staging
1
2
3
4
5
7
891011
121314
6
15
16
17
18
19
20
21
22
23
24
25
26
27
28 29
30
31
32
33
34
35 36
37
38
39
40
41
42
4344
45
46
47
48
49
50
51
52
53
54
55
56
57
58
59
60
61 62
62
63
64
65
66
67
68
69
70
71
72
73
74
75
76
77
78
79
80
81
82
83
84
85
86
87
8889
90
91
92
93
94
95
96
97
98
99
100
101
102
103
104
105
106
107
108
17
Designing a System-VA / NVA Processes
1. Receiving
2. Verify received material against
3. Print Labels
4. Apply labels to pallet/carton
5. Separate items between A, B, Bulk, and Wire
6. Move products to specific putaway areas
7. Putaway items into rack position
8. Walk down pick aisles to identify SKUs that
require replenishment
9. Identify replenishment SKU
10. Pull SKU from putaway position
11. Place SKU into pick position
12. Get order form
13. Go to “A” pick area
14. Get Tote
Repeat 15-17 for 4 lines per Order in Area A
15. Read order form for 1st pick
16. Go to SKU location
17. Pick & place SKU into tote/pallet
27. When order is complete in zone past to next
zone or push onto take-away conveyor
Automated: If orders are ins Area B, a pusher
pushes the tote into Area B
28. Get Tote
Repeat 29-31 for 2 lines per Order in Area B
29. Read order form for 1st pick
30. Go to SKU location
31. Pick & place SKU into tote/pallet
35. When order is complete in zone past to next
zone or push onto take-away conveyor
Automated: Order/Tote is conveyed to end of
conveyor
36. Determine if order is a
a. Branch order,
b. small order,
c. Or to be palletized and continued
into the bulk area.
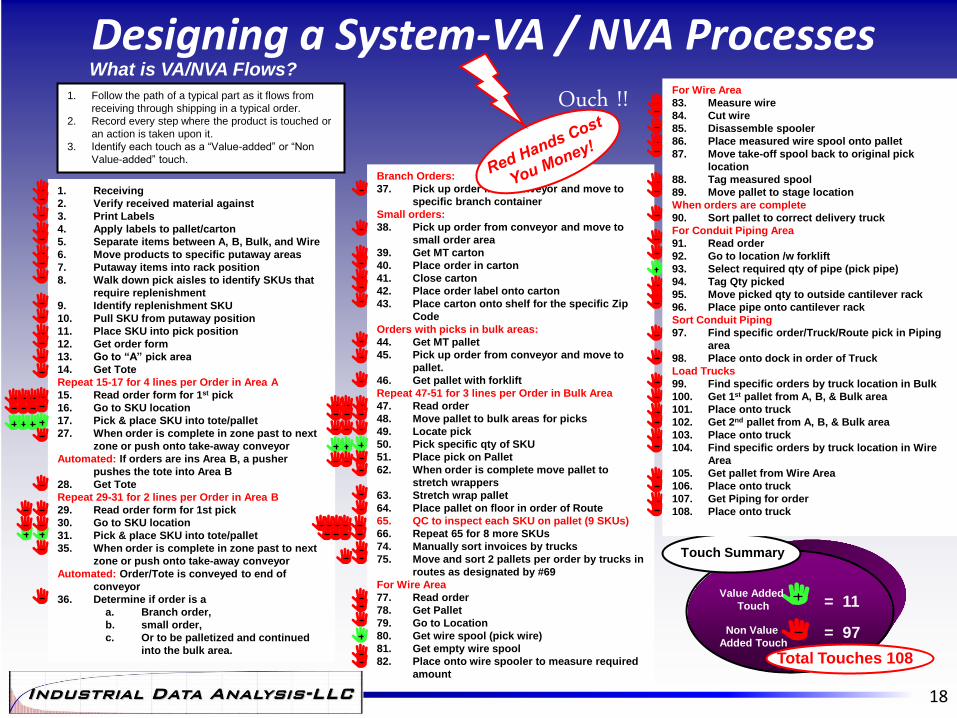
1. Follow the path of a typical part as it flows from
receiving through shipping in a typical order.
2. Record every step where the product is touched or
an action is taken upon it.
3. Identify each touch as a “Value-added” or “Non
Value-added” touch.
What is VA/NVA Flows?
Value Added
Touch
Non Value
Added Touch
= 11
= 97
Total Touches 108
Touch Summary
Branch Orders:
37. Pick up order from conveyor and move to
specific branch container
Small orders:
38. Pick up order from conveyor and move to
small order area
39. Get MT carton
40. Place order in carton
41. Close carton
42. Place order label onto carton
43. Place carton onto shelf for the specific Zip
Code
Orders with picks in bulk areas:
44. Get MT pallet
45. Pick up order from conveyor and move to
pallet.
46. Get pallet with forklift
Repeat 47-51 for 3 lines per Order in Bulk Area
47. Read order
48. Move pallet to bulk areas for picks
49. Locate pick
50. Pick specific qty of SKU
51. Place pick on Pallet
62. When order is complete move pallet to
stretch wrappers
63. Stretch wrap pallet
64. Place pallet on floor in order of Route
65. QC to inspect each SKU on pallet (9 SKUs)
66. Repeat 65 for 8 more SKUs
74. Manually sort invoices by trucks
75. Move and sort 2 pallets per order by trucks in
routes as designated by #69
For Wire Area
77. Read order
78. Get Pallet
79. Go to Location
80. Get wire spool (pick wire)
81. Get empty wire spool
82. Place onto wire spooler to measure required
amount
For Wire Area
83. Measure wire
84. Cut wire
85. Disassemble spooler
86. Place measured wire spool onto pallet
87. Move take-off spool back to original pick
location
88. Tag measured spool
89. Move pallet to stage location
When orders are complete
90. Sort pallet to correct delivery truck
For Conduit Piping Area
91. Read order
92. Go to location /w forklift
93. Select required qty of pipe (pick pipe)
94. Tag Qty picked
95. Move picked qty to outside cantilever rack
96. Place pipe onto cantilever rack
Sort Conduit Piping
97. Find specific order/Truck/Route pick in Piping
area
98. Place onto dock in order of Truck
Load Trucks
99. Find specific orders by truck location in Bulk
100. Get 1st pallet from A, B, & Bulk area
101. Place onto truck
102. Get 2nd pallet from A, B, & Bulk area
103. Place onto truck
104. Find specific orders by truck location in Wire
Area
105. Get pallet from Wire Area
106. Place onto truck
107. Get Piping for order
108. Place onto truck
18
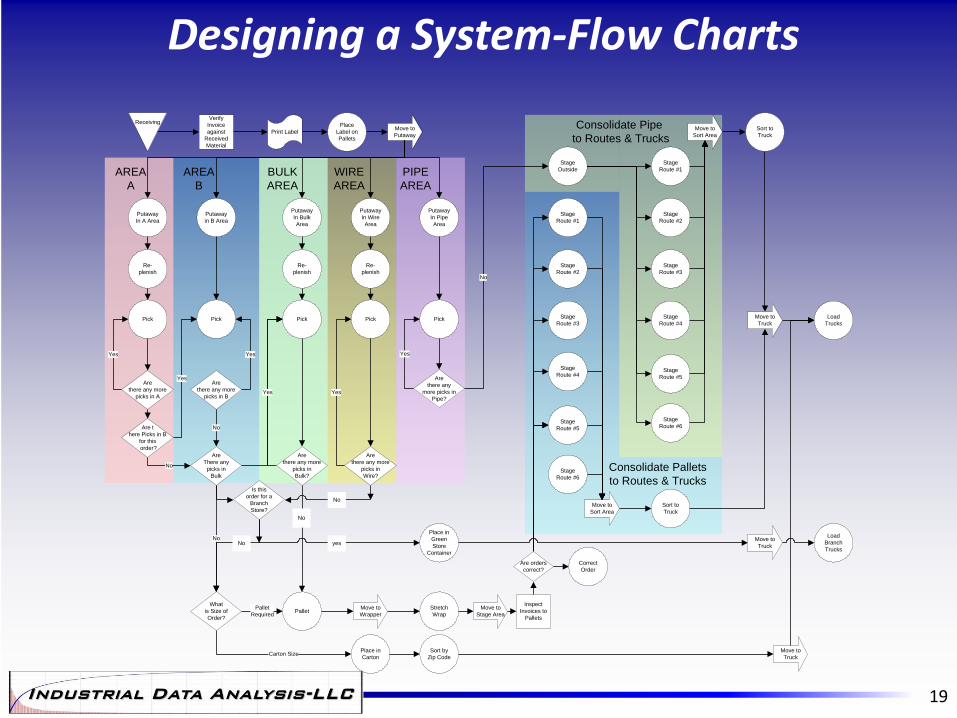
Designing a System-Flow Charts
BULK
AREA
AREA
A
ReceivingVerify
Invoice
against
Received
Material
Move to
Putaway
Putaway
In A Area
Re-
plenish
Putaway
in B Area
Putaway
In Bulk
Area
Putaway
In Wire
Area
Putaway
In Pipe
Area
Re-
plenish
Re-
plenish
Pick Pick Pick Pick Pick
Are
there any more
picks in A
Yes
Are
there any more
picks in B
Yes
No
No
Are
There any
picks in
Bulk
What
is Size of
Order?
Carton SizeSort by
Zip Code
PalletPallet
Required
Are
there any more
picks in
Bulk?
Yes
Place in
Carton
Stretch
Wrap
Are
there any more
picks in
Wire?
Yes
Are
there any
more picks in
Pipe?
Yes
Stage
Outside
Is this
order for a
Branch
Store?
NoPlace in
Green
Store
Container
Move to
Truck
Load
Branch
Trucks
Stage
Route #1
No
Stage
Route #2
Stage
Route #3
Stage
Route #4
Stage
Route #5
Stage
Route #6
Sort to
Truck
Move to
Stage Area
Move to
Sort Area
Stage
Route #1
Stage
Route #2
Stage
Route #3
Stage
Route #4
Stage
Route #5
Stage
Route #6
Sort to
Truck
Move to
Sort Area
Move to
Truck
Load
Trucks
Move to
Truck
Move to
Wrapper
Are t
here Picks in B
for this
order?
Yes
WIRE
AREA
PIPE
AREA
Print Label
Place
Label on
Pallets
AREA
B
Consolidate Pallets
to Routes & Trucks
Consolidate Pipe
to Routes & Trucks
Inspect
Invoices to
Pallets
Are orders
correct?
Correct
Order
No
yesNo
No
19
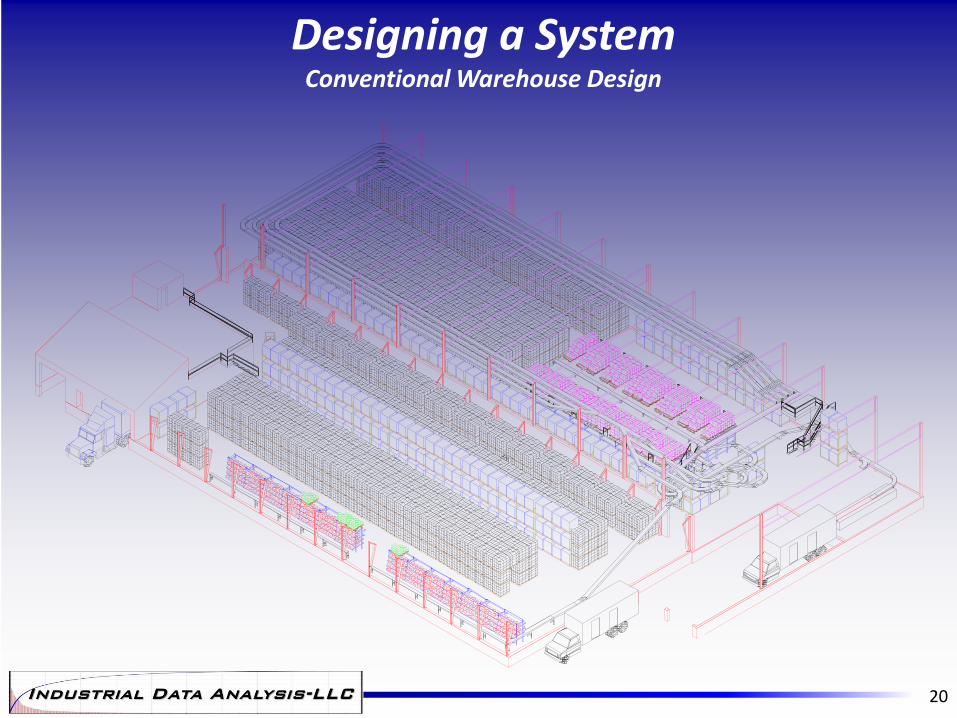
Designing a System Conventional Warehouse Design
20
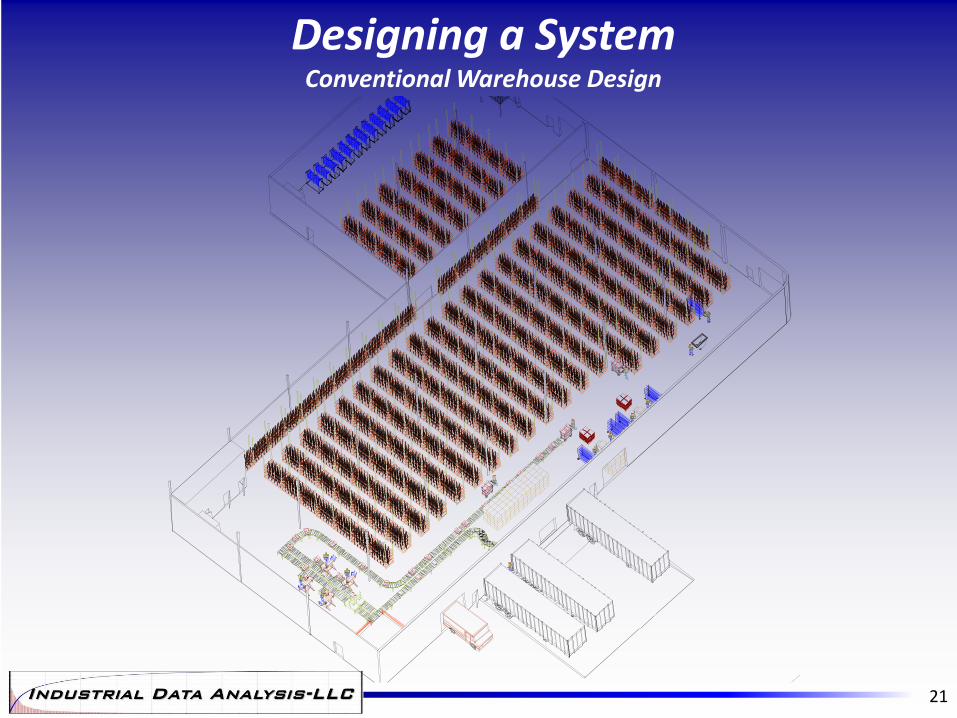
Designing a System Conventional Warehouse Design
21
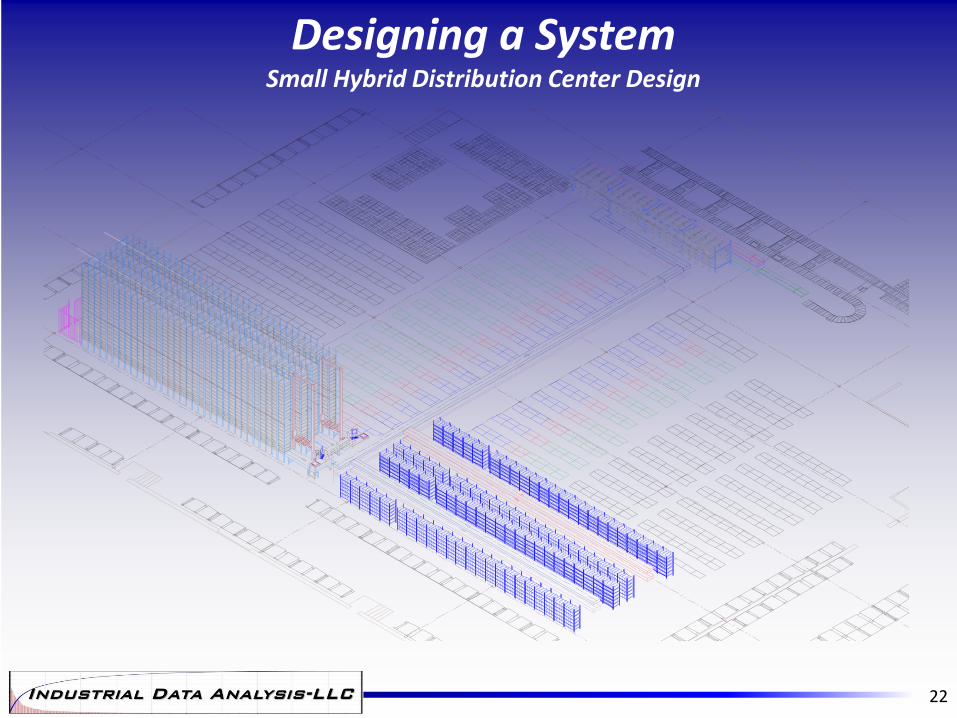
Designing a System Small Hybrid Distribution Center Design
22
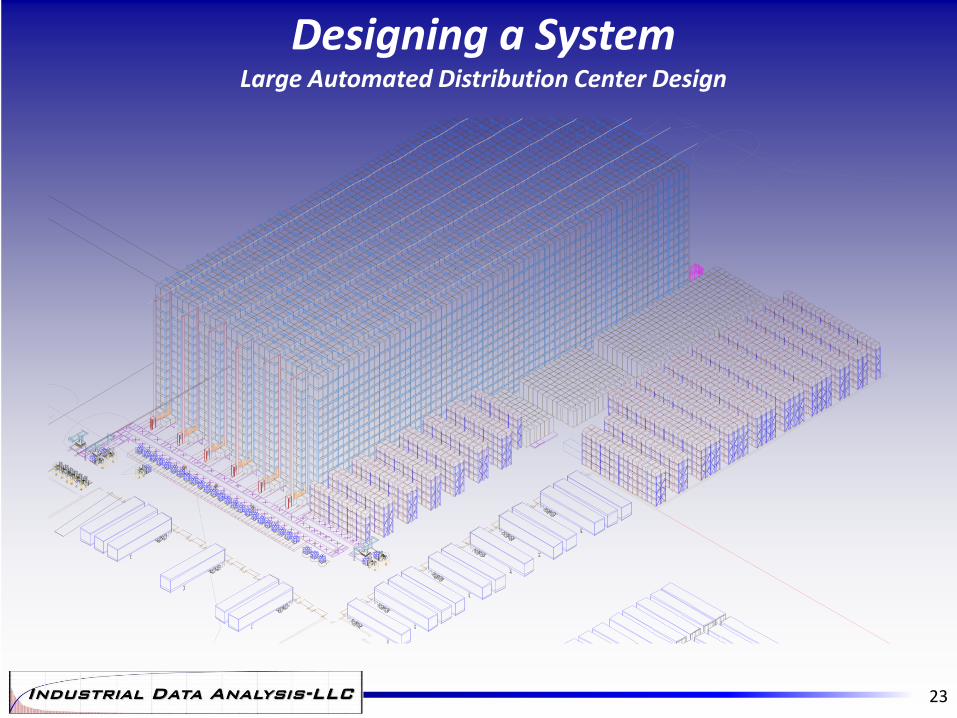
Designing a System Large Automated Distribution Center Design
23
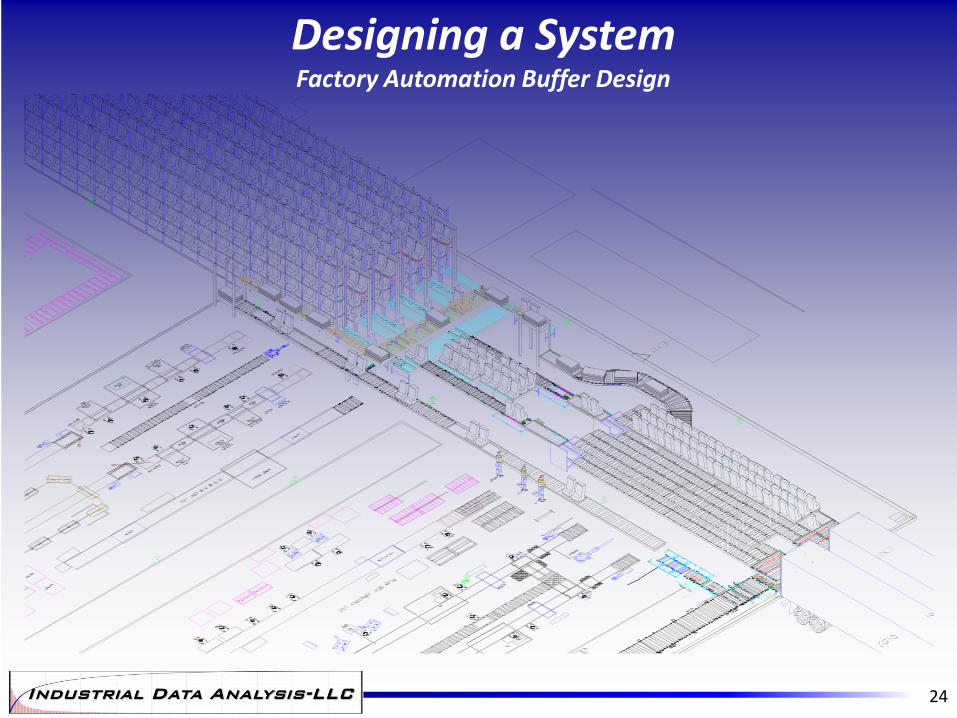
Designing a System Factory Automation Buffer Design
24
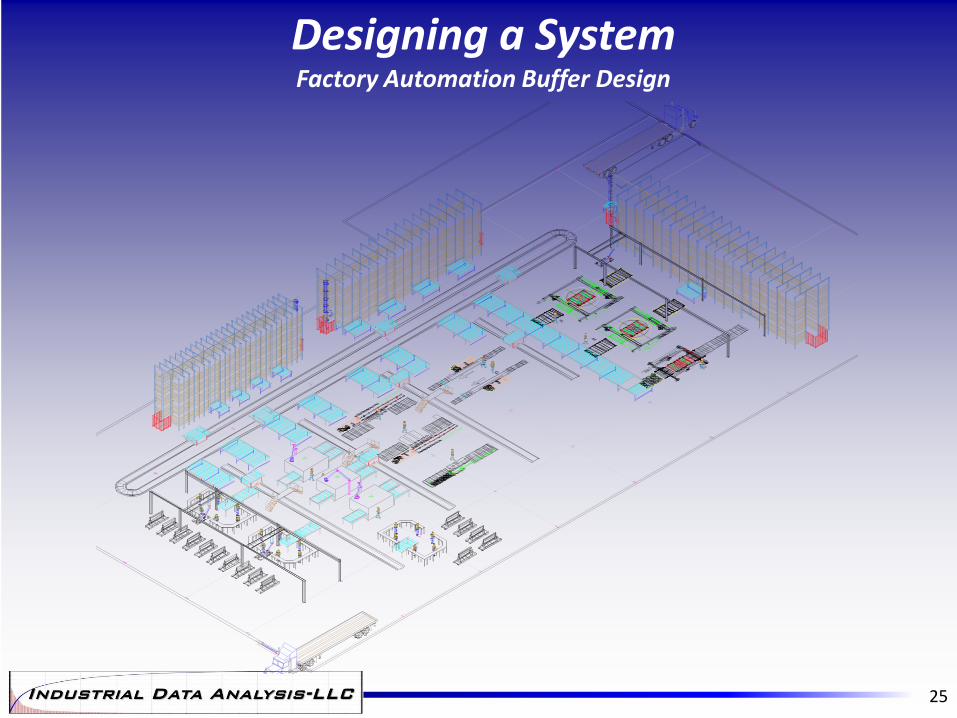
Designing a System Factory Automation Buffer Design
25
The Desired Results
• By using data analysis, all critical decisions are objective and based upon statistical data.
• A layout design that is dynamic, and can be modified as the sales and market conditions change.
• Reduction of Non-Value Added touches • Improved Cycle time from order to ship • A Customer that is satisfied and will be a
repeat Customer.
26