Embed Size (px)
Citation preview

0
Teaching Practices and Students’ Learning:
An Experiment in Chile
Marina Bassi, Costas Meghir and Ana Reynoso1
(DRAFT) January 16, 2016
Abstract2
This paper estimates de impact of a program launched in 2011 to improve learning
outcomes of the worst performing schools in Chile. Since the program started with half
of all eligible schools, a randomization was made to select participant schools in the
first year. Outcomes were measured with two main instruments: the national
standardized test in Chile (SIMCE) and CLASS, an instrument well documented in the
education literature that measures the teachers’ quality through the coding of different
aspects of teachers’ behavior following a rigorous protocol and using videotaped
classes. Results show that students’ test scores improve mildly. Improvement was only
observed in higher income students and disappears shortly. No impact can be detected
in CLASS scores for the teachers, what helps understand the weak effect on students
learning.
Keywords: education, teacher quality, experimental impact evaluation
JEL Codes: I20, I28, C01
1 Marina Bassi (Inter-American Development Bank); Costas Meghir and Ana Reynoso (Department of Economics, Yale
University). 2 The authors would like to thank Daniel Alonso for his valuable assistance in the analysis of the data. All remaining errors are our
own. The findings and conclusions expressed in this report are solely those of the authors and do not reflect the view of the IDB, its
Executive Directors, or the countries they represent.
1
I. INTRODUCTION
1.1 Teacher behavior and students performance
This paper estimates the impact of improved teaching techniques on students’ learning outcomes in low performing
schools. Recent empirical evidence has consistently showed that teachers matter: estimates of teacher value added (that
is, estimates of teachers fixed effects) are found to correlate positively and significantly with students’ test scores.
However, typical observable characteristics of teachers (such as education, tenure or experience) do not explain
variability in teacher value added. Recent studies suggest that the quality of the teacher interactions with students is
what results in differences in students’ learning. Thus, what the teacher does in the classroom and their ability to
interact positively with their student is makes a good teacher. Still, what kind of interventions could improve
teacher-student interactions remains unknown. In this paper we confirm the importance of good teacher-students
interaction for students’ learning and contribute to answering the question about effective mechanisms to improve the
quality of teaching by evaluating a program that relies on teaching material and technical assistance to teachers to
improve students’ test scores.
We profit from the experimental design of a large scale educational program in Chile. The program Plan Apoyo
Compartido (henceforth, PAC) was implemented by the Chilean Ministry of Education in 2011. The main
intervention of the program is to provide technical and pedagogical support to teachers in order to help them improve
the ways in which they teach the academic curricula and contents. Because of budgetary reasons, among schools eligible
for receiving the program only a randomly selected subset of schools was invited to participate. We, hence, benefit from
this randomization to measure the impact of the program on students’ learning outcomes. Our measure of students’
learning is their performance in the Chilean standardized Education Quality Measurement System evaluations
(henceforth SIMCE evaluations, for its name in Spanish). The SIMCE is a set of standardized tests on Math,
Language, and Science applied to elementary and high school students in the second, fourth, eighth, and tenth grades
in all schools in the country. In this paper, we focus the analysis on the universe of students who were in their fourth
grade of elementary school in years 2011 and 2012 and attended eligible schools.
Our main results suggest that only the most advantaged kids (kids from high income families) are able to appropriate
the positive effects of the program. For the 2011 cohort, high income boys attending schools participating in the
program improve SIMCE scores by almost 20% of a test score standard deviation with respect to comparable boys in
control schools. For the 2012 cohort, high income girls in treated schools improve their SIMCE scores by more than
20% of a test score standard deviation relative to girls in control schools. These results are strongly robust to
adjustments in our inference strategy to control for the bias created by data snooping when we divide the sample of
students by demographic characteristics.
To better understand these limited results, we study the effects of the program on within classroom interactions
between teachers and students and whether better interactions are associated with better learning outcomes. We source
on the Education literature and measure the quality of teacher-students interactions by one of the well-known
instruments used, namely, the CLASS (Classroom Assessment Scoring System) (Pianta et al., 2008). As part of the
experimental design for this study, a random sub sample of treatment and control schools from the PAC program
where invited to participate in the CLASS experiment. The experiment consisted on filming segments of classes and
afterwards assigning videotaped teachers with a score for their interaction with students (we provide details about the
CLASS experiment in section 5). There are several studies that link better students outcomes (both in learning and in
2
the development of socioemotional skills) with teachers scores in CLASS.1 Consistent with this literature, we first
show that CLASS scores correlate positively and significantly with students’ performance. Interestingly, we find that
the positive association between teacher-students interactions and students’ test scores is concentrated among the
disadvantaged kids for whom the PAC had no effect. Second, we show that the PAC program did not cause significant
improvements in CLASS scores. Although the effects of CLASS on students’ learning is are not causal, we believe this
analysis enlightens the understanding of the differential impact of the program according to students’ types and, in
particular, its weak impact on the performance of low income students. Indeed, the failure of the program in affecting
the scores of the most disadvantaged kids might have to do with the fact that the program did not improve the
relationship between teachers and students, a feature that seems to be of major importance in the performance of
disadvantaged kids. If, moreover, teaching techniques and students’ ability to learn are complement inputs in the
production function of knowledge, we would expect the effects of a program like the PAC to be concentrated on higher
skilled kids, exactly what we find in this paper.
1.2 Related literature
This paper is embedded in the literature on the production function of education: the relationship between school inputs
(that is, the quality and quantity of educational resources) and outputs (that is, students’ learning). In particular, our
paper contributes to the recent and growing strand that studies whether teachers matter for students outcomes and
which characteristics of teachers matter the most.
Early papers consistently found small or perverse effects of certain schools variables on learning. For example, early
empirical studies focused on the effect of class size and peer effects on students’ performance. Lazear (2001) reviews
part of the most important contributions in this area and highlights the fact that results conflict with what is a
priory expected: the literature finds either small, insignificant, or perverse (positive) effects of class size on learning.
In order to make sense of this class size puzzle, Lazear (2001) proposes a model where classroom education is a public
good with congestion, where a bad behaving students disrupts the learning of the whole class, and schools
endogenously choose class size in order to minimize disruption and maximize learning. The small or even perverse
effects of class size found in the literature is interpreted, in the light of his model, as a selection effect: schools optimal
policy is to assign bad behaving students to small classes (that have a high teacher-student ratio which allows teachers
to control disruption) while assigning well behaved students to big classes. In a cross sectional empirical analysis, then,
class size will appear to correlate positively with learning, or not correlate at all. Even in experimental studies, that
control for the endogenous class size choice, conflicting results are explained by the omission of the probability of
classroom disruption.3
As another example, a subsequent set of papers analyze the impact of school resources on students’ performance and,
similarly, show little and not conclusive effects of school resources on learning. For example, Banerjee et al. (2007)
review some of the most notable contributions that conclude that improving resources such as textbooks or flip
charts, or even increasing school attendance, have little or no impact in students’ performance. Similar to the
argument put forward by Lazear to explain the class size puzzle, Banerjee et al. (2007) offer an explanation for the
school resources puzzle based on the behavior of individuals. They argue that schools or teachers often lack the incentive
to adjust the curricula or adequacy of resources to the particular needs of students, fact that makes improved school
3 Lazear (2001) argues that the probability of disruption is observable, so that measuring this characteristic by classroom
observation or through teacher surveys, is a promising research agenda to empirically obtain class size effects of
magnitudes consistent with economic models.
3
resources unlikely to have an effect. For example, if the contents of classes are too hard for most students, or if
textbooks are written in a language that most students cannot read, going to school or receiving textbooks will not
show significant improvements in learning for the majority of disadvantaged students. In the light of this argument,
Banerjee et al. (2007) show the results of two experimental interventions concluding that offering targeted tutoring to
the bottom students and targeting the instruction level to all students according to their ability significantly improved
students’ performance.
However, targeting resources according to ability is not certain to be effective in every context. For example, in a related
contribution, Duflo et al. (2011) make the point that under positive peer effects (where students benefit from high
achieving classmates) tracking students by baseline achievement (that is, splitting classes and re-grouping students
assortatively according to their ability) can actually harm low performing students, unless teachers have the
incentives to adapt their behavior (level of instruction) according to the ability distribution of students in their
classroom. Although they do not directly observe changes in teaching behavior, they show that tracking significantly
improved performance even for low achieving students that are now prevented from interaction with high achieving
peers. This, they argue, is only consistent with a model in which teachers change their instructional level in response
to the change in the distribution of students in their classrooms. This gives rise to the question of whether teachers
matter and motivates the main focus of our paper: whether the interaction between teachers’ characteristics and
students’ ability matters and how that interaction can be effectively improved.
In effect, within the literature on the production function of education, our paper is most closely related to the
research program that studies the impact of teachers on students’ learning. Important previous related contributions
have found that, after controlling for endogenous sorting, teachers matter. For example, in two related contributions,
Rivkin et al. (2005) and Chetty et al. (2014) develop econometric techniques that control non experimentally for
families’ and schools’ strategic sorting of students into classrooms and identify the importance of teachers by
exploiting events of teacher turnover in the US. Both contributions conclude that increments in teacher quality rises
schools’ average test scores significantly.4
In this paper, we start by acknowledging the fact that teachers matter and go one step forward to explore what
explains variability in teachers’ value added. In particular, we address the question of whether improved teaching
techniques and better teacher-students interactions affect positively students’ test scores, by analyzing the impact of the
PAC intervention and of CLASS teacher scores on students’ SIMCE scores. In answering this question, we make at
least two additional contributions. First, we explicitly take into account the interaction between teaching methods
and students ability types in producing learning outcomes. We, hence, estimate the effect of the PAC program that
improves teaching techniques at the student level and identify the types of students that benefit the most from
improved teaching practices. Second, we exploit a purely experimental design that can be thought of as assigning
4 Rivkin et al. (2005) develop an econometric model for the average gain in test scores within a grade as function of student,
teacher, and school fixed effects that account for strategic behavior. Starting from this specification, the authors are able to derive
an expression for the variance of teacher quality that is identified up to a covariance parameter from teacher turnover rates across
cohorts and grades within a cohort. Using data from the universe of public schools in Texas, they estimate, then, lower bounds for
the importance of teacher quality variability in explaining gains in test scores, concluding that one standard deviation increase in
average teacher quality significantly increases average test scores in Math and Reading by at least 0.11 and 0.095 standard
deviations of test scores, respectively. Chetty et al. (2014), on the other hand, use a combination of school district administrative
data and tax records from the US to show that a teacher’s value added in a given school (that is, the predicted fixed effect of teachers
on test scores of a given classroom based on test scores residuals of that classroom in previous years) is an unbiased measure of the
impact of teachers on student performance, hence arguing that once baseline test scores are taken into account, studies that rely on
value added as measures of teachers importance are not subject to other significant sources of bias. They arrive at this conclusion by
showing the remarkably high correlation between value added estimates changes and changes in test scores in the events of teacher
turn over.

4
improved ways of teaching the academic material randomly across schools, and allows us to control for parents’ and
schools’ strategic sorting of students into classrooms. We believe our approach contributes to clarifying why
previous similar interventions showed little effects. For example, two decades before the implementation of the
PAC, the Chilean government launched the P-900 schools program that had similar characteristics as the PAC and
that showed little or insignificant effects on students’ test scores. Chay et al. (2005) evaluate Chile’s P-900 program
using a regression discontinuity design that exploits pre-program scores cutoff for eligibility and conclude that each
year of exposure to the program had an insignificant or a small positive effect on test scores. We find similar effects
on the entire pool of students, but once we take into account the relationship between teachers and students, we find
big and significant effects on the sub-population of higher-income kids. The small or insignificant effects for the pool
of students can be explained by the fact that high and low type students present conflicting effects of improved
teaching techniques: possibly because of the complementarity between teaching methods and students’ ability, while
high type students are able to appropriate the returns to the different teaching methods, low type students are not.
Complementing this explanation, we show that low income students benefit the most from improved teacher-students
interactions, a feature that the program was unable to impact.
1.3 Outline
The paper is organized as follows. The next section describes the program intervention, the experimental design, the data
used in this paper, and discusses several randomization checks exercises. In this section we show that attrition rates (that
is, the proportion of students that did not sit for the SIMCE subject tests) are balanced across treatment status and that
baseline characteristics are not significantly associated with treatment status even for the post attrition sample.
Section 3 describes the identification and inference strategies. Section 4 presents the main results of the paper: high
income boys and girls in treated schools increase their SIMCE scores by more than 20% of a standard deviation of
SIMCE scores in control schools. The effects are smaller and not significant for low income students. In order to
understand these results, section 5 studies the importance of within classroom interactions to improve performance
and the impact of PAC on these interactions. We find that low income students benefit greatly from improved
teacher-students interactions, but that the PAC did not significantly improve the quality of teacher-students
interactions. This, possibly together with the complementarity between students’ ability and teaching practices
might explain why the PAC had a positive effect on high income kids but failed to benefit disadvantaged kids. Finally,
section 6 concludes.
II. EXPERIMENTAL DESIGN, DATA, AND RANDOMIZATION CHECK
2.1 About Plan Apoyo Compartido (PAC)
Plan Apoyo Compartido (henceforth, PAC) was implemented by the Ministry of Education of Chile in 2011 as a
targeted educational policy providing technical and pedagogical support to schools historically performing below
average in the national standardized test, the SIMCE. The ultimate objective of the program was to improve learning
outcomes in Math and Language for students from pre-K to fourth grade and, additionally, in Science for students in
5
third and fourth grades by means of improving class management and pedagogical practices. To achieve this goal, the
PAC financed three types of interventions.
The first intervention consisted in the development of unified pedagogical material distributed to teachers and
designed to help schools to organize, plan, and optimize the effective implementation of the national school curriculum.
These planning tools included an annual curricular programming, a series of teaching materials designed for six-week
periods, and a set of daily planning activities to be used by teachers in the classroom.
The second intervention consisted in the development of four types of tests to monitor progress in students learning: a
diagnostic test to determine the initial level of academic skills and knowledge administered at the beginning of the
school year, intermediate and final tests to determine students’ progress, and students’ performance reports. Each of
these testing instruments was applied in different moments of the semester to help analyze students’ performance in
Math and Language (MINEDUC, 2013). It is worth noting that unlike the SIMCE tests, these instruments were not
standardized tests and could be applied voluntarily by PAC schools.
Finally, the third intervention consisted on the creation of two support teams (one internal and one external to schools)
expected to work together. The first team, the Education Leadership Team (henceforth ELE, from its name in
Spanish), was formed by at least four members: the school principal, the head of the technical and pedagogic office of
the school, and two distinguished teachers. This team helped to implement the first and second interventions of the
program in the school. The second group, the Team of Technical and Pedagogic Advisors (henceforth ATP, from its
name in Spanish), was formed by three authorities of the regional Department of Education (the DEPROV), and aimed
to provide external support to the ELE teams. Each ATP visited its assigned schools every 6 to 7 weeks to advise the
ELE on the use of the teaching material, on the development of a diagnosis of the school’s strengths and weaknesses, and
on the analysis of the students’ tests scores to study progress (MINEDUC, 2013).
The PAC targeted low performing public and subsidized private schools nationwide.5 We describe the eligibility
criteria and the random assignment of the program below.
2.2 Eligibility and Randomization
Among public and subsidized private school in Chile, the Ministry applied two main eligibility criteria to define the
target group of schools: first, the school’s baseline average SIMCE score for the years between 2005 and 2009 in Math and
Language should be below the national average; and second, there should be at least 20 students per level on average
from pre-K to fourth grade.6 The 2,286 schools that met these criteria were ranked by their 2005-2009 average SIMCE
scores in Language and Math and the bottom 1,000 schools were automatically considered eligible. Since participation in
the program was voluntary, refusal to participate was expected, so in order to reach a target of around 1,000 eligible
schools in the first year of the program, the Ministry increased the sample within each DEPROV by 50%, going up in
5 The Chilean system of education includes three types of schools: public schools, subsidized private schools, and private
schools. Public schools are both financed and administered by the public sector; subsidized private schools are administered
by private agencies but receive funding from the State in the form of vouchers per attending student; finally, the third group
includes schools that are administered privately and tuition is paid by the students’ families. 6 The Ministry of Education also required that the schools administrators should have no sanctions related to the voucher
subsidies system in the previous three years.

6
the the SIMCE ranking.7 The final sample of eligible schools (1480 schools) were offered participation in the
program according to two methodologies. First, a non experimental method was applied to 632 schools located in
“small” DEPROVs (DEPROVs with 40 schools or less). These schools were automatically invited to participate in
the program and we exclude them from our analysis. Second, an experimental method was applied to the other 848
schools located in “large” DEPROVs. These schools were randomly assigned to being offered participation or not. All
in all, the experimental sample that we consider in this paper includes 651 schools that were invited to participate
(treatment schools) and 197 schools that were not (control schools).
2.3 Data
This paper counts on administrative data provided by the Ministry of Education. This data set contains student
level information on treatment status, test scores, and baseline demographic characteristics. Table 6 in appendix A
shows summary statistics of all the variables used in this paper, namely, test scores and baseline characteristics, for the
group of students that took each of the subject tests (post attrition samples). We describe the variables included in the
table next.
The names of columns indicate the set of students over which summary statistics are calculated.
Columns labeled Reading, Math, and Science test takers indicate the pool of students that took each of the
corresponding subject tests. This corresponds to the post attrition sample, since for each test, there is a small set of
students that did not take the test (we discuss the issue of attrition in the next subsection).
Sub-columns labeled PAC=0 and PAC=1 refer to treatment status. PAC is a dummy variable that takes value one if
the student goes to a school that was invited to participate in the program through the randomization, and zero
otherwise. In what follows, we refer to the set of students such that PAC=0 as the control group and to the set of
students such that PAC=1 as the treatment group.
In turn, the table is divided in two panels, 2011 and 2012, indicating the fourth grade cohorts considered in this paper.
The names of rows indicate the variable for which we show summary statistics.
SIMCE scores (Reading, Math, and Science) refer to the grade obtained by students in the SIMCE subject tests.
Baseline characteristics indicate characteristics of the students that do not change because of treatment. They include
student demographic characteristics and education of parents. Student demographics are Female (a dummy variable that
takes value one if the student is a female and zero otherwise), Low income (a dummy variable that takes value one if
the student’s family monthly income is less than 300,000 Chilean pesos, the minimum wage in such country),
Nuclear, Extended, and Other family (three dummies that indicate the family structure of the student), and Nbr years
failed (a count variable that captures the number of primary school years the student had to retake previous to the
fourth grade). Mother’s and father’s education refer to the highest education level reached by the student’s mother and
father. These include No education, Incomplete primary, Primary, Incomplete high school, High school, Incomplete
college, and college.
7 At this point some schools were excluded after consultation with DEPROV authorities either because of bad management or
because they were already receiving technical and pedagogical assistance from well-known agencies of pedagogical support in
Chile.

7
2.4 Treatment- control balance and attrition
Table 1 shows the success of the randomization in producing balanced baseline characteristics, even after
accounting for attrition. The table displays a set of randomization checks for the entire population of fourth grade
students (the pre attrition sample) and for the three post attrition samples (Reading, Math, and Science test takers). The
table is divided in two panels, corresponding to the 2011 and 2012 cohorts. Each panel displays the results of a test of
differences in means of attrition rates and baseline characteristics across treatment status, and a test of joint significance of
baseline characteristics to explain treatment status.
In general, attrition rates in our sample are very low and baseline characteristics are balanced in both, the pre attrition
and the post attrition samples.
In 2011 there is no student that missed the three subject tests in the sample. When analyzing attrition rates by subject for
this cohort (not reported in the table), only 2.06% of students missed the Reading test, 2.08% missed the Math test,
and 1.97% missed the Science test. Moreover, attrition rates are balanced between the treatment and control groups, as
shown in the first three rows of the 2011 panel of table 1. There, the statistic reported is the difference in attrition rates
between the treatment and control groups. These differences are very small: relative to the control group, there is
0.7% less students missing the Reading test and 0.1% more students missing the Math and Science tests in the
treatment group. However, all p-values indicate that these differences are not significant.
The next set of rows show the results of a test of differences in means of baseline characteristics. Interestingly, most
baseline characteristics are balanced even among the students that did not attrit from the analysis. The exceptions are
low income and mother and father incomplete high school: test takers in the treatment group are less likely to be from
a low income family and less likely to have a parent with incomplete high school. Even when the p-value indicate
that these differences are significant, the magnitude of the economic effect is extremely small, of around 2%.
Moreover, the last row of the 2011 panel shows that taken together, baseline characteristics do not significantly
predict whether a student is in the treatment or the control group, even in the post attrition samples. The statistic
reported is the F-statistic of the joint test, and p-values indicate that we cannot reject the null hypothesis that baseline
characteristics do not jointly determine the random allocation to the program.
The 2012 cohort panel shows a similar analysis. Firstly, attrition rates are higher than in the 2011 cohort, but still low.
In this cohort 15% of students missed the Reading test, 15.26% missed the Math test, and 15.36% missed the Science
test (statistics not reported in the table). However, differences in attrition rates between treatment and control groups
for 2012 are small and insignificant. Being in the treatment group is associated with about 1% lower probability of
sitting for the Reading, Math, and Science tests relative to the control group, but these differences are not
statistically different from zero.
Furthermore, with the exception of father’s incomplete primary, all baseline characteristics are balanced between
treatment and control groups, and they are jointly not significant to explain treatment status, as evidenced by the
F-test.
All in all, we find the evidence sufficient to be convinced that attrition is not likely to generate bias in the main
results of this paper. In both cohorts the difference in the proportion of attritors is negligible in magnitude and not
significant and the randomization was successful in balancing baseline characteristics, even for the post attrition samples.

8
III. ESTIMATION AND INFERENCE
Our main results explore heterogeneous treatment effects by demographic characteristics. We define four demo-graphic
groups based on the interaction between the gender of the student and her household income (Female-Low income,
Female- Medium-High income, Male- Low income, and Male- Medium-High income).
The main objective of this paper is, therefore, to quantify the causal effect of the education program Plan Apoyo
Compartido on students’ performance in standardized tests, conditional on gender and family income. Formally, we
aim at estimating the following econometric models for each demographic group g:
SIMCEkigj = β + γPACj + Xigjδ + ϵigj (1)
where SIMCEkigj is the SIMCE score in subject k = {Math, Language, Science}, of student i, in demographic
group g, in school j; PACj is an indicator variable for participation of school j in the program; Xigj is a vector of
student-school characteristics that includes baseline characteristics; and ϵigj is a vector of unobservable student-school
characteristics assumed to be uncorrelated with variable PAC.
Our main estimation strategy aims at identifying γ in equation (2), that is, the effect of PAC on SIMCE scores. When
PAC is specified as the random assignment to the program, the Ordinary Least Squares estimator of γ in equation (2)
consistently estimates the Intention to Treat (ITT) parameter that captures the effect of being randomized into PAC
on SIMCE scores.
In both, cohorts 2011 and 2012, there are some non compliant schools which participation into the program contradicts
the random assignment. Given the experimental design, we are also able to identify the Local Average Treatment
Effect (LATE) parameter, that is, the effect of actually participating in the PAC on SIMCE scores for the sub-sample
of students that attend schools that comply with the random assignment. When PAC in equation (2) is specified as an
indicator for actual participation in the program, the Instrumental Variables estimate of γ consistently estimates the
LATE parameter by instrumenting treatment actually received with treatment randomly assigned.
In sum, we will estimate the ITT and LATE parameters in model (2) for the three subject tests and the four
demographic groups separately. This means that, for each cohort, we will be testing 12 hypotheses of the effect of PAC
on test scores. To perform inference, hence, we take into account the fact that we are testing multiple related
hypothesishypotheses.
Our inference strategy is twofold. Firstly, we construct 95% bootstrapped confidence intervals for the reported
estimated coefficients. Secondly, we construct adjusted p-values to minimize the error of over rejecting a true hypothesis
due to testing multiple hypotheses simultaneously following the Romano & Wolf (2005) step-down procedure. Our
objective is to minimize the familywise error rate (FWE) (Romano & Wolf, 2005), that is, the probability of
incorrectly rejecting at least one hypothesis when testing n hypotheses at level α.8 With this inference method, we are
able to report p-values for the tests of the joint hypothesis that control for the FWE. These two inference exercises are
based on robust standard errors clustered at the school level (the level at which the random assignment was done).
8 When testing n hypotheses at level α, mere chance will result in the false rejection of at least one of the multiple hypotheses
with probability α.

9
IV. MAIN RESULTS
Tables 2 and 3 show the main results of this paper: the estimation of equation 2 for every demographic group and
SIMCE subject tests, for the model without covariates. Tables 7 to 8 in appendix B show the corresponding estimation
exercises but for the model with covariates. In all exercises we assign equal weights to all students regardless of the
size of the school they attend.
All tables have the same structure. The top panel shows results for females and the bottom panel for males. Within each
panel, we present two sets of regression results.
The first set is the analysis of the effect of PAC on test scores, and we display six sets of statistics for this analysis. The
first line shows the magnitude of the ITT effect in percent of units of the control group standard deviations. The next
line displays 95% bootstrapped confidence intervals in square brackets. The following line shows, in parenthesis, the
Romano-Wolf step down p-values from the two sided tests. The last three lines show the control group mean and
standard deviations of SIMCE scores in the corresponding demographic group and the total amount of observations in
such demographic group. Columns (1) to (3) display the aforementioned statistics for the different SIMCE scores for
low income females. Columns (4) to (6) display these results for medium-high income females. Columns (9) to (11)
are concerned with low income males. Finally, columns (12) to (14) show the corresponding results for the sub-sample
of medium-high income males.
The second set of regressions consists of the effect of being randomized into the program on actually participating in the
program. This would be the first stage of the Instrumental Variables strategy that allows us to recover the LATE
parameter. This effect is interpreted as the difference in compliance rates between treatment and control groups.
Column (7) shows differences in compliance rates for low income females, column (8) for medium-high income
females, column (16) for low income males, and column (17) for medium-high income males.
Based on a χ2 test for the joint significance of all the effects reported, the program has an overall significant effect (both,
when measured by the ITT and the LATE parameters, and for the specifications with and without covariates) with
p-values of zero in all joint tests.9 This suggests that the program did have an effect on SIMCE scores. We next explore
the magnitudes of these effects for different cohorts and demographic groups.
4.1 The 2011 cohort
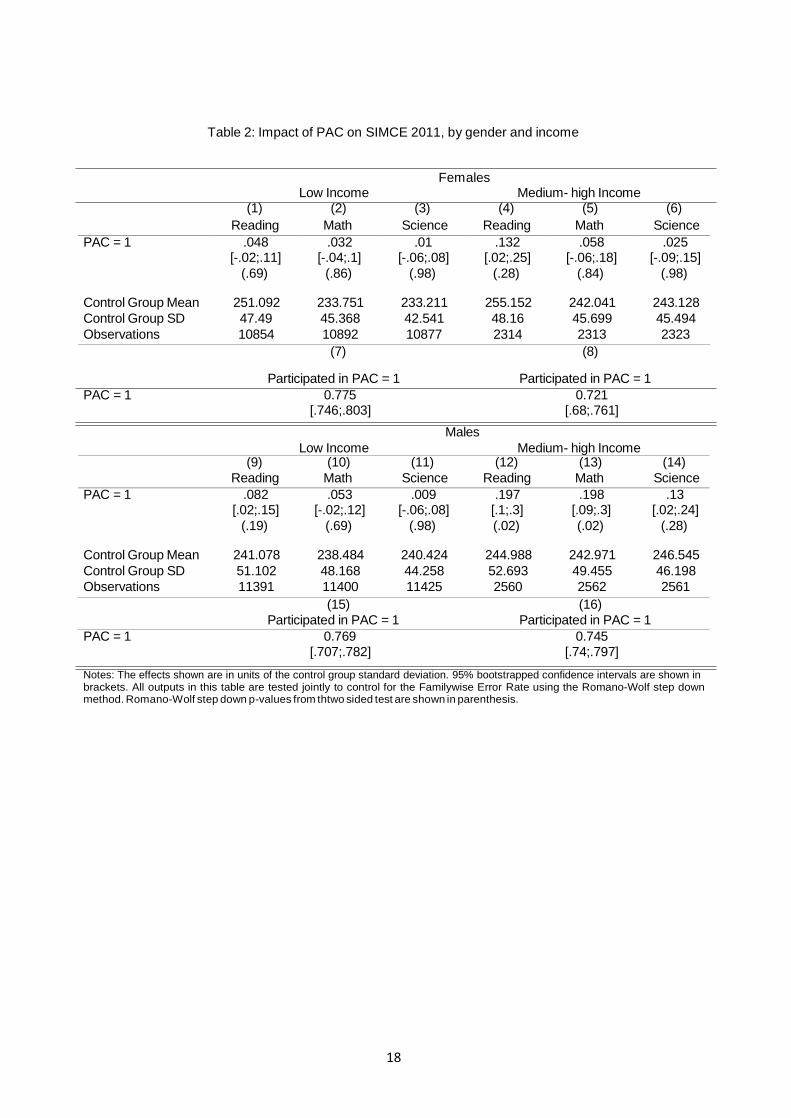
Table 2 shows the estimation of the effect of PAC on SIMCE scores for the 2011 cohort. The main conclusion from this
table is that the program benefited greatly medium-high income boys, especially in Reading and Math. For this
demographic group, the program effect is high: being randomized into the program increases the Reading and Math test
scores of high income boys in about 20% of the control group standard deviation. Moreover, the Romano-Wolf joint
test of the 12 hypothesis (1) to (6) and (9) to (14), indicate that after controlling for data snooping the effects remain
highly significant with p-values of 0.02. Weaker effects are detected for medium-high income girls, but the statistical
significance of this effect vanishes once we control for the FWE. We can analyze the LATE effect by dividing the ITT
effect for each test score in each demographic group by the first stage effect displayed for each demographic group in
9 We perform the joint test separately for the effects without and with covariates and separately for the type of parameter being
estimated, but jointly for the 2011 and 2012 cohorts. That is, we perform four joint tests of 24 hypothesishypotheses each.
P-values are zero in all cases.
10
columns (7), (8), (15), and (16). The effect of participating on the program for compliers is also highly significant for
high income boys in Reading and Math, and the magnitudes are bigger than the ITT effect: participating in the
program causes an increase in Reading and Math tests scores of more than 26% of the control group standard
deviation for students that attend schools that comply with the random assignment. Finally, results from the
estimation of the model with covariates are shown in table 7 in the appendix and are very similar, although the effects
are about three percent points smaller.
4.2 The 2012 cohort
For the 2012 cohort we are only able to find a significant effect for medium-high income girls in Reading scores, while
the effects for high income boys disappear. Table 3 shows the results. Being randomized into the program causes an
increase in the Reading scores of high income girls of about 21% of the control group standard deviation. The effect is
significant at a one percent level even after controlling for the FWE. The estimation of the LATE parameter suggests
that the program effect on Reading scores of high income girls in compliant schools is bigger, 34% of the control
group standard deviations with a p-value of less than two percent. When estimating the program effect in the
specification that includes covariates (shown in table 8 in the appendix), the treatment effects remain significant at the
5% level when testing all hypothesis independently, but are not longer significant after controlling for the FWE.
All in all, the main results of this paper suggest that the PAC had a big and significant effect on the performance
of four grader high income boys and girls, although the effects weaken during the second year of the program. In the
next section we explore a possible mechanism to explain the pattern of effects found.
V. THE CLASS EXPERIMENT AND STUDENTS’ LEARNING
In this section we propose an explanation for why the PAC program shows no impact on the performance of low
income students. The small and growing literature that studies what characteristics of teachers matter the most for
students’ learning has recently started to focus on the quality of within classroom teacher-students interactions. The
aim of this section is, therefore, to study how important are within classroom interactions for improving students’
learning in our context, and whether the PAC had any positive impact on the quality of teacher-students interactions.
As a preview of our results, we find that higher quality of teacher-students interactions significantly improves the
test scores of low income students but have no or little effects on the test scores of high income students. Moreover,
we find that the PAC was not successful in improving teacher-students interactions. We believe that these two findings
combined provide a plausible explanation for why the PAC did not significantly improve the test scores of
disadvantaged kids. If low skill kids benefit relatively more from personalized teaching methods, while high skill kids
benefit more from standardized teaching practices, it is expected that the PAC, that focused on improving the
standardized part of teaching practices, had its greatest impact on high skilled kids.
11
5.1 Background
The main instrument used in this paper to measure teacher-students interactions is the Classroom Assessment Scoring
System (henceforth, CLASS) in its Upper Elementary version (fourth to sixth grade) (Pianta et al., 2008). The
CLASS is one of the well-known instruments used in the Education literature to measure the quality of within
classroom interactions. To produce the CLASS measures, trained coders watch and analyze videotaped classes and
assign a score for teacher-students interactions in 11 dimensions. These dimensions are part of three main domains:
Emotional Support, Classroom Organization, and Instructional Support.10
Coders look for specific teachers’
behaviors in each dimension, which are well described in the CLASS protocol that guides coders for their scoring.
There are several studies that link better students outcomes (both in learning and in the development of
socioemotional skills) with teachers scores in CLASS. Araujo et al. (2014) present a brief review of this literature for the
US and perform a study for Kindergarten children in Ecuador. However, to the best of our knowledge, no study in the
literature evaluates the effectiveness of a program to improve teaching quality using CLASS.
We next describe how the experimental design for this paper allows us to assess the relationship between CLASS and
students’ test scores, and the relationship between PAC and teachers’ CLASS scores.
5.2 The CLASS experiment
In 2012, among the entire PAC experimental sample, a subsample of 210 schools (105 from the PAC treatment group
and 105 from the PAC control group) was randomly selected to also participate in the CLASS experiment. Selected
schools were asked if they would agree to have some classroom lectures videotaped and analyzed afterwards. The
CLASS experiment had some non compliance: in the end, 137 invited schools agreed to participate in the filming
sessions.11
For this evaluation, all teachers in the fourth grades of the schools that agreed to participate in the CLASS
experiment was videotaped for four full lectures (mostly Language classes). A total of 185 classes (or teachers) were
filmed strictly following the CLASS protocol.12
The coding was done by 10 coders and a supervisor carefully trained
and selected.13
Each of the four hours filmed per teacher was divided into 15-minute segments and one segment per hour
was coded (for a total of 760 segments) in each of the CLASS dimensions. Following the CLASS protocol, the score on
each dimension was based on a 1 to 7 scale (“low” for scores 1-2, “medium” for scores 3-5, and “high” for scores 6-7).
10 Emotional support includes the dimensions of Positive Climate, Negative Climate, Regard for Student Perspectives, and
Teacher Sensitivity; Classroom Organization includes the dimensions of Effective Behavior Management, Instructional
Learning Formats, and Productivity; and Instructional Climate includes the dimensions of Language Modelling, Concept
Development, Analysis and Inquiry, and Quality of Feedback. 11 Among these 137 schools, 70 were control PAC schools and 67 were treatment PAC schools. Among the 67 PAC schools, in
turn, 58 schools were participating in the PAC, while 9 schools were invited to participate in PAC but did not accept. 12 The fieldwork and coding according to CLASS was coordinated and implemented by a team of the Centro de Politicas
Comparadas de Educacion from the Universidad Diego Portales, which had already applied CLASS for the evaluation of
another program in Chile, Un buen Comienzo (Yoshikawa, et al. 2013). 13 The coders had to take a two-day training course provided by a Teachstone certified trainer, who also had the experience of
applying CLASS to the Chilean context. After the course, coders took a four-hour online test (developed by Teachstone), that
asks the candidate to watch and code five segments of model videos. The candidate is approved when achieving a reliability
rate of at least 80% in all videos and at least in two of the videos the same reliability in all CLASS dimensions. Only the
candidates that passed the test were certified to be CLASS coders in this evaluation. In addition, before starting the coding of
the videos for the PAC evaluation, coders participated in another training course to adapt their knowledge of CLASS to the
Chilean context. The training included watching and coding videos of Chilean teachers, which were previously coded by
experienced CLASS coders.
12
The final CLASS scores for each domain consisted on the average across dimensions within the corresponding domain.
For the coding, videos were randomly assigned to the 10 certified coders. The coding process lasted for five weeks.
During the first week of coding, 100% of the videos were double coded. The double-coding was expected to be
gradually reduced in the following weeks if reliability rates remained above 80%.14
Overall, 52% of the videos were
double coded, with an average reliability rate of 84.2%.15
This inter-coder reliability is comparable to that found in
other studies. For example, as cited in Araujo et al. (2014), Brown et al. (2010) report an inter-coder reliability rate
of 83% for the 12% of the classroom observations which were double-coded. Araujo et al. (2014) get a higher
inter-coder reliability rate (93%) double-coding 100% of the videos.
5.3 Teachers’ CLASS scores and 2012 SIMCE scores
In accordance to the empirical literature analyzing the association between CLASS scores and students’ test scores, in
this subsection we report the correlation between CLASS and SIMCE scores for the 2012 cohort, at the student level.
Formally, we aim at estimating γ in the following equation:
SIMCEkigcj = β + γCLASSpccj + Xigjδ + ϵigj (2)
where SIMCEkigcj is the SIMCE score in subject k = {Math, Language, Science}, of student i, in demographic
group g, in classroom c, at school j; CLASSpccj is the first principal component of the scores in the 11 CLASS
dimensions for the teacher in classroom c; Xigj is a vector of student-school characteristics that includes baseline
characteristics; and ϵigcj is a vector of unobservable student-classroom characteristics assumed to be uncorrelated with
variable CLASSpc. Since in this design teachers have not been randomly assigned to students, γ cannot be interpreted
as the causal effect of within classroom interactions on tests scores, but only as a correlation.
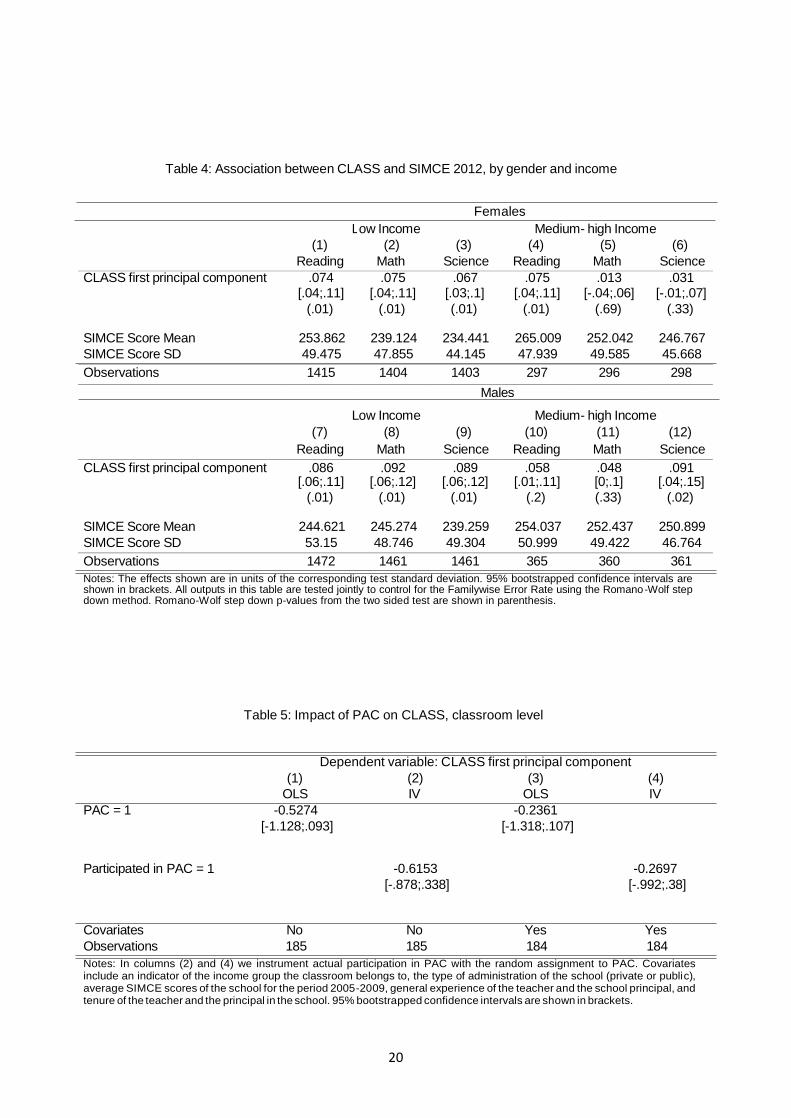
Table 4 shows the result of the estimation of γ by OLS. The table has the same structure as tables presented in section 4
(except that we do not have compliance regressions to show for this exercise). The most striking result from the table is
that low income students, who did not benefit from the PAC program, benefit a great deal from better teacher-students
interactions. In effect, one additional principal component score unit in CLASS scores increases test scores for low
income students in between 7% and 9% SIMCE scores standard deviations. These results are robust to adjustments in
p-values to control for the FWE rate. For high income students, effects are smaller and in most subjects insignificant.
Given the importance of teachers’ CLASS scores in the performance of disadvantaged kids, we next explore whether the
program was successful in improving teachers’ performance in CLASS.
5.4 The impact of PAC on CLASS
We analyze whether participating in the program increases the performance of within classroom interactions.
Since the outcome variable in this exercise (the CLASS score) was measured for 185 classrooms, the analysis in this
subsection is at the classroom level. Formally, we aim at estimating the following model:
14 Coding is considered reliable if the difference between the two coders’ score is less than 2 points for each CLASS dimension. 15 When a coding was not considered not reliable, a supervisor did a third coding, which was the final score attributed to
that teacher.

13
CLASSpccj = β + γP ACj + Xcj δ + ϵcj (3)
where CLASSpccj is the CLASS dimensions principal component for classroom c in school j; PACj is the treatment
indicator variable that takes value one if school j was randomized into PAC and zero otherwise; Xcj is a vector of
teacher-classroom characteristics that includes an indicator of the income group the classroom belongs to, the type of
administration of the school, average SIMCE scores of the school for the period 2005-2009, general experience of the
teacher and the school principal, and tenure of the teacher and the principal in the school; and ϵcj is a vector of
unobservable teacher-classroom characteristics assumed to be uncorrelated with PAC.
Table 5 shows the result of the estimation. Columns (1) and (3) report the ITT parameter obtained by estimating
γ by OLS in equation 3, while columns (2) and (4) report the LATE parameter obtained by instrumenting actual
participation with the random assignment to estimate γ in equation 3.
The results consistently suggest that the program has a negative effect on teacher-classroom interactions in 2012 but that
these effects cannot be distinguished from zero at the standard significance levels. The lack of effect of the program
on classroom performance might be the reason behind the lack of effects on SIMCE scores at the student level, for
disadvantaged students.
VI. CONCLUSIONS
This paper estimates de impact of Plan Apoyo Compartido (PAC), a program launched in 2011 to improve learning
outcomes of students in the poorest performing schools in Chile, according to the national standardized test
(SIMCE). Through standardized teaching and class preparation material, and through the support of internal and
external pedagogic teams, the program aimed at reducing the gap in terms of SIMCE between the poorest population
and the national average. The evaluation profited from the randomized selection implemented by the program
coordinators in the first year. Since the program could cover only half of the eligible schools when it was launched, a
random selection was held to invite schools to participate.
Results show a mild impact in the SIMCE in the end of the 2011 school year (a few months after PAC was launched)
and concentrated only in higher income boys. In 2012, these effects disappear and only a small impact on higher
income girls is detected. In 2013 (not showed in the paper), all effects disappear.
In order to understand what lies behind these disappointing results, we analyze if the program changed teachers’
practices and teacher-students interactions. For that purpose we use CLASS, a well-documented instrument in the
education literature that scores, through a rigorous protocol, different dimensions of teacher-students interaction.
CLASS scores are correlated with SIMCE results, although we cannot identify causality in this relationship with this
data. However, we find no impact of PAC in teachers’ CLASS scores, what is consistent with the mild and short-term
results of the program on students learning.
These findings have relevant policy implications for PAC and for similar programs. To achieve long lasting
significant impact on students learning, affecting teachers’ practices and improving their interactions with students is
key.
14
References
Araujo, Maria Caridad, Carneiro, Pedro, Cruz-Aguayo, Yyannu, & Schady, Norbert. 2014. A helping hand?
Teacher quality and learning outcomes in kindergarten, Unpublished manuscript.
Banerjee, Abhijit V., Cole, Shawn, Duflo, Esther, & Linden, Leigh. 2007. Remedying Education: Evidence from Two
Randomized Experiments in India. The Quarterly Journal of Economics, 122(3), 1235-1264.
Brown, Joshua L, Jones, Stephanie M, LaRusso, Maria D, & Aber, J Lawrence. 2010. Improving classroom quality:
Teacher influences and experimental impacts of the 4rs program. Journal of Educational Psychology, 102(1), 153.
Chay, Kenneth Y., McEwan, Patrick J., & Urquiola, Miguel. 2005. The Central Role of Noise in Evaluating
Interventions That Use Test Scores to Rank Schools. American Economic Review, 95(4), 1237-1258.
Chetty, Raj, Friedman, John N., & Rockoff, Jonah E. 2014. Measuring the Impacts of Teachers I: Evaluating Bias in
Teacher Value-Added Estimates. American Economic Review, 104(9), 2593-2632.
Duflo, Esther, Dupas, Pascaline, & Kremer, Michael. 2011. Peer Effects, Teacher Incentives, and the Impact of
Tracking: Evidence from a Randomized Evaluation in Kenya. American Economic Review, 101(5), 1739-74.
Lazear, Edward P. 2001. Educational Production. The Quarterly Journal of Economics, 116(3), 777-803.
Pianta, Robert C., Mashburn, Andrew J., Downer, Jason T., Hamre, Bridget K., & Justice, Laura. 2008. Effects of
web mediated professional development resources on teacher child interactions in pre kindergarten classrooms. Early
Childhood Research Quarterly, 23(4), 431-451.
Rivkin, Steven G., Hanushek, Eric A., & Kain, John F. 2005. Teachers, Schools, and Academic Achievement.
Econometrica, 73(2), 417-458.
Romano, Joseph P., & Wolf, Michael. 2005. Stepwise Multiple Testing as Formalized Data Snooping. Econometrica,
73(4), 1237-1282.

15
Reading -.007 .258 n.a. n.a. n.a. n.a. n.a. n.a. Math .001 .67 n.a. n.a. n.a. n.a. n.a. n.a. Science
Baseline characteristics:
Students demographics
.001 .784 n.a. n.a. n.a. n.a. n.a. n.a.
Female .003 .758 .003 .758 .003 .758 .003 .758 Low income -.02 .048 -.02 .048 -.02 .048 -.02 .048 Nuclear family .012 .324 .012 .324 .012 .324 .012 .324 Extended family -.009 .284 -.009 .284 -.009 .284 -.009 .284 Other family -.003 .786 -.003 .786 -.003 .786 -.003 .786 Nbr years failed
Mother’s education
No education
-.01
-.001
.497
.578
-.01
-.001
.497
.578
-.01
-.001
.497
.578
-.01
-.001
.497
.578
Inc. primary .005 .567 .005 .567 .005 .567 .005 .567 Primary -.004 .597 -.004 .597 -.004 .597 -.004 .597 Inc. high school -.022 .007 -.022 .007 -.022 .007 -.022 .007 High school .017 .131 .017 .131 .017 .131 .017 .131 Inc. college
Father’s education
College
0
.004
.923
.363
0
.004
.923
.363
0
.004
.923
.363
0
.004
.923
.363
No education -.001 .661 -.001 .661 -.001 .661 -.001 .661 Inc. primary -.001 .92 -.001 .92 -.001 .92 -.001 .92 Inc. primary .006 .446 .006 .446 .006 .446 .006 .446 Inc. high school -.02 .015 -.02 .015 -.02 .015 -.02 .015 High school .009 .372 .009 .372 .009 .372 .009 .372 Inc. college .005 .186 .005 .186 .005 .186 .005 .186 College .001 .854 .001 .854 .001 .854 .001 .854 Test of joint significance of baseline characteristics (F-statistic) 1.18 0.277 1.18 0.272 1.17 0.282 1.15 0.305
Table 1: Randomization check
Pre attrition sample
Stat. p-val
Post attrition samples
Reading test takers Math test takers Science test takers
Stat. p-val Stat. p-val Stat. p-val
Panel A: 2011
Balancing of attrition rates and baseline characteristics (E(PAC=1) - E(PAC=0))
Proportion of attritors
Panel B: 2012
Balancing of attrition rates and baseline characteristics (E(PAC=1) - E(PAC=0))
Proportion of attritors
Reading -.01 .213 n.a. n.a. n.a. n.a. n.a. n.a. Math -.012 .125 n.a. n.a. n.a. n.a. n.a. n.a. Science -.01 .231 n.a. n.a. n.a. n.a. n.a. n.a. Baseline characteristics: Students demographics Female -.001 .909 -.001 .909 -.001 .909 -.001 .909 Low income -.005 .652 -.005 .652 -.005 .652 -.005 .652 Nuclear family .014 .299 .014 .299 .014 .299 .014 .299 Extended family .003 .687 .003 .687 .003 .687 .003 .687 Other family -.017 .251 -.017 .251 -.017 .251 -.017 .251 Nbr years failed -.024 .123 -.024 .123 -.024 .123 -.024 .123 Mother’s education No education .001 .441 .001 .441 .001 .441 .001 .441 Inc. primary -.003 .783 -.003 .783 -.003 .783 -.003 .783 Primary .001 .844 .001 .844 .001 .844 .001 .844 Inc. high school -.001 .934 -.001 .934 -.001 .934 -.001 .934 High school .004 .675 .004 .675 .004 .675 .004 .675 Inc. college -.004 .3 -.004 .3 -.004 .3 -.004 .3

16
College Father’s education
.001 .922 .001 .922 .001 .922 .001 .922
17
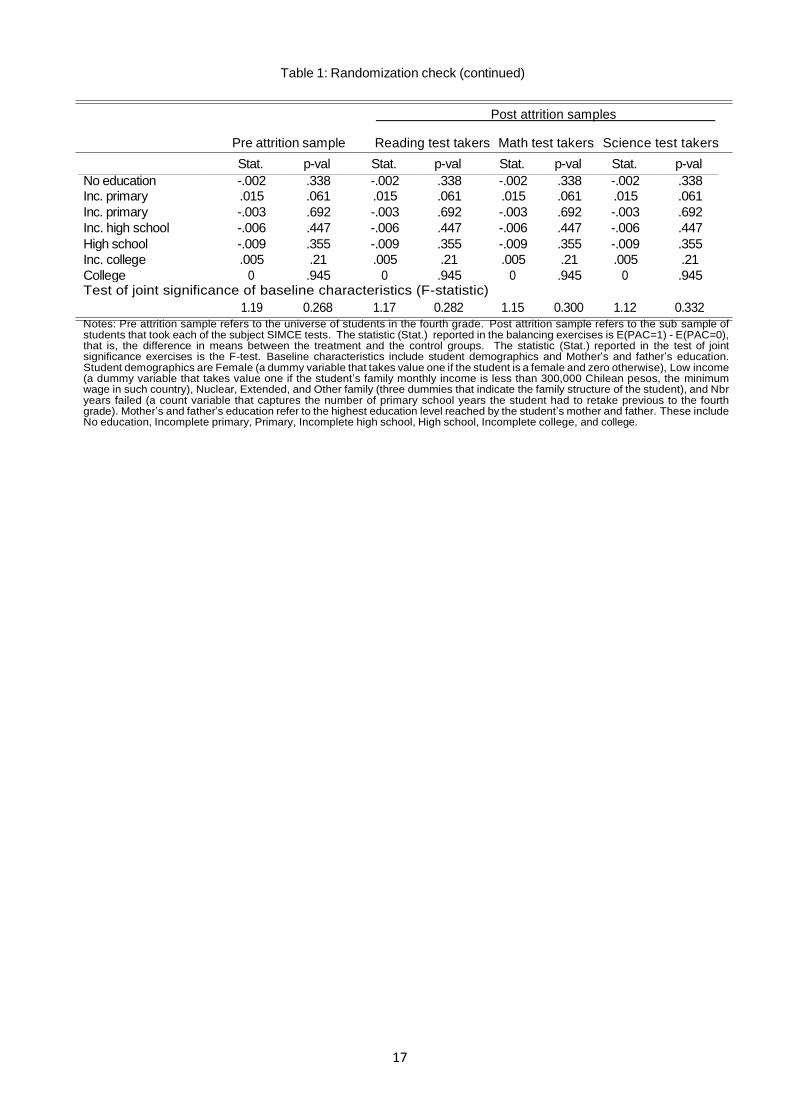
Table 1: Randomization check (continued)
Post attrition samples
Pre attrition sample Reading test takers Math test takers Science test takers
Stat. p-val Stat. p-val Stat. p-val Stat. p-val No education -.002 .338 -.002 .338 -.002 .338 -.002 .338 Inc. primary .015 .061 .015 .061 .015 .061 .015 .061 Inc. primary -.003 .692 -.003 .692 -.003 .692 -.003 .692 Inc. high school -.006 .447 -.006 .447 -.006 .447 -.006 .447 High school -.009 .355 -.009 .355 -.009 .355 -.009 .355 Inc. college .005 .21 .005 .21 .005 .21 .005 .21 College 0 .945 0 .945 0 .945 0 .945 Test of joint significance of baseline characteristics (F-statistic)
1.19 0.268 1.17 0.282 1.15 0.300 1.12 0.332 Notes: Pre attrition sample refers to the universe of students in the fourth grade. Post attrition sample refers to the sub sample of students that took each of the subject SIMCE tests. The statistic (Stat.) reported in the balancing exercises is E(PAC=1) - E(PAC=0), that is, the difference in means between the treatment and the control groups. The statistic (Stat.) reported in the test of joint significance exercises is the F-test. Baseline characteristics include student demographics and Mother’s and father’s education. Student demographics are Female (a dummy variable that takes value one if the student is a female and zero otherwise), Low income (a dummy variable that takes value one if the student’s family monthly income is less than 300,000 Chilean pesos, the minimum wage in such country), Nuclear, Extended, and Other family (three dummies that indicate the family structure of the student), and Nbr years failed (a count variable that captures the number of primary school years the student had to retake previous to the fourth grade). Mother’s and father’s education refer to the highest education level reached by the student’s mother and father. These include No education, Incomplete primary, Primary, Incomplete high school, High school, Incomplete college, and college.
18
Reading Math Science Reading Math Science PAC = 1 .048 .032 .01 .132 .058 .025
[-.02;.11] [-.04;.1] [-.06;.08] [.02;.25] [-.06;.18] [-.09;.15] (.69) (.86) (.98) (.28) (.84) (.98)
Control Group Mean 251.092 233.751 233.211 255.152 242.041 243.128 Control Group SD 47.49 45.368 42.541 48.16 45.699 45.494 Observations 10854 10892 10877 2314 2313 2323
(7) (8)
Table 2: Impact of PAC on SIMCE 2011, by gender and income
Females Low Income Medium- high Income
(1) (2) (3) (4) (5) (6)
Participated in PAC = 1 Participated in PAC = 1
PAC = 1 0.775 0.721 [.746;.803] [.68;.761]
Males
Low Income Medium- high Income
(9)
Reading (10)
Math (11)
Science (12)
Reading (13)
Math (14)
Science PAC = 1 .082 .053 .009 .197 .198 .13
[.02;.15] [-.02;.12] [-.06;.08] [.1;.3] [.09;.3] [.02;.24] (.19) (.69) (.98) (.02) (.02) (.28)
Control Group Mean 241.078 238.484 240.424 244.988 242.971 246.545 Control Group SD 51.102 48.168 44.258 52.693 49.455 46.198 Observations 11391 11400 11425 2560 2562 2561
(15)
Participated in PAC = 1 (16)
Participated in PAC = 1 PAC = 1 0.769
[.707;.782] 0.745
[.74;.797]
Notes: The effects shown are in units of the control group standard deviation. 95% bootstrapped confidence intervals are shown in brackets. All outputs in this table are tested jointly to control for the Familywise Error Rate using the Romano-Wolf step down method. Romano-Wolf step down p-values from thtwo sided test are shown in parenthesis.

19
Table 3: Impact of PAC on SIMCE 2012, by gender and income
Females
Low Income Medium- high Income
(1)
Reading (2)
Math (3)
Science (4)
Reading (5)
Math (6)
Science PAC = 1 .039 .068 .025 .208 .117 .075
[-.03;.11] [0;.15] [-.04;.1] [.09;.32] [0;.24] [-.03;.18] (.8) (.57) (.87) (.01) (.45) (.74)
Control Group Mean 251.989 236.495 232.941 256.406 244.927 242.931 Control Group SD 49.769 46.37 44.465 49.098 47.692 46.727 Observations 10030 10005 9973 2533 2522 2520
(7) (8) Participated in PAC = 1 Participated in PAC = 1
PAC = 1 0.6342 0.6108
[.586;.679] [.555;.663]
Males
Low Income Medium- high Income
(9)
Reading (10)
Math (11)
Science (12)
Reading (13)
Math (14)
Science PAC = 1 .046 .072 .031 .026 .107 .013
[-.02;.11] [0;.15] [-.03;.1] [-.06;.12] [.01;.2] [-.08;.1] (.74) (.47) (.87) (.87) (.45) (.87)
Control Group Mean 239.601 240.548 235.503 250.521 247.172 246.618 Control Group SD 51.678 47.936 48.001 51.718 47.433 46.927 Observations 10235 10191 10182 2950 2946 2930
(15)
Participated in PAC = 1 (16)
Participated in PAC = 1 PAC = 1 0.636
[.575;.681] 0.629
[.585;.687] Notes: The effects shown are in units of the control group standard deviation. 95% bootstrapped confidence intervals are shown in brackets. All outputs in this table are tested jointly to control for the Familywise Error Rate using the Romano-Wolf step down method. Romano-Wolf step down p-values from the two sided test are shown in parenthesis.
20
Table 4: Association between CLASS and SIMCE 2012, by gender and income
L
(1)
ow Income
(2)
Fem
(3)
ales
Medium- high Income
(4) (5) (6) Reading Math Science Reading Math Science
CLASS first principal component .074 .075 .067 .075 .013 .031 [.04;.11] [.04;.11] [.03;.1] [.04;.11] [-.04;.06] [-.01;.07] (.01) (.01) (.01) (.01) (.69) (.33)
SIMCE Score Mean 253.862 239.124 234.441 265.009 252.042 246.767 SIMCE Score SD 49.475 47.855 44.145 47.939 49.585 45.668
Observations 1415 1404 1403 297 296 298
Males
Low Income Medium- high Income
(7) (8) (9) (10) (11) (12)
Reading Math Science Reading Math Science
CLASS first principal component .086 .092 .089 .058 .048 .091 [.06;.11] [.06;.12] [.06;.12] [.01;.11] [0;.1] [.04;.15] (.01) (.01) (.01) (.2) (.33) (.02)
SIMCE Score Mean 244.621 245.274 239.259 254.037 252.437 250.899 SIMCE Score SD 53.15 48.746 49.304 50.999 49.422 46.764
Observations 1472 1461 1461 365 360 361 Notes: The effects shown are in units of the corresponding test standard deviation. 95% bootstrapped confidence intervals are shown in brackets. All outputs in this table are tested jointly to control for the Familywise Error Rate using the Romano -Wolf step down method. Romano-Wolf step down p-values from the two sided test are shown in parenthesis.
Table 5: Impact of PAC on CLASS, classroom level
Dependent variable: CLASS first principal component
(1) (2) (3) (4)
OLS IV OLS IV
PAC = 1 -0.5274 -0.2361
[-1.128;.093] [-1.318;.107]
Participated in PAC = 1 -0.6153 -0.2697
[-.878;.338] [-.992;.38]
Covariates No No Yes Yes
Observations 185 185 184 184
Notes: In columns (2) and (4) we instrument actual participation in PAC with the random assignment to PAC. Covariates include an indicator of the income group the classroom belongs to, the type of administration of the school (private or public), average SIMCE scores of the school for the period 2005-2009, general experience of the teacher and the school principal, and tenure of the teacher and the principal in the school. 95% bootstrapped confidence intervals are shown in brackets.

21
Appendix A Summary Statistics

Table 6: Summary statistics - post attrition samples
Reading test takers Math test takers Science test takers
PAC=0 PAC=1 PAC=0 PAC=1 PAC=0 PAC=1
Obs. Mean SD Obs. Mean SD Obs. Mean SD Obs. Mean SD Obs. Mean SD Obs. Mean SD
Panel A: 2011
SIMCE scores:
Reading
6886
245
50
23850
248
50
Math 6903 236 47 23828 238 48 Science 6911 237 44 23854 238 44 Baseline characteristics: Students demographics Female 6554 .472 .499 22861 .484 .5 6653 .473 .499 23152 .484 .5 6660 .473 .499 23162 .484 .5 Low income 6219 .841 .366 21470 .813 .39 6235 .841 .366 21490 .813 .39 6244 .841 .366 21502 .813 .39 Nuclear family 6886 .613 .487 23850 .617 .486 6903 .613 .487 23828 .619 .486 6911 .613 .487 23854 .617 .486 Extended family 6886 .244 .43 23850 .239 .426 6903 .244 .43 23828 .239 .426 6911 .244 .43 23854 .239 .427 Other family 6886 .143 .35 23850 .144 .352 6903 .143 .35 23828 .143 .35 6911 .143 .35 23854 .143 .35 Nbr years failed 6187 .238 .527 21353 .232 .531 6202 .239 .528 21367 .232 .531 6211 .239 .528 21387 .232 .531 Mother’s education No education 6201 .007 .086 21352 .006 .078 6215 .007 .086 21374 .006 .077 6225 .008 .087 21387 .006 .078 Inc. primary 6201 .179 .383 21352 .174 .379 6215 .178 .383 21374 .174 .379 6225 .178 .383 21387 .174 .379 Primary 6201 .17 .375 21352 .164 .37 6215 .17 .375 21374 .164 .37 6225 .169 .375 21387 .164 .37 Inc. high school 6201 .235 .424 21352 .218 .413 6215 .235 .424 21374 .218 .413 6225 .236 .425 21387 .219 .413 High school 6201 .324 .468 21352 .341 .474 6215 .324 .468 21374 .341 .474 6225 .324 .468 21387 .341 .474 Inc. college 6201 .034 .182 21352 .038 .191 6215 .034 .182 21374 .038 .191 6225 .034 .181 21387 .037 .19 College 6201 .051 .22 21352 .059 .235 6215 .051 .22 21374 .059 .235 6225 .051 .22 21387 .059 .235 Father’s education No education 5992 .008 .089 20577 .008 .089 6006 .008 .09 20597 .008 .089 6013 .008 .089 20611 .008 .09 Inc. primary 5992 .17 .376 20577 .158 .364 6006 .17 .376 20597 .157 .364 6013 .17 .376 20611 .157 .364 Inc. primary 5992 .16 .366 20577 .162 .368 6006 .16 .367 20597 .161 .368 6013 .16 .366 20611 .162 .368 Inc. high school 5992 .248 .432 20577 .23 .421 6006 .248 .432 20597 .23 .421 6013 .247 .431 20611 .23 .421 High school 5992 .329 .47 20577 .345 .475 6006 .328 .469 20597 .344 .475 6013 .328 .47 20611 .344 .475 Inc. college 5992 .036 .187 20577 .043 .202 6006 .036 .187 20597 .043 .203 6013 .036 .187 20611 .043 .203 College 5992 .05 .217 20577 .056 .229 6006 .05 .219 20597 .056 .23 6013 .05 .218 20611 .056 .229
Panel B: 2012 SIMCE scores: Reading 7141 246 51 23353 248 52 Math 7095 239 47 23273 242 49 Social Science
Baseline characteristics: 7105 235 47 23226 237 46

Table 6: Summary statistics - post attrition samples (continued)
Reading test takers Math test takers Science test takers
Obs.
PAC=0
Mean
SD PAC=1
Obs. Mean
SD
Obs. PAC=0
Mean
SD PAC=1
Obs. Mean
SD
Obs. PAC=0
Mean
SD
Obs. PAC=1
Mean
SD Students demographics Female 6773 .481 .5 22810 .481 .5 6572 .483 .5 22303 .482 .5 6580 .483 .5 22245 .482 .5 Low income 6048 .8 .4 20229 .783 .412 6065 .801 .399 20292 .783 .412 6063 .801 .399 20236 .783 .412 Nuclear family 7141 .566 .496 23353 .572 .495 7095 .572 .495 23273 .576 .494 7105 .571 .495 23226 .575 .494 Extended family 7141 .235 .424 23353 .248 .432 7095 .237 .425 23273 .25 .433 7105 .236 .425 23226 .249 .433 Other family 7141 .2 .4 23353 .18 .385 7095 .191 .393 23273 .175 .38 7105 .193 .395 23226 .175 .38 Nbr years failed
Mother’s education
No education
6050
5873
1.243
.006
.588
.076
20242
19580
1.219
.006
.565
.075
6068
5894
1.245
.006
.593
.077
20305
19648
1.22
.006
.564
.075
6066
5891
1.243
.006
.592
.076
20248
19594
1.219
.006
.564
.075
Inc. primary 5873 .178 .383 19580 .166 .372 5894 .18 .384 19648 .167 .373 5891 .179 .384 19594 .166 .372 Primary 5873 .173 .378 19580 .169 .375 5894 .173 .378 19648 .169 .375 5891 .172 .378 19594 .17 .376 Inc. high school 5873 .214 .41 19580 .213 .409 5894 .214 .41 19648 .213 .41 5891 .214 .41 19594 .213 .409 High school 5873 .338 .473 19580 .348 .476 5894 .336 .472 19648 .348 .476 5891 .337 .473 19594 .348 .476 Inc. college 5873 .036 .187 19580 .039 .193 5894 .036 .187 19648 .039 .193 5891 .036 .187 19594 .039 .192 College
Father’s education
No education
5873
5630
.055
.009
.228
.092
19580
18745
.058
.007
.235
.085
5894
5647
.055
.009
.228
.092
19648
18820
.059
.007
.235
.085
5891
5644
.055
.009
.228
.092
19594
18768
.059
.007
.236
.085
Inc. primary 5630 .153 .36 18745 .158 .365 5647 .153 .36 18820 .158 .365 5644 .154 .361 18768 .158 .364 Inc. primary 5630 .172 .377 18745 .165 .371 5647 .172 .377 18820 .165 .371 5644 .17 .376 18768 .165 .372 Inc. high school 5630 .222 .416 18745 .217 .412 5647 .222 .416 18820 .217 .412 5644 .222 .416 18768 .218 .413 High school 5630 .357 .479 18745 .351 .477 5647 .356 .479 18820 .35 .477 5644 .357 .479 18768 .35 .477 Inc. college 5630 .035 .183 18745 .043 .203 5647 .035 .184 18820 .043 .204 5644 .035 .184 18768 .043 .204 College 5630 .054 .225 18745 .058 .234 5647 .054 .226 18820 .058 .234 5644 .054 .225 18768 .059 .235
24
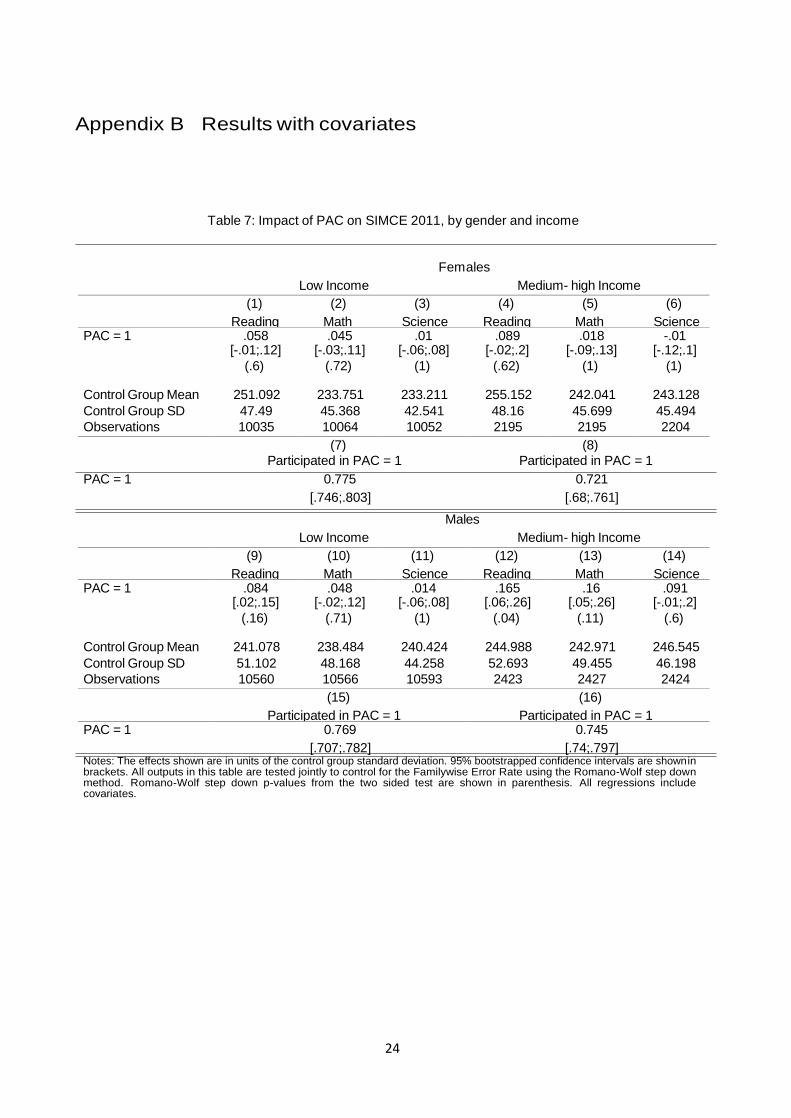
Appendix B Results with covariates
Table 7: Impact of PAC on SIMCE 2011, by gender and income
Females
Low Income Medium- high Income
(1)
Reading
(2)
Math
(3)
Science
(4)
Reading
(5)
Math
(6)
Science PAC = 1 .058 .045 .01 .089 .018 -.01
[-.01;.12] [-.03;.11] [-.06;.08] [-.02;.2] [-.09;.13] [-.12;.1] (.6) (.72) (1) (.62) (1) (1)
Control Group Mean 251.092 233.751 233.211 255.152 242.041 243.128 Control Group SD 47.49 45.368 42.541 48.16 45.699 45.494 Observations 10035 10064 10052 2195 2195 2204
(7) (8) Participated in PAC = 1 Participated in PAC = 1
PAC = 1 0.775 0.721
[.746;.803] [.68;.761]
Males
Low Income Medium- high Income
(9)
Reading
(10)
Math
(11)
Science
(12)
Reading
(13)
Math
(14)
Science PAC = 1 .084 .048 .014 .165 .16 .091
[.02;.15] [-.02;.12] [-.06;.08] [.06;.26] [.05;.26] [-.01;.2] (.16) (.71) (1) (.04) (.11) (.6)
Control Group Mean 241.078 238.484 240.424 244.988 242.971 246.545 Control Group SD 51.102 48.168 44.258 52.693 49.455 46.198 Observations 10560 10566 10593 2423 2427 2424
(15)
Participated in PAC = 1
(16)
Participated in PAC = 1 PAC = 1 0.769
[.707;.782]
0.745
[.74;.797] Notes: The effects shown are in units of the control group standard deviation. 95% bootstrapped confidence intervals are shown in brackets. All outputs in this table are tested jointly to control for the Familywise Error Rate using the Romano-Wolf step down method. Romano-Wolf step down p-values from the two sided test are shown in parenthesis. All regressions include covariates.

25
Table 8: Impact of PAC on SIMCE 2012, by gender and income
Females
Low Income Medium- high Income
(1)
Reading (2)
Math (3)
Science (4)
Reading (5)
Math (6)
Science Randomized into PAC .038 .05 .022 .161 .067 .021
[-.03;.1] [-.02;.13] [-.04;.09] [.05;.27] [-.04;.18] [-.08;.12] (.91) (.87) (.99) (.12) (.91) (.99)
Control Group Mean 251.989 236.495 232.941 256.406 244.927 242.931 Control Group SD 49.769 46.37 44.465 49.098 47.692 46.727 Observations 9064 9049 9022 2396 2384 2382
(7) (8) Participated in PAC = 1 Participated in PAC = 1
PAC = 1 0.6342 0.6108
[.586;.679] [.555;.663]
Males
Low Income Medium- high Income
(9)
Reading (10)
Math (11)
Science (12)
Reading (13)
Math (14)
Science Randomized into PAC .035 .059 .022 .029 .106 .004
[-.03;.1] [-.01;.13] [-.04;.09] [-.06;.12] [0;.21] [-.09;.1] (.91) (.73) (.99) (.99) (.49) (.99)
Control Group Mean 239.601 240.548 235.503 250.521 247.172 246.618 Control Group SD 51.678 47.936 48.001 51.718 47.433 46.927 Observations 9234 9206 9194 2785 2781 2767
(15)
Participated in PAC = 1 (16)
Participated in PAC = 1 PAC = 1 0.636
[.575;.681] 0.629
[.585;.687] Notes: The effects shown are in units of the control group standard deviation. 95% bootstrapped confidence intervals are shown in brackets. All outputs in this table are tested jointly to control for the Familywise Error Rate using the Romano-Wolf step down method. Romano-Wolf step down p-values from the two sided test are shown in parenthesis. All regressions include covariates.