Embed Size (px)
Citation preview

NBER WORKING PAPER SERIES
EDUCATION QUALITY AND TEACHING PRACTICES
Marina BassiCostas MeghirAna Reynoso
Working Paper 22719http://www.nber.org/papers/w22719
NATIONAL BUREAU OF ECONOMIC RESEARCH1050 Massachusetts Avenue
Cambridge, MA 02138October 2016, Revised June 2019
The authors would like to thank two anonymous referees and the editor of the Journal for their comments. We are grateful to Daniel Alonso for his valuable assistance in the analysis of the data. We also thank Esteban M. Aucejo, Martha Bailey, Hoyt Bleakley, Eric Hanushek, Dean Yang, and Paul Rodhe for helpful comments and suggestions. We would also like to recognize the support of the Ministry of Education of Chile (Division of General Education and Studies Department) in the different stages of this project. Costas Meghir benefited from funding by the Cowles foundation and the ISPS. Ana Reynoso was funded by the IADB. All errors and opinions are our own. The findings and conclusions expressed in this report are solely those of the authors and do not reflect the view of the IDB, its Executive Directors, the countries they represent, or the National Bureau of Economic Research.
NBER working papers are circulated for discussion and comment purposes. They have not been peer-reviewed or been subject to the review by the NBER Board of Directors that accompanies official NBER publications.
© 2016 by Marina Bassi, Costas Meghir, and Ana Reynoso. All rights reserved. Short sections of text, not to exceed two paragraphs, may be quoted without explicit permission provided that full credit, including © notice, is given to the source.

Education Quality and Teaching Practices Marina Bassi, Costas Meghir, and Ana Reynoso NBER Working Paper No. 22719October 2016, Revised June 2019JEL No. I21,I24,I25,I3
ABSTRACT
Improving school quality with limited resources is a key issue of policy. It has been suggested that instructing teachers to follow specific practices together with tight monitoring of their activities may help improve outcomes in under-performing schools that usually serve poor populations. This paper uses a RCT to estimate the effectiveness of guided instruction methods as implemented in under-performing schools in Chile. The intervention improved performance substantially and by equal amounts for boys and girls. However, the effect is mainly accounted for by children from relatively higher income backgrounds and not for the most deprived. Based on the CLASS instrument we document that quality of teacher-student interactions is positively correlated with the performance of low income students; however, the intervention did not affect these interactions. Guided instruction can improve outcomes, but it is a challenge to reach the most deprived children.
Marina BassiInter American Development Bank1300 New York Avenue, N.W. Washington, D.C. [email protected]
Costas MeghirDepartment of EconomicsYale University37 Hillhouse AvenueNew Haven, CT 06511and IZAand also [email protected]
Ana ReynosoDepartment of EconomicsUniversity of Michigan611 Tappan AvenueAnn Arbor, MI [email protected]

1 Introduction
Improving the quality of education for children from lower socioeconomic backgrounds is key to offering equal
opportunity and arresting the intergenerational transmission of poverty. However, achieving this can be chal-
lenging in practice. For example observational studies as well as studies with randomized assignment of students
to teachers have concluded that teachers can have a large impact on performance (Rivkin, Hanushek, and Kain
(2005) and Chetty, Friedman, and Rockoff (2014) and for Ecuador Araujo, Carneiro, Cruz-Aguayo, and Schady
(2016)). However this literature has been unable to identify what makes a good teacher; and even if it did,
turning around the quality of teachers to a sufficient extent will likely prove far too difficult and slow. So
the natural question is whether we can improve outcomes by identifying and implementing innovative teaching
practices and relying on the existing human resources; solving this problem can have major policy implications
for most countries in the world.
An experiment in Chile provides a unique opportunity to address this question. The educational psychology
literature focusses on the method of instruction as an approach to improve school performance. The basic
principle is that it is possible to compensate for low teacher skills by providing them with specific prepackaged
classroom material and directions for teaching to any group of students in standardized ways. These methods
can be controversial and there is an active debate on the extent to which prescriptive methods can be successful.
While advocates of minimal instructional guidance argue that students learn best when they discover concepts
by themselves, those who believe in guided instruction argue that the cognitive architecture of the human brain
is such that students’ learning is maximized when teachers directly explain the concepts that students are
required to know (Kirschner, Sweller, and Clark, 2006).
Guided instruction methods, in turn, come in many forms. They are distinguished by the degree of discretion
that teachers have to adapt instruction according to the characteristics of the particular group of students they
are facing (Ganimian and Murnane, 2014). These methods are usually complemented by training teachers to
support them in the use of these instruction materials. This method is known in the literature as scripted
instruction and became very popular ever since the launch of high scale educational programs like Success for
All and DISTAR in the United States (Slavin, Lake, Chambers, Cheung, and Davis, 2009).
In this paper we contribute to the understanding of the effectiveness of direct instruction approaches in
schools that serve deprived populations, by analyzing the impact of a large-scale guided instruction program in
Chile aimed at low performing schools. We focus on the performance of students in the national standardized
Math, Language, and Science tests and our results are based on a school-level randomized trial.
The program in question, known as Plan Apoyo Compartido (henceforth, PAC), was implemented by the
Chilean Ministry of Education in 2011. The main intervention of the program was to support teachers through
a modified method of instruction by adopting a more prescriptive model. Teachers in treated schools received
detailed classroom guides and scripted material to follow in their lectures. The program was intended to be
implemented gradually, so only a group of eligible schools was invited to participate in the first year. Our
measure of students’ learning is their performance in the Chilean standardized Education Quality Measurement
2

System evaluations (henceforth SIMCE evaluations, for its name in Spanish). We concentrate the analysis on
students who were in their fourth grade of elementary school in years 2011 and 2012 and attended eligible
schools.
Our results suggest that the program had positive and significant effects, particularly for kids from the
most advantaged backgrounds within treated schools (students in schools with higher socioeconomic status
or from higher income families within our lower income population). Overall, the program improves Reading
test scores by about 10% of a test score standard deviation the first year of implementation. Program effects
increase significantly in the second year: test scores improve in all subjects in between 9% and 13% of a test
score standard deviation. All these effects are statistically significant. Moreover, kids in schools with high
socioeconomic status participating in the program improved SIMCE scores by 20% of a test score standard
deviation with respect to comparable kids in control schools. Finally, students from high-income families see
the greatest benefits from the program, their test scores improving by between 10% and 20% of a test score
standard deviation. All these results are strongly robust to adjustments in our inference strategy to control for
multiple testing.1
To better understand the impact of PAC on students’ test scores we analyze the effects of the program on
the quality of teacher-students interactions based on the CLASS (Classroom Assessment Scoring System; see
Pianta, Mashburn, Downer, Hamre, and Justice (2008).2 A random subsample of treatment and control schools
from the PAC program where invited to participate in the CLASS experiment. The experiment involved filming
several hours of classroom teaching and coding them to score teachers’ interactions with their students based
on very specific teachers’ behaviors that coders look for. We first show that CLASS scores correlate positively
and significantly with students’ performance, and particularly for those from lower income background. Then,
we show that PAC did not cause significant improvements in CLASS scores, which may explain why low income
students were more modestly impacted by the PAC.
Our study offers an important contribution to the literature on understanding and improving education
quality. We are specifically testing a program that is easily scalable and which does not make inordinate
demands on human resources, but which, according to a well established literature, can offer real improvements
in pupil performance. From a methodological point of view the experimental design on a particularly large
number of schools offers the power needed to detect even relatively small effect sizes. Second, we provide the first
assessment of the interaction between a large scale instruction intervention and the CLASS in producing learning
outcomes. The use of CLASS as a tool for understanding the mechanisms through which the intervention works,
by implementing it on both treatment and control groups is new in the literature.3
The paper is organized as follows. The next section describes the program intervention, the experimental
design and the data used in this paper. Section 3 describes the identification and inference strategies. Section
1A recent paper by Araujo, Carneiro, Cruz-Aguayo, and Schady (2016) focuses on the relationship between the quality ofteacher-students interactions and test scores in Ecuador. Their study finds that one standard deviation increase in the qualityteacher-students interaction results in approximately 10% of a standard deviation of higher students’ tests scores.
2also used in Araujo, Carneiro, Cruz-Aguayo, and Schady (2016) also used the CLASS in their experiment3He, Linden, and MacLeod (2009) also evaluates a scripted Reading preschool program in Mumbai, India and Albornoz, Anauati,
Furman, Luzuriaga, Podesta, and Taylor (2017) evaluates the effects of teacher training interventions in Buenos Aires, Argentina.Unlike theirs, our paper focuses on fourth grade primary school students.
3

4 presents the main results of the paper. Section 5 studies the importance of teacher-students’ interactions to
improve performance and the impact of PAC on these interactions. Finally, section 6 concludes.
2 Experimental design, data, and randomization check
2.1 Plan Apoyo Compartido (PAC)
PAC was implemented by the Chilean Ministry of Education in 2011 as a targeted educational policy providing
technical and pedagogical support to schools historically performing below average in the national standardized
test, SIMCE. It aimed at improving student’ learning outcomes in Math and Language from pre-K to fourth
grade (and, additionally, in Natural and Social Sciences for students in third and fourth grades), changing
practices inside the classroom and the school. The PAC targeted low performing public and subsidized private
schools nationwide.4 We describe the design and implementation of the PAC next.
PAC design The design of PAC included five components and was implemented in six-week cycles (see Figure
1). The first component, called “effective implementation of the national curriculum”(indicated [1] in the figure),
consisted in the development of unified pedagogical material and planning tools distributed to teachers. These
tools included an annual curricular programming, a series of teaching materials designed for each six-week
cycle, and a set of daily planning activities to be used by teachers in the classroom. The second component
(indicated [2] in the figure) consisted of promoting a school culture and environment that encourages learning. A
manual was developed and delivered to schools to guide the implementation of the ideas. The third component
(indicated [3] in the figure) was the use of student evaluations as a tool for guiding teaching. This component
included the development of four types of tests to monitor progress in students learning: a diagnostic test to
determine the initial level of academic skills and knowledge administered at the beginning of the school year,
intermediate and final tests to determine students’ progress, and students’ performance reports. Each of these
testing instruments was applied in different moments of the semester to help analyze students’ performance in
Math and Language (MINEDUC, 2013). It is worth noting that unlike the SIMCE tests, these instruments
were not standardized tests and could be applied voluntarily by PAC schools. The fourth component (indicated
[4] in the figure) was defined as the “optimization of the use of school time for learning in the classroom”, and
consisted in promoting class planning and frequent class observation in schools to provide feedback to teachers.
Finally, the last component known as “promotion of teachers’ professional development” (indicated [5] in the
figure) aimed at promoting frequent internal school staff meetings to discuss students’ progress.
4The Chilean system of education includes three types of schools: public schools, subsidized private schools, and private schools.Public schools are both financed and administered by the public sector; subsidized private schools are administered by privateagencies but receive funding from the State in the form of vouchers per attending student; finally, the third group includes schoolsthat are administered privately and tuition is paid by the students’ families.
4
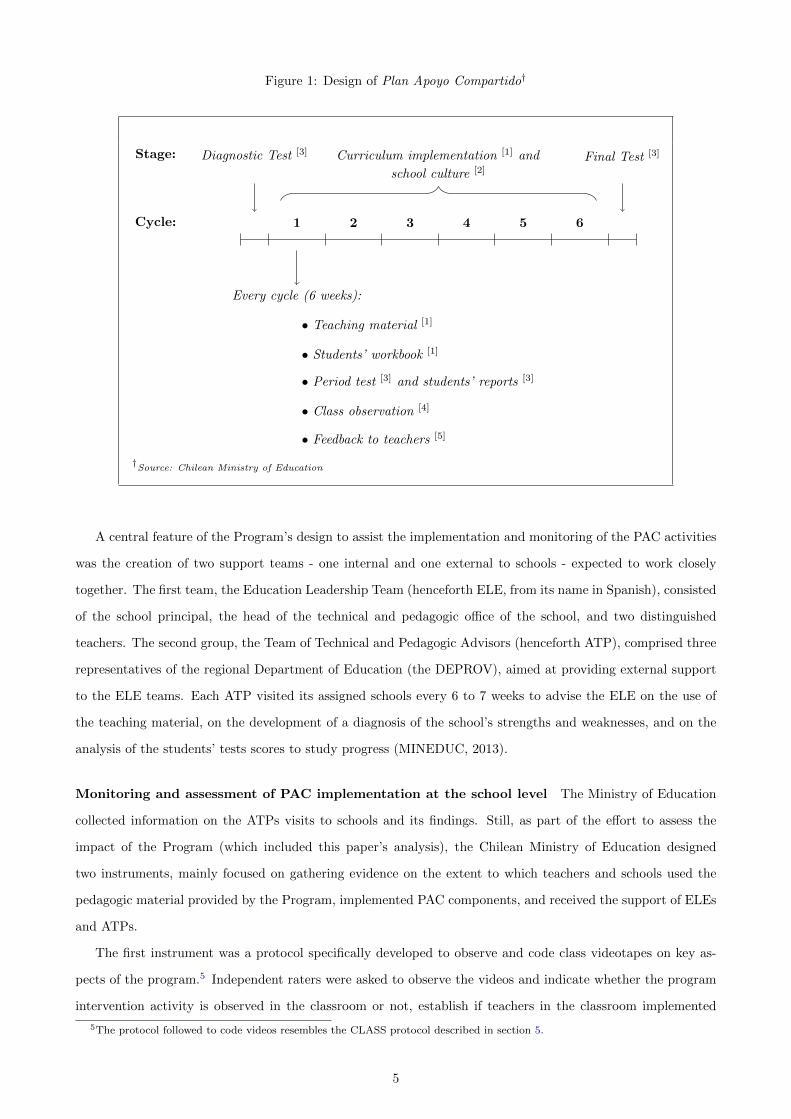
Figure 1: Design of Plan Apoyo Compartido†
Stage: Curriculum implementation [1] and
school culture [2]
Diagnostic Test [3] Final Test [3]
Cycle: 1 2 3 4 5 6
Every cycle (6 weeks):
• Teaching material [1]
• Students’ workbook [1]
• Period test [3] and students’ reports [3]
• Class observation [4]
• Feedback to teachers [5]
†Source: Chilean Ministry of Education
A central feature of the Program’s design to assist the implementation and monitoring of the PAC activities
was the creation of two support teams - one internal and one external to schools - expected to work closely
together. The first team, the Education Leadership Team (henceforth ELE, from its name in Spanish), consisted
of the school principal, the head of the technical and pedagogic office of the school, and two distinguished
teachers. The second group, the Team of Technical and Pedagogic Advisors (henceforth ATP), comprised three
representatives of the regional Department of Education (the DEPROV), aimed at providing external support
to the ELE teams. Each ATP visited its assigned schools every 6 to 7 weeks to advise the ELE on the use of
the teaching material, on the development of a diagnosis of the school’s strengths and weaknesses, and on the
analysis of the students’ tests scores to study progress (MINEDUC, 2013).
Monitoring and assessment of PAC implementation at the school level The Ministry of Education
collected information on the ATPs visits to schools and its findings. Still, as part of the effort to assess the
impact of the Program (which included this paper’s analysis), the Chilean Ministry of Education designed
two instruments, mainly focused on gathering evidence on the extent to which teachers and schools used the
pedagogic material provided by the Program, implemented PAC components, and received the support of ELEs
and ATPs.
The first instrument was a protocol specifically developed to observe and code class videotapes on key as-
pects of the program.5 Independent raters were asked to observe the videos and indicate whether the program
intervention activity is observed in the classroom or not, establish if teachers in the classroom implemented
5The protocol followed to code videos resembles the CLASS protocol described in section 5.
5

the scripted instruction method, and determine if teachers organized their classroom according to the program
guidelines. The key aspects that were observed in both PAC and control schools were class structure, encour-
agement of critical thinking, norms and schedule, and evaluation of students’ performance. In Appendix A
we present the correlation between participating in PAC and the average score in these relevant dimensions of
the program implementation. The data indicates that PAC schools are observed to perform better in the PAC
objectives within the classroom. The difference between treated and control schools is only significant when
it comes to the enforcement of norms and schedule. PAC classrooms are 5.8 percentage points more likely to
follow the norms and schedule relative to non- PAC schools. Within this dimension, a particularly interesting
aspect concerns the use of prepacked material by the teachers. Coders were asked to indicate if they observe
teachers in the classroom using special workbooks as a pedagogic resource (the scripted class manuals, or ”PAC
book” in the case of the treated schools). PAC schools are 23 percentage points more likely to use the scripted
workbooks in class relative to non-PAC schools. The difference is significant at the 1% level.
The second instrument to assess the degree of implementation of the PAC at the school level was to interview
the head of the technical and pedagogic office of the school (henceforth JUTP, from its name in Spanish) and
a set of teachers within the schools that participated in the monitoring evaluation. These surveys gathered
information about the key ingredients of the program. For example, authorities were asked if their school
utilizes annual planning in class, whether students are periodically evaluated, whether the teachers understand
and explain norms of behavior to students, and the frequency with which the school organizes meetings between
teachers and authorities to monitor the performance of students (see figure 1).
Table A2 shows the correlation between PAC treatment and the responses of JUTPs. The first three columns
are concerned with annual planning activities within the school. 93.38% of JUTPs in the sample respond that
the school engages in annual planning of the curriculum and we do not detect differences between PAC and
control schools in annual planning. However, columns (1) to (3) evidence that PAC schools are significantly more
likely to have the annual planning performed by the PAC authorities or by the ELE team and significantly less
likely to leave the curriculum design to teachers. This evidence may be an indication of one of the dimensions
in which teachers in PAC schools were supported by the authorities. Columns (4) and (5) provide evidence of
two additional dimensions of support to teachers. The evidence presented in column (4) indicates that PAC
schools are observed about 34.2% more times by the ELE team relative to control schools. Moreover, column
(5) indicates that teachers in PAC schools receive feedback after these observations in about 30.5% more times
than control schools. Finally, teachers’ responses are consistent with the JUTPs answers, although we do not
detect significant differences between PAC and control schools in teachers’ responses.6 For example, consistent
with the JUTPs reports, teachers in PAC schools are more likely to having their classrooms observed and to
receive feedback after observations.
6The vast majority of teachers in the sample respond positively to the questions. It is worth remarking that the fact that allteachers, including PAC teachers, implement the key program instruments is reassuring of the implementation of PAC.
6

2.2 Eligibility and Randomization
Among public and subsidized private schools in Chile, PAC considered two main eligibility criteria to define
the target group of schools: first, the school’s baseline average SIMCE score for the years between 2005 and
2009 in Math and Language should be below the national average (252 points out of 500); and second, there
should be at least 20 students per level on average from pre-K to fourth grade.7 2,286 schools met these criteria
and were ranked by their 2005-2009 average SIMCE scores in Language and Math. The bottom 1,000 schools
were automatically considered eligible. Since participation in the program was voluntary, refusal to participate
was expected, so in order to reach a target of around 1,000 eligible schools in the first year of the program, the
Ministry increased the sample within each DEPROV by 50%, going up in the SIMCE ranking.8 Of the resulting
1,480 eligible schools 632 located in “small” DEPROVs (DEPROVs with 40 schools or less) were allocated to
the program automatically and do not form part of the evaluation and analysis. The remaining 848 schools
located in “large” DEPROVs were randomly allocated to treatment and control groups. Five schools in the
randomization are excluded from the analysis because they show missing information on school and students’
characteristics in both the 2011 and 2012 data sets. All in all, of the 843 schools considered in this analysis,
648 were randomly selected to the treatment group and 195 were randomly selected to the control group.9
2.3 2012 CLASS intervention
The second part of this paper analyzes the relationship between teacher-students interactions and learning
outcomes. To measure the quality of teacher-students interactions, we use the well-known CLASS measurement
system Pianta, Mashburn, Downer, Hamre, and Justice (2008). The CLASS is an instrument used in the
Education literature to measure the quality of teacher-student interactions, as a proxy to teachers’ quality or
effectiveness.
To produce the CLASS measures, a randomly selected group of 158 PAC schools (79 from the PAC treatment
group and 79 from the PAC control group) were invited to have their fourth grade classrooms videotaped for
four full lessons. The CLASS intervention took place in 2012, the second year of implementation of the PAC
program. After class observations, thoroughly trained coders watch and analyze the videotapes and assign a
score for teacher-students interactions in several dimensions (details will be presented in section 5).
The CLASS experiment had an extremely good compliance: in the end, 137 invited schools agreed to
participate in the filming sessions and 185 classrooms within participating schools had lectures filmed. Non-
participation is fairly well balanced between the treatment and control schools.10 The sample of treated and
control schools that participated in the CLASS experiment is also well balanced in school pre-treatment char-
7The Ministry of Education also required that the schools administrators should have no sanctions related to the vouchersubsidies system in the previous three years.
8At this point some schools were excluded after consultation with DEPROV authorities either because of bad management orbecause they were already receiving technical and pedagogical assistance from well-known agencies of pedagogical support in Chile.
9Two of the 843 schools in the randomization are missing from our 2011 data set. Therefore, we consider 841 schools in 2011.Four of the 843 schools in the randomization drop out of our sample in 2012. Therefore, our analysis for 2012 is based on 839schools. We discuss attrition in this section below.
10Among these 185 classrooms, 94 were in control PAC schools and 91 were in treatment PAC schools. Among the 91 classroomsin PAC schools, in turn, 78 were participating in the PAC, while 13 were in schools invited to participate in PAC but did notaccept.
7

acteristics. These characteristics include the school income group, the past average SIMCE score of the school,
the experience of fourth grade teachers, the experience of the school principal, and the tenure at the school of
fourth grade teachers and the principal. For all these baseline characteristics we cannot reject the hypotheses
that they are equal among PAC and non PAC schools that participate in the CLASS experiment.
2.4 Data
The analysis in this paper relies on administrative data provided by the Ministry of Education. This data set
includes student level information on treatment status, test scores, and baseline demographic characteristics.
Table A3 in appendix B shows summary statistics of all the variables used in this paper, namely, test scores and
baseline characteristics, for the group of students that took each of the subject tests (post attrition samples).
2.5 Treatment- control balance and attrition
In our empirical results we exclude from the 2012 data those schools that implemented the CLASS observation
system because of Hawthorne effects (Landsberger, 1958) - an issue we return to in the results section. As we
show there, the CLASS intervention had impacts of its own thus contaminating the control schools that were
part of it. CLASS was randomly allocated in both treatment and control schools and thus there is no bias in
excluding these schools.
Table A4 in the Appendix shows summary statistics and randomization checks at the school level. The
evidence shows that the randomization at the school level was successful: all pre-treatment school characteristics
are balanced across PAC and control schools. Moreover, the result of an F-test of joint significance of school
baseline characteristics on random assignment indicated that we cannot reject the null hypothesis that no
variable jointly predicts treatment.
Table A5 in the Appendix, displays a set of randomization checks for the entire population of fourth grade
students (the pre attrition sample) and for the three post attrition samples (Reading, Math, and Science test
takers). The table is divided in three panels, corresponding to the 2011 cohort, the 2012 cohort that excludes
schools participating in the CLASS intervention, and the whole 2012 sample. Each panel displays the results of
a test of differences in means of attrition rates and baseline characteristics across treatment status, and a test
of joint significance of the impact of baseline characteristics on treatment status.
In general, attrition rates in our sample are very low and baseline characteristics are balanced in both, the
pre attrition and the post attrition samples. In 2011 there is no student that missed all three subject tests in
the sample. When analyzing attrition rates by subject for this cohort (not reported in the table), only 2.06% of
students missed the Reading test, 2.08% missed the Math test, and 1.97% missed the Science test. Moreover,
attrition rates are balanced between the treatment and control groups, as shown in the first three rows of the
2011 panel of Appendix Table A5. There, the statistic reported is the difference in attrition rates between the
treatment and control groups. These differences are very small: relative to the control group, there is 0.7% less
students missing the Reading test and 0.1% more students missing the Math and Science tests in the treatment
8

group. However, all p-values indicate that these differences are not significant.
The next set of rows show the results of a test of differences in means of baseline characteristics. Most
baseline characteristics are balanced even among the students that did not drop out of the data. The exceptions
are low income and mother and father incomplete high school : test takers in the treatment group are less
likely to be from a low income family and less likely to have a parent with incomplete high school. Even when
the p-value indicates that these differences are individually significant, the magnitude of the economic effect
is extremely small, around 2%. Moreover, the last row of the 2011 panel shows that taken together, baseline
characteristics do not significantly predict whether a student is in the treatment or the control group, even in
the post attrition samples. The statistic reported is the F-statistic of the joint test, and p-values indicate that
we cannot reject the null hypothesis that baseline characteristics do not jointly determine the random allocation
to the program.
The conclusions from the 2012 cohort are similar. First, attrition rates are higher than in the 2011 cohort,
but still low. In this cohort 15% of students missed the Reading test, 15.26% missed the Math test, and 15.36%
missed the Science test (statistics not reported in the table). However, differences in attrition rates between
treatment and control groups for 2012 are small and insignificant. Being in the treatment group is associated
with about 1% lower probability of sitting for the Reading, Math, and Science tests relative to the control group,
but these differences are not significantly different from zero, which suggests that the higher overall attrition in
2012 does not bias our results of the impact of PAC on SIMCE.
As further corroborative evidence panel B in Table A5 shows that the 2012 subsample excluding schools
contaminated by the CLASS intervention is also balanced: all baseline characteristics are jointly insignificant
in explain treatment status, as evidenced by the F-test. Individually, all baseline characteristics are balanced
between treatment and control groups, with the exception of Nbr years failed (the number of grades a student
had to retake prior to the fourth grade), which difference is economically negligible in magnitude and statistically
only marginally significant.
In sum, we find no evidence that the experimental design was compromised in any way. In both cohorts the
difference in the proportion of attritors is negligible in magnitude and not significant and the randomization
was successful in balancing baseline characteristics, even for the post attrition samples.
3 Estimation and inference
Our results explore overall effects as well as heterogeneous treatment effects by school and students’ demographic
characteristics. In our heterogeneity analysis we first analyze results by school socio-economic status. Second,
we define four groups of students based on the interaction between the gender of the student and her house-
hold income (Female- Low income, Female- Medium-High income, Male- Low income, and Male- Medium-High
income).
The focus on income is mainly motivated by the need to understand whether such programs are particularly
helpful for the most deprived, or by contrast they reinforce resources provided by parents. In general there
9

is ample evidence showing an association between income and wealth with child outcomes. Whether such
association extends to responses to interventions is an open and important question. Gender is also important;
girls tend to perform better than boys in Reading and worse than boys in Math and Science (OECD, 2015).
These outcomes may be related to teachers’ practices. Using the same sample of fourth grade teachers in Chile
as this paper, Bassi, Mateo Dıaz, Blumberg, and Reynoso (2018) show that teachers in fact pay more attention
to boys than girls, and those differentiated behaviors are correlated with worse performance in SIMCE in Math
and Science among the girls. It is thus important to understand whether there are substantial differences in the
response to interventions.
The results we present are obtained by a regression at the individual student level
SIMCEijgk = βgk + γgkTij +Xijgδgk + εijgk (1)
where SIMCEijgk is the test score of student i, in school j, in demographic group g, and in subject k =
{Math, Language, Science}. This is measured in units of a standard deviation of the control group (which we
will refer to as SD units henceforth). Tij is is a dummy indicating whether the student attended a school j
that was randomized into the program (PAC); Xijg is a vector of student-school characteristics that includes
baseline characteristics;11 and εijgk is a random error term, which because of randomization is uncorrelated
with treatment assignment.
Not all schools assigned to the program actually implemented it: there is non-compliance in both the 2011
and the 2012 cohorts. Table 1 shows take up rates of schools considered eligible to the program, for both years
2011 and 2012 and for the total schools that were ever considered eligible.
Table 1: Randomization and implementation, school level
All schools 2011 sample 2012 sampleImplemented PAC
No Yes No Yes No Yes
Randomized into PACNo 185 10 194 0 115 10Yes 150 498 155 492 164 413
Notes: PAC stands for Plan Apoyo Compartido. All schools refers to the 843 schools thatwere considered eligible by the program and considered in the program evaluation at somepoint. The 2011 sample consists of the 841 schools that were originally included in theprogram evaluation sample. The 2012 sample consists of the 702 schools that remained inthe program evaluation sample in the second year and were randomly excluded from theCLASS intervention (that is, 839 schools that continued in 2012 minus 137 schools thatparticipated in CLASS). Implemented PAC is a dummy variable that takes value one if theschool participated in PAC and zero otherwise. Randomized into PAC is a dummy variablethat takes value one if the school that randomly assigned to the treatment group and zerootherwise.
In 2011 about 23% of schools randomized into the program did not implement it. In this case if we replace
the randomization indicator Tij with whether treatment actually took place and then use the randomization
indicator as an instrument we will identify the effect of treatment on the treated because noncompliance is only
one sided. In 2012 however, we have two sided noncompliance, with 8% of schools not assigned to the program
11The covariates include, whether the student lives in a household with at least one parent and/or siblings; whether the studentlives in a household with members of the extended family; the number of times the student failed a school year; mother’s education:dummies for “no education”, “incomplete primary”, “primary”, “incomplete high school”, “high school”, “some college”, “college+”; father’s education (same dummies as mother education).
10

by the randomization actually getting it.12 IV in this case identifies the LATE parameter under the additional
monotonicity assumption that randomization either does not change treatment status or induces the school to
adopt the program but never the reverse.13 In all cases using as treatment variable the original randomization
(Tij) provides an unbiased estimate of the intention to treat parameter (ITT), namely the effect of having been
offered the program.
At the student level Table 2 shows that for the 2011 cohort 76% of students were exposed to it as a result of
the school being assigned to receive PAC. No student in the control group was exposed. The percentage varies
slightly by demographic groups because the composition of the schools is not uniform. For the 2012 cohort
the percent of exposed students as a result of being randomized into the program is 63%; some student in the
control group did however receive the treatment. Table A9 in the appendix shows similar conclusions for the
whole sample of 2012 schools.
Table 2: First stage. Dependent variable: Implemented PAC.
2011All Girls Boys
Low Income High Income Low Income High IncomeRandomized into PAC 0.761∗∗∗ 0.775∗∗∗ 0.721∗∗∗ 0.769∗∗∗ 0.745∗∗∗
[.734;.788] [.746;.803] [.68;.761] [.707;.782] [.74;.797]Observations 31384 10938 2330 11492 2581
2012All Girls Boys
Low Income High Income Low Income High IncomeRandomized into PAC 0.6321∗∗∗ 0.6528∗∗∗ 0.6226∗∗∗ 0.6509∗∗∗ 0.6455∗∗∗
[.575; .683] [.596; .704] [.561; .682] [.589; .697] [.591; .706]Observations 29905 8740 2225 8894 2622Notes: PAC stands for Plan Apoyo Compartido. The dependent variable is Implemented PAC, a dummy variable that takesvalue one if the student attends a school that participated in PAC and zero otherwise. Randomized into PAC is a dummyvariable that takes value one if the student attends a school that was randomly assigned to the treatment group and zerootherwise. All refers to all students pooled together. Low Income is a dummy variable that takes value one if the student’sfamily monthly income is less than 300,000 Chilean pesos, the minimum wage in such country. High Income is a dummy thattakes value one if Low Income= 0. 95% bootstrapped confidence intervals are shown in brackets. ∗∗∗Variable significant at the1% level. Clustering at the school level. The 2012 sample excludes schools that implemented CLASS.
In deriving standard errors and carrying out inference we cluster at the school level, which is the randomiza-
tion unit. Since we will be splitting the sample by demographic characteristics and testing families of hypotheses
we adjust the p-values for multiple testing using the step-down procedure of Romano and Wolf (2005). The
resulting p-value is the Family wise error rate (FWE), namely the probability that we incorrectly identify one
coefficient as significant in the entire group of hypotheses being tested. We use 1000 bootstrap replications to
compute all standard errors and confidence intervals.
12Table A8 in the appendix shows a similar picture when all 2012 schools are considered.13See Imbens and Angrist (1994).
11

4 Main Results
4.1 CLASS, Hawthorne Effects and the 2012 sample
As mentioned earlier, in order to better understand how PAC works and how it may affect teacher practices
it was decided to implement the CLASS observation system in a random subset of 137 PAC treatment and
PAC control schools. The CLASS was effectively another intervention consisting of videotaping lectures in full
knowledge of the teachers within randomly selected PAC control and PAC treated schools. The question is
whether CLASS had an effect in itself, thus contaminating the control group. Exploiting the fact that CLASS
was randomly allocated, we estimate the treatment effect of receiving CLASS by comparing the outcomes for
children in whose schools CLASS was implemented to those in which it was not, among the schools that did
not implement the PAC (PAC controls). The mere implementation of CLASS significantly improved SIMCE
scores by 23%, 18% and 21% of a standard deviation for Reading, Math and Science respectively. However,
CLASS had no additional effect on learning outcomes for children in the PAC treatment group.14 This is a
characteristic example of the so called Hawthorne effects (Landsberger, 1958; Levitt and List, 2011) which lead
to productivity increases when people feel they are being monitored.15 The implication is that by including
schools that received CLASS in our evaluation sample we would blunt the estimated effects of the PAC; hence
we exclude all 2012 schools in treatment and control that implemented CLASS. Importantly since CLASS was
randomly allocated, this causes no bias, but instead produces results that correctly reflect the PAC intervention.
The estimates that include the CLASS sample are presented in Appendix E for completeness.
4.2 Overall effects
Table 3: Impact of PAC on SIMCE
Intention to treat effect (ITT)Reading Math Science
Randomized into PAC .108 .087 .055[.06;.15] [.03;.14] [.01;.1]
(.01) (.02) (.06)Control Group Mean 243.83 236.12 235.18Control Group SD 50.38 47.17 44.83Number of Clusters 842 843 843Observations 56193 56116 56104Notes: PAC stands for Plan Apoyo Compartido. Implemented PAC is a dummy variable that takes value one if the student attendsa school that participated in PAC and zero otherwise. Randomized into PAC is a dummy variable that takes value one if thestudent attends a school that was randomly assigned to the treatment group and zero otherwise. The effects shown are in unitsof the control group standard deviation. 95% bootstrapped confidence intervals are shown in brackets. Romano-Wolf step downp-values from the two sided test accounting for all3 hypotheses are shown in parenthesis. All regressions include cohort fixed effects.Clustering at the school level. The 2012 sample excludes schools that implemented CLASS.
We start by showing in Table 3 the overall Intention to Treat (ITT) effects of the experiment pooling the data
from the two cohorts together and controlling for cohort fixed effects. In all Tables that follow we report results
without covariates (other than cohort effects when we pool them). Appendix F reports the results when we
14Detailed results in Table A10 in appendix D.15In other contexts observation has been shown to reduce teacher absentees, which can also have an impact on performance
(Duflo, Hanna, and Ryan, 2012).
12

include covariates. In this and all Tables that follow we report 95% confidence intervals (CI) in square brackets
and RW stepdown p-values in parentheses, both computed using the bootstrap.
The impacts on Reading and Math are both large, and significant even controlling for multiple testing. The
results for Science are smaller and the Romano Wolf (RW) stepdown p-value is 0.06. Overall the conclusion
from this table is that the intervention was successful in improving learning standards. In what follows we first
consider how the program worked for separate cohorts and we then proceed with heterogeneity analysis.
4.3 Effects by Cohort
Table 4 shows the effects of the program on SIMCE test scores for students in the 2011 and the 2012 cohorts
separately. The top panel of the Table shows the ITT estimate while the bottom panel reports the corresponding
instrumental variables (IV) results where the explanatory variable is actually receiving PAC and the instrument
is being randomized into PAC; the parameter is interpreted as the effect of treatment on the treated for the 2011
cohort where all those randomized out were actually excluded from the program (one sided noncompliance),
while for the 2012 cohort it is interpreted as the Local Average Treatment Effect (LATE) under the additional
assumption of monotonicity, since there is two sided noncompliance. The RW stepdown p-values allows for all
6 hypotheses (Reading, Math and Science in each of the two years).
Table 4: Impact of PAC on SIMCE by cohort
Intention to treat effect (ITT)2011 2012
Reading Math Science Reading Math ScienceRandomized into PAC .095 .068 .033 .127 .117 .089
[.04;.15] [.01;.13] [-.03;.09] [.07;.19] [.04;.19] [.03;.15](.02) (.22) (.56) (.01) (.03) (.04)
Instrumental Variables (IV)Implemented PAC .125 .089 .044 .2 .184 .139
[.05;.2] [.01;.17] [-.04;.12] [.11;.3] [.06;.31] [.06;.24](.02) (.22) (.56) (.01) (.05) (.05)
Control Group Mean 244.79 235.76 236.84 242.42 236.65 232.72Control Group SD 49.97 47.10 44.09 50.94 47.26 45.80Number of Clusters 840 841 841 702 702 702Observations 30736 30731 30765 25457 25385 25339Notes: PAC stands for Plan Apoyo Compartido. Implemented PAC is a dummy variable that takes value one if the student attendsa school that participated in PAC and zero otherwise. Randomized into PAC is a dummy variable that takes value one if thestudent attends a school that was randomly assigned to the treatment group and zero otherwise. The effects shown are in unitsof the control group standard deviation. 95% bootstrapped confidence intervals are shown in brackets. Romano-Wolf step downp-values from the two sided test accounting for all 6 hypotheses in each panel (ITT and IV) are shown in parenthesis. Clustering atthe school level. In the second panel the instrument is Randomized into PAC. The 2012 sample excludes schools that implementedCLASS.
Considering the results for the ITT and the corresponding ones for IV we find that Reading improved by
about 0.10 of a SD in 2011, giving an IV coefficient of 0.125 (RW pva;ue 0.02), revealing a large impact in the
schools that actually received the PAC. There is also a 0.07 improvement in Math in the same year, that is
individually significant (see CI) but not so once we account for multiple testing (see RW p-value). The remaining
effects for 2011 are not significant.
The effects in the 2012 sample are strong: test scores in all subjects improve between 0.09 and 0.13 of SD
13

units relative to control schools, and the effects are all significant, even accounting for multiple testing. The
effects are larger than those in 2011, which is consistent with the program maturing and being better embedded
in the implementing schools. Indeed, the fraction of classrooms with teachers who are hired in 2012 or who are
substitute teachers in the school is only 13.37%, implying improved experience levels with PAC implementation
in the second year. So these results point to the persistent and even improving success for the program overall.
Table A14 in appendix F shows that these results are robust to including covariates in the specification.16
4.4 Heterogeneity Analysis
Given the overall impacts of the program we now investigate whether these differ across gender and socioe-
conomic status, which are sources of disparities in performance. We will be focussing on three groups: Boys
and Girls; children from low Income households versus higher income; and low versus Higher SES schools. We
define low income background as children from families with a monthly income less than 300,000 Chilean pesos
(US$ 600 in 2011), which is the minimum wage. The SES status of the school is defined by the government
based on an index of parental education and income and a vulnerability index.17 In our sample of PAC eligible
schools Lower SES schools are overrepresented, reflecting the fact that underperforming schools tend to serve
lower SES students. Our Low SES group includes the schools classified by the government as belonging to the
Low and medium-Low groups.
The heterogeneity analysis is important for targeting, program improvement and understanding how to
reduce important educational deficits: there are large disparities among the groups and a key question is
whether the program reduces such inequalities and more generally how it affects the outcomes of each category.
Table 5 shows the difference in the SIMCE scores, in standard deviation units, for the control group in both
cohorts between boys and girls and between children from lower and higher income families. We also show
differences between children in low and higher SES schools.
Girls perform better in Reading and worse in Math and Science while children from higher income groups
are performing uniformly better than lower ones. We also find differences between low and higher SES schools,
although these are not significant. Nevertheless, it is still interesting to consider the impact of the program
across types of school because policy makers often target policies based on overall school composition and
because the peer structure is different. We start by considering how the program affected different SES type
schools and then we move to gender and family background differences.
16The 2012 results including the CLASS subsample are shown in Table A11 in appendix E. These show a decline in the impact ofthe program. However, this is fully explained by the fact that CLASS raised the performance of the control schools (non PAC) inwhich it was implemented, as we documented earlier. For further corroboration we also show in section 2 that the PAC interventionwas well implemented in 2012.
17The Education Quality Assurance Agency, responsible for the SIMCE, classifies schools into socioeconomic categories based onfour variables: mothers’ years of education, fathers’ years of education, monthly income reported by parents, and a vulnerabilityindex developed by the Ministry of Education. The first three variables are obtained from SIMCE parents questionnaires. Theaverage value among parents of the corresponding students grade is calculated for each of these variables. A cluster methodologyis applied with these four variables to classify schools (for each grade level in which SIMCE is applied) into five socioeconomiccategories: low, medium-low, medium, medium-high, high. Appendix Table A7 shows the distribution of Chilean schools accordingto their SES along with the distribution in the PAC sample of eligible schools.
14

Table 5: Differences in performance in the control group, by demographic characteristics and school SES
Reading Math ScienceGirls - Boys .219 -.07 -.094
[.19;.25] [-.11;-.03] [-.13;-.05]Low Income - Higher Income student -.109 -.145 -.217
[-.16;-.06] [-.21;-.08] [-.28;-.16]Low SES - Higher SES School -.054 -.011 -.069
[-.15;.05] [-.13;.1] [-.17;.03]Number of Clusters (Control Schools) 194 194 194Notes: Table shows pairwise differences in performance for students in the control group by demographic characteristics. SESvariables refer to the school Socio Economic Status as described in this section 4. Low Income is a dummy variable that takesvalue one if the student’s family monthly income is less than 300,000 Chilean pesos, the minimum wage in such country. 95%bootstrapped confidence intervals are shown in brackets.
Heterogeneity analysis can be particularly susceptible to false positives (i.e. finding significant results when
there are none) because the number of hypotheses being tested is multiplied. Thus for each case we compute
RW stepdown p-values for the entire set of hypotheses involved as specified below. Moreover, for this analysis
we pool the 2011 and the 2012 data (allowing for cohort effects) so as to increase statistical power.
4.4.1 Effects by School Socio-Economic status
Table 6: Impact of PAC on SIMCE by school socio economic status, with cohort fixed effects
Low SES Medium SES(1) (2) (3) (4) (5) (6)
Reading Math Science Reading Math ScienceRandomized into PAC .079 .051 .015 .197 .223 .191
[.03;.13] [-.01;.11] [-.04;.07] [.1;.3] [.11;.34] [.09;.29](.02) (.24) (.67) (.01) (.01) (.01)
Control Group Mean 243.04 235.82 234.50 248.37 237.84 239.14Control Group SD 50.12 47.29 44.85 51.61 46.43 44.54Number of Clusters 706 707 707 194 194 194Observations 43637 43544 43537 12480 12497 12492Notes: PAC stands for Plan Apoyo Compartido. Randomized into PAC is a dummy variable that takes value one if the studentattends a school that was randomly assigned to the treatment group and zero otherwise. SES variables refer to the school SocioEconomic Status as described in section 4. The effects shown are in units of the control group standard deviation (SD). 95%bootstrapped confidence intervals are shown in brackets. RW step down p-values allowing for all 6 hypotheses from the twosided tests are shown in parenthesis. All regressions include cohort fixed effects. Clustering at the school level. Schools thatimplemented CLASS are excluded from the 2012 sample.
Table 6 shows the effects of the PAC program on test scores in each of the two SES school groups. The main
conclusion from this table is that the program was most successful in schools with higher socioeconomic status
among eligible schools: in the Medium SES group the program increased test scores in Reading and Science by
about 0.20 of SD units and in Math by over 0.22 of SD units. All effects for the Medium SES schools are highly
significant with stepdown p-values of at most 0.01 adjusting for all six hypotheses being considered. These are
remarkable improvements. But even more remarkable from a policy perspective is the fact that the program
did not increase the performance in the Low SES schools by nearly as much, despite the fact that the baseline
performance is similar as shown above. In fact, we reject the hypothesis that the impact of PAC on SIMCE
scores are equal for kids in Low SES schools vs kids in Medium SES schools. We aggregate the test scores
of different subjects by obtaining the first principal component of test scores within each group and we reject
15

the hypothesis that PAC effects on aggregate test scores are equal for the Low and High SES groups (p-value
of 0.015). We also reject equality of coefficients when we compare each SIMCE subject separately instead of
taking the principal component (p-values of 0.056 for Reading, 0.022 for Math, and 0.006 for Science).18
4.4.2 Effects by gender and family income
We now turn to differences by gender and household income, both sources of disparities in performance. We
are particularly interested in how impacts vary between children of different SES backgrounds because it has
been a challenge to improve outcomes for the most deprived populations. In addition, gender disparities in
educational performance may partly explain male/female differences in labor market outcomes, including in
wages and informality rates.
Appendix Tables A17 and A18 show differences between boys and girls and low and higher income back-
ground students respectively. We find that overall there are no significant differences in impacts between boys
and girls and the estimates are almost the same. However, we find that the impacts for students from higher
income backgrounds are approximately twice those of the students from low income families: the reading score
improved by 0.167 SD units (p-value 0.01) for the higher income group and only 0.089 SD units (p-value 0.01) for
the lower group. The Math score improvements were 0.143 (p-value 0.01) and 0.074 (p-value 0.08) respectively.19
We now look at this in greater detail by considering gender and income background differences jointly.
The results are shown in Table 7 that pools the two years together and includes cohort fixed effects in the
regression.20 The table presents 12 impacts and the RW stepdown p-values provide significance levels accounting
for the fact we are considering these multiple hypotheses. We also report 95% confidence intervals.
The main conclusion from Table 7 is that the program produced significant impacts for the Reading scores for
boys from both income groups as well as for girls from a higher income backround. It also improved significantly
the Math performance of boys from the higher income group. Specifically, Reading scores for higher income
children improve by 0.135 SD units for boys (RW p-value 0.02) and 0.203 SD units for girls (RW p-value 0.01)
relative to kids in control schools. The Reading scores for boys in the lower income families improved by 0.10
SD units (RW p-value 0.01). We also find that a 0.18 SD units improvement in the Math scores for boys from
the higher income group (RW p-value 0.01). Given the adjustment for multiple hypotheses testing these are
particularly strong results. If we were using the conventional single hypothesis p-values many more of these
12 effects would have been classified as significant - for example see the individually significant improvements,
implied by the 95% confidence intervals, in Math for lower income boys and girls; however the chance that these
are false positives is quite high given the adjusted p-values.21
All in all, these results suggest that the PAC had a large and significant effect on the performance of fourth
grade boys and girls from relatively higher income backgrounds. This is clear evidence that the structured
18See Table A15 in appendix F for results including covariates in the specification.19p-values reported are RW stepdown for 6 hypotheses.20Once again, the 2012 sample exclude the contaminated CLASS sample. Table A13 in appendix E shows the 2012 results that
include the sample contaminated by the CLASS intervention.21Results from the estimation of the model with covariates are shown in tables A15 in the appendix and are very similar.
16

Table 7: Impact of PAC on SIMCE by students’ gender and income, with cohort fixed effects
GirlsLow Income High Income
Reading Math Science Reading Math ScienceRandomized into PAC .075 .067 .043 .203 .102 .065
[.02;.13] [0;.13] [-.01;.1] [.11;.3] [0;.2] [-.03;.15](.10) (.32) (.38) (.01) (.32) (.38)
Control Group Mean 250.34 233.87 232.23 253.93 242.73 242.24Control Group SD 48.33 45.62 43.01 49.22 46.44 45.88Number of Clusters 835 835 835 761 761 760Observations 19222 19245 19201 4494 4484 4493
BoysLow Income High Income
Reading Math Science Reading Math ScienceRandomized into PAC .101 .081 .048 .135 .179 .087
[.05;.15] [.02;.14] [-.01;.1] [.06;.21] [.1;.26] [.01;.17](.01) (.18) (.38) (.02) (.01) (.32)
Control Group Mean 239.1 238.10 237.45 246.75 243.96 246.09Control Group SD 51.18 48.04 45.42 52.93 48.68 46.59Number of Clusters 836 836 836 780 781 781Observations 19895 19873 19888 5098 5102 5083Notes: PAC stands for Plan Apoyo Compartido. Randomized into PAC is a dummy variable that takes value one if the studentattends a school that was randomly assigned to the treatment group and zero otherwise. Low Income is a dummy variablethat takes value one if the student’s family monthly income is less than 300,000 Chilean pesos, the minimum wage in suchcountry. High Income is a dummy that takes value one if Low Income= 0. The effects shown are in units of the control groupstandard deviation (SD). 95% bootstrapped confidence intervals are shown in brackets.RW step down p-values allowing for all6 hypotheses from the two sided tests are shown in parenthesis. All regressions include cohort fixed effects. Clustering at theschool level. Schools that implemented CLASS are excluded from the 2012 sample.
teaching intervention holds real promise. However, the effects on the lower income children are much smaller
and when we break them down by gender, the only significant effect is confined to Reading and to boys only.
Thus the program, improved quality of education overall and improved the performance of boys and girls by
the same amount, but did not reduce the disparities between socioeconomic groups. Thus, we need further
understanding on how to improve the performance of children from lower SES backgrounds. Noting that lower
parental income is associated with lower baseline achievement (as shown in Table 5), the difficulty of intervening
successfully for the most disadvantaged is consistent with much of the literature that shows complementarities
between investments in children and earlier achievement (Cunha, Heckman, and Schennach, 2010; Attanasio,
Meghir, and Nix, 2019b). It is also consistent with the results of other school interventions: for example
Machin, McNally, and Meghir (2010) show that an inner city school intervention in England improved most
the performance of the children with higher achievement, although they also showed that the largest effects
were observed in under resourced schools, which is not surprising. This raises the urgency of how to design
interventions for the most deprived populations and is likely to involve programs specifically targeted to address
developmental deficits of children in deprived populations from a very early age (Attanasio et al., 2014, 2019a;
Gertler et al., 2014).
In the next section we use the Classroom Assessment Scoring System (CLASS) to see whether the program
affected the way teachers and students interact.
17

5 The 2012 CLASS experiment and students’ learning
The small and growing literature that studies what characteristics of teachers matter the most for students’
learning has recently started to focus on the quality of within classroom teacher-students interactions (Araujo,
Carneiro, Cruz-Aguayo, and Schady, 2016). In this section we study how important are teacher-students
interactions to improve students’ learning in our context, and whether the PAC had any positive impact on
the quality of teacher-students interactions. As a preview of our results, we find that higher quality of teacher-
students interactions are associated with better test scores of low income students but are not correlated with
test scores of high income students. Moreover, we find that the PAC was not successful in improving teacher-
students interactions by this measure.
5.1 Measuring the quality of teacher-student interactions
The main instrument used in this paper to measure teacher-student interactions is the CLASS in its Upper
Elementary version (fourth to sixth grade, see Pianta, Mashburn, Downer, Hamre, and Justice (2008)). The
CLASS is an instrument used in the Education literature to measure the quality of teacher-student interactions,
as a proxy to teachers’ quality or effectiveness. To produce the CLASS measures, thoroughly trained coders
watch and analyze videotaped classes and assign a score for teacher-students interactions in 11 dimensions.
These dimensions can be grouped into three main domains: Emotional Support, Classroom Organization, and
Instructional Support.22 Coders look for very specific teachers’ behaviors in each dimension, which are well
described in the CLASS protocol that guides coders for their scoring.
There are several studies that link better student outcomes (both in learning and in the development of
socioemotional skills) with teachers’ scores in CLASS. Araujo, Carneiro, Cruz-Aguayo, and Schady (2016)
present a brief review of this literature for the US and perform a study for Kindergarten children in Ecuador.
However, to the best of our knowledge, no study in the literature analyses the effect of CLASS on test scores
for elementary school kids in developing countries.
In 2012, fourth grade teachers in participating schools were videotaped for four full lessons (see section 2.3
for details on the random selection of PAC schools to participate in the CLASS intervention). A total of 185
teachers were filmed following the CLASS protocol.23
The coding was done by 10 coders and a supervisor carefully trained and selected.24 Each of the four school
hours filmed per teacher was divided into 15-minute segments and one segment per hour was coded (for a total
22Emotional support includes the dimensions of Positive Climate, Negative Climate, Regard for Student Perspectives, and TeacherSensitivity; Classroom Organization includes the dimensions of Effective Behavior Management, Instructional Learning Formats,and Productivity; and Instructional Climate includes the dimensions of Language Modeling, Concept Development, Analysis andInquiry, and Quality of Feedback.
23The fieldwork and coding according to CLASS was coordinated and implemented by a team of the Centro de Politicas Compara-das de Educacion from the Universidad Diego Portales, which had already applied CLASS for the evaluation of another programin Chile, Un buen Comienzo (Yoshikawa, et al. 2013).
24The coders had to take a two-day training course provided by a Teachstone certified trainer, who also had the experience ofapplying CLASS to the Chilean context. After the course, coders took a four-hour online test (developed by Teachstone), that asksthe candidate to watch and code five segments of model videos. The candidate is approved when achieving a reliability rate of atleast 80% in all videos and at least in two of the videos the same reliability in all CLASS dimensions. Only the candidates thatpassed the test were certified to be CLASS coders in this evaluation. In addition, before starting the coding of the videos for thePAC evaluation, coders participated in another training course to adapt their knowledge of CLASS to the Chilean context. Thetraining included watching and coding videos of Chilean teachers, which were previously coded by experienced CLASS coders.
18

of 760 segments) in each of the CLASS dimensions. Following the CLASS protocol, the score on each dimension
was based on a 1 to 7 scale (”low” for scores 1-2, “medium” for scores 3-5, and “high” for scores 6-7). The final
CLASS scores for each domain consisted of the average across dimensions within the corresponding domain.
For the coding, videos were randomly assigned to the 10 certified coders. The coding process lasted five weeks.
During the first week of coding, 100% of the videos were double coded. The double-coding was expected to be
gradually reduced in the following weeks if reliability rates remained above 80%.25 Overall, 52% of the videos
were double coded, with an average reliability rate of 84.2%.26 This inter-coder reliability is comparable to
that found in other studies. For example, Araujo, Carneiro, Cruz-Aguayo, and Schady (2016), Brown, Jones,
LaRusso, and Aber (2010) report an inter-coder reliability rate of 83% for the 12% of the classroom observations
which were double-coded.27
5.2 CLASS, Teacher Performance and program effects
Table 8: Association between CLASS and SIMCE 2012, by school socio economic status
Low SES Medium SES(1) (2) (3) (4) (5) (6)
Reading Math Science Reading Math ScienceCLASS first principal component .085 .085 .083 .029 .011 .029
[.06;.11] [.06;.11] [.06;.11] [-.03;.08] [-.09;.09] [-.05;.09](.01) (.01) (.01) (.53) (.83) (.60)
SIMCE Score Mean 247.934 241.684 236.145 260.803 252.08 250.099SIMCE Score SD 51.984 48.961 47.098 48.858 45.899 44.11Number of Clusters 114 114 114 22 22 22Observations 3608 3572 3582 720 713 713Notes: SES variables refer to the school Socio Economic Status as described in section 4. The effects shown are in units of thecorresponding SIMCE test score standard deviation (SD). 95% bootstrapped confidence intervals are shown in brackets. Alloutcomes in this table are tested jointly to control for the Familywise Error Rate using the Romano-Wolf step down method.Step down p-values from the two sided test are shown in parenthesis. Clustering at the school level.
In Tables 8 and 9 we report the association between CLASS and SIMCE scores for the 2012 cohort by school
SES and in Table 9 by gender and student family icome. The effects reported are in SD units of the SIMCE
score for the corresponding demographic group and subject.
Table 8 shows that performance in CLASS is significantly and positively associated with the test scores of
students in the most disadvantage schools. Consistently, the most striking result from table 9 is the association
between better student-teacher interactions (reflected in a higher CLASS score) and the performance of low
income students. In effect, one additional standard deviation in the principal component of CLASS scores
is associated with a higher SIMCE test score for low income students of between 0.15 and 0.20 of SD units.
For higher income students, effects are smaller and in some cases insignificant. These results are potentially
important and consistent with the finding that teachers have a large causal impact on student performance (see
25Coding is considered reliable if the difference between the two coders’ score is less than 2 points for each CLASS dimension.26When a coding was not considered not reliable, a supervisor did a third coding, which was the final score attributed to that
teacher.27Araujo, Carneiro, Cruz-Aguayo, and Schady (2016) get a higher inter-coder reliability rate (93%) double-coding 100% of the
videos.
19

Table 9: Association between CLASS and SIMCE 2012, by students’ gender and income
GirlsLow Income High Income
(1) (2) (3) (4) (5) (6)Reading Math Science Reading Math Science
CLASS first principal component .158 .161 .143 .159 .028 .066[.09; .24] [ .09;.24] [.06;.21] [.08;.23 ] [-.08;.13] [ -.02;.15]
(.01) (.01) (.01) (.01) (.69) (.33)
SIMCE Score Mean 253.862 239.124 234.441 265.009 252.042 246.767SIMCE Score SD 49.475 47.855 44.145 47.939 49.585 45.668Number of Clusters 128 128 128 102 102 102Observations 1415 1404 1403 297 296 298
BoysLow Income High Income
(7) (8) (9) (10) (11) (12)Reading Math Science Reading Math Science
CLASS first principal component .187 .201 .194 .126 .105 .198[ .13;.24] [ .13;.26] [ .13;.26] [ .02;.24 ] [0;.22] [ .09;.33]
(.01) (.01) (.01) (.2) (.33) (.02)
SIMCE Score Mean 244.621 245.274 239.259 254.037 252.437 250.899SIMCE Score SD 53.15 48.746 49.304 50.999 49.422 46.764Number of Clusters 129 129 129 109 109 109Observations 1472 1461 1461 365 360 361Notes: Low Income is a dummy variable that takes value one if the student’s family monthly income is less than 300,000 Chileanpesos, the minimum wage in such country. High Income is a dummy that takes value one if Low Income= 0. The effects shownare in units of the corresponding SIMCE test score standard deviation (SD). 95% bootstrapped confidence intervals are shownin brackets. All outcomes in this table are tested jointly to control for the Familywise Error Rate using the Romano-Wolf stepdown method. Step down p-values from the two sided test are shown in parenthesis. Clustering at the school level.
Rivkin, Hanushek, and Kain (2005)). Taken at face value the results imply that moving a lower income student
from a bottom 2% of teachers to the top 2% can improve outcomes of low income students by close to one
standard deviation. There is no causality implied or presumed by these results, which may be entirely due to
sorting of better low-income students to better teachers (say because of more pro-active parents). However, it
does pose an interesting question as to whether improving interactions could actually lead to better performance
for low income students. We thus examine whether the CLASS score was affected by the program.
The impact of PAC on CLASS Table 10 shows the result of regressing CLASS scores on treatment
allocation and covariates. The results consistently suggest that the program has no significant effect on teacher-
classroom interactions in 2012. Given that CLASS is ranked based on interactions that may somehow be
discouraged by the PAC intervention, it may well be that CLASS is not a particularly good way of understanding
the mechanisms through which the PAC operated. It may also be that the improvements we observed relate to
practices not captured by CLASS, namely the more structured approach to lesson planning and the monitoring
of students. On the other hand the loss in sample size has meant that these estimates are not as precise as we
would desire. However, the association of CLASS scores with better performance of low income students suggests
that improving outcomes for deprived populations should focus more on how teachers interact with low income
students, as well as improving practices tested with this intervention. It is important to remember that, after
all, the scripted instruction intervention was successful; moreover, while the impacts are concentrated among
20

Table 10: Impact of PAC on CLASS, classroom level
Dependent variable: CLASS first principal component(1) (2) (3) (4)
OLS IV OLS IVRandomized into PAC -0.5274 -0.2361
[-1.128;.093] [-1.318;.107]
Implemented PAC -0.6153 -0.2697[-.878;.338] [-.992;.38]
Covariates No No Yes YesObservations 185 185 184 184Notes: PAC stands for Plan Apoyo Compartido. Randomized into PAC is a dummy variable that takes value one if the schoolwas randomly assigned to the treatment group and zero otherwise. Implemented PAC is a dummy variable that takes valueone if the school participated in PAC and zero otherwise. In columns (2) and (4) we instrument actual participation in PACwith the random assignment to PAC. Covariates include an indicator of the income group the classroom belongs to, the type ofadministration of the school (private or public), average SIMCE scores of the school for the period 2005-2009, general experienceof the teacher and the school principal, and tenure of the teacher and the principal in the school. 95% bootstrapped confidenceintervals are shown in brackets. Clustering at the School level.
the relatively better off, the population we are studying is already lower-income and attending underperforming
schools.
6 Discussion and Conclusions
Improving quality of education has proved to be a major policy challenge. While the quality of teachers seems
to be of central importance the policy question remains, particularly because it is not clear what constitutes
a priori a good teacher. One possibility is to consider more structured teaching methods, that define carefully
what teachers are supposed to do and monitor the progress of students throughout the year. This is the idea
underlying PAC (Plan Apoyo Compartido) the program we are analyzing in this paper and which was launched
in 2011 in Chile. Through standardized teaching material (class preparation) and through the support of internal
and external pedagogic teams, the program aimed at reducing the gap, as measured by the standardized test
SIMCE, between the poorest student population and the national average. The program was designed with a
gradual implementation, which implied that only half of eligible schools could be offered the program. These
were selected randomly, which forms the basis of our evaluation.
The results for the first 2011 cohort of implementation were encouraging implying overall improvements in
Reading. In the second year of the program, the effects increase for all subjects and become significant also
for Math and Science. When we break down the impacts by school socioeconomic status (SES) we find that
the positive effects of the program are concentrated among children in schools with higher SES. Moreover,
heterogeneous effects by students’ gender and family income reveal positive and significant effects particularly
for students originating from relatively higher income families. Importantly the effects are the same for boys
and girls. Overall, it seems that the program can improve outcomes, but it mainly improves results for the
relatively better off.28
In order to begin understanding what lies behind these results we used the CLASS system to record classroom
28PAC was discontinued in 2014 by the entering administration of the Ministry of Education.
21

sessions and score teacher-student interactions. CLASS is a well-documented instrument in the education
literature that uses a very rigorous protocol to score the ways students and teachers interact along various
dimensions (class organization, instructional support and emotional support, measured in 11 different sub-
dimensions). We find that CLASS scores are correlated with SIMCE results: a better CLASS score is associated
with better performing students, particularly among those from lower income backgrounds. No causality should
of course be attributed since it may well be the case that teachers interact better when they are interacting with
better performing students. We then examine whether the program shifted the CLASS score, by improving
teacher-student interactions and we find no effect at all. However, since CLASS altered the performance of the
control group it is hard to interpret this result: in other words the group that was observed via CLASS is not
comparable to the one that was not.
Despite the overall success of the program, the urgent question of how to improve outcomes of children
from the most deprived backgrounds remains. As much research seems to show the answer may lie in Early
Childhood Development Programs, which attempt to ensure that children from the most deprived backgrounds
have better cognitive development and access to improved opportunities from the earliest possible age, making
them potentially better placed to benefit from schooling.
22
References
F. Albornoz, M. V. Anauati, M. Furman, M. Luzuriaga, M. E. Podesta, and I. Taylor. Training to teach science:
experimental evidence from Argentina. Discussion Papers 2017-8, University of Nottingham, CREDIT, 2017.
M. C. Araujo, P. Carneiro, Y. Cruz-Aguayo, and N. Schady. A helping hand? Teacher quality and learning
outcomes in kindergarten. The Quarterly Journal of Economics, 131(3):1415–1453, 2016.
O. Attanasio, C. Fernandez, E. Fitzsimons, S. Grantham-McGregor, C. Meghir, and M. Rubio-Codina. Using the
infrastructure of a conditional cash transfer programme to deliver a scalable integrated early child development
programme in Colombia: a cluster randomised controlled trial. BMJ - British Medical Journal, 349:g5785,
2014.
O. Attanasio, S. Cattan, E. Fitzsimmons, C. Meghir, and M. R. Codina. Estimating the production function
for human capital: Results from a randomized controlled trial in colombia. American Economic Review,
forthcoming, 2019a.
O. Attanasio, C. Meghir, and E. Nix. Investments in children and the development of cognition and health in
india. NBER Working Paper No. 21740, 2019b.
M. Bassi, M. Mateo Dıaz, R. L. Blumberg, and A. Reynoso. Failing to notice? Uneven teachers’ attention to
boys and girls in the classroom. IZA Journal of Labor Economics, 7(1):9, Nov 2018.
J. L. Brown, S. M. Jones, M. D. LaRusso, and J. L. Aber. Improving classroom quality: teacher influences and
experimental impacts of the 4rs program. Journal of Educational Psychology, 102(1):153, 2010.
R. Chetty, J. N. Friedman, and J. E. Rockoff. Measuring the impacts of teachers I: evaluating bias in teacher
value-added estimates. American Economic Review, 104(9):2593–2632, 2014.
F. Cunha, J. J. Heckman, and S. M. Schennach. Estimating the technology of cognitive and noncognitive skill
formation. Econometrica, 78(3):883–931, 2010. doi: 10.3982/ECTA6551.
E. Duflo, R. Hanna, and S. P. Ryan. Incentives work: Getting teachers to come to school. American Economic
Review, 102(4):1241–78, June 2012.
A. J. Ganimian and R. J. Murnane. Improving educational outcomes in developing countries: Lessons from
rigorous impact evaluations. Working Paper 20284, National Bureau of Economic Research, July 2014.
P. Gertler, J. Heckman, R. Pinto, A. Zanolini, C. Vermeerch, S. Walker, S. Chang, and S. Grantham-McGregor.
Labor market returns to an early childhood stimulation intervention in Jamaica. Science, 344:998–1001, May
2014.
F. He, L. L. Linden, and M. MacLeod. A better way to teach children to read? Evidence from a randomized
controlled trial. Unpublished manuscript. New York, NY: Columbia University, 2009.
23

G. Imbens and J. Angrist. Identification and estimation of local average treatment effects. Econometrica, 62
(2):467–475, 1994.
P. A. Kirschner, J. Sweller, and R. E. Clark. Why minimal guidance during instruction does not work: an
analysis of the failure of constructivist, discovery, problem-based, experiential, and inquiry-based teaching.
Educational Psychologist, 41(2):75–86, 2006.
H. A. Landsberger. Hawthorne revisited. Distribution Center, NYS School of Industrial and Labor Relations,
Cornell University, Ithaca, New York 14850, 1958.
S. D. Levitt and J. A. List. Was there really a hawthorne effect at the hawthorne plant? An analysis of the
original illumination experiments. American Economic Journal: Applied Economics, 3(1):224–38, January
2011.
S. Machin, S. McNally, and C. Meghir. Resources and standards in urban schools. Journal of Human Capital,
4(4):365–393, 2010. doi: 10.1086/658634.
OECD. The ABC of gender equality in education: aptitude, behaviour, confidence. Paris, France: OECD
Publishing, 2015.
R. C. Pianta, A. J. Mashburn, J. T. Downer, B. K. Hamre, and L. Justice. Effects of web mediated professional
development resources on teacher child interactions in pre kindergarten classrooms. Early Childhood Research
Quarterly, 23(4):431–451, 2008.
S. G. Rivkin, E. A. Hanushek, and J. F. Kain. Teachers, schools, and academic achievement. Econometrica, 73
(2):417–458, 2005.
J. P. Romano and M. Wolf. Stepwise multiple testing as formalized data snooping. Econometrica, 73(4):
1237–1282, 2005.
R. E. Slavin, C. Lake, B. Chambers, A. Cheung, and S. Davis. Effective reading programs for the elementary
grades: a best-evidence synthesis. Review of Educational Research, 79(4):1397–1466, 2009.
24

Appendix A Evidence on implementation of PAC
Table A1: Correlation between participation in PAC and PAC dimensions, classroom level analysis
(1) (2) (3) (4) (5)Class structure Reflective thinking Norms and schedule Evaluation Use of manual
Implemented PAC 0.0129 0.0369 0.0582∗∗ 0.0279 0.2300∗∗∗
(0.0238) (0.0291) (0.0225) (0.0281) (0.0733)
Constant 0.4589∗∗∗ 0.5397∗∗∗ 0.7390∗∗∗ 0.8730∗∗∗ 0.1619∗∗∗
(0.0171) (0.0175) (0.0153) (0.0200) (0.0354)Observations 179 179 179 179 179Notes: PAC stands for Plan Apoyo Compartido. Implemented PAC is a dummy variable that takes value one if the schoolparticipated in PAC and zero otherwise. ∗∗Variable significant at the 5% level. ∗∗∗Variable significant at the 1% level. Clusteringat the School level.
Table A2: Correlation between participation in PAC and PAC components, school level analysis
(1) (2) (3) (4) (5)Annual planning performed by Support to teachers
ELE classroom FeedbackPAC team ELE team Teachers observations to teachers
Implemented PAC 0.2546∗∗∗ 0.1888∗∗ -0.1830∗∗ 1.1593∗∗∗ 1.1176∗∗∗
(0.0641) (0.0858) (0.0810) (0.3991) (0.3826)
Constant 0.0385∗ 0.3974∗∗∗ 0.7692∗∗∗ 3.3924∗∗∗ 3.6582∗∗∗
(0.0219) (0.0558) (0.0481) (0.2442) (0.2439)Observations 136 136 136 137 137Notes: PAC stands for Plan Apoyo Compartido. ELE refers to the Education Leadership Team (consistingof the school principal, the head of the technical and pedagogic office of the school, and two distinguishedteachers, as described in section 2). Implemented PAC is a dummy variable that takes value one if theschool participated in PAC and zero otherwise. ∗Variable significant at the 10% level. ∗∗Variable significantat the 5% level. ∗∗∗Variable significant at the 1% level. Robust standard errors in parenthesis.
Appendix B Summary Statistics
The names of columns indicate the set of students over which summary statistics are calculated.
Columns labeled Reading, Math, and Science test takers indicate the pool of students that took each of the
corresponding subject tests. This corresponds to the post attrition sample, since for each test, there is a small
set of students that did not take the test (we discuss the section 2.5).
Sub-columns labeled PAC=0 and PAC=1 refer to treatment status. PAC is a dummy variable that takes
value one if the student goes to a school that was invited to participate in the program through the randomiza-
tion, and zero otherwise. In what follows, we refer to the set of students such that PAC=0 as the control group
and to the set of students such that PAC=1 as the treatment group.
In turn, the table is divided in three panels, 2011, 2012-excluding CLASS sample, and 2012, indicating the
fourth grade cohorts considered in this paper.
The names of rows indicate the variable for which we show summary statistics.
SIMCE scores (Reading, Math, and Science) refer to the grade obtained by students in the SIMCE subject
tests.
25

Baseline characteristics indicate characteristics of the students that do not change because of treatment.
They include student demographic characteristics and education of parents. Student demographics are Female
(a dummy variable that takes value one if the student is a female and zero otherwise), Low income (a dummy
variable that takes value one if the student’s family monthly income is less than 300,000 Chilean pesos, or
around 600 dollars at that time),29 Nuclear, Extended, and Other family (three dummies that indicate the
family structure of the student), and Nbr years failed (a count variable that captures the number of primary
school years the student had to retake previous to the forth grade). Mother’s and father’s education refer to
the highest education level reached by the student’s mother and father. These include No education, Incomplete
primary, Primary, Incomplete high school, High school, Incomplete college, and college.
29SIMCE includes a 1 to 9 scale for the income reported by the parents in the questionnaire that they complete. We consider“low-income” those reporting in categories 1 to 4. It is important to note, tough, that students in our sample belong mainly tolow-middle income families in Chile.
26

Table A3: Summary statistics - post attrition samples
Reading test takers Math test takers Science test takersPAC=0 PAC=1 PAC=0 PAC=1 PAC=0 PAC=1
Obs. Mean SD Obs. Mean SD Obs. Mean SD Obs. Mean SD Obs. Mean SD Obs. Mean SDPanel A: 2011
SIMCE scores:Reading 6886 245 50 23850 248 50Math 6903 236 47 23828 238 48Science 6911 237 44 23854 238 44Baseline characteristics:Students demographicsFemale 6554 .472 .499 22861 .484 .5 6653 .473 .499 23152 .484 .5 6660 .473 .499 23162 .484 .5Low income 6219 .841 .366 21470 .813 .39 6235 .841 .366 21490 .813 .39 6244 .841 .366 21502 .813 .39Nuclear family 6886 .613 .487 23850 .617 .486 6903 .613 .487 23828 .619 .486 6911 .613 .487 23854 .617 .486Extended family 6886 .244 .43 23850 .239 .426 6903 .244 .43 23828 .239 .426 6911 .244 .43 23854 .239 .427Other family 6886 .143 .35 23850 .144 .352 6903 .143 .35 23828 .143 .35 6911 .143 .35 23854 .143 .35Nbr years failed 6187 .238 .527 21353 .232 .531 6202 .239 .528 21367 .232 .531 6211 .239 .528 21387 .232 .531Mother’s educationNo education 6201 .007 .086 21352 .006 .078 6215 .007 .086 21374 .006 .077 6225 .008 .087 21387 .006 .078Inc. primary 6201 .179 .383 21352 .174 .379 6215 .178 .383 21374 .174 .379 6225 .178 .383 21387 .174 .379Primary 6201 .17 .375 21352 .164 .37 6215 .17 .375 21374 .164 .37 6225 .169 .375 21387 .164 .37Inc. high school 6201 .235 .424 21352 .218 .413 6215 .235 .424 21374 .218 .413 6225 .236 .425 21387 .219 .413High school 6201 .324 .468 21352 .341 .474 6215 .324 .468 21374 .341 .474 6225 .324 .468 21387 .341 .474Inc. college 6201 .034 .182 21352 .038 .191 6215 .034 .182 21374 .038 .191 6225 .034 .181 21387 .037 .19College 6201 .051 .22 21352 .059 .235 6215 .051 .22 21374 .059 .235 6225 .051 .22 21387 .059 .235Father’s educationNo education 5992 .008 .089 20577 .008 .089 6006 .008 .09 20597 .008 .089 6013 .008 .089 20611 .008 .09Inc. primary 5992 .17 .376 20577 .158 .364 6006 .17 .376 20597 .157 .364 6013 .17 .376 20611 .157 .364Inc. primary 5992 .16 .366 20577 .162 .368 6006 .16 .367 20597 .161 .368 6013 .16 .366 20611 .162 .368Inc. high school 5992 .248 .432 20577 .23 .421 6006 .248 .432 20597 .23 .421 6013 .247 .431 20611 .23 .421High school 5992 .329 .47 20577 .345 .475 6006 .328 .469 20597 .344 .475 6013 .328 .47 20611 .344 .475Inc. college 5992 .036 .187 20577 .043 .202 6006 .036 .187 20597 .043 .203 6013 .036 .187 20611 .043 .203College 5992 .05 .217 20577 .056 .229 6006 .05 .219 20597 .056 .23 6013 .05 .218 20611 .056 .229
Panel B: 2012-excluding CLASS sampleSIMCE scores:Reading 4685 242 51 20772 249 52Math 4658 237 47 20727 242 49Science 4654 233 46 20685 237 46Baseline characteristics:
27

Table A3: Summary statistics - post attrition samples (continued)
Reading test takers Math test takers Science test takersPAC=0 PAC=1 PAC=0 PAC=1 PAC=0 PAC=1
Obs. Mean SD Obs. Mean SD Obs. Mean SD Obs. Mean SD Obs. Mean SD Obs. Mean SDStudents demographicsFemale 4412 .481 .5 20342 .481 .5 4293 .484 .5 19900 .483 .5 4290 .483 .5 19848 .482 .5Low income 3946 .792 .406 18045 .779 .415 3960 .793 .405 18119 .779 .415 3954 .793 .405 18067 .78 .415Nuclear family 4685 .563 .496 20772 .572 .495 4658 .569 .495 20727 .576 .494 4654 .569 .495 20685 .576 .494Extended family 4685 .234 .423 20772 .25 .433 4658 .237 .425 20727 .252 .434 4654 .236 .425 20685 .252 .434Other family 4685 .203 .402 20772 .177 .382 4658 .195 .396 20727 .172 .377 4654 .195 .396 20685 .172 .378Nbr years failed 3947 1.25 .592 18055 1.217 .561 3962 1.253 .595 18129 1.218 .561 3956 1.251 .593 18076 1.218 .56Mother’s educationNo education 3836 .007 .08 17474 .006 .075 3852 .007 .082 17554 .006 .075 3847 .006 .08 17505 .006 .075Inc. primary 3836 .178 .383 17474 .163 .37 3852 .179 .384 17554 .164 .37 3847 .179 .383 17505 .163 .369Primary 3836 .173 .379 17474 .169 .374 3852 .175 .38 17554 .168 .374 3847 .174 .379 17505 .169 .375Inc. high school 3836 .217 .412 17474 .212 .408 3852 .217 .412 17554 .211 .408 3847 .217 .412 17505 .211 .408High school 3836 .333 .471 17474 .351 .477 3852 .331 .471 17554 .35 .477 3847 .332 .471 17505 .35 .477Inc. college 3836 .038 .191 17474 .04 .197 3852 .038 .192 17554 .04 .197 3847 .038 .192 17505 .04 .196College 3836 .054 .225 17474 .06 .237 3852 .054 .226 17554 .06 .238 3847 .054 .225 17505 .061 .239Father’s educationNo education 3675 .01 .097 16720 .007 .083 3686 .009 .097 16804 .007 .083 3682 .01 .097 16756 .007 .083Inc. primary 3675 .155 .362 16720 .158 .364 3686 .155 .362 16804 .158 .364 3682 .155 .362 16756 .157 .364Primary 3675 .176 .381 16720 .162 .368 3686 .176 .381 16804 .162 .369 3682 .174 .379 16756 .162 .369Inc. high school 3675 .221 .415 16720 .218 .413 3686 .221 .415 16804 .218 .413 3682 .221 .415 16756 .219 .414High school 3675 .351 .477 16720 .352 .478 3686 .35 .477 16804 .351 .477 3682 .351 .477 16756 .35 .477Inc. college 3675 .037 .189 16720 .044 .206 3686 .037 .189 16804 .045 .206 3682 .037 .189 16756 .045 .207College 3675 .051 .22 16720 .06 .237 3686 .051 .221 16804 .059 .236 3682 .051 .22 16756 .06 .237
Panel C: 2012SIMCE scores:Reading 7141 246 51 23353 248 52Math 7095 239 47 23273 242 49Social Science 7105 235 47 23226 237 46Baseline characteristics:Students demographicsFemale 6773 .481 .5 22810 .481 .5 6572 .483 .5 22303 .482 .5 6580 .483 .5 22245 .482 .5Low income 6048 .8 .4 20229 .783 .412 6065 .801 .399 20292 .783 .412 6063 .801 .399 20236 .783 .412Nuclear family 7141 .566 .496 23353 .572 .495 7095 .572 .495 23273 .576 .494 7105 .571 .495 23226 .575 .494Extended family 7141 .235 .424 23353 .248 .432 7095 .237 .425 23273 .25 .433 7105 .236 .425 23226 .249 .433Other family 7141 .2 .4 23353 .18 .385 7095 .191 .393 23273 .175 .38 7105 .193 .395 23226 .175 .38
28

Table A3: Summary statistics - post attrition samples (continued)
Reading test takers Math test takers Science test takersPAC=0 PAC=1 PAC=0 PAC=1 PAC=0 PAC=1
Obs. Mean SD Obs. Mean SD Obs. Mean SD Obs. Mean SD Obs. Mean SD Obs. Mean SDNbr years failed 6050 1.243 .588 20242 1.219 .565 6068 1.245 .593 20305 1.22 .564 6066 1.243 .592 20248 1.219 .564Mother’s educationNo education 5873 .006 .076 19580 .006 .075 5894 .006 .077 19648 .006 .075 5891 .006 .076 19594 .006 .075Inc. primary 5873 .178 .383 19580 .166 .372 5894 .18 .384 19648 .167 .373 5891 .179 .384 19594 .166 .372Primary 5873 .173 .378 19580 .169 .375 5894 .173 .378 19648 .169 .375 5891 .172 .378 19594 .17 .376Inc. high school 5873 .214 .41 19580 .213 .409 5894 .214 .41 19648 .213 .41 5891 .214 .41 19594 .213 .409High school 5873 .338 .473 19580 .348 .476 5894 .336 .472 19648 .348 .476 5891 .337 .473 19594 .348 .476Inc. college 5873 .036 .187 19580 .039 .193 5894 .036 .187 19648 .039 .193 5891 .036 .187 19594 .039 .192College 5873 .055 .228 19580 .058 .235 5894 .055 .228 19648 .059 .235 5891 .055 .228 19594 .059 .236Father’s educationNo education 5630 .009 .092 18745 .007 .085 5647 .009 .092 18820 .007 .085 5644 .009 .092 18768 .007 .085Inc. primary 5630 .153 .36 18745 .158 .365 5647 .153 .36 18820 .158 .365 5644 .154 .361 18768 .158 .364Inc. primary 5630 .172 .377 18745 .165 .371 5647 .172 .377 18820 .165 .371 5644 .17 .376 18768 .165 .372Inc. high school 5630 .222 .416 18745 .217 .412 5647 .222 .416 18820 .217 .412 5644 .222 .416 18768 .218 .413High school 5630 .357 .479 18745 .351 .477 5647 .356 .479 18820 .35 .477 5644 .357 .479 18768 .35 .477Inc. college 5630 .035 .183 18745 .043 .203 5647 .035 .184 18820 .043 .204 5644 .035 .184 18768 .043 .204College 5630 .054 .225 18745 .058 .234 5647 .054 .226 18820 .058 .234 5644 .054 .225 18768 .059 .235
29

Table A4: Randomization check, school level
PAC=1 PAC=0 Diff. in meansObs Mean SD Obs Mean SD Stat. p-val
Low SES 651 .158 .365 197 .162 .37 -.004 .888Medium-Low SES 651 .631 .483 197 .675 .47 -.044 .254Medium SES 651 .21 .408 197 .162 .37 .048 .119Public 648 .645 .479 194 .67 .471 -.025 .518Avg SIMCE 2005-2009 651 228.37 11.418 197 227.406 11.573 .964 .304Avg SIMCE Reading 2010 648 249.552 18.435 195 248.872 17.933 .681 .644Avg SIMCE Math 2010 648 227.755 19.303 195 226.174 17.069 1.58 .272
Joint F-test p-value: 0.657Notes: PAC=1 and PAC=0 denote the treatment and control groups, respectively. SES variables refer to the school SocioEconomic Status as described in section 4; Public is a dummy variable that takes value 1 if the school depends upon themunicipality; Avg. SIMCE refers to the average score in the SIMCE tests.
Table A5: Randomization check, student level
Pre attrition samplePost attrition samples
Reading test takers Math test takers Science test takersStat. p-val Stat. p-val Stat. p-val Stat. p-val
Panel A: 2011Balancing of attrition rates and baseline characteristics (E(PAC=1) - E(PAC=0))Proportion of attritorsReading -.007 .258 n.a. n.a. n.a. n.a. n.a. n.a.Math .001 .67 n.a. n.a. n.a. n.a. n.a. n.a.Science .001 .784 n.a. n.a. n.a. n.a. n.a. n.a.Baseline characteristics:Students demographicsFemale .003 .758 .004 .688 .003 .709 .003 .728Low income -.02 .048 -.019 .052 -.019 .052 -.019 .052Nuclear family .012 .324 .01 .383 .013 .269 .011 .355Extended family -.009 .284 -.012 .182 -.01 .241 -.009 .273Other family -.003 .786 .001 .88 -.003 .737 -.002 .851Nbr years failed -.01 .497 -.009 .539 -.01 .473 -.011 .464Mother’s educationNo education -.001 .578 -.001 .582 -.001 .575 -.001 .553Inc. primary .005 .567 .006 .518 .005 .604 .005 .596Primary -.004 .597 -.004 .559 -.004 .559 -.004 .597Inc. high school -.022 .007 -.022 .006 -.022 .008 -.022 .007High school .017 .131 .017 .127 .018 .12 .017 .129Inc. college 0 .923 0 .922 0 .891 .001 .858College .004 .363 .004 .375 .004 .372 .004 .358Father’s educationNo education -.001 .661 -.001 .774 -.001 .582 -.001 .694Inc. primary -.001 .92 0 .973 -.001 .901 -.001 .887Inc. primary .006 .446 .006 .437 .006 .462 .007 .414Inc. high school -.02 .015 -.02 .012 -.021 .012 -.02 .016High school .009 .372 .009 .38 .011 .307 .009 .376Inc. college .005 .186 .005 .237 .005 .188 .005 .19College .001 .854 .001 .831 .001 .865 .001 .904Test of joint significance of baseline characteristics: F-statistic (p-val)
1.18 (0.277) 1.18 (0.272) 1.17 (0.282) 1.15 (0.305)Panel B: 2012-excluding CLASS sample
Balancing of attrition rates and baseline characteristics (E(PAC=1) - E(PAC=0))Proportion of attritorsReading -.01 .309 n.a. n.a. n.a. n.a. n.a. n.a.Math -.014 .172 n.a. n.a. n.a. n.a. n.a. n.a.Science -.013 .201 n.a. n.a. n.a. n.a. n.a. n.a.
30

Table A5: Randomization check, student level (continued)
Pre attrition samplePost attrition samples
Reading test takers Math test takers Science test takersStat. p-val Stat. p-val Stat. p-val Stat. p-val
Baseline characteristics:Students demographicsFemale -.006 .565 -.005 .603 -.01 .371 -.008 .456Low income -.001 .935 -.002 .854 -.003 .831 -.003 .796Nuclear family .016 .298 .013 .424 .01 .531 .01 .519Extended family .006 .567 .004 .703 .005 .694 .004 .75Other family -.022 .215 -.017 .315 -.014 .394 -.014 .414Nbr years failed -.036 .076 -.032 .102 -.034 .082 -.032 .098Mother’s educationNo education 0 .908 -.001 .638 -.001 .604 -.001 .71Inc. primary -.006 .561 -.008 .453 -.009 .434 -.008 .45Primary -.002 .807 0 .995 -.002 .837 0 .999Inc. high school -.004 .671 -.005 .648 -.005 .647 -.006 .584High school .012 .347 .011 .387 .014 .296 .012 .372Inc. college -.003 .494 -.002 .699 -.002 .706 -.002 .665College .004 .478 .004 .498 .004 .516 .005 .424Father’s educationNo education -.003 .155 -.003 .173 -.003 .181 -.003 .184Inc. primary .011 .282 .008 .427 .008 .416 .007 .49Inc. primary -.014 .146 -.017 .076 -.017 .083 -.015 .125Inc. high school -.005 .636 -.001 .923 -.001 .919 0 .965High school .001 .927 .001 .912 .002 .898 0 .989Inc. college .005 .272 .005 .226 .005 .267 .005 .265College .005 .36 .006 .288 .006 .31 .006 .29Test of joint significance of baseline characteristics: F-statistic (p-val)
0.98 (0.483) 0.97 (0.496) 0.94 (0.523) 0.9 (0.575)Panel C: 2012
Balancing of attrition rates and baseline characteristics (E(PAC=1) - E(PAC=0))Proportion of attritorsReading -.01 .213 n.a. n.a. n.a. n.a. n.a. n.a.Math -.012 .125 n.a. n.a. n.a. n.a. n.a. n.a.Science -.01 .231 n.a. n.a. n.a. n.a. n.a. n.a.Baseline characteristics:Students demographicsFemale -.001 .909 0 .987 -.003 .771 -.002 .827Low income -.005 .652 -.006 .552 -.007 .492 -.007 .515Nuclear family .014 .299 .011 .405 .009 .515 .009 .498Extended family .003 .687 .001 .925 .002 .87 .001 .886Other family -.017 .251 -.012 .41 -.01 .481 -.01 .476Nbr years failed -.024 .123 -.019 .216 -.022 .155 -.02 .186Mother’s educationNo education .001 .441 0 .771 0 .798 .001 .695Inc. primary -.003 .783 -.004 .655 -.005 .579 -.005 .591Primary .001 .844 .003 .658 .003 .722 .004 .621Inc. high school -.001 .934 0 .973 0 .977 -.001 .95High school .004 .675 .003 .8 .005 .66 .003 .777Inc. college -.004 .3 -.003 .439 -.003 .456 -.003 .44College .001 .922 .001 .908 .001 .897 .001 .783Father’s educationNo education -.002 .338 -.002 .351 -.002 .327 -.002 .361Inc. primary .015 .061 .013 .122 .012 .138 .011 .172Inc. primary -.003 .692 -.005 .512 -.005 .55 -.003 .67Inc. high school -.006 .447 -.003 .707 -.002 .777 -.002 .81High school -.009 .355 -.01 .334 -.01 .339 -.011 .284Inc. college .005 .21 .006 .104 .005 .136 .006 .129College 0 .945 .001 .83 .001 .886 .001 .836
31

Table A5: Randomization check, student level (continued)
Pre attrition samplePost attrition samples
Reading test takers Math test takers Science test takersStat. p-val Stat. p-val Stat. p-val Stat. p-val
Test of joint significance of baseline characteristics: F-statistic (p-val)1.19 (0.268) 1.17 (0.282) 1.15 (0.300) 1.12 (0.332)
Notes: Pre attrition sample refers to the universe of students in the fourth grade. Post attrition sample refers to the sub sampleof students that took each of the subject SIMCE tests. The statistic (Stat.) reported in the balancing exercises is E(PAC=1) -E(PAC=0), that is, the difference in means between the treatment and the control groups. The statistic (Stat.) reported in thetest of joint significance exercises is the F-test. Baseline characteristics include student demographics and Mother’s and father’seducation. Student demographics are Female (a dummy variable that takes value one if the student is a female and zero otherwise),Low income (a dummy variable that takes value one if the student’s family monthly income is less than 300,000 Chilean pesos,the minimum wage in such country), Nuclear, Extended, and Other family (three dummies that indicate the family structure ofthe student), and Nbr years failed (a count variable that captures the number of primary school years the student had to retakeprevious to the forth grade). Mother’s and father’s education refer to the highest education level reached by the student’s motherand father. These include No education, Incomplete primary, Primary, Incomplete high school, High school, Incomplete college,and college.
Table A6: Balancing of pre-treatment characteristics by gender, sample of test takers
Girls BoysReading Math Science Reading Math Science
Stat. p-val Stat. p-val Stat. p-val Stat. p-val Stat. p-val Stat. p-val
Panel A: 2011Students demographicsLow income -.025 .028 -.024 .034 -.024 .03 -.012 .326 -.012 .298 -.012 .313Nuclear family .005 .701 .013 .365 .011 .424 .009 .545 .008 .604 .006 .688Extended family -.005 .666 -.005 .665 -.003 .799 -.02 .091 -.017 .138 -.017 .142Other family -.001 .958 -.008 .467 -.008 .442 .011 .219 .01 .361 .011 .278Nbr years failed .005 .757 .005 .765 .004 .789 -.026 .167 -.029 .136 -.029 .131Mother’s educationNo education .002 .384 .002 .326 .002 .377 -.004 .122 -.004 .1 -.004 .106Inc. primary .008 .505 .008 .471 .008 .474 0 .99 -.003 .796 -.003 .812Primary -.007 .498 -.007 .498 -.007 .484 0 .988 0 .987 .001 .889Inc. high school -.029 .009 -.028 .013 -.03 .008 -.015 .198 -.014 .202 -.014 .227High school .022 .096 .02 .134 .021 .116 .014 .338 .017 .244 .015 .298Inc. college 0 .96 0 .98 .001 .779 0 .98 0 .978 -.001 .912College .005 .488 .004 .512 .005 .487 .004 .495 .004 .474 .004 .462Father’s educationNo education 0 .902 0 .926 0 .877 -.002 .443 -.003 .315 -.003 .381Inc. primary .001 .941 .001 .927 .001 .96 -.001 .945 -.002 .859 -.002 .858Inc. primary .013 .247 .013 .234 .014 .214 -.001 .96 -.001 .899 -.001 .945Inc. high school -.028 .009 -.028 .008 -.029 .008 -.011 .324 -.011 .316 -.009 .418High school .007 .626 .007 .638 .007 .624 .01 .436 .013 .312 .01 .424Inc. college -.001 .853 -.001 .908 -.001 .925 .009 .063 .009 .05 .009 .053College .008 .124 .008 .138 .008 .143 -.005 .528 -.005 .524 -.005 .489
Panel B: 2012Students demographicsLow income 0 .991 -.001 .968 0 .983 -.004 .784 -.005 .774 -.006 .699Nuclear family .02 .275 .021 .25 .02 .253 -.005 .784 -.011 .499 -.009 .597Extended family -.019 .174 -.021 .149 -.021 .155 .017 .218 .018 .213 .016 .267Other family 0 .99 0 .997 0 .977 -.013 .441 -.007 .655 -.007 .641Nbr years failed -.037 .084 -.037 .088 -.035 .099 -.03 .233 -.032 .206 -.03 .228Mother’s educationNo education .001 .782 .001 .748 .001 .791 -.002 .538 -.002 .517 -.001 .66Inc. primary -.011 .467 -.011 .492 -.01 .541 -.004 .738 -.005 .697 -.004 .732Primary .001 .942 -.001 .917 0 .97 -.008 .511 -.008 .498 -.007 .579Inc. high school -.016 .255 -.014 .293 -.017 .225 .002 .906 0 .997 0 .976
32
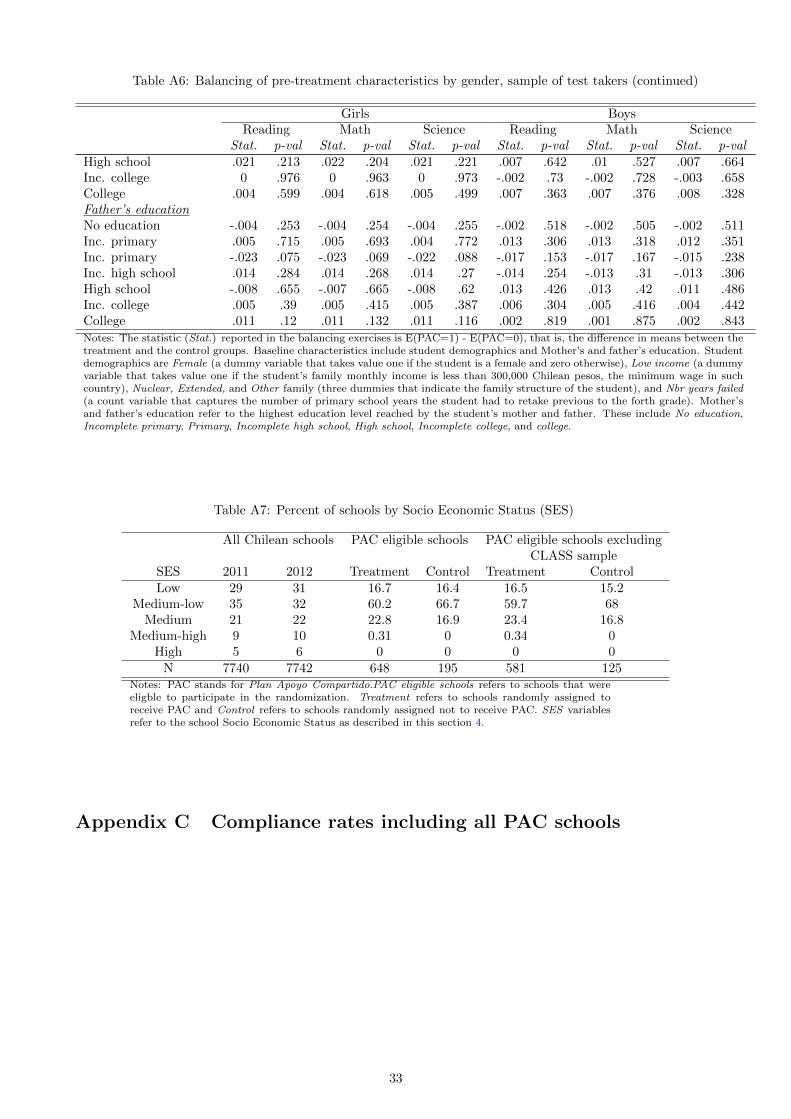
Table A6: Balancing of pre-treatment characteristics by gender, sample of test takers (continued)
Girls BoysReading Math Science Reading Math Science
Stat. p-val Stat. p-val Stat. p-val Stat. p-val Stat. p-val Stat. p-valHigh school .021 .213 .022 .204 .021 .221 .007 .642 .01 .527 .007 .664Inc. college 0 .976 0 .963 0 .973 -.002 .73 -.002 .728 -.003 .658College .004 .599 .004 .618 .005 .499 .007 .363 .007 .376 .008 .328Father’s educationNo education -.004 .253 -.004 .254 -.004 .255 -.002 .518 -.002 .505 -.002 .511Inc. primary .005 .715 .005 .693 .004 .772 .013 .306 .013 .318 .012 .351Inc. primary -.023 .075 -.023 .069 -.022 .088 -.017 .153 -.017 .167 -.015 .238Inc. high school .014 .284 .014 .268 .014 .27 -.014 .254 -.013 .31 -.013 .306High school -.008 .655 -.007 .665 -.008 .62 .013 .426 .013 .42 .011 .486Inc. college .005 .39 .005 .415 .005 .387 .006 .304 .005 .416 .004 .442College .011 .12 .011 .132 .011 .116 .002 .819 .001 .875 .002 .843Notes: The statistic (Stat.) reported in the balancing exercises is E(PAC=1) - E(PAC=0), that is, the difference in means between thetreatment and the control groups. Baseline characteristics include student demographics and Mother’s and father’s education. Studentdemographics are Female (a dummy variable that takes value one if the student is a female and zero otherwise), Low income (a dummyvariable that takes value one if the student’s family monthly income is less than 300,000 Chilean pesos, the minimum wage in suchcountry), Nuclear, Extended, and Other family (three dummies that indicate the family structure of the student), and Nbr years failed(a count variable that captures the number of primary school years the student had to retake previous to the forth grade). Mother’sand father’s education refer to the highest education level reached by the student’s mother and father. These include No education,Incomplete primary, Primary, Incomplete high school, High school, Incomplete college, and college.
Table A7: Percent of schools by Socio Economic Status (SES)
All Chilean schools PAC eligible schools PAC eligible schools excludingCLASS sample
SES 2011 2012 Treatment Control Treatment ControlLow 29 31 16.7 16.4 16.5 15.2
Medium-low 35 32 60.2 66.7 59.7 68Medium 21 22 22.8 16.9 23.4 16.8
Medium-high 9 10 0.31 0 0.34 0High 5 6 0 0 0 0
N 7740 7742 648 195 581 125Notes: PAC stands for Plan Apoyo Compartido.PAC eligible schools refers to schools that wereeligble to participate in the randomization. Treatment refers to schools randomly assigned toreceive PAC and Control refers to schools randomly assigned not to receive PAC. SES variablesrefer to the school Socio Economic Status as described in this section 4.
Appendix C Compliance rates including all PAC schools
33

Table A8: Randomization and implementation, school level
All schools 2011 sample 2012 sampleImplemented PAC
No Yes No Yes No Yes
Randomized into PACNo 176 19 194 0 176 19Yes 149 499 155 492 179 465
Notes: PAC stands for Plan Apoyo Compartido. All schools refers to the 843 schoolsthat were considered eligible by the program and considered in the program evalua-tion at some point. The 2011 sample consists of the 841 schools that were originallyincluded in the program evaluation sample. The 2012 sample consists of the 839schools that remained in the program evaluation sample in the second year. Imple-mented PAC is a dummy variable that takes value one if the school participated inPAC and zero otherwise. Randomized into PAC is a dummy variable that takes valueone if the school that randomly assigned to the treatment group and zero otherwise.
Table A9: First stage. Dependent variable: Implemented PAC.
2011All Girls Boys
Low Income High Income Low Income High Income(1) (2) (3) (4) (5)
Randomized into PAC 0.761∗∗∗ 0.775∗∗∗ 0.721∗∗∗ 0.769∗∗∗ 0.745∗∗∗
[.734;.788] [.746;.803] [.68;.761] [.707;.782] [.74;.797]Observations 31384 10938 2330 11492 2581
2012All Girls Boys
Low Income High Income Low Income High Income(7) (8) (9) (10) (11)
Randomized into PAC 0.624∗∗∗ 0.634∗∗∗ 0.611∗∗∗ 0.636∗∗∗ 0.629∗∗∗
[.577;.668] [.586;.679] [.555;.663] [.575;.681] [.585;.687]Observations 35835 10479 2587 10709 3043Notes: PAC stands for Plan Apoyo Compartido. The dependent variable is Implemented PAC, a dummy variable that takesvalue one if the student attends a school that participated in PAC and zero otherwise. Randomized into PAC is a dummyvariable that takes value one if the student attends a school that was randomly assigned to the treatment group and zerootherwise. All refers to all students pooled together. Low Income is a dummy variable that takes value one if the student’sfamily monthly income is less than 300,000 Chilean pesos, the minimum wage in such country. High Income is a dummy thattakes value one if Low Income= 0. 95% bootstrapped confidence intervals are shown in brackets. ∗∗∗Variable significant at the1% level. Clustering at the school level.
Appendix D The impact of participating in CLASS on SIMCE
Table A10: Impact of participation in CLASS on SIMCE 2012
PAC control group PAC treatment group(1) (2) (3) (4) (5) (6)
Reading Math Science Reading Math ScienceIn CLASS sample .229 .18 .206 -.043 -.014 -.024
[.14;.33] [.08;.3] [.11;.32] [-.14;.06] [-.12;.1] [-.12;.07]
Not in CLASS Mean 242.416 236.65 232.72 248.774 241.99 237.227Not in CLASS SD 50.941 47.259 45.799 51.551 49.13 46.173Number of Clusters 195 195 195 644 644 644Observations 7141 7095 7105 23353 23273 23226Notes: PAC stands for Plan Apoyo Compartido. In CLASS sample is a dummy variable that takes value one if the student attendsa school that was randomized into the CLASS intervention and zero otherwise. The effects shown are in units of the Not in CLASSsample standard deviation. 95% bootstrapped confidence intervals are shown in brackets.
34

Appendix E Main results including all PAC schools
E.1 Overall effects
Table A11: Impact of PAC on SIMCE 2011 and 2012
Intention to treat effect (ITT)2011 2012-including contaminated schools
(1) (2) (3) (4) (5) (6)Reading Math Science Reading Math Science
Randomized into PAC .095 .068 .033 .04 .051 .012[.04;.15] [.01;.13] [-.03;.09] [-.01;.09] [-.01;.11] [-.04;.07]
(.01) (.13) (.34) (.32) (.27) (.72)
Control Group Mean 244.787 235.756 236.836 245.937 239.432 235.461Control Group SD 49.97 47.103 44.09 51.055 47.326 46.527Number of Clusters 840 841 841 839 839 839Observations 30736 30731 30765 30494 30368 30331
Instrumental Variables2011 2012-including contaminated schools
(7) (8) (9) (10) (11) (12)Reading Math Science Reading Math Science
Implemented PAC .125 .089 .044 .064 .081 .019[.05;.2] [.01;.17] [-.04;.12] [-.02;.15] [-.01;.18] [-.06;.11](.01) (.13) (.34) (.32) (.27) (.72)
Control Group Mean 244.787 235.756 236.836 245.937 239.432 235.461Control Group SD 49.97 47.103 44.09 51.055 47.326 46.527Number of Clusters 840 841 841 839 839 839Observations 30736 30731 30765 30494 30368 30331Notes: PAC stands for Plan Apoyo Compartido. Implemented PAC is a dummy variable that takes value one if the studentattends a school that participated in PAC and zero otherwise. Randomized into PAC is a dummy variable that takes value oneif the student attends a school that was randomly assigned to the treatment group and zero otherwise. The effects shown are inunits of the control group standard deviation. 95% bootstrapped confidence intervals are shown in brackets. All 6 impacts ineach panel are tested jointly to control for the Familywise Error Rate using the Romano-Wolf step down method. Romano-Wolfstep down p-values from the two sided test are shown in parenthesis. Clustering at the school level. In the second panel theinstrument is Randomized into PAC.
E.2 2012 results by school SES
Table A12: Impact of PAC on SIMCE 2012-including contaminated schools (ITT parameter), by school socioeconomic status
Low SES Medium SES(7) (8) (9) (10) (11) (12)
Reading Math Science Reading Math ScienceRandomized into PAC .021 .022 -.013 .094 .158 .075
[-.04;.08] [-.04;.09] [-.07;.05] [-.02;.2] [0;.31] [-.05;.19](.78) (.78) (.78) (.5) (.29) (.64)
Control Group Mean 244.809 238.789 234.125 252.828 243.391 243.702Control Group SD 51.155 47.545 46.651 49.913 45.774 44.906Number of Clusters 681 681 681 158 158 158Observations 24097 23976 23951 6397 6392 6380Notes: PAC stands for Plan Apoyo Compartido. Randomized into PAC is a dummy variable that takes value one if the studentattends a school that was randomly assigned to the treatment group and zero otherwise. SES variables refer to the schoolSocio Economic Status as described in section 4. The effects shown are in units of the control group standard deviation (SD).95% bootstrapped confidence intervals are shown in brackets. All outcomes in this table are tested jointly to control for theFamilywise Error Rate using the Romano-Wolf step down method. The resulting step down p-values from the two sided testsare shown in parenthesis. Clustering at the school level.
35

E.3 2012 results by gender and income
Table A13: Impact of PAC on SIMCE 2012-including contaminated schools (ITT parameter), by students’gender and income
GirlsLow Income High Income
(1) (2) (3) (4) (5) (6)Reading Math Science Reading Math Science
Randomized into PAC .039 .068 .025 .208 .117 .075[-.03;.11] [0;.15] [-.04;.1] [.09;.32] [0;.24] [-.03;.18]
(.80) (.57) (.87) (.01) (.45) (.74)
Control Group Mean 251.989 236.495 232.941 256.406 244.927 242.931Control Group SD 49.769 46.37 44.465 49.098 47.692 46.727Number of Clusters 800 800 826 680 679 679Observations 10030 10005 9973 2533 2522 2520
BoysLow Income High Income
(7) (8) (9) (10) (11) (12)Reading Math Science Reading Math Science
Randomized into PAC .046 .072 .031 .026 .107 .013[-.02;.11] [0;.15] [-.03;.1] [-.06;.12] [.01;.2] [-.08;.1]
(.74) (.47) (.87) (.87) (.45) (.87)
Control Group Mean 239.601 240.548 235.503 250.521 247.172 246.618Control Group SD 51.678 47.936 48.001 51.718 47.433 46.927Number of Clusters 803 803 803 693 696 693Observations 10235 10191 10182 2950 2946 2930Notes: PAC stands for Plan Apoyo Compartido. Randomized into PAC is a dummy variable that takes value one if the studentattends a school that was randomly assigned to the treatment group and zero otherwise. Low Income is a dummy variable thattakes value one if the student’s family monthly income is less than 300,000 Chilean pesos, the minimum wage in such country.High Income is a dummy that takes value one if Low Income= 0. The effects shown are in units of the control group standarddeviation (SD). 95% bootstrapped confidence intervals are shown in brackets. All outputs in this table are tested jointly tocontrol for the Familywise Error Rate using the Romano-Wolf step down method. Romano-Wolf step down p-values from thetwo sided test are shown in parenthesis. Clustering at the school level.
36

Appendix F Main results with covariates
Table A14: Impact of PAC on SIMCE 2011 and 2012
Intention to treat effect (ITT)2011 2012
(1) (2) (3) (4) (5) (6)Reading Math Science Reading Math Science
Randomized into PAC .089 .059 .019 .112 .107 .076[.04;.14] [0;.12] [-.03;.08] [.06;.17] [.04;.18] [.02;.14]
(.02) (.13) (.57) (.01) (.04) (.06)
Control Group Mean 244.787 235.756 236.836 242.416 236.65 232.72Control Group SD 49.97 47.103 44.09 50.941 47.259 45.799Number of Clusters 838 838 838 680 680 680Observations 25894 25923 25949 20076 20168 20117
Instrumental Variables2011 2012
(7) (8) (9) (10) (11) (12)Reading Math Science Reading Math Science
Implemented PAC .116 .077 .025 .172 .164 .117[.05;.18] [0;.15] [-.05;.1] [.09;.26] [.06;.28] [.04;.21]
(.03) (.14) (.57) (.01) (.05) (.07)
Control Group Mean 244.787 235.756 236.836 242.416 236.65 232.72Control Group SD 49.97 47.103 44.09 50.941 47.259 45.799Number of Clusters 838 838 838 680 680 680Observations 25894 25923 25949 20076 20168 20117Notes: PAC stands for Plan Apoyo Compartido. Implemented PAC is a dummy variable that takes value one if the studentattends a school that participated in PAC and zero otherwise. Randomized into PAC is a dummy variable that takes value oneif the student attends a school that was randomly assigned to the treatment group and zero otherwise. The effects shown are inunits of the control group standard deviation. 95% bootstrapped confidence intervals are shown in brackets. In each panel, all6 impacts are tested jointly to control for the Familywise Error Rate using the Romano-Wolf step down method. Romano-Wolfstep down p-values from the two sided test are shown in parenthesis. All regressions include covariates: whether the students livesin a household with at least one parent and/or siblings; whether the student lives in a household with members of the extendedfamily; the number of times the student failed a school year; mother’s education: dummies for “no education”, “inc primary”,“primary”, “inc high school”, “high school”, “some college”, “college +”; father’s education (same dummies as mother education).Clustering at the school level. In the second panel the instrument is Randomized into PAC. The 2012 sample excludes schools thatimplemented CLASS.
37

Table A15: Impact of PAC on SIMCE (ITT parameter), by school socio economic status, with cohort fixedeffects
Low SES Medium SES(1) (2) (3) (4) (5) (6)
Reading Math Science Reading Math ScienceRandomized into PAC .073 .044 .005 .204 .238 .202
[.03;.12] [-.01;.1] [-.05;.06] [.1;.31] [.12;.35] [.11;.3](.02) (.31) (.90) (.01) (.01) (.01)
Control Group Mean 243.044 235.821 234.498 248.372 237.838 239.143Control Group SD 50.123 47.287 44.845 51.608 46.427 44.543Number of Clusters 706 706 706 194 194 194Observations 35616 35701 35684 10293 10329 10321Notes: PAC stands for Plan Apoyo Compartido. Randomized into PAC is a dummy variable that takes value one if thestudent attends a school that was randomly assigned to the treatment group and zero otherwise. SES variables refer to theschool Socio Economic Status as described in section 4. The effects shown are in units of the control group standard deviation(SD). 95% bootstrapped confidence intervals are shown in brackets. All outcomes in this table are tested jointly to control forthe Familywise Error Rate using the Romano-Wolf step down method. The resulting step down p-values from the two sidedtests are shown in parenthesis. All regressions include cohort fixed effects. All regressions include covariates: whether thestudents lives in a household with at least one parent and/or siblings; whether the student lives in a household with membersof the extended family; the number of times the student failed a school year; mother’s education: dummies for “no education”,“inc primary”, “primary”, “inc high school”, “high school”, “some college”, “college +”; father’s education (same dummies asmother education). Clustering at the school level. The 2012 sample excludes schools that implemented CLASS.
Table A16: Impact of PAC on SIMCE (ITT parameter), by students’ gender and income, with cohort fixedeffects
GirlsLow Income High Income
(1) (2) (3) (4) (5) (6)Reading Math Science Reading Math Science
Randomized into PAC .077 .065 .04 .158 .057 .022[.03;.13] [0;.13] [-.02;.09] [.06;.25] [-.04;.16] [-.07;.11]
(.08) (.35) (.62) (.04) (.62) (.68)
Control Group Mean 250.338 233.869 232.225 253.927 242.733 242.244Control Group SD 48.325 45.616 43.008 49.22 46.437 45.884Number of Clusters 834 834 834 757 757 756Observations 17603 17624 17589 4254 4243 4252
BoysLow Income High Income
(7) (8) (9) (10) (11) (12)Reading Math Science Reading Math Science
Randomized into PAC .089 .068 .04 .116 .156 .058[.04;.14] [0;.13] [-.02;.1] [.05;.19] [.07;.24] [-.02;.14]
(.04) (.35) (.62) (.05) (.02) (.62)
Control Group Mean 239.1 238.095 237.453 246.745 243.962 246.087Control Group SD 51.182 48.044 45.424 52.926 48.676 46.585Number of Clusters 836 836 836 773 774 774Observations 18217 18204 18221 4825 4830 4810Notes: PAC stands for Plan Apoyo Compartido. Randomized into PAC is a dummy variable that takes value one if the studentattends a school that was randomly assigned to the treatment group and zero otherwise. Low Income is a dummy variablethat takes value one if the student’s family monthly income is less than 300,000 Chilean pesos, the minimum wage in suchcountry. High Income is a dummy that takes value one if Low Income= 0. The effects shown are in units of the control groupstandard deviation (SD). 95% bootstrapped confidence intervals are shown in brackets. All outcomes in this table are testedjointly to control for the Familywise Error Rate using the Romano-Wolf step down method. The resulting step down p-valuesfrom the two sided test are shown in parenthesis. All regressions include cohort fixed effects. All regressions include covariates:whether the students lives in a household with at least one parent and/or siblings; whether the student lives in a household withmembers of the extended family; the number of times the student failed a school year; mother’s education: dummies for “noeducation”, “inc primary”, “primary”, “inc high school”, “high school”, “some college”, “college +”; father’s education (samedummies as mother education). Clustering at the school level. The 2012 sample excludes schools that implemented CLASS.
38

Appendix G Results by gender and income (separately)
Table A17: Impact of PAC on SIMCE by gender, with cohort fixed effects
Girls Boys(1) (2) (3) (4) (5) (6)
Reading Math Science Reading Math ScienceRandomized into PAC .109 .077 .058 .108 .097 .057
[.06;.16] [.02;.13] [0;.11] [.06;.16] [.04;.16] [0;.11](.01) (.08) (.12) (.01) (.02) (.12)
Control Group Mean 249.751 234.539 233.059 239.225 238.243 237.943Control Group SD 48.659 45.635 43.42 51.38 48.142 45.678Number of Clusters 835 836 836 837 838 838Observations 26068 26045 26006 28101 27953 27954Notes: PAC stands for Plan Apoyo Compartido. Randomized into PAC is a dummy variable that takes value one if the studentattends a school that was randomly assigned to the treatment group and zero otherwise. The effects shown are in units of thecontrol group standard deviation (SD). 95% bootstrapped confidence intervals are shown in brackets. RW step down p-valuesallowing for all 6 hypotheses from the two sided tests are shown in parenthesis. All regressions include cohort fixed effects.Clustering at the school level. Schools that implemented CLASS are excluded from the 2012 sample.
Table A18: Impact of PAC on SIMCE by family income, with cohort fixed effects
Low income High income(1) (2) (3) (4) (5) (6)
Reading Math Science Reading Math ScienceRandomized into PAC .089 .074 .044 .167 .143 .071
[.04;.14] [.01;.13] [-.01;.09] [.11;.23] [.07;.21] [0;.14](.01) (.08) (.18) (.01) (.01) (.18)
Control Group Mean 244.302 235.801 234.677 249.877 243.23 244.358Control Group SD 50.17 46.92 44.319 51.423 47.994 46.75Number of Clusters 842 842 842 823 824 824Observations 39879 39985 39961 9801 9819 9806Notes: PAC stands for Plan Apoyo Compartido. Randomized into PAC is a dummy variable that takes value one if the studentattends a school that was randomly assigned to the treatment group and zero otherwise. Low Income is a dummy variablethat takes value one if the student’s family monthly income is less than 300,000 Chilean pesos, the minimum wage in suchcountry. High Income is a dummy that takes value one if Low Income= 0. The effects shown are in units of the control groupstandard deviation (SD). 95% bootstrapped confidence intervals are shown in brackets. RW step down p-values allowing for all6 hypotheses from the two sided tests are shown in parenthesis. All regressions include cohort fixed effects. Clustering at theschool level. Schools that implemented CLASS are excluded from the 2012 sample.
39