Embed Size (px)
Citation preview
DI
SC
US
SI
ON
P
AP
ER
S
ER
IE
S
Forschungsinstitut zur Zukunft der ArbeitInstitute for the Study of Labor
Teaching Practices and Social Capital
IZA DP No. 6052
October 2011
Yann AlganPierre CahucAndrei Shleifer

Teaching Practices and Social Capital
Yann Algan Sciences Po
and IZA
Pierre Cahuc Ecole Polytechnique
and IZA
Andrei Shleifer Harvard University
Discussion Paper No. 6052 October 2011
IZA
P.O. Box 7240 53072 Bonn
Germany
Phone: +49-228-3894-0 Fax: +49-228-3894-180
E-mail: [email protected]
Any opinions expressed here are those of the author(s) and not those of IZA. Research published in this series may include views on policy, but the institute itself takes no institutional policy positions. The Institute for the Study of Labor (IZA) in Bonn is a local and virtual international research center and a place of communication between science, politics and business. IZA is an independent nonprofit organization supported by Deutsche Post Foundation. The center is associated with the University of Bonn and offers a stimulating research environment through its international network, workshops and conferences, data service, project support, research visits and doctoral program. IZA engages in (i) original and internationally competitive research in all fields of labor economics, (ii) development of policy concepts, and (iii) dissemination of research results and concepts to the interested public. IZA Discussion Papers often represent preliminary work and are circulated to encourage discussion. Citation of such a paper should account for its provisional character. A revised version may be available directly from the author.
IZA Discussion Paper No. 6052 October 2011
ABSTRACT
Teaching Practices and Social Capital* We use several data sets to consider the effect of teaching practices on student beliefs, as well as on organization of firms and institutions. In cross-country data, we show that teaching practices (such as copying from the board versus working on projects together) are strongly related to various dimensions of social capital, from beliefs in cooperation to institutional outcomes. We then use micro-data to investigate the influence of teaching practices on student beliefs about cooperation and students’ involvement in civic life. A two-stage least square strategy provides evidence that teaching practices have an independent sizeable effect on student social capital. The relationship between teaching practices and student test performance is nonlinear. The evidence supports the idea that progressive education promotes social capital. JEL Classification: I2, Z1 Keywords: education, social capital, institutions Corresponding author: Yann Algan Sciences Po 28 rue des Saints-Pères 75007 Paris France E-mail: [email protected]
* We are grateful to Roland Benabou, Antonio Ciccone, Joshua Gottlieb, Lawrence Katz, Jesse Shapiro, Emily Oster, and Fabrizio Zilibotti for helpful comments. We also thank for their comments seminar participants at the University of Chicago, CREI, Harvard, Zurich and to the NBER Cultural Economics workshop. Yann Algan thanks the ERC-Starting Grant for financial support.

2
1.Introduction
Since the path-‐breaking work of Banfield (1958), Coleman (1990), and Putnam (1993, 2000),
social scientists have argued that social capital, defined broadly as the capacity of people in a
community to cooperate with others outside their family, is an important determinant of various
social outcomes. The list of such outcomes includes the provision of public goods (Putman 1993),
economic growth (Knack and Keefer 1997, Algan and Cahuc 2010), formation of large firms and
organizations (La Porta et al. 1997), financial development (Guiso et al. 2004), trade (Guiso et al.
2009), as well as methods of state intervention (Djankov et al. 2003, Aghion et al. 2010). Many social
scientists have also argued that social capital is highly persistent over time (Putnam 1993, Guiso et al.
2007), largely because the underlying beliefs regarding the benefits of trust and cooperation are
transmitted in communities through families (e.g., Bisin and Verdier 2001, Tabellini 2008, Guiso et al.
2008) or social interactions (Benabou and Tirole 2010).
The emphasis on family transmission leads to a sanguine assessment of the possibility of
raising the levels of social capital in a community, since not much scope for action is left for the
community itself. But is it really the case that only families play a role? Is there a possibility that a
community can raise its own levels of social capital collectively?
In this paper, we explore an alternative, and complementary, mechanism of how social
capital is transmitted in a community, namely schooling. Aghion et al. (2010) and Guiso et al. (2010)
note that schools rather than families might contribute to such transmission. There is some evidence
that a greater quantity of schooling leads to higher social capital (Milligan et al. 2004, Helliwell and
Putnam 2007, Glaeser et al. 2007) and has other desirable non-‐pecuniary benefits (Oreopoulos and
Salvanes 2011). Our emphasis will be not on the quantity of schooling, but on how students are
taught.
The idea that how students are taught shapes their beliefs is of course not new. Teaching
students ethics and civicness are established goals of school systems in many countries, which also
animate the progressive education movement (Dewey 1944). More recently, the Marxist critique of
capitalist education (Bourdieu and Passeron 1970, Bowles and Gintis 1976) sees these objectives as
mechanisms of perpetuating the social order. Our paper is an empirical exploration into the effects
of progressive education.
Our starting observation is that the methods of teaching differ tremendously across
countries, and between schools within a country. Some schools emphasize what we call vertical
teaching methods, whereby teachers primarily lecture, students take notes or read textbooks, and

3
teachers ask students questions. The central relationship in the classroom is between the teacher
and the student. Other schools emphasize what we call horizontal teaching methods, whereby
students work in groups, do projects together, and ask teachers questions. The central relationship
in the classroom is among students. Consistent with the idea that beliefs underlying social capital
are acquired through the practice of cooperation, we hypothesize that horizontal teaching methods
are conducive to the formation of social capital, whereas vertical teaching methods are not.
To pursue our study, we assemble data on teaching methods across schools from several
multi-‐country data sources. The three data bases we examine are 1) the Civic Education Study (CES),
run in 1999 in 25 countries to assess the level of civic knowledge of mostly 14 year olds in the 8th and
9th grades, 2) the Trends in International Mathematics and Science Study (TIMSS), conducted in 1995
in 33 countries and focused similarly on the 8th graders, and 3) the Program for International Student
Assessment (PISA), which we use for 2000 and 2003 waves for 15 year olds in 36 countries. The CES
data in particular contains a great deal of student-‐level information about student beliefs and
characteristics, as well as characteristics of their teachers and their schools, including most
importantly teaching methods. In our empirical work, we emphasize the distinction between
“teachers lectures” and “students work in groups” as measures of vertical and horizontal teaching
methods. We can then use the CES at the student and school level to relate teaching methods to
student beliefs, and use all data sources at the country level to relate teaching methods to a variety
of measures of both beliefs and social outcomes.
In doing so, we seek to address four questions. First, do teaching methods vary
systematically across countries? The answer to this question is a clear yes. Students work in groups
more in Nordic countries (Denmark, Norway, Sweden) and Anglo-‐Saxon countries (Australia, United
States and to a lesser extent Great Britain). This teaching practice is less common in East European
countries and the Mediterranean (Greece, Cyprus, Portugal and, to a lesser extent, Italy). In contrast,
in East European and Mediterranean countries, teachers spend more timing lecturing.
Second, are teaching practices related to social capital and institutional quality at the country
level? We consider several dimensions of social capital, but also several aspects of the quality of
institutions. In all cross-‐country specifications, we control for per capita income and average years of
education. We find a variety of interesting correlations. In terms of beliefs, students in countries
with vertical teaching methods assess a lower value of cooperation with other students and have a
lower view of teacher fairness and willingness to listen than do students in countries with horizontal
teaching methods. Vertical teaching is also associated with greater belief (from the WVS) that it is
the duty of children to respect their parents. Such methods are associated with students feeling “like
4
an outsider” and “awkward and out of place” in the classroom (from PISA), and are highly negatively
correlated with trust and association membership, the two standard measures of beliefs underlying
social capital from the WVS. Finally, vertical teaching methods are associated with lower trust in civil
servants and lower level of belief that civil servants treat citizens fairly (both measures from the
International Social Survey Program). It appears that subordination to teachers as a student leads to
a feeling – and perhaps a reality -‐-‐ of subordination to bureaucrats as an adult.
With respect to “real outcomes” as opposed to just beliefs, we looked at organization of
firms, which some studies find to be related to social capital (La Porta et al. 1997, Bloom et al. 2007).
We find that vertical teaching methods are associated with lower assessed incidence of delegation of
authority in firms (Global Competitiveness Report) and lower perceived freedom of daily work
organization (European Social Survey). Again, teaching practices appear to translate into work
practices, suggesting that social skills learned in school are used later. We also find that vertical
teaching methods are related to a perception of inferior labor relations. Perceived unfairness of
teachers may lead to that of bosses. We also look at two measures of institutional quality: the
(subjective) government effectiveness index from Kauffman et al. (2008) and the objective measure
of entry regulation from Djankov et al. (2002), and find that vertical teaching methods are associated
with lower government effectiveness and higher entry regulations.
Suggestive as it is, the macro evidence always suffers from omitted variable problems, as
well as from reverse causality. Accordingly, in the second part of the paper, we turn to the micro
data. The third question we ask is whether differences in teaching practices also influence student
beliefs across schools within a country, holding country fixed effects constant to control for national
educational policies and social capital. We thus exploit the variation in teaching practices between
schools to identify the effect of teaching practices. We show that not only countries but also schools
and teachers differ a lot in their reliance on vertical and horizontal teaching practices. Indeed,
teaching practices vary considerably not just across schools but between teachers within schools.
Because of how our data are constructed, however, we can only exploit the effect of teaching
practices on student beliefs across but not within schools. The CES randomly samples students from
a given classroom, and interviews exactly the same set of teachers for every sampled student. We
thus do not have any sources of variation in student beliefs due to different allocation of students to
teachers within the same classroom. We examine the determinants of teaching practices both
within and between schools, where the observation is student teacher pair. The within school
evidence, while not usable for understanding the influence of teaching practices on student beliefs,
will turn out to be helpful in interpreting our instruments.

5
We first estimate the relationship between teaching practices and student beliefs using OLS
specification. We control for an extensive list of student, teacher, and school characteristics,
including the teacher and school level of social capital. This allows us to disentangle the role of
teaching practices from other channel of transmission of social capital through teacher or peer
effects. We find a significant relationship between those practices and various dimensions of student
social capital, including beliefs in cooperation with other students and with teachers, association
membership, trust in institutions, and indexes of participation in the civil society.
Yet the OLS results cannot completely answer our fourth question, namely whether the
relationship between teaching practices and social capital is causal. The trouble is that differences in
teaching methods may reflect the differences in the beliefs or preferences of the community rather
than exert an independent influence on student beliefs. For example, teachers specializing in
horizontal teaching methods might be selected, or even self-‐select, into high social capital
communities. Alternatively, teachers might adjust their practices to the social capital of their
students. If teaching methods entirely reflect community preferences, then one might still argue
that only families shape beliefs, and schools merely reinforce what families teach kids already. If
teaching methods have an independent component, there is a possibility that schools can build social
capital even in communities where parents lack it.
To shed light on the question of causality, we instrument teaching practices using two
distinct instrumental variables. The first is teacher gender, which in the first stage regression is a
highly significant determinant of teaching practices even holding teacher social capital constant
(female teachers use horizontal teaching methods more heavily). Female teachers thus seem to
prefer group projects to lecturing. The second instrument is teacher interest in additional
instructional time from teacher surveys, which is also a significant predictor of teaching practices in
first stage estimates (teachers who want more instructional time use vertical teaching methods more
heavily). Teachers seeking more instructional time plausibly are more focused on getting through
the curriculum, which often requires lecturing. We find a substantial amount of variation in both
teacher gender and teacher interest in additional instructional time across but also within schools.
Moreover, these teacher characteristics predict teacher practices within schools as well. The within-‐
school evidence suggests that our instruments reflect teacher characteristics and preferences, and
not characteristics of students or communities, and hence are uncorrelated with the possibly
omitted school or community characteristics. In addition, over-‐identification tests do not reject their
exogeneity. The 2SLS estimates show that teaching practices have a sizeable causal effect on student

6
beliefs. Horizontal teaching practices, on the margin, appear to have an independent impact on
student social capital, and perhaps through this channel on various social outcomes.
One might worry that horizontal teaching practices raise social capital at the expense of
academic achievement. To address this concern, we use student level data to ask whether
educational quality is compromised by teaching practices favorable to the formation of social capital.
We find that extreme bias toward some teaching practices is detrimental to test scores, and that a
mixture of horizontal and vertical teaching practices supports best academic performance.
Section 2 describes our data sources and measures of teaching methods and looks at the
cross-‐country correlations between teaching practices and various outcomes including social capital
and institutions. Section 3 presents the micro evidence on the relationship between teaching
methods and student beliefs using variation between schools by including country fixed effects, and
using 2SLS regression to identify the independent effect from teaching practices on beliefs in
cooperation. In Section 4, we consider student test scores. Section 5 concludes.
2. Teaching practices and Aggregate outcomes
This section investigates the cross-‐country relationships between teaching practices
measured at the country level and various social outcomes, including trust and civic life, but also the
organization of firms and public institutions. Aggregate data allow us to consider both beliefs and
“real outcomes”, although concerns with omitted variables might be greater than with micro data.
2.1 Cross-‐country comparisons on teaching practices
We start by exploring a first issue: do teaching practices vary across countries? While the
literature has so far focused on the quantity of schooling, we open the black box of schools by
looking at how children at taught in the different countries.
We illustrate teaching practices at the country level by using two main databases: the “Civic
Education Study” (CES) and the Trends in International Mathematics and Science Study (TIMSS). The
CES is a survey run in 1999 by the International Association for the Evaluation of Educational
Achievement (IEA). The CES is designed to assess the civic knowledge of students in grade 8 (or
grade 9 for certain countries) in 25 countries: Australia, Bulgaria, Chile, Cyprus, Czech Republic,
Denmark, England, Estonia, Finland, Germany, Greece, Hungary, Italy, Latvia, Lithuania, Norway,
Poland, Portugal, Romania, Russian Federation, Slovak Republic, Slovenia, Sweden, Switzerland,

7
United States. In addition to the individual student survey, the CES includes school-‐principal and
teacher background questionnaires. Critically, the teacher questionnaire requests detailed
information on teaching practices of the teachers. Each of the participating countries randomly
samples the students to be surveyed using a two-‐stage stratified sampling design. The primary
sampling unit (PSU) is the schools randomly selected in each country. The students from grade 8 are
then randomly picked from the assigned class in the selected school. The teachers of those selected
students complete individual surveys (as did school principals). For students with multiple teachers
(up to a maximum of five in the database), all the teachers complete the questionnaire.
The individual teacher surveys ask the following questions about teaching practices: « In your
class, a) How often do students work in groups? b) How often do students work on projects ? c) How
often do students study textbooks? , d) How often do students participate in role play, e) How
often does the teacher lecture? , f) How often does the teacher include discussions, g) How often
does the teacher asks questions? ». The answers take on values 1 for Never, 2 for Sometimes, 3 for
Often and 4 for Very Often. To capture the contrast between vertical and horizontal teaching
practices, we focus on the two main oppositional teaching practices from the CES, “Teacher lectures”
and “Students work in groups.”
The second database is TIMSS, a multi-‐country comparative test of student cognitive
achievement in math and science, conducted in 1995 by the IEA, the same international consortium
that constructed the CES database. TIMSS is also targeted to students belonging to grade 8 and cover
up to 36 countries: Australia, Austria, Belgium, Bulgaria, Canada, Czech Republic, Denmark, Finland,
France, Germany, Greece, Hungary, Iceland, Indonesia, Iran, Ireland, Israel, Italy, Japan, Korea, Latvia,
Lithuania, Netherlands, Norway, Portugal, Romania, Russia, Singapore, Slovakia, Slovenia, Spain,
Sweden, Switzerland, Turkey, United Kingdom and United States. The database combines
information from student, school principal, and teacher questionnaires for a representative sample
of students.
The TIMSS database covers more and more diverse countries than the CES (the CES is mainly
centered on European countries), and also asks questions about teaching practices. Unlike the CES,
however, TIMSS does not ask specific questions on student beliefs, since the primary focus of this
study is the assessment of cognitive performance. Teaching practices are measured from the
individual student surveys conducted in all classrooms in each selected school. The survey covers the
classes in mathematics, science, biology, chemistry, and earth science. We focus on teaching
practices in mathematics, which allows observations for the maximum number of countries.

8
The questions on teaching practices most related to our analysis are: “In schools, how often
do you do these things? Copy notes from the board during the lessons? , Work together in pairs and
small groups in class?” The answers range from 1 for All the time, 2 for Often, 3 for Sometimes, to 4
for Never. We reverse the order of the answers to get a scale comparable to that of the CES. The
higher is the value of the TIMSS indicator, the more frequent is the teaching practice.
Figure 1 presents the correlation between country average scores of “Students work in
group” and “Teacher lectures” taken from the CES. The higher is the value of these indicators, the
more frequent are these teaching practices based on teacher surveys. Figure 1 shows a negative
cross-‐country correlation between these two practices, with the coefficient of correlation equal to -‐
0.418. Students work in groups more in Nordic countries (Denmark, Norway, Sweden) and Anglo-‐
Saxon countries (Australia, United States and to a lesser extent Great Britain). This teaching practice
is less common in East European countries and the Mediterranean (Greece, Cyprus, Portugal and, to
a lesser extent, Italy). In contrast, in East European and Mediterranean countries, teachers spend
more timing lecturing. Figure 1 also suggests that in countries such as Germany and Switzerland
teachers combine the two practices, or do something else with their class time.
Figure 1 – Cross-‐country correlation in teaching practices: Teacher Lectures versus Students Work in Groups –(1=Never, 2=Sometime, 3=Often, 4=Always). Source: CES

9
Figure 2 – Cross-‐country correlation in teaching practices from TIMSS: country-‐level score for the questions “Student take notes from the board” and “Students work in groups” (1=Never, 2=Sometime, 3=Often, 4=Always)
Figure 2 shows the country average scores from TIMSS for “Students copy notes from the
board during the lessons” and “Students work together in pairs and in small groups in class”. The
variables range from 1 to 4, a higher score indicating a higher frequency. The cross-‐country
correlation is -‐0.137. In all countries, students take notes from the board more frequently than they
work in groups. But they do much more so in France, Japan, Turkey or more generally in most
Continental and Mediterranean European countries. In contrast, the gap in the country average
scores for “Students take notes from the board” and “Students work in groups” is the lowest in
Scandinavian countries and Anglo Saxon countries.
For countries present in both CES and TIMSS survey, the indicators of teaching practices are
significantly correlated with each other. The cross-‐country correlation between averages of “Teacher
lectures” from CES and “Students take notes from the board” from TIMSS is 0.328. The
corresponding correlation between “Students work in groups” from CES and TIMSS, respectively, is
0.598. This correlation pattern shows the consistency of the practices across surveys. The phrasing
of the questions differs between CES and TIMSS, but they capture the same broad contrast between
vertical and horizontal teaching. This comparison also suggests, importantly, that the students and
the teachers share the same perceptions of teaching practices, since the questions are administrated
at the teacher level in CES and at the student level in TIMSS. Since TIMSS cover a wider spectrum of
countries, we will base our macro analysis on this database henceforth.
2.2 Teaching practices and students beliefs in cooperation

10
Having established the large cross-‐country variation in teaching practices, we now explore
the relationship between those teaching practices and various dimensions of social capital. We first
investigate the cross-‐country relationships between teaching practices and student beliefs in
cooperation. To measure beliefs in the aggregate data, we begin with a comprehensive set of
student attitudes toward cooperation at school from the Program for International Student
Assessment (PISA). This survey was run in 2000, 2003 and 2006 by the Organization for Economic
Cooperation and Development (OECD). The PISA survey is meant to provide international
comparison of cognitive skills of 15 year-‐old students, by asking standardized questions in
mathematics, science, reading, and problem-‐solving. Information on the way schools are run is
collected through a school principal questionnaire. PISA does not include a teacher survey and,
unlike the CES and the TIMSS, does not report teaching practices in detail. But the background
student questionnaire provides an indication of student perception of cooperation among students,
as well as between students and teachers. These questions are available in the surveys 2000 and
2003 for 30 countries for which we also have observations for our control variables: Australia,
Austria, Belgium, Bulgaria, Chile, Czech Republic, Denmark, Finland, France, Germany, Greece,
Hungary, Iceland, Indonesia, Ireland, Italy, Japan, Korea, Latvia, Netherlands, Norway, Portugal,
Romania, Slovakia, Spain, Sweden, Switzerland, Turkey, United Kingdom and the United States.
The regressions include several controls. The first is the level of education from the Barro
and Lee database for 2000. Education has been found to be crucial in explaining various civic
outcomes as well as the development of democracy (Lipset 1959, Milligan, Moretti, and Oreopoulos
2006, Helliwell and Putnam 2007, Glaeser, Ponzetto and Shleifer, 2007). Another concern is that
teaching practices proxy for per capita income. In poor countries, it might be less costly for teachers
to lecture than to ask students to work in groups. We control for total annual expenditure per
student in public institutions for secondary education, which corresponds to the grades where
teaching practices are measured in TIMSS. Total expenditure per student is calculated as a
percentage of GDP in US 2002 dollars adjusted for PPP. The data come from UNESCO. An additional
control is GDP per capita, expressed in US 2000 dollars. These last two controls are highly correlated.
From PISA 2000 and 2003, we use the following statements concerning cooperation between
students: “I enjoy working with other students in group”, “When we work on a project, I think that it
is a good idea to combine the ideas of all the students in a group”, “I do my best work when I work
with other students” and “I learn most when I work with other students in my class”. The replies to
each statement range from 1 for Strongly disagree, 2 for disagree, 3 for Agree, and 4 for Strongly
agree. To ease the interpretation of the results, we create a dummy for each question which equals
0 if the response is “strongly disagree” or “disagree”, and 1 if the response is “agree” and “strongly

11
agree”. The country level of the variable thus measures the share of students who agree or strongly
agree with the statement. We also create a synthetic indicator of “student cooperation” at the
country level by taking the average over the four questions of the share of students who agree or
strongly agree with the statement. The index varies between 0 and 1.
Table 1, Columns 1-‐3 report the OLS cross-‐country estimates controlling for (ln)-‐school
expenditure per student, the (ln) income per capita, and average years of education. Column 1
shows a strong negative relationship between “student cooperation” and the country share of
students who never work in groups. The coefficient is statistically significant at the 1 percent level.
Column 2 shows a negative association between “student cooperation” and the country share of
students who always take notes from the board; the relationship is statistically significant at the 10
percent level. Column 3 reports that the relationship is statistically significant at the 1 percent level
for the Gap between Vertical Teaching and Horizontal Teaching. Twenty-‐one percent of the cross-‐
country variation in beliefs about student cooperation is explained by this gap.
The size of the coefficients is substantial. Teaching practices are the only variables
statistically significantly related to “student cooperation”. None of school expenditure per student,
income per capita, or average years of education is related to student attitudes toward cooperation.
To ease the interpretation, we look at the estimates using each question separately rather than at
their average. An increase by one-‐standard deviation (across countries) in the share of students who
always take notes from the board is associated with a decrease of 8 percentage points in the share of
students who agree or strongly agree with the statement “I enjoy working with other students in
group”. An increase by one standard deviation in the share of students who never work in groups is
associated with a decrease by 7 percentage points in the share of students who agree or strongly
agree with the statement: “I learn most when I work with other students in my class”.
We next turn to the relationship between teaching practices and cooperation between
teachers and students. We measure this relationship using student beliefs from PISA. Students are
asked to consider the following statements: “In general teachers treat me fairly”, “In general
students and teachers get along”, “In general the teacher listens to me”. The responses range from 1
for Strongly disagree, 2 for Disagree, 3 for Agree and 4 for Strongly agree. To measure the country
level of cooperation with teachers, we create for each statement a dummy equal to 1 if the answer is
agree or strongly agree, and 0 if the answer is disagree or strongly disagree. We also look at an
indicator of “cooperation with teachers” by taking the average of these dummies over the three
statements. Table 1 shows a strong negative relationship between “cooperation with teachers” and

12
the share of students who never work in groups (Col. 4), who always take notes from the board (Col.
5), or who see a larger Gap between Notes and Groups. The correlations are statistically significant
at the 5 or 1 percent level. Twenty-‐three percent of the cross-‐country variation in “cooperation with
teachers” is explained by the country share of students who never work in groups.
We complement this analysis by looking at the relationships between teaching practices and
beliefs about family life. From the World Values Survey 2000, we use the question: “Children should
respect their parents regardless of their merits and their faults”. The variable equals 1 if the answer
is yes, and 0 otherwise. We calculate the country share of positive answers to this question for the
countries that are also included in TIMSS and for which we have observations on teaching practices.
Table 2 – Col. 1-‐3 show that teaching practices are related to attitudes toward hierarchical
relationships between children and parents. The country share of students who always take notes
from the board is positively related to share of individuals agreeing with the statement that children
must always respect their parents. The relationship is statistically significant at the 1 percent level,
and 45 percent of the cross-‐country variation in family values is explained by the cross-‐country
variation in this teaching practice.
Table 2 – Col. 4-‐6 explore the relationship between students’ feeling of alienation and the
teaching practices. From PISA, we take two related questions: “In general, do you feel like an
outsider in your class?”, “In general, do you feel awkward in your class?”. The answers range from 1
for Strongly disagree, 2 for Disagree, 3 for Agree to 4 for Strongly agree. We create a dummy for
each question equal to 1 if the answer is agree or strongly agree, and 0 if the answer is disagree or
strongly disagree. We then create a measure of student alienation by taking the average of these
dummies. Table 2 shows that feelings of alienation are positively related to “Always take notes from
the board”; the coefficient is statistically significant at the 1 percent level. Forty five percent of the
cross-‐country variation in student alienation is explained by the share of students who always take
notes from the board. Working in groups is not associated with alienation.
2.3 Teaching practices and Aggregate Social capital
2.3.1 Teaching practices, Trust and Civic life
This section looks at the broader implications of teaching practices for trust and civic life at
the country level. Figure 3 shows the relationship between the country level of trust and the Gap
between “Vertical Teaching” and “Horizontal Teaching.” Trust is measured by the standard question
from the World Values Survey 2000: “In general do you think you can trust others or one cannot be

13
too careful?” The answer is 1 if the respondent trusts others, and zero otherwise. We calculate the
country average level of trust. Vertical and Horizontal teaching measures are taken from TIMSS, as
described before, and Gap is the country level difference between the two. The correlation between
Gap and trust is strongly negative; almost one third of the cross-‐country variation in trust is
explained by the variation in teaching practices. Scandinavian countries (with the exception of
Finland), and to a lesser extent Anglo-‐Saxon countries, combine both a fairly high level of trust and
teaching practices tilted toward horizontal rather than vertical. In contrast, most Mediterranean
(Turkey, France and Greece in the first place) and East European countries are characterized by
teaching practices biased toward the vertical and low levels of trust. The big outliers are Japan and
Ireland, which tilt toward vertical teaching practices but have high trust.
Table 3 documents the robustness of the relationships between generalized trust and
teaching practices by including income per capita, school expenditure per student, and average years
of education at the country level. Columns 1-‐2 show a negative correlation between generalized
trust and the shares of students who “always take notes from the board”, “never work in groups”,
and the Gap. The coefficients are statistically significant at the 1 percent level. Teaching practices are
statistically more significant than national education, a variable usually seen to be the main
determinant of trust. The relationship is also economically sizeable. Respectively 33 percent and 32
percent of the cross-‐country variation in generalized trust is explained by the variation in “Always
take notes from the board” and “Gap between Lecture and Work in groups”. An increase by one
standard deviation in “Always takes notes from the board” is associated with a rise by 5.7 percentage
points in generalized trust. Income per capita and average years of schooling are also statistically
significant determinants of generalized trust in a cross-‐section of countries.
Columns 4-‐6 of Table 3 show that teaching practices are also significantly related to civic life,
measured as the percentage of citizens registered in an association in the WVS 2000. In particular,
there is a negative and statistically significant (at the 1 percent level) relationship between the share
who “always take notes from the board” and association membership. Taken alone, this share
explains 48 percent of the cross-‐country variation in association membership.

14
Figure 3 – Generalized Trust and the Gap between Vertical and Horizontal Teaching. Source: TIMSS, WVS
Table 4 documents the effects of teaching practices on attitudes toward officials. One might
expect vertical teaching to fuel a sense of subordination of citizens to officials, breeding distrust in
politics and the state. In contrast, horizontal teaching might encourage a feeling of belonging to the
same community and an expectation of accountability from the official. We investigate this
hypothesis by using the International Social Survey Program 2006 devoted to the role of government.
The ISSP 2006 covers a large set of countries for which we have data on teaching practices. We use
the following related questions: “Most civil servants can be trusted to do what is best for the
country”. The answers range from 1 for Strongly Agree, 2 for Agree, 3 for Neither Agree nor
Disagree, 4 for Disagree and 5 for Strongly Disagree. The second question is related to the
perception of fairness of civil servants: “In your opinion, how often do public officials deal fairly with
people like you?”. The answers range from 1 for Almost always, 2 for Often, 3 for Occasionally, 4 for
Seldom and 5 for Almost never. We use the country average of the answers to these two questions.
Table 4 shows that the variables trust in civil servants and belief in their fairness are
negatively related to the share of students who “always take notes from the board”; both
relationships are statistically significant at the 1 percent level. In contrast, horizontal teaching does
not display any significant relationship with attitudes toward civil servants. To interpret the
15
magnitude of the effect, we recode the attitudes toward civil servants. Take the question “In your
opinion, how often do public officials deal fairly with people like you?”. We create an indicator of
the fairness of civil servants equal to 1 if the answers are “Almost always” and “Often”, and to 0
otherwise. We then use the country average share of this variable as the left hand side variable. All
the controls are the same as in Table 4. An increase by ten percentage points in the share of
students who always take notes from the board is associated with a fall of 6.7 percentage points in
the share of respondents who believe that civil servants treat them fairly.
Columns 7-‐9 of Table 4 show that vertical teaching is also associated with a more widespread
feeling of corruption from the elites. From the ISSP 1996, we use the following question on the
perception of corruption of civil servants: “In your opinion, how many public officials are involved in
corruption?”. The answers range from 1 for Almost None, 2 for A few, 3 for Quite a lot, and 4 for
Almost all. This index of perception of corruption is higher when more students “always take notes
from the board” as well as when the Gap is higher. The coefficients are statistically significant at the
1 percent level.
2.3.2 Organization of firms
This section evaluates the consequences of teaching practices for the organization of firms
and the quality of labor relations. We assess whether a society emphasizing horizontal teaching also
promotes horizontal organization of work in firms. Perhaps citizens who have been trained to
cooperate at schools are also more likely to cooperate at work. Conversely, vertical teaching might
encourage hierarchical relationships outside of school, and in particular at work. We test this
prediction by looking at three cross-‐country indicators on firm organization.
Figure 4 shows the cross-‐country relationship between the Gap between Vertical and
Horizontal teaching and decentralization of firms. Decentralization is measured using the following
question from the Global Competitiveness Report 2009 (GCR): “In your country, how do you assess
the willingness to delegate authority to subordinates? 1 = low: top management controls all
important decisions; 7 = high: authority is mostly delegated to business unit heads and other lower-‐
level managers”. The GCR is based on a survey given to a representative sample of managers in all
the countries for which we have indicators of teaching practices. This indicator of delegation has
been found by Bloom and Van Reenen (2010) to be highly correlated with their cross-‐country
measure of decentralization in firms. Figure 4 shows a strong negative relation between this
indicator of decentralization and the gap between Vertical and Horizontal teaching. Both Anglo-‐
Saxon and Scandinavian firms are much more decentralized than the European ones, and especially
the Mediterranean and the East European ones, paralleling the patterns in teaching practices.

16
Figure 4 – Decentralization of firms
Table 5 – Col. 1-‐3 confirm that the organization of firms is associated with teaching practices,
even with additional controls. Delegation of authority is lower when more students “always take
notes from the board” or when the Gap between vertical and horizontal teaching is higher. The
coefficients are statistically significant at the 1 or 5 percent. Taken alone, vertical teaching explains a
quarter of the cross-‐country dispersion in the delegation of authority.
Table 5 – Col. 4-‐6 provide the complementary picture based on worker views on their degree
of autonomy in the organization of their daily work. The question is taken from the European Social
Survey and reads: “When you think about your work, how much freedom do you have in the
organizations of your tasks”. The answer ranges from 1 for no freedom at all to 10 for total freedom.
The results show that workplace autonomy is negatively and significantly related to the share who
“always take notes from the board” and to the Gap between vertical and horizontal teaching.
We also investigate how these differences in teaching practices relate to the quality of labor
relations. From the GCR 2009, we use the question: «How would you characterize labor-‐employer
relations in your country? 1 = generally confrontational; 7 = generally cooperative.” Since the data
come from the GCR, this question captures the point of view of managers and executives.

17
Figure 5 – Quality of labor relations
Figure 5 shows that countries in which students always take notes from the board do not
have cooperative labor relations. Twenty eight percent of the cross-‐country variation in the quality
of labor relations is explained by vertical teaching. Table 5 tests the robustness of this relationship
when we include additional controls. Columns 7-‐9 show that the quality of labor relations is reduced
when vertical teaching dominates. The correlation is the most significant with the gap between the
time spent in vertical and horizontal teaching.
2.3.3 The Quality of Institutions
We conclude this section by looking at the relationship between teaching practices and
institutions. We first explore the relationship between teaching practices and the extent of
regulation of the society. One might expect vertical teaching to be associated with a more
hierarchical organization of the state. We look at this using two main indicators. The first is
government effectiveness, measured as the average of the Kaufmann government effectiveness
index between 1998 and 2007 (see Kaufmann et al., 2008). This measure captures perceptions of the
quality of public services, the quality of civil service, and its degree of independence from political
pressures, the quality of policy formulation and implementation, and the credibility of the
government’s commitment to such policies. The range of the score is from −2.5 to +2.5, with a
18
higher score indicating greater government effectiveness. The second institutional measure is
regulatory intensity, which we measure as the number of steps for starting a new business from
Djankov et al. (2002).
Table 6 – Col. 1-‐3 show that government effectiveness is lower in countries where vertical
teaching predominates. The correlation patterns are statistically significant and economically
sizeable. Vertical teaching alone can explain 18.3 percent of the cross-‐country variation in
government effectiveness. Table 6 – Col. 4-‐6 reports the relationship between entry regulation and
teaching practices. Regulation is the more stringent in countries where more students “always take
notes from the board”; the coefficient is statistically significant at the 5 percent level.
3. Teaching practices and Student Beliefs
The correlations in the aggregate data are suggestive, but they leave issues of omitted
variables and causality quite open. To address these issues, this section examines the relationship
between teaching practices and social capital by using micro data on students’ beliefs in cooperation
from the CES. Using micro data first allows to control for country fixed effect, making it possible to
disentangle the role of teaching practices from national educational policies or national social capital
by looking at variation across schools and teachers. We show that not only countries but also
schools and teachers differ a lot in their reliance on what we call vertical and horizontal teaching
practices. We also show that teaching practices vary considerably among teachers within schools.
We discuss the determinants of teaching practices between and within schools using our micro data,
where an observation is a student teacher pair.
We then turn to estimating the relationship between teaching practices and student beliefs
using OLS specification. We control for several student, teacher and school characteristics, including
the teacher and school level of social capital. This allows us to disentangle the role of teaching
practices from other channel of transmission of social capital through teacher or peer effects. We
find a significant relationship between those practices and various dimensions of student social
capital, including beliefs in cooperation with other students and with teachers, association
membership, trust in institutions, and indexes of participation in the civil society.
Because the OLS regressions control for school and teacher social capital, as well as a number
of school characteristics, they alleviate the concern that both student beliefs and teaching practices
are driven by community social capital. Yet they do not fully resolve it because teachers and their
19
practices might be selected or self-‐selected based on community social capital, and because teachers
can adjust their practices to student characteristics. We then estimate instrumental-‐variables
models, using teacher gender and teacher interest in additional instructional time as instruments.
Over-‐identification tests show that that these instruments are valid. The results of 2SLS tell us that
teaching practices have an independent and statistically significant causal effect on student beliefs.
3.1. Database on Teaching Practices and Student Beliefs
Our analysis of the association between teaching practices and student social capital draw on
the “Civic Education Study” (CES). In addition to the teaching practices already presented in section
2.1, the CES measures various dimensions of civic knowledge, including concepts of democracy and
citizenship, attitudes to institutions, trust and civic behavior, as well as beliefs about cooperation
among students and cooperation between students and teachers. In addition to the individual
student survey, the CES includes school-‐principal and teacher background questionnaires.
At the student level, in addition to questions about beliefs discussed below, the measured
characteristics include age, gender and immigration status (dummy equal 1 if the student is born
abroad and 0 otherwise). We control for the socioeconomic background of the parents by including
their education, equal to 1 for No elementary school, 2 for Completed elementary school, 3 for High
School, 4 for Completed High School, 5 Higher technical education, 6 for Some college – university
degree, and 7 for Graduate degree. We also use student responses on the number of books at home,
equal to 1 for None, 2 for One-‐Ten books, 3 for Eleven-‐Fifty Books, 4 for Fifty one-‐ One hundred
books, 5 for One-‐hundred and one-‐Two hundreds books, and 6 for More than two hundred books.
This variable has been found to be a more cross-‐country comparable measure of family background
than parental education, and is the single most important predictor of student performance
(Hanushek and Woesmann, 2010). Schuetz et al (2008) show that the number of books at home is a
good proxy for household income, which is not reported in the CES.
At the teacher level, the survey includes information on teacher’s age, gender, highest level
of formal education, and years of experience. The CES samples for each class all the teachers whose
topic is related to civic knowledge. This includes mostly fields in humanities and social sciences but
excludes biology, maths, and sciences. In all regression we control for the field taught by the teacher.
We also use questions about teachers’ beliefs in cooperation as proxies for their social
capital, which they might transmit to students. If geographic mobility of teachers is low, their level of
social capital might be a proxy for the local social capital in the area where students live. We use this
information as an additional control to isolate the specific role of teaching practices on student

20
beliefs, which roughly holds constant social capital in the geographic location, and thus, perhaps, in
the family.
We measure teachers’ social capital with the following questions they answer on confidence:
“How much confidence do you have in the political system?”, “How much confidence do you have in
elections?”, “How much confidence do you have in the judicial system?”, “How much confidence do
you have in immigration?”, “How much confidence do you have in social welfare?”, “How much
confidence do you have in labor unions?”. The answers equal 1 for “Not at all”, 2 for “Little
confidence”, 3 for “Confident” and 4 for “Very confident”. We create an index of “Teacher’s social
capital” by taking the average of these answers, which ranges between 1 and 4.
We also control for the educational goal of the teacher. We use the following two questions:
“In our school, students learn to understand people who have different ideas/point of views” and “In
our school, students learn to cooperate in groups with other students”. The answers range from 1 for
Strongly Disagree to 4 for Strongly Agree. We create an index of “Teacher Beliefs in Cooperation” as
the average of those two answers. This variable is important to identify the independent component
of the teaching practice from the more general teacher behavior or belief about cooperation at
school. This variable could also address the concern that the students answer about cooperation at
school are just mirror what the teacher tells them.
In addition, we use data on teacher perception of whether more instructional time is needed.
The question reads: “In your view, what need to be improved about education in your school: More
instructional time for education?”. The variable equals 1 if the teacher mentions this item among the
three most important things to improve and zero otherwise (the other potential items are more
materials and textbooks, additional training in teaching methods, more cooperation between
teachers, more opportunities for special projects, more opportunities for school decisions). Unlike
the other items, the demand for more instructional time for education is highly correlated with both
the practices “students work in groups” and “teacher lectures”.
At the school level, the school principal’s questionnaire includes the size of the class being
interviewed and whether the school is public or private. The questionnaire also reports the fraction
of students in the school from low socio-‐economic backgrounds. This question is not reported for all
countries (in particular in Great Britain and the United States) and will be used only for a robustness
check. We also include a measure of the social capital at the school level. The school-‐principal survey
reports the following question: “How frequently each of the following occurs at your school? a)
Vandalism, b) Drugs, c) Truancy, d) Racism, e) Religious intolerance, f) Alcohol, g) Bullying, h)
Violence”. For each item, the answer equal 1 for never, 2 for sometime, and 3 for Often. We change

21
the order of the scale so that a higher score indicates a higher level of social capital. These measures
are used as an additional control for the local level of social capital and to disentangle teaching
practices from the school environment. Finally, we also include a question on the goal of the school
according to the school-‐principal: “Students in this school learn to understand people who have
different ideas” and “Students in this school learn to cooperate in groups with other students”. The
answer range from 1 for strongly disagree to 4 for strongly agree. This question is used to distinguish
the role of teaching practice from alternative channels to promote cooperation within the school.
Table A1 in the Appendix presents the definition and descriptive statistics of all the variables
we use from the CES. The sample covers 3,934 schools, with an average of 150 schools per country,
3,413 students per country, and an average of 1.68 teachers per student. Table A2 in Appendix
reports the descriptive statistics for the mean and standard deviation of teaching practices per
country from the CES. Countries differ substantially in the extent of variation in teaching practices
across schools. Nordic countries like Denmark, Norway or Sweden, are characterized by lower
variation across schools in the practice “teacher lectures”, followed by Germany, Switzerland and
Germany. Eastern European countries display above average variation in lecturing. United Kingdom
and the United States are close to the cross-‐country average.
3.2 Determinants of teaching practices: variation across and within schools
We begin by discussing the sources of variation in teaching practices across schools and
within schools. We look at the relationship between teaching practices and observable
characteristics at the class and schools levels. The dependent variable is the teaching practice of a
given teacher, with each student of that teacher entering as a separate observation. We control for
the individual characteristics of each student in the class of the teacher, including gender, immigrant
origin, age, education level of the parents, and the number of books at home. We also include the
individual characteristics of the teacher: age, gender, level of education, years of experience, as well
as the social capital of the teacher. Finally, we include the average characteristics of the school:
whether the school is public or private and the size of the classroom.
Table 8 presents the results of regressing teaching practices “Teacher Lectures” and “Work
in groups” on the set of observables characteristics of the teachers, the school and the family
background of the students. We run OLS regressions with country fixed effects to focus on within
country variation across schools in Columns 1 and 2, and include school fixed effects to look at
variation within schools in Columns 3 and 4. We cluster standard errors at the student level. The
results are unchanged by clustering standard errors at the teacher or school level.

22
Table 8, Columns 1 and 2, shows that teaching practices are correlated with some observable
characteristics of children and schools. “Students work in groups” rises with mother’s education and
teacher gender. “Teacher Lectures” falls with immigrant status of the student, teacher gender, and
the fraction of students in the school from low socio-‐economic backgrounds. It also rises with
teacher social capital. The strongest and most consistent predictor of teaching practices appears to
be the teacher’s gender: women are more likely to rely on horizontal, and less likely on vertical,
teaching practices. Later we use teacher gender as an instrument for teaching practices. We also
find a statistically significant relationship between the teacher demand for additional instructional
time and teaching practices. The teachers who feel that they need more instructional time are more
likely to lecture, and are less likely to ask their students to work in groups. This relationship still
holds when we control for the total instructional time by class and whatever the field taught by the
teacher. We use this indicator of teacher wishes as the second instrument, as well as test its validity.
Table 8 – Columns 3 and 4 -‐ describe the variation in teaching practices within schools by
including school fixed effects. We restrict the sample to the classrooms for which we have
observation of teaching practices for multiple teachers. (Table A2 shows that there is still substantial
variation in teaching practices within classrooms.) Columns 3 and 4 show that the variation in
teaching practices within the same class mostly depends on teacher characteristics. We speak
interchangeably of classes and schools since the CES samples one class per school and interviews a
sub-‐sample of students within that single classroom. Within a class, the practice “Students work in
groups” rises with teacher belief that her goal is to teach children to cooperate, with teacher
education, and with teacher experience. Horizontal teaching is still positively correlated with teacher
gender and negatively correlated with the demand for more instructional time. Conversely, the
practice “Teacher lectures” falls with female gender and teacher inclination to teach cooperation,
and rises with the teacher feeling of being time constrained. These characteristics remain statistically
significant at the 1 percent level. But the coefficient is smaller in the within schools regressions than
in the between schools regressions. The student characteristics are irrelevant in within schools
regressions since the teachers face the same students by design.
We find substantial variation in teaching practices both between and within schools. These
results indicate that teaching practices are not just a mirror of the local level of social capital, or the
mirror of the national or school curricula. The database does not make it possible to exploit the
variation in teaching practices within the same classrooms though. The reason is that we do not have
multiple combinations of students allocated to different teachers in a given class. The CES randomly
samples students from a given classroom, and interview exactly the same set of teachers for all the
students sampled. We thus do not get any source of variation in the students’ beliefs due to different

23
allocation of students to teachers within the same classroom. The regressions relating teaching
practices and student’s beliefs below thus exploit variation across schools.
3.3 Teaching practices and individual Student Beliefs: OLS estimates
3.3.1 Basic OLS estimates
We start with OLS regressions of student beliefs on teaching practices with various controls.
When we have data on multiple teachers for the same student, we use each pair as a separate
observation. We cluster standard errors at the student level. The results are similar when we cluster
at the school level. The results are not markedly different when we consider the average
characteristics across different teachers of a given student, rather than treating each teacher student
pair as a separate observation. The relationship between student beliefs and teaching practices is
not statistically significant, however, when we run the estimates with school fixed effects, i.e., look at
the role of variation in teaching practices within a school. We include country fixed effects in all the
regressions. We thus exploit the variation in teaching practices across schools, making it possible to
disentangle the specific role of teaching practices on students’ beliefs from other national
characteristics such as social capital or institutions.
We first estimate the relationship between student beliefs about cooperation among
themselves and teaching practices. From the student survey, we use the following two questions:
“The goal of education is to understand people with different ideas” and “The goal of education is to
learn how to cooperate in groups with other students”. The answers range from 1 for Strongly
Disagree, 2 for Disagree, 3 for Agree and 4 for Strongly Agree. The indicator “Belief in cooperation
between students” takes for each student the average of the two answers, ranging from 1 to 4.
The OLS results for student belief in cooperation with other students are reported in Table 9.
Column 1 shows that this belief is positively related to “Students work in groups,” and the coefficient
is statistically significant at the 1 percent level. In contrast, the belief in cooperation among students
is negatively related to “Teacher lectures.” The coefficient is positive and statistically significant at
the 1 percent level. There are a number of other important effects. Female students are firmer
believers in cooperation with other students, as are students coming from households with more
books. Finally, this belief is significantly stronger among students in public schools. We do not
pursue these interesting results here, but note that the student gender result is in line with Groson
and Gneezy’s (2009) finding of important gender differences in experimental public good games.
How large are the parameter estimates on teaching practices? Raising “Students work in
groups” by one point increases the belief in cooperation among students by 0.011, or 2.44 percent of

24
the standard deviation. Raising “Teacher lectures” by one point decreases that belief by 0.008, or
2.03 percent of the standard deviation. These effects appear modest, but perhaps not compared to
those of the other teacher and school characteristics. For example, the class size needs to be
reduced by a third to increase the belief in cooperation among students by 0.01 point.
The second aspect of student social capital is belief in cooperation with their teachers. We
use the following related questions from the student questionnaire: “Are students encouraged to
make up their own opinion?”, “Do teacher respect your opinion?”, “Do you feel free to express
opinions in class?”, “Do you feel free to openly disagree with the teacher?”. The answers range from
1 for strongly disagree, 2 for disagree, 3 for agree, to 4 for strongly agree. We use these answers to
create an index “Belief in cooperation between students and teachers”, which ranges from 1 to 4.
Table 9 -‐ Column 3 shows that the belief in cooperation with teachers is positively and
significantly (at the 1 percent level) related to “Students work in groups.” A one point increase in this
practice is associated with a rise by 0.0212 in the belief in cooperation with teachers, or 3.6 percent
of a standard deviation. Table 9 -‐ Column 4 shows a negative and statistically significant at the 1
percent level relationship between student “Belief in cooperation with teachers” and “Teacher
lectures”. Raising “Teacher lectures” by one point is associated with a drop of 0.006 in the “Belief in
cooperation between students and teachers”, or 1.02 percent of a standard deviation. Other
important influences on student belief in cooperation with teachers include student gender, father’s
education, the number of books at home, teacher’s age, teacher’s education (which enters
negatively!), teacher’s experience (which enters negatively), class size, teacher’s attitude towards
promoting cooperation (which enters positively), and school social capital (which enters positively).
The third dimension of students’ social capital is participation in civic life. Table 10 –
Columns 1 and 2 show the relationship between teaching practices and the involvement of students
in associations. The student survey brings up 15 organizations: “Have you ever participated in: A
student council? A youth organization? A school newspaper? An environmental organization? A U.N
or UNESCO Club? A Student exchange program? A Human Rights Organization? A Group Conducting
Activities? A Charity Collecting ? A boy or girl scout group? A cultural association? A computer club?
An art, drama or music association? A Sport Organization? An association supported by a religious
group?“ For each association, the answer is 1 if the respondent participates and 0 otherwise. We
sum up the answers to get a measure of Association membership, varying between 0 and 15.
Table 10 shows that Association membership is positively related to “Students work in
groups”; the coefficient is statistically significant at the 1 percent level (Column 1). In contrast,
Column 2 shows a negative relationship between Association membership and “Teachers lectures”;

25
although the coefficient is not statistically significant. Raising by one point “Students work in groups”
increases the number of memberships by 0.073, which is 5.18 percent of a standard deviation. The
other statistically significant determinants of memberships are student gender, father’s and mother’s
education, the number of books at home, teacher education (weakly), class size and public status of
the school, but teaching practices have a large effect compared, for example, to class size.
Finally, we look at the relationship between teaching practices and trust in institutions. From
the CES, we use the following questions: “How much confidence do you have in: i) Courts? , ii) The
Police?, iii) Education institutions/Schools? , iv) Government?, v) Parliament?”. The answers range
from 1 for “Not at all”, 2 for “Little confidence”, 3 for “Confident” and 4 for “Very confident”. We
take the average of these four answers to construct an index of “Trust”, ranging between 1 and 4.
Table 10 – Columns 3 and 4 show that “Trust” is positively related to “work in groups” but
not related to “teacher lectures.” The coefficient is statistically significant at the 5 percent level for
“work in groups. The evidence on trust is a bit weaker than that on other measures of social capital,
yet still continues to point in the direction of importance of teaching practices, and in particular of
the benefits of horizontal teaching methods, and costs of vertical ones, for social capital.
Table 11 concludes this section by looking at more general questions on student beliefs
about civic life and cooperation outside the school. One concern with the previous questions on
cooperation is that they are school centered. The students might just answer what the teachers are
expecting them to say. Questions on their civic culture outside the school should be less subject to
this concern. We measure cooperation in the civil society outside the school with the following list of
questions: “ “To become a good citizen, how important it is to you to: i) participate in activities to
benefit people in the community, ii) take part in activities promoting human rights? Iii) take part in
activities to protect the environment? iv) participate in a peaceful protest against a law considered as
unjust?”. The answers range from 1 for Not important to 4 for Very important. We create an index of
Participation in the social life by taking the average of those questions.
We measure participation in political life outside the school with the questions: “To become
a good citizen, how important is it for you to: a) vote in every election? Ii) join a political party? Iii)
follow political issues in the newspaper, on the radio or on TV?” The answers range from 1 for Not
important to 4 for Very important. We also consider two questions related to l democracy. The first
question reads:” When everyone has the right to express their opinion freely that is: i) very bad, ii)
somewhat bad, iii) somewhat good, iv) very good , for democracy?”. The second question is “When
many different organizations are available for people who wish to belong to them, that is i) very bad,
ii) somewhat bad, iii) somewhat good, iv) very good, for democracy?. We create an index

26
Participation in the political life by taking the average of those questions. Table 11 shows that
“Participation in social life” and “Participation in political life” are positively related to “work in
groups” and negatively related to “teacher lectures.” The coefficient is statistically significant at the
1 percent level for “work in groups.”, and at 5 percent for “teacher lectures”. The influence of
teaching practices on students’ answer about social capital goes beyond cooperation at school.
3.3.2 The Effects of Teaching practices on Students from Different Backgrounds
We briefly assess whether the relation between teaching practice and social capital is
different for different groups of students. We compare the relationship in schools with few versus
many students from poor socioeconomic backgrounds. From the school principal surveys, we can
compute the national average share of students from low socioeconomic backgrounds across
schools, and distinguish schools that are above or below this threshold. We do not use this
characteristic in the previous estimate due to the lack of data for four countries of the sample. We
obtain similar results when we use the class average number of books relative to the national
average as an indicator for poor socioeconomic background.
Table 6 shows that the effect of teaching practices on student beliefs in cooperation among
themselves and with teachers is particularly pronounced in schools with a high share of students
from low socioeconomic backgrounds. The coefficients on teaching practices are statistically
significant in these schools, but not in schools with below average share of students from poor
backgrounds. We get similar results for the student level of trust and association memberships.
These results might be particularly interesting if communities are particularly focuses on raising the
level of social capital of students from low socioeconomic backgrounds.
We also distinguish the role of teaching policies in countries and schools displaying a above
average variation in teaching practices, or in private schools. We expect in this case the effect of
teaching practices to be bigger since teachers have more latitude in choosing their practice.
3.4 Identification: IV estimates
So far, all the regressions control for country fixed effects, identifying the effects of teaching
practices from teacher differences. This strategy makes it possible to disentangle the role of the
teacher (or the school) from national educational policies or national social capital. But teaching
practices might still reflect the beliefs of the parents or of the local community, even after controlling
for teacher and school social capital. Teaching practices might also be influenced by student beliefs
in cooperation as the teachers adjust their practices to their audience. We address those concerns by
instrumenting teaching practices. We use two instruments: teacher gender and teacher interest in

27
more instructional time. Female teachers might be more interesting in group projects and student
cooperation. Teachers committed to completing the curriculum and feeling time pressure might be
especially focused on lecturing rather that student working in groups. Indeed, we know from Table 8
that teacher gender and interest in additional instructional time are significant predictors of teaching
practices. We discuss the validity of these instruments below. In particular, we perform F-‐tests to
test the hypothesis of weak instruments and over-‐identification tests to check the exogeneity of the
instruments.
The first issue is whether our instruments are weak. Recall from the first stage estimate in
Table 8 that teacher gender and teacher interest in more instructional time are both significant
predictors of teaching practices. A female teacher is associated with an increase by 0.22 points in the
frequency of the practice “Students work in groups”, which corresponds to 32.25 percent of the
standard deviation in this teaching practice. The relationship is statistically highly significant at the 1
percent level. A female teacher is also associated with a decrease by 0.11 points in the practice
“Teacher lectures”, which is 12.31 percent of the standard deviation of this practice. Teacher
interest in more instructional time is also highly correlated with the teaching practice chosen by the
teacher. Teachers who express this interest are more likely to lecture either because they like this
teaching practice or because they feel time constrained. Importantly, the teacher interest in more
instructional time is a significant predictor of the teaching practices even when controlling for total
instructional time at the school level.
We provide formal tests of weak instruments at the bottom of the 2SLS estimates in Table
13. We do not report the first stage estimates for each question on student beliefs since these
estimates remain approximately unchanged compared to Table 8 (Columns 1 for “Students work in
groups” and Column 2 for “Teacher lectures”). (Only the number of observations changes slightly
across questions.) We report the F-‐test of weak instruments for each question though. In all cases,
the F-‐tests are highly significant and largely reject the hypothesis of weak instruments. This result is
consistent with the first stage estimates in Table 8 showing that teacher gender and instructional
time were highly correlated with teaching methods.
The second issue is whether the instruments are exogenous relative to student beliefs and
uncorrelated with the error term. Unfortunately, we do not have teachers and students randomly
assigned to each other, so one can come up with a variety of alternative theories. For example,
teacher interest in more instructional time could depend on the social capital of the students. The
female teacher is more immune to this criticism and is obviously exogeneous with regard to the
social capital of the students. Furthermore, we do not find any correlation across schools between
28
the share of female teachers and the characteristics of the classrooms (share of girls, education of
parents, share of poor socio-‐economic background…), mitigating the concern of self-‐sorting of
female teachers into specific schools. We also recall that, as shown in Table 8, teacher gender and
teacher interest in additional instructional time predict teaching practices within and not just across
schools. This piece of evidence suggests that these variables reflect teacher preferences and styles
rather than characteristics of the communities or schools in which the teachers are employed.
We are also concerned that the instrument teacher gender might violate the exclusion
restriction. Female teachers might build up student social capital by being broadly sympathetic,
rather than through particular teaching methods (even controlling for teacher belief that the goal of
education is to promote cooperation). To sort out these concerns, we perform over-‐identification
tests of the exogeneity of instruments for each question on student beliefs. Since we use robust
standard errors, we use Wooldridge’s robust score test of over-‐identification restrictions. The p-‐
value of the over-‐identification tests are reported at the bottom of Table 13. In all cases, the p-‐
values are higher than the 10 percent level and we cannot reject the hypothesis that our instruments
are exogenous and uncorrelated with the error term. These over-‐identification tests also suggest
that instrumental variables work only through teaching practices, giving us additional confidence in
our instruments.
Table 13 reports that the second stage estimates are statistically significant at the 1 or 5
percent level for “Cooperation among students”, “Participation in political life” and “Participation in
social life”, and significant at the 10 percent level for “Cooperation with teachers” (Col. 2). When
significant, the size of the 2SLS coefficients are bigger than the previous OLS estimates, suggesting
that the OLS estimates were downward biased by the endogeneity of the teaching practices relative
to those students’ beliefs. We have also checked the robustness of our results by including the
official time of instruction by school ((ln)-‐number of weeks of instruction and (ln)-‐number of classes
by weeks). These measures could be correlated with the teacher demand for more instructional
time. The number of observations drops sharply due to missing data for some countries. But we do
not find any significant change in the 2SLS estimates. These results point to the direction of a
significant causal effect of teaching practices on student’s social capital.
The results in Table 13 provide some evidence that the influence of teaching practices on
student beliefs is not merely a correlation, but is causal. The evidence indicates that changing
teaching practices might be conducive to building the social capital of students in a classroom, quite
aside from the social capital of the community they live in.
29
4. Teaching practices and Cognitive skills
One potential reaction to our findings is that the acquisition of social capital through
horizontal teaching practices comes at the expense of substantive knowledge. Alternatively, the
teaching practices that enhance social capital might encourage cognitive performance as well. This
section addresses this question both at the individual and country level. We use the TIMSS database
for the micro estimates (recall that we could not use TIMSS to study beliefs because it does not
record them). TIMSS report test scores in mathematics for students in 8th Grade, along with teaching
practices and student backgrounds. TIMSS math performance is measured on an international
achievement scale with the mean of 500 and the standard deviation of 100. These achievement
tests are evidently representative of national cognitive skills and have been endorsed by all the
participating countries (see Martin and Kelly 1997). We measure teaching practices using the
variables: “Students take notes from the board” and “Students work in groups” from TIMSS. Recall
that these variables range from 1 for Never, 2 for Sometimes, 3 for Often, to 4 for All the time. We
also consider dummies for measuring the frequency of each teaching practice to detect potential
non-‐monotonic effects.
The regressions control for several student, teacher, and school characteristics. From the
student survey, we use information on family background, including parental education and the
number of books at home. We also include student age, as well as dummies for whether the student
was born abroad and whether she is a girl. From the teacher survey, we include the teacher’s age,
gender, highest level of formal education, and years of experience. We also use the size of the
classroom in which that teacher teaches that student. From the school principal’s survey, we use
variables indicating the shortage of instruction materials in the school (equal to 1 for None, 2 for A
little, 3 for Some, and 4 for A lot) and the community location of the school (1 for Geographically
isolated area, 2 for Village or rural area, 3 for On the outskirts of a city, and 4 for Center of the city).
Table 14 presents the OLS micro estimates. All the regressions control for country fixed
effects. Column 1 shows that “Take notes from the board” is statistically significantly negatively
related to math performance. However, Column 2 shows the same negative relationship between
math test scores and “Students work in groups.” The relationships for the two teaching practices are
both statistically significant at the 1 percent level. However, the coefficient on “Students work in
groups” is lower than that on “Take notes from the board.” This evidence suggests that it might be
useful to look for non-‐monotonic effects of teaching practices.

30
We do so by including in the regressions dummies for each frequency of each teaching
practice. We take the frequency “Never” as the reference group. Column 3 shows that taking notes
from the board “Sometimes” instead of “Never” is positively related to math performance.
However, the relationship between math test scores and taking notes from the board “Often” and
“Always” is negative. Column 4 shows that a similar non-‐monotonic pattern emerges between math
performance and the frequency with which “Students work in groups”.
The size of the coefficients on teaching practices is quite substantial. Consider the
coefficients on the dummies for the frequency of each teaching practice (Columns 3 and 4). Students
who work in groups “Sometimes” perform 7.88 test-‐score points better than students who “Never”
work in groups. This effect is of the same order of magnitude as having a teaching with one higher
educational degree, the only other teacher characteristic to be statistically significant at the 1
percent level. This effect is comparable to an increase of one and a half steps in the education of the
mother or the father. Working in groups “Often”, instead of “Never”, has a negative but not
statistically significant effect on test performance. But students who “Always” work in groups
perform 23.82 test score points lower than students who “Never” work in groups. This effect is twice
as large as that of being an immigrant. The magnitude of the coefficients on “Taking notes from the
board” is smaller. Students who take notes from the board “Sometimes” instead of “Never” do not
significantly improve their test scores. Yet students who take notes “Often” or “Always” perform
10.97 and 15.84 points lower than students who “Never” take notes from the board.
Cognitive skills are not the focus of this paper, and we cannot provide as detailed analysis of
causality in the relationship between teaching practices and cognitive skills. We have used teacher
gender as an instrument and confirmed the OLS results; the coefficients on teaching practices remain
significant in 2SLS. However, because we have changed data bases, we do not have information on
teacher interest in additional instructional time.
We conclude by looking at the aggregate implications of teaching practices for cognitive
skills. For the macro estimates, we compute country average tests scores from TIMSS. We also use
the information on cognitive tests of 15 year old students provided by PISA 2000 and 2003. From
PISA, we also take the country’s share of repeaters in secondary schools and the country average
value of the PISA index on socio-‐economic inequality in cognitive scores. This index measures the
effect of the socioeconomic background of each student on his cognitive tests. The background
includes income and the level of education of the family. The higher is the index, the higher is the
role played by the socioeconomic background of the student in his test scores. We average the
indices at the country level.

31
Table 15 presents the OLS estimates of cognitive skills controlling for income per capita and
school expenditure. We report the results for the tests score in mathematics from TIMSS 1995. We
do not find a statistically significant relationship between test scores and teaching practices. We
have checked with PISA cognitive tests, without finding any effects either. Table 15 also shows that
the average years of education are negatively related to vertical teaching. This seems to suggest that
even though teaching practices do not directly affect cognitive skills at a given grade, they might
influence the selection of students into upper grades.
Table 16 documents the effects of teaching practices for the share of repeaters and the index
of socioeconomic inequality. It is consistent with the previous results. More vertical teaching is
associated with a higher share of repeaters in secondary schools and a higher weight of socio-‐
economic backgrounds.
5. Conclusion.
We have presented a great deal of empirical evidence documenting the connection between
teaching capital and social capital. In a cross-‐section of countries, teaching practices are associated
both with beliefs supporting social capital, and several outcomes bearing on the organization of firms
and governments. In the micro data, we have documented a significant relationship between
teaching practices and social capital-‐supporting beliefs for a sample of about 70,000 students, 7,000
teachers and 4,000 schools from about 23 countries. Horizontal teaching practices, such as working
in groups, seem to promote the formation of social capital, while vertical teaching practices, such as
teachers lecturing, seem to discourage it. Finally, instrumental variable techniques, although not
perfect in our context, suggest that these correlations reflect causal effects, and not omitted
“community social capital” or reverse causality.
Overall, it appears that schools, and not just families, can produce social capital, consistent
with the case for progressive education as developed by Dewey (1944). This is a hopeful conclusion
because it suggests the possibility of altering social capital in the community through teaching
practices. In fact, the payoff to progressive education might be higher than we suggest here.
Throughout the paper, we have focused only on the social capital payoff. Yet there is a substantial
and growing body of thought that non-‐cognitive skills, which seem intimately related to social
capital, have an economic payoff as well (see, for example, Heckman 2008, Brunello and Schlotter
2010, Lindqvist and Westman 2011, Oreopoulos and Salvanes 2011). The relationship between
teaching practices and economic performance of students is one of many open areas that need to be
explored.

32
References
Aghion, Philippe, Yann Algan, Pierre Cahuc, and Andrei Shleifer (2010). “Regulation and Distrust,” Quarterly Journal of Economics, 125(3): 1015-‐1049.
Algan, Yann, and Pierre Cahuc (2010). “Inherited Trust and Growth,” American Economic Review, 100(5): 2060-‐92. Almond, Gabriel A., and Sidney Verba (1989, 1st ed. 1963). The Civic Culture: Political Attitudes and Democracy in Five Nations. London: Sage Publications. Banfield, Edward (1958). The Moral Basis of a Backward Society. New York: Free Press. Barro, Robert, and Jong Wha Lee (2001). “International Data on Educational Attainment: Updates and Implications,” Oxford Economic Papers, 53: 541–563. Benabou, Roland and Jean Tirole (2010). “Identity, Morals, and Taboos: Beliefs as Assets,” Quarterly Journal of Economics, forthcoming. Bisin Alberto, and Thierry Verdier (2001). “The Economics of Cultural Transmission and the Dynamics of Preferences,” Journal of Economic Theory, 97(2): 298–319. Bloom, Nicholas, and John Van Reenen (2010). “Why Do Management Practices Differ across Firms and Countries?” Journal of Economic Perspectives, 24(1): 203-‐224. Bloom, Nicholas, Raffaella Sadun, and John Van Reenen (2007). “The Organization of Firms Across Countries,” Stanford University Mimeo. Bourdieu, Pierre and Jean Claude Passeron (1970). La Reproduction. Minuit Edition. Bowles, Samuel, and Herbert Gintis (1976). Schooling in Capitalist America: Educational Reform and the Contradictions of Capitalist Life. New York: Basic Books. Brunello, Giorgio, and Martin Schlotter (2010). “The Effect of Non Cognitive Skills and Personality Traits on Labour Market Outcomes,” Working paper. Coleman, James (1990). Foundations of Social Theory. Cambridge, MA: Harvard University Press. Croson, Rachel, and Uri Gneezy (2009). “Gender Differences in Preferences,” Journal of Economic Literature, 47(2): 1-‐27. Dewey, John (1944). Democracy and Education, New York, NY: Dover. Djankov, Simeon, Rafael La Porta, Florencio Lopez-‐de-‐Silanes, and Andrei Shleifer (2002). “The Regulation of Entry,” Quarterly Journal of Economics, 117(1) :1–37. Djankov, Simeon, Edward Glaeser, Rafael La Porta, Florencio Lopez-‐de-‐Silanes, and Andrei Shleifer (2003). “The New Comparative Economics,” Journal of Comparative Economics,31: 595-‐619. Glaeser, Edward, Giacomo Ponzetto, and Andrei Shleifer (2007). “Why Does Democracy Need Education?” Journal of Economic Growth, 12:77-‐99.

33
Guiso, Luigi, Paola Sapienza, and Luigi Zingales (2004). “The Role of Social Capital in Financial Development,” American Economic Review, 94(3): 526–56. Guiso, Luigi, Paola Sapienza, and Luigi Zingales (2007). “Long Term Persistence,” Univ. of Chicago, Mimeo. Guiso, Luigi, Paola Sapienza, and Luigi Zingales (2008). “Social Capital as Good Culture,” Journal of the European Economic Association Papers and Proceedings, 6: 295–320. Guiso, Luigi, Paola Sapienza, and Luigi Zingales (2009). “Cultural Biases in Economic Exchange?” Quarterly Journal of Economics, 124(3): 1095–1131. Guiso, Luigi, Paola Sapienza, and Luigi Zingales (2010). “Civic Capital as the Missing Link,” NBER Working Paper No. 15845. Hanushek, Eric, and Ludger Woessmann (2010). “The Economics of International Differences in Educational Achievement,” IZA working paper.
Heckman, James (2008). “Schools, Skills and Synapses,” Economic Inquiry, 46(3): 289-‐324.
Helliwell, John, and Robert Putnam (2007). “Education and Social Capital,” Eastern Economics Journal, 33(1): 1-‐19.
Kaufmann, Dani, Aart Kraay, and Massimo Mastruzzi (2008). “Governance Matters VII: Aggregate and Individual Governance Indicators 1996–2007,” World Bank Policy Research WP 4654. Knack, Steven, and Paul Keefer (1997).“Does Social Capital Have an Economic Payoff? A Cross-‐Country Comparison,” Quarterly Journal of Economics, 112: 1251–1288. La Porta, Rafael, Florencio Lopez-‐de-‐Silanes, Andrei Shleifer, and Robert Vishny (1997). “Trust in Large Organizations,” American Economic Review Papers and Proceedings, 87(2): 333-‐338. La Porta, Rafael, Florencio Lopez-‐de-‐Silanes, and Andrei Shleifer (2008). “The Economic Consequences of Legal Origins,” Journal of Economic Literature, 46: 285–332.
Lindqvist, Erik, and Roine Westman (2011). “The Labor Market Returns to Cognitive and Noncognitive Ability: Evidence from the Swedish Experiment,” American Economic Journal: Applied Economics, 3 (1): 101-‐128.
Lipset, Seymour (1959). “Some Social Requisites for Democracy: Economic Development and Political Legitimacy,” American Political Science Review, 53: 69–105.
Martin, M.O and Douglas L. Kelly (1997). “Third International Mathematics and Science Study Technical Report,” Chesnut Hill, MA: Boston College.
Milligan, Kevin, Enrico Moretti, and Philip Oreopoulos (2004). “Does Education Improve Citizenship? Evidence from the United States and the United Kingdom,” Journal of Public Economics 88, 1667-‐1695.
Oreopoulos, Philip, and Kjell Salvanes (2011). “Priceless: the Nonpecuniary Benefits of Schooling,” Journal of Economic Perspectives 25, 159-‐184.
Putnam, Robert (1993). Making Democracy Work. Princeton, NJ: Princeton University Press.
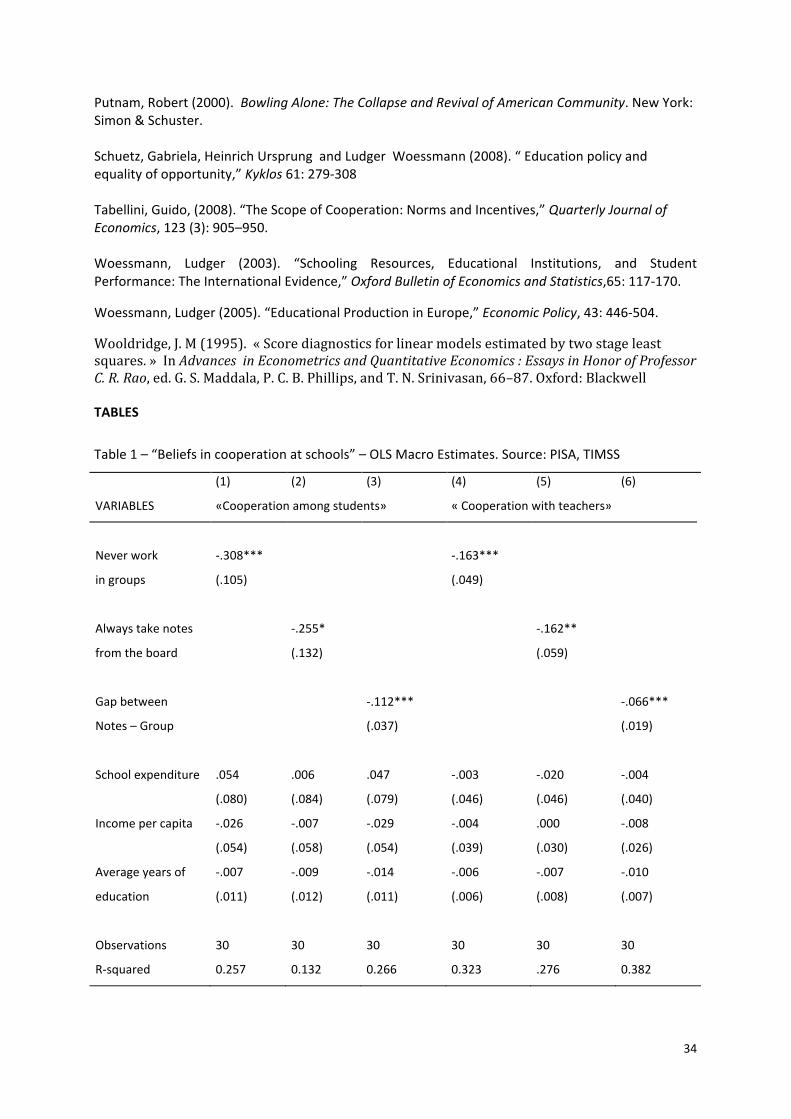
34
Putnam, Robert (2000). Bowling Alone: The Collapse and Revival of American Community. New York: Simon & Schuster. Schuetz, Gabriela, Heinrich Ursprung and Ludger Woessmann (2008). “ Education policy and equality of opportunity,” Kyklos 61: 279-‐308 Tabellini, Guido, (2008). “The Scope of Cooperation: Norms and Incentives,” Quarterly Journal of Economics, 123 (3): 905–950. Woessmann, Ludger (2003). “Schooling Resources, Educational Institutions, and Student Performance: The International Evidence,” Oxford Bulletin of Economics and Statistics,65: 117-‐170.
Woessmann, Ludger (2005). “Educational Production in Europe,” Economic Policy, 43: 446-‐504.
Wooldridge, J. M (1995). « Score diagnostics for linear models estimated by two stage least squares. » In Advances in Econometrics and Quantitative Economics : Essays in Honor of Professor C. R. Rao, ed. G. S. Maddala, P. C. B. Phillips, and T. N. Srinivasan, 66–87. Oxford: Blackwell TABLES
Table 1 – “Beliefs in cooperation at schools” – OLS Macro Estimates. Source: PISA, TIMSS
(1) (2) (3) (4) (5) (6)
VARIABLES «Cooperation among students» « Cooperation with teachers»
Never work -‐.308*** -‐.163***
in groups
(.105) (.049)
Always take notes -‐.255* -‐.162**
from the board
(.132) (.059)
Gap between -‐.112*** -‐.066***
Notes – Group
(.037) (.019)
School expenditure .054 .006 .047 -‐.003 -‐.020 -‐.004
(.080) (.084) (.079) (.046) (.046) (.040)
Income per capita -‐.026 -‐.007 -‐.029 -‐.004 .000 -‐.008
(.054) (.058) (.054) (.039) (.030) (.026)
Average years of -‐.007 -‐.009 -‐.014 -‐.006 -‐.007 -‐.010
education (.011) (.012) (.011) (.006) (.008) (.007)
Observations 30 30 30 30 30 30
R-‐squared 0.257 0.132 0.266 0.323 .276 0.382

35
Table 2 – Student feeling of alienation. OLS Macro estimates. Source: PISA, TIMSS, WVS.
(1) (2) (3) (4) (5) (6)
VARIABLES «Respect Parents» -‐ WVS «Feeling of alienation at school» -‐ PISA
Never work .088 .010
in groups (.120) (.027)
Always take notes .385*** .104***
from the board (.115) (.017)
Gap between .101** .024**
Notes – Group
(.036) (.009)
School expenditure .089 .091 .080 .030* .024 .021
(.062) (.057) (.051) (.017) (.014) (.017)
Income per capita -‐.117** -‐.112** -‐.109*** -‐.025* -‐.019* -‐.019
(.046) (.040) (.035) (.013) (.009) (.012)
Average years of -‐.019 -‐.011 -‐.010 .000 .002 .002
education (.009) (.009) (.010) (.002) (.001) (.002)
Observations 31 31 31 29 29 29
R-‐squared 0.471 0.639 0.583 0.426 0.557 0.368
Table 3 – Teaching practices, Generalized Trust and Association Membership. OLS Macro estimates. Source: TIMSS, WVS.
(1) (2) (3) (4) (5) (6)
VARIABLES «Generalized Trust » -‐ WVS « Association Membership » -‐ WVS
Never work -‐.192* .001
in groups (.107) (.160)
Always take notes -‐.400*** -‐.606***
from the board (.133) (.127)
Gap between -‐.120*** -‐.128*
Notes – Group (.035) (.064)
School expenditure -‐.165 -‐.181* -‐.166 -‐.027 -‐.086 -‐.049
(.114) (.104) (.100) (.096) (.072) (.087)
Income per capita .150** .151** .146 .098 .116** .106*
(.066) (.062) (.058) (.066) (.044) (.056)
Average years of .031 .023** .021** .068*** .049*** .052***
education (.010) (.008) (.009) (.013) (.012) (.016)
Observations 31 31 31 27 27 27
R-‐squared 0.47 0.59 0.57 0.59 0.75 0.67

36
Table 4 – Teaching practices and Trust in public officials. OLS Macro estimates. Source: ISSP, TIMSS.
(1) (2) (3) (4) (5) (6)
VARIABLES Trust in Civil Servants – ISSP Civil Servants fair -‐ ISSP
Never work -‐.217 -‐.125 in groups
(.541) (.433)
Always take notes -‐1.361** -‐1.906*** from the board
(.567) (.420)
Gap between -‐.279 -‐.392* Notes – Group
(.253) (.215)
School expenditure .071 -‐.047 -‐.193 .255 .077 .114 (.281) (.184) (.196) (.300) (.183) (.223) Income per capita .103 .137 .101 -‐.025 .013 -‐.036 (.226) (.142) (.193) (.246) (.147) (.199)
Average years of -‐.003 -‐.035 -‐.030 .011 -‐.037 -‐.030
education (.024) (.024) (.029) (.044) (.034) (.055)
Observations 20 20 20 20 20 20
R-‐squared 0.118 0.423 0.229 0.083 0.556 0.266
Table 4 (continued) – Teaching practices and Trust in public officials. OLS Macro estimates.
(7) (8) (9) VARIABLES Corruption of civil servants – ISSP 2006 Never work .560 in groups
(.392)
Always take notes 1.946*** from the board
(.470)
Gap between .406*** Notes – Group
(.123)
School expenditure .241 .505** .224 (.230) (.235) (.176) Income per capita -‐.553** -‐.637*** -‐.535*** (.210) (.180) (.161) Average years of -‐.074 -‐.033 -‐.036 education (.052) (.046) (.056) Observations 22 22 22 R-‐squared 0.596 0.771 0.684

37
Table 5 – Teaching practices and Organization of firms. OLS estimates. Source: ESS, GCR, TIMSS
(1) (2) (3) (4) (5) (6) VARIABLES Delegation of authority – GCR 2009 Freedom in daily work organization – ESS 2008 Never work -‐.930 -‐.881 in groups
(.693) (.596)
Always take notes -‐2.247*** -‐3.101*** from the board
(.629) (.993)
Gap between -‐.633** -‐.621** Notes – Group
(.253) (.273)
School expenditure -‐1.092* -‐1.180** -‐1.123** -‐.097 -‐.181 -‐.161 (.565) (.492) (.478) (1.155) (.782) (.956) Income per capita 1.104*** 1.114*** 1.112*** .999 1.014** .966* (.334) (.285) (.270) (.656) (.425) (.543) Average years of .192** .152* .136 .140 .004 .070 education (.079) (.081) (.091) (.085 (.066) (.069) Observations 28 28 28 18 18 18 R-‐squared 0.62 0.71 0.69 0.74 0.84 0.80
Table 5 (con.) – Teaching practices and Organization of firms. OLS estimates. Source GCR, TIMSS
(7) (8) (9) VARIABLES Quality of labor relations –
GCR 2009 Never work -‐1.394* in group
(.812)
Always take notes -‐2.094* from the board
(1.040)
Gap between -‐.665** Notes – Group
(.274)
School expenditure -‐.853* -‐.995* -‐.908* (.460) (.496) (.451) Income per capita .868*** .895** .869*** (.282) (.325) (.284) Average years of .128* .100 .080 education (.074) (.079) (.083) Observations 30 30 30 R-‐squared 0.482 0.541 0.582
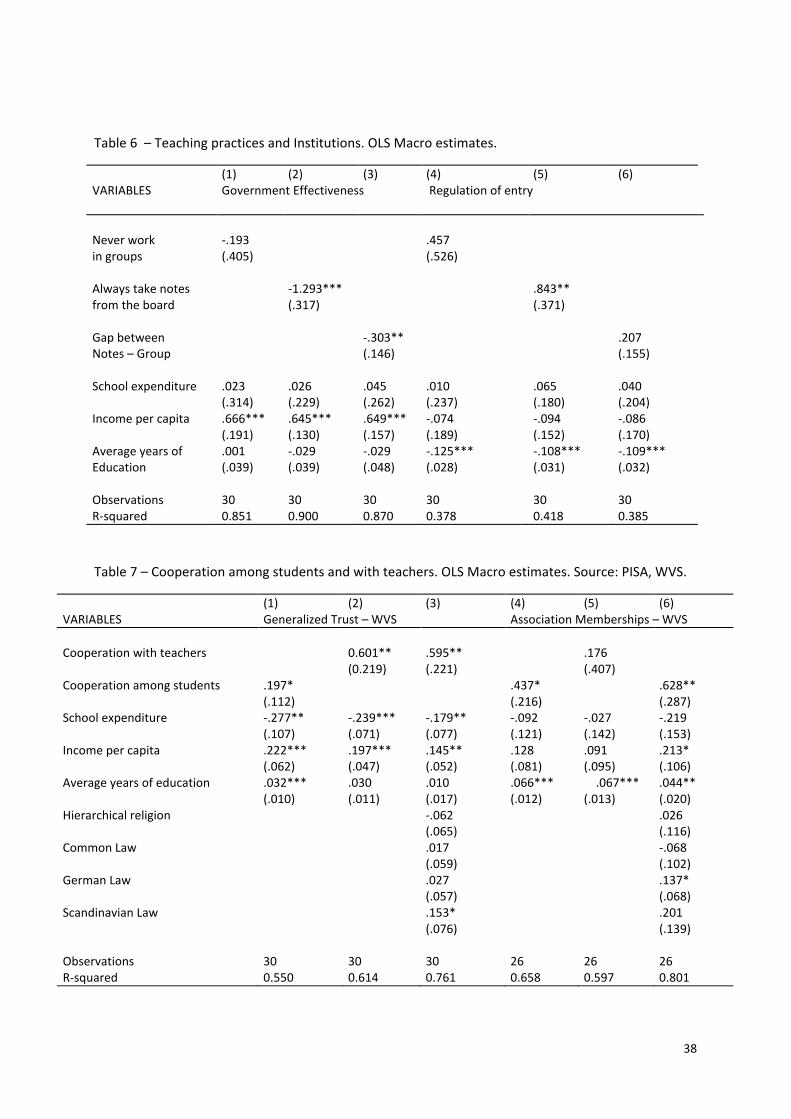
38
Table 6 – Teaching practices and Institutions. OLS Macro estimates.
(1) (2) (3) (4) (5) (6) VARIABLES Government Effectiveness
Regulation of entry
Never work -‐.193 .457 in groups
(.405) (.526)
Always take notes -‐1.293*** .843** from the board
(.317) (.371)
Gap between -‐.303** .207 Notes – Group
(.146) (.155)
School expenditure .023 .026 .045 .010 .065 .040 (.314) (.229) (.262) (.237) (.180) (.204) Income per capita .666*** .645*** .649*** -‐.074 -‐.094 -‐.086 (.191) (.130) (.157) (.189) (.152) (.170) Average years of .001 -‐.029 -‐.029 -‐.125*** -‐.108*** -‐.109*** Education (.039) (.039) (.048) (.028) (.031) (.032) Observations 30 30 30 30 30 30 R-‐squared 0.851 0.900 0.870 0.378 0.418 0.385
Table 7 – Cooperation among students and with teachers. OLS Macro estimates. Source: PISA, WVS.
(1) (2) (3) (4) (5) (6) VARIABLES Generalized Trust – WVS Association Memberships – WVS Cooperation with teachers 0.601** .595** .176 (0.219) (.221) (.407) Cooperation among students .197* .437* .628** (.112) (.216) (.287) School expenditure -‐.277** -‐.239*** -‐.179** -‐.092 -‐.027 -‐.219 (.107) (.071) (.077) (.121) (.142) (.153) Income per capita .222*** .197*** .145** .128 .091 .213* (.062) (.047) (.052) (.081) (.095) (.106) Average years of education .032*** .030 .010 .066*** .067*** .044** (.010) (.011) (.017) (.012) (.013) (.020) Hierarchical religion -‐.062 .026 (.065) (.116) Common Law .017 -‐.068 (.059) (.102) German Law .027 .137* (.057) (.068) Scandinavian Law .153* .201 (.076) (.139) Observations 30 30 30 26 26 26 R-‐squared 0.550 0.614 0.761 0.658 0.597 0.801

39
Table 8 – Sources of variations in teaching practices across schools and within schools: OLS Micro estimates. Source: CES.
Variation between schools Variation within schools VARIABLES Students work in
group Teacher lectures Students work in
groups Teacher lectures
(1) (2) (3) (4) Student Gender (female) 0.005 0.011* 0.000 0.001 (0.005) (0.006) (0.003) (0.004) Father’s education 0.004** 0.012*** 0.000 -‐0.000 (0.002) (0.002) (0.001) (0.001) Mother’s education 0.005*** 0.007*** 0.000 -‐0.000 (0.002) (0.002) (0.001) (0.0019) Number of books at home 0.004** -‐0.001 0.000 0.000 (0.002) (0.002) (0.001) (0.002) Immigrant -‐0.024** -‐0.073*** -‐0.003 0.001 (0.011) (0.015) (0.008) (0.010) Student Age -‐0.006* -‐3.40e-‐05 0.000 -‐0.000 (0.004) (0.005) (0.002) (0.003) Teacher age -‐0.049*** -‐0.026*** -‐0.042*** -‐0.032*** (0.004) (0.005) (0.004) (0.005) Teacher education 0.005 0.001 0.023*** 0.001 (0.003) (0.004) (0.003) (0.004) Teacher experience 0.004*** -‐0.000 0.004*** -‐0.001* (0.000) (0.000) (0.000) (0.000) Teacher social capital 0.147*** 0.076*** 0.162*** 0.122*** (0.005) (0.006) (0.004) (0.006) Teacher goal: promote cooperation 0.304*** -‐0.103*** 0.291*** -‐0.080*** (0.006) (0.007) (0.006) (0.007) Teacher : instructional time constraints -‐0.031*** 0.031*** -‐0.015** 0.0381*** (0.006) (0.007) (0.006) (0.007) Teacher gender 0.227*** -‐0.119*** 0.169*** -‐0.053*** (0.005) (0.007) (0.005) (0.007) Class size (ln) 0.043*** 0.141*** (0.016) (0.017) Public school -‐0.049*** -‐0.131*** (0.011) (0.013) School social capital 0.061*** -‐0.013 (0.0133) (0.016) School goal: promote cooperation -‐0.005 -‐0.047** (0.005) (0.006) Country fixed effects Yes Yes School fixed effects Yes Yes Observations 75038 74872 62838 62660 R-‐squared 0.305 0.158 0.070 0.013
Robust standard errors in parentheses *** p<0.01, ** p<0.05, * p<0.1

40
Table 9 – Student belief in cooperation among students and between students and teachers: OLS Micro estimates. Source: CES
(1) (2) (3) (4) VARIABLES Beliefs in cooperation among children Beliefs in cooperation between children
and teachers Teaching practices Students work in groups 0.0117*** 0.0212*** (0.00331) (0.00390) Teacher lectures -‐0.00817*** -‐0.00646* (0.00279) (0.00332) Controls Student Gender (female) 0.125*** 0.124*** 0.189*** 0.189*** (0.00628) (0.00629) (0.00742) (0.00742) Father’s education -‐0.00289 -‐0.00266 0.0103*** 0.0107*** (0.00251) (0.00251) (0.00299) (0.00299) Mother’s education -‐0.00373 -‐0.00365 0.00149 0.00146 (0.00261) (0.00261) (0.00309) (0.00309) Number of books at home 0.00779*** 0.00772*** 0.0247*** 0.0246*** (0.00297) (0.00297) (0.00345) (0.00345) Grade 0.651*** 0.657*** -‐0.441*** -‐0.432*** (0.0169) (0.0169) (0.0197) (0.0196) Immigrant -‐0.00178 -‐0.00297 0.0239 0.0231 (0.0133) (0.0133) (0.0155) (0.0155) Student Age -‐0.00376 -‐0.00383 -‐0.00449 -‐0.00496 (0.00466) (0.00466) (0.00552) (0.00552) Teacher age -‐0.00173 -‐0.00265 0.0104** 0.00868* (0.00400) (0.00398) (0.00481) (0.00480) Teacher education -‐0.00421 -‐0.00401 -‐0.00769** -‐0.00792** (0.00277) (0.00277) (0.00325) (0.00326) Teacher experience 0.000609 0.000640 -‐0.00103** -‐0.000868* (0.000430) (0.000430) (0.000521) (0.000521) Teacher social capital -‐0.00489 -‐0.00317 0.00297 0.00609 (0.00406) (0.00406) (0.00482) (0.00483) Teacher goal: promote cooperation 0.0146*** 0.0184*** 0.0166*** 0.0243*** (0.00519) (0.00513) (0.00610) (0.00604) Class size (ln) -‐0.0237 -‐0.0261 -‐0.0578*** -‐0.0594*** (0.0171) (0.0171) (0.0194) (0.0195) Public school 0.0318** 0.0301** -‐0.0186 -‐0.0207 (0.0129) (0.0129) (0.0152) (0.0152) School social capital 0.0328** 0.0318** 0.0808*** 0.0790*** (0.0140) (0.0141) (0.0166) (0.0166) School goal: promote cooperation 0.00515 0.00538 -‐0.0109 -‐0.0104 (0.00642) (0.00641) (0.00743) (0.00743) Country fixed effects Yes Yes Yes Yes Observations 73216 73053 72963 72798 R-‐squared 0.089 0.089 0.085 0.084
Robust standard errors in parentheses *** p<0.01, ** p<0.05, * p<0.1

41
Table 10 – Association membership and trust in institutions. OLS Micro estimates. Source: CES
(1) (2) (3) (4) VARIABLES Association Membership Trust in Institutions Teaching practices Students work in groups 0.0739*** 0.00784** (0.0134) (0.00319) Teacher lectures -‐0.0185 0.00111 (0.0118) (0.00279) Controls Student Gender (female) 0.201*** 0.203*** -‐0.0149** -‐0.0142** (0.0256) (0.0256) (0.00609) (0.00609) Father’s education 0.0581*** 0.0586*** 0.00546** 0.00555** (0.0103) (0.0103) (0.00238) (0.00238) Mother’s education 0.0768*** 0.0773*** 0.000399 0.000421 (0.0107) (0.0107) (0.00250) (0.00250) Number of books at home 0.217*** 0.217*** -‐0.00162 -‐0.00189 (0.0120) (0.0120) (0.00285) (0.00285) Grade -‐1.549*** -‐1.511*** -‐0.534*** -‐0.527*** (0.0618) (0.0612) (0.0172) (0.0171) Immigrant -‐0.0732 -‐0.0762 0.0122 0.0122 (0.0576) (0.0577) (0.0130) (0.0130) Student Age 0.0116 0.0104 -‐0.00476 -‐0.00465 (0.0205) (0.0205) (0.00479) (0.00479) Teacher age 0.0117 0.00569 0.00226 0.00189 (0.0160) (0.0161) (0.00389) (0.00389) Teacher education -‐0.0206* -‐0.0199* -‐0.00588** -‐0.00606** (0.0115) (0.0116) (0.00270) (0.00271) Teacher experience -‐0.000297 8.81e-‐05 -‐1.65e-‐05 2.86e-‐06 (0.00171) (0.00171) (0.000422) (0.000423) Teacher social capital 0.000252 0.00924 0.00485 0.00504 (0.0174) (0.0174) (0.00407) (0.00407) Teacher goal: promote cooperation -‐0.0382* -‐0.0121 0.00816 0.0113** (0.0212) (0.0210) (0.00504) (0.00497) Class size (ln) -‐0.355*** -‐0.357*** -‐0.0315* -‐0.0314* (0.0666) (0.0671) (0.0169) (0.0170) Public school -‐0.131** -‐0.138** 0.0136 0.0132 (0.0563) (0.0564) (0.0125) (0.0125) School social capital 0.0659 0.0666 0.0515*** 0.0507*** (0.0581) (0.0582) (0.0138) (0.0138) School goal: promote cooperation 0.00615 0.00388 0.000298 0.000454 (0.0257) (0.0257) (0.00616) (0.00616) Country fixed effects Yes Yes Yes Yes Observations 75038 74872 73958 73793 R-‐squared 0.133 0.132 0.090 0.090
Robust standard errors in parentheses *** p<0.01, ** p<0.05, * p<0.1

42
Table 11 – Student attitudes towards Political and Social Life. OLS Micro estimates. Source: CES.
(1) (2) (3) (4) VARIABLES Index Participation Political Life Index Participation Social life Teaching practices Students work in groups 0.0113*** 0.0101*** (0.00277) (0.00354) Teacher lectures -‐0.00521** -‐0.00779** (0.00238) (0.00305) Controls Student Gender (female) 0.0127** 0.0128** 0.0449*** 0.0453*** (0.00531) (0.00531) (0.00679) (0.00679) Father’s education 0.0132*** 0.0137*** -‐0.000819 -‐0.000353 (0.00212) (0.00212) (0.00273) (0.00272) Mother’s education 0.0131*** 0.0131*** 0.00301 0.00294 (0.00219) (0.00219) (0.00280) (0.00280) Number of books at home 0.0244*** 0.0241*** 0.00828*** 0.00815*** (0.00249) (0.00249) (0.00314) (0.00315) Grade -‐0.237*** -‐0.231*** -‐0.585*** -‐0.581*** (0.0143) (0.0142) (0.0180) (0.0179) Immigrant 0.0363*** 0.0365*** 0.0422*** 0.0413*** (0.0111) (0.0111) (0.0142) (0.0142) Student Age -‐0.00795* -‐0.00817** -‐0.0150*** -‐0.0148*** (0.00407) (0.00407) (0.00527) (0.00526) Teacher age -‐1.89e-‐05 -‐0.00100 -‐0.00226 -‐0.00264 (0.00343) (0.00342) (0.00442) (0.00442) Teacher education -‐0.000966 -‐0.00138 0.00124 0.000917 (0.00236) (0.00236) (0.00306) (0.00306) Teacher experience 0.000291 0.000375 0.000873* 0.000923** (0.000368) (0.000369) (0.000467) (0.000468) Teacher social capital 0.00555 0.00642* -‐0.00436 -‐0.00281 (0.00349) (0.00350) (0.00446) (0.00448) Teacher goal: promote cooperation -‐0.00465 -‐0.00112 0.00844 0.0107* (0.00435) (0.00429) (0.00561) (0.00553) Class size (ln) -‐0.00408 -‐0.00365 -‐0.0139 -‐0.0118 (0.0139) (0.0140) (0.0186) (0.0187) Public school 0.00134 0.000312 0.0502*** 0.0489*** (0.0108) (0.0108) (0.0144) (0.0144) School social capital 0.0365*** 0.0355*** 0.0193 0.0210 (0.0121) (0.0121) (0.0154) (0.0154) School goal: promote cooperation 0.00984* 0.00957* 0.00946 0.00804 (0.00531) (0.00531) (0.00690) (0.00689) Country fixed effects Yes Yes Yes Yes Observations 74474 74308 74131 73965 R-‐squared 0.110 0.109 0.083 0.083
Robust standard errors in parentheses *** p<0.01, ** p<0.05, * p<0.1

43
Table 12 –Socio Economic Family Backgrounds and the relation between Teaching practices and Students Beliefs. OLS Micro Estimates. Source: CES.
Beliefs in cooperation among students Beliefs in cooperation with teachers (1) (2) (3) (4) (5) (6) (7) (8) VARIABLES Share of low
socioeconomic backgrounds
< National average
Share of low socioeconomic backgrounds
> National average
Share of low socioeconomic backgrounds
< National average
Share of low socioeconomic backgrounds
> National average Students work 0.008 0.012** 0.014 0.028*** in groups (0.006) (0.006) (0.009) (0.009) Teacher Lectures
-‐0.009* -‐0.013*** -0.004 -0.019***
(0.005) (0.004) (0.005) 0.005) Observations 36142 35979 29485 29489 36035 35872 29401 29404 R-squared 0.094 0.094 0.096 0.096 0.071 0.071 0.093 0.093
Additional controls. Student level: age, gender, immigrant, number of books at home, education of the parents. Teacher level: age, gender, education, years of experience, trust, attitudes towards cooperation. School level: (ln)-‐size of the class, public institution, social capital. Country fixed effects. Robust standard errors clustered at the student level *** p<0.01, ** p<0.05, * p<0.1
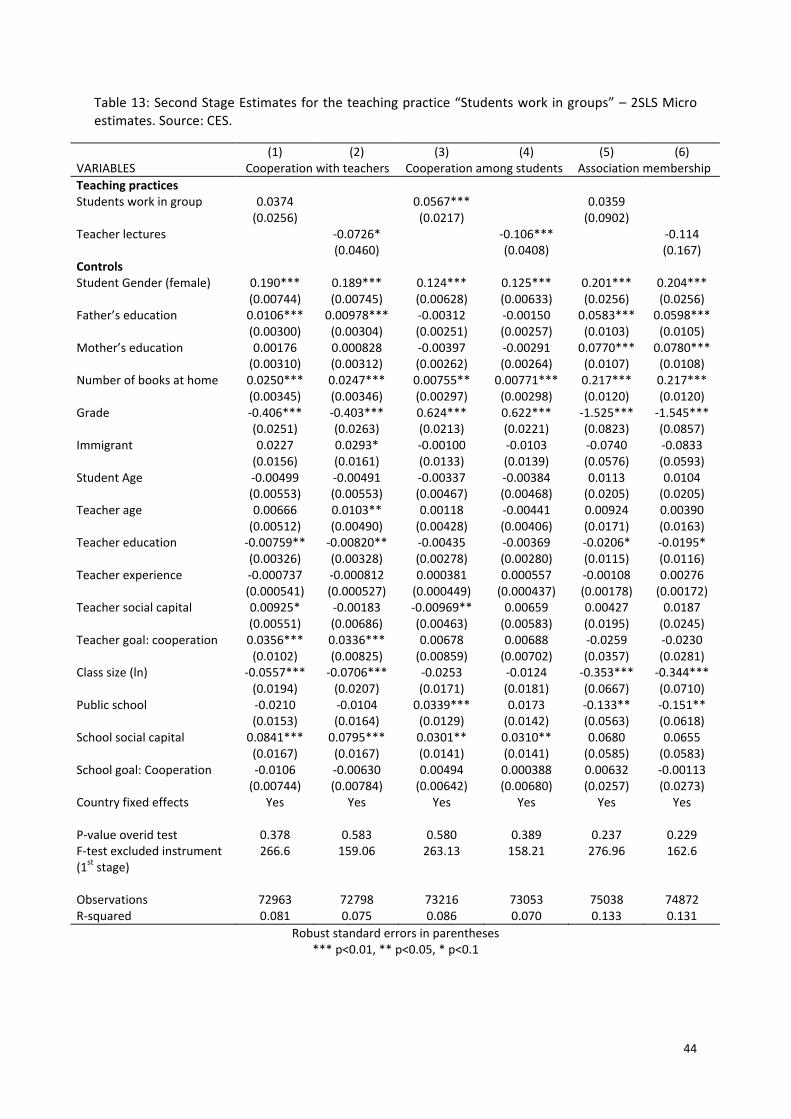
44
Table 13: Second Stage Estimates for the teaching practice “Students work in groups” – 2SLS Micro estimates. Source: CES.
(1) (2) (3) (4) (5) (6) VARIABLES Cooperation with teachers Cooperation among students Association membership Teaching practices Students work in group 0.0374 0.0567*** 0.0359 (0.0256) (0.0217) (0.0902) Teacher lectures -‐0.0726* -‐0.106*** -‐0.114 (0.0460) (0.0408) (0.167) Controls Student Gender (female) 0.190*** 0.189*** 0.124*** 0.125*** 0.201*** 0.204*** (0.00744) (0.00745) (0.00628) (0.00633) (0.0256) (0.0256) Father’s education 0.0106*** 0.00978*** -‐0.00312 -‐0.00150 0.0583*** 0.0598*** (0.00300) (0.00304) (0.00251) (0.00257) (0.0103) (0.0105) Mother’s education 0.00176 0.000828 -‐0.00397 -‐0.00291 0.0770*** 0.0780*** (0.00310) (0.00312) (0.00262) (0.00264) (0.0107) (0.0108) Number of books at home 0.0250*** 0.0247*** 0.00755** 0.00771*** 0.217*** 0.217*** (0.00345) (0.00346) (0.00297) (0.00298) (0.0120) (0.0120) Grade -‐0.406*** -‐0.403*** 0.624*** 0.622*** -‐1.525*** -‐1.545*** (0.0251) (0.0263) (0.0213) (0.0221) (0.0823) (0.0857) Immigrant 0.0227 0.0293* -‐0.00100 -‐0.0103 -‐0.0740 -‐0.0833 (0.0156) (0.0161) (0.0133) (0.0139) (0.0576) (0.0593) Student Age -‐0.00499 -‐0.00491 -‐0.00337 -‐0.00384 0.0113 0.0104 (0.00553) (0.00553) (0.00467) (0.00468) (0.0205) (0.0205) Teacher age 0.00666 0.0103** 0.00118 -‐0.00441 0.00924 0.00390 (0.00512) (0.00490) (0.00428) (0.00406) (0.0171) (0.0163) Teacher education -‐0.00759** -‐0.00820** -‐0.00435 -‐0.00369 -‐0.0206* -‐0.0195* (0.00326) (0.00328) (0.00278) (0.00280) (0.0115) (0.0116) Teacher experience -‐0.000737 -‐0.000812 0.000381 0.000557 -‐0.00108 0.00276 (0.000541) (0.000527) (0.000449) (0.000437) (0.00178) (0.00172) Teacher social capital 0.00925* -‐0.00183 -‐0.00969** 0.00659 0.00427 0.0187 (0.00551) (0.00686) (0.00463) (0.00583) (0.0195) (0.0245) Teacher goal: cooperation 0.0356*** 0.0336*** 0.00678 0.00688 -‐0.0259 -‐0.0230 (0.0102) (0.00825) (0.00859) (0.00702) (0.0357) (0.0281) Class size (ln) -‐0.0557*** -‐0.0706*** -‐0.0253 -‐0.0124 -‐0.353*** -‐0.344*** (0.0194) (0.0207) (0.0171) (0.0181) (0.0667) (0.0710) Public school -‐0.0210 -‐0.0104 0.0339*** 0.0173 -‐0.133** -‐0.151** (0.0153) (0.0164) (0.0129) (0.0142) (0.0563) (0.0618) School social capital 0.0841*** 0.0795*** 0.0301** 0.0310** 0.0680 0.0655 (0.0167) (0.0167) (0.0141) (0.0141) (0.0585) (0.0583) School goal: Cooperation -‐0.0106 -‐0.00630 0.00494 0.000388 0.00632 -‐0.00113 (0.00744) (0.00784) (0.00642) (0.00680) (0.0257) (0.0273) Country fixed effects
Yes Yes Yes Yes Yes Yes
P-‐value overid test 0.378 0.583 0.580 0.389 0.237 0.229 F-‐test excluded instrument (1st stage)
266.6 159.06 263.13 158.21 276.96 162.6
Observations 72963 72798 73216 73053 75038 74872 R-‐squared 0.081 0.075 0.086 0.070 0.133 0.131
Robust standard errors in parentheses *** p<0.01, ** p<0.05, * p<0.1

45
Table 13 (Continued): Second Stage Estimates for the teaching practice “Students work in groups” – 2SLS Micro estimates. Source: CES.
(7) (8) (9) (10) (11) (12) VARIABLES Index Participation
Political life Index Participation
Social life Trust in institutions
Teaching practices Students work in group 0.0285* 0.0873*** 0.0154 (0.0102) (0.0236) (0.0212) Teacher lectures -‐0.0538** -‐0.164*** -‐0.0339 (0.0240) (0.0445) (0.0396) Controls Student Gender (female) 0.0126** 0.0133** 0.0443*** 0.0470*** -‐0.0150** -‐0.0139** (0.00531) (0.00533) (0.00680) (0.00687) (0.00609) (0.00611) Father’s education 0.0131*** 0.0142*** -‐0.00122 0.00154 0.00542** 0.00597** (0.00212) (0.00216) (0.00274) (0.00280) (0.00238) (0.00243) Mother’s education 0.0130*** 0.0135*** 0.00257 0.00420 0.000355 0.000709 (0.00219) (0.00221) (0.00281) (0.00283) (0.00250) (0.00252) Number of books at home 0.0243*** 0.0241*** 0.00795** 0.00799** -‐0.00166 -‐0.00194 (0.00249) (0.00250) (0.00315) (0.00317) (0.00285) (0.00285) Grade -‐0.248*** -‐0.248*** -‐0.633*** -‐0.637*** -‐0.538*** -‐0.539*** (0.0182) (0.0189) (0.0230) (0.0242) (0.0215) (0.0223) Immigrant 0.0366*** 0.0327*** 0.0438*** 0.0294** 0.0124 0.00947 (0.0111) (0.0115) (0.0143) (0.0148) (0.0130) (0.0133) Student Age -‐0.00782* -‐0.00814** -‐0.0144*** -‐0.0148*** -‐0.00470 -‐0.00462 (0.00408) (0.00407) (0.00528) (0.00529) (0.00479) (0.00479) Teacher age 0.00108 -‐0.00192 0.00271 -‐0.00551 0.00274 0.00125 (0.00364) (0.00348) (0.00470) (0.00456) (0.00414) (0.00395) Teacher education -‐0.000998 -‐0.00115 0.00103 0.00156 -‐0.00590** -‐0.00592** (0.00236) (0.00237) (0.00307) (0.00312) (0.00270) (0.00271) Teacher experience 0.000205 0.000337 0.000484 0.000794* 0.00235 0.0056 (0.000382) (0.000372) (0.000486) (0.000480) (0.00431) (0.00422) Teacher social capital 0.00373 0.0113** -‐0.0125** 0.0130** 0.00405 0.00856 (0.00393) (0.00496) (0.00506) (0.00649) (0.00464) (0.00568) Teacher goal: cooperation -‐0.0102 -‐0.00680 -‐0.0166* -‐0.00764 0.00573 0.00718 (0.00725) (0.00582) (0.00935) (0.00761) (0.00830) (0.00667) Class size (ln) -‐0.00471 0.00333 -‐0.0167 0.0107 -‐0.0318* -‐0.0264 (0.0140) (0.0148) (0.0187) (0.0200) (0.0169) (0.0180) Public school 0.00210 -‐0.00621 0.0536*** 0.0281* 0.0139 0.00857 (0.0108) (0.0119) (0.0144) (0.0157) (0.0125) (0.0136) School social capital 0.0355*** 0.0351*** 0.0148 0.0198 0.0510*** 0.0505*** (0.0121) (0.0121) (0.0155) (0.0155) (0.0139) (0.0138) School goal: cooperation 0.00978* 0.00698 0.00918 -‐0.000247 0.000268 -‐0.00141 (0.00531) (0.00560) (0.00690) (0.00734) (0.00616) (0.00654) Country fixed effects
Yes Yes Yes Yes Yes Yes
P-‐value overid test 0.223 0.159 0.798 0.480 0.894 0.742 F-‐test excluded instrument (1st stage)
278.64 162.79 276.69 162.228 271.24 159.14
Observations 74474 74308 74131 73965 73958 73793 R-‐squared 0.109 0.103 0.076 0.042 0.090 0.087
Robust standard errors in parentheses *** p<0.01, ** p<0.05, * p<0.1
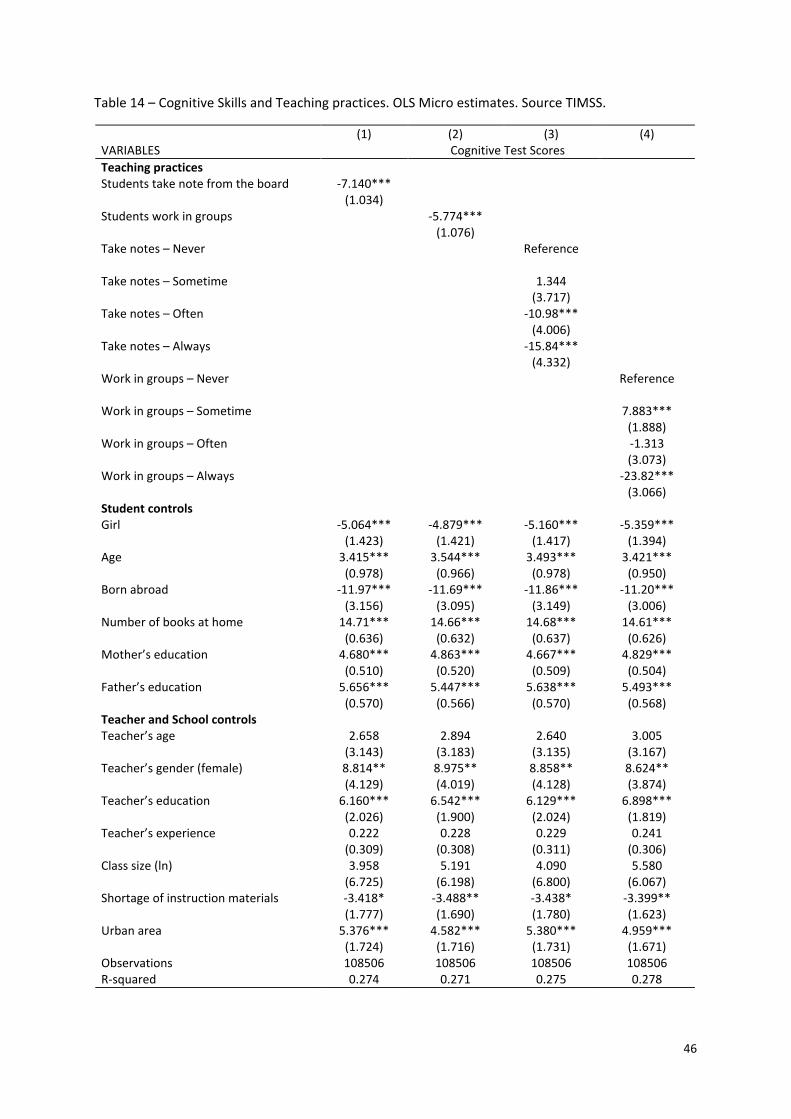
46
Table 14 – Cognitive Skills and Teaching practices. OLS Micro estimates. Source TIMSS.
(1) (2) (3) (4) VARIABLES Cognitive Test Scores Teaching practices Students take note from the board -‐7.140*** (1.034) Students work in groups -‐5.774*** (1.076) Take notes – Never
Reference
Take notes – Sometime 1.344 (3.717) Take notes – Often -‐10.98*** (4.006) Take notes – Always -‐15.84*** (4.332) Work in groups – Never Reference Work in groups – Sometime 7.883*** (1.888) Work in groups – Often -‐1.313 (3.073) Work in groups – Always -‐23.82*** (3.066) Student controls Girl -‐5.064*** -‐4.879*** -‐5.160*** -‐5.359*** (1.423) (1.421) (1.417) (1.394) Age 3.415*** 3.544*** 3.493*** 3.421*** (0.978) (0.966) (0.978) (0.950) Born abroad -‐11.97*** -‐11.69*** -‐11.86*** -‐11.20*** (3.156) (3.095) (3.149) (3.006) Number of books at home 14.71*** 14.66*** 14.68*** 14.61*** (0.636) (0.632) (0.637) (0.626) Mother’s education 4.680*** 4.863*** 4.667*** 4.829*** (0.510) (0.520) (0.509) (0.504) Father’s education 5.656*** 5.447*** 5.638*** 5.493*** (0.570) (0.566) (0.570) (0.568) Teacher and School controls Teacher’s age 2.658 2.894 2.640 3.005 (3.143) (3.183) (3.135) (3.167) Teacher’s gender (female) 8.814** 8.975** 8.858** 8.624** (4.129) (4.019) (4.128) (3.874) Teacher’s education 6.160*** 6.542*** 6.129*** 6.898*** (2.026) (1.900) (2.024) (1.819) Teacher’s experience 0.222 0.228 0.229 0.241 (0.309) (0.308) (0.311) (0.306) Class size (ln) 3.958 5.191 4.090 5.580 (6.725) (6.198) (6.800) (6.067) Shortage of instruction materials -‐3.418* -‐3.488** -‐3.438* -‐3.399** (1.777) (1.690) (1.780) (1.623) Urban area 5.376*** 4.582*** 5.380*** 4.959*** (1.724) (1.716) (1.731) (1.671) Observations 108506 108506 108506 108506 R-‐squared 0.274 0.271 0.275 0.278
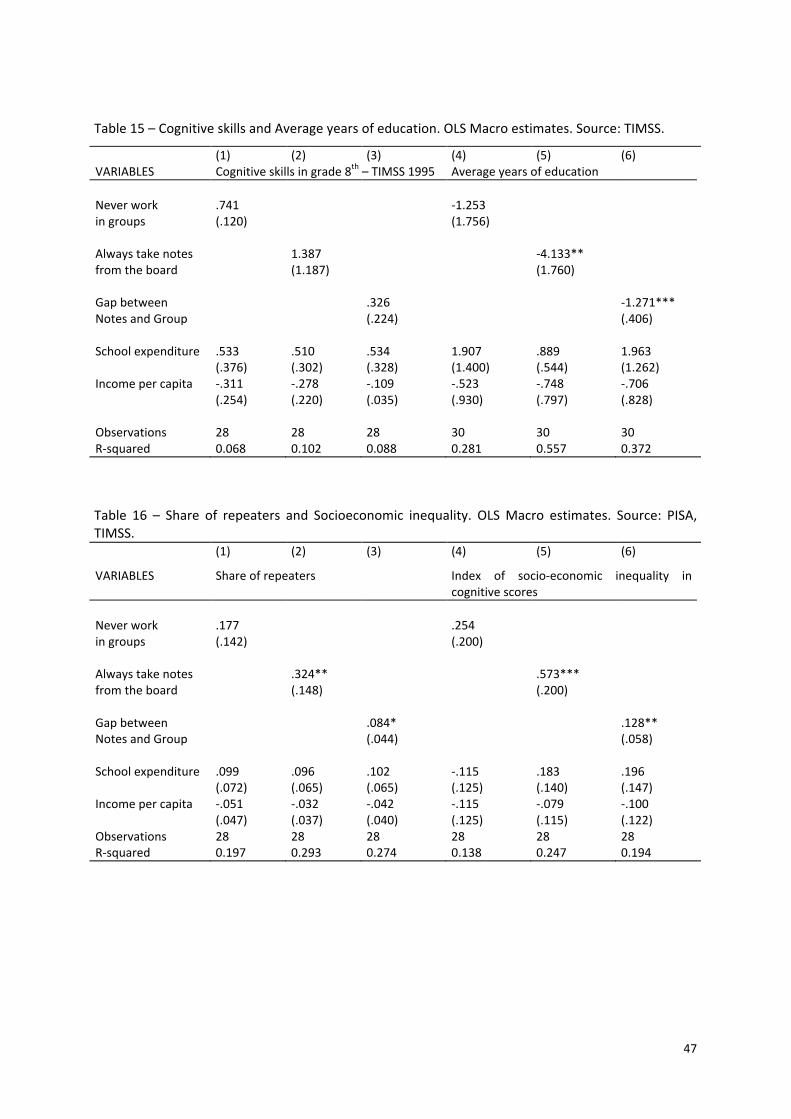
47
Table 15 – Cognitive skills and Average years of education. OLS Macro estimates. Source: TIMSS.
(1) (2) (3) (4) (5) (6) VARIABLES Cognitive skills in grade 8th – TIMSS 1995 Average years of education Never work .741 -‐1.253 in groups
(.120) (1.756)
Always take notes 1.387 -‐4.133** from the board
(1.187) (1.760)
Gap between .326 -‐1.271*** Notes and Group
(.224) (.406)
School expenditure .533 .510 .534 1.907 .889 1.963 (.376) (.302) (.328) (1.400) (.544) (1.262) Income per capita -‐.311 -‐.278 -‐.109 -‐.523 -‐.748 -‐.706 (.254) (.220) (.035) (.930) (.797) (.828) Observations 28 28 28 30 30 30 R-‐squared 0.068 0.102 0.088 0.281 0.557 0.372
Table 16 – Share of repeaters and Socioeconomic inequality. OLS Macro estimates. Source: PISA, TIMSS. (1) (2) (3) (4) (5) (6)
VARIABLES Share of repeaters Index of socio-‐economic inequality in cognitive scores
Never work .177 .254 in groups
(.142) (.200)
Always take notes .324** .573*** from the board
(.148) (.200)
Gap between .084* .128** Notes and Group
(.044) (.058)
School expenditure .099 .096 .102 -‐.115 .183 .196 (.072) (.065) (.065) (.125) (.140) (.147) Income per capita -‐.051 -‐.032 -‐.042 -‐.115 -‐.079 -‐.100 (.047) (.037) (.040) (.125) (.115) (.122) Observations 28 28 28 28 28 28 R-‐squared 0.197 0.293 0.274 0.138 0.247 0.194

48
Appendix
Appendix A – Descriptive statistics
Table A1-‐ Definition and descriptive statistics for the database “Civic Education Study”.
Variable definitions Mean Standard deviation
“Teacher lectures”: This variable derives from the question: “In your class, how often does the teacher lecture?” The answer equals 1 for “Never”, 2 for “Sometimes”, 3 for “Often” and 4 for “Very often”. Source: Teacher survey
2.338 .868
“Students work in groups”: This variable derives from the question: “In your class, how often do the students work in groups?” The answer equals 1 for “Never”, 2 for “Sometimes”, 3 for “Often” and 4 for “Very often”. Source: Teacher survey
2.557 .787
Teacher’s age. Variable with six categories: 1=under 25 years old, 2= 25-‐29 years old, 3= 30-‐39 years old, 4=40-‐49 years old, 5=50-‐59 years old, 6=60 years old or more. Source: Teacher survey
3.667 1.109
Teacher’s education. This variable measures the highest level of former education, in 5 categories. Source: Teacher survey
3.076 1.235
Teacher’s experience: number of years of teaching altogether. Source: Teacher survey 16.712 10.599
Teacher’s gender: dummy variable equal 1 if female, and 0 for male. Source Teacher survey
.668 .470
Teacher’s trust: This variable is the average of questions1)“How much confidence do you have in the political system?”,2) “How much confidence do you have in elections?”, 3) “How much confidence do you have in the judicial system?”, 4) “How much confidence do you have in immigration?”, 5) “How much confidence do you have in social welfare?”, 6) “How much confidence do you have in labor unions?”. The answers equal 1 for “Not at all”, 2 for “Little confidence”, 3 for “Confident” and 4 for “Very confident”. Source: Teacher survey
2.615 .574
Teacher’s beliefs in cooperation: This variable is the average of the questions 1)“Students learn at school to understand people” and 2) “Students learn at school is to cooperate in groups”. The answers range from 1 for “Strongly disagree” to 4 for “Strongly agree”. Source: Teacher survey.
3.074 .484
Size of the class: number of students per classroom. Source: School Survey 25.66 6.48
School social capital: “How frequently each of the following occurs at your school? a) Vandalism, b) Drugs, c) Truancy, d) Racism, e) Religious intolerance, f) Alcohol, g) Bullying, h) Violence”. 1=Often, 2=Sometimes, 3=Never. Average answers. Source: School Survey
1.47 0.26

49
Table A1 (continued)
Variables – Student characteristics Means Standard deviation
Student age: number of years. Source: Student survey 14.166 .704
Student gender: dummy equal 1 if female, and 0 otherwise. Source: Student survey
Immigrant: dummy variable equal 1 if the student is born abroad, 0 otherwise. Source: Student survey
.066 .247
Grade: variable equal 8 for the 8th grade, and 9 for the 9th grade. Only one grade per country. Source: student survey
8.337 .473
Mother’s education: This variable derives from the question “How far in school did your mother go?” The answer equals 1=No elementary education, 2=Finish elementary school, 3= high school, 4=Completed high school, 5= Some higher technical education, 6=Some college, university, 7=Graduate education. Source: Student survey
4.156 1.578
Father’s education: This variable derives from the question “How far in school did your father go?” The answer equals =No elementary education, 2=Finish elementary school, 3= high school, 4=Completed high school, 5= Some higher technical education, 6=Some college, university, 7=Graduate education. Source: Student survey
4.183 1.563
Number of books at home: measured by the question “How many books are there in your home?”. The answer has 7 categories: 1=None, 2=1-‐10 books, 3=11-‐50 books, 4=51-‐100 books, 5=101-‐200 books, 6=more than 200 books. Source: Student survey
4.287 1.350
“Student’s belief in cooperation among students“. This variable is the average of the questions: 1) “The goal of education is to understand people with different ideas” and 2) “The goal of education is to learn how to cooperate in groups with other students”. The answers ranges from 1 for Strongly Disagree, 2 for Disagree, 3 for Agree and 4 for Strongly Agree. Source: student survey
3.136 .556
“Student’s belief in cooperation between students and teacher“. This variable is the average of the questions: 1) “Are students encouraged to make up their own opinion?”, 2)“Do teacher respect your opinion?”, 3)“ Do you feel free to express opinions in class?”, 4)“Do you feel free to openly disagree with the teacher?”. The answers range from 1 for strongly disagree to 4 for strongly agree. Source: student survey.
3.040 .660
“Student association membership”. This variable is the sum of the 15 items related to an association membership: “Have you ever participated to: A student council? A youth organization? A school newspaper? An environmental organization? A U.N or UNESCO Club? A Student exchange program? A Human Rights Organization? A Group Conducting Activities? A Charity Collecting ? A boy or girl scout group? A cultural association? A computer club? An art, drama or music association? A Sport Organization? An association supported by a religious group?“.. For each association, the answer equal 1 if the respondent participates to it and 0 otherwise. Source: student survey.
2.955 2.331
“Student’s level of trust”. This variable is the average of the questions “How much confidence do you have in: 1) Justice? 2) The Police?,3) Education institutions/Schools?”. The answers equal 1 for “Not at all”, 2 for “Little confidence”, 3 for “Confident” and 4 for “Very confident”. Source: Student survey
2.824 .537

50
Table A2 – Samples of schools and teaching practices. Source: CES.
Country Number of schools
Number of students
Country level
Lecture
Mean Std
Country level
Group
Mean Std
Within school variation (std)
Lecture Group
AUS 142 3330 2.199 .677 2.745 .725 .098 .091
BGR 139 2674 2.687 .823 2.273 .751 .295 .346
CHE 155 3065 1.564 .680 2.510 .760 .214 .139
CHL 180 5688 2.601 .727 3.248 .687 .210 .186
CYP 61 3106 2.688 .768 2.256 .698 .392 .478
CZE 148 3607 2.400 .843 2.196 .685 .247 .352
DEU 169 3700 1.591 .675 2.260 .660
DNK 173 3124 2.073 .626 2.961 .677 .126 .086
EST 122 2927 2.365 .793 2.343 .737 .215 .239
FIN 146 2780 2.375 .801 2.445 .621 .065 .052
GRC 139 3391 2.656 .901 2.043 .712 .266 .306
HUN 146 3167 2.338 .872 2.239 .680
ITA 172 3808 2.942 .726 2.382 .754 .028 .019
LTU 169 3494 2.127 .830 2.519 .701
LVA 130 2572 2.359 .784 2.395 .683 .336 .446
NOR 150 3258 2.478 .628 2.665 .690 .175 .195
POL 178 3347 2.798 .811 3.071 .788 .140 .157
PRT 148 3228 2.450 .731 2.270 .528 .215 .391
ROM 146 2985 3.185 .832 2.231 .795 .202 .291
RUS 184 2120 2.968 .700 2.120 .653 .055 .026
SVK 145 3456 1.977 .884 2.364 .651 .198 .324
SVN 149 3068 1.941 .845 2.701 .754 .202 .250
SWE 138 3071 2.276 .574 2.663 .747 .201 .101
UK 128 3039 1.864 .762 2.475 .751 .344 .366
USA 124 2811 2.428 .817 2.720 .788