Embed Size (px)
Citation preview

TEACHING AND VISUALIZING FITTS’ LAW
By
GAVIN JOEL SIMONS [email protected]
A Thesis Submitted to the Honors College
In Partial Fulfillment of the Bachelors Degree With Honors in
Computer Science
THE UNIVERSITY OF ARIZONA
DECEMBER 2011
Approved by:
Professor Richard T. SnodgrassDepartment of Computer Science

STATEMENT BY AUTHOR
This thesis has been submitted in partial fulfillment of requirements for adegree at The University of Arizona and is deposited in the UniversityLibrary to be made available to borrowers under rules of the Library.
Signed:
1

Abstract
The purpose of this thesis was to develop a laboratory activity and an associated program which would conveythe concepts of Fitts’ Law and what Fitts’ Law is used for in the real world. The program is called QuikFitt,which is designed to demonstrate and teach the computer science theory of Fitts’ Law to people without abackground in computer science and to present it in such a manner that people see it as genuine science.QuikFitt is part of the larger LoCuS [1] project, which is composed of many programs like QuikFitt whicheach demonstrate and explain a different concept or theory from computer science. The majority of this thesisis the QuikFitt program, which I developed from start to finish and is currently being deployed by the LoCuSproject. It was an interesting experience, since I had to research the theory and learn it well enough to teach it.Also, writing the code for everything was fairly difficult since I had to learn several new techniques in areas ofcomputer science that I have relatively little experience with. Overall it was a good experience since I learnedboth how to handle a large project and work in a team.

1 Introduction
Out of the many fields of science, there is one where its members are not seen as scientists by the generalpublic. I speak, of course, about the field of computer science. Despite having the word ”science” in thetitle, computer scientists are often just seen as some sort of engineer, only making products and never doinganything equivalent to the physicist shooting molecules with a laser or the geologist analyzing rocks in a lab.However, this perception is false and there are many theories and concepts in the field of computer sciencethat are on the same scientific level as Newton’s Laws of Motion or the Theory of Relativity.
The program QuikFitt is designed to demonstrate and teach the computer science theory of Fitts’ Law topeople without a background in computer science and to present it in such a manner that people see it asgenuine science. QuikFitt is part of the larger LoCuS [1] project, which is composed of many programslike QuikFitt, each demonstrating a specific concept or theory from computer science. To teach Fitts’ Law,QuikFitt is used by the main LoCuS program which runs a lab. This lab is similar in format to a traditionalscience lab; there is a pre-lab, a procedure, hypothesis, and so on. This is meant to get the student to betterconnect the theories and concepts being presented with real science.
LoCuS labs in general are also intended to be similar to the computer-based labs which are often seen inhigh schools. Programs which allow a teacher to do things with their students which may be impossible to dootherwise, such as a virtual dissection of a human or reconstruction of a dinosaur skeleton. Within LoCuSlabs programs like QuikFitt are refereed to as apparatuses, since each program is used like a tool in the labsto help teach a concept. Apparatuses are much like equipment found in real-life labs, such as microscopesor spectrometers. The idea is that a high school teacher can use a computer science lab from LoCuS toeasily introduce their students to computer science theories and concepts, even if the teacher has little to nobackground in computer science. This document will focus mostly on background information of Fitts’ Law,information on how the program works, the layout of the lab QuikFitt will use when it is released, possiblefuture improvements, and the experience I had in creating the program.
1

2 The Theory
Fitts’ Law was first conceived of in 1954 by Pail Fitts’, and has since developed to a formula which can predictthe amount of time it will take a user to move a pointer between two specified points on a computer screenusing any sort of input device, which could be a mouse, a keyboard, or even a stylus [4] [5]. A subject moves apointer from a point A to a point B, and the time it takes the subject to do that is recorded. This is repeatedseveral times, with the distance between A and B and the distance across B varying. Once all this data iscollected, it is put into the Fitts’ Law formula so that it can account for the user’s unique reaction times.Then, we are then able to predict how long it will take the subject to move the pointer between any points Aand B.
2.1 Fitts’ Law Formula
The following goes into detail about the formula and the variables that make it up:
Fitts’ Law: MT = r + s·log2(DA )+1) [3]
• Task : A task consists of moving a pointer from the start to the target as quickly and accurately aspossible.
• start : The first point selected in the task by using an input device, meant to represent a random pointon a computer screen where a user would begin before moving the pointer. It is from here that we beginmeasuring D.
• target : This is the second point that is selected in the task, meant to represent the point a user wouldmove a pointer to. It is the center of target where we stop measuring D.
• r : The y-intercept coefficient in the regression. A constant, representing the time needed to use theinput device and their reaction time. An example would be depressing the mouse’s left button once thetarget is reached. The user first needs to register that they have entered the target, and then they mustpush the button, a process which is not instantaneous. This varies from person to person and machineto machine.
• s: The slope coefficient in the regression. s is representative of the user’s human motor system’s capacityto process information, essentially their reaction time.
• MT : Movement Time, the total time it takes to get from the start to the target. In this lab, we measureMT in milliseconds.
• D : the distance from start to the target’s center
A: the distance across the target. The line that S is measured on is a continuation of the line formed bythe point where the cursor leaves start and enters target.
• Index of Difficulty : represented by the log2(DA )+1) part of the equation, represents the relative difficulty
of moving the pointer from the start to target using an input device, for that particular person.
2
3 The QuikFitt Apparatus
3.1 Introduction
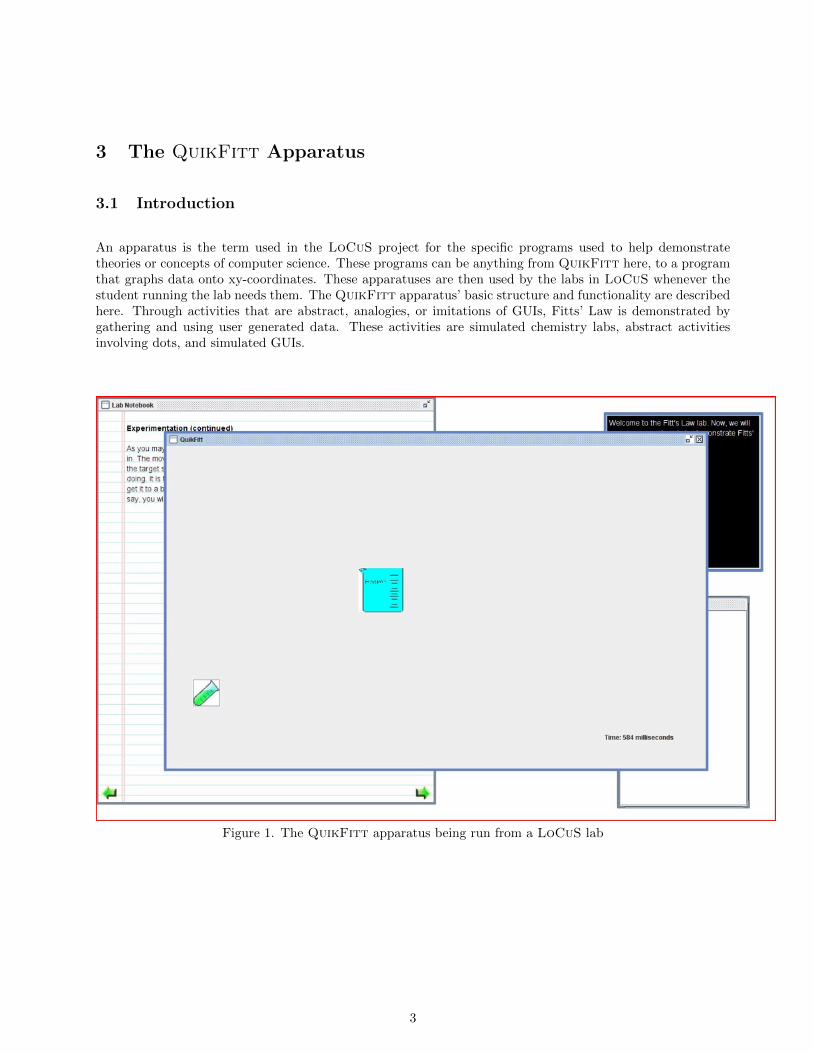
An apparatus is the term used in the LoCuS project for the specific programs used to help demonstratetheories or concepts of computer science. These programs can be anything from QuikFitt here, to a programthat graphs data onto xy-coordinates. These apparatuses are then used by the labs in LoCuS whenever thestudent running the lab needs them. The QuikFitt apparatus’ basic structure and functionality are describedhere. Through activities that are abstract, analogies, or imitations of GUIs, Fitts’ Law is demonstrated bygathering and using user generated data. These activities are simulated chemistry labs, abstract activitiesinvolving dots, and simulated GUIs.
Figure 1. The QuikFitt apparatus being run from a LoCuS lab
3
3.2 Functionality
There are several different activities which can be generated by this apparatus, each being distinct. Theseactivities follow three main themes: a chemistry lab, a simulated desktop, and an abstract view. However, thethemes are only there to help ease the user into the concepts of Fitts’ Law, starting with the chemistry laband desktop to help show how Fitts’ Law functions in the real world. The abstract view is a simplified viewwith only dots, for when the user has a better understanding of Fitts’ Law and is ready to see it without anyreal-world context.
3.3 User Interface
QuikFitt has three tabs: Main, Help, and Instructions, all of which are located along the top and are partof the common layout. The first tab from left to right is the Instructions tab. The Instructions tab containsinstructions on how to do the current activity and the instructions screen is the first thing the User sees whenQuikFitt comes up. The next tab is the Main tab. The Main tab of QuikFitt displays one of the QuikFittactivities. The last tab is the Help tab. The Help tab brings the user to the help menu for QuikFitt. Thehelp tab is divided into two main areas: general and activity-specific. The general help covers QuikFitt ingeneral, helping with things like error messages, what each tab is for, and so on. The activity-specific helpcovers things specific to the current activity. To exit the activity, the user just clicks on the x-button in theupper-right of the frame. After clicking it a window will pop up asking the user if they are sure they want toquite and warning them that all data from the activity will be lost. This will happen no matter which kind ofactivity the user is doing.
3.4 The Activities
The activity displayed is determined by the XML code from the Lab. The activities all revolve around clickingon a start area then clicking on an end target area. In the bottom left corner of the Activity a timer is displayed.This timer shows the user how much time it took to get from the start area to target area. The activity canhave one of three main themes, a chemistry lab theme, a computer desktop theme, or an abstract theme. Inthe chemistry activities, the user clicks on various pieces of lab equipment, in the abstracts the user is justclicking on dots, and in the desktop activities the user clicks on desktop icons, task bars, and other desktopelements. The distances between the start and end points and the width of the end point are generated byreading in a data file containing pairs consisting of a distance and width. The format of the data file and whathappens if there are errors in it are specified below in 3.8.
3.4.1 Common Activity Elements
Each activity has certain elements in common with all other activities which do not change due to theme. Thedistance between the start point and target point and width of the target point are determined by the datafile that is read in when QuikFitt is first activated. The data file is a text file where on every line there aretwo ints. The first int is the distance between the start area and target area, and the second int is the widthof the target area. The location of the target point is always either fixed or randomly determined, and if itis randomly determined it will always be the required distance away from the start point. If there is no datafile, then the distance between the start point and target point and the target point width will be randomly
4
determined. Whenever the user successfully goes from the start point to the target point, the time it took todo so is displayed in the upper left corner.
3.4.2 Chemistry 1D Horizontal
This activity focuses on horizontal movement and uses a chemistry lab theme. The user sees a lab bench fromthe side and a test tube is generated on the left side. The user is to move the test tube to a beaker that isshown on the right side by first clicking on the test tube then on the beaker. When the user selects the testtube, it will move along with the mouse to simulate how a person would have to carry the test tube to thebeaker in a real chemistry lab environment. In all of the Chemistry activities, when the chemicals are mixed,there is a short chemical reaction animation as the time is displayed. This animation is just a poof of smokeover the beaker and a change in color of the liquid in the beaker.
3.4.3 Chemistry 1D Vertical
This activity focuses on vertical movement and uses a chemistry lab theme. There is a buret suspended over abeaker. What the user needs to do is tighten the clamp that holds the buret then release the liquid by turningthe valve at the bottom. This is done by clicking on the clamp then on the valve. Tightening the clamptriggers an animation where the clamp turns to tighten, and releasing the liquid triggers an animation of thevalve turning to release the liquid and of the liquid in the buret draining into the beaker. After the draininganimation is done, the chemical reaction animation will trigger.
3.4.4 Chemistry 2D
This activity focuses on movement in a 2D environment. Like in Chemistry 1D Horizontal, the user needs toget a test tube to a beaker. However, this time the straight line between the test tube and beaker is at anangle.
3.4.5 Abstract 1D Horizontal
This activity is an abstract demonstration of Fitts Law. There are no analogies or metaphors involved, and itis the simplest way the concept can be shown in this program. There are two dots on the panel, one labeledstart and the other labeled end. The ”start” dot will have constant size, while the ”end” dot will have avariable radius, changing after each set is completed. The dots will always be on the same horizontal line. It istimed how long it takes the student to click the end dot after clicking the start dot. After clicking on the startdot, it will be dragged along with the mouse until the end dot is clicked. This will be true for all Abstractactivities.
3.4.6 Abstract 1D Vertical
This activity is the same as Abstract 1D Horizontal, except the dots are always vertically aligned.
5
3.4.7 Abstract 2D
This activity is similar to Abstract 1D, but has both vertical and horizontal movement instead of strictlyhorizontal or vertical.
3.4.8 Desktop Infinity
This activity shows a simulated desktop, complete with desktop icons and a task bar. The user will clicktheir mouse at the Start icon, and then go to the icon near the bottom of the frame. In this activity, themouse is captured by the panel, causing it to stop at the edge of the panel. The user will be told by a pop-upframe that the mouse is captured by the activity’s panel. This activity is meant to demonstrate how theedges of a computer screen technically have infinite width, making it very easy to get to buttons on the taskbar. This ”infinite width” is there because even if you move the mouse much farther than you need to whengoing towards the task bar, the mouse cursor will always stop at the edge of the screen. This ”infinite” widtheffectively makes the target area very easy to get to, primarily because its impossible to overshoot the targetarea. This is caused by the way the mouse cursor stops when it hits the edge of the screen. It can’t go anyfarther, no matter how far you moved the mouse, so it is a physical impossibility to overshoot the target area.So, according to Fitts’ Law, it will be much more efficient to place things at the edge of a screen as opposedto elsewhere.
3.4.9 Desktop Wrap-Around
This activity shows a simulated desktop, complete with desktop icons and a task bar. The user will start theirmouse at the Start icon, and then go to the highlighted icon near the bottom. In this activity, the mousewraps around from one side of the panel to the other. This activity is meant to contrast with the GUI DesktopInfinity activity, showing that it will take longer to click on the same targets in this activity than it did in theInfinity activity. This will be because there will be no barrier that will stop the mouse.
3.4.10 Desktop Dropdown
This activity shows a simulated desktop, but there are no desktop icons and the task bar cannot be interactedwith. The user will be instructed to right-click their mouse, causing a drop-down menu to appear with themouse pointer in one of the top corners. One of the options in the drop-down menu will be highlighted whenit appears, and the user will have to click on it.
3.4.11 Desktop Dropdown Distance
This activity shows a simulated desktop, but there are no desktop icons and the task bar cannot be interactedwith. The user will be instructed to right-click the mouse, causing a drop-down menu to appear a pre-determined vertical distance from the mouse pointer. One of the options in the drop-down menu will behighlighted when it appears, and the user will have to click on it. This activity is meant to contrast with theGUI Dropdown activity to show that drop-down menus appearing with the pointer in the corner is the mostefficient layout.
6
3.4.12 Keyboard Activities
For all the previously defined activities, there is a Keyboard version. In a Keyboard activity, everything isexactly the same as the normal version, but instead of using the mouse the user uses the arrow keys. Theywill use the arrow keys to move a selector around and use the enter key to select the start and target areas.
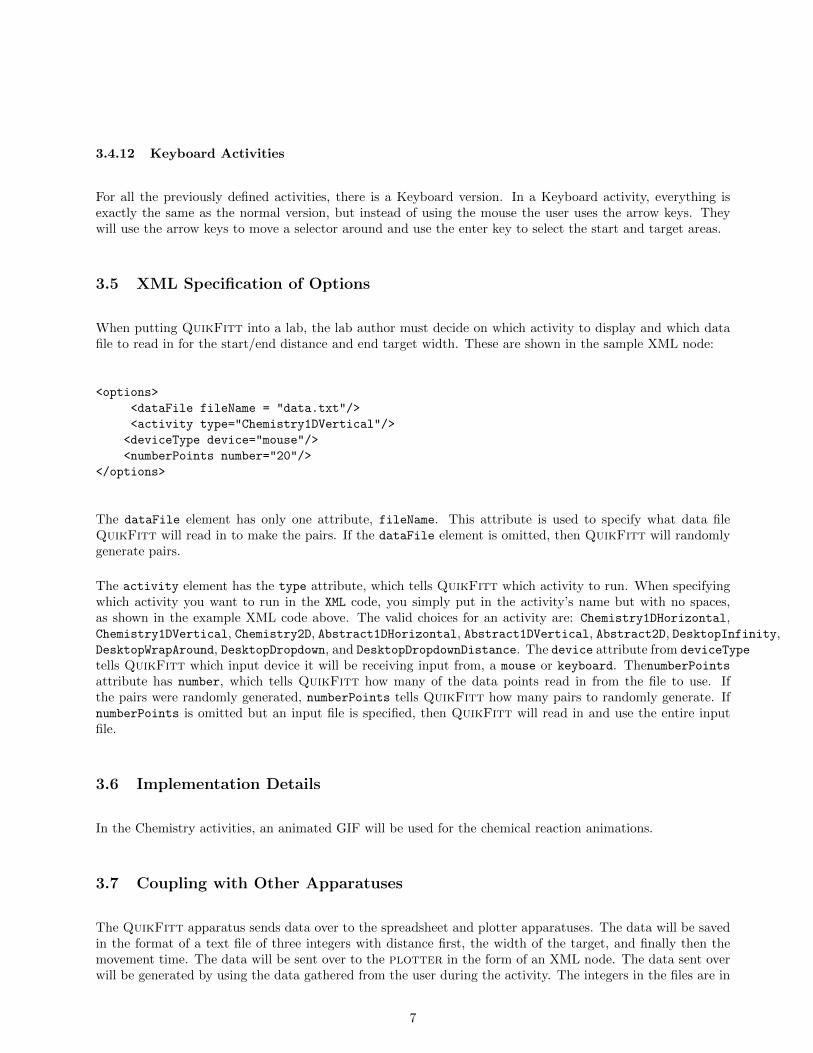
3.5 XML Specification of Options
When putting QuikFitt into a lab, the lab author must decide on which activity to display and which datafile to read in for the start/end distance and end target width. These are shown in the sample XML node:
<options>
<dataFile fileName = "data.txt"/>
<activity type="Chemistry1DVertical"/>
<deviceType device="mouse"/>
<numberPoints number="20"/>
</options>
The dataFile element has only one attribute, fileName. This attribute is used to specify what data fileQuikFitt will read in to make the pairs. If the dataFile element is omitted, then QuikFitt will randomlygenerate pairs.
The activity element has the type attribute, which tells QuikFitt which activity to run. When specifyingwhich activity you want to run in the XML code, you simply put in the activity’s name but with no spaces,as shown in the example XML code above. The valid choices for an activity are: Chemistry1DHorizontal,Chemistry1DVertical, Chemistry2D, Abstract1DHorizontal, Abstract1DVertical, Abstract2D, DesktopInfinity,DesktopWrapAround, DesktopDropdown, and DesktopDropdownDistance. The device attribute from deviceType
tells QuikFitt which input device it will be receiving input from, a mouse or keyboard. ThenumberPointsattribute has number, which tells QuikFitt how many of the data points read in from the file to use. Ifthe pairs were randomly generated, numberPoints tells QuikFitt how many pairs to randomly generate. IfnumberPoints is omitted but an input file is specified, then QuikFitt will read in and use the entire inputfile.
3.6 Implementation Details
In the Chemistry activities, an animated GIF will be used for the chemical reaction animations.
3.7 Coupling with Other Apparatuses
The QuikFitt apparatus sends data over to the spreadsheet and plotter apparatuses. The data will be savedin the format of a text file of three integers with distance first, the width of the target, and finally then themovement time. The data will be sent over to the plotter in the form of an XML node. The data sent overwill be generated by using the data gathered from the user during the activity. The integers in the files are in
7

the units of centimeters for distances and milliseconds for time. The distances from the input are just scalars,the actual distance saved in the output file will depend on the screen size of the computer running QuikFitt.By using the plotter, the user will be able to plot their data and do a linear regression on the data, givingthem a complete Fitts’ Law formula. Once the formula is complete, they will be able to make predictions onhow long movement times will be if they know the distance and the target’s width. The gathered data willbe sent over to the plotter or spreadsheet all at once in the form of an input file, so we won’t need to havethe plotter or spreadsheet up while QuikFitt is running. This will happen automatically, so the user will notneed to worry about transferring the data themselves.
3.8 Input File
The input file that is read in by the QuikFitt program needs to be in a specific format, otherwise the programwill not function properly. The data file is just a text file, where on each line there are two integers separatedby a space. The first int is the distance to the target, and the second int is the width of the target. Theseintegers are only considered valid if they are within the range of 1-100 inclusive. These widths and distancesare scaled to different widths and distances when the program runs, while keeping them all relative. If aninvalid distance or width is read in, it is ignored and QuikFitt continues reading in the file. Also, an errormessage is sent to the console for debugging and testing purposes. This is something the user will not see.
8
4 QuikFitt in action
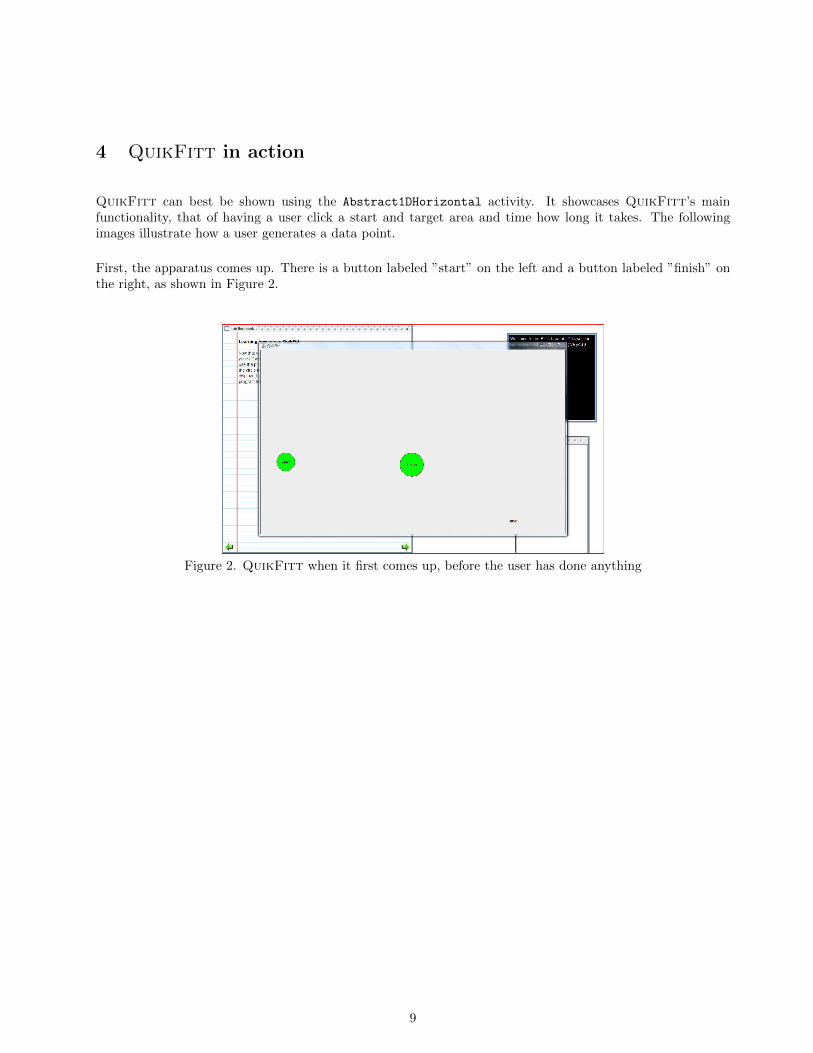
QuikFitt can best be shown using the Abstract1DHorizontal activity. It showcases QuikFitt’s mainfunctionality, that of having a user click a start and target area and time how long it takes. The followingimages illustrate how a user generates a data point.
First, the apparatus comes up. There is a button labeled ”start” on the left and a button labeled ”finish” onthe right, as shown in Figure 2.
Figure 2. QuikFitt when it first comes up, before the user has done anything
9
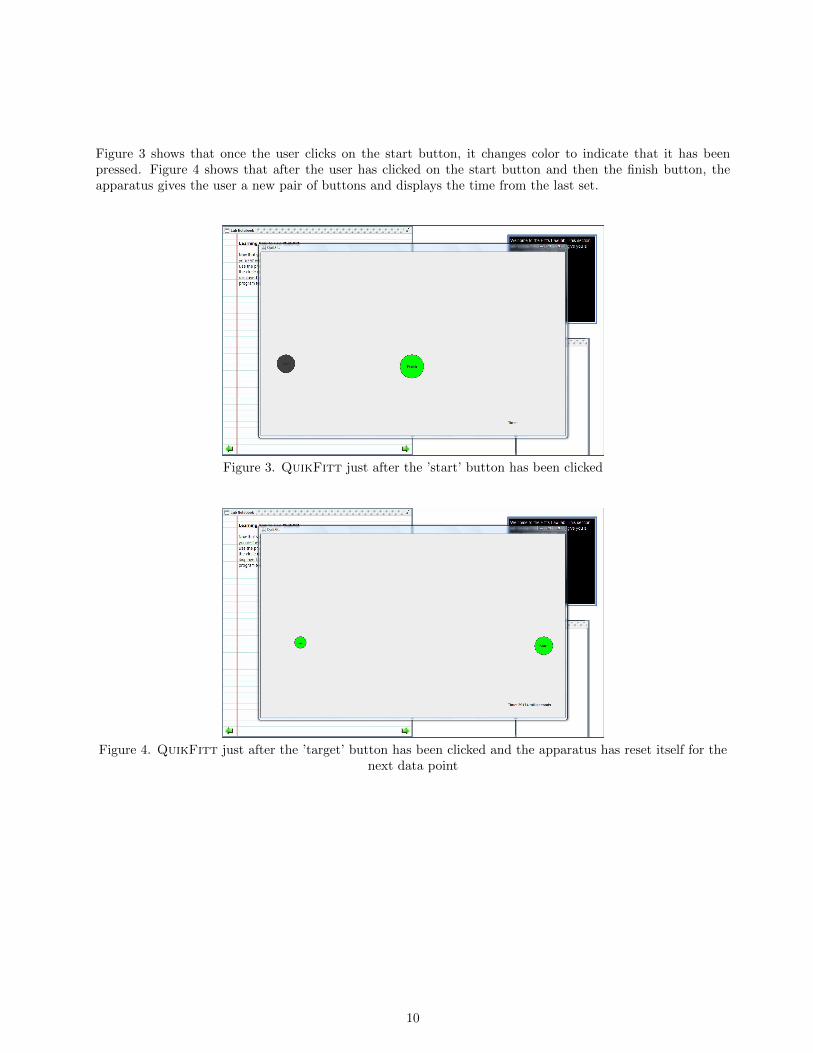
Figure 3 shows that once the user clicks on the start button, it changes color to indicate that it has beenpressed. Figure 4 shows that after the user has clicked on the start button and then the finish button, theapparatus gives the user a new pair of buttons and displays the time from the last set.
Figure 3. QuikFitt just after the ’start’ button has been clicked
Figure 4. QuikFitt just after the ’target’ button has been clicked and the apparatus has reset itself for thenext data point
10
5 The Fitts’ Law Lab
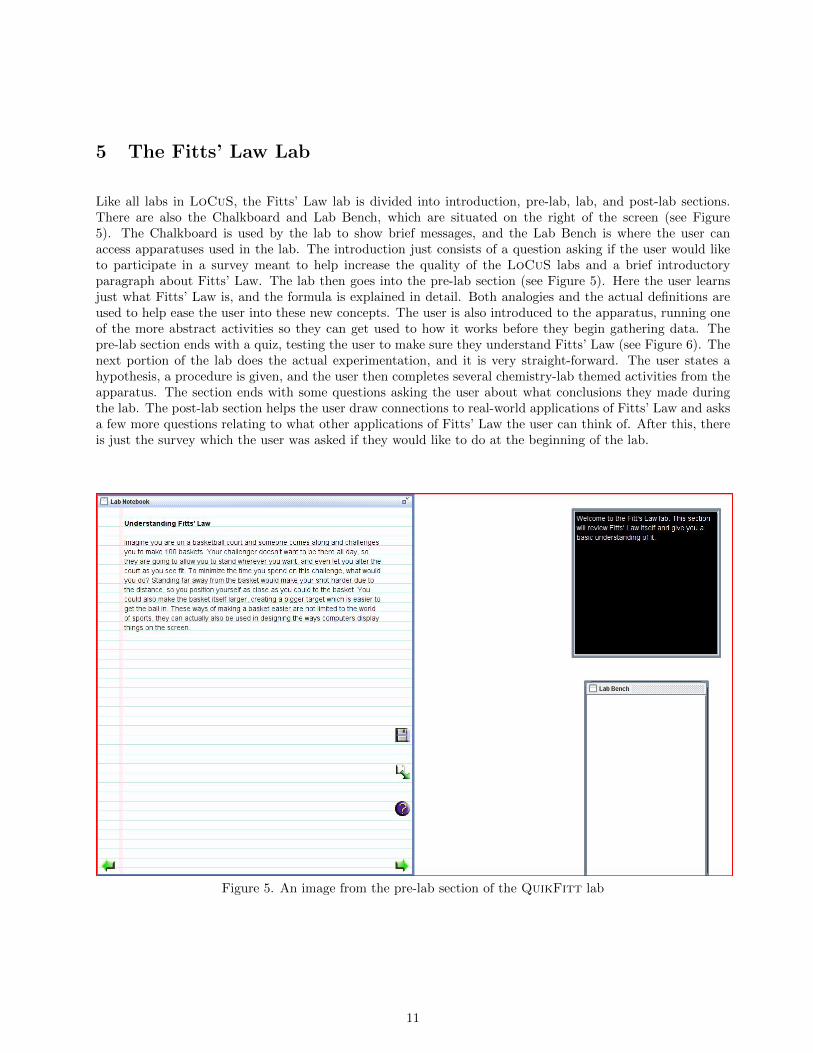
Like all labs in LoCuS, the Fitts’ Law lab is divided into introduction, pre-lab, lab, and post-lab sections.There are also the Chalkboard and Lab Bench, which are situated on the right of the screen (see Figure5). The Chalkboard is used by the lab to show brief messages, and the Lab Bench is where the user canaccess apparatuses used in the lab. The introduction just consists of a question asking if the user would liketo participate in a survey meant to help increase the quality of the LoCuS labs and a brief introductoryparagraph about Fitts’ Law. The lab then goes into the pre-lab section (see Figure 5). Here the user learnsjust what Fitts’ Law is, and the formula is explained in detail. Both analogies and the actual definitions areused to help ease the user into these new concepts. The user is also introduced to the apparatus, running oneof the more abstract activities so they can get used to how it works before they begin gathering data. Thepre-lab section ends with a quiz, testing the user to make sure they understand Fitts’ Law (see Figure 6). Thenext portion of the lab does the actual experimentation, and it is very straight-forward. The user states ahypothesis, a procedure is given, and the user then completes several chemistry-lab themed activities from theapparatus. The section ends with some questions asking the user about what conclusions they made duringthe lab. The post-lab section helps the user draw connections to real-world applications of Fitts’ Law and asksa few more questions relating to what other applications of Fitts’ Law the user can think of. After this, thereis just the survey which the user was asked if they would like to do at the beginning of the lab.
Figure 5. An image from the pre-lab section of the QuikFitt lab
11

Figure 6. A set of quiz questions from the QuikFitt lab, typical for LoCuS labs
12
6 Development Experience
Making something that would help teach people unfamiliar with computer science about Fitts’ Law seemedsimple enough, but the project turned out to be a bit more complicated than anticipated. While it was allan interesting learning experience, sometimes learning things was a painful and slow process. Learning andunderstanding the theory itself was my first experience in teaching myself a computer science concept, and itwent smoother than I anticipated. There were plenty of papers and material which covered Fitts’ Law, and theonly real issue was that they were all written with a fair amount of complexity. This made it a little difficultfor me to get a good enough grasp on the theory so that I could teach it to others, but after that everythingfell into place.
The next major step of the project was making the QuikFitt program itself. This took me the largestamount of time, and required learning more about a part of the Java programing language called Swing [2].Unfortunately, Swing has many parts which are very tricky to use without a fair amount of experience andtrial-and-error. Most of my time programming was spent learning how to use the new Swing concepts, testingand getting everything to work properly. The final part of this thesis was writing a lab. The labs for LoCuSare written in a language called XML, which I had to learn for this project, but it was not too difficult. Overall,it was simple and straightforward, a relaxing end to a complicated project.
13
7 Future Work
Due to time constraints (and the current limits of my skill), there are many things which I had envisionedQuikFitt having but were not implemented. These are as follows:
• In the chemistry-themed activities, being able to drag the test tube and have it move with the mouse.
• In the chemistry-themed activities, having an animation occur when clicking on the beaker. Likely ofthe test tube pouring into it and some sort of animation representing a chemical reaction, such as a poofof smoke.
• In the desktop-themed activities, having the simulated toolbar at the bottom of the screen look like anactual toolbar.
• Thematically appropriate backgrounds for all the activities. This is more of an artistic problem than aprograming problem, but still important. Good backgrounds would give QuikFitt a more professionallook and make it more appealing overall to the average user.
14

References
[1] ”Ergalics: Field Guide.” University of Arizona. http://www.cs.arizona.edu/projects/focal/
ergalics/fieldguide/ Viewed December 12, 2011
[2] Loy, Marc, and Robert Eckstein. 2003. ”Java Swing.” Sebastopol, CA: O’Reilly.
[3] MacKenzie,I.S., and Buxton,W. (1992). Extending Fitts’ law to two dimensional tasks. Proceedings of theCHI ’92 Conference on Human Factors in Computing Systems. New York:ACM.
[4] Paul M. Fitts and James R. Peterson (1964). Information capacity of discrete motor responses. Journal ofExperimental Psychology, 67(2):103112, February 1964.
[5] Paul M. Fitts (1954). The information capacity of the human motor system in controlling the amplitude ofmovement. Journal of Experimental Psychology, volume 47, number 6, June 1954, pp. 381391. (Reprintedin Journal of Experimental Psychology: General, 121(3):262269, 1992).
15


![Sanando a Los Enfermos [Robert Fitts] ~Book](https://img.dokumen.tips/doc/110x75/55cf9969550346d0339d42d3/sanando-a-los-enfermos-robert-fitts-book.jpg)