Embed Size (px)
Citation preview

Teachers’ Pension and Annuity Fund of New Jersey
Actuarial Valuation Report as of July 1, 2019
Produced by Cheiron
April 2020

TABLE OF CONTENTS Section Page Letter of Transmittal ........................................................................................................................ i Section I Board Summary ........................................................................................................1 Section II Assessment and Disclosure of Risk ........................................................................13 Section III Assets ......................................................................................................................30 Section IV Liabilities ................................................................................................................37 Section V Contributions...........................................................................................................42 Appendices Appendix A Membership Information ........................................................................................46 Appendix B Actuarial Assumptions and Methods .....................................................................53 Appendix C Summary of Plan Provisions .................................................................................66 Appendix D Historical Data and Required CAFR Exhibits .......................................................72 Appendix E Early Retirement Incentive Contribution Schedule ...............................................76 Appendix F Glossary of Terms ...................................................................................................79
LETTER OF TRANSMITTAL April 23, 2020 Board of Trustees Teachers’ Pension and Annuity Fund of New Jersey State of New Jersey Department of the Treasury Division of Pension and Benefits, CN 295 Trenton, NJ 08625-0295 Dear Board Members: We have performed the July 1, 2019 Actuarial Valuation of the Teachers’ Pension and Annuity Fund of New Jersey (TPAF or Fund). In preparing our report, we relied on information (some oral and some written) supplied by the Division of Pensions and Benefits (DPB). This information includes, but is not limited to, plan provisions, employee data, and financial information. We performed an informal examination of the obvious characteristics of the data for reasonableness and consistency in accordance with Actuarial Standard of Practice No. 23. The results of this report are only applicable to the Fund’s contribution for Fiscal Year Ending 2021. Future results may differ significantly from the current results presented in this report due to such factors as the following: plan experience differing from that anticipated by the assumptions; changes in assumptions; and changes in plan provisions or applicable law. The demographic and economic (other than the investment rate of return) actuarial assumptions are based on the recommended assumptions from the July 1, 2015 – June 30, 2018 Experience Study, which were approved by the Board of Trustees on February 6, 2020. The investment return assumption of 7.30% is based on the recommendation of the State Treasurer. This report and its contents have been prepared in accordance with generally recognized and accepted actuarial principles and practices and our understanding the Code of Professional Conduct and applicable Actuarial Standards of Practice set out by the Actuarial Standards Board as well as applicable laws and regulations. Furthermore, as credentialed actuaries we meet the Qualification Standards of the American Academy of Actuaries to render the opinion contained in this report. This report does not address any contractual or legal issues. We are not attorneys, and our firm does not provide any legal services or advice.

Teachers’ Pension and Annuity Fund of New Jersey April 23, 2020 Page 2 This actuarial valuation report was prepared exclusively for TPAF, the DPB and the Fund auditors for the purposes described herein and in preparing financial reports in accordance with applicable law and annual report requirements. Other users of this report are not intended users as defined in the Actuarial Standards of Practice, and Cheiron assumes no duty or liability to such other users. Sincerely, Cheiron Janet Cranna, FSA, FCA, MAAA, EA Principal Consulting Actuary Anu Patel, FSA, MAAA, EA Principal Consulting Actuary Jonathan Chipko, FSA, MAAA, EA Consulting Actuary cc: Kenneth Kent, FSA, FCA, MAAA, EA
TEACHERS’ PENSION AND ANNUITY FUND OF NEW JERSEY JULY 1, 2019 ACTUARIAL VALUATION
SECTION I – BOARD SUMMARY
1
The primary purpose of the actuarial valuation and this report is to disclose the following as of the valuation date: • The financial condition of the Teachers’ Pension and Annuity Fund of New Jersey,
• Past and expected future trends and risks to the Fund’s financial condition, and
• The State’s Statutory pension contribution for Fiscal Year End (FYE) 2021.
In this Section we present a summary of the principal valuation results. This includes the basis on which the July 1, 2019 valuation was completed and an examination of the current financial condition of the Fund. In addition, we present a review of the key historical trends as well as the Fund’s projected financial outlook. The stress testing in accordance with the requirements set out in Chapter 277, P. L. 2017 follows in Section II. This report does not include calculations under GASB Statements Nos. 67 and 68 which were provided in separate reports. Results shown in this report for years prior to July 1, 2018 are based on the prior actuary’s valuation reports.

TEACHERS’ PENSION AND ANNUITY FUND OF NEW JERSEY JULY 1, 2019 ACTUARIAL VALUATION
SECTION I – BOARD SUMMARY
2
Valuation Basis The July 1, 2019 valuation results are based on the same actuarial methods as used in the July 1, 2018 valuation. The demographic and economic assumptions, aside from the valuation interest rate, are based on the July 1, 2015 – June 30, 2018 Experience Study, which was approved by the Board of Trustees on February 6, 2020. The valuation is based on a 7.30% interest rate, which was recommended by the State Treasurer. This valuation is based on plan provisions in effect as of July 1, 2019 and does not reflect the impact of any changes in benefits that may have been approved after the valuation date. This valuation reflects a new DPB policy regarding the crediting of interest on member contributions for the purpose of refunds of accumulated deductions. This report is prepared using census data and financial information as of July 1, 2019 provided by the Division of Pensions and Benefits and does not reflect any subsequent changes in the membership or the assets. The Appropriations Act of Fiscal Year 2019 reduced the State pension contribution from the Statutory amount of $3,208,116,552 to $1,974,389,000. The $1,974,389,000 includes revenue of $859,469,000 from the Lottery Enterprise Contribution Act. The potential impact of the Appropriations Act of 2020 reduces the State pension contribution for Fiscal Year 2020 from the Statutory amount of $3,244,013,909 to $2,271,684,350 (70% of the Statutory contribution less the Lottery Enterprise Contribution Offset plus expected revenue from the Lottery Enterprise Contribution Act {70% x $3,244,013,909 - $832,596,867 + $833,471,481}). This valuation reflects the potential impact of the Appropriations Act of 2020. Chapter 83, P.L. 2016 calls for the State to make the required pension contributions on a quarterly basis in each fiscal year according to the following schedule: at least 25% by September 30, at least 50% by December 31, at least 75% by March 31, and at least 100% by June 30. As such, State contributions are assumed to be made on a quarterly basis. In accordance with Chapter 78, P.L. 2011, a pension committee is to be established for the State when the “target funded ratio” is achieved. The “target funded ratio” is defined as the ratio of the actuarial value of assets divided by the actuarial liability expressed as a percentage that is 75% in fiscal year 2012 and increased annually by equal increments in each of the subsequent seven fiscal years, until the funded ratio equals 80% at which time it will remain at 80% for all subsequent fiscal years. The Fund has not attained the required “target funded ratio” and thus the pension committee has not been established for the Fund.

TEACHERS’ PENSION AND ANNUITY FUND OF NEW JERSEY JULY 1, 2019 ACTUARIAL VALUATION
SECTION I – BOARD SUMMARY
3
Under Chapter 98, P.L. 2017, the Lottery Enterprise Contribution Act, the Teachers’ Pension and Annuity Fund receives 77.78% of the proceeds of the Lottery Enterprise, based on their members' past or present employment in schools and institutions in the State for a term of 30 years. As of the July 1, 2019 valuation, 27 years remain. Revenues from Chapter 98, P.L. 2017, the Lottery Enterprise Contribution Act, are assumed to be contributed to the trust on a monthly basis. The Chapter 78, P.L. 2011 "target funded ratio" is based on the actuarial value of assets plus the allocable special asset value. The special asset value is the present value of the projected future lottery contributions to the retirement systems as provided by the Division of Pensions and Benefits. Effective with Fiscal Year 2018, the State's pension contribution shall be reduced by the product of the allocable percentage for such retirement system, the adjustment percentage for such retirement system and the special asset adjustment. The valuation reflects Chapter 78, P.L. 2011, which increased the member contribution rate from 5.5% to 6.5% of compensation effective October 2011. Further, beginning July 2012, the member contribution rate was increased by 1/7th of 1% each July until a 7.5% member contribution rate was reached in July 2018. The valuation excludes assets and liabilities under the Non-Contributory Group Insurance Premium Fund. The Non-Contributory Group Insurance premiums are separately funded monthly, on a pay-as-you-go basis. Key Results The following Table I-1 summarizes the key results of the valuation with respect to the Fund’s membership, assets and liabilities, and contributions. The results are presented and compared for both the current and prior year.

TEACHERS’ PENSION AND ANNUITY FUND OF NEW JERSEY JULY 1, 2019 ACTUARIAL VALUATION
SECTION I – BOARD SUMMARY
4
Table I-1Summary of Key Valuation Results
Valuation Date July 1, 2019 July 1, 2018 % Fiscal Year End 2021 2020 ChangeMember DataContributing Actives1 141,795 141,128 0.5%Non-Contributing Members1 14,271 14,368 -0.7%Deferred Vested 432 219 97.3%Retirees and Beneficiaries2 106,388 104,703 1.6%Total Members 262,886 260,418 0.9%
Appropriation Payroll3 11,061,603,138$ 10,823,504,797$ 2.2%Annual Allowances for Retirees and Beneficiaries 4,391,260,795$ 4,295,446,681$ 2.2%
Assets and LiabilitiesActuarial Liability 65,470,847,885$ 60,971,919,315$ 7.4%Actuarial Value of Assets (AVA)4 26,375,429,936 26,308,754,955 0.3%Unfunded Actuarial Liability/(Surplus) 39,095,417,949$ 34,663,164,360$ 12.8%Funding Ratio (AVA) 40.3% 43.1% -2.8%
Actuarial Value of Assets4 including Special Asset Value (AVA + SAV) 36,188,020,515$ 36,127,247,378$ 0.2%Unfunded Actuarial Liability/(Surplus) 29,282,827,370$ 24,844,671,937$ 17.9%Funded Ratio (AVA + SAV) 55.3% 59.3% -4.0%
Market Value of Assets (MVA)4 24,877,874,495$ 24,838,481,325$ 0.2%Unfunded Actuarial Liability/(Surplus) 40,592,973,390$ 36,133,437,990$ 12.3%Funded Ratio (MVA) 38.0% 40.7% -2.7%
Contribution Amounts5
State Normal Cost at End of Year 426,591,302$ 309,040,948$ 38.0%Amortization Payment of UAL 3,246,033,452 2,934,972,961 10.6%Total Statutory Contribution for FYE 3,672,624,754$ 3,244,013,909$ 13.2%
Percent Appropriated 80% 70% 10.0%State Appropriation for Pension 2,938,099,803$ 2,270,809,736$ 29.4%Lottery Enterprise Contribution Offset (843,411,195) (832,596,867) 1.3%Net State Contribution 2,094,688,608$ 1,438,212,869$ 45.6%
1 Reflects all records for multiple members, who are employed by multiple participating employers at the same time2 QDRO recipients are excluded from member counts3 Limited annual compensation for contributing actives only4 Includes discounted State receivable contributions and Lottery proceeds as shown in Table III-25 In addition, Early Retirement Incentive (ERI) Contributions are payable by certain Local employers. See Appendix E.

TEACHERS’ PENSION AND ANNUITY FUND OF NEW JERSEY JULY 1, 2019 ACTUARIAL VALUATION
SECTION I – BOARD SUMMARY
5
The key results of the July 1, 2019 actuarial valuation are as follows:
• The total Statutory contribution increased from $3,244 million for FYE 2020 to $3,673 million for FYE 2021 prior to any adjustments for the State phase-in of contributions or the Lottery Enterprise offset.
• The funded ratio, the ratio of actuarial asset value over liabilities, decreased from 43.1% as of July 1, 2018 to 40.3% as of July 1, 2019. The funded ratio based on the actuarial value of assets plus special asset value decreased from 59.3% to 55.3%. Using the market value of assets, the funded ratio also decreased from 40.7% to 38.0%.
• The unfunded actuarial liability based on the actuarial asset value plus special asset value increased from $24.8 billion as of July 1, 2018 to $29.3 billion as of July 1, 2019. The unfunded actuarial liability used in determining the Statutory contributions (excess of actuarial liability over the actuarial value of assets) increased from $34.7 billion to $39.1 billion.
• During the year there was a total actuarial experience loss of $456 million, consisting of an asset loss of $389 million and a liability loss of $67 million. The liability loss of $67 million represents 0.1% of liabilities. The rate of return on the actuarial value of assets was 5.91% compared to the expected return of 7.50%, resulting in the $389 million asset loss.
• The reduction in the assumed rate of investment return from 7.50% to 7.30% increased the actuarial liability by $1,386 million.
• The updates in the assumed rates of termination, disability, retirement, mortality, salary increase and inflation as a result of the recently completed experience study increased the actuarial liability by $1,968 million.
• The policy update for the crediting of interest on member contributions for the purpose of refunds of accumulated deductions decreased the actuarial liability by $15.6 million.
Recent Trends Although most of the attention given to the valuation reflects the most recently computed unfunded actuarial liability, funded ratio, and contribution amounts, each valuation is merely a snapshot of the long-term progress of a pension fund. It is important to take a step back from the current year results and view them in the context of the Fund’s recent history as well as trends expected into the future. Below, we present a series of graphs which display historical trends for key factors in the valuations of the last 10 years. Additionally, in Appendix D we provide the numerical values of the historical unfunded actuarial liability, funded ratio, and contribution amounts. In reviewing the historic trends over the 10 year period, the declining funded status coupled with significant negative net cash flow highlights the potential risk of running out of assets to pay benefits unless the State consistently contributes the full amount of the Statutory required contributions.

TEACHERS’ PENSION AND ANNUITY FUND OF NEW JERSEY JULY 1, 2019 ACTUARIAL VALUATION
SECTION I – BOARD SUMMARY
6
Assets and Liabilities The gray bars represent the Actuarial Liability (AL). The green line is the Market Value of Assets (MVA), the gold line is the Actuarial Value of Assets (AVA) and the blue line (which starts in 2016) is the AVA plus the Special Asset Value (SAV). The Fund’s funded ratio (ratio of assets to actuarial liability) on the MVA, AVA basis and AVA+SAV basis, is shown next to the respective asset lines. The liability has been increasing over time in part due to additional benefit accruals but also due to decreases in the discount rate and other assumption changes. For 2019, the liability increased due to the reduction in the assumed rate of investment return from 7.50% to 7.30% and the assumption changes resulting from the experience study. The funded ratio has been decreasing over time in part due to decreases in the discount rate, recognition of the 2008/2009 market losses and because the State has not been making the full Statutory contribution for the entire period shown.
53% 55% 51% 51% 51% 48%41% 41% 41% 38%
47% 44% 43% 40%
68% 64% 61% 58% 54% 51%
64% 61% 59% 55%
$0
$10
$20
$30
$40
$50
$60
$70
2010 2011 2012 2013 2014 2015 2016 2017 2018 2019
Bill
ions
Actuarial Valuation as of July 1,
Actuarial Liability Market Value of AssetsActuarial Value of Assets (without SAV) Actuarial Value of Assets (with SAV)
The information above is based on the final actuarial valuation reports for the given years. The amounts do not reflect differences between the discounted State appropriations receivable and the actual State contribution amounts that became known after the issuance of the reports.

TEACHERS’ PENSION AND ANNUITY FUND OF NEW JERSEY JULY 1, 2019 ACTUARIAL VALUATION
SECTION I – BOARD SUMMARY
7
Membership Trends The graph below shows the membership counts of the Fund for the last ten valuations. The numbers which appear at the top of each bar represent the ratio of the number of inactive members and non-contributing active members to active contributing members at each valuation date, and provide a measure of the maturity of the Fund. We refer to this as the support ratio. The support ratio has increased over the period. As more of the liability moves from actives to inactives, the Fund will experience more volatility in contribution rates when actuarial gains and losses are recognized. With the current inactive-to-active ratio of 0.9, there are more active members than inactive members implying that the risk factor is not at a high level relative to other mature pension funds. Starting with the 2018 valuation, the membership counts reflect all records for multiple members, which are active members employed by more than one participating employer at the same time. The numbers that are shown in the middle of the bars represent the number of actives or inactive members in thousands. The black line represents the appropriation payroll for active contributing members over the period, and it corresponds with the scale on the right.
144 137 137 139 139 140 141 141 141 142
13 14 13 12 13 13 14 14 14 14
81 86 90 92 95 98 101 104 105 107
0.6 0.7 0.8 0.8 0.8 0.8 0.8 0.8 0.8 0.9
$0
$5
$10
$15
$20
$25
$30
0
50
100
150
200
250
300
2010 2011 2012 2013 2014 2015 2016 2017 2018 2019
Billi
ons
Thou
sand
s
Actuarial Valuation as of July 1,
Contributing Actives Non-Contributing ActivesRetirees and Deferred Vesteds Payroll

TEACHERS’ PENSION AND ANNUITY FUND OF NEW JERSEY JULY 1, 2019 ACTUARIAL VALUATION
SECTION I – BOARD SUMMARY
8
Cash Flows The following graph shows the Fund net cash flow (contributions less benefit payments and expenses) at the end of each fiscal year. For the entire period shown, the net cash flow, which excludes investment returns, has been negative. This illustrates that contributions have not been sufficient to cover benefits and expenses in any years over the past decade. A major implication of a negative cash flow is that the difference each year must be met first from cash generated by investments and then paid out of the principal assets, representing additional risk for the Fund if investments need to be sold in a down market to cover benefit payments. The black dotted line shows the net cash flow as a percent of the market assets and goes with the axis on the right. For the 10 year period shown the average net cash flow as a percent of assets is -9.4%, which is greater than the long term investment return assumption. This indicates that a plan is expected to defund with an increased risk of insolvency if the contributions do not catch up to cover a higher portion of the benefit payments and expenses. For 2019, the net cash flow of -6.7% implies that the assumed investment return of 7.3%, if achieved, will cover this difference. Because the State appropriation percentages have increased by 10% per year, the negative cash flow has improved since 2017.
-25%
-20%
-15%
-10%
-5%
0%
5%
10%
15%
20%
25%
($5)
($4)
($3)
($2)
($1)
$0
$1
$2
$3
$4
$5
2010 2011 2012 2013 2014 2015 2016 2017 2018 2019
Billi
ons
Fiscal Year Ending June 30,
Contributions Benefits & ExpensesInvestments Net Cash Flow excl InvNet Cash Flow as % of MVA

TEACHERS’ PENSION AND ANNUITY FUND OF NEW JERSEY JULY 1, 2019 ACTUARIAL VALUATION
SECTION I – BOARD SUMMARY
9
Contributions This graph shows the historical trends for the State contributions. The Statutory contributions are comprised of the State normal cost (blue bars) and the amortization of the UAL (gold bars). The green line shows the actual State contributions over the period. For FYE 2020 and 2021, the green line has a lighter shade to indicate that these are expected, rather than actual, contributions based on the State appropriating 70% and 80% of the Statutory contribution, respectively. The expected contributions are shown in Table I-1. The red line is the tread water line, which is the State normal cost plus the interest on the UAL. The tread water line shows the minimum contributions that are needed to avoid an increase in the UAL. The graph shows that not only has the State been making contributions less than required by Statute, but that the State contributions have historically been significantly below the tread water line. When contributions are lower than the normal cost plus interest on the UAL, the unfunded actuarial liability is expected to grow from one year to the next.
$0.0
$0.5
$1.0
$1.5
$2.0
$2.5
$3.0
$3.5
$4.0
2012 2013 2014 2015 2016 2017 2018 2019 2020 2021
Bill
ions
Fiscal Year Ending June 30,
Employer Normal Cost UAL ContributionActual Employer Contribution AVA Tread Water
TEACHERS’ PENSION AND ANNUITY FUND OF NEW JERSEY JULY 1, 2019 ACTUARIAL VALUATION
SECTION I – BOARD SUMMARY
10
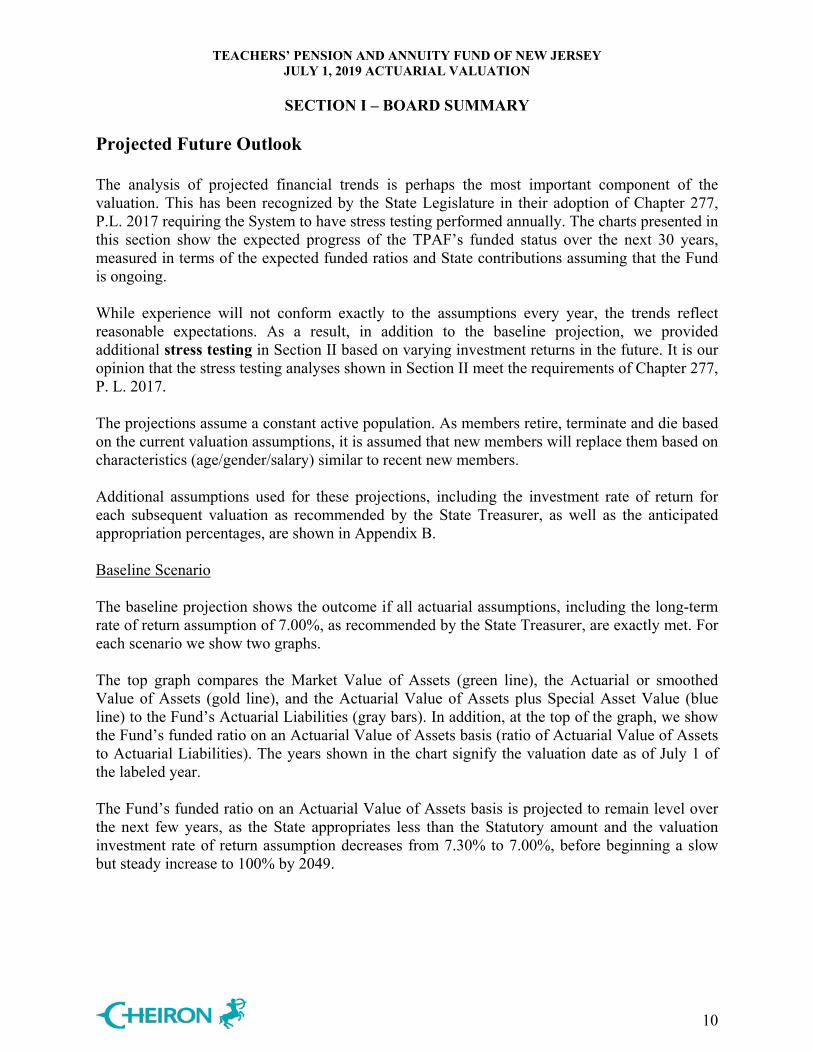
Projected Future Outlook The analysis of projected financial trends is perhaps the most important component of the valuation. This has been recognized by the State Legislature in their adoption of Chapter 277, P.L. 2017 requiring the System to have stress testing performed annually. The charts presented in this section show the expected progress of the TPAF’s funded status over the next 30 years, measured in terms of the expected funded ratios and State contributions assuming that the Fund is ongoing. While experience will not conform exactly to the assumptions every year, the trends reflect reasonable expectations. As a result, in addition to the baseline projection, we provided additional stress testing in Section II based on varying investment returns in the future. It is our opinion that the stress testing analyses shown in Section II meet the requirements of Chapter 277, P. L. 2017. The projections assume a constant active population. As members retire, terminate and die based on the current valuation assumptions, it is assumed that new members will replace them based on characteristics (age/gender/salary) similar to recent new members. Additional assumptions used for these projections, including the investment rate of return for each subsequent valuation as recommended by the State Treasurer, as well as the anticipated appropriation percentages, are shown in Appendix B. Baseline Scenario
The baseline projection shows the outcome if all actuarial assumptions, including the long-term rate of return assumption of 7.00%, as recommended by the State Treasurer, are exactly met. For each scenario we show two graphs. The top graph compares the Market Value of Assets (green line), the Actuarial or smoothed Value of Assets (gold line), and the Actuarial Value of Assets plus Special Asset Value (blue line) to the Fund’s Actuarial Liabilities (gray bars). In addition, at the top of the graph, we show the Fund’s funded ratio on an Actuarial Value of Assets basis (ratio of Actuarial Value of Assets to Actuarial Liabilities). The years shown in the chart signify the valuation date as of July 1 of the labeled year. The Fund’s funded ratio on an Actuarial Value of Assets basis is projected to remain level over the next few years, as the State appropriates less than the Statutory amount and the valuation investment rate of return assumption decreases from 7.30% to 7.00%, before beginning a slow but steady increase to 100% by 2049.

TEACHERS’ PENSION AND ANNUITY FUND OF NEW JERSEY JULY 1, 2019 ACTUARIAL VALUATION
SECTION I – BOARD SUMMARY
11
The bottom graph shows the contributions by fiscal year. The member contributions are in purple and the State contributions are in gold. The gold outline shows the State’s full Statutory contributions with the shaded portion showing the anticipated appropriated amount. The projected lottery revenue is provided by the DPB and is outlined in blue. Lottery revenue amounts shaded in gold are offsets to Statutory contributions. Lottery revenue amounts shaded white are additional contributions in excess of the Statutory contributions that pay down the UAL. The lottery revenue through FYE 2022 largely offsets the Statutory contribution while lottery amounts after that include additional payments toward the UAL. The lottery offsets during the projection period are calculated based on the methodology as defined in Chapter 98, P.L. 2017. The projection assumes the State appropriates 80% of the Statutory contribution in FYE 2021, and increases the percent by 10% a year, until reaching 100% of the Statutory contribution beginning with FYE 2023. Both the appropriated State contributions and the member contributions are also shown in dollar amounts. The dashed black line in the bottom chart shows the gross normal cost. The difference between the dashed black line and the purple bar is the State portion of the normal cost. The solid black line is the tread water line based on the Actuarial Value of Assets. Because the tread water metric equals the normal cost plus interest on the UAL, the difference between the solid black line and the dashed black line is the interest on the UAL. When contributions fall below the solid black line, as is the case in FYE 2021, the UAL grows and the funded ratio falls. When the contributions exceed the solid line, as is the case beginning in FYE 2022, the UAL decreases and the funded ratio increases. The Statutory contributions increase steadily through FYE 2023 as the State appropriates less than the Statutory amount and the valuation investment rate of return assumption decreases from 7.30% to 7.00%. Thereafter, the Statutory contributions remain relatively steady until lottery revenue stops. Once the appropriated amount equals the Statutory contribution, beginning in FYE 2023, the contributions reach the level necessary to pay down the UAL and the tread water line begins to decrease relative to the Statutory contribution. Additionally, expected lottery revenue that is contributed each year in excess of the Statutory contributions also helps pays down the UAL sooner.

TEACHERS’ PENSION AND ANNUITY FUND OF NEW JERSEY JULY 1, 2019 ACTUARIAL VALUATION
SECTION I – BOARD SUMMARY
12
Baseline: 7.0% return for all years

TEACHERS’ PENSION AND ANNUITY FUND OF NEW JERSEY JULY 1, 2019 ACTUARIAL VALUATION
SECTION II – ASSESSMENT AND DISCLOSURE OF RISK
13
Actuarial valuations are based on a set of assumptions about future economic and demographic experience. These assumptions represent a reasonable estimate of future experience, but actual future experience will undoubtedly be different and may be significantly different. This section of the report is intended to identify the primary risks to the plan, provide some background information about those risks, and provide an assessment of those risks. Identification of Risks The fundamental risk to the Fund is that the contributions needed to pay the benefits become unaffordable. While there are a number of factors that could lead to contribution amounts becoming unaffordable, we believe the primary risks are: • Investment risk, • Assumption change risk, and • Contribution risk. Other risks that we have not identified may also turn out to be important. Investment risk is the potential for investment returns to be different than expected. Lower investment returns than anticipated will increase the unfunded actuarial liability necessitating higher contributions in the future unless there are other gains that offset these investment losses. The potential volatility of future investment returns is determined by the Fund’s asset allocation and the affordability of the investment risk is determined by the amount of assets invested relative to the size of the plan sponsor or other contribution base. Assumption change risk is the potential for the environment to change such that future valuation assumptions are different than the current assumptions. For example, declines in interest rates over the last three decades resulted in higher investment returns for fixed income investments, but lower expected future returns necessitating either a change in investment policy, a reduction in discount rate, or some combination of the two. Assumption change risk is an extension of the other risks identified, but rather than capturing the risk as it is experienced, it captures the cost of recognizing a change in environment when the current assumption is no longer reasonable. Contribution risk is the potential for actual future contributions to deviate from expected future contributions. There are different sources of contribution risk ranging from the sponsor choosing to not make contributions in accordance with the funding policy to material changes in the contribution base (e.g., covered employees, covered payroll, sponsor revenue) that affect the amount of contributions the Fund can collect. The following chart shows the components of changes in the Unfunded Actuarial Liability (UAL) for the Fund over the last 10 years, including investment gains and losses on the Actuarial Value of Assets, liability gains and losses, assumption and plan/policy changes, and contributions compared to the tread water level of contributions (normal cost plus interest on the UAL.) The net UAL change is shown by the dark blue line. Table II-1 below the chart summarizes the changes in the UAL over the last 10 years.

TEACHERS’ PENSION AND ANNUITY FUND OF NEW JERSEY JULY 1, 2019 ACTUARIAL VALUATION
SECTION II – ASSESSMENT AND DISCLOSURE OF RISK
14
These total changes in UAL support our identification of investment returns, assumption changes, and contributions as the primary risks to the System.
Historical Changes in UAL 2010-2019
TABLE II-1Changes in Unfunded Actuarial Liability
(Dollar amounts in millions)State
2010 2011 2012 2013 2014 2015 2016 2017 2018 2019 Total
Discount Rate 8.25% 7.95% 7.90% 7.90% 7.90% 7.90% 7.65% 7.50% 7.50% 7.30%SourceAVA (G)/L 1,843.2$ 1,125.6$ 1,260.3$ 902.6$ 350.4$ 495.2$ 859.3$ 513.5$ 367.6$ 374.4$ 8,092.0$ Liability (G)/L (611.2) (212.5) 72.5 22.1 114.9 398.7 173.7 126.6 140.4 67.1 292.2 Assumptions/Methods 1,170.7 281.1 (337.7) (404.3) 0.0 0.0 1,144.2 822.6 (286.8) 3,353.5 5,743.4 Plan/Policy Changes (8,173.4) 0.0 0.0 0.0 0.0 0.0 0.0 0.0 0.0 (15.6) (8,189.0) Contributions1 2,341.9 1,590.8 1,263.8 1,051.0 2,343.1 1,458.9 1,461.1 1,246.2 1,036.8 652.8 14,446.5 Net UAL Change (3,428.9)$ 2,785.0$ 2,259.0$ 1,571.4$ 2,808.4$ 2,352.8$ 3,638.2$ 2,708.9$ 1,258.0$ 4,432.3$ 20,385.1$
1 UAL change due to contributions (greater)/less than normal cost plus interest on the UAL.
TEACHERS’ PENSION AND ANNUITY FUND OF NEW JERSEY JULY 1, 2019 ACTUARIAL VALUATION
SECTION II – ASSESSMENT AND DISCLOSURE OF RISK
15
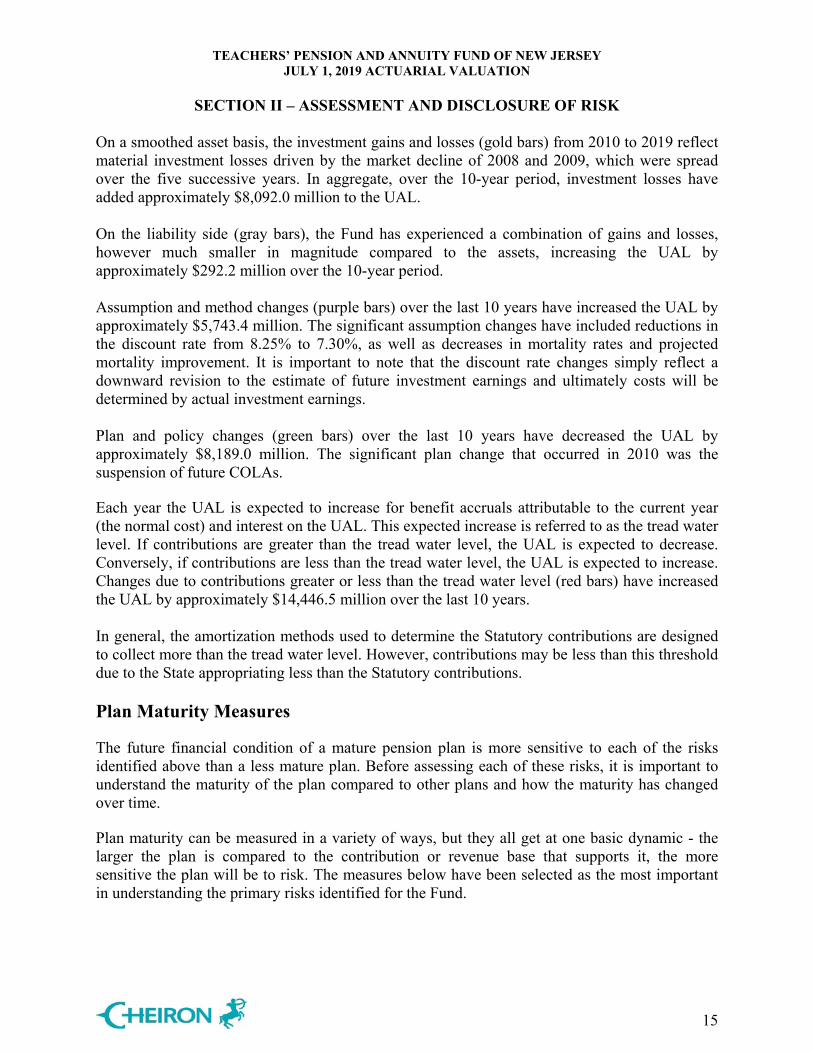
On a smoothed asset basis, the investment gains and losses (gold bars) from 2010 to 2019 reflect material investment losses driven by the market decline of 2008 and 2009, which were spread over the five successive years. In aggregate, over the 10-year period, investment losses have added approximately $8,092.0 million to the UAL. On the liability side (gray bars), the Fund has experienced a combination of gains and losses, however much smaller in magnitude compared to the assets, increasing the UAL by approximately $292.2 million over the 10-year period. Assumption and method changes (purple bars) over the last 10 years have increased the UAL by approximately $5,743.4 million. The significant assumption changes have included reductions in the discount rate from 8.25% to 7.30%, as well as decreases in mortality rates and projected mortality improvement. It is important to note that the discount rate changes simply reflect a downward revision to the estimate of future investment earnings and ultimately costs will be determined by actual investment earnings. Plan and policy changes (green bars) over the last 10 years have decreased the UAL by approximately $8,189.0 million. The significant plan change that occurred in 2010 was the suspension of future COLAs. Each year the UAL is expected to increase for benefit accruals attributable to the current year (the normal cost) and interest on the UAL. This expected increase is referred to as the tread water level. If contributions are greater than the tread water level, the UAL is expected to decrease. Conversely, if contributions are less than the tread water level, the UAL is expected to increase. Changes due to contributions greater or less than the tread water level (red bars) have increased the UAL by approximately $14,446.5 million over the last 10 years. In general, the amortization methods used to determine the Statutory contributions are designed to collect more than the tread water level. However, contributions may be less than this threshold due to the State appropriating less than the Statutory contributions. Plan Maturity Measures The future financial condition of a mature pension plan is more sensitive to each of the risks identified above than a less mature plan. Before assessing each of these risks, it is important to understand the maturity of the plan compared to other plans and how the maturity has changed over time. Plan maturity can be measured in a variety of ways, but they all get at one basic dynamic - the larger the plan is compared to the contribution or revenue base that supports it, the more sensitive the plan will be to risk. The measures below have been selected as the most important in understanding the primary risks identified for the Fund.

TEACHERS’ PENSION AND ANNUITY FUND OF NEW JERSEY JULY 1, 2019 ACTUARIAL VALUATION
SECTION II – ASSESSMENT AND DISCLOSURE OF RISK
16
Inactives per Active (Support Ratio) One simple measure of plan maturity is the ratio of the number of inactive members (those receiving benefits or entitled to a deferred benefit) to the number of active members. We refer to this ratio as the support ratio. The revenue base supporting the plan is usually proportional to the number of active members, so a relatively high number of inactives compared to actives indicate a larger plan relative to its revenue base as well. We also discussed this risk metric in Section I.
The chart above shows the distribution from the 5th to 95th percentile of support ratios for the plans in the Public Plans Database. The black diamond shows how TPAF compares dating back to 2009. TPAF has been less mature than the median plan. Though the support ratio increased following the Great Recession, it has remained stable at about the 25th percentile. Net Cash Flow The net cash flow of the plan as a percentage of the beginning of year assets indicates the sensitivity of the plan to short-term investment returns. Net cash flow is equal to contributions less benefit payments and administrative expenses. Mature plans can have large amounts of benefit payments compared to contributions, particularly if they are well funded. Investment losses in the short-term are compounded by the net withdrawal from the plan leaving a smaller asset base to try to recover from the investment losses. Large negative cash flows can also create liquidity issues. We also discussed this risk metric in Section I.

TEACHERS’ PENSION AND ANNUITY FUND OF NEW JERSEY JULY 1, 2019 ACTUARIAL VALUATION
SECTION II – ASSESSMENT AND DISCLOSURE OF RISK
17
The chart above shows the distribution from the 5th to 95th percentile of net cash flow for the plans in the Public Plans Database. The black diamond shows how TPAF compares to other public plans. Since the Great Recession, TPAF has been at or below the 5th percentile compared to the database of other public plans in terms of negative cash flow as a percentage of assets. Assessing Costs and Risks The fundamental risk to the Fund is that the contributions needed to fund the benefits become unaffordable. Assessing this risk, however, is complex because there is no bright line of what is unaffordable and the contribution amounts themselves are affected not just by the experience of the Fund, but also by the interaction of that experience and decisions by the State and the Board related to the amount of contributions appropriated, assumptions, asset smoothing methods, and amortization periods. Investment Risk - Stress Testing This section illustrates stress testing of the investment return assumption and is an extension of the baseline projections provided in the Summary section. Under the baseline results, we assumed the ultimate 7.00% investment return assumption each and every year beginning July 1, 2019.

TEACHERS’ PENSION AND ANNUITY FUND OF NEW JERSEY JULY 1, 2019 ACTUARIAL VALUATION
SECTION II – ASSESSMENT AND DISCLOSURE OF RISK
18
For stress testing purposes, we developed six hypothetical scenarios to illustrate the impact actual investment returns may have on future funded status and contribution amounts. The scenarios are balanced between positive and negative scenarios and are based on a lognormal distribution of one and five year expected returns as shown in the following table using the capital market assumptions from the New Jersey Division of Investments (Geometric return of 7.07%, standard deviation of 11.89%).
Distribution of Expected Average Annual Returns
Percentile 1 Year 5 Year
5% -10.7% -1.3%25% -0.6% 3.6%50% 7.1% 7.1%75% 15.3% 10.7%95% 28.3% 16.1%
The scenarios include: a one-year shock using the 5th and 95th percentile returns for one year; a 5-year moderate scenario using the 25th and 75th percentile returns for five years; and a 5-year significant scenario using the 5th and 95th percentile returns for five years. The table below summarizes the theoretical scenarios.
Theoretical Scenarios1-Yr Shock 5-Yr Moderate 5-Yr Significant
FYE Neg Pos Neg Pos Neg Pos
2020 -10.7% 28.3% 3.6% 10.7% -1.3% 16.1%2021 7.0% 7.0% 3.6% 10.7% -1.3% 16.1%2022 7.0% 7.0% 3.6% 10.7% -1.3% 16.1%2023 7.0% 7.0% 3.6% 10.7% -1.3% 16.1%2024 7.0% 7.0% 3.6% 10.7% -1.3% 16.1%
2025+ 7.0% 7.0% 7.0% 7.0% 7.0% 7.0%
In reviewing each of these projections, it is the future trends, not necessarily the actual values, that are important to observe in consideration of the risks of the Fund and the potential volatility of future funded ratios and Statutory contribution levels. We note that when asset returns are high, excess assets may be used to offset employer costs. We have not shown the implications of a surplus and assume that the State will always contribute at least the normal cost. The graphs on the following pages show the projections under each of these theoretical scenarios. Instead of the tread water line shown for the baseline projection, the contribution graphs include a dashed red line representing the expected contributions under the baseline projections shown in the Summary section to facilitate the comparison between the particular scenario and the baseline projections assuming all assumptions are met.

TEACHERS’ PENSION AND ANNUITY FUND OF NEW JERSEY JULY 1, 2019 ACTUARIAL VALUATION
SECTION II – ASSESSMENT AND DISCLOSURE OF RISK
19
One-Year Negative Shock Scenario: -10.7% return FYE 2020, 7.0% after

TEACHERS’ PENSION AND ANNUITY FUND OF NEW JERSEY JULY 1, 2019 ACTUARIAL VALUATION
SECTION II – ASSESSMENT AND DISCLOSURE OF RISK
20
One-Year Positive Shock Scenario: 28.3% return FYE 2020, 7.0% after

TEACHERS’ PENSION AND ANNUITY FUND OF NEW JERSEY JULY 1, 2019 ACTUARIAL VALUATION
SECTION II – ASSESSMENT AND DISCLOSURE OF RISK
21
Five-Year Moderate Negative Scenario: 3.6% return FYE 2020-2024, 7.0% after

TEACHERS’ PENSION AND ANNUITY FUND OF NEW JERSEY JULY 1, 2019 ACTUARIAL VALUATION
SECTION II – ASSESSMENT AND DISCLOSURE OF RISK
22
Five-Year Moderate Positive Scenario: 10.7% return FYE 2020-2024, 7.0% after

TEACHERS’ PENSION AND ANNUITY FUND OF NEW JERSEY JULY 1, 2019 ACTUARIAL VALUATION
SECTION II – ASSESSMENT AND DISCLOSURE OF RISK
23
Five-Year Significant Negative Scenario: -1.3% return FYE 2020-2024, 7.0% after

TEACHERS’ PENSION AND ANNUITY FUND OF NEW JERSEY JULY 1, 2019 ACTUARIAL VALUATION
SECTION II – ASSESSMENT AND DISCLOSURE OF RISK
24
Five-Year Significant Positive Scenario: 16.1% return FYE 2020-2024, 7.0% after

TEACHERS’ PENSION AND ANNUITY FUND OF NEW JERSEY JULY 1, 2019 ACTUARIAL VALUATION
SECTION II – ASSESSMENT AND DISCLOSURE OF RISK
25
These scenarios show that actual future investment returns have a significant impact on future State contribution amounts. In each of the scenarios, the State contribution amounts gradually increase through FYE 2023 as the State is assumed to appropriate an increasing percentage of the Statutory amount and the valuation investment rate of return assumption decreases from 7.30% to 7.00%. The following table summarizes the impact on the State contributions in FYE 2033 for each of the investment return scenarios.
Table II-2Impact on Contributions for FYE 2033
(dollar amounts in billions)
1-Yr Shock 5-Yr Moderate 5-Yr SignificantNeg Pos Neg Pos Neg Pos
Amount $0.37 ($0.44) $0.32 ($0.40) $0.71 ($1.08)Percent 10% -12% 9% -11% 20% -31%
The positive scenarios sometimes show the system achieving a 100% funded status during the 30-year projection period, which results in the State contribution decreasing to equal the employer normal cost. The investment returns used in the projections above were selected solely to illustrate the impact of investment volatility on the pattern of future funded status and contribution amounts. They are not intended to be predictive of actual future contributions or funded status or even to represent a realistic pattern of investment returns. Assumption Change Risk – Sensitivity Testing As shown in Table II-1, assumption changes over the last decade have increased the UAL by approximately $5,743.4 million. The most significant changes were reductions in the discount rate, decreases in mortality rates and projected mortality improvement. The reductions in discount rates have been largely driven by declines in interest rates that affect expectations of future investment returns. If there are further declines in interest rates or if there is a desire or need to reduce investment risk that reduces expected returns, the discount rate and expected returns may need to be reduced further. The charts on the following page show the impact on projected future funded status and contribution amounts if the discount rate and expected returns were reduced by 100 basis points to 6.00% beginning with the July 1, 2020 valuation. This scenario results in Statutory contributions in FYE 2033 that are approximately 17% higher than the baseline.

TEACHERS’ PENSION AND ANNUITY FUND OF NEW JERSEY JULY 1, 2019 ACTUARIAL VALUATION
SECTION II – ASSESSMENT AND DISCLOSURE OF RISK
26
6.00% Discount Rate and Investment Return Assumption Effective July 1, 2020

TEACHERS’ PENSION AND ANNUITY FUND OF NEW JERSEY JULY 1, 2019 ACTUARIAL VALUATION
SECTION II – ASSESSMENT AND DISCLOSURE OF RISK
27
Contribution Risk – Sensitivity Testing The amortization method used to determine the Statutory contributions is designed to collect more than the tread water level and, therefore, gradually pay down the UAL. However, appropriated contributions have consistently been less than the Statutory contributions and the tread water level, causing an increase in the UAL of approximately $14,446.5 million over the last 10 years. The baseline projections assume the State appropriates 80% of the Statutory contribution in FYE 2021, and increases the percent by 10% a year, until reaching 100% of the Statutory contribution beginning with FYE 2023, at which time contributions are projected to be greater than the tread water level. Contribution risk is the potential for actual future contributions to deviate from expected future contributions. The charts on the following page illustrate the impact on projected future funded status and contribution amounts if the State appropriation remains at 70% of the Statutory contribution for each year in the future, rather than gradually increasing to 100% of the Statutory contribution. In illustrating the contribution risk sensitivity, we assume the State’s appropriation percent remains at the current level of 70%. This scenario shows the Statutory and appropriated State contributions gradually increasing over time. The Statutory contributions quickly exceed the baseline. The appropriated contributions are below the baseline initially but eventually grow to reach a similar level, with a lower funded ratio. The funded ratio at the end of the projection period is 51% compared to 100% under the baseline projection.

TEACHERS’ PENSION AND ANNUITY FUND OF NEW JERSEY JULY 1, 2019 ACTUARIAL VALUATION
SECTION II – ASSESSMENT AND DISCLOSURE OF RISK
28
State Appropriates 70% of Statutory Contribution for Fiscal Year Ending June 30, 2021 and Thereafter

TEACHERS’ PENSION AND ANNUITY FUND OF NEW JERSEY JULY 1, 2019 ACTUARIAL VALUATION
SECTION II – ASSESSMENT AND DISCLOSURE OF RISK
29
More Detailed Assessment While a more detailed assessment is always valuable to enhance the understanding of the risks identified above, we believe the scenarios illustrated above cover the primary risks facing the Fund at this time. We would be happy to provide the Board with a more in-depth analysis at their request.

TEACHERS’ PENSION AND ANNUITY FUND OF NEW JERSEY JULY 1, 2019 ACTUARIAL VALUATION
SECTION III – ASSETS
30
The Fund uses and discloses two different asset measurements for funding, which are presented in this section of the report: market value and actuarial value of assets. The market value represents the value of the assets if they were liquidated on the valuation date. The actuarial value of assets is a value that smooths annual investment returns to reduce annual investment volatility and is used in determining contribution levels. In compliance with New Jersey Statute, the method used to calculate the actuarial value of assets recognizes 20% of the difference between the market value of assets and the expected actuarial value of assets each year. Actuarial Standards of Practice (ASOP) No. 44 states that the asset valuation method should produce an actuarial value of assets that falls within a reasonable range of market value, recognizes the difference between the market value and actuarial value of assets within a reasonably short period of time, and is likely to produce actuarial value of assets that are sometimes greater than and sometimes less than the corresponding market values. The asset method required under N. J. Statute does not meet the requirements of ASOP No. 44 because this method has produced actuarial value of assets which have consistently been greater than the market value of assets and recognizes investment losses slowly over time. Additionally, the method may produce an actuarial value of assets that falls outside of a reasonable range of the market value. On the following pages, we present detailed information on the Fund’s assets:
• Disclosure of assets at July 1, 2018 and July 1, 2019,
• Statement of cash flows during the year,
• Development of the actuarial value of assets,
• Disclosure of investment performance for the year,
• Development of the Special Asset Value (SAV), and
• Development of the Actuarial Balance Sheet. Disclosure The market value of assets represents a “snap-shot” value as of the last day of the fiscal year that provides the principal basis for measuring financial performance from one year to the next. Market values, however, can fluctuate widely with corresponding swings in the value of the investments. Because these fluctuations would cause volatility in employer contributions, an actuarial value of assets is developed. Table III-1 on the following page presents the market value as of June 30, 2018 and June 30, 2019. Table III-2 presents the Fund’s net cash flows from June 30, 2018 to June 30, 2019. Table III-3 presents the development of the Actuarial Value of Assets as of July 1, 2019.

TEACHERS’ PENSION AND ANNUITY FUND OF NEW JERSEY JULY 1, 2019 ACTUARIAL VALUATION
SECTION III – ASSETS
31
Table III-1 Statement of Assets at Market Value
June 30, 2019 June 30, 2018Assets
Cash 6,180,296$ 371,943,696$ Investment Holdings 22,690,207,686 22,634,290,412 Employers' Contributions Receivable - NCGI 5,671,665 4,647,272 Employers' Contributions Receivable - Common L 101,891,800 64,557,400 Employers' Contributions Receivable - Local Employers 720,684 953,445 Employers' Contributions Receivable - Local Employers ERI 9,798,143 12,906,879 Employers' Contributions Receivable - Delayed Enrollments 551,705 483,011 Employers' Contributions Receivable - Delayed Appropriations 5,079,408 5,052,280 Members' Contributions Receivable 84,097,036 82,297,872 Accrued Interest on Investments 82,302 63,622 Accounts Receivable 3,653,862 4,396,946 Loans Receivable 270,804,824 275,431,126 Securities Lending Collateral 289,647,691 247,244,971 Total Assets 23,468,387,102$ 23,704,268,932$
LiabilitiesPension Payroll Payable (308,723,013)$ (299,603,246)$ Pension Adjustment Payroll Payable (24,442,624) (26,115,228) Withholdings Payable (44,027,809) (43,217,971) Administrative Expenses Payable (490,857) (1,278,077) Death Benefits Payable (3,135,963) (5,278,892) Securities Lending Collateral & Rebates Payable (289,297,550) (247,237,955) Other Accounts Payable (101,535,010) (90,420,723) Total Liabilities (771,652,826)$ (713,152,092)$
Preliminary Market Value of Assets 22,696,734,276$ 22,991,116,840$
Discounted ReceivablesState Appropriations 1,376,520,108$ 1,068,977,365$ Expected Lottery Revenue 804,620,111 778,387,120
Market Value of Assets 24,877,874,495$ 24,838,481,325$

TEACHERS’ PENSION AND ANNUITY FUND OF NEW JERSEY JULY 1, 2019 ACTUARIAL VALUATION
SECTION III – ASSETS
32
Fund Cash Flows as of June 30, 2019
Table III-2Changes in Market Value for FYE June 30, 2019
AdditionsContributions
Member Contributions 846,166,328$ Member Transfer Contributions 12,365,945 State Appropriations 1,114,920,000 State Lottery 859,469,000 NCGI Contributions 41,107,648 Employer Transfer Contributions from Other Systems 2,783,020 Other Contributions - Delayed Enrollments 272,985 Other Contributions - Delayed Appropriations 27,127 Total Contributions 2,877,112,053$
Net Investment Income 1,361,781,295 Total Additions 4,238,893,348$
DeductionsWithdrawal of Member Contributions 61,545,901$ Withdrawal of Member Transfer Contributions 7,271,381 Withdrawal of Employer Transfer Contributions 1,221,907 Adjustment for Member Loans (55,909) Retirement Allowances 4,118,411,040 Pension Adjustment Benefits 289,851,559 NGCI Premiums 41,107,648 Administrative Expenses 13,922,385 Total Deductions 4,533,275,912$
Net Increase/(Decrease) (294,382,564)$
Preliminary Market Value of Assets Beginning of Year 22,991,116,840$ Preliminary Market Value of Assets End of Year 22,696,734,276$
Discounted ReceivablesState Appropriations 1,376,520,108$ Expected Lottery Revenue 804,620,111
Market Value of Assets End of Year 24,877,874,495$
Approximate Return 6.18%

TEACHERS’ PENSION AND ANNUITY FUND OF NEW JERSEY JULY 1, 2019 ACTUARIAL VALUATION
SECTION III – ASSETS
33
Actuarial Value of Assets (AVA) To determine on-going funding requirements, most pension systems utilize an actuarial value of assets that differs from the market value of assets. The actuarial value of assets represents an asset value based on averaging or smoothing year-to-year market value returns for purposes of reducing contribution volatility. Each year, 20% of the difference between the adjusted market value of assets and the expected actuarial value of assets is added to the expected actuarial value of assets.
1. Preliminary Actuarial Value of Assets as of July 1, 20181 24,461,390,470$
2. Net Cash Flow excluding Investment Income (1,656,163,859)
3. Expected Investment Income2 1,763,451,966
4. Expected Actuarial Value of Assets as of July 1, 2019: [1 + 2 + 3] 24,568,678,577$
5. Preliminary Market Value as of June 30, 2019 22,696,734,276$
6. 20% of Difference from MVA = [(5-4) x 0.2] (374,388,860)$
7. Preliminary Actuarial Value of Assets as of July 1, 20191: [4 + 6] 24,194,289,717$
8. Discounted ReceivablesState Appropriations 1,376,520,108$ Expected Lottery Revenue 804,620,111 Total 2,181,140,219$
9. Actuarial Value of Assets as of July 1, 2019: [7 + 8] 26,375,429,936$
10. Rate of Return on Actuarial Value of Assets 5.91%
11. Ratio of Actuarial Value of Assets to Market Value of Assets 106.0%
1 Excludes discounted State appropriations receivable2 Refer to Appendix B, Actuarial Methods, for details on the assumed timing of contributions
Table III-3Development of Actuarial Value of Assets as of July 1, 2019

TEACHERS’ PENSION AND ANNUITY FUND OF NEW JERSEY JULY 1, 2019 ACTUARIAL VALUATION
SECTION III – ASSETS
34
Investment Performance The market value of assets rate of return was 6.18% for the year ending June 30, 2019. This is compared to an assumed return of 7.50% for the same period. On an actuarial value of assets basis, the return for FYE 2019 was 5.91%. In the table below, we show historical asset returns compared to the investment return assumption.
Table III-4
Annual Rates of Return
Year Ended Investment Return June 30 Assumption Market Value Actuarial Value
2010 8.25% 13.83% 2.74%2011 8.25% 17.91% 4.71%2012 7.95% 2.46% 3.85%2013 7.90% 11.69% 4.86%2014 7.90% 16.58% 6.67%2015 7.90% 4.15% 6.10%2016 7.90% -1.12% 4.68%2017 7.65% 13.05% 5.64%2018 7.50% 9.19% 5.97%2019 7.50% 6.18% 5.91%
10-Year Compound Average 9.23% 5.11%5-Year Compound Average 6.18% 5.66%

TEACHERS’ PENSION AND ANNUITY FUND OF NEW JERSEY JULY 1, 2019 ACTUARIAL VALUATION
SECTION III – ASSETS
35
Development of Special Asset Value (SAV) Under Chapter 98, P.L. 2017, the Lottery Enterprise Contribution Act, TPAF receives 77.78% of the proceeds of the Lottery Enterprise for a term of 30 years. The value of the Lottery Enterprise is classified as a special asset, and is included in the actuarial value of assets used for the purpose of calculating the target funding ratio under Chapter 78, P.L. 2010. The special asset value is the present value of remaining lottery contributions to the retirement systems. Table III-5 shows the development of the special asset value as of July 1, 2019. The depreciated value is a roll forward of the Lottery Enterprise value from the appraisal date.
Table III-5 Development of Special Asset Value for July 1, 2019
1. Lottery Enterprise Value as of Appraisal Date of June 30, 20171 13,535,103,380$ 2. Depreciated Value at end of Valuation Year at June 30, 20201 13,536,782,838 3. Discounted Value as of July 1, 2019 at 7.30% 12,615,827,4354. Allocation to TPAF 77.78%5. Special Asset Value as of July 1, 2019 9,812,590,579$ 1 Provided by the Division of Pensions and Benefits

TEACHERS’ PENSION AND ANNUITY FUND OF NEW JERSEY JULY 1, 2019 ACTUARIAL VALUATION
SECTION III – ASSETS
36
Actuarial Balance Sheet
AssetsRetirement Fund Reserve (RFR)Credited to Fund with Distribution of Income 40,265,329,953$ Add/(Deduct) reserve transferable from/(to) ECR1 2,134,304,550 Adjusted RFR2 42,399,634,503$ 3
Members' Contributions Reserve (MCR)2 7,686,922,827$
Accumulative Interest Reserve (AIR) with Distribution of Income2 6,506,005,479$
Employers' Contributions Reserve (ECR)Credited to Fund with Distribution of Income (28,082,828,323)$ Add/(Deduct) reserve transferable from/(to) RFR (2,134,304,550) Adjusted CRF2 (30,217,132,873)$
Benefit Enhancement Fund (BEF)2 0$
Special Asset Value as of July 1, 2019 9,812,590,579$
Present Value of Prospective Contributions to ECR and BEF 29,282,827,370$
Total Assets 65,470,847,885$
LiabilitiesPayable from RFRRetirees, Disableds, and Beneficiaries currently receiving benefits 42,399,634,503$ 3
Payable from Annuity Savings Fund and ECRActive and Deferred Vested Members due a future benefit 23,071,213,382$
Total Liabilities 65,470,847,885$ 1 It is recommended that the RFR be put into balance each year by transferring assets from the ECR to the RFR so that the RFR will contain sufficient assets to cover the retiree and b beneficiary liability.2 Actuarial Value of Assets equals RFR + MCR + AIR + ECR + BEF.3 Includes the present value of Local ERI payments of $5,986,729.
Table III-6Actuarial Balance Sheet as of June 30, 2019

TEACHERS’ PENSION AND ANNUITY FUND OF NEW JERSEY JULY 1, 2019 ACTUARIAL VALUATION
SECTION IV – LIABILITIES
37
In this section, we present detailed information on liabilities of the Fund, including: • Disclosure of liabilities at July 1, 2018 and July 1, 2019,
• Active liabilities broken down by Tier, and
• The development of the actuarial gain and loss. Disclosure The Actuarial Liability is used for determining employer contributions. For TPAF, the funding method employed is the Projected Unit Credit (PUC) Actuarial Cost Method. Under this funding method, the actuarial liability is calculated as the actuarial present value of the projected benefits allocated to periods prior to the valuation year. This liability is determined for funding purposes and is not appropriate for measuring the cost of settling plan liabilities by purchasing annuities or paying lump sums.

TEACHERS’ PENSION AND ANNUITY FUND OF NEW JERSEY JULY 1, 2019 ACTUARIAL VALUATION
SECTION IV – LIABILITIES
38
Table IV-1 shows the actuarial liability, unfunded actuarial liability and funded ratios as of July 1, 2019, and July 1, 2018 for the Fund. The unfunded actuarial liability (UAL) and funded ratio based on the actuarial value of assets plus the special asset value (AVA + SAV) are used to compare against the “target funded ratio” and is different from the UAL used in determining the Statutory contributions which is based on just the actuarial value of assets (AVA).
July 1, 2019 July 1, 2018Actuarial Liability
Contributing Actives 22,129,473,344$ 19,973,993,069$ Non-Contributing Actives 873,596,654 826,022,665 Deferred Vested 68,143,384 30,259,839 Retirees 39,927,659,770 37,868,375,403 Disabled 1,011,052,979 926,626,341 Beneficiaries 1,460,921,754 1,346,641,998
Total Actuarial Liability 65,470,847,885$ 60,971,919,315$
Actuarial Value of Assets 26,375,429,936$ 26,308,754,955$ Unfunded Actuarial Liability/(Surplus) 39,095,417,949$ 34,663,164,360$ Funded Ratio (AVA) 40.3% 43.1%
Actuarial Value of Assets + Special Asset Value 36,188,020,515$ 36,127,247,378$ Unfunded Actuarial Liability/(Surplus) 29,282,827,370$ 24,844,671,937$ Funded Ratio (AVA + SAV) 55.3% 59.3%
Table IV-1Disclosure of Liabilities

TEACHERS’ PENSION AND ANNUITY FUND OF NEW JERSEY JULY 1, 2019 ACTUARIAL VALUATION
SECTION IV – LIABILITIES
39
Tables IV-2 and IV-3 show the number of members, total appropriation salary, actuarial liability, and gross normal cost for contributing and non-contributing active members by Tier as of July 1, 2019.
Number of Appropriation Actuarial GrossMembers Payroll1 Liability Normal Cost
Tier 1 77,347 6,997,830,934$ 19,864,111,395$ 886,377,186$ Tier 2 10,179 724,707,014 912,197,828 76,706,382 Tier 3 5,129 351,494,126 366,129,273 35,535,729 Tier 4 2,977 199,260,242 150,274,351 16,588,331 Tier 5 46,163 2,788,310,822 836,760,497 181,357,370 Total 141,795 11,061,603,138$ 22,129,473,344$ 1,196,564,998$
1 Tier 1 members limited to the 401(a)(17) pay limit. Other tiers limited to the Social Security Wage Base.
Table IV-2Contributing Active Liabilities by Tier
Number of Last Reported Actuarial GrossMembers Payroll Liability Normal Cost
Tier 1 7,620 453,968,436$ 759,013,931$ 0$ Tier 2 1,019 58,066,268 35,957,485 0 Tier 3 514 29,128,659 14,732,254 0 Tier 4 288 17,597,514 7,978,165 0 Tier 5 4,830 238,340,815 55,914,819 0 Total 14,271 797,101,692$ 873,596,654$ 0$
Table IV-3Non-Contributing Member Liabilities by Tier
Tables IV-4 presents the change in the actuarial liabilities, actuarial assets, and unfunded actuarial liability during the plan year. In general, the unfunded actuarial liability (UAL) of any retirement system is expected to change at each subsequent valuation for a variety of reasons. In each valuation, we report on those elements of change in the UAL which are of particular significance, potentially affecting the long-term financial outlook of the Fund. For this purpose, we focus on the UAL without considering the SAV because this UAL is used to determine the Statutory contribution.

TEACHERS’ PENSION AND ANNUITY FUND OF NEW JERSEY JULY 1, 2019 ACTUARIAL VALUATION
SECTION IV – LIABILITIES
40
Table IV-4Development of 2019 Experience (Gain)/Loss
Unfunded Actuarial Actuarial Value ActuarialLiability of Assets Liability
1. Value as of July 1, 2018 60,971,919,315$ (26,308,754,955)$ 34,663,164,360$
2. AdditionsNormal Cost 1,068,315,779$ 0$ 1,068,315,779$ Statutory State Contributions 0 (3,244,013,909) (3,244,013,909) Expected Member Contributions 0 (809,587,817) (809,587,817) Total Additions 1,068,315,779$ (4,053,601,726)$ (2,985,285,947)$
3. DecreasesBenefit Payments (4,469,752,591)$ 4,469,752,591$ 0$ Expected Administrative Expenses 0 0 0 Total Deductions (4,469,752,591)$ 4,469,752,591$ 0$
4. Net Transfers from Other SystemsEmployer Contributions 1,561,113$ (1,561,113)$ 0$ Member Contributions 5,094,564 (5,094,564) 0 Total Net Transfers 6,655,677$ (6,655,677)$ 0$
5. Expected Interest 4,488,677,175$ (1,838,626,862)$ 2,650,050,313$
6. Expected Value as of July 1, 2019: [1 + 2 + 3 + 4 + 5] 62,065,815,355$ (27,737,886,629)$ 34,327,928,726$
7. Other ChangesAppropriation Adjustment 0$ 976,550,124$ 976,550,124$ Contribution Timing 0 90,544,131 90,544,131 Actual Lottery Revenue 0 (55,224,886) (55,224,886) Other Employer Contributions 0 (311,163) (311,163) Actual Member Contributions 0 (37,925,407) (37,925,407) Change in Methods/Assumptions Experience Study 1,967,962,507 0 1,967,962,507 Investment Rate of Return 1,385,554,494 0 1,385,554,494 Change in Benefits/Policy (15,561,490) 0 (15,561,490) Total Other Changes 3,337,955,511$ 973,632,799$ 4,311,588,310$
8. Expected Value after Changes: [6 + 7] 65,403,770,866$ (26,764,253,830)$ 38,639,517,036$
9. Actual Value as of July 1, 2019 65,470,847,885$ (26,375,429,936)$ 39,095,417,949$
10. Actuarial (Gain)/Loss: [9 - 8] 67,077,019$ 388,823,894$ 455,900,913$

TEACHERS’ PENSION AND ANNUITY FUND OF NEW JERSEY JULY 1, 2019 ACTUARIAL VALUATION
SECTION IV – LIABILITIES
41
Table IV-5 shows the components of the Actuarial (gain)/loss.
Table IV-5Actuarial (Gain)/Loss Analysis
Components July 1, 2019 July 1, 2018
Actuarial Value of Assets Investment Return 374,388,860$ 367,568,407$ Administrative Expenses 14,435,034 13,709,045 Total 388,823,894$ 381,277,452$
Actuarial Liability Salary Increases 58,214,503$ 35,896,638$ New Entrants 40,970,983 50,709,843 Demographic Experience and Census Data Updates
Contributing Actives (2,079,804) 56,354,670 Non-Contributing Actives (9,051,607) (53,985,381) Inactives (14,076,303) 57,360,769 Sub-Total 73,977,772$ 146,336,539$ Impact of Net Transfers from Other Systems (6,900,753) (5,895,675) Total 67,077,019$ 140,440,864$
Actuarial (Gain)/Loss 455,900,913$ 521,718,317$

TEACHERS’ PENSION AND ANNUITY FUND OF NEW JERSEY JULY 1, 2019 ACTUARIAL VALUATION
SECTION V – CONTRIBUTIONS
42
In the process of evaluating the financial condition of any pension plan, the actuary analyzes the assets and liabilities to determine what level (if any) of contributions is needed to properly maintain the funding status of the Plan. Typically, the actuarial process will use a funding technique that will result in a pattern of contributions that are both stable and predictable. Under the current funding policy, the State funding requirement contains two components: the employer normal cost and an amortization of the unfunded actuarial liability (UAL). The UAL for this purpose does not include the special asset value. The funding methodology prescribed by NJ State Statute does not include a cost component for administrative expenses, and therefore administrative expenses are implicitly covered by the investment rate of return assumption. Because the investment rate of return assumption is recommended by the State Treasurer, we provide no opinion on the reasonableness of the assumption. For TPAF, the funding method employed is the Projected Unit Credit (PUC) Actuarial Cost Method. Under this funding method, the actuarial liability is calculated as the actuarial present value of the projected benefits linearly allocated to periods prior to the valuation year. Refunds are valued as the Accumulated Deductions with interest as of the valuation date as provided by the Division of Pensions and Benefits. The unfunded actuarial liability is the actuarial liability on the valuation date less the actuarial value of assets. In accordance with Chapter 78, P. L. 2011, the unfunded actuarial liability for the July 1, 2018 valuation was amortized over an open 30 year period as a level dollar amount. Beginning with the July 1, 2019 valuation, the unfunded actuarial liability is amortized over a closed 30 year period as a level dollar amount. Under Chapter 98, P.L. 2017, the Lottery Enterprise Contribution Act, TPAF receives 77.78% of the proceeds of the Lottery Enterprise for a term of 30 years. As of the July 1, 2019 valuation, 27 years remain. The State's pension contribution shall be reduced by the product of the allocable percentage for such retirement system, the adjustment percentage for such retirement system and the special asset adjustment.

TEACHERS’ PENSION AND ANNUITY FUND OF NEW JERSEY JULY 1, 2019 ACTUARIAL VALUATION
SECTION V – CONTRIBUTIONS
43
Table V-1 shows the development of the Lottery Enterprise contribution offset. Per N.J. Statute, the methodology for determining the percentage varies depending on the applicable fiscal year. The following table shows both calculations to illustrate how the adjustment percentage may change over time.
For Fiscal Years Through 20221. Special Asset Adjustment for FYE 20211 1,084,354,841$
2. Allocable Percentage to TPAF for Fiscal Years through 2022 77.78%
3. Adjustment Percentage 100.00%
4. Lottery Enterprise Contribution Offset as of June 30, 2020 [1 x 2 x 3] 843,411,195$
For Fiscal Years Beginning 20235. Special Asset Value Allocated to TPAF as of July 1, 2019 9,812,590,579$
6. 27-Year Level Dollar Amortization payable June 30, 2020 841,949,109$
7. Initial Special Asset Value Allocated to TPAF as of July 1, 2016 9,779,398,978$
8. Maximum Special Asset Adjustment: 30-Year Level Dollar Amortization at 7.65% 840,156,036$
9. Special Asset Adjustment as of June 30, 2020 [lesser of 6 and 8] 840,156,036$
10. Adjustment Percentage 88.27%
11. Funded Ratio based on Actuarial Value + Special Asset Value 55.27%
12. Applicable Adjustment Percentage 88.27%[If 11. < 50%, 10. - 3 x (50% - 11.), otherwise 10.]
1 This adjustment will be $1,095,871,137 for FYE 2022.
Table V-1Development of Lottery Enterprise Contribution Offset for Fiscal Year Ending 2021
TEACHERS’ PENSION AND ANNUITY FUND OF NEW JERSEY JULY 1, 2019 ACTUARIAL VALUATION
SECTION V – CONTRIBUTIONS
44
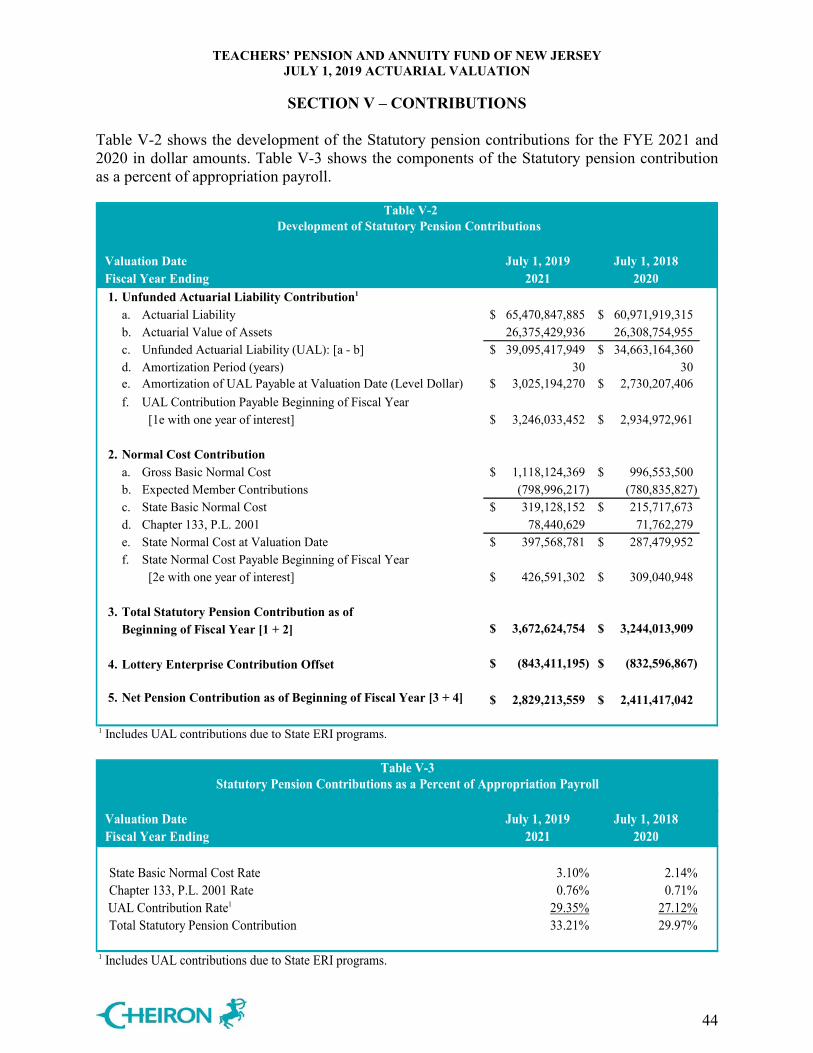
Table V-2 shows the development of the Statutory pension contributions for the FYE 2021 and 2020 in dollar amounts. Table V-3 shows the components of the Statutory pension contribution as a percent of appropriation payroll.
Table V-2
Development of Statutory Pension Contributions
Valuation Date July 1, 2019 July 1, 2018Fiscal Year Ending 2021 20201. Unfunded Actuarial Liability Contribution1
a. Actuarial Liability 65,470,847,885$ 60,971,919,315$ b. Actuarial Value of Assets 26,375,429,936 26,308,754,955 c. Unfunded Actuarial Liability (UAL): [a - b] 39,095,417,949$ 34,663,164,360$ d. Amortization Period (years) 30 30e. Amortization of UAL Payable at Valuation Date (Level Dollar) 3,025,194,270$ 2,730,207,406$ f. UAL Contribution Payable Beginning of Fiscal Year
[1e with one year of interest] 3,246,033,452$ 2,934,972,961$
2. Normal Cost Contributiona. Gross Basic Normal Cost 1,118,124,369$ 996,553,500$ b. Expected Member Contributions (798,996,217) (780,835,827) c. State Basic Normal Cost 319,128,152$ 215,717,673$ d. Chapter 133, P.L. 2001 78,440,629 71,762,279 e. State Normal Cost at Valuation Date 397,568,781$ 287,479,952$ f. State Normal Cost Payable Beginning of Fiscal Year
[2e with one year of interest] 426,591,302$ 309,040,948$
3. Total Statutory Pension Contribution as of Beginning of Fiscal Year [1 + 2] 3,672,624,754$ 3,244,013,909$
4. Lottery Enterprise Contribution Offset (843,411,195)$ (832,596,867)$
5. Net Pension Contribution as of Beginning of Fiscal Year [3 + 4] 2,829,213,559$ 2,411,417,042$
1 Includes UAL contributions due to State ERI programs.
Table V-3 Statutory Pension Contributions as a Percent of Appropriation Payroll
Valuation Date July 1, 2019 July 1, 2018Fiscal Year Ending 2021 2020
State Basic Normal Cost Rate 3.10% 2.14%Chapter 133, P.L. 2001 Rate 0.76% 0.71%
UAL Contribution Rate1 29.35% 27.12%Total Statutory Pension Contribution 33.21% 29.97%
1 Includes UAL contributions due to State ERI programs.

TEACHERS’ PENSION AND ANNUITY FUND OF NEW JERSEY JULY 1, 2019 ACTUARIAL VALUATION
SECTION V – CONTRIBUTIONS
45
Table V-4 shows the breakdown of the Statutory contributions payable by various State departments and certain State colleges.
Table V-4Fiscal Year Ending 2021 Statutory Contributions Payable by the State and Certain State Colleges
Basic Ch. 133, P.L. 2009Appropriation Normal Cost Normal Cost UAL Contribution Lottery Enterprise Net Pension
Group Payroll Contribution Contribution Basic State ERI Contribution Offset ContributionCertain State Colleges
NJ Institute for Technology 0$ 0$ 0$ 0$ 77,466$ 0$ 77,466$ Rowan University 0 0 0 0 65,341 0 65,341 New Jersey University 0 0 0 0 385,216 0 385,216 Kean University 105,735 3,273 805 30,991 201,489 (8,062) 228,496 William Patterson University 290,457 8,991 2,210 85,133 74,397 (22,146) 148,585 Monclair State University 0 0 0 0 159,399 0 159,399 The College of NJ 0 0 0 0 40,969 0 40,969 Stockton State College 0 0 0 0 0 0 0 Total Certain State Colleges 396,192$ 12,264$ 3,015$ 116,124$ 1,004,277$ (30,208)$ 1,105,472$
StateDepartment of Higher Education 0$ 0$ 0$ 0$ 0$ 0$ 0$ Department of Education 10,115,441 313,135 76,968 2,964,853 2,854,448 (771,269) 5,438,135 County Colleges 476,773 14,759 3,628 139,743 0 (36,352) 121,778 Charter Schools 266,906,746 8,262,402 2,030,871 78,230,822 0 (20,350,770) 68,173,325 Other 10,783,707,986 333,821,947 82,052,313 3,160,723,185 0 (822,222,596) 2,754,374,849 Total State 11,061,206,946$ 342,412,243$ 84,163,780$ 3,242,058,603$ 2,854,448$ (843,380,987)$ 2,828,108,087$
Total System 11,061,603,138$ 342,424,507$ 84,166,795$ 3,242,174,727$ 3,858,725$ (843,411,195)$ 2,829,213,559$

TEACHERS’ PENSION AND ANNUITY FUND OF NEW JERSEY JULY 1, 2019 ACTUARIAL VALUATION
APPENDIX A – MEMBERSHIP INFORMATION
46
The data for this valuation was provided by the Division of Pensions and Benefits as of July 1, 2019. Cheiron did not audit any of the data. However, we did perform an informal examination of the obvious characteristics of the data for reasonableness and consistency in accordance with Actuarial Standards of Practice No. 23. The following is a list of data charts contained in this section:
• A-1: Contributing Active Member Data by Tier • A-2: Non-Contributing Active Member by Tier • A-3: Inactive Member Data by Status • A-4: Reconciliation of Membership • A-5 to A-6: Contributing Active Member Data by Age and Service • A-7 to A-8: Inactive Member Data by Age and Status

TEACHERS’ PENSION AND ANNUITY FUND OF NEW JERSEY JULY 1, 2019 ACTUARIAL VALUATION
APPENDIX A – MEMBERSHIP INFORMATION
47
Table A-1
% %July 1, 2019 July 1, 2018 Change July 1, 2019 July 1, 2018 Change
Tier 1 Tier 2Count 77,347 81,416 -5.0% Count 10,179 10,446 -2.6%Average Age 49.9 49.5 0.9% Average Age 41.9 41.0 2.2%Average Service 20.0 19.4 3.6% Average Service 11.5 10.4 11.4%Average Appropriation Pay 90,473$ 87,908$ 2.9% Average Appropriation Pay 71,196$ 68,138$ 4.5%Total Appropriation Payroll 6,997,830,934$ 7,157,147,775$ -2.2% Total Appropriation Payroll 724,707,014$ 711,766,029$ 1.8%
Tier 3 Tier 4Count 5,129 5,184 -1.1% Count 2,977 3,038 -2.0%Average Age 40.9 39.9 2.5% Average Age 39.0 38.0 2.7%Average Service 10.0 8.9 12.5% Average Service 8.8 7.7 13.8%Average Appropriation Pay 68,531$ 65,799$ 4.2% Average Appropriation Pay 66,933$ 64,481$ 3.8%Total Appropriation Payroll 351,494,126$ 341,104,057$ 3.0% Total Appropriation Payroll 199,260,242$ 195,893,162$ 1.7%
Tier 5 TotalCount 46,163 41,044 12.5% Count 141,795 141,128 0.5%Average Age 35.2 34.6 1.7% Average Age 44.0 43.9 0.1%Average Service 4.2 3.6 17.3% Average Service 13.7 13.5 1.6%Average Appropriation Pay 60,401$ 58,902$ 2.5% Average Appropriation Pay 78,011$ 76,693$ 1.7%Total Appropriation Payroll 2,788,310,822$ 2,417,593,774$ 15.3% Total Appropriation Payroll 11,061,603,138$ 10,823,504,797$ 2.2%
Contributing Active Member Data by Tier
Reflects all records for multiple members, which are active members employed by more than one TPAF-participating employer at the same time.

TEACHERS’ PENSION AND ANNUITY FUND OF NEW JERSEY JULY 1, 2019 ACTUARIAL VALUATION
APPENDIX A – MEMBERSHIP INFORMATION
48
% %July 1, 2019 July 1, 2018 Change July 1, 2019 July 1, 2018 Change
Tier 1 Tier 2Count 7,620 7,932 -3.9% Count 1,019 1,072 -4.9%Average Age 50.6 50.3 0.5% Average Age 41.7 41.0 1.5%Average Service 12.7 12.4 2.9% Average Service 7.8 6.9 14.5%Average Last Reported Pay 64,576$ 63,578$ 1.6% Average Last Reported Pay 59,191$ 57,341$ 3.2%Total Last Reported Pay 453,968,436$ 464,817,285$ -2.3% Total Last Reported Pay 58,066,268$ 59,233,360$ -2.0%
Tier 3 Tier 4Count 514 580 -11.4% Count 288 318 -9.4%Average Age 41.1 40.6 1.2% Average Age 38.2 38.2 0.2%Average Service 6.5 6.1 7.0% Average Service 6.5 5.7 13.8%Average Last Reported Pay 57,567$ 57,618$ -0.1% Average Last Reported Pay 61,530$ 60,585$ 1.6%Total Last Reported Pay 29,128,659$ 32,957,741$ -11.6% Total Last Reported Pay 17,597,514$ 19,144,971$ -8.1%
Tier 5 TotalCount 4,830 4,466 8.2% Count 14,271 14,368 -0.7%Average Age 36.5 36.2 0.8% Average Age 44.6 44.6 0.0%Average Service 2.8 2.6 11.0% Average Service 8.7 8.5 2.0%Average Last Reported Pay 57,794$ 56,704$ 1.9% Average Last Reported Pay 61,662$ 60,607$ 1.7%Total Last Reported Pay 238,340,815$ 241,558,869$ -1.3% Total Last Reported Pay 797,101,692$ 817,712,226$ -2.5%
Average pay calculations exclude 1,344 and 876 members with no reported pay information as of July 1, 2019 and July 1, 2018, respectively.
Non-Contributing Member Data by TierTable A-2
The averages as of July 1, 2018 have been updated to reflect additional members with no reported pay information

TEACHERS’ PENSION AND ANNUITY FUND OF NEW JERSEY JULY 1, 2019 ACTUARIAL VALUATION
APPENDIX A – MEMBERSHIP INFORMATION
49
%July 1, 2019 July 1, 2018 Change
RetireesCount 95,841 94,434 1.5%Annual Retirement Allowances 4,095,575,746$ 4,011,000,750$ 2.1%Average Retirement Allowance 42,733$ 42,474$ 0.6%
BeneficiariesCount 6,838 6,628 3.2%Annual Retirement Allowances 184,321,296$ 176,461,487$ 4.5%Average Retirement Allowance 26,955$ 26,624$ 1.2%
Ordinary DisabilityCount 3,436 3,372 1.9%Annual Retirement Allowances 98,871,921$ 95,893,508$ 3.1%Average Retirement Allowance 28,775$ 28,438$ 1.2%
Accidental DisabilityCount 273 269 1.5%Annual Retirement Allowances 12,491,832$ 12,090,936$ 3.3%Average Retirement Allowance 45,758$ 44,948$ 1.8%
In-Pay TotalCount 106,388 104,703 1.6%Annual Retirement Allowances 4,391,260,795$ 4,295,446,681$ 2.2%Average Retirement Allowance 41,276$ 41,025$ 0.6%
Deferred Vested MembersCount 432 219 97.3%Annual Retirement Allowances 8,067,684$ 3,570,312$ 126.0%Average Retirement Allowance 18,675$ 16,303$ 14.6%
Table A-3Inactive Member Data by Status
QDRO benefits included with member records for valuation purposes.

TEACHERS’ PENSION AND ANNUITY FUND OF NEW JERSEY JULY 1, 2019 ACTUARIAL VALUATION
APPENDIX A – MEMBERSHIP INFORMATION
50
Contributing Non-Contrib. DeferredActives Actives Vested Retired Disabled Beneficiaries Total
1. July 1, 2018 141,128 14,368 219 94,434 3,641 6,628 260,418
2. Additionsa. New entrants 7,344 325 7,669b. New beneficiaries 68 68c. Data corrections 7 7d. Total 7,344 325 0 7 0 68 7,744
3. Reductionsa. Withdrawal/certain period ended (549) (2,311) (8) (2,868)b. Died without beneficiary (62) (34) (1,844) (112) (334) (2,386)c. Data corrections (22) (22)d. Total (611) (2,345) 0 (1,844) (112) (364) (5,276)
4. Changes in Statusa. Contributing Actives 1,813 (1,813) 0b. Non-Contributing Actives (4,277) 4,277 0c. Deferred Vested (34) (234) 268 0d. Retired (3,437) (226) (55) 3,718 0e. Disabled (122) (79) (2) 203 0f. Died with beneficiary (9) (2) (472) (23) 506 0g. Total (6,066) 1,923 213 3,244 180 506 0
5. July 1, 2019 141,795 14,271 432 95,841 3,709 6,838 262,886
Table A-4Reconciliation of Plan Membership from July 1, 2018 to July 1, 2019
Reflects all records for multiple members, which are active members employed by more than one TPAF-participating employer at the same time. QDRO benefits included with member records for valuation purposes.
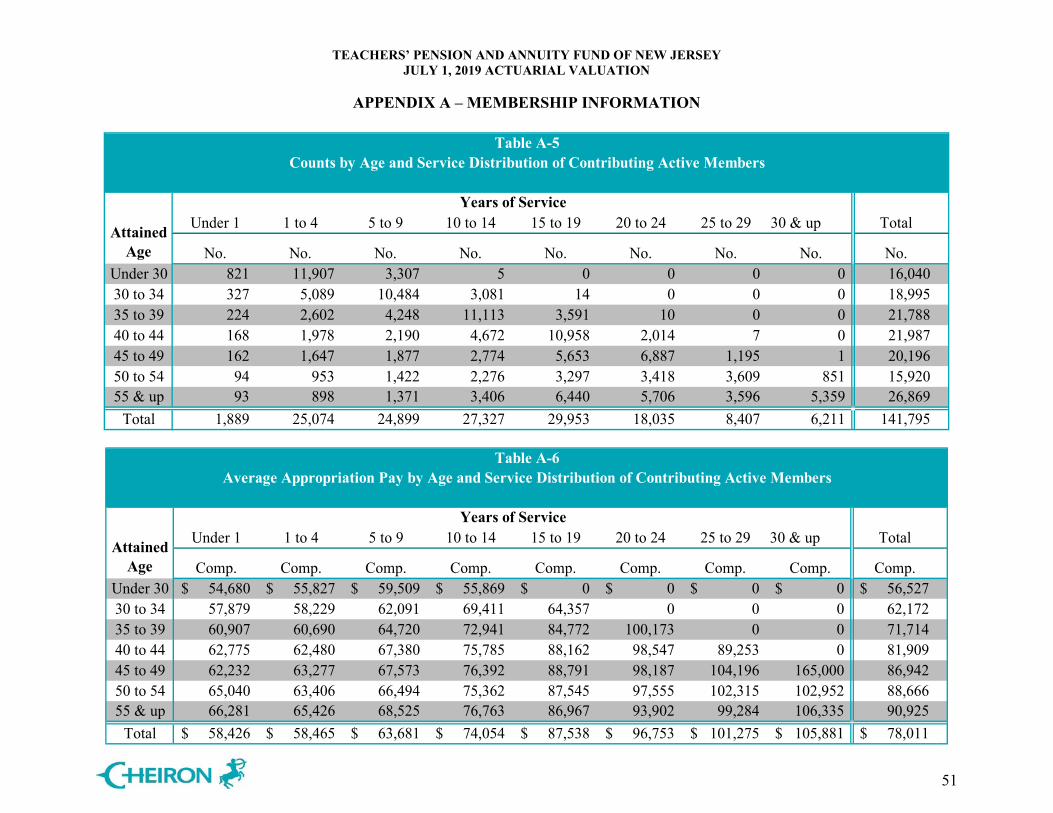
TEACHERS’ PENSION AND ANNUITY FUND OF NEW JERSEY JULY 1, 2019 ACTUARIAL VALUATION
APPENDIX A – MEMBERSHIP INFORMATION
51
Under 1 1 to 4 5 to 9 10 to 14 15 to 19 20 to 24 25 to 29 30 & up Total
Age No. No. No. No. No. No. No. No. No.Under 30 821 11,907 3,307 5 0 0 0 0 16,04030 to 34 327 5,089 10,484 3,081 14 0 0 0 18,99535 to 39 224 2,602 4,248 11,113 3,591 10 0 0 21,78840 to 44 168 1,978 2,190 4,672 10,958 2,014 7 0 21,98745 to 49 162 1,647 1,877 2,774 5,653 6,887 1,195 1 20,19650 to 54 94 953 1,422 2,276 3,297 3,418 3,609 851 15,92055 & up 93 898 1,371 3,406 6,440 5,706 3,596 5,359 26,869
Total 1,889 25,074 24,899 27,327 29,953 18,035 8,407 6,211 141,795
Table A-5Counts by Age and Service Distribution of Contributing Active Members
Attained
Years of Service
Under 1 1 to 4 5 to 9 10 to 14 15 to 19 20 to 24 25 to 29 30 & up TotalAverage Average Average Average Average Average Average Average Average
Age Comp. Comp. Comp. Comp. Comp. Comp. Comp. Comp. Comp.Under 30 54,680$ 55,827$ 59,509$ 55,869$ 0$ 0$ 0$ 0$ 56,527$ 30 to 34 57,879 58,229 62,091 69,411 64,357 0 0 0 62,17235 to 39 60,907 60,690 64,720 72,941 84,772 100,173 0 0 71,71440 to 44 62,775 62,480 67,380 75,785 88,162 98,547 89,253 0 81,90945 to 49 62,232 63,277 67,573 76,392 88,791 98,187 104,196 165,000 86,94250 to 54 65,040 63,406 66,494 75,362 87,545 97,555 102,315 102,952 88,66655 & up 66,281 65,426 68,525 76,763 86,967 93,902 99,284 106,335 90,925
Total 58,426$ 58,465$ 63,681$ 74,054$ 87,538$ 96,753$ 101,275$ 105,881$ 78,011$
Table A-6Average Appropriation Pay by Age and Service Distribution of Contributing Active Members
Attained
Years of Service

TEACHERS’ PENSION AND ANNUITY FUND OF NEW JERSEY JULY 1, 2019 ACTUARIAL VALUATION
APPENDIX A – MEMBERSHIP INFORMATION
52
Retiree BeneficiaryOrdinary Disability
Accidental Disability Total
Under 45 0 95 95 3 19345 to 49 13 54 139 3 20950 to 54 333 86 211 12 64255 to 59 2,730 154 325 23 3,23260 to 64 10,060 314 566 42 10,98265 to 69 22,942 740 738 60 24,48070 to 74 26,310 1,232 637 65 28,24475 to 79 15,902 1,335 404 33 17,67480 to 84 8,664 1,177 203 24 10,06885 & up 8,887 1,651 118 8 10,664
Total 95,841 6,838 3,436 273 106,388
Attained Age
Status
Table A-7Counts by Age and Status of Inactive Members
Retiree BeneficiaryOrdinary Disability
Accidental Disability Total
Under 45 0$ 13,514$ 27,235$ 46,543$ 20,781$ 45 to 49 40,300 21,838 30,515 45,954 29,10350 to 54 41,599 20,660 30,745 53,894 35,45755 to 59 49,506 24,816 31,345 46,792 46,48460 to 64 44,808 25,206 30,409 49,500 43,52465 to 69 45,034 28,685 29,496 46,176 44,07470 to 74 44,115 28,566 28,677 45,059 43,09175 to 79 41,900 28,619 26,177 47,460 40,54880 to 84 39,522 28,310 25,189 40,121 37,92485 & up 32,939 24,469 20,617 22,989 31,484
Total 42,733$ 26,955$ 28,775$ 45,758$ 41,276$
Attained Age
Status
Table A-8Average Retirement Allowances by Age and Status of Inactive Members
QDRO benefits included with member records for valuation purposes.

TEACHERS’ PENSION AND ANNUITY FUND OF NEW JERSEY JULY 1, 2019 ACTUARIAL VALUATION
APPENDIX B – ACTUARIAL ASSUMPTIONS AND METHODS
53
A. Actuarial Assumptions
1. Investment Rate of Return
7.30% per annum, compounded annually.
2. Administrative Expenses
No explicit assumption is made for administrative expenses for funding purposes per the funding methodology prescribed by NJ State Statute.
3. Interest Crediting Rate on Accumulated Deductions
7.30% per annum, compounded annually. Interest credits are assumed to end upon termination.
4. Cost-of-Living Adjustments (COLAs
No future COLAs are assumed. Previously granted COLAs are included in the data.
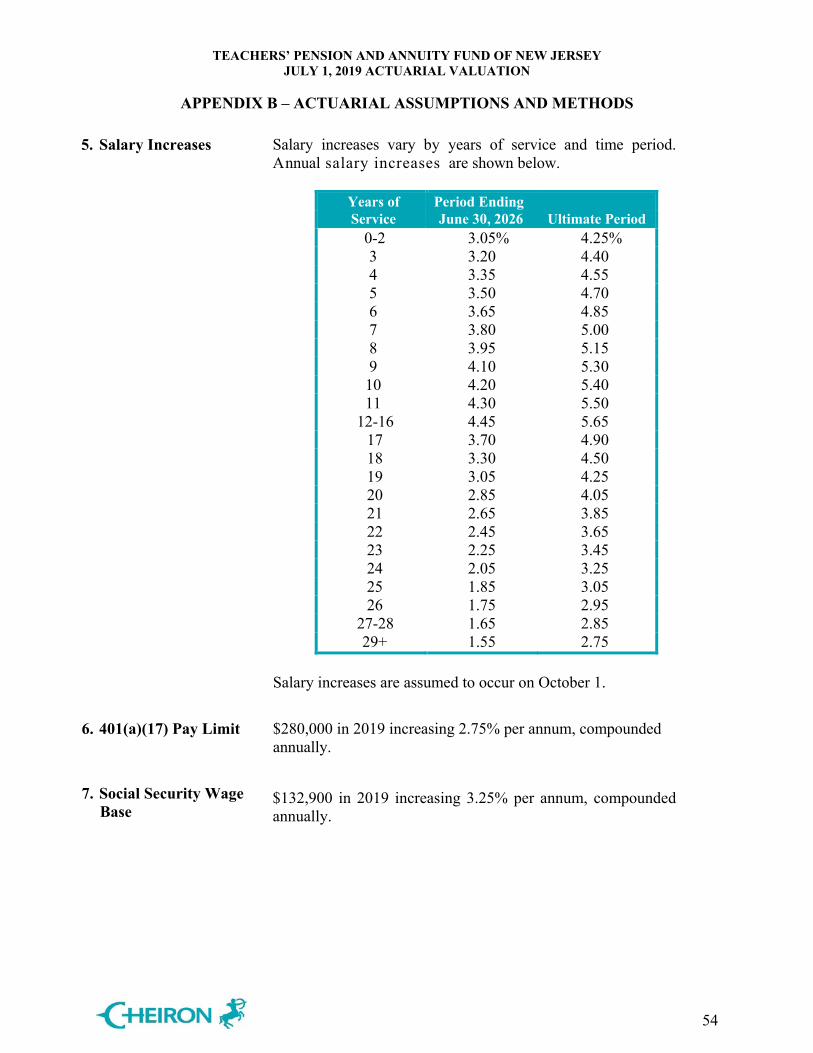
TEACHERS’ PENSION AND ANNUITY FUND OF NEW JERSEY JULY 1, 2019 ACTUARIAL VALUATION
APPENDIX B – ACTUARIAL ASSUMPTIONS AND METHODS
54
5. Salary Increases Salary increases vary by years of service and time period. Annual salary increases are shown below.
Years of Period Ending Service June 30, 2026 Ultimate Period
0-2 3.05% 4.25% 3 3.20 4.40 4 3.35 4.55 5 3.50 4.70 6 3.65 4.85 7 3.80 5.00 8 3.95 5.15 9 4.10 5.30 10 4.20 5.40 11 4.30 5.50
12-16 4.45 5.65 17 3.70 4.90 18 3.30 4.50 19 3.05 4.25 20 2.85 4.05 21 2.65 3.85 22 2.45 3.65 23 2.25 3.45 24 2.05 3.25 25 1.85 3.05 26 1.75 2.95
27-28 1.65 2.85 29+ 1.55 2.75
Salary increases are assumed to occur on October 1.
6. 401(a)(17) Pay Limit
$280,000 in 2019 increasing 2.75% per annum, compounded annually.
7. Social Security Wage Base
$132,900 in 2019 increasing 3.25% per annum, compounded annually.

TEACHERS’ PENSION AND ANNUITY FUND OF NEW JERSEY JULY 1, 2019 ACTUARIAL VALUATION
APPENDIX B – ACTUARIAL ASSUMPTIONS AND METHODS
55
8. Termination Termination rates are as follows:
Service Rates 0 1 2 3 4 5 6 7 8 9 10 11 12 13 14 15 16 17 18 19 20 21 22 23
24-29
7.00% 7.00 6.25 5.50 4.25 3.75 3.25 3.00 2.50 2.50 2.25 2.20 1.95 1.70 1.40 1.20 1.00 0.90 0.90 0.70 0.55 0.55 0.55 0.40 0.30
No termination is assumed after attainment of retirement eligibility. 67% of members with 10 or more years of service at termination are assumed to elect a deferred retirement benefit. All other members are assumed to receive a refund of Accumulated Deductions with credited interest.
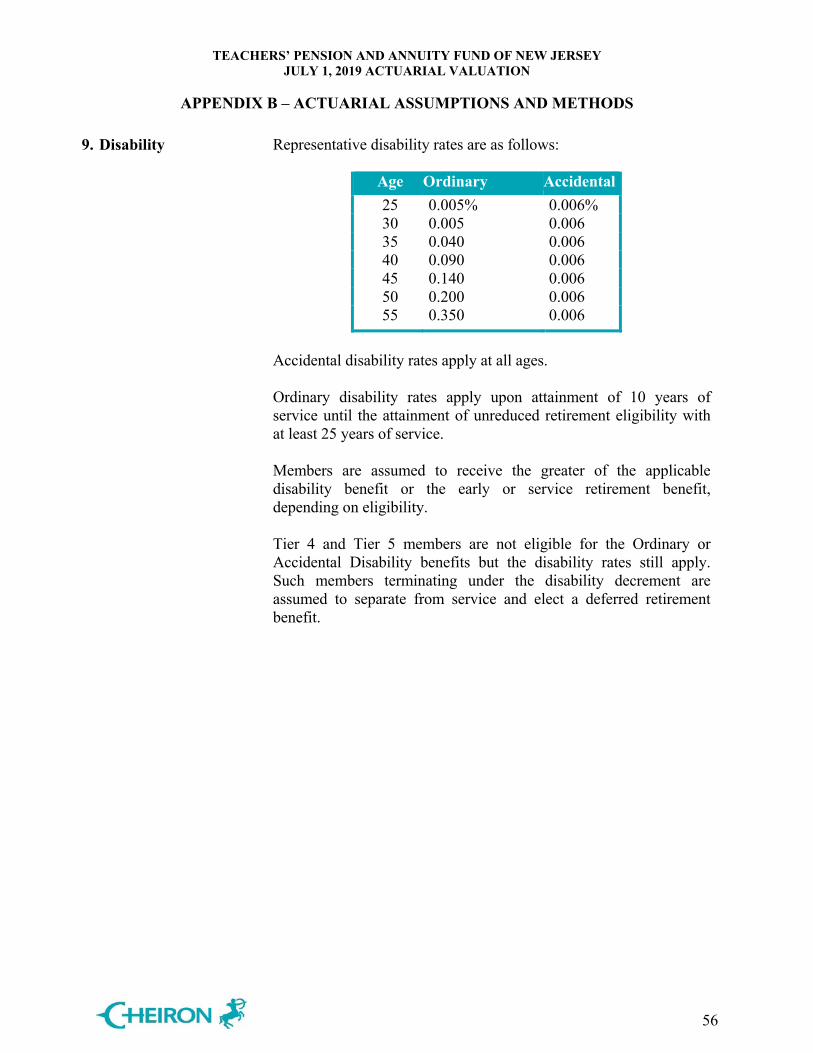
TEACHERS’ PENSION AND ANNUITY FUND OF NEW JERSEY JULY 1, 2019 ACTUARIAL VALUATION
APPENDIX B – ACTUARIAL ASSUMPTIONS AND METHODS
56
9. Disability Representative disability rates are as follows:
Age Ordinary Accidental 25 0.005% 0.006% 30 0.005 0.006 35 0.040 0.006 40 0.090 0.006 45 0.140 0.006 50 0.200 0.006 55 0.350 0.006
Accidental disability rates apply at all ages. Ordinary disability rates apply upon attainment of 10 years of service until the attainment of unreduced retirement eligibility with at least 25 years of service. Members are assumed to receive the greater of the applicable disability benefit or the early or service retirement benefit, depending on eligibility. Tier 4 and Tier 5 members are not eligible for the Ordinary or Accidental Disability benefits but the disability rates still apply. Such members terminating under the disability decrement are assumed to separate from service and elect a deferred retirement benefit.

TEACHERS’ PENSION AND ANNUITY FUND OF NEW JERSEY JULY 1, 2019 ACTUARIAL VALUATION
APPENDIX B – ACTUARIAL ASSUMPTIONS AND METHODS
57
10. Mortality Pre-Retirement Mortality: The Pub-2010 Teachers Above-Median Income Employee mortality table [PubT-2010(A) Employee] as published by the Society of Actuaries with a 93.9% adjustment for males and 85.3% adjustment for females, and with future improvement from the base year of 2010 on a generational basis using SOA’s Scale MP-2018. All pre-retirement deaths are assumed to be ordinary deaths. Healthy Retirees and Beneficiaries (Healthy Annuitants): The Pub-2010 Teachers Above-Median Income Healthy Retiree mortality table [PubT-2010(A) Healthy Retiree] as published by the Society of Actuaries with a 114.7% adjustment for males and 99.6% adjustment for females, and with future improvement from the base year of 2010 on a generational basis using SOA’s Scale MP-2018. Disabled Retirees (Disabled Annuitants): The Pub-2010 Non-Safety Disabled Retiree mortality table [PubNS-2010 Disabled Retiree] as published by the Society of Actuaries with a 106.3% adjustment for males and 100.3% adjustment for females, and with future improvement from the base year of 2010 on a generational basis using SOA’s Scale MP-2018.

TEACHERS’ PENSION AND ANNUITY FUND OF NEW JERSEY JULY 1, 2019 ACTUARIAL VALUATION
APPENDIX B – ACTUARIAL ASSUMPTIONS AND METHODS
58
11. Retirement Retirement rates for Tier 1-4 members are as follows:
AgeLess Than 25
Years of Service25 Years of
Service26 or More
Years of Service < 50 N/A 1.5% 1.5%
50 N/A 1.5 1.551 N/A 2.0 2.052 N/A 3.0 2.553 N/A 4.0 3.054 N/A 6.0 3.555 N/A 10.0 13.056 N/A 18.0 17.057 N/A 18.0 17.058 N/A 20.0 17.059 N/A 25.0 17.060 4.0 25.0 20.061 6.0 25.0 22.062 6.0 33.0 27.063 8.0 42.0 30.064 8.0 42.0 30.065 12.0 42.0 30.066 18.0 55.0 35.067 18.0 55.0 40.068 18.0 55.0 30.069 18.0 55.0 30.070 18.0 55.0 30.071 18.0 55.0 30.072 18.0 55.0 30.073 18.0 55.0 30.074 18.0 55.0 30.075 100.0 100.0 100.0
Rates apply upon retirement eligibility by tier.

TEACHERS’ PENSION AND ANNUITY FUND OF NEW JERSEY JULY 1, 2019 ACTUARIAL VALUATION
APPENDIX B – ACTUARIAL ASSUMPTIONS AND METHODS
59
Retirement rates for Tier 5 members are as follows:
AgeLess Than 25
Years of Service25 Years of
Service26 to 29 Years
of Service30 Years of
Service31 or More
Years of Service < 50 N/A N/A N/A 1.5% 1.5%
50 N/A N/A N/A 1.5 1.551 N/A N/A N/A 2.0 2.052 N/A N/A N/A 3.0 2.553 N/A N/A N/A 4.0 3.054 N/A N/A N/A 6.0 3.555 N/A N/A N/A 10.0 13.056 N/A N/A N/A 18.0 17.057 N/A N/A N/A 18.0 17.058 N/A N/A N/A 20.0 17.059 N/A N/A N/A 25.0 17.060 N/A N/A N/A 25.0 20.061 N/A N/A N/A 25.0 22.062 N/A N/A N/A 33.0 27.063 N/A N/A N/A 42.0 30.064 N/A N/A N/A 42.0 30.065 12.0 42.0 42.0 42.0 30.066 18.0 55.0 35.0 35.0 35.067 18.0 55.0 40.0 40.0 40.068 18.0 55.0 30.0 30.0 30.069 18.0 55.0 30.0 30.0 30.070 18.0 55.0 30.0 30.0 30.071 18.0 55.0 30.0 30.0 30.072 18.0 55.0 30.0 30.0 30.073 18.0 55.0 30.0 30.0 30.074 18.0 55.0 30.0 30.0 30.075 100.0 100.0 100.0 100.0 100.0

TEACHERS’ PENSION AND ANNUITY FUND OF NEW JERSEY JULY 1, 2019 ACTUARIAL VALUATION
APPENDIX B – ACTUARIAL ASSUMPTIONS AND METHODS
60
12. Family Composition Assumptions
For members not currently in receipt, 100% of members are assumed married to spouses of the opposite sex. Males are assumed to be three years older than females. For purposes of the optional form of payment death benefit for members currently in receipt, beneficiary status is based on the beneficiary allowance reported. If no beneficiary date of birth is provided, the beneficiary is assumed to be the member’s spouse of the opposite sex with males assumed to be three years older than females. No additional dependent children or parents are assumed.
13. Form of Payment
Current actives are assumed to elect the Maximum Option.
14. Data Information provided by the prior actuary was relied upon for the purposes of setting the status of and valuing non-contributing records. For non-contributing terminated members, a deferred retirement benefit is estimated, when applicable, based on the last known salary. For non-contributing members with incomplete information, the benefit is based on the Annuity Savings Fund. For current beneficiaries with incomplete information, reasonable assumptions were made based on information available in prior years. Inactive participants receiving benefits according to the 2018 data but omitted from the 2019 data are assumed to have died without a beneficiary. Tier 4 and 5 members on long-term disability appeared on the active data for the first time in 2019. The number of members on long-term disability is immaterial for valuation purposes. Therefore, we valued these members as regular contributing and non-contributing members while we gain clarity on what happens with these members.
15. Rationale for Assumptions
The demographic and economic assumptions used in this report, except for the investment return assumption, reflect the results of the July 1, 2015 – June 30, 2018 Experience Study, which was approved by the Board of Trustees on February 6, 2020. The investment return assumption was recommended by the State Treasurer.

TEACHERS’ PENSION AND ANNUITY FUND OF NEW JERSEY JULY 1, 2019 ACTUARIAL VALUATION
APPENDIX B – ACTUARIAL ASSUMPTIONS AND METHODS
61
16. Changes in Assumption Since Last Valuation
The assumed rates of termination, disability, retirement, mortality, salary increase and inflation were updated based on the July 1, 2015 – June 30, 2018 Experience Study, which was approved by the Board of Trustees on February 6, 2020. For a detailed description of each of the assumptions before and after the changes reflected in this valuation, please reference the Experience Study. The assumed rate of investment return was decreased from 7.50% to 7.30% per annum, compounded annually. In connection with a new policy adopted by the DPB, interest credits are assumed to end upon termination, instead of continuing through retirement.

TEACHERS’ PENSION AND ANNUITY FUND OF NEW JERSEY JULY 1, 2019 ACTUARIAL VALUATION
APPENDIX B – ACTUARIAL ASSUMPTIONS AND METHODS
62
B. Projection Assumptions
1. Investment Rate of Return
• July 1, 2020 valuation: 7.30% per annum, compounded annually. • July 1, 2021 and later valuations: 7.00% per annum, compounded
annually.
2. Appropriation Percentages
The State is assumed to appropriate 80% of the Statutory contribution in FYE 2021, and to increase the percent by 10% a year, until reaching 100% of the Statutory contribution beginning with FYE 2023.
3. Administrative Expenses
0.31% of expected pension benefit payments for the year.
4. New Entrants • Contributing active population assumed to remain at 2019 levels. • Assumed to join mid-year. • Age/sex distributions based on the last three years of new hires. • Salary based on salary for most recent hires reported on 2019 data. • New entrant salary assumed to increase with the 29+ years of
service salary increase rates.
5. Demographic Assumptions
Same as those used for valuation purposes.

TEACHERS’ PENSION AND ANNUITY FUND OF NEW JERSEY JULY 1, 2019 ACTUARIAL VALUATION
APPENDIX B – ACTUARIAL ASSUMPTIONS AND METHODS
63
C. Actuarial Methods
The actuarial methods used for determining State contributions are described below.
1. Actuarial Cost Method
The actuarial cost method for funding calculations is the Projected Unit Credit Cost Method. Non-contributory active members only use the Unit Credit Cost Method. The actuarial liability is calculated as the actuarial present value of the projected benefits linearly allocated to periods prior to the valuation year based on service. Refunds are valued as the Accumulated Deductions with interest as of the valuation date as provided by the Division of Pensions and Benefits. The unfunded actuarial liability is the actuarial liability on the valuation date less the actuarial value of assets. In accordance with Chapter 78, P.L. 2011:
• Beginning with the July 1, 2010 actuarial valuation, the accrued liability contribution shall be computed so that if the contribution is paid annually in level dollars, it will amortize the unfunded accrued liability over an open 30 year period.
• Beginning with the July 1, 2019 actuarial valuation, the accrued liability contribution shall be computed so that if the contribution is paid annually in level dollars, it will amortize the unfunded accrued liability over a closed 30 year period (i.e., for each subsequent actuarial valuation the amortization period shall decrease by one year).
• Beginning with the July 1, 2029 actuarial valuation, when the remaining amortization period reaches 20 years, any increase or decrease in the unfunded accrued liability as a result of actuarial losses or gains for subsequent valuation years shall serve to increase or decrease, respectively, the amortization period for the unfunded accrued liability, unless an increase in the amortization period will cause it to exceed 20 years. If an increase in the amortization period as a result of actuarial losses for a valuation year would exceed 20 years, the accrued liability contribution shall be computed for the valuation year using a 20 year amortization period.
To the extent that the amortization period remains an open period in future years and depending upon the specific circumstances, it should be noted that in the absence of emerging actuarial gains or contributions made in excess of the actuarially determined contribution, any existing unfunded accrued liability may not be fully amortized in the future.
The non-contributory group life insurance benefit is funded separately through a term cost.

TEACHERS’ PENSION AND ANNUITY FUND OF NEW JERSEY JULY 1, 2019 ACTUARIAL VALUATION
APPENDIX B – ACTUARIAL ASSUMPTIONS AND METHODS
64
2. Asset Valuation Method
For the purposes of determining contribution rates, an actuarial value of assets is used that dampens the volatility in the market value of assets, resulting in a smoother pattern of contributions.
The actuarial value of assets is adjusted to reflect actual contributions, benefit payments and administrative expenses, and an assumed rate of return on the previous year’s assets and current year’s cash flow at the prior year’s actuarial valuation interest rate, with a further adjustment to reflect 20% of the difference between the resulting value and the actual market value of Fund assets.
3. Contributions
Chapter 83, P.L. 2016 requires the State to make the required pension contributions on a quarterly basis in each fiscal year according to the following schedule: at least 25% by September 30, at least 50% by December 31, at least 75% by March 31, and at least 100% by June 30. As such, contributions are assumed to be made on a quarterly basis with the first contribution 15 months after the associated valuation date.
Chapter 98, P.L. 2017, the Lottery Enterprise Contribution Act, allows the TPAF to receive 77.78% of the proceeds of the Lottery Enterprise, based upon their members' past or present employment in schools and institutions in the State for a term of 30 years. Revenues from Chapter 98, P.L. 2017, the Lottery Enterprise Contribution Act, are assumed to be contributed to the trust on a monthly basis. The State’s pension contribution is reduced by the product of the allocable percentage for the TPAF, the adjustment percentage, and the special asset value.
Contributions payable in the fiscal year starting on the valuation date are included in the actuarial value of assets as receivable contributions, discounted by the applicable valuation interest rate.
Legislation has provided for additional benefits and/or funding requirements which are included in this valuation and are described as follows.
Early Retirement Incentive Programs
State and Local employers which elected to participate in various early retirement incentive programs authorized by NJ Statute make contributions to cover the cost of these programs over amortization periods elected by the employer to the extent permitted by NJ Statute.

TEACHERS’ PENSION AND ANNUITY FUND OF NEW JERSEY JULY 1, 2019 ACTUARIAL VALUATION
APPENDIX B – ACTUARIAL ASSUMPTIONS AND METHODS
65
Chapter 133, P.L. 2001 Chapter 133, P.L. 2001 increased the accrual rate from 1/60 to 1/55. In addition, it lowered the age required for a veteran benefit equal to 1/55 of highest 12-month Compensation for each Year of Service from 60 to 55.
Chapter 133, P.L. 2001 established the Benefit Enhancement Fund (BEF) to fund the additional annual employer normal contribution due to the Statute’s increased benefits. (Chapter 353, P.L. 2001 extended this coverage to this Statute’s additional annual employer normal contribution.) If the assets in the BEF are insufficient to cover the normal contribution for the increased benefits for a valuation period, the State will pay such amount. As of July 1, 2019, there are no assets in the BEF.
4. Changes since the last valuation
None.

TEACHERS’ PENSION AND ANNUITY FUND OF NEW JERSEY JULY 1, 2019 ACTUARIAL VALUATION
APPENDIX C – SUMMARY OF PLAN PROVISIONS
66
This summary of Plan provisions provides an overview of the major provisions of the TPAF used in the actuarial valuation. It is not intended to replace the more precise language of the NJ State Statutes, Title 18A, Chapter 66, and if there is any difference between the description of the plan herein and the actual language in the NJ State Statutes, the NJ State Statutes will govern. This valuation is prepared based on plan provisions in effect as of July 1, 2019 and does not reflect the impact of any changes in benefits that may have been approved after the valuation date. 1. Eligibility for Membership
Employees appointed to positions requiring certification by the New Jersey Department of Education as members of a regular teaching or professional staff of a public school system in New Jersey are required to enroll as a condition of employment. Employees of the Department of Education holding unclassified, professional and certificated titles are eligible for membership. Temporary or substitute employees are not eligible. The eligible employee must be scheduled to work at least 32 hours per week effective May 22, 2010, per Chapter 1, P.L. 2010. a) Class B (or Tier 1) Member: Any member hired prior to July 1, 2007.
b) Class D (or Tier 2) Member: Any member hired on or after July 1, 2007 and before November 2, 2008.
c) Class E (or Tier 3) Member: Any member hired after November 1, 2008 and before May 22, 2010.
d) Class F (or Tier 4) Member: Any member hired after May 21, 2010 and before June 28, 2011.
e) Class G (or Tier 5) Member: Any member hired on or after June 28, 2011.
2. Plan Year The 12-month period beginning on July 1 and ending on June 30.
3. Years of Service
A year of service for each year an employee is a Member of the Retirement System plus service, if any, covered by a prior service liability. Tier 4 members must be scheduled to work at least 32 hours per week, Tier 3 members must have an annual salary of $7,500 (indexed for inflation) and other members must have an annual salary of $500.
4. Compensation Base salary upon which contributions by a Member to the Annuity Savings Fund were based. Chapter 113, P.L. 1997 provides that Compensation cannot exceed the compensation limitation of Section 401(a)(17) of the Internal Revenue Code. Chapter 103, P.L. 2007 provides that for a Tier 2, 3, 4 or 5 Member, Compensation cannot exceed the annual maximum wage contribution base for Social Security, pursuant to the Federal Insurance Contribution Act.

TEACHERS’ PENSION AND ANNUITY FUND OF NEW JERSEY JULY 1, 2019 ACTUARIAL VALUATION
APPENDIX C – SUMMARY OF PLAN PROVISIONS
67
5. Final Compensation The average annual compensation upon which contributions by a Member are made for the three consecutive years of service immediately preceding retirement, or the highest three fiscal years of service, if greater. Chapter 1, P. L. 2010 provides that for a Tier 4 or Tier 5 Member, Final Compensation is the average annual compensation upon which contributions by a Member are made for the five consecutive years of service immediately preceding retirement, or the highest five fiscal years of service, if greater.
6. Final Year Compensation The compensation upon which contributions by a Member to the Annuity Savings Fund are based in the last year of service.
7. Accumulated Deductions The sum of all amounts deducted from the compensation of a Member or contributed by the Member or on the Member’s behalf without interest.
8. Interest Credits on Accumulated Deductions Members receive interest credits while contributing and for the first two years of inactivity. The rate depends on the type of benefit. Prior to July 1, 2018, members received interest credits for the entire period of inactivity until retirement or death.
9. Member Contributions Each Member contributes a percentage of Compensation. Effective October 1, 2011, Chapter 78, P.L. 2011 set the member contribution rate at 6.5% and increased it by 1/7 of 1% each July thereafter until it attained an ultimate rate of 7.5% on July 1, 2018.
10. Benefits
a) Service Retirement: For a Tier 1 or Tier 2 Member, age 60. For a Tier 3 or Tier 4 Member, age 62. For a Tier 5 Member, age 65.
Benefit is an annual retirement allowance comprised of a member annuity plus an employer pension which together will provide a total allowance of:
(1) For a Tier 1, 2 or 3 Member, 1/55 of Final Compensation for each Year of Service.
(2) For a Tier 4 or 5 Member, 1/60 of Final Compensation for each Year of Service. b) Early Retirement: Prior to eligibility for Service Retirement. For a Tier 1, 2, 3 or 4
Member, 25 Years of Service. For a Tier 5 Member, 30 Years of Service.

TEACHERS’ PENSION AND ANNUITY FUND OF NEW JERSEY JULY 1, 2019 ACTUARIAL VALUATION
APPENDIX C – SUMMARY OF PLAN PROVISIONS
68
Benefit is an annual retirement allowance comprised of a member annuity plus an employer pension which together will provide a total allowance of:
(1) For a Tier 1 Member, the Service Retirement benefit reduced by 1/4 of one percent
for each month the retirement date precedes age 55. (2) For a Tier 2 Member, the Service Retirement benefit reduced by 1/12 of one
percent for each month the retirement date precedes age 60 through age 55 and by 1/4 of one percent for each month the retirement date precedes age 55.
(3) For a Tier 3 or 4 Member, the Service Retirement benefit reduced by 1/12 of one percent for each month the retirement date precedes age 62 through age 55 and by 1/4 of one percent for each month the retirement date precedes age 55.
(4) For a Tier 5 Member, the Service Retirement benefit reduced by 1/4 of one percent for each month the retirement date precedes age 65.
c) Veteran Retirement: Age 55 with 25 Years of Service or Age 60 with 20 Years of
Service for a qualified military veteran who retires directly from active service. Benefit is an annual retirement allowance comprised of a member annuity plus an employer pension which together will provide a total allowance of the greater of:
(1) 54.5% of highest 12-month Compensation, or
(2) For a member who is at least age 55 with 35 Years of Service, 1/55 of highest 12-month Compensation for each Year of Service.
Veterans may receive a Service Retirement benefit if greater.
d) Deferred Retirement: Termination of service prior to eligibility for Service Retirement
with 10 Years of Service.
Benefit is either:
(1) A refund of Accumulated Deductions plus, if the member has completed three years of service, interest accumulated at 2.0% per annum; or
(2) A deferred life annuity, commencing at age 60 for a Tier 1 or Tier 2 Member, age 62 for a Tier 3 or Tier 4 Member or age 65 for a Tier 5 Member, comprised of a member annuity plus an employer pension which together will provide a total allowance of the Service Retirement benefit based on Final Compensation and Years of Service at date of termination.
For Members who die during the deferral period, the benefit is a return of Accumulated Deductions with credited interest.
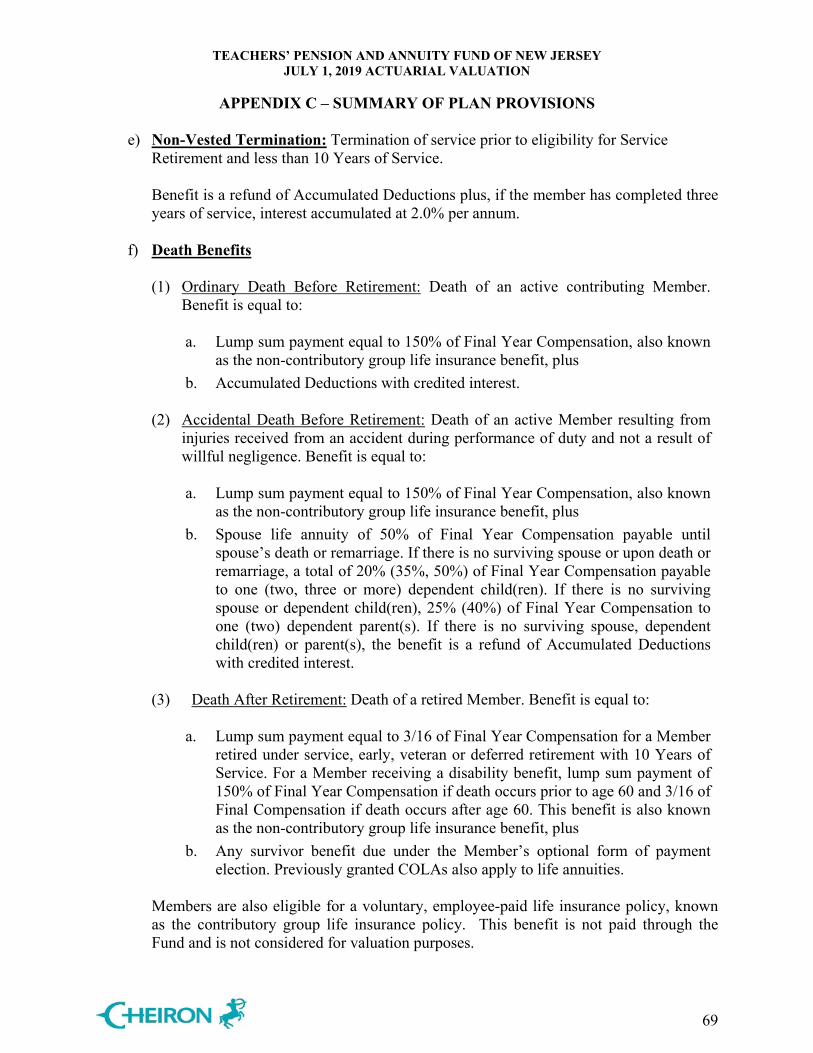
TEACHERS’ PENSION AND ANNUITY FUND OF NEW JERSEY JULY 1, 2019 ACTUARIAL VALUATION
APPENDIX C – SUMMARY OF PLAN PROVISIONS
69
e) Non-Vested Termination: Termination of service prior to eligibility for Service Retirement and less than 10 Years of Service.
Benefit is a refund of Accumulated Deductions plus, if the member has completed three years of service, interest accumulated at 2.0% per annum.
f) Death Benefits
(1) Ordinary Death Before Retirement: Death of an active contributing Member.
Benefit is equal to: a. Lump sum payment equal to 150% of Final Year Compensation, also known
as the non-contributory group life insurance benefit, plus
b. Accumulated Deductions with credited interest.
(2) Accidental Death Before Retirement: Death of an active Member resulting from injuries received from an accident during performance of duty and not a result of willful negligence. Benefit is equal to:
a. Lump sum payment equal to 150% of Final Year Compensation, also known
as the non-contributory group life insurance benefit, plus
b. Spouse life annuity of 50% of Final Year Compensation payable until spouse’s death or remarriage. If there is no surviving spouse or upon death or remarriage, a total of 20% (35%, 50%) of Final Year Compensation payable to one (two, three or more) dependent child(ren). If there is no surviving spouse or dependent child(ren), 25% (40%) of Final Year Compensation to one (two) dependent parent(s). If there is no surviving spouse, dependent child(ren) or parent(s), the benefit is a refund of Accumulated Deductions with credited interest.
(3) Death After Retirement: Death of a retired Member. Benefit is equal to:
a. Lump sum payment equal to 3/16 of Final Year Compensation for a Member
retired under service, early, veteran or deferred retirement with 10 Years of Service. For a Member receiving a disability benefit, lump sum payment of 150% of Final Year Compensation if death occurs prior to age 60 and 3/16 of Final Compensation if death occurs after age 60. This benefit is also known as the non-contributory group life insurance benefit, plus
b. Any survivor benefit due under the Member’s optional form of payment election. Previously granted COLAs also apply to life annuities.
Members are also eligible for a voluntary, employee-paid life insurance policy, known as the contributory group life insurance policy. This benefit is not paid through the Fund and is not considered for valuation purposes.

TEACHERS’ PENSION AND ANNUITY FUND OF NEW JERSEY JULY 1, 2019 ACTUARIAL VALUATION
APPENDIX C – SUMMARY OF PLAN PROVISIONS
70
g) Disability Retirement (1) Ordinary Disability Retirement: 10 years of service and totally and permanently
incapacitated from the performance of normal or assigned duties. Only available to Tier 1, 2 and 3 Members.
Benefit is an annual retirement allowance comprised of a member annuity plus an employer pension which together will provide a total allowance of:
a. 1.64% of Final Compensation for each Year of Service; or
b. 43.6% of Final Compensation.
(2) Accidental Disability Retirement: Total and permanent incapacitation as a direct result of a traumatic event occurring during and as a result of the performance of regular or assigned duties. Only available to Tier 1, 2 and 3 Members.
Benefit is an annual retirement allowance comprised of a member annuity plus an employer pension which together will provide a total allowance of 72.7% of the Compensation at the date of injury.
The pension portion of the benefit will be offset for any periodic Workers’ Compensation benefits.
Tier 4 and Tier 5 Members are eligible for long-term disability coverage. This benefit is not paid through the Fund and is not considered for valuation purposes. Both Member and employer contributions to the Fund continue while on long-term disability, with the policy covering the Member portion. The long-term disability benefit equals 60% of Final Year Compensation and may be offset for other periodic benefits, such as Workers’ Compensation, short-term disability or Social Security. The long-term disability benefit may continue through the earlier of age 70 or commencement of a retirement benefit under the Fund.
11. Optional Forms of Payment
The member may elect the following forms of payment.
a) Maximum Option: Single life annuity with a return of the balance of the Accumulated Deductions with credited interest.
b) Option 1: Single life annuity with a return of the balance of the initial reserve. c) Option 2: 100% joint and survivor annuity. d) Option 3: 50% joint and survivor annuity. e) Option 4: Other percentage joint and survivor annuity. f) Option A: 100% pop-up joint and survivor annuity. g) Option B: 75% pop-up joint and survivor annuity. h) Option C: 50% pop-up joint and survivor annuity. i) Option D: 25% pop-up joint and survivor annuity.

TEACHERS’ PENSION AND ANNUITY FUND OF NEW JERSEY JULY 1, 2019 ACTUARIAL VALUATION
APPENDIX C – SUMMARY OF PLAN PROVISIONS
71
12. Cost-of-Living Adjustments Also known as Pension Adjustments. Provided annually to retirees and survivors after 24 months of retirement prior to July 1, 2011. Chapter 78, P.L. 2011 eliminated future adjustments effective July 1, 2011. Adjustments may be reinstated in the future subject to certain conditions outlined in Chapter 78, P.L. 2011.
13. Changes in Plan Provisions Since Last Valuation Effective July 1, 2018, the DPB adopted a new policy regarding the crediting of interest on member contributions for the purpose of refund of accumulated deductions. Previously, after termination of employment but prior to retirement or death, interest was credited on member accumulated deductions for the entire period. Effective July 1, 2018, interest is only credited at for the first two years of inactivity prior to retirement or death. Thereafter, no additional interest is credited.

TEACHERS’ PENSION AND ANNUITY FUND OF NEW JERSEY JULY 1, 2019 ACTUARIAL VALUATION
APPENDIX D – HISTORICAL DATA AND REQUIRED CAFR EXHIBITS
72
Historical Summary of Assets and LiabilitiesFunded Ratio
Valuation Actuarial + Date Market Value of Actuarial + Special Actuarial Market Special Asset
July 1, Assets Asset Value 1 Liability Value Value 1
2019 24,877,874,495$ 36,188,020,515$ 65,470,847,885$ 38.00% 55.27%2018 24,838,481,325 36,127,247,378 60,971,919,315 40.74% 59.25%2017 24,495,303,183 36,367,511,298 59,954,548,700 40.86% 60.66%2016 23,732,571,086 36,949,157,326 57,865,971,163 41.01% 63.85%2015 26,320,738,690 28,301,404,184 55,359,377,071 47.55% 51.12%2014 27,643,078,116 29,044,777,902 53,749,976,641 51.43% 54.04%2013 26,859,612,370 30,469,857,304 52,366,655,055 51.29% 58.19%2012 26,037,983,392 31,079,212,983 51,194,110,587 50.86% 60.71%2011 27,654,006,602 32,156,229,300 50,222,688,750 55.06% 64.03%2010 25,763,644,836 33,136,475,630 48,417,932,345 53.21% 68.44%
1 Includes Special Asset Value beginning with July 1, 2016 valuation
Table D-1
Fiscal Year Gross Actual Actual Contribution PercentageEnding Statutory State Lottery Deficiency of ContributionJune 30, Contribution Appropriation Revenue (Excess) Covered
20202 3,244,013,909$ 1,438,212,869$ 833,471,481$ 972,329,559$ 70.03%2019 3,208,116,552 1,114,920,000 859,469,000 1,233,727,552 61.54%2018 2,999,577,684 721,230,000 759,134,509 1,519,213,175 49.35%2017 2,737,175,151 1,087,919,000 0 1,649,256,151 39.75%2016 2,544,811,534 764,489,000 0 1,780,322,534 30.04%2015 2,306,611,715 504,320,000 0 1,802,291,715 21.86%2014 2,158,287,358 392,035,985 0 1,766,251,373 18.16%2013 2,148,185,001 613,766,799 0 1,534,418,202 28.57%2012 2,009,810,329 287,115,915 0 1,722,694,414 14.29%2011 1,826,722,370 0 0 1,826,722,370 0.00%
1Excludes contributions for NCGI2Reflects the State's planned contribution of 70% of the Statutory contribution and expected lottery revenue
Table D-2Historical Summary of State Appropriation for Pension1
The information above is based on the final actuarial valuation reports for the given years. The amounts do not reflect differences between the discounted State appropriations receivable and the actual State contribution amounts that became known after the issuance of the reports.

TEACHERS’ PENSION AND ANNUITY FUND OF NEW JERSEY JULY 1, 2019 ACTUARIAL VALUATION
APPENDIX D – HISTORICAL DATA AND REQUIRED CAFR EXHIBITS
73
In accordance with the Government Finance Officers Association (GFOA) and their recommended checklist for Comprehensive Annual Financial Reports (CAFRs), we have prepared the following schedules for the Fund. The GFOA checklist uses the term Actuarial Accrued Liability, which is the same as the Actuarial Liability used elsewhere in this report.
Table D-3
Valuation Average % Increase inDate Annual Annual Annual Annual Average Annual
July 1, Number Allowance Number1 Allowance Number1 Allowance Allowance1 Allowance1
2019 4,500 190,652,924$ 2,815 95,949,554$ 106,388 4,391,260,795$ 41,276$ 0.61%2018 4,634 192,293,599 2,511 82,862,457 104,703 4,295,446,681 41,025 1.50%2017 4,792 N/A 2,510 N/A 103,528 4,184,662,175 40,421 0.61%2016 5,460 N/A 2,444 N/A 101,246 4,067,574,984 40,175 0.75%2015 5,789 N/A 2,381 N/A 98,230 3,916,956,144 39,875 0.81%2014 5,284 N/A 2,191 N/A 94,822 3,750,680,254 39,555 1.04%2013 4,614 N/A 2,193 N/A 91,729 3,591,007,462 39,148 0.96%2012 5,496 N/A 2,100 N/A 89,308 3,462,975,740 38,776 1.40%2011 7,744 N/A 2,069 N/A 85,912 3,285,419,699 38,242 3.75%2010 4,147 N/A 2,124 N/A 80,237 2,957,518,144 36,860 1.42%
1 Beginning with the 2018 valuation, QDRO records excluded from headcounts and QDRO benefits included with member records. This change resulted in 948 fewer records on the rolls as of July 1, 2018.
Schedule Retirees and Beneficiaries Added to and Removed From Rolls
Added to Rolls Removed from Rolls Rolls at End of Year
Table D-4Schedule of Active Member Valuation Data
Valuation Number of % Increase in Number ofDate Contributing Annual Annual Average Average Annual Patricipating
July 1, Active Members1 Compensation1 Compensation1 Compensation1 Employers2
2019 141,795 11,061,603,138$ 78,011$ 1.72% 6772018 141,128 10,823,504,797 76,693 1.84% 6782017 143,092 10,775,872,458 75,307 1.59% N/A2016 142,845 10,588,493,706 74,126 1.02% N/A2015 142,454 10,453,176,648 73,379 0.82% N/A2014 141,874 10,325,972,743 72,783 2.83% N/A2013 151,318 10,710,424,746 70,781 1.36% N/A2012 150,200 10,488,890,840 69,833 1.31% N/A2011 151,115 10,416,454,800 68,931 1.54% N/A2010 157,023 10,659,241,596 67,883 3.01% N/A
1 Prior to July 1, 2018, includes non-contributing active members reported on active data with compensation.Prior to July 1, 2014, includes all non-contributing active members.
2 Number of locations reporting contributing active members. For GASB reporting purposes, the State may be consideredthe participating employer for multiple locations.

TEACHERS’ PENSION AND ANNUITY FUND OF NEW JERSEY JULY 1, 2019 ACTUARIAL VALUATION
APPENDIX D – HISTORICAL DATA AND REQUIRED CAFR EXHIBITS
74
Table D-5Schedule of Funding Progress
(Surplus)/Unfunded(Surplus)/Unfunded Actuarial Accrued
Valuation Actuarial Value Actuarial Actuarial Funded Covered Liability as %Date of Assets1 Accrued Liability Accrued Liability Ratio Payroll of Covered Payroll
July 1, (a) (b) (c) = (b) - (a) (a) / (b) (d) (c) / (d)
2019 26,375,429,936$ 65,470,847,885$ 39,095,417,949$ 40.29% 11,061,603,138$ 353.43%2018 26,308,754,955 60,971,919,315 34,663,164,360 43.15% 10,823,504,797 320.26%2017 26,549,410,215 59,954,548,700 33,405,138,485 44.28% 10,775,872,458 310.00%2016 27,169,758,348 57,865,971,163 30,696,212,815 46.95% 10,588,493,706 289.90%2015 28,301,404,184 55,359,377,071 27,057,972,887 51.12% 10,453,176,648 258.85%2014 29,044,777,902 53,749,976,641 24,705,198,739 54.04% 10,325,972,743 239.25%2013 30,469,857,304 52,366,655,055 21,896,797,751 58.19% 10,710,424,746 204.44%2012 31,079,212,983 51,194,110,587 20,114,897,604 60.71% 10,488,890,840 191.77%2011 32,156,229,300 50,222,688,750 18,066,459,450 64.03% 10,416,454,800 173.44%2010 33,136,475,630 48,417,932,345 15,281,456,715 68.44% 10,659,241,596 143.36%
1 Includes receivable amounts. Excludes Special Asset Value.
Table D-6
Schedule of Funded Liabilities by Type (Solvency Test)
Actuarial Accrued Liability forContributing &
Contributing & Retirees, Non-ContributingNon-Contributing Beneficiaries & Active Member Portion of Actuarial Accrued
Valuation Active Member Deferred Benefits Financed Liabilities Covered byDate Contributions Vesteds by Employer Actuarial Value Actuarial Value of Assets
July 1, (1) (2) (3) of Assets1 (1) (2) (3)
2019 14,079,166,893$ 42,467,777,887$ 8,923,903,105$ 26,375,429,936$ 100.00% 28.95% 0.00%2018 13,283,767,530 40,171,903,581 7,516,248,204 26,308,754,955 100.00% 32.42% 0.00%2017 12,466,587,057 39,224,970,512 8,262,991,131 26,549,410,215 100.00% 35.90% 0.00%2016 11,709,150,079 38,027,977,392 8,128,843,692 27,169,758,348 100.00% 40.66% 0.00%2015 11,129,745,608 36,128,130,029 8,101,501,434 28,301,404,184 100.00% 47.53% 0.00%2014 10,624,778,098 34,587,834,921 8,537,363,622 29,044,777,902 100.00% 53.26% 0.00%2013 10,079,938,128 33,312,970,535 8,973,746,392 30,469,857,304 100.00% 61.21% 0.00%2012 9,432,073,781 32,411,855,950 9,350,180,856 31,079,212,983 100.00% 66.79% 0.00%2011 8,987,300,905 30,765,265,431 10,470,122,414 32,156,229,300 100.00% 75.31% 0.00%2010 9,077,370,573 27,435,656,099 11,904,905,673 33,136,475,630 100.00% 87.69% 0.00%
1 Includes receivable amounts. Excludes Special Asset Value.

TEACHERS’ PENSION AND ANNUITY FUND OF NEW JERSEY JULY 1, 2019 ACTUARIAL VALUATION
APPENDIX D – HISTORICAL DATA AND REQUIRED CAFR EXHIBITS
75
Table D-7Analysis of Financial Experience
Change in Unfunded Actuarial Accrued Liability
Actuarial Value ActuarialValuation Of Assets Accrued Assumption & Change in
Date Investment Liability Method Plan/Policy Unfunded ActuarialJuly 1, (Gain)/Loss (Gain)/Loss Changes Changes Contributions1 Accrued Liability
2019 374,388,860$ 67,077,019$ 3,353,517,001$ (15,561,490)$ 652,832,199$ 4,432,253,589$ 2018 367,568,407 140,440,865 (286,796,037) 0 1,036,812,640 1,258,025,875 2017 513,526,758 126,550,240 822,620,195 0 1,246,228,477 2,708,925,670 2016 859,296,816 173,672,067 1,144,195,634 0 1,461,075,411 3,638,239,928 2015 495,166,374 398,659,572 0 0 1,458,948,202 2,352,774,148 2014 350,424,947 114,878,752 0 0 2,343,097,289 2,808,400,988 2013 902,561,234 22,121,971 (404,297,149) 0 1,050,981,941 1,571,367,997 2012 1,260,307,398 72,510,427 (337,666,242) 0 1,263,818,721 2,258,970,304 2011 1,125,555,674 (212,466,070) 281,118,410 0 1,590,794,721 2,785,002,735 2010 1,843,207,699 (611,211,761) 1,170,659,104 (8,173,436,399) 2,341,910,837 (3,428,870,520)
1 Change due to contributions (greater)/less than normal cost plus interest on the Unfunded Actuarial Accrued Liability.

TEACHERS’ PENSION AND ANNUITY FUND OF NEW JERSEY JULY 1, 2019 ACTUARIAL VALUATION
APPENDIX E – EARLY RETIREMENT INCENTIVE CONTRIBUTION SCHEDULE
76
Table E-1ERI Contribution Schedule - Local Employers
Location Location Fiscal Year Present Value Fiscal Year Present Value Group Number Name 2021 Payment as of 7/1/2019 2021 Payment as of 7/1/2019
3 981 NJ Institute of Techonology 24,838$ 21,957$ 37,107$ 333,143$ 6 911 Allamuchy Board of Education N/A N/A 9,901 77,172 6 300 Asbury Park Board of Education 403,402 356,606 N/A N/A6 969 Atlantic County Vocational Schools 24,268 21,453 N/A N/A6 4015 Berlin Township Board of Education 23,103 20,423 N/A N/A6 412 Boonton Township Board of Education 15,732 13,907 N/A N/A6 774 Byram Township Board of Education 27,672 24,462 N/A N/A6 4017 Chesilhurst Borough Board of Education 3,512 3,105 N/A N/A6 4018 Clementon Board of Education 13,068 11,552 N/A N/A6 753 Green Brook Board of Education 36,750 32,487 N/A N/A6 8082 Guttenberg Board of Education 19,766 17,473 N/A N/A6 956 Hudson County Vocational Schools N/A N/A 66,509 518,398 6 521 Lakehurst Borough Board of Education 10,326 9,128 N/A N/A6 645 Lake and Regional 92,840 82,070 N/A N/A6 111 Mercer County Special Services 45,903 40,578 N/A N/A6 346 Monmouth Beach Board of Education 12,587 11,127 N/A N/A6 987 Monmouth County Vocational Schools 74,272 65,656 N/A N/A6 4069 Pine Hill Borough Board of Education 33,414 29,538 N/A N/A6 5071 Shiloh Township 1,373 1,214 N/A N/A6 8070 West New York Township Board of Education N/A N/A 233,545 1,820,342 6 934 White Township Board of Education 25,959 22,948 N/A N/A
Total 888,785$ 785,684$ 347,062$ 2,749,055$
ERI 1 Information ERI 2 Information
Consistent with established methodology, payment amounts calculated using a payment date 21 months after the valuation date. Present values as of July 1, 2019 exclude expected payments for fiscal year ending 2020.

TEACHERS’ PENSION AND ANNUITY FUND OF NEW JERSEY JULY 1, 2019 ACTUARIAL VALUATION
APPENDIX E – EARLY RETIREMENT INCENTIVE CONTRIBUTION SCHEDULE
77
Table E-2ERI Contribution Schedule - State Locations and Local Employers1
Location Location Fiscal Year Present Value Fiscal Year Present ValueGroup Number Name 2021 Payment as of 7/1/2019 2021 Payment as of 7/1/2019
2 90400 Education Department 1,855,374$ 20,825,935$ N/A N/A2 90416 Marie Katzenback School for Deaf 330,175 3,706,105 N/A N/A2 90207 Office of Adm. Law 78,121 876,878 N/A N/A3 981 NJ Institute of Techonology 77,466 869,531 N/A N/A4 90411 New Jersey University 385,216 4,323,914 N/A N/A4 90412 Kean University 201,489 2,261,646 N/A N/A4 90414 Montclair State University 159,399 1,789,202 N/A N/A4 90410 Rowan University 65,341 733,433 N/A N/A4 90415 The College of New Jersey 40,969 459,868 N/A N/A4 90413 William Paterson University 74,397 835,085 N/A N/A4 8083 Harrison Township Board of Education N/A N/A 196,299 173,528 6 956 Hudson County Vocational Schools N/A N/A 154,733 136,783 6 620 Passaic Board of Education N/A N/A 2,422,724 2,141,679
Total 3,267,947$ 36,681,597$ 2,773,756$ 2,451,990$
1 ERI 3 is applicable to State locations, and ERI 4 is applicable to Local employers.
ERI 3 Information ERI 4 Information
Consistent with established methodology, payment amounts calculated using payment dates 24 and 21 months after the valuation date for State and Local employers, respectively. Present values as of July 1, 2019 exclude expected payments for fiscal year ending 2020.
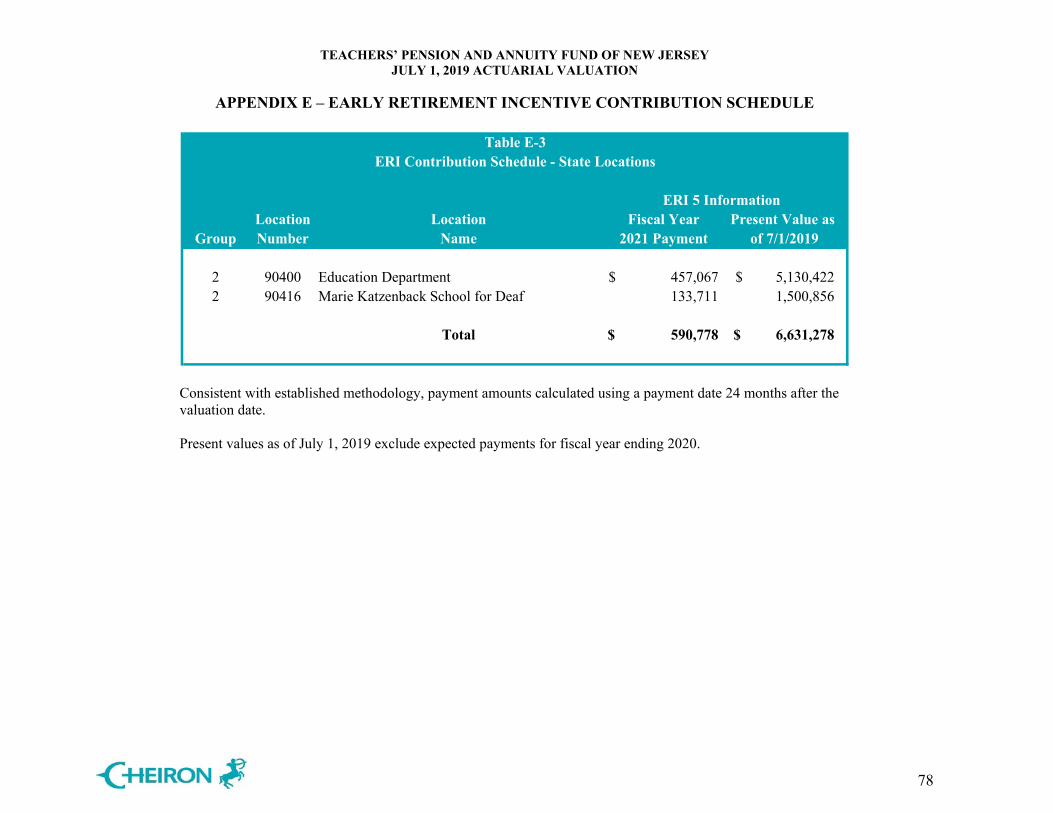
TEACHERS’ PENSION AND ANNUITY FUND OF NEW JERSEY JULY 1, 2019 ACTUARIAL VALUATION
APPENDIX E – EARLY RETIREMENT INCENTIVE CONTRIBUTION SCHEDULE
78
Table E-3ERI Contribution Schedule - State Locations
Location Location Fiscal Year Present Value as Group Number Name 2021 Payment of 7/1/2019
2 90400 Education Department 457,067$ 5,130,422$ 2 90416 Marie Katzenback School for Deaf 133,711 1,500,856
Total 590,778$ 6,631,278$
ERI 5 Information
Consistent with established methodology, payment amounts calculated using a payment date 24 months after the valuation date. Present values as of July 1, 2019 exclude expected payments for fiscal year ending 2020.
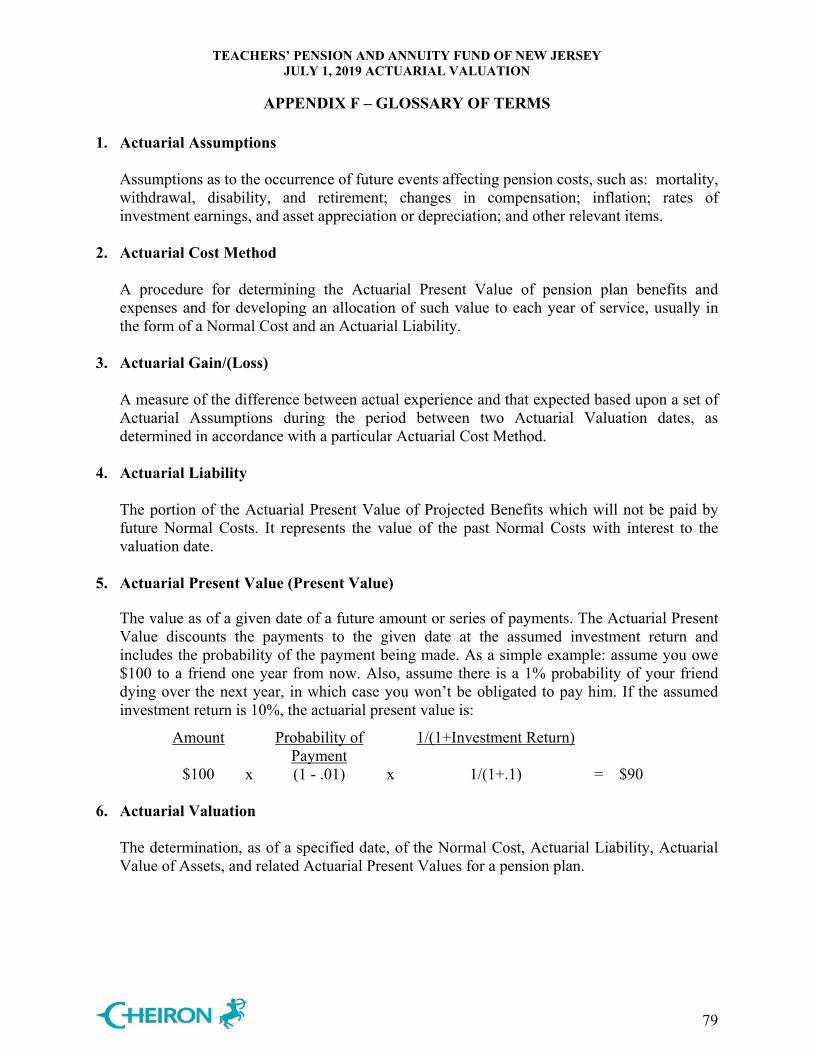
TEACHERS’ PENSION AND ANNUITY FUND OF NEW JERSEY JULY 1, 2019 ACTUARIAL VALUATION
APPENDIX F – GLOSSARY OF TERMS
79
1. Actuarial Assumptions Assumptions as to the occurrence of future events affecting pension costs, such as: mortality,
withdrawal, disability, and retirement; changes in compensation; inflation; rates of investment earnings, and asset appreciation or depreciation; and other relevant items.
2. Actuarial Cost Method A procedure for determining the Actuarial Present Value of pension plan benefits and
expenses and for developing an allocation of such value to each year of service, usually in the form of a Normal Cost and an Actuarial Liability.
3. Actuarial Gain/(Loss) A measure of the difference between actual experience and that expected based upon a set of
Actuarial Assumptions during the period between two Actuarial Valuation dates, as determined in accordance with a particular Actuarial Cost Method.
4. Actuarial Liability The portion of the Actuarial Present Value of Projected Benefits which will not be paid by
future Normal Costs. It represents the value of the past Normal Costs with interest to the valuation date.
5. Actuarial Present Value (Present Value) The value as of a given date of a future amount or series of payments. The Actuarial Present
Value discounts the payments to the given date at the assumed investment return and includes the probability of the payment being made. As a simple example: assume you owe $100 to a friend one year from now. Also, assume there is a 1% probability of your friend dying over the next year, in which case you won’t be obligated to pay him. If the assumed investment return is 10%, the actuarial present value is:
Amount Probability of Payment
1/(1+Investment Return)
$100 x (1 - .01) x 1/(1+.1) = $90 6. Actuarial Valuation The determination, as of a specified date, of the Normal Cost, Actuarial Liability, Actuarial
Value of Assets, and related Actuarial Present Values for a pension plan.
TEACHERS’ PENSION AND ANNUITY FUND OF NEW JERSEY JULY 1, 2019 ACTUARIAL VALUATION
APPENDIX F – GLOSSARY OF TERMS
80
7. Actuarial Value of Assets The value of cash, investments and other property belonging to a pension plan as used by the
actuary for the purpose of an Actuarial Valuation. The purpose of an Actuarial Value of Assets is to smooth out fluctuations in market values. This way long-term costs are not distorted by short-term fluctuations in the market.
8. Actuarially Equivalent Of equal Actuarial Present Value, determined as of a given date with each value based on the
same set of Actuarial Assumptions. 9. Amortization Payment
The portion of the pension plan contribution which is designed to pay interest and principal
on the Unfunded Actuarial Liability in order to pay for that liability in a given number of years.
10. Funded Ratio The ratio of the Actuarial Value of Assets to the Actuarial Liabilities. 11. Investment Return Assumption The assumed interest rate used for projecting dollar related values in the future. 12. Mortality Table A set of percentages which estimate the probability of death at a particular point in time.
Typically, the rates are annual and based on age and sex. 13. Normal Cost That portion of the Actuarial Present Value of pension plan benefits and expenses, which is
allocated to a valuation year by the Actuarial Cost Method. 14. Projected Benefits Those pension plan benefit amounts which are expected to be paid in the future under a
particular set of Actuarial Assumptions, taking into account such items as the effect of advancement in age and increases in future compensation and service credits.

TEACHERS’ PENSION AND ANNUITY FUND OF NEW JERSEY JULY 1, 2019 ACTUARIAL VALUATION
APPENDIX F – GLOSSARY OF TERMS
81
15. Projected Unit Credit Cost Method A method under which the Actuarial Liability is calculated as the Actuarial Present Value of the Projected Benefits allocated to periods prior to the valuation year.
16. Unfunded Actuarial Liability The excess of the Actuarial Liability over the Actuarial Value of Assets.