Embed Size (px)
Citation preview

Provincial Results
Grade 9 Assessment of Mathematics, 2016–2017
Teacher Questionnaire: Academic Course
Results as of August 14, 2017 1 of 31
Provincial Results
About Your SchoolProvince*
Number of Respondents 2 390# %†
1. How often did you meet with other staff members at your school for the following reasons this past semester or year? Consider both formal and informal meetings.a. To discuss general school issues
Never or hardly ever 40 2%A few times 319 13%Once a month 1 006 42%Once every 2 weeks 270 11%At least once a week 742 31%No response/ambiguous response 13 1%
b. To reflect on school-level data (e.g., EQAO, diagnostic tests) for planning purposes
Never or hardly ever 248 10%A few times 1 312 55%Once a month 451 19%Once every 2 weeks 200 8%At least once a week 157 7%No response/ambiguous response 22 1%
c. To participate in school-based professional learning activities (e.g., PLCs, school growth teams)
Never or hardly ever 125 5%A few times 1 012 42%Once a month 975 41%Once every 2 weeks 170 7%At least once a week 83 3%No response/ambiguous response 25 1%
* Numbers and percentages are based on the total number of teachers who completed the questionnaire.† Percentages may not add up to 100, due to rounding.

Provincial Results
Grade 9 Assessment of Mathematics, 2016–2017
Teacher Questionnaire: Academic Course
Results as of August 14, 2017 2 of 31
About Your SchoolProvince*
Number of Respondents 2 390# %†
d. To reflect on the delivery of the mathematics curriculum (e.g., to plan lessons, discuss instructional strategies and materials)
Never or hardly ever 126 5%A few times 621 26%Once a month 469 20%Once every 2 weeks 335 14%At least once a week 820 34%No response/ambiguous response 19 1%
e. To coordinate mathematics instruction among teachersNever or hardly ever 155 6%A few times 558 23%Once a month 298 12%Once every 2 weeks 337 14%At least once a week 1 016 43%No response/ambiguous response 26 1%
* Numbers and percentages are based on the total number of teachers who completed the questionnaire.† Percentages may not add up to 100, due to rounding.
Provincial Results
Grade 9 Assessment of Mathematics, 2016–2017
Teacher Questionnaire: Academic Course
Results as of August 14, 2017 3 of 31
About Your SchoolProvince*
Number of Respondents 2 390# %†
2. To what extent do you agree or disagree with the following statements about your school’s improvement goals in mathematics this year?a. The school’s improvement goals have been communicated to me.
Strongly disagree or disagree 135 6%Neither agree nor disagree 280 12%Agree or strongly agree 1 956 82%No response/ambiguous response 19 1%
b. The school’s improvement goals were clear to me.Strongly disagree or disagree 171 7%Neither agree nor disagree 382 16%Agree or strongly agree 1 818 76%No response/ambiguous response 19 1%
c. I had the support of other staff members at the school to help me work toward the improvement goals.
Strongly disagree or disagree 135 6%Neither agree nor disagree 452 19%Agree or strongly agree 1 782 75%No response/ambiguous response 21 1%
d. The school provided me with materials to help me work toward the improvement goals.
Strongly disagree or disagree 206 9%Neither agree nor disagree 584 24%Agree or strongly agree 1 579 66%No response/ambiguous response 21 1%
* Numbers and percentages are based on the total number of teachers who completed the questionnaire.† Percentages may not add up to 100, due to rounding.

Provincial Results
Grade 9 Assessment of Mathematics, 2016–2017
Teacher Questionnaire: Academic Course
Results as of August 14, 2017 4 of 31
About Your SchoolProvince*
Number of Respondents 2 390# %†
e. The school has taken steps to meet its improvement goals.Strongly disagree or disagree 96 4%Neither agree nor disagree 481 20%Agree or strongly agree 1 791 75%No response/ambiguous response 22 1%
f. I had the opportunity to participate in decisions about the school’s improvement goals.
Strongly disagree or disagree 382 16%Neither agree nor disagree 577 24%Agree or strongly agree 1 412 59%No response/ambiguous response 19 1%
* Numbers and percentages are based on the total number of teachers who completed the questionnaire.† Percentages may not add up to 100, due to rounding.

Provincial Results
Grade 9 Assessment of Mathematics, 2016–2017
Teacher Questionnaire: Academic Course
Results as of August 14, 2017 5 of 31
About Your SchoolProvince*
Number of Respondents 2 390# %†
3. To what extent do you agree or disagree with the following statements about your school?a. Students take pride in this school.
Strongly disagree or disagree 88 4%Neither agree nor disagree 325 14%Agree or strongly agree 1 958 82%No response/ambiguous response 19 1%
b. Teachers take pride in this school.Strongly disagree or disagree 53 2%Neither agree nor disagree 205 9%Agree or strongly agree 2 112 88%No response/ambiguous response 20 1%
c. There is strong school spirit in this school.Strongly disagree or disagree 201 8%Neither agree nor disagree 566 24%Agree or strongly agree 1 604 67%No response/ambiguous response 19 1%
d. Students at this school respect one another.Strongly disagree or disagree 82 3%Neither agree nor disagree 349 15%Agree or strongly agree 1 937 81%No response/ambiguous response 22 1%
e. There is co-operation at this school among students.Strongly disagree or disagree 34 1%Neither agree nor disagree 274 11%Agree or strongly agree 2 057 86%No response/ambiguous response 25 1%
* Numbers and percentages are based on the total number of teachers who completed the questionnaire.† Percentages may not add up to 100, due to rounding.
Provincial Results
Grade 9 Assessment of Mathematics, 2016–2017
Teacher Questionnaire: Academic Course
Results as of August 14, 2017 6 of 31
About Your SchoolProvince*
Number of Respondents 2 390# %†
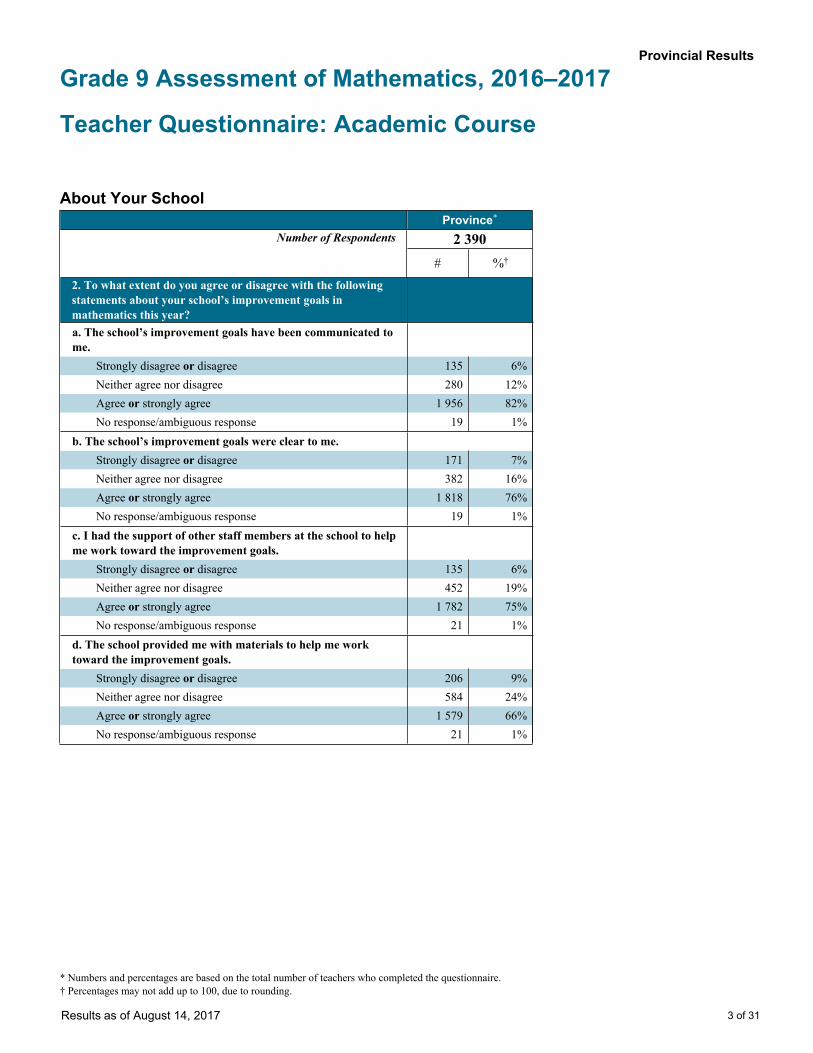
f. There is co-operation at this school among teachers.Strongly disagree or disagree 53 2%Neither agree nor disagree 207 9%Agree or strongly agree 2 108 88%No response/ambiguous response 22 1%
g. There is co-operation at this school among all staff members.Strongly disagree or disagree 145 6%Neither agree nor disagree 395 17%Agree or strongly agree 1 823 76%No response/ambiguous response 27 1%
h. There is co-operation at this school between students and teachers.
Strongly disagree or disagree 29 1%Neither agree nor disagree 213 9%Agree or strongly agree 2 117 89%No response/ambiguous response 31 1%
i. There is co-operation at this school between teachers and parents or guardians.
Strongly disagree or disagree 82 3%Neither agree nor disagree 435 18%Agree or strongly agree 1 849 77%No response/ambiguous response 24 1%
j. There is respect for diversity (e.g., cultural, ethnic, special needs) at this school.
Strongly disagree or disagree 33 1%Neither agree nor disagree 175 7%Agree or strongly agree 2 161 90%No response/ambiguous response 21 1%
* Numbers and percentages are based on the total number of teachers who completed the questionnaire.† Percentages may not add up to 100, due to rounding.

Provincial Results
Grade 9 Assessment of Mathematics, 2016–2017
Teacher Questionnaire: Academic Course
Results as of August 14, 2017 7 of 31
About Your SchoolProvince*
Number of Respondents
# %†
4. This question is not reported. Currently under field-testing.
* Numbers and percentages are based on the total number of teachers who completed the questionnaire.† Percentages may not add up to 100, due to rounding.
Provincial Results
Grade 9 Assessment of Mathematics, 2016–2017
Teacher Questionnaire: Academic Course
Results as of August 14, 2017 8 of 31
About Your SchoolProvince*
Number of Respondents 2 390# %†
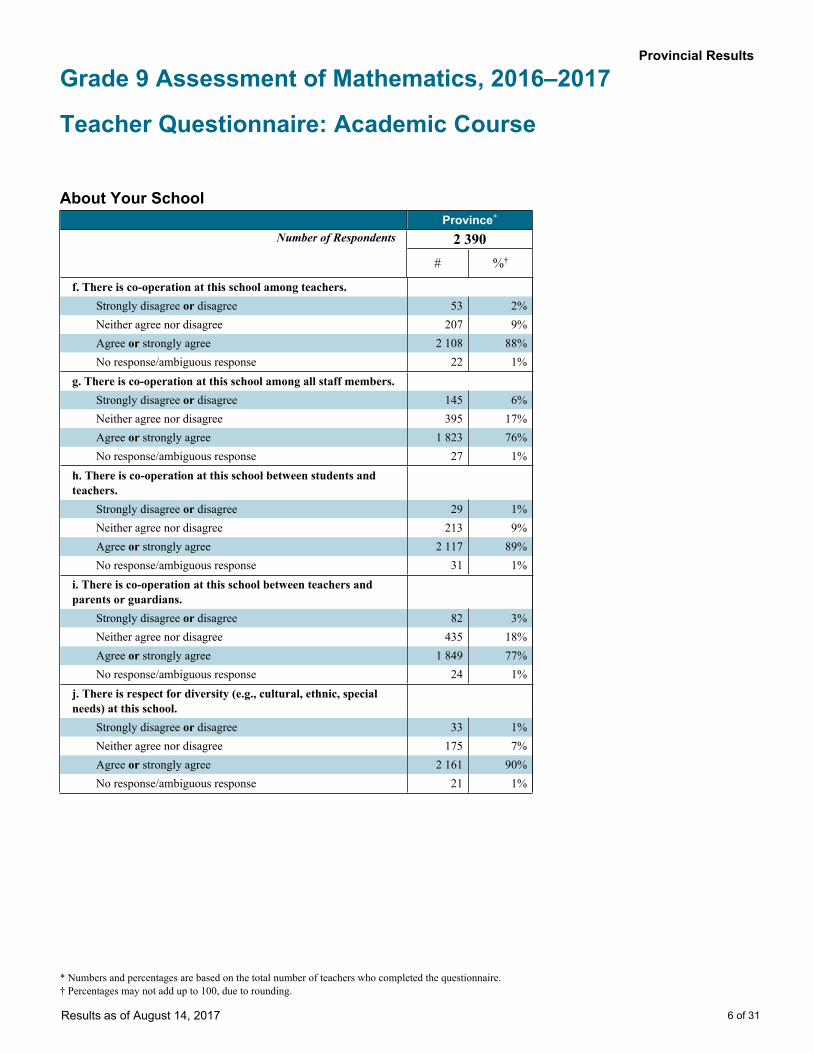
5a. For which mathematics course are you answering questions 5 to 12? Fill in only one circle.
Grade 9 applied 0 0%Grade 9 academic 2 390 100%No response/ambiguous response 0 0%
5b. This course is offered overa semester. 2 185 91%a year. 181 8%No response/ambiguous response 24 1%
* Numbers and percentages are based on the total number of teachers who completed the questionnaire.† Percentages may not add up to 100, due to rounding.

Provincial Results
Grade 9 Assessment of Mathematics, 2016–2017
Teacher Questionnaire: Academic Course
Results as of August 14, 2017 9 of 31
Use of EQAO ResourcesProvince*
Number of Respondents 2 390# %
6. How have you used the EQAO sample student assessments and scoring guides this year? Fill in all that apply.Independently
a. To show samples of student responses to students 1 872 78%b. To help students understand how questions and tasks relate to curriculum expectations 1 761 74%
c. To communicate with parents and guardians about curriculum expectations 796 33%
d. As a model for designing assessments 1 591 67%e. To inform classroom instruction 1 703 71%f. In ways other than those listed above 719 30%g. Did not use 82 3%
With a school teamh. As a model for designing assessments 876 37%i. To inform classroom instruction 818 34%j. In ways other than those listed above 332 14%k. Did not use 79 3%
* Numbers and percentages are based on the total number of teachers who completed the questionnaire.
Provincial Results
Grade 9 Assessment of Mathematics, 2016–2017
Teacher Questionnaire: Academic Course
Results as of August 14, 2017 10 of 31
Use of EQAO ResourcesProvince*
Number of Respondents 2 390# %
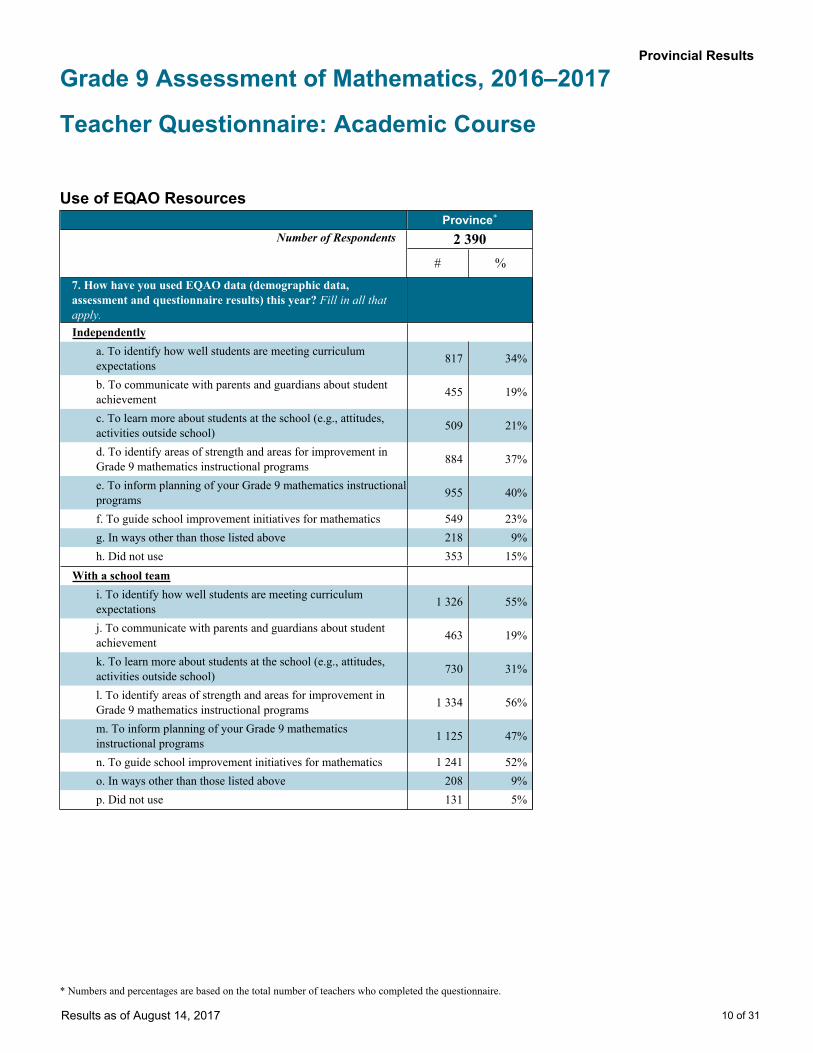
7. How have you used EQAO data (demographic data, assessment and questionnaire results) this year? Fill in all that apply.Independently
a. To identify how well students are meeting curriculum expectations 817 34%
b. To communicate with parents and guardians about student achievement 455 19%
c. To learn more about students at the school (e.g., attitudes, activities outside school) 509 21%
d. To identify areas of strength and areas for improvement in Grade 9 mathematics instructional programs 884 37%
e. To inform planning of your Grade 9 mathematics instructional programs 955 40%
f. To guide school improvement initiatives for mathematics 549 23%g. In ways other than those listed above 218 9%h. Did not use 353 15%
With a school teami. To identify how well students are meeting curriculum expectations 1 326 55%
j. To communicate with parents and guardians about student achievement 463 19%
k. To learn more about students at the school (e.g., attitudes, activities outside school) 730 31%
l. To identify areas of strength and areas for improvement in Grade 9 mathematics instructional programs 1 334 56%
m. To inform planning of your Grade 9 mathematics instructional programs 1 125 47%
n. To guide school improvement initiatives for mathematics 1 241 52%o. In ways other than those listed above 208 9%p. Did not use 131 5%
* Numbers and percentages are based on the total number of teachers who completed the questionnaire.

Provincial Results
Grade 9 Assessment of Mathematics, 2016–2017
Teacher Questionnaire: Academic Course
Results as of August 14, 2017 11 of 31
Use of Instructional Resources in Your ClassroomProvince*
Number of Respondents 2 390# %†
8. I. How often did you have the majority of your students use each of the following in class this past semester or year?a. Calculator
Never 10 <1%Seldom 51 2%Sometimes 227 9%Frequently 2 074 87%No response/ambiguous response 28 1%
b. Graphing calculatorNever 819 34%Seldom 787 33%Sometimes 569 24%Frequently 160 7%No response/ambiguous response 55 2%
c. Computer software (e.g., spreadsheet, statistical, dynamic geometry or graphing software)
Never 476 20%Seldom 765 32%Sometimes 816 34%Frequently 292 12%No response/ambiguous response 41 2%
d. The Internet (e.g., to access statistics or other sources of mathematical information)
Never 363 15%Seldom 833 35%Sometimes 775 32%Frequently 378 16%No response/ambiguous response 41 2%
* Numbers and percentages are based on the total number of teachers who completed the questionnaire.† Percentages may not add up to 100, due to rounding.
Provincial Results
Grade 9 Assessment of Mathematics, 2016–2017
Teacher Questionnaire: Academic Course
Results as of August 14, 2017 12 of 31
Use of Instructional Resources in Your ClassroomProvince*
Number of Respondents 2 390# %†
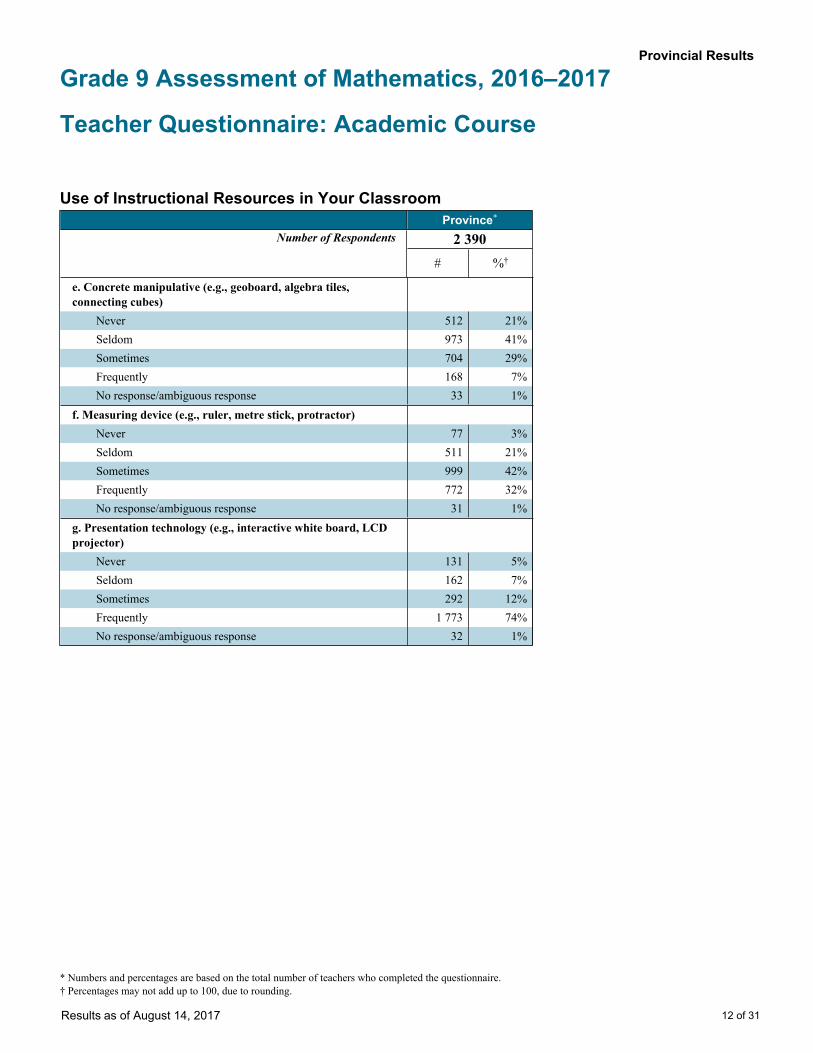
e. Concrete manipulative (e.g., geoboard, algebra tiles, connecting cubes)
Never 512 21%Seldom 973 41%Sometimes 704 29%Frequently 168 7%No response/ambiguous response 33 1%
f. Measuring device (e.g., ruler, metre stick, protractor)Never 77 3%Seldom 511 21%Sometimes 999 42%Frequently 772 32%No response/ambiguous response 31 1%
g. Presentation technology (e.g., interactive white board, LCD projector)
Never 131 5%Seldom 162 7%Sometimes 292 12%Frequently 1 773 74%No response/ambiguous response 32 1%
* Numbers and percentages are based on the total number of teachers who completed the questionnaire.† Percentages may not add up to 100, due to rounding.

Provincial Results
Grade 9 Assessment of Mathematics, 2016–2017
Teacher Questionnaire: Academic Course
Results as of August 14, 2017 13 of 31
Use of Instructional Resources in Your ClassroomProvince*
Number of Respondents 2 390# %†
8. II. How accessible were each of the following for use in class this past semester or year?a. Calculator
Not accessible 8 <1%Difficult to access 55 2%Easy to access 2 209 92%No response/ambiguous response 118 5%
b. Graphing calculatorNot accessible 136 6%Difficult to access 384 16%Easy to access 1 708 71%No response/ambiguous response 162 7%
c. Computer software (e.g., spreadsheet, statistical, dynamic geometry or graphing software)
Not accessible 81 3%Difficult to access 623 26%Easy to access 1 547 65%No response/ambiguous response 139 6%
d. The Internet (e.g., to access statistics or other sources of mathematical information)
Not accessible 30 1%Difficult to access 331 14%Easy to access 1 883 79%No response/ambiguous response 146 6%
e. Concrete manipulative (e.g., geoboard, algebra tiles, connecting cubes)
Not accessible 77 3%Difficult to access 369 15%Easy to access 1 790 75%No response/ambiguous response 154 6%
* Numbers and percentages are based on the total number of teachers who completed the questionnaire.† Percentages may not add up to 100, due to rounding.

Provincial Results
Grade 9 Assessment of Mathematics, 2016–2017
Teacher Questionnaire: Academic Course
Results as of August 14, 2017 14 of 31
Use of Instructional Resources in Your ClassroomProvince*
Number of Respondents 2 390# %†
f. Measuring device (e.g., ruler, metre stick, protractor)Not accessible 7 <1%Difficult to access 105 4%Easy to access 2 142 90%No response/ambiguous response 136 6%
g. Presentation technology (e.g., interactive white board, LCD projector)
Not accessible 47 2%Difficult to access 138 6%Easy to access 2 074 87%No response/ambiguous response 131 5%
* Numbers and percentages are based on the total number of teachers who completed the questionnaire.† Percentages may not add up to 100, due to rounding.
Provincial Results
Grade 9 Assessment of Mathematics, 2016–2017
Teacher Questionnaire: Academic Course
Results as of August 14, 2017 15 of 31
Some Teaching PracticesProvince*
Number of Respondents 2 390# %†
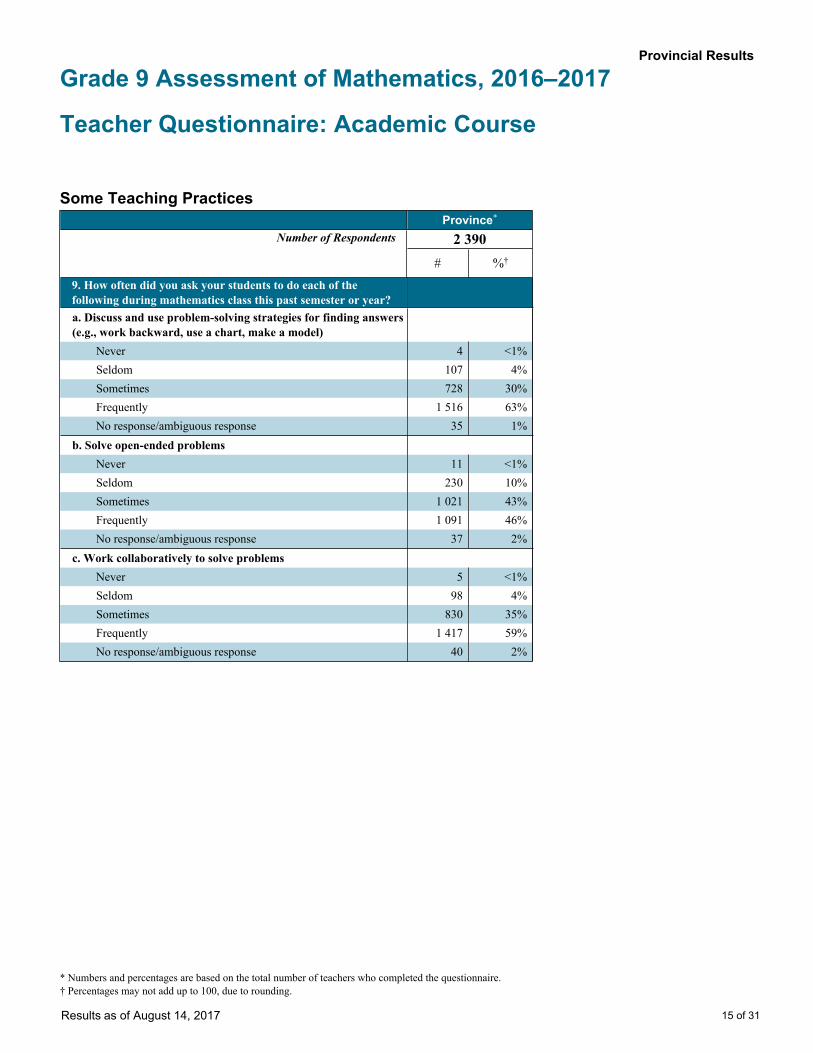
9. How often did you ask your students to do each of the following during mathematics class this past semester or year?a. Discuss and use problem-solving strategies for finding answers (e.g., work backward, use a chart, make a model)
Never 4 <1%Seldom 107 4%Sometimes 728 30%Frequently 1 516 63%No response/ambiguous response 35 1%
b. Solve open-ended problemsNever 11 <1%Seldom 230 10%Sometimes 1 021 43%Frequently 1 091 46%No response/ambiguous response 37 2%
c. Work collaboratively to solve problemsNever 5 <1%Seldom 98 4%Sometimes 830 35%Frequently 1 417 59%No response/ambiguous response 40 2%
* Numbers and percentages are based on the total number of teachers who completed the questionnaire.† Percentages may not add up to 100, due to rounding.

Provincial Results
Grade 9 Assessment of Mathematics, 2016–2017
Teacher Questionnaire: Academic Course
Results as of August 14, 2017 16 of 31
Some Teaching PracticesProvince*
Number of Respondents 2 390# %†
d. Discuss mathematical ideas and relationshipsNever 4 <1%Seldom 60 3%Sometimes 603 25%Frequently 1 676 70%No response/ambiguous response 47 2%
e. Conduct mathematical investigations (e.g., to demonstrate the inquiry process)
Never 30 1%Seldom 353 15%Sometimes 1 197 50%Frequently 772 32%No response/ambiguous response 38 2%
f. Explain the reasoning behind their answersNever 3 <1%Seldom 28 1%Sometimes 406 17%Frequently 1 909 80%No response/ambiguous response 44 2%
g. Write solutions using mathematical language and symbolsNever 2 <1%Seldom 16 1%Sometimes 146 6%Frequently 2 182 91%No response/ambiguous response 44 2%
* Numbers and percentages are based on the total number of teachers who completed the questionnaire.† Percentages may not add up to 100, due to rounding.

Provincial Results
Grade 9 Assessment of Mathematics, 2016–2017
Teacher Questionnaire: Academic Course
Results as of August 14, 2017 17 of 31
Some Teaching PracticesProvince*
Number of Respondents 2 390# %†
10a. How often did you assign homework in your mathematics course this past semester or year?
Never 9 <1%Occasionally 117 5%Most classes 929 39%Every class 1 297 54%No response/ambiguous response 38 2%
10b. If you assign homework, how much time would you expect an average student to spend on a typical homework assignment?‡
30 minutes or less 944 40%Between 31 and 45 minutes 1 213 52%More than 45 minutes 139 6%No response/ambiguous response 47 2%
* Numbers and percentages are based on the total number of teachers who completed the questionnaire.† Percentages may not add up to 100, due to rounding.‡ Numbers and percentages are based on the number of teachers who answered “Occasionally,” “Most classes” or “Every class” to Question 10a.
Provincial Results
Grade 9 Assessment of Mathematics, 2016–2017
Teacher Questionnaire: Academic Course
Results as of August 14, 2017 18 of 31
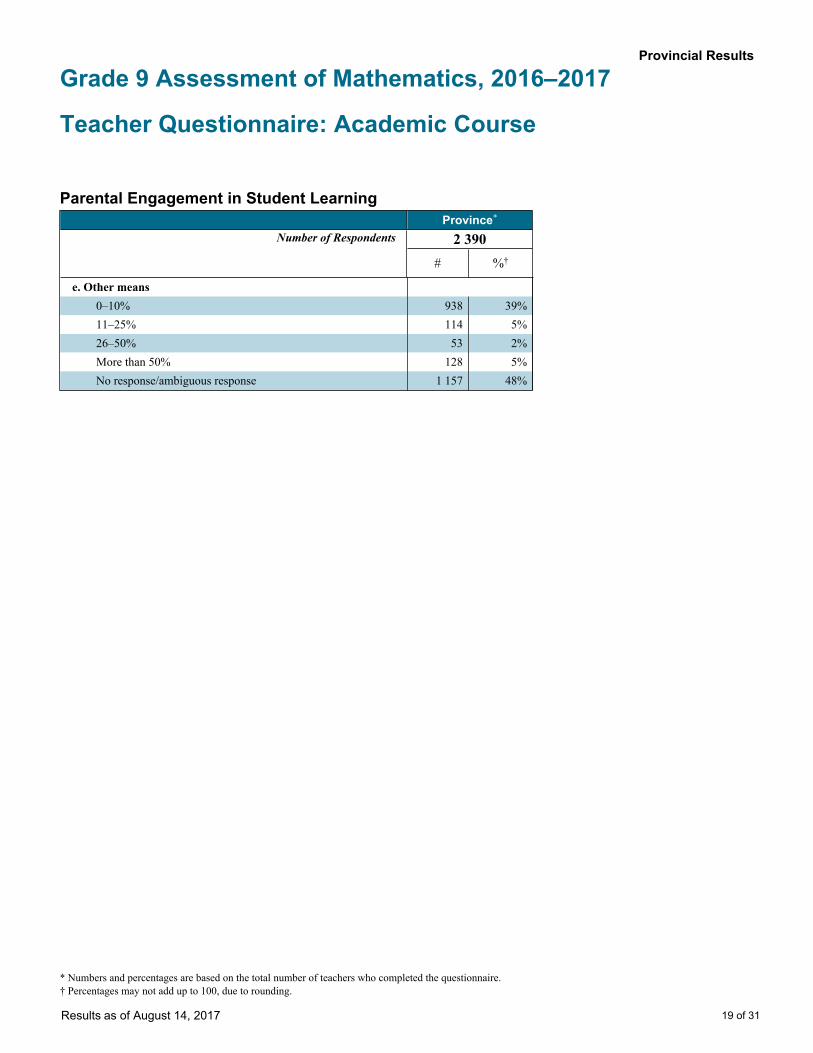
Parental Engagement in Student LearningProvince*
Number of Respondents 2 390# %†
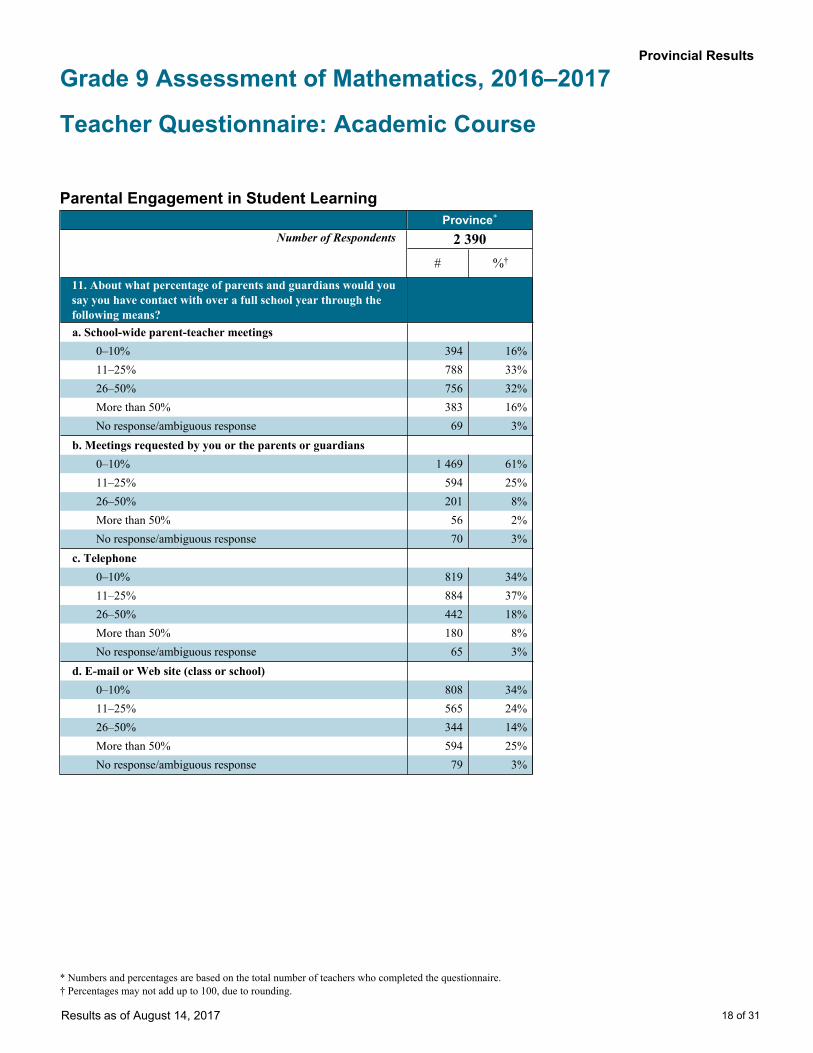
11. About what percentage of parents and guardians would you say you have contact with over a full school year through the following means?a. School-wide parent-teacher meetings
0–10% 394 16%11–25% 788 33%26–50% 756 32%More than 50% 383 16%No response/ambiguous response 69 3%
b. Meetings requested by you or the parents or guardians0–10% 1 469 61%11–25% 594 25%26–50% 201 8%More than 50% 56 2%No response/ambiguous response 70 3%
c. Telephone0–10% 819 34%11–25% 884 37%26–50% 442 18%More than 50% 180 8%No response/ambiguous response 65 3%
d. E-mail or Web site (class or school)0–10% 808 34%11–25% 565 24%26–50% 344 14%More than 50% 594 25%No response/ambiguous response 79 3%
* Numbers and percentages are based on the total number of teachers who completed the questionnaire.† Percentages may not add up to 100, due to rounding.
Provincial Results
Grade 9 Assessment of Mathematics, 2016–2017
Teacher Questionnaire: Academic Course
Results as of August 14, 2017 19 of 31
Parental Engagement in Student LearningProvince*
Number of Respondents 2 390# %†
e. Other means0–10% 938 39%11–25% 114 5%26–50% 53 2%More than 50% 128 5%No response/ambiguous response 1 157 48%
* Numbers and percentages are based on the total number of teachers who completed the questionnaire.† Percentages may not add up to 100, due to rounding.

Provincial Results
Grade 9 Assessment of Mathematics, 2016–2017
Teacher Questionnaire: Academic Course
Results as of August 14, 2017 20 of 31
Parental Engagement in Student LearningProvince*
Number of Respondents 2 390# %†
12. About what percentage of parents and guardians would you say you have contact with over a full school year for the following reasons?a. To discuss the link between EQAO assessments and The Ontario Curriculum
0% 1 348 56%1–10% 662 28%11–25% 118 5%26–50% 80 3%More than 50% 113 5%No response/ambiguous response 69 3%
b. To discuss the link between EQAO assessments and instructional or assessment strategies
0% 1 275 53%1–10% 688 29%11–25% 138 6%26–50% 94 4%More than 50% 119 5%No response/ambiguous response 76 3%
c. To discuss their child’s learning progress0% 21 1%1–10% 327 14%11–25% 606 25%26–50% 681 28%More than 50% 689 29%No response/ambiguous response 66 3%
* Numbers and percentages are based on the total number of teachers who completed the questionnaire.† Percentages may not add up to 100, due to rounding.

Provincial Results
Grade 9 Assessment of Mathematics, 2016–2017
Teacher Questionnaire: Academic Course
Results as of August 14, 2017 21 of 31
Parental Engagement in Student LearningProvince*
Number of Respondents 2 390# %†
d. To discuss their child’s behaviour0% 293 12%1–10% 1 166 49%11–25% 461 19%26–50% 268 11%More than 50% 132 6%No response/ambiguous response 70 3%
e. To provide suggestions about how to support learning at home0% 96 4%1–10% 724 30%11–25% 734 31%26–50% 450 19%More than 50% 317 13%No response/ambiguous response 69 3%
f. For other reasons0% 433 18%1–10% 558 23%11–25% 173 7%26–50% 110 5%More than 50% 142 6%No response/ambiguous response 974 41%
* Numbers and percentages are based on the total number of teachers who completed the questionnaire.† Percentages may not add up to 100, due to rounding.

Provincial Results
Grade 9 Assessment of Mathematics, 2016–2017
Teacher Questionnaire: Academic Course
Results as of August 14, 2017 22 of 31
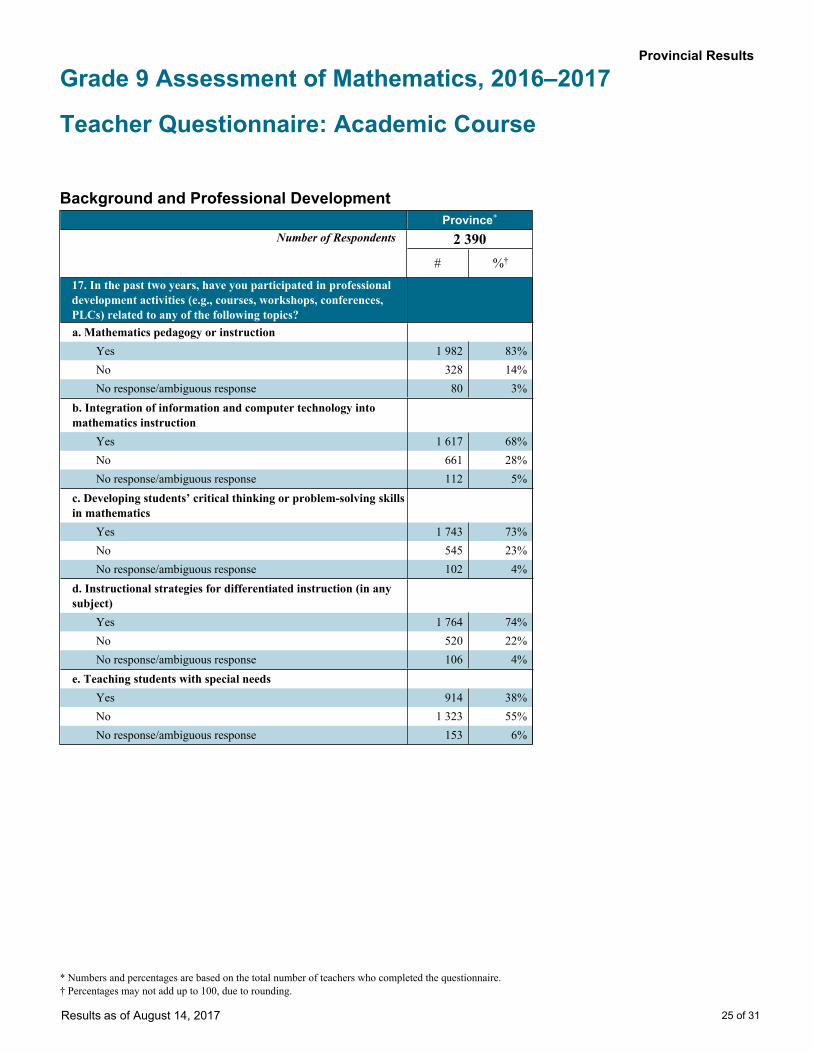
Background and Professional DevelopmentProvince*
Number of Respondents 2 390# %†
13. What is your gender?Female 1 412 59%Male 876 37%No response/ambiguous response 102 4%
14. Including this year, for how many years have you been teaching?a. In total
2 years or less 68 3%3–5 years 203 8%6–10 years 486 20%11 years or more 1 577 66%No response/ambiguous response 56 2%
b. Mathematics at the secondary level2 years or less 196 8%3–5 years 265 11%6–10 years 491 21%11 years or more 1 361 57%No response/ambiguous response 77 3%
c. Grade 9 mathematics2 years or less 355 15%3–5 years 369 15%6–10 years 557 23%11 years or more 1 037 43%No response/ambiguous response 72 3%
* Numbers and percentages are based on the total number of teachers who completed the questionnaire.† Percentages may not add up to 100, due to rounding.

Provincial Results
Grade 9 Assessment of Mathematics, 2016–2017
Teacher Questionnaire: Academic Course
Results as of August 14, 2017 23 of 31
Background and Professional DevelopmentProvince*
Number of Respondents 2 390# %†
15. What best describes your area of study during your post-secondary education? Fill in only one circle.
Mathematics major or specialist 879 37%Mathematics-related major or specialist (e.g., business, science, engineering, computer science) 839 35%
Other major with a mathematics minor 317 13%Other major with a mathematics-related minor 122 5%Area of study unrelated to mathematics 177 7%No response/ambiguous response 56 2%
* Numbers and percentages are based on the total number of teachers who completed the questionnaire.† Percentages may not add up to 100, due to rounding.

Provincial Results
Grade 9 Assessment of Mathematics, 2016–2017
Teacher Questionnaire: Academic Course
Results as of August 14, 2017 24 of 31
Background and Professional DevelopmentProvince*
Number of Respondents 2 390# %
16. Which of the following courses have you completed or are you presently enrolled in? Fill in all that apply.
Intermediate Additional Basic Qualifications in Mathematics 882 37%Senior Additional Basic Qualifications in Mathematics 863 36%Honour Specialist Additional Qualifications in Mathematics 650 27%Additional Qualifications in Integration of Information and Computer Technology in Instruction (Part I or II or Specialist) 154 6%
Additional Qualifications in English as a Second Language (Part I or II or Specialist) 182 8%
Additional Qualifications in Special Education (Part I or II or Specialist) 655 27%
None of the above 459 19%
* Numbers and percentages are based on the total number of teachers who completed the questionnaire.
Provincial Results
Grade 9 Assessment of Mathematics, 2016–2017
Teacher Questionnaire: Academic Course
Results as of August 14, 2017 25 of 31
Background and Professional DevelopmentProvince*
Number of Respondents 2 390# %†
17. In the past two years, have you participated in professional development activities (e.g., courses, workshops, conferences, PLCs) related to any of the following topics?a. Mathematics pedagogy or instruction
Yes 1 982 83%No 328 14%No response/ambiguous response 80 3%
b. Integration of information and computer technology into mathematics instruction
Yes 1 617 68%No 661 28%No response/ambiguous response 112 5%
c. Developing students’ critical thinking or problem-solving skills in mathematics
Yes 1 743 73%No 545 23%No response/ambiguous response 102 4%
d. Instructional strategies for differentiated instruction (in any subject)
Yes 1 764 74%No 520 22%No response/ambiguous response 106 4%
e. Teaching students with special needsYes 914 38%No 1 323 55%No response/ambiguous response 153 6%
* Numbers and percentages are based on the total number of teachers who completed the questionnaire.† Percentages may not add up to 100, due to rounding.
Provincial Results
Grade 9 Assessment of Mathematics, 2016–2017
Teacher Questionnaire: Academic Course
Results as of August 14, 2017 26 of 31
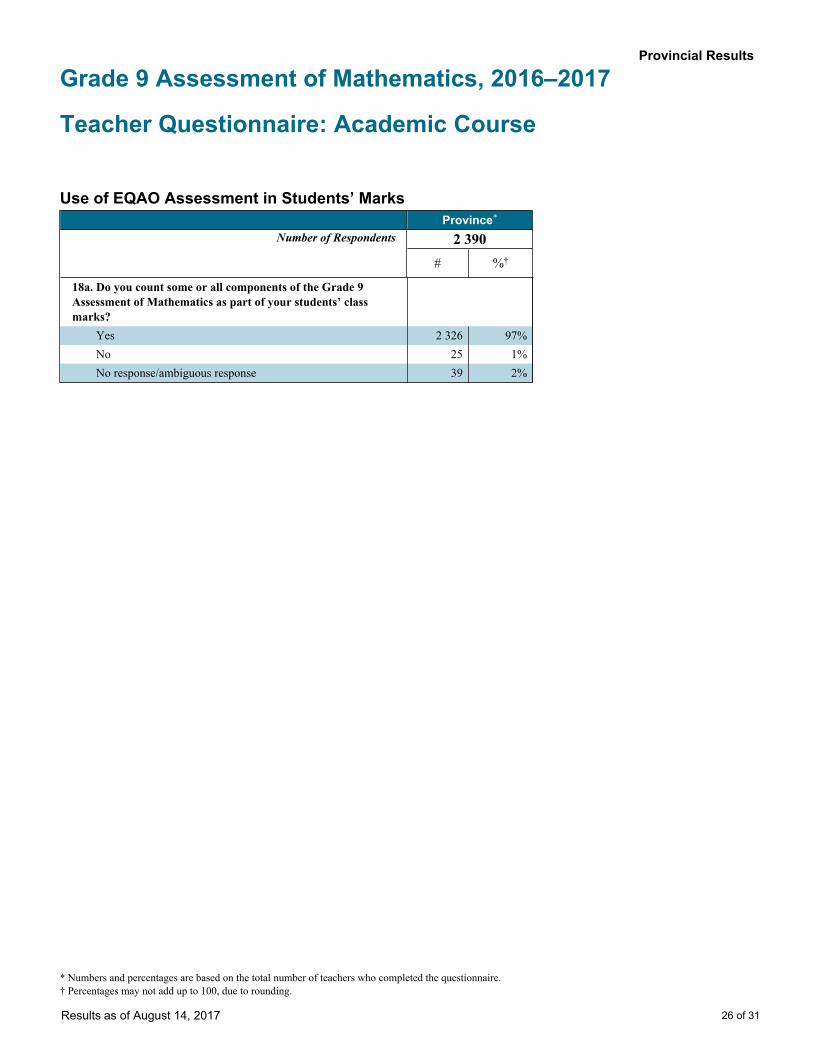
Use of EQAO Assessment in Students’ Marks Province*
Number of Respondents 2 390# %†
18a. Do you count some or all components of the Grade 9 Assessment of Mathematics as part of your students’ class marks?
Yes 2 326 97%No 25 1%No response/ambiguous response 39 2%
* Numbers and percentages are based on the total number of teachers who completed the questionnaire.† Percentages may not add up to 100, due to rounding.

Provincial Results
Grade 9 Assessment of Mathematics, 2016–2017
Teacher Questionnaire: Academic Course
Results as of August 14, 2017 27 of 31
Use of EQAO Assessment in Students’ Marks Province*
Number of Respondents 2 326# %†
18b. If yes, for how much do they count?‡
1–5% 584 25%6–10% 1 168 50%11–15% 351 15%16–20% 95 4%21–25% 11 <1%26–30% 45 2%Other 29 1%No response/ambiguous response 43 2%
19. Before writing the Grade 9 Assessment of Mathematics, were students informed about the weight it would be given in the calculation of their class mark (e.g., 5%, 10%)?‡
Yes 2 311 99%No 12 1%No response/ambiguous response 3 <1%
20. In your opinion, does counting some or all components of the Grade 9 Assessment of Mathematics as part of class marks motivate students to take the assessment more seriously?‡
Yes 2 113 91%No 52 2%Undecided 157 7%No response/ambiguous response 4 <1%
* Numbers and percentages for this section apply to Questions 18b-23.† Percentages may not add up to 100, due to rounding.‡ Numbers and percentages are based on the number of teachers who answered "yes" to Question 18a.

Provincial Results
Grade 9 Assessment of Mathematics, 2016–2017
Teacher Questionnaire: Academic Course
Results as of August 14, 2017 28 of 31
Use of EQAO Assessment in Students’ Marks Province*
Number of Respondents 2 326# %
21. Who decides if some or all components of the Grade 9 Assessment of Mathematics count as part of your students’ class marks? Fill in all circles that apply.‡
School-board staff 587 25%Mathematics department 1 593 68%School principal or vice-principal 416 18%Individual Grade 9 mathematics teachers 257 11%Grade 9 mathematics teachers as a group 740 32%Don’t know 108 5%Other 10 <1%
22. Who decides which questions count as part of your students’ class marks? Fill in all circles that apply.‡
School-board staff 157 7%Mathematics department 1 190 51%School principal or vice-principal 147 6%Individual Grade 9 mathematics teachers 460 20%Grade 9 mathematics teachers as a group 1 047 45%Don’t know 67 3%Other 7 <1%
* Numbers and percentages for this section apply to Questions 18b-23.‡ Numbers and percentages are based on the number of teachers who answered "yes" to Question 18a.

Provincial Results
Grade 9 Assessment of Mathematics, 2016–2017
Teacher Questionnaire: Academic Course
Results as of August 14, 2017 29 of 31
Use of EQAO Assessment in Students’ Marks Province*
Number of Respondents 2 326# %†
23. Which types of questions count as part of your students’ class marks?‡ a. Open-response questions
All questions 821 35%Some questions 867 37%No questions 471 20%No response/ambiguous response 167 7%
b. Multiple-choice questionsAll questions 1 993 86%Some questions 268 12%No questions 23 1%No response/ambiguous response 42 2%
* Numbers and percentages for this section apply to Questions 18b-23.† Percentages may not add up to 100, due to rounding.‡ Numbers and percentages are based on the number of teachers who answered "yes" to Question 18a.
Provincial Results
Grade 9 Assessment of Mathematics, 2016–2017
Teacher Questionnaire: Academic Course
Results as of August 14, 2017 30 of 31
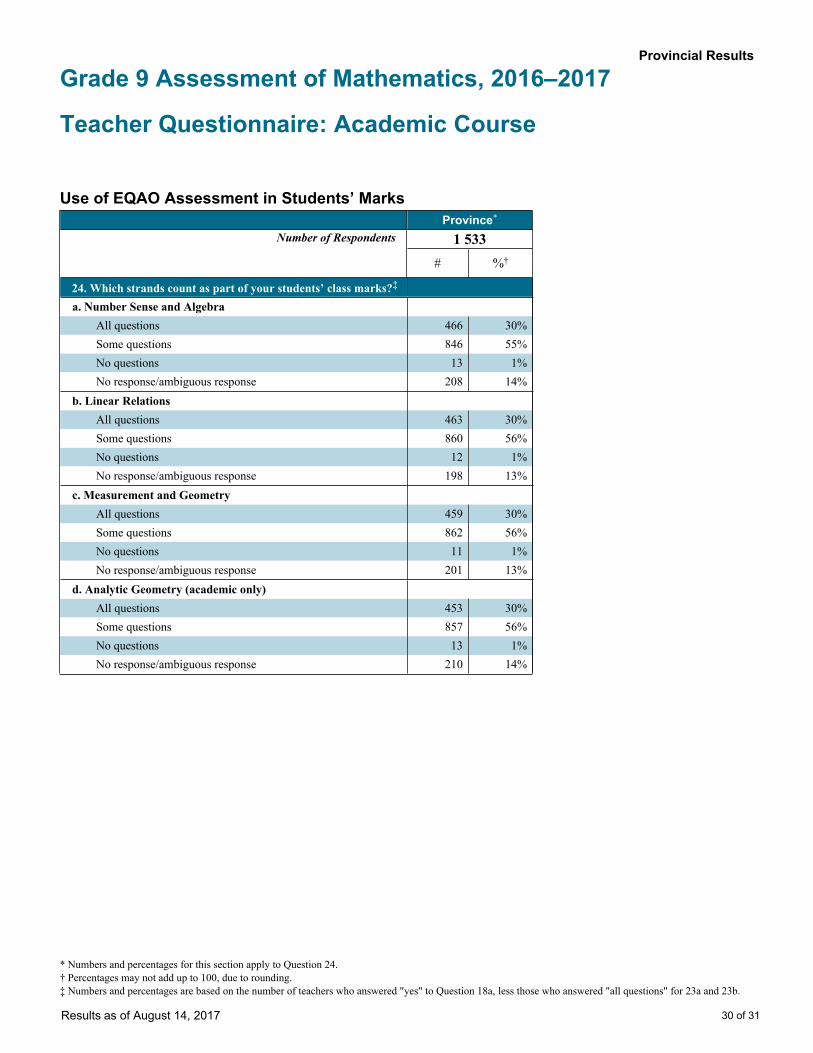
Use of EQAO Assessment in Students’ Marks Province*
Number of Respondents 1 533# %†
24. Which strands count as part of your students’ class marks?‡ a. Number Sense and Algebra
All questions 466 30%Some questions 846 55%No questions 13 1%No response/ambiguous response 208 14%
b. Linear RelationsAll questions 463 30%Some questions 860 56%No questions 12 1%No response/ambiguous response 198 13%
c. Measurement and GeometryAll questions 459 30%Some questions 862 56%No questions 11 1%No response/ambiguous response 201 13%
d. Analytic Geometry (academic only)All questions 453 30%Some questions 857 56%No questions 13 1%No response/ambiguous response 210 14%
* Numbers and percentages for this section apply to Question 24.† Percentages may not add up to 100, due to rounding.‡ Numbers and percentages are based on the number of teachers who answered "yes" to Question 18a, less those who answered "all questions" for 23a and 23b.

Provincial Results
Grade 9 Assessment of Mathematics, 2016–2017
Teacher Questionnaire: Academic Course
Results as of August 14, 2017 31 of 31
OtherProvince*
Number of Respondents 2 390# %†
25. Do you believe that the time allotted this year to complete the Grade 9 Assessment of Mathematics was sufficient?
Yes 1 986 83%No 292 12%No response/ambiguous response 112 5%
26. I would prefer to answer this questionnaire online (through the Internet).
Strongly disagree or disagree 668 28%Neither agree nor disagree 699 29%Agree or strongly agree 920 38%No response/ambiguous response 103 4%
* Numbers and percentages are based on the total number of teachers who completed the questionnaire.† Percentages may not add up to 100, due to rounding.