Embed Size (px)
Citation preview

T R A N S I T C O O P E R A T I V E R E S E A R C H P R O G R A M
SPONSORED BY
The Federal Transit Administration
TCRP Report 25
Bus Operator Workstation Evaluation and Design Guidelines
Summary
Transportation Research BoardNational Research Council

TCRP OVERSIGHT AND PROJECTSELECTION COMMITTEE
CHAIRMICHAEL S. TOWNESPeninsula Transportation Dist. Comm.
MEMBERSSHARON D. BANKSAC TransitLEE BARNESBarwood, Inc.GERALD L. BLAIRIndiana County Transit AuthoritySHIRLEY A. DeLIBERONew Jersey Transit CorporationROD J. DIRIDONIISTPSSANDRA DRAGGOOCATALOUIS J. GAMBACCINISEPTADELON HAMPTONDelon Hampton & AssociatesKATHARINE HUNTER-ZAWORSKIOregon State UniversityALAN F. KIEPPERParsons Brinckerhoff, Inc.PAUL LARROUSSEMadison Metro Transit SystemROBERT G. LINGWOODBC TransitGORDON J. LINTONFederal Transit AdministrationDON S. MONROEPierce TransitPATRICIA S. NETTLESHIPThe Nettleship Group, Inc.ROBERT E. PAASWELLThe City College of New YorkJAMES P. REICHERTReichert Management ServicesLAWRENCE G. REUTERMTA New York City TransitPAUL TOLIVERKing County DOT/MetroLINDA WATSONCorpus Christi RTAFRANK J. WILSONNew Jersey DOTEDWARD WYTKINDAFL-CIO
EX OFFICIO MEMBERSWILLIAM W. MILLARAPTARODNEY E. SLATERFHWAFRANCIS B. FRANCOISAASHTOROBERT E. SKINNER, JR.TRB
TDC EXECUTIVE DIRECTORFRANK J. CIHAKAPTA
SECRETARYROBERT J. REILLYTRB
TRANSPORTATION RESEARCH BOARD EXECUTIVE COMMITTEE 1997
OFFICERS
Chair: David N. Wormley, Dean of Engineering, Pennsylvania State UniversityVice Chair: Sharon D. Banks, General Manager, AC TransitExecutive Director: Robert E. Skinner, Jr., Transportation Research Board
MEMBERS
BRIAN J. L. BERRY, Lloyd Viel Berkner Regental Professor, Bruton Center for Development Studies,University of Texas at Dallas
LILLIAN C. BORRONE, Director, Port Commerce, The Port Authority of New York and New Jersey (PastChair, 1995)
DAVID BURWELL, President, Rails-to-Trails Conservancy, Washington, DCE. DEAN CARLSON, Secretary, Kansas Department of TransportationJAMES N. DENN, Commissioner, Minnesota Department of TransportationJOHN W. FISHER, Joseph T. Stuart Professor of Civil Engineering, Director, ATLSS Engineering Research
Center, Lehigh UniversityDENNIS J. FITZGERALD, Executive Director, Capital District Transportation Authority, Albany, NYDAVID R. GOODE, Chair, President and CEO, Norfolk Southern CorporationDELON HAMPTON, Chair and CEO, Delon Hampton & AssociatesLESTER A. HOEL, Hamilton Professor, Civil Engineering, University of VirginiaJAMES L. LAMMIE, Director, Parsons Brinckerhoff, Inc., New York, NYBRADLEY L. MALLORY, Secretary of Transportation, Pennsylvania Department of TransportationROBERT E. MARTINEZ, Secretary of Transportation, Commonwealth of VirginiaJEFFREY J. MCCAIG, President and CED, Trimac Corporation, Calgary, Alberta, CanadaMARSHALL W. MOORE, Director, North Dakota Department of TransportationCRAIG E. PHILIP, President, Ingram Barge Co., Nashville, TNANDREA RINIKER, Deputy Executive Director, Port of SeattleJOHN M. SAMUELS, Vice President—Operating Assets, Consolidated Rail CorporationWAYNE SHACKELFORD, Commissioner, Georgia Department of TransportationLESLIE STERMAN, Executive Director, East-West Gateway Coordinating Council, St. Louis, MOJOSEPH M. SUSSMAN, JR East Professor, Civil and Environmental Engineering, MITJAMES W. VAN LOBEN SELS, Director, California Department of Transportation (Past Chair, 1996)MARTIN WACHS, Director, University of California Transportation Center, BerkeleyDAVID L. WINSTEAD, Secretary, Maryland Department of Transportation
EX OFFICIO MEMBERS
MIKE ACOTT, President, National Asphalt Pavement AssociationROY A. ALLEN, Vice President, Research and Test Department, Association of American RailroadsJOE N. BALLARD, Chief of Engineers and Commander, U.S. Army Corps of EngineersANDREW H. CARD, JR., President and CEO, American Automobile Manufacturers AssociationTHOMAS J. DONOHUE, President and CEO, American Trucking AssociationsFRANCIS B. FRANCOIS, Executive Director, American Association of State Highway and Transportation
OfficialsDAVID GARDINER, Administrator, U.S. Environmental Protection AgencyJANE F. GARVEY, Federal Highway Acting Administrator, U.S. Department of TransportationALBERT J. HERBERGER, Maritime Administrator, U.S. Department of TransportationT. R. LAKSHMANAN, Director, Bureau of Transportation Statistics, U.S. Department of TransportationGORDON J. LINTON, Federal Transit Administrator, U.S. Department of TransportationRICARDO MARTINEZ, National Highway Traffic Safety Administrator, U.S. Department of TransportationWILLIAM W. MILLAR, President, American Public Transit AssociationJOLENE M. MOLITORIS, Federal Railroad Administrator, U.S. Department of TransportationDHARMENDRA K. (DAVE) SHARMA, Research and Special Programs Administrator, U.S. Department of
TransportationBARRY L. VALENTINE, Acting Administrator, Federal Aviation Administration, U.S.DOT
TRANSIT COOPERATIVE RESEARCH PROGRAM
Transportation Research Board Executive Committee Subcommittee for TCRPDAVID N. WORMLEY, Pennsylvania State University (Chair)SHARON D. BANKS, AC TransitDENNIS J. FITZGERALD, Capital Dist. Transportation Authority, Albany, NYLESTER A. HOEL, University of VirginiaGORDON J. LINTON, U.S. Department of TransportationROBERT E. SKINNER, JR., Transportation Research BoardJAMES W. VAN LOBEN SELS, California Department of Transportation

T R A N S I T C O O P E R A T I V E R E S E A R C H P R O G R A MT R A N S I T C O O P E R A T I V E R E S E A R C H P R O G R A M
Report 25
Bus Operator Workstation Evaluation and Design Guidelines
Summary
HEECHEON YOUBRIAN OESTERLING
JOSEPH BUCCIAGLIABRIAN LOWE
BRIAN GILMOREANDRIS FREIVALDS
The Pennsylvania Transportation InstituteThe Pennsylvania State University
University Park, PA
Subject Area
Public Transit
Research Sponsored by the Federal Transit Administration inCooperation with the Transit Development Corporation
T R A N S P O R T A T I O N R E S E A R C H B O A R D
NATIONAL RESEARCH COUNCIL
NATIONAL ACADEMY PRESSWashington, D.C. 1997

TRANSIT COOPERATIVE RESEARCH PROGRAM
The nation’s growth and the need to meet mobility,environmental, and energy objectives place demands on publictransit systems. Current systems, some of which are old and in needof upgrading, must expand service area, increase service frequency,and improve efficiency to serve these demands. Research isnecessary to solve operating problems, to adapt appropriate newtechnologies from other industries, and to introduce innovations intothe transit industry. The Transit Cooperative Research Program(TCRP) serves as one of the principal means by which the transitindustry can develop innovative near-term solutions to meetdemands placed on it.
The need for TCRP was originally identified in TRB SpecialReport 213—Research for Public Transit: New Directions,published in 1987 and based on a study sponsored by the UrbanMass Transportation Administration—now the Federal TransitAdministration (FTA). A report by the American Public TransitAssociation (APTA), Transportation 2000, also recognized the needfor local, problem-solving research. TCRP, modeled after thelongstanding and successful National Cooperative HighwayResearch Program, undertakes research and other technical activitiesin response to the needs of transit service providers. The scope ofTCRP includes a variety of transit research fields including plan-ning, service configuration, equipment, facilities, operations, humanresources, maintenance, policy, and administrative practices.
TCRP was established under FTA sponsorship in July 1992.Proposed by the U.S. Department of Transportation, TCRP wasauthorized as part of the Intermodal Surface TransportationEfficiency Act of 1991 (ISTEA). On May 13, 1992, a memorandumagreement outlining TCRP operating procedures was executed bythe three cooperating organizations: FTA, the National Academy ofSciences, acting through the Transportation Research Board (TRB),and the Transit Development Corporation, Inc. (TDC), a nonprofiteducational and research organization established by APTA. TDC isresponsible for forming the independent governing board,designated as the TCRP Oversight and Project Selection (TOPS)Committee.
Research problem statements for TCRP are solicited periodicallybut may be submitted to TRB by anyone at any time It is theresponsibility of the TOPS Committee to formulate the researchprogram by identifying the highest priority projects. As part of theevaluation, the TOPS Committee defines funding levels andexpected products.
Once selected, each project is assigned to an expert panel,appointed by the Transportation Research Board. The panels prepareproject statements (requests for proposals), select contractors, andprovide technical guidance and counsel throughout the life of theproject. The process for developing research problem statements andselecting research agencies has been used by TRB in managingcooperative research programs since 1962. As in other TRB activ-ities, TCRP project panels serve voluntarily without compensation.
Because research cannot have the desired impact if products failto reach the intended audience, special emphasis is placed ondisseminating TCRP results to the intended end users of theresearch: transit agencies, service providers, and suppliers. TRBprovides a series of research reports, syntheses of transit practice,and other supporting material developed by TCRP research. APTAwill arrange for workshops, training aids, field visits, and otheractivities to ensure that results are implemented by urban and ruraltransit industry practitioners.
The TCRP provides a forum where transit agencies cancooperatively address common operational problems. The TCRPresults support and complement other ongoing transit research andtraining programs.
TRANSIT COOPERATIVE RESEARCH PROGRAM
The nation’s growth and the need to meet mobility,environmental, and energy objectives place demands on publictransit systems. Current systems, some of which are old and in needof upgrading, must expand service area, increase service frequency,and improve efficiency to serve these demands. Research isnecessary to solve operating problems, to adapt appropriate newtechnologies from other industries, and to introduce innovations intothe transit industry. The Transit Cooperative Research Program(TCRP) serves as one of the principal means by which the transitindustry can develop innovative near-term solutions to meetdemands placed on it.
The need for TCRP was originally identified in TRB SpecialReport 213—Research for Public Transit: New Directions,published in 1987 and based on a study sponsored by the UrbanMass Transportation Administration—now the Federal TransitAdministration (FTA). A report by the American Public TransitAssociation (APTA), Transportation 2000, also recognized the needfor local, problem-solving research. TCRP, modeled after thelongstanding and successful National Cooperative HighwayResearch Program, undertakes research and other technical activitiesin response to the needs of transit service providers. The scope ofTCRP includes a variety of transit research fields including plan-ning, service configuration, equipment, facilities, operations, humanresources, maintenance, policy, and administrative practices.
TCRP was established under FTA sponsorship in July 1992.Proposed by the U.S. Department of Transportation, TCRP wasauthorized as part of the Intermodal Surface TransportationEfficiency Act of 1991 (ISTEA). On May 13, 1992, a memorandumagreement outlining TCRP operating procedures was executed bythe three cooperating organizations: FTA; the National Academy ofSciences, acting through the Transportation Research Board (TRB);and the Transit Development Corporation, Inc. (TDC), a nonprofiteducational and research organization established by APTA. TDC isresponsible for forming the independent governing board,designated as the TCRP Oversight and Project Selection (TOPS)Committee.
Research problem statements for TCRP are solicited periodicallybut may be submitted to TRB by anyone at any time It is theresponsibility of the TOPS Committee to formulate the researchprogram by identifying the highest priority projects. As part of theevaluation, the TOPS Committee defines funding levels andexpected products.
Once selected, each project is assigned to an expert panel,appointed by the Transportation Research Board. The panels prepareproject statements (requests for proposals), select contractors, andprovide technical guidance and counsel throughout the life of theproject. The process for developing research problem statements andselecting research agencies has been used by TRB in managingcooperative research programs since 1962. As in other TRB activ-ities, TCRP project panels serve voluntarily without compensation.
Because research cannot have the desired impact if products failto reach the intended audience, special emphasis is placed ondisseminating TCRP results to the intended end users of theresearch: transit agencies, service providers, and suppliers. TRBprovides a series of research reports, syntheses of transit practice,and other supporting material developed by TCRP research. APTAwill arrange for workshops, training aids, field visits, and otheractivities to ensure that results are implemented by urban and ruraltransit industry practitioners.
The TCRP provides a forum where transit agencies cancooperatively address common operational problems. The TCRPresults support and complement other ongoing transit research andtraining programs.
TCRP REPORT 25
Project F-4ISSN 1073-4872ISBN 0-309-06074-5Library of Congress Catalog Card No. 97-61387
©1997 Transportation Research Board
Price $20.00
NOTICE
The project that is the subject of this report was a part of the Transit CooperativeResearch Program conducted by the Transportation Research Board with theapproval of the Governing Board of the National Research Council. Suchapproval reflects the Governing Board’s judgment that the project concerned isappropriate with respect to both the purposes and resources of the NationalResearch Council.
The members of the technical advisory panel selected to monitor this project andto review this report were chosen for recognized scholarly competence and withdue consideration for the balance of disciplines appropriate to the project. Theopinions and conclusions expressed or implied are those of the research agencythat performed the research, and while they have been accepted as appropriateby the technical panel, they are not necessarily those of the TransportationResearch Board, the National Research Council, the Transit DevelopmentCorporation, or the Federal Transit Administration of the U.S. Department ofTransportation.
Each report is reviewed and accepted for publication by the technical panelaccording to procedures established and monitored by the TransportationResearch Board Executive Committee and the Governing Board of the NationalResearch Council.
Special Notice
The Transportation Research Board, the National Research Council, the TransitDevelopment Corporation, and the Federal Transit Administration (sponsor ofthe Transit Cooperative Research Program) do not endorse products ormanufacturers. Trade or manufacturers’ names appear herein solely because theyare considered essential to the clarity and completeness of the project reporting.
Published reports of the
TRANSIT COOPERATIVE RESEARCH PROGRAM
are available from:
Transportation Research BoardNational Research Council2101 Constitution Avenue, N.W.Washington, D.C. 20418
and can be ordered through the Internet athttp://www.nas.edu/trb/index.html
Printed in the United States of America

This report will be of interest to transit managers, bus specification engineers, bus manu-facturers, and bus operator workstation component manufacturers and suppliers concernedwith improving the ergonomic design of the bus operator workstation to improve bus oper-ator comfort, and reduce bus operator injuries and related absenteeism and workers’ com-pensation claims. The report provides scientifically validated design guidelines thatergonomically accommodate operators from the 5th percentile female to the 95th percentilemale population. The design guidelines address all aspects of the bus operator workstationincluding the seat, steering assembly, pedals, instrument panels, farebox, and other equip-ment. While attempting to minimize the amount of required component adjustability to con-tain cost, adjustment is included in several key components including instrument panels,seat, and steering assembly. It is estimated that the workstation improvements identified inthe design guidelines would increase the price of a standard transit bus by approximately$6,000, with a payback period of between 3.5 and 8 years based on direct cost savings asso-ciated with estimated reductions in bus operator injuries. Indirect cost savings such as theneed for fewer replacement operators would further reduce this payback period.
The cost associated with bus operator injuries is a major concern of the transit industry.A significant portion of these injuries is associated with inadequate ergonomic design of thebus operator workstation. Injuries that can result from poor design or vibration includecumulative trauma disorders, soft tissue injuries, and musculoskeletal injuries. To reducesuch injuries, bus operator workstations should be ergonomically compatible with the rangeof physical dimensions and functional capabilities of the bus operator population.
The automotive and air transportation industries historically have placed a high priorityon matching equipment to the dimensions and capabilities of the operator. In contrast, busmanufacturers are only recently, concurrent with requests from transit agencies, indicatingthe possibility of major design changes to the operator workstation.
Under TCRP Project F-4, research was undertaken by the Pennsylvania TransportationInstitute (PTI), Pennsylvania State University to develop design guidelines for bus opera-tor workstations using sound ergonomic/biomechanical principles to accommodate the 5thpercentile female to the 95th percentile male of the U.S. adult population, and to validatethe guidelines by testing a full-scale prototype of the workstation. The areas addressed inthe research included the design and location of the operator seat, steering assembly, ped-als, farebox, radio, transfer tray, public address system, sun visor, modesty panel, stan-chions, controls, gauges, and other displays. The employment of control and display tech-nology more advanced than technologies presently in use was encouraged as part of thisresearch to enhance the safety, health, and comfort of bus operators.
To achieve the project objectives, the researchers first reviewed previous bus operatorworkstation design efforts, and conducted a task analysis of bus operators to define howthey interact with the workstation. A bus operator survey was then conducted to obtain rec-ommendations from bus operators on the design and location of workstation elements.Approximately 140 bus operators responded to the survey, and this input was consideredin the development of a workstation design concept. Based on this concept, a mock-up was
FOREWORDBy Staff
Transportation ResearchBoard

constructed and evaluated by over 100 individuals on the basis of several factors, includ-ing visibility, reach, and comfort. In addition, a workshop was held with representatives ofbus manufacturers, and bus operator workstation component manufacturers and suppliersto obtain their important input into the design concept. A CAD-based analysis was then per-formed to validate the workstation design concept that had been developed. Through an iter-ative process, the workstation design guidelines were further refined. A prototype of theworkstation was then constructed on a full-sized transit bus. The prototype was tested andevaluated with the assistance of 24 bus operators on PTI’s closed-course test track. Eachoperator drove the prototype for approximately 2 hours, simulating various operating con-ditions. The driving schedule was similar to a typical transit service route. A video camerarecorded various reaches and driving postures, and other instrumentation recorded vibra-tion and operator force information. In addition, operators were asked for their personalevaluation of the workstation. At the conclusion of the prototype testing, final design guide-lines were developed. These guidelines present the essential features that should beincluded in a workstation. Features include an 18-in. steering wheel, hanging pedals, andinstrument panels divided into 3 areas according to function. Specific dimensional data isprovided to facilitate the use of the guidelines in the specification and construction of futurebuses.
This report represents an executive summary of the research performed in this project.An unpublished companion report, prepared under this project and entitled Bus OperatorWorkstation Evaluation and Design Guidelines-Final Report, provides the details of all thevarious technical analyses performed during the course of the project. This companion doc-ument is available on the World Wide Web in the Transportation category of the NationalAcademy Press’ Reading Room: www.nap.edu/readingroom.

CHAPTER 1. Introduction, 1
CHAPTER 2. Background, 2
CHAPTER 3. Workstation Concept, 2
CHAPTER 4. Operator Workstation Mock-Up and Evaluation, 4
CHAPTER 5. Neutral Seating Reference Point Approach, 6
CHAPTER 6. JACK Simulation, 7
CHAPTER 7. Instrument Panel Design, 9
CHAPTER 8. Prototype Construction, 9
CHAPTER 9. Prototype Testing, 10
CHAPTER 10. Final Design Specifications and Guidelines, 12
CHAPTER 11. Sample Bid Specifications, 13
CHAPTER 12. Benefit-Cost Evaluation, 15
CHAPTER 13. Summary, 17
CHAPTER 14. Conclusions, 20
References, 20
CONTENTS

COOPERATIVE RESEARCH PROGRAMS STAFF
ROBERT J. REILLY, Director, Cooperative Research ProgramsSTEPHEN J. ANDRLE, Manager, Transit Cooperative Research ProgramCHRISTOPHER W. JENKS, Senior Program OfficerEILEEN P. DELANEY, Managing EditorKAMI CABRAL, Production EditorHILARY FREER, Assistant Editor
PROJECT PANEL F-4
DAVID A. LEE, CT Transit (Chair)RUFUS FRANCIS, LACMTABRENDON HEMILY, Canadian Urban Transit AssociationJOHN LUNDELL, University of IowaSORAYA NOLAND, U.S. Postal OfficeELIZABETH SCHNEIDER, New Jersey TransitAARON SCHOPPER, CSERIAC, Wright Patterson AFB, OHMICHAL SETTLES, BARTROGER STEPHENS, U.S. Department of Labor, OSHAJUDY MEADE, FTA Liaison RepresentativeCHARLES T. MORISON, FTA Liaison RepresentativeRICHARD PAIN, TRB Liaison Representative
ACKNOWLEDGMENTS
The work presented herein was made possible through the coop-eration of many companies, transit systems, and individuals. Becauseof confidentiality requirements, the operators who participated in thestudy are recognized anonymously. Bus manufacturer representativeswho provided advice, reviewed research results, and furnished vari-ous bus components include Jim McDowell, NovaBus, Inc.; JohnMoon, Gillig Corp.; Harvey Dick, American Ikarus; Dale Guthrie andMarshall Owen, ThomasBuilt Buses, Inc.; Heinz Schollhammer,Neoplan; and Lance Watt, Flxible. Transit system representativeswho, through their operators, provided feedback include Joe Gilbert,Hugh Mose, and Bob Colton, Centre Area Transit Authority (CATA),State College, Pennsylvania; Flash Quarry, Altoona (Pennsylvania)
Metropolitan Transit; Bill Lloyd, Capitol Area Transit, Harrisburg,Pennsylvania; and Jim Satterfield and Rich Wojnar, Port Authority ofAllegheny County, Pittsburgh, Pennsylvania. CATA supplied the busin which the prototype was constructed. Vendor company represen-tatives who also made the project possible include Hugh McElvaneyand Christian Hammerskjold, USSC; Ed Kreuger, Jeff Newton, andJim Gallagher, Recaro; Doug Studer, National Seating; Ron Ziegler,Seats, Inc.; Bruce Thomas and Forest Swift, Digital Recorders; KimGreen, GFI, ZF Industries; Bob Loper, B & R Mirrors; and theAltoona Bus Testing and Research Center. Of course, behind anygood organization are good individuals. Several individuals shouldbe recognized for their assistance in prototype construction and test-ing: Dave Klinikowski, Dave Fishburn, and Ron Harter.

1
CHAPTER 1. INTRODUCTION
An unusually high rate of absenteeism (sometimes 3 timesas great as the average rate for blue collar workers) and ill-ness occur among transit bus operators (1,2). This has sig-nificantly increased the number of worker’s compensationand disability claims in the transit industry. Many factorscontribute to the higher than normal morbidity and mortalityrates of transit bus operators.
Epidemiological studies have concentrated on identifyingthe primary diseases that strike transit bus operators. Re-searchers have identified three main categories: cardiovas-cular disease, gastrointestinal illness, and musculoskeletalproblems. The most prevalent health problems are musculo-skeletal, relating to neck and back pain (3). Studies havefound that 80.5 percent of operators have experienced somedegree of back and neck pain, compared with 50.7 percent ofnonoperators, and the incidence of reported low back pain is20 percent higher for operators than nonoperators (4). Fre-quent awkward postures, muscular effort, vibration, andshock as well as exposure to whole body vibration and pro-longed sitting in a constrained position contribute to over-working the lumbar spine and its supportive structures, caus-ing low back pain (5).
Several organizations have attempted to design a worksta-tion based on ergonomic principles (6,7 ). Carrier et al. (6 )created a mock-up of a transit bus operator workstation byusing a computer program. This program, developed byGenicom, combines both the statistical approach of buildinga model around three-dimensional “zones” with the theoret-ical modeling approach in which actual subjects are simu-lated by changing numerical parameters. The researchersreceived input from transit authorities, bus manufacturers,and bus operators on the mock-up and presented several rec-ommendations for future workstations.
One of the key findings from Carrier et al. is that steeringwheels, because of their size, interfere with visibility and can“penetrate” the operator’s abdomen or thighs if he or sheattempts to orient the wheel to achieve maximum visibility.The researchers concluded that steering wheel orientationshould be more vertical than horizontal and that it is impos-sible to accommodate 95 percent of the population withexisting components. A primary concern of workstationdesign is the relationship between the seat, steering wheel,
and pedals, with which the operator is required to stay in con-stant contact, because the location of these controls dictatesthe operator’s posture. However, operators have demon-strated leg comfort is a higher priority than arm reach whenpositioning their seats (8).
BC Transit of Vancouver, British Columbia, has ad-dressed some of these concerns (9). BC Transit developed aset of standards that are applied to the workstations of everynew bus it purchases. The modifications include replacingspring suspension seats with pneumatic ride seats, installingtilting and telescoping steering columns, installing power-assist steering, installing left-side convex mirrors, and relo-cating the farebox. These modifications have reduced the fre-quency of workstation-related injuries by 78 percent andhave resulted in an 86 percent reduction in the amount oftime off per injury, which indicates the severity of the injury(5). Similar design requirements have been adopted by Seat-tle Metro (10).
The workstation proposed in this report considers thedesign and location of the seat, steering wheel, pedals, andinstrument panel. To accommodate the entire spectrum of the population, components are made adjustable. However,every adjustment adds cost, which needs to be minimized.The intention of this work is to develop design guidelinesthat minimize actual mechanical adjustment, yet accommo-date the 5th percentile female to the 95th percentile male.
The report is presented in the following manner:
1. A task analysis to ensure reader appreciation of the busoperator’s functions
2. Results from an operator survey to determine theimportance of controls and problems facing operators
3. Evaluation of the concept and component adjustmentsthrough jury evaluation of a laboratory mock-up
4. Investigation of proper adjustment ranges for the busoperator workstation using a scientific approach basedon several design variables and the neutral seating ref-erence point (NSRP)
5. Evaluation and validation of adjustment ranges usingthe JACK human simulation program
6. Testing of a prototype, constructed from a 1973 GMCbus, using 24 bus operators in a driving session withleft and right turns and simulated stops

CHAPTER 2. BACKGROUND
Bucciaglia (11) conducted a task analysis of operators todefine how they interact with the workstation. The analysiswas conducted by direct and video observation of severaloperators in State College, Altoona, Johnstown, and Harris-burg, Pennsylvania. The tasks were broken down into groupsand itemized (Table 2.1).
A survey was developed to obtain recommendations frombus operators on the design and location of workstation ele-ments. The survey was distributed September through Octo-ber 1994 to four transit districts in Pennsylvania. A total of138 operators responded to the survey, and this input wasused to develop the workstation that will be presented later.The average respondent was 175 cm tall, with a standarddeviation of 6.6 cm. The shortest operator was 155 cm, andthe tallest was 196 cm. There were 122 male and 16 femalerespondents. Table 2.2 presents the operators’ responsesrelating to the use of controls. Because the steering wheel andbrake and accelerator pedals are essential and could over-shadow other controls, they were not included in the survey.The top rankings shown are not statistically different fromone another. Also, all operators were presented with the samesurvey; therefore, some ordering effect may be present.
Through open-ended questions, the survey asked the oper-ators to comment on their present vehicle workstations. Thecomments were analyzed through a keyword count to showthe operators’ major concerns. Many operators, particularlylarge operators, complained of hitting the farebox with theirknees or other body parts when ingressing and egressing.Many large males also complained of hitting the steeringwheel, and several operators commented that the seat did nottravel far enough back to allow proper egress. Power steer-ing, plenty of leg room, and a comfortable seat were cited aspositive features. Complicated seat adjustments, lack of out-
2
side mirror controls, and poor layout of controls were citedas elements of deficient workstation design.
CHAPTER 3. WORKSTATION CONCEPT
The objective of the design methodology is to develop aworkstation that will accommodate population extremes,with minimum mechanical adjustment. Priority was given todesign concepts that do not degrade safety. For example, theoperator should be able to keep his or her feet firmly plantedon the pedals, and, for safety reasons, the pedal mountingpoints should be fixed to the bus. Previous approaches sug-gested a movable pedal to accommodate operators of differ-ent heights (6 ). This type of adjustment was discardedbecause of safety concerns. Another objective of the designmethodology is to develop a workstation in which visibility,reach, comfort, and adjustability are enhanced.
This study has suggested novel design concepts for theworkstation components of transit buses (e.g., the steeringwheel, pedals, and instrument panel) to resolve the problemsdescribed by the operators and discussed by other researchers.A systematic design approach was developed to determine theposition, orientation, and adjustment ranges of the compo-nents, which will be discussed in the following section.
The steering wheel was designed in terms of its orien-tation, size, and adjustment mechanism. Carrier et al. (6 )pointed out that the steering wheel should be oriented morevertically than the wheels commonly used. This woulddecrease the range of motion of body parts used to maneuverthe steering wheel (i.e., back, shoulder, elbow, and wrist) forthe typical operator; therefore, his or her fatigue level woulddecrease and the 5th percentile female would be able to oper-ate the steering wheel in a more appropriate and biomechan-ically efficient manner.

As for wheel size, a large horizontal steering wheel whosediameter ranges from 508 to 559 mm causes many operatorsto reach forward and therefore reduce contact and supportbetween the torso and the seat back. Society of AutomotiveEngineers (SAE) J1100 recommends a steering wheel diam-eter of 450 to 560 mm for Class B vehicles. The wheel diam-eter was determined to be 457 mm in this study, which iswithin the recommended range in which operators can main-tain a comfortable posture for steering. Finally, to accom-modate all positions and orientations needed to provide suf-ficient visibility and a comfortable reach for small and largeoperators, the wheel must have three adjustments: (1) a huborientation adjustment, (2) a column telescope adjustment,and (3) a column tilt adjustment at the base of the steeringcolumn. Because an existing steering wheel system providesthe first two adjustments, only a column tilt adjustment wasadded to the wheel assembly.
The selection of pedal style is critical in the pedal design.Currently, the majority of transit buses use treadle pedalswith an orientation angle between 40 and 50 deg (12). Thetreadle pedal allows for little variability for placement of theoperator’s heel, assuming the heel must be at the base of thetreadle pedal for efficient and safe pedal activation. In addi-tion, for most small operators, the extremely steep orienta-tion of the accelerator pedal results in an uncomfortablelower leg posture, which can cause unnatural extension orrotation about the ankle. To resolve the problems resultingfrom the use of treadle pedals, a hanging pedal was used andevaluated in this study. The hanging pedal allows the opera-tor to place his or her the heel at more locations on the work-station platform than the treadle pedal. Using a kinematicmodel developed in this study (Appendix E of the FinalReport), the orientation, activation angle, and location of theaccelerator and brake pedals when a hanging pedal is usedwere determined based on comfortable reach of the right leg.
The instrument panels, which contain displays and con-trols, were investigated in terms of adjustment range, panel
3
layout, size, and location (Appendix F of the Final Report).All instrument panels are adjustable to accommodate visi-bility and a comfortable reach for all bus operators. Displaysand controls are grouped according to function and system-atically arranged into three areas: the left, central, and rightinstrument panels. The left instrument panel provides easyaccess for all operators to secondary controls, or controlsused during predriving tasks:
• Parking brake• Exterior mirror remote adjustment knobs• Exterior mirror defrost control• Internal and external public announcement systems• Radio controls• Run selector knob• Transmission• Ignition switch
The size of the left instrument panel is determined by thespace required for the controls, and the instrument panel islocated in the side and plan views based on comfortablereach of the left arm.
The central instrument panel is intended to provide theoperator with information on the operating status of the bus.Any information that does not require continuous monitoringby a particular gauge is displayed with an indicator light. Toaccommodate tell-tale indicators without giving up 0.95 cmby 1.27 cm of space for each, a small screen that can displayindicators in color and with required alarms is proposed forthe central instrument panel. Because time is a large concernfor operators and an important component of a significantnumber of their duties, a clock is provided. The speedometerand air pressure gauge are the two most regularly monitoreditems on the central instrument panel. For this reason, tradi-tional large dial readouts are provided. The goal of mountingthe instrument panel directly on the steering column is toimprove downward visibility.

Figure 4.2a. Mock-up dimensions, top view. (Lengths arein cm. Reference points were mock-up specific; they werechanged after mock-up evaluation.)
Figure 4.1. View of workstation mock-up: (1) hangingpedals, (2) left instrument panel, (3) right instrument panel,(4) center instrument panel mounted on tilt-telescope-tiltsteering wheel, (5) turn signals and high beams, and (6)farebox.
The right instrument panel contains primary controls fordriving and picking up and depositing passengers. Thesecontrols are placed on this panel because they are used fre-quently and need to be easily accessible to bus operators. Theright instrument panel will contain an operator digital assis-tant (ODA) consisting of a keypad with a small display. TheODA can be used for the following purposes:
• Presenting the bus route schedule• Controlling the farebox• Performing automatic counting and categorization of
fares if used in conjunction with a card reading farebox,performing manual inventorying of passengers if usinga traditional farebox
• Printing transfer tickets• Monitoring fuel efficiency• Changing the destination sign• In the future, possibly linking with the Global Position-
ing System (GPS) for real-time location of buses andplanning routes to avoid delays
Data collected by the ODA can be downloaded easily at theend of the workday to a “home base” computer for analysis.
The dimensions of the right instrument panel are based onthe controls it will contain. Also, comfortable reach of theright arm is considered in determining the location of theright instrument panel.
A minimum visibility marker (an imaginary point in frontof the bus) was used to define the visibility constraint underwhich all controls must be located. The steering wheel waslocated below this constraint, but above a minimum bound-ary layer that surrounds the operator and within comfortablearm reach. The lateral locations of the accelerator and brakepedals were determined in the plan view based on the reach-ability of the operator’s legs, whereas the right and left dash-boards were located in the elevation and plan views based on the reachability of the operator’s arms. This process wasrepeated for the large operator. The required ranges ofadjustment for workstation controls can be extracted from anoverlay of the two resulting workstations.
CHAPTER 4. OPERATOR WORKSTATIONMOCK-UP AND EVALUATION
The workstation mock-up was created to (1) confirm thestandard posture chosen for this design, (2) record the posi-tions of the controls selected by a jury with a wide anthropo-metric range, and (3) verify the workstation’s visibility,reachability, and comfort. The mock-up included the entireworkstation and the first 200 cm of a typical bus. The buswidth was taken to be 244 cm, and the dimensions for thedoors, steps, and fire wall were obtained from a current tran-sit bus. Figure 4.1 presents an actual workstation; Figures4.2a, 4.2b, and 4.2c illustrate the dimensions used in themock-up.
4
Each juror’s height, weight, age, and so on were recorded.The jurors were asked to position the seat and steering wheelso that their feet reached the pedals and they had a down-ward view over the top of the steering wheel as specified byAPTA (13). They were then asked to make final adjustmentsbased on comfort. Their anthropometric joint angles andcomponent adjustments were then recorded. The jurors,after a brief explanation of the controls and tasks, wereinstructed to perform a simulated driving task with a video-tape acting as a prompt for turns and other actions. This wayall jurors performed the same tasks in a quasi-dynamic sim-ulation. The jurors were observed during their simulated driv-ing for their ease of reach. Finally, the jurors evaluated the

Figure 4.2c. Mock-up dimensions, side view (leftinstrument panel not shown). (Lengths are in cm. Referencepoints were mock-up specific; they were changed aftermock-up evaluation. Minimum and maximum adjustmentranges are indicated where two numbers appear.)
Figure 4.2b. Mock-up dimensions, side view (right instrumentpanel not shown). (Lengths are in cm. Angles are in deg. Referencepoints were mock-up specific; they were changed after mock-upevaluation. Minimum and maximum adjustment ranges are indicatedwhere two numbers appear.)
mock-up on the basis of several factors such as visibility,reach, and comfort.
For purposes of data reduction, the jury was divided intoheight categories of small, medium, and large (Table 4.1).The 103 jurors, which consisted of 64 males and 39 females,14 of whom were professional bus operators or transit per-sonnel, evaluated the mock-up. The average small femalewas actually 0.8 cm taller than the 5th percentile female spec-ified in SAE J833; the average large male was 1.5 cm shorterthan the 95th percentile male defined in SAE J833. The stan-
5
dard deviations for both groups extend beyond the 5th per-centile range and the 95th percentile range, respectively. Theweight of the average subject was 74 kg, which compareswell with the SAE J833 value of 73 kg.
The jurors were asked to rate the mock-up for visibility,reach, comfort, and ingress/egress. The evaluation scale wasas follows:
1 = Unsatisfactory2 = Poor3 = Satisfactory4 = Good5 = Very good.
Figure 4.3 shows the jurors’ responses, which show thatno great differences existed between gender or staturegroups. The relative flatness of the plots (with the exceptionof ingress/egress) show that the workstation received similarratings from all population groups. Transit bus operatorstended to evaluate the workstation more highly than non-operators. For all population groups, the subjects were ableto assume postures within anthropometric comfort angles.
The standard deviations for visibility, reach, comfort, andadjustability are close to each other, at values about 0.6. Themeasure of ingress/egress, a topic on which many peopleoffered comments, had a larger standard deviation, a valueabout 1. One reason for this may be that many jurors sug-gested that the seat should swivel. However, a swivel seatmay not provide sufficient mechanical reliability.
From the workstation mock-up evaluation, adjustmentrange results were obtained (Table 4.2). Note that the pre-

liminary computer-aided design (CAD) approach was, ingeneral, a more conservative approach with larger adjust-ment ranges than necessary. Also, the adjustment rangesunder the “Prototype” heading are preliminary values basedon the mock-up and CAD approach. The ranges were laterrefined using the NSRP approach and JACK simulation, dis-cussed later in this summary.
6
CHAPTER 5. NEUTRAL SEATING REFERENCEPOINT APPROACH
The NSRP design approach was a more rigorous approachto designing the bus operator workstation than the prelimi-nary CAD approach discussed earlier. The approach is basedon the NSRP, which is the 50th percentile seat reference
Figure 4.3. Subjective evaluation of mock-up.

point (SRP). The SRP is a point on the sagittal or medialplane of the body located by the intersection of two planes.One of these planes approximates the compressed seat sur-face, and the other plane represents the compressed seatback. The SRP can be represented easily by either the hippivot point (H-point) or seat index point (SIP) (12). Designcriteria for the workstation were based on four ergonomic/biomechanical principles: (1) visibility, (2) reach, (3) comfort,and (4) force. Also, a standard driving posture was assumed,one that enables the joint angles to be in the middle of theestablished comfort ranges of each joint.
A hierarchy of design variables was constructed to definethe workstation systematically. In this study, the workstationwas divided into eight design variables:
1. Seat2. Steering3. Pedals4. Instrument panels5. Mirrors6. Windshield7. Farebox8. Peripheral workspace
After the workstation was divided into these design vari-ables, their hierarchy was established by stratifying them intofour levels:
1. Subsystems2. Sub-subsystems3. Dimensional attributes4. Specific design variables
7
Table 5.1 illustrates part of the hierarchy of design variables.To apply anthropometric characteristics to the workstation
design, 46 anthropometric variables were selected. Thesevariables also were organized into a hierarchy by followingthe same procedures used for the design variables. As thehierarchies of the design and anthropometric variables werebeing constructed, 242 design and 46 anthropometric vari-ables were identified for an ergonomic bus workstationdesign.
Based on a three-point evaluation, functional design rela-tionships for design variables and anthropometric variableswere developed. A functional design relationship of a designvariable is the function that represents the geometric rela-tionship between the design variable and its related designand anthropometric variables. The advantage of the func-tional design relationship is that there is no ambiguity in thefinal design because every workstation design variable isexplicitly determined by defining the geometric relationshipsof the design and anthropometric variables. Figure 5.1 is anexample of the functional relationships developed.
CHAPTER 6. JACK SIMULATION
The workstation designed by the NSRP approach (Figure6.1) was validated using JACK (a CAD-based human simu-lation software package), which incorporated workstationgeometry, three human models (5th percentile female, 50thpercentile person, and 95th percentile male), 17 bus operat-ing tasks, kinematic constraints, and a design evaluationscheme. The kinematic constraints restricted human modelbehavior so that a human performing bus operating taskscould be simulated more realistically. The simulated human

Figure 5.1. Illustration of functional design relationship.
8

Figure 6.1. Transit bus operation workstationimplemented in JACK.
performance for each bus operating task was evaluated interms of visibility, reach, comfort, and adjustability. Basedon the simulation results, the ergonomic workstation designwas suggested, incorporating both adjustment ranges andlocations of bus workstation components. Iterative designmodifications during simulation were made to produce thevalid workstation design. Overall, the workstation is appro-priate for all three human models and can accommodate thethree types of individuals.
CHAPTER 7. INSTRUMENT PANEL DESIGN
When the instrument panel was designed, the type of con-trols, their sizes, and their general arrangement were consid-ered. Initially, buses manufactured by NovaBUS, Neoplan,and GMC, along with a “request for bids” from Seattle Metroand Centre Area Transportation Authority (CATA), in StateCollege, Pennsylvania, were reviewed. The locations andsizes of the controls on the buses’ instrument panels wererecorded. Bus operator survey results were compiled to gaina wider information database. Once the type of controls weredetermined, a taxonomy of controls was developed. Visibil-ity and reach were considered; viewing cones were used forvisibility. Each requirement was based on the populationextremes using SAE guidelines. Next, a hierarchical designvariable approach was used, as was done with the worksta-tion layout. Functional similarity and sequence of use for thecontrols were considered.
This information was used within an algorithm to lay outthe instrument panels. The layout procedure was conductedin three parts: overall layout, intermediate layout, and detaillayout. The overall layout considered frequency of use and
9
importance as the deciding factors. The intermediate layoutapplied the results from the operator survey, also known asstereotypes. The detail layout relied on functional similarity.A representative view of the instrument panel layout isshown in Figure 7.1. More detail on the approach to instru-ment panel layout design appears in Appendix F of the FinalReport.
CHAPTER 8. PROTOTYPE CONSTRUCTION
A 1973 GMC bus with power steering was obtained fromCATA. The bus had the following attributes:
• Treadle pedals• Manual shifter• Pedestal seat• Floor-mounted parking brake• Nonadjustable steering column• Fixed instrument panels• Good visibility
The bus was retrofitted to bring it into accordance with thedesign concept, with a minimum of compromise. Some com-promise, however, was required because of the state of themarket and component availability. For example, the accel-erator was not electronic, such as hanging pedals currentlyavailable on the market. Therefore, a mechanical linkage wasused to transmit motion to the treadle pedal from the hang-ing pedal. The pedestal seat was replaced with a seat selectedby vibration testing, which is discussed later. The floor-mounted parking brake was a problem because no conver-sions exist for it. The parking brake lever arm was shortenedand left in its present location, but a control was placed in theinstrument panel for appearance and to take up the space.
An 18-in. (457-mm) steering wheel for Class B vehicleswas used in the prototype, as specified at the panel/vendorbriefing. The existing steering column was completelyremoved and replaced with a column having a base tilt andtelescope. A farebox shell with no electronics was obtained
Figure 7.1. Overall instrument panel layout.
from a current manufacturer. Also, a reduced version of theODA was implemented. This ODA was able to supply orsimulate many intended ODA functions as well as withstandthe environment.
The mounting location and design of the hanging pedalswere determined (see Appendix E) using the populationextremes of the 5th percentile female to the 95th percentilemale. Acceptable ranges of motion also were considered forthe population extremes.
Seven bus operator seats were evaluated using the Penn-sylvania Transportation Institute (PTI) ride quality simulatorand test track facilities. Seats whose links are pin jointedlinks appeared to have the best performance. Seats whosesuspensions contain a slider appeared to have been subject tosome “stiction” in their motion, which could make suspen-sion movement difficult.
Two seats appeared favorable and provide sufficientadjustment in both the vertical and fore-aft directions. Theseseats also have an independent adjustment for vertical heightand suspension stiffness. One seat isolates vibrations over a broad frequency band, whereas the other was better at attenuating vibrations at the specific resonant frequencies of a seated human. The seat that attenuates vibrations at ahuman’s natural frequency was used for the prototypebecause of concern about lower back injury. More details ofthis evaluation appear in Appendix D of the Final Report andelsewhere (14).
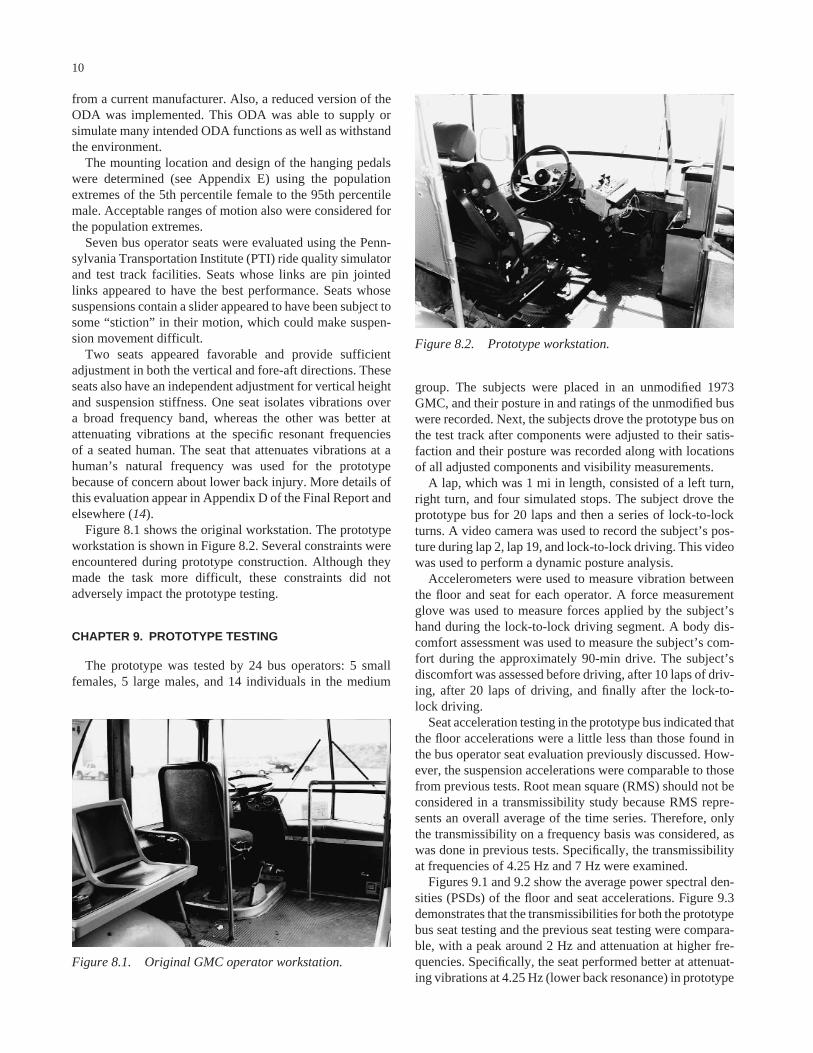
Figure 8.1 shows the original workstation. The prototypeworkstation is shown in Figure 8.2. Several constraints wereencountered during prototype construction. Although theymade the task more difficult, these constraints did notadversely impact the prototype testing.
CHAPTER 9. PROTOTYPE TESTING
The prototype was tested by 24 bus operators: 5 smallfemales, 5 large males, and 14 individuals in the medium
10
group. The subjects were placed in an unmodified 1973GMC, and their posture in and ratings of the unmodified buswere recorded. Next, the subjects drove the prototype bus onthe test track after components were adjusted to their satis-faction and their posture was recorded along with locationsof all adjusted components and visibility measurements.
A lap, which was 1 mi in length, consisted of a left turn,right turn, and four simulated stops. The subject drove theprototype bus for 20 laps and then a series of lock-to-lockturns. A video camera was used to record the subject’s pos-ture during lap 2, lap 19, and lock-to-lock driving. This videowas used to perform a dynamic posture analysis.
Accelerometers were used to measure vibration betweenthe floor and seat for each operator. A force measurementglove was used to measure forces applied by the subject’shand during the lock-to-lock driving segment. A body dis-comfort assessment was used to measure the subject’s com-fort during the approximately 90-min drive. The subject’sdiscomfort was assessed before driving, after 10 laps of driv-ing, after 20 laps of driving, and finally after the lock-to-lock driving.
Seat acceleration testing in the prototype bus indicated thatthe floor accelerations were a little less than those found inthe bus operator seat evaluation previously discussed. How-ever, the suspension accelerations were comparable to thosefrom previous tests. Root mean square (RMS) should not beconsidered in a transmissibility study because RMS repre-sents an overall average of the time series. Therefore, onlythe transmissibility on a frequency basis was considered, aswas done in previous tests. Specifically, the transmissibilityat frequencies of 4.25 Hz and 7 Hz were examined.
Figures 9.1 and 9.2 show the average power spectral den-sities (PSDs) of the floor and seat accelerations. Figure 9.3demonstrates that the transmissibilities for both the prototypebus seat testing and the previous seat testing were compara-ble, with a peak around 2 Hz and attenuation at higher fre-quencies. Specifically, the seat performed better at attenuat-ing vibrations at 4.25 Hz (lower back resonance) in prototype
Figure 8.1. Original GMC operator workstation.
Figure 8.2. Prototype workstation.

Figure 9.2. Prototype average suspension accelerations.
Figure 9.1. Prototype average floor accelerations.
testing, which indicates the validity of the ride quality simu-lator testing.
Seven aspects of the standard bus and prototype bus work-stations were evaluated under static and dynamic drivingconditions:
1. Visibility2. Postural comfort3. Reach4. Adjustability5. Ease of ingress6. Ease of egress7. Ride quality
As indicated earlier, 24 transit bus operators participated inthe evaluation. Three stature groups were defined: the 5th
11
percentile female and the 15th percentile female, defined assmall, and the 85th percentile and larger male, defined aslarge. The jury was composed of about 20 percent smallfemales (a mean height of 158.5 cm) and 25 percent largemales (a mean height of 186.7 cm). The remaining 55 percentfit in the medium size group (a mean height of 172.9 cm).
According to the evaluation, visibility was not signifi-cantly different between the standard bus workstation and the prototype bus workstation for two reasons: (1) the wind-shield height and body frame structure of the standard bus,which provide sufficient downward visibility, were the sameas those of the prototype bus and (2) comfort, reach, adjusta-bility, ease of ingress, and ease of egress were significantlyimproved in the prototype design. All 24 operators rated theprototype bus workstation better than the standard bus work-station for each of these criteria.
The reference point locations of each workstation compo-nent (seat, steering wheel, and left and right instrument pan-els) adjusted by the bus operators were recorded for the stan-dard and prototype bus workstations. The results indicatedthat the seat in the prototype was located at a lower positionand the steering wheel and right instrument panel of the pro-totype were located at a farther and higher location from theseat than those of the design specifications. This producedshoulder and elbow flexion angles during driving that werelarger than the assumed standard driving postures. However,these angles were still within recommended comfort ranges.The stretched-out shoulder-arm posture could be the result ofdriving preferences developed by operators driving buseswith conventional workstations.
Static driving postures were measured in the standard busand prototype bus. The joint angles measured were convertedinto postural comfort scores by using the postural comfortevaluation scheme, which quantifies the magnitude of jointangle deviation from the standard driving posture within the
Figure 9.3. Prototype and seat evaluationtransmissibilities.

corresponding comfort range of motion. The integrated com-fort scores combining the scores of the shoulder, elbow, hip,knee, and ankle are 3.4 out of 5 for the standard bus, 3.9 forthe prototype bus, and 4.2 for the standard driving posture. Itwas determined that the prototype improved the shoulder andelbow flexion angles for holding the steering wheel by pro-viding a steering column telescope-tilt mechanism and asmaller (18 in. in diameter) steering wheel for the operators.
Dynamic driving postures in the prototype workstationwere analyzed to evaluate bus operators’ continuously chang-ing postures as they maneuvered the prototype. The elbowand shoulder movements were graded into comfort scoresaccording to the postural comfort evaluation scheme. Thecomfort scores of both static and dynamic driving postureswere used to identify significance of stature, joint (elbow andshoulder), and test condition (static and dynamic driving)effects. Only the joint effect was found to be significant; theother effects were insignificant. This indicated that the shoul-der comfort scores were significantly lower than the elbowscores for all three stature groups regardless of test condition(static or dynamic). In turn, this result implies that the proto-type workstation provided statistically equivalent amounts ofpostural comfort for the different size operators throughoutthe testing.
Body part discomfort was evaluated four times using a rat-ing scale from 7 (most comfortable) to 27 (most uncomfort-able) during the course of prototype testing:
1. Before driving2. After driving 10 laps on the oval track3. After driving 20 laps on the oval track4. After completing all driving (after lock-to-lock driving)
Increasing negative numbers indicated increasing discom-fort during the course of testing. This trend was found for theupper and lower back, left and right hip/thigh regions, rightknee, right ankle, and right foot. The first four are primarilyinfluenced by seat design. Thus, even though, based on vibra-tion isolation, the best of the available seats was selected, theseat still may not be optimum and may lead to fatigue overtime. On the other hand, the comfort of the right knee, ankle,and foot do depend primarily on pedal design. In this partic-ular case, the original mechanical design with a high accel-erator spring constant limited the positive effects of the hang-ing pedal design. Small operators experienced a significantincrease in discomfort during 10 laps of oval track driving;however, only a slight discomfort change for the rest of thedrive indicated that the greatest changes were experienced inthe lower back and right and left hip/thigh regions. All theseare most affected by seat design (including seat pan lengthand seat pan width) and least by workstation design.
RMS grip forces during prototype bus testing ranged from0.9 percent to 9.4 percent (with a mean value of 5.8 percent)as normalized to each individual’s maximum grip force,which indicates that no evidence for muscle fatigue in grip
12
exertions during steering in the prototype bus could be found.In terms of the relative proportion of maximum grip forceused when steering the prototype workstation, there was notany significant gender, stature, or transit experience effect(i.e., females or small individuals did not use more than theiravailable maximum grip force than did males or large indi-viduals). Similarly, novice bus operators did not use moreforce than did experienced bus operators. This is a goodresult from the standpoint of developing cumulative traumadisorders (CTDs). In many industries, new and inexperi-enced employees may exert force levels that are higher thannecessary and thus become more susceptible to CTDs.
CHAPTER 10. FINAL DESIGN SPECIFICATIONSAND GUIDELINES
The workstation should contain several features that areessential for accommodating the population extremes. Fig-ures 10.1 through 10.4 are photographs of the prototypeworkstation. The essential features of the workstation are asfollows:
• A 457-mm (18-in.) steering wheel• Hanging pedals• Tilt-telescoping steering column (minimum require-
ment); tilt-telescoping-tilt steering column (ideal)• Low-profile farebox (not to exceed 91.4 cm [36 in.])• Pin joint suspension operator seat• Seat with air-actuated lumbar and back side bolster sup-
port features (preferred)• Turn signal platform located on the floor angled at 30
deg housing the turn signals and high beam switch• Adjustable (height and fore-aft) instrument panels
divided into left, center, and right • An ODA to act as the central interface to the bus elec-
tronics system• Remotely activated mirrors
Figure 10.1. Left and right instrument panels.

• Annunciator system that allows push-button activationof prerecorded announcements (preferred); “hands-free” communication system (ideal)
The following figures and tables detail the necessary loca-tions and adjustment ranges for the proposed workstationdesign. Figures 10.5, 10.6, and 10.7 are illustrations of thelocations listed in Table 10.1. The reference points are listedin terms of 5th percentile female, 50th percentile person, and95th percentile male and are defined in Table 10.2. Table10.3 details all the design specifications necessary for theworkstation.
CHAPTER 11. SAMPLE BID SPECIFICATIONS
The workstation’s components will be adjustable toaccommodate operators who range in stature from the 5thpercentile female to the 95th percentile male as defined by
13
SAE J833. The adjustable components include the seat,steering wheel, left instrument panel, and right instrumentpanel. The adjustment ranges are to be measured relative toeach component’s reference point as defined in Table 10.2.
The origin of the workstation (i.e., the datum) is denotedas the workstation origin and defined to be the SRP for the50th percentile person (NSRP) projected onto the bus opera-tor’s platform. Relative to the workstation origin, the SRPwill be adjustable ±9.3 cm in the horizontal direction andfrom 29.6 cm to 43.9 cm from the operator’s platform in thevertical direction. The SRP for the 50th percentile personwill be located a vertical distance of 36.7 cm from the oper-ator’s platform. No lateral distance will exist between theSRP and the workstation origin. The seat suspension shall bea pin-jointed linkage type. Features such as air-actuated lum-bar and back side support are preferred.
The steering wheel location is defined by the steeringwheel reference point (SWRP). Relative to the workstationorigin, the SWRP is to range from a location of 48.8 cm inthe horizontal and 63.2 cm in the vertical to a point locatedat 39.8 cm in the horizontal and 69.5 cm in the vertical. TheSWRP for the 50th percentile person is located midwaybetween the extremes. No lateral distance will exist betweenthe SWRP and the workstation origin. The steering wheeldiameter will be 457 mm.
The left instrument panel is to contain the secondary con-trols or controls that are used during predriving tasks. Thesecontrols are the parking brake, exterior mirror remote ad-justment knobs, exterior mirror defrost control, internal and external public announcement systems, radio controls,run selector knob, transmission, and ignition switch. Theannouncement system preferably should be one that allowspush-button activation of prerecorded stop announcementsor one that is a hands-free microphone system. The dimen-sions of the left instrument panel are determined by thespace required for the controls. The LIPRP is defined inTable 10.2. Relative to the workstation origin, the LIPRP is
Figure 10.2. Center instrument panel.
Figure 10.3. Hanging pedals.
Figure 10.4. Prototype workstation.

to range from a location 43.1 cm in the horizontal and 47.6cm in the vertical to a point located 33.2 cm in the horizon-tal and 51.6 cm in the vertical. The LIPRP for the 50th per-centile person is located midway between the extremes. Theleft instrument panel is to be inclined at an angle of 5 deg.The LIPRP is located 33.0 cm laterally from the workstationorigin.
The right instrument panel contains primary controls fordriving and picking up and depositing passengers. Thesecontrols are placed on this panel because they are used fre-quently and need to be easily accessible to bus operators. Thedimensions of the right instrument panel are based on thecontrols it will contain.
The right instrument panel will contain a keypad with asmall displayCan ODA. The functions that can be accom-plished through the ODA include the following:
• Presentation of the bus route schedule• Control of the farebox• Automatic counting and categorization of fares if used
in conjunction with a card reading farebox or manualinventorying of passengers is used with a traditionalfarebox
• Printing of transfer tickets• Monitoring of fuel efficiency• Changing of the destination sign
14
• In the future, linking with an inertial navigation systemfor real-time location of buses and planning of properrouting to avoid delays
The data collected by the ODA can be downloaded easilyat the end of the workday to a home-base computer for analy-sis. The RIPRP is defined in Table 4.2. Relative to the work-station origin, the RIPRP is to range from a location 51.9 cmin the horizontal and 65 cm in the vertical to a point located38.6 cm in the horizontal and 69.5 cm in the vertical. TheRIPRP for the 50th percentile person is located midwaybetween the extremes. The right instrument panel is to beinclined at an angle of 30 deg. The RIPRP is located 37 cmlaterally from the workstation origin.
The center instrument panel gives the operator the status of the workings of the bus. Any information that does notrequire continuous monitoring by a particular gauge (e.g.,speed) is replaced with an indicator light. To accommodatetell-tale indicators without giving up 0.95 cm by 1.27 cm ofspace for each, the center instrument panel will have a smallscreen that can display any of these indicators with the colorsand required alarms. Because time is a major concern foroperators and a significant factor in their duties, a clock is pro-vided. The two most regularly monitored items on the centerinstrument panel are the speedometer and air pressure gauge.For this reason, traditional, large dial readouts are provided.
Figure 10.5. Specifications, plan view.

The intention of mounting the instrument panel directly onthe steering column is to facilitate downward visibility.
Pedals will be the hanging type. Relative to the worksta-tion origin, the brake pedal plate reference point (BPPRP)will be located laterally 8.9 cm to the right, 86.6 cm forward,and 11.6 cm above the operator’s platform. Relative to theworkstation origin, the accelerator pedal plate referencepoint (APPRP) will be located laterally 21.8 cm to the right,86.4 cm forward, and 9 cm above the operator’s platform.
A turn signal platform will be mounted on the operator’splatform to accommodate left-foot-actuated turn signals andhigh beams as well as the stop announcement switch. Theplatform will be angled at 30 deg.
The farebox will be electronically connected to the ODA.The farebox shall be located in a position so that obstructionof the operator’s view is minimized. Therefore, a locationshall be provided in the bus so that the farebox can be placedwith minimal obstruction. The top of farebox shall notexceed 91.4 cm (36 in.) from the floor.
12. BENEFIT-COST EVALUATION
Benefit-cost analysis is a quantitative methodology usedfor justifying the expenditure of funds for controlling a prob-
15
lem situation or, more simply, the dollars spent per negativeutility reduction (15). Cost can be defined as the monetaryoutlay for the incorporation of a device, method, or pro-cedure for a given period. In this particular study, costsincluded materials, components, and labor associated withdeveloping the recommended bus operator’s workstation.
A negative utility or dollar cost is associated with everyinjury. This cost could include direct costs, such as for med-ical expenses and worker’s compensation, and indirect costs,such as for lost time and replacement operator training. A benefit is defined as the reduction in the negative utilityand the decrease in injuries and medical costs. The effec-tiveness of a corrective measure is evaluated by the ratio ofbenefit to cost, with larger numbers indicating better utilityor effectiveness.
Costs
Many factors need to be included in estimating the costsof the prototype bus workstation. The proposed workstationcontains instrument panels that move, which will result inincreased maintenance. Also, the wires and cable going intothe instrument panels will require sheathing to protect themfrom vandalism and large loops to prevent failure due to
Figure 10.6. Specifications, side view (left instrument panel and right instrument panel not shown).(Solid lines denote 50th percentile positions.)

Figure 10.7. Specifications, side view (steering wheel not shown). (Solid lines denote 50th percentilepositions.)
fatigue. The instrument panel supports will have to be strongenough to withstand the vibrations generated on a typicaltransit bus route. During development of the workstationdesign guidelines, attention was paid to these issues. Ofcourse, each manufacturer will have its own method forimplementation.
Costs associated with the ergonomic workstation weredeveloped based on the costs incurred in the development ofthe prototype workstation. The costs for the prototype’smaterials, parts, components, and labor totaled $6,131.
Benefits
Benefits of the recommended workstation were estimatedbased on information from Connecticut Transit (CTTRAN-SIT) and BC Transit. CTTRANSIT experienced 32 injuriesamong 515 employees in a 6-month period. This amounts toa yearly injury rate of 12.43 per 100 workers, or an injury rateof 0.1243 per worker.
16
CTTRANSIT spent $87,000 ($42,000 in direct medicalcosts and $45,000 in worker’s compensation costs) for these32 injuries, at an average cost of $2,718 per injury. Data fromBC Transit indicated average direct costs of $5,962 perinjury. These costs were primarily for back injuries (whichtend to be more expensive than other types of injuries) result-ing from frequent occurrences of the seats bottoming out.
The projected decrease in injuries due to the redesignedergonomic operator’s workstation is based on data from BCTransit. The agency installed upgraded seats and made ad-ditional workstation modifications. In the year following the implementation, BC Transit experienced a 78 percentdecrease in the injury rate (from 1.92 to .43 per 1 million km)and an 88 percent decrease in the injury severity rate (from29.42 to 2.72 days lost per 1 million km). These values aresimilar to those obtained by another industry. More specifi-cally, during a 3-year period after implementation of anergonomic program (workstation redesign, tool changes, andtraining) in an automobile carpet manufacturing facility, thenumber of injuries decreased by 74 percent. Therefore, a pro-jected injury reduction rate of 80 percent for this prototype isnot unusual.
Benefit-Cost
The benefit-cost ratio is defined as the dollar cost reduc-tions per workstation implemented per cost of a workstation:

Typically one bus is used for approximately 14 shifts aweek. With each operator working 5 shifts a week, wewould expect 14⁄5 = 2.8 operators per bus. The injury rate perworker from CTTRANSIT is 0.1243. Average injury costsrange from $2,718 to $5,962, and an 80 percent injuryreduction is expected. This results in a cost-benefit ratioranging from
2.8 3 0.1243 3 $2,718 3 0.8/$6,131 5 0.123
to
2.8 3 0.1243 3 $5,962 3 0.8/$6,131 5 0.27
These are calculated on a yearly basis; therefore, takingthe inverse would result in the number of years it would taketo pay off the cost of a workstation that decreases medicalcosts. The payoff time would range from 1⁄0.27 = 3.69 to 1⁄0.123 =8.1 years. These values are probably low and payoff timecould be expected to be shorter because of several variablesthat are difficult to account for in the direct calculations.Only direct costs are used. There are many indirect costs,such as for lost time, replacement operators, and training for
# operators(shifts)bus
injury_rate_per_worker average_injury_cost %_reduction
workstation_cost
{ } × { } × { } × { }
17
replacement operators, that affect a transit authority. Also,medical and hospitalization costs have been skyrocketingduring the past few years and will likely continue to do so.Therefore, these costs may be considerably low and payofftime may be considerably faster.
CHAPTER 13. SUMMARY
This report presents a transit bus operator workstationintended to accommodate a population from the 5th per-centile female to the 95th percentile male. The approachtaken to develop the workstation was to develop an appreci-ation of the operator’s tasks and an understanding of currentworkstations through use of a survey and from direct obser-vation. Use of hanging pedals, which are believed to providebetter comfort for small operators, was considered.
A preliminary layout of the transit bus operator worksta-tion was developed using various CAD tools along with scale-model mannequins oriented in the preferred driving posture.This resulted in approximate design values and adjustmentranges needed to nominally satisfy the bus operator popula-tion ranging from the 5th percentile female to the 95th per-centile male. The resulting adjustment ranges are listed inColumn 1 of Table 13.1.
A laboratory mock-up based on preliminary CAD designvalues was constructed and evaluated by a jury of more than

100 people, who were grouped according to stature and gen-der. The average height of the small female was close (withina standard deviation) to that for the 5th percentile female.The average height of the large male was close (within a stan-dard deviation) of the 95th percentile male. Therefore, thepopulation extremes were included in the evaluation and, tosome extent, were overrepresented compared with the gen-eral population.
18
The resulting user preferences were tabulated in frequencydistributions from which the mean values and 5th percentiletails (i.e., z.05 and z.95) were calculated. The correspondingparameter values provided the two extreme values for deter-mining the required adjustment range. These values are tab-ulated in Column #2 of Table 13.1. For most components, thevalues are actually slightly smaller than initially proposedunder the preliminary CAD design. Only the seat fore-aft

range was larger than expected because of several outliers(i.e., small females choosing extremely close-up seat posi-tions). However, overall, the workstation was able to accom-modate a population ranging from the 5th percentile femaleto the 95th percentile male.
Evaluations indicated that, on average, jury members weresatisfied with the preliminary design in terms of visibility,reach, comfort, and adjustability. These ratings are consistentfor all population groups. The standard deviations for thesesubjective ratings are consistent between population groupsand subjective measures.
Next, the JACK program was used to validate the designspecifications. The workstation layout was imported intoJACK, and simulations of typical driving tasks using 5th per-centile female and 95th percentile male models were under-taken. The workstation components were adjusted as neededto accommodate the different size models, resulting in theadjustment ranges (with a precision of +1 cm) shown in Col-umn 3 of Table 13.1. These values corresponded closely topreviously selected design variables, again validating previ-ous design strategies.
A scientific approach using the NSRP was used to deter-mine the key design variables. This procedure yielded thefinal design values (the adjustment ranges of which areshown in Column 4 in Table 13.1) used in prototype con-struction and evaluation. Again, these values were, in mostcases, very close to the values found in the previous stages(Columns 1, 2, and 3 in the table). Also, the preliminary CADapproach involved a discrete simulation using two man-nequins, whereas the mock-up included postural differencesas well as the variation of subject limb lengths. JACK was a discrete simulation with finite resolution. The NSRPapproach was much more precise and accurate. In a graphictechnique, the accuracy may be ± 5 deg to 10 deg, but in theNSRP approach, specific angles were considered.
19
The prototype was constructed in a 1973 GMC bus. Anydeviations in adjustment ranges, such as for some of theinstrument panels, were due to limitations of the mechanicalstructure of the existing bus. The reduced steering wheel tele-scoping range resulted from current technological limitationsof commercially available telescopic columns.
The purpose of the prototype was to evaluate the perfor-mance of the workstation under actual operating conditions ona closed course. A closed course was chosen because of safetyconsiderations, but represented a typical transit bus operatingcycle (four stops/mi and average speed of about 15 mph).Because the prototype was constructed on an existing plat-form, it required compromise in some actual features. Forexample, the steering gear box location was fixed and couldnot be moved. This caused some of the workstation compo-nents to be located closer than desired; however, it alsoshowed that if the workstation can be built in this existing plat-form, the workstation can be constructed on most platforms.The seat for the workstation was a commercial unit selectedbased on vibration isolation properties. The benefit-cost ratioof the workstation as built in the prototype is favorable.
According to the bus operators who tested the prototype,visibility was not significantly different between the standardbus workstation and the prototype workstation. This can beattributed to the fact that windshield height and body framestructure of the standard bus, which provide sufficient down-ward visibility, were the same as the prototype, whereasevery other characteristic (comfort, reach, adjustability, andease of ingress and egress) was significantly improved in theprototype design. All 24 operators rated the prototype betterthan the standard bus workstation for each of these criteria.
The results indicated that the seat in the prototype waslocated at a lower position and the steering wheel and rightinstrument panel of the prototype were located at a farther andhigher location from the seat than those of the design specifi-

cations. This produced larger shoulder and elbow flexionangles during driving than the assumed standard driving pos-tures. However, these angles were within recommended com-fort ranges. The stretched-out shoulder-arm posture could bethe result of an operator’s driving preference that developedfrom driving buses with conventional workstations.
Test results indicated the acceptance of the redesignedworkstation by 24 bus operators from various transit sys-tems. The small females did experience some discomfort andan increase in discomfort over time; however, it is believedthat this discomfort stemmed from the seat, which wasbeyond the control of the project. The other populationgroups remained relatively comfortable throughout the test.The force required to actuate the accelerator pedal did causesome discomfort for the operators; however, again, this wasa factor beyond the control of the project because the exist-ing accelerator linkage had to be used.
CHAPTER 14. CONCLUSIONS
The conclusions from this research are as follows:
• The bus operator workstation can be redesigned using er-gonomic principles to accommodate individuals rangingfrom the 5th percentile female to the 95th percentile male.
• The prototype designed and constructed for this projectwas judged superior to the existing workstation by a rep-resentative jury of bus operators.
• It is estimated that the additional cost of incorporating innew buses the final design guidelines developed in thisresearch will be more than offset by savings in terms ofreduced operator injuries and worker’s compensationclaims.
This work resulted in guidelines for the design of a bus operator workstation that accommodates populationextremes. This report develops the guidelines through rigor-ous analysis, synthesis, and testing. The guidelines are pre-sented in two formats: (1) a simple-to-use version that isessentially a set of engineering drawings that can be incor-porated directly into a bus specification and (2) a set of func-tional relationships that serve as guidelines for the design ofworkstations with specific features and requirements.
Future enhancements can be designed into the workstationas costs permit. Some of these enhancements are as follows:
• A memory that allows operators to type a number intothe ODA to move components automatically to presetlocations
• Active vibration control in the seat to accommodate awide variety of road conditions (e.g., roughness) and allpopulation ranges
• A seat pan that is sufficiently adjustable to accommo-date all population ranges
• A steering wheel tilt
The prototype constructed in this work did not include asteering wheel tilt because a suitable commercial product
20
could not be located; however, a steering wheel tilt wouldimprove visibility as well as comfort.
To develop a further understanding of the issues involvedand to develop cost-effective solutions, more research isneeded. Each aspect of this project could be expanded tobecome a research project unto itself. Recommendations forfuture research include the following:
• Development of an anthropometric dataset focused onthe industry. This would allow refinement of the afore-mentioned guidelines.
• A critical in-depth study of seating comfort, includingvibrations and long-term static comfort. This studyshould identify how operator manipulation of controlsaffects vibration levels. In addition, vibration levelsfound in a typical transit bus should be characterized.
• Future studies focusing on the entire bus and its layoutto supplement this project, which dealt with the opera-tor’s immediate work area. For example, can the fareboxbe reconfigured to provide more visibility and room? Is the door in the optimal location? Are the vehicle’sdynamic properties such as its pitch natural frequencyoptimal?
• Development of programs to educate operators aboutergonomics, safe postures, and proper use of equipment,such as the seat, that has a variety of adjustments.
REFERENCES
1. Evans, G.W. Working on the Hot Seat: Urban Bus Operators.Accident Analysis and Prevention, Vol. 26, No. 2, 1994, pp.181–193.
2. Winkleby, M.A., D.R. Ragland, J.M. Fisher, and S.L. Syme.Excess Risk of Sickness and Disease in Bus Drivers: A Reviewand Synthesis of Epidemiological Studies. International Jour-nal of Epidemiology, Vol. 17, No. 2, 1988.
3. Patterson, P.K., T.L. Eubanks, and R. Ramseyer. Back Dis-comfort Prevalence and Associated Factors Among Bus Driv-ers. AAOHN Journal, Vol. 34, No. 10, 1986, pp. 481–484.
4. Anderson, R. The Back Pain of Bus Drivers, Prevalence in anUrban Area of California. Spine, Vol. 17, No. 12, 1991, pp.1481–1488.
5. Bovenzi, M., and A. Zadini. Self-Reported Low Back Symp-toms in Urban Bus Drivers Exposed to Whole-Body Vibration.Spine, Vol. 17, No. 12, 1992, pp. 1048–1059.
6. Carrier, R., R. Gilbert, and P. Gourmain. Ergonomic Study ofthe Driver’s Workstation in Urban Buses. STRP Report 6.Canadian Urban Transit Association, Toronto, 1992.
7. Courtney, A.J., and W.A. Evans. A Preliminary Investigationof Bus Cab Design for Cantonese Drivers. Journal of HumanErgology, Vol. 16, 1987, pp. 163–171.
8. Philippart, N.L., T.J. Kuechenmeister, and J.M. Stanick. TruckDriver Selected Seat Position Model. SAE 861131. Society ofAutomotive Engineers, Warrendale, PA, 1986.
9. Krantz, G. Driver Workstation Upgrade on BC Transit Buses.Unpublished report. BC Transit, Vancouver, British Columbia,1994.
10. Request for Proposals, Manufacture and Delivery of HeavyDuty Transit Motor Buses. Contract MB 94-1. Seattle Metro-politan Transit Authority, Seattle, WA, 1993.

11. Bucciaglia, J. Transit Bus Operator Workstation Design Syn-thesis and Analysis. Master’s thesis. Pennsylvania State Uni-versity, University Park, PA, 1995.
12. Diffreint, N., A.R. Tilley, and D. Harman. Human Scale 7/8/9.The MIT Press, Cambridge, MA, 1981.
13. Baseline Advanced Design Transit Coach Specifications: AGuideline Procurement Document for New 35- and 40-Foot
21
Coach Dimensions. American Public Transit Association,Washington, D.C., 1977.
14. Oesterling, B.P. Evaluation of Transit Bus Operator SeatsBased on Vibration Isolation. Master’s thesis. PennsylvaniaState University, University Park, PA, 1997.
15. Brown, D.B. Systems Analysis and Design for Safety. Prentice-Hall, New York, 1976.

THE TRANSPORTATION RESEARCH BOARD is a unit of the National Research Coun-cil, which serves the National Academy of Sciences and the National Academy of Engineering. TheBoard’s mission is to promote innovation and progress in transportation by stimulating and conduct-ing research, facilitating the dissemination of information, and encouraging the implementation ofresearch results. The Board’s varied activities annually draw on approximately 4,000 engineers, sci-entists, and other transportation researchers and practitioners from the public and private sectors andacademia, all of whom contribute their expertise in the public interest. The program is supported bystate transportation departments, federal agencies including the component administrations of theU.S. Department of Transportation, and other organizations and individuals interested in the devel-opment of transportation.
The National Academy of Sciences is a private, nonprofit, self-perpetuating society of distin-guished scholars engaged in scientific and engineering research, dedicated to the furtherance of sci-ence and technology and to their use for the general welfare. Upon the authority of the charter grantedto it by the Congress in 1863, the Academy has a mandate that requires it to advise the federal gov-ernment on scientific and technical matters. Dr. Bruce M. Alberts is president of the National Acad-emy of Sciences.
The National Academy of Engineering was established in 1964, under the charter of the NationalAcademy of Sciences, as a parallel organization of outstanding engineers. It is autonomous in itsadministration and in the selection of its members, sharing with the National Academy of Sciencesthe responsibility for advising the federal government. The National Academy of Engineering alsosponsors engineering programs aimed at meeting national needs, encourages education and research,and recognizes the superior achievements of engineers. Dr. William A. Wulf is president of theNational Academy of Engineering.
The Institute of Medicine was established in 1970 by the National Academy of Sciences to secure the services of eminent members of appropriate professions in the examination of policymatters pertaining to the health of the public. The Institute acts under the responsibility given to theNational Academy of Sciences by its congressional charter to be an adviser to the federal governmentand, upon its own initiative, to identify issues of medical care, research, and education. Dr. KennethI. Shine is president of the Institute of Medicine.
The National Research Council was organized by the National Academy of Sciences in 1916 toassociate the broad community of science and technology with the Academy’s purpose of furtheringknowledge and advising the federal government. Functioning in accordance with general policiesdetermined by the Academy, the Council has become the principal operating agency of both theNational Academy of Sciences and the National Academy of Engineering in providing services to thegovernment, the public, and the scientific and engineering communities. The Council is administeredjointly by both Academies and the Institute of Medicine. Dr. Bruce M. Alberts and Dr. William A.Wulf are chairman and vice chairman, respectively, of the National Research Council.
Abbreviations used without definitions in TRB publications:
AASHO American Association of State Highway OfficialsAASHTO American Association of State Highway and Transportation OfficialsAPTA American Public Transit AssociationASCE American Society of Civil EngineersASME American Society of Mechanical EngineersASTM American Society for Testing and MaterialsFAA Federal Aviation AdministrationFHWA Federal Highway AdministrationFRA Federal Railroad AdministrationFTA Federal Transit AdministrationIEEE Institute of Electrical and Electronics EngineersITE Institute of Transportation EngineersNCHRP National Cooperative Highway Research ProgramNCTRP National Cooperative Transit Research and Development ProgramNHTSA National Highway Traffic Safety AdministrationSAE Society of Automotive EngineersTCRP Transit Cooperative Research ProgramTRB Transportation Research BoardU.S.DOT United States Department of Transportation