Embed Size (px)
Citation preview
Government of the District of Columbia
Muriel Bowser Mayor
Fitzroy Lee
Chief Financial Officer
Tax Rates and Tax Burdens
In the District of Columbia -
A Nationwide Comparison
2019
Issued April 2021

(This page intentionally left blank)
Executive Summary
2019 Tax Rates and Tax Burdens in the District of Columbia: A Nationwide Comparison
iii
Table of Contents
Tax Rates and Tax Burdens in the District of Columbia:
A Nationwide Comparison
Table of Contents ......................................................................................................................... iii
Listing of Charts, Tables, and Maps .......................................................................................... iv
Executive Summary ..................................................................................................................... vi
Acknowledgment .......................................................................................................................... ix
Part I: Tax Burdens in Washington DC Compared with Those in the Largest City in Each
State, 2019..……………………………………………………………………………………….1
Overview………………………………………………………………………………………….2
Why Do Tax Burdens Differ From One City to Another?.………………………………………3
Chapter I: How Tax Burdens are Computed for the Largest City in each State ................... 5
Individual Income Tax ........................................................................................................ 6
Real Property Tax ................................................................................................................ 8
Sales and Use Tax ............................................................................................................. 11
Automobile Taxes ............................................................................................................. 12
Chapter II: Overall Tax Burdens for Hypothetical Families in the Largest City in Each
State .............................................................................................................................................. 13
Chapter III: Comparing Specific Tax Burdens for a Hypothetical Family of Three in the
Largest City in Each State ......................................................................................................... 25
Individual Income Tax ...................................................................................................... 25
Real Property Tax .............................................................................................................. 31 Sales and Use Tax ............................................................................................................. 38
Automobile Taxes ............................................................................................................. 42
Chapter IV: How Do Tax Burdens in Washington DC Compare with Those in the Largest
City in Each State?...................................................................................................................... 46
Individual Income Tax ...................................................................................................... 46
Real Property Tax .............................................................................................................. 47
Sales and Use Tax ............................................................................................................. 48
Automobile Taxes ............................................................................................................. 48
Summary ........................................................................................................................... 48
Part II: A Comparison of Selected Tax Rates in DC with Those in the 50 States ................ 51
Tax Rate Comparisons at a Glance……………………………………….…………….……..52
Appendix... ................................................................................................................................... 71
Office Locations and Telephone Numbers ............................................................................... 79
Listing of Charts, Tables, and Maps
Charts
Charts 1a-e: 2019 Estimated Burdens of Major Taxes for 5 Hypothetical Families……......14-22
Chart 2: 2019 Income Tax Burdens for All Income Levels, Sorted by Highest Income Level .. 27
Chart 3: Residential Property Tax Rates in the Largest City in Each State, 2019 ...................... 34
Chart 4: 2019 Property Tax Burdens for All Income Levels, Sorted by Lowest Income Level . 37
Chart 5: Composition of State and Local General Sales Tax Rates in Each of the 51 Cities as of
December 31, 2019………………………………………………………………………………39
Chart 6: 2019 Auto Tax Burdens, Family Earning $75,000/year………………………...…….45
Chart 7: Combined 2019 Tax Burdens at Each Income Level; Comparison of DC and the
Average of the 50 Cities................................................................................................................50
Tables
Tables 1a-e: 2019 Estimated Burdens of Major Taxes for 5 Hypothetical Families………..15-23
Table 2: States That Index Some Part of Their Individual Income Tax, 2019……………..…...29
Table 3: State and Local Income Tax Burden as a Percent of Income in the Largest Cities by
Type of Income Tax for a Hypothetical Family of Three, 2019…………………………………30
Table 4: Residential Property Tax Rates in the Largest City in Each State 2019........................ 33
Table 5: Housing Value Assumptions, 2019 ............................................................................... 35
Table 6: Cities That Allow Exemptions or Reduced Rates in the Calculation of Real Estate
Taxes for Homeowners, 2019 ....................................................................................................... 36
Table 7: State and Local General Sales Tax Rates in Each of the 51 Cities as of December 31,
2019............................................................................................................................................... 40
Table 8: Cumulative Tax Rates on Gasoline in the 51 Cities as of December 31, 2019……..…43
Table 9: Summary of Types of Automobile Registration Taxes 2019 ........................................ 44
Table 10: Automobile Tax Assumptions 2019 ............................................................................ 44
Table 11: Tax Burdens in Washington, DC for a Hypothetical Family Compared with the
Average for the Largest City in Each State by Income Level, 2019 ............................................ 49
Table 12: Comparison of Selected State Tax Rates ..................................................................... 52
Table 13: Individual Income Tax Washington Metropolitan Area .............................................. 53
Table 14: Individual Income Tax 43 States and the District of Columbia .................................. 54
Table 15: Characteristics of State Individual Income Taxes ....................................................... 58
Table 16: State Corporate Income Tax Rates .............................................................................. 60
Table 17: State Gross Premiums Tax Rates on Foreign (Out-of-State) Life Insurers ................. 61
Table 18: State General Sales and Use Tax Rates ....................................................................... 62
Table 19: State Beer Tax Rates .................................................................................................... 63
Table 20: State Light Wine Tax Rates ......................................................................................... 64
Table 21: State Distilled Spirits Tax Rates .................................................................................. 65
Table 22: State Cigarette Tax Rates ............................................................................................. 66
Table 23: State Gasoline Excise Tax Rates ................................................................................. 67
Table 24: State Motor Vehicle Sales and Excise Taxes............................................................... 68
Table 25: State Motor Vehicle Annual Registration Fees ........................................................... 69
Table 26: State Real Estate Deed Recordation and Transfer Tax Rates …………………….….70
Table 27: Population Changes of the Largest City in Each State ............................................... 77
Maps
Map 1: Total 2019 Tax Burdens (Income, Property, Sales, & Auto) as a % of Income (Family
Earning $75,000/Year) ……………………………………………………...…………….……. 24
Map 2: 2019 Income Tax Burdens (Family Earning $75,000/Year)……...………………...…..28
Map 3: 2019 Property Tax Burdens ($) (Family Earning $75,000/Year)…. ............................... 32
Map 4: 2019 Sales Tax Burdens (Family Earning $75,000/Year)...…………………………….41
Maps 5-9: Combined 2019 Tax Burdens (Inc., Prop., Sales, & Auto) as a % of Income ...... 72-76
Map 10: Population of the Largest Cities as a % of the State’s Total Population, 2019………..78
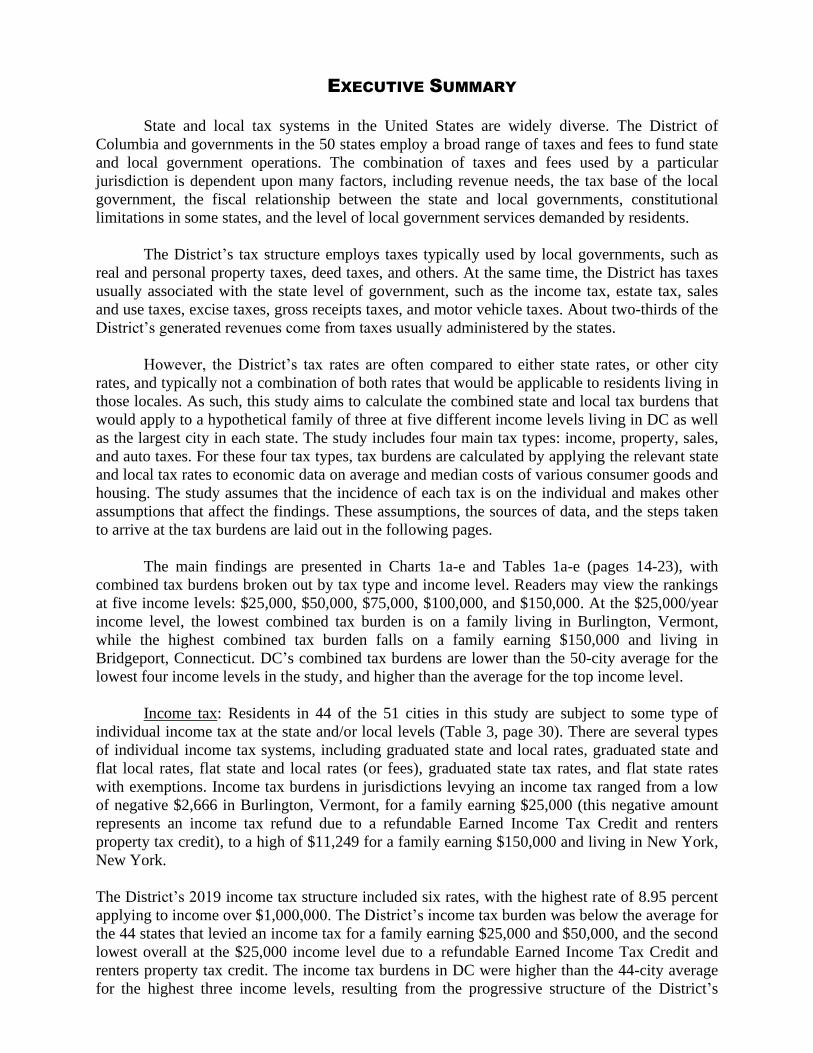
EXECUTIVE SUMMARY
State and local tax systems in the United States are widely diverse. The District of
Columbia and governments in the 50 states employ a broad range of taxes and fees to fund state
and local government operations. The combination of taxes and fees used by a particular
jurisdiction is dependent upon many factors, including revenue needs, the tax base of the local
government, the fiscal relationship between the state and local governments, constitutional
limitations in some states, and the level of local government services demanded by residents.
The District’s tax structure employs taxes typically used by local governments, such as
real and personal property taxes, deed taxes, and others. At the same time, the District has taxes
usually associated with the state level of government, such as the income tax, estate tax, sales
and use taxes, excise taxes, gross receipts taxes, and motor vehicle taxes. About two-thirds of the
District’s generated revenues come from taxes usually administered by the states.
However, the District’s tax rates are often compared to either state rates, or other city
rates, and typically not a combination of both rates that would be applicable to residents living in
those locales. As such, this study aims to calculate the combined state and local tax burdens that
would apply to a hypothetical family of three at five different income levels living in DC as well
as the largest city in each state. The study includes four main tax types: income, property, sales,
and auto taxes. For these four tax types, tax burdens are calculated by applying the relevant state
and local tax rates to economic data on average and median costs of various consumer goods and
housing. The study assumes that the incidence of each tax is on the individual and makes other
assumptions that affect the findings. These assumptions, the sources of data, and the steps taken
to arrive at the tax burdens are laid out in the following pages.
The main findings are presented in Charts 1a-e and Tables 1a-e (pages 14-23), with
combined tax burdens broken out by tax type and income level. Readers may view the rankings
at five income levels: $25,000, $50,000, $75,000, $100,000, and $150,000. At the $25,000/year
income level, the lowest combined tax burden is on a family living in Burlington, Vermont,
while the highest combined tax burden falls on a family earning $150,000 and living in
Bridgeport, Connecticut. DC’s combined tax burdens are lower than the 50-city average for the
lowest four income levels in the study, and higher than the average for the top income level.
Income tax: Residents in 44 of the 51 cities in this study are subject to some type of
individual income tax at the state and/or local levels (Table 3, page 30). There are several types
of individual income tax systems, including graduated state and local rates, graduated state and
flat local rates, flat state and local rates (or fees), graduated state tax rates, and flat state rates
with exemptions. Income tax burdens in jurisdictions levying an income tax ranged from a low
of negative $2,666 in Burlington, Vermont, for a family earning $25,000 (this negative amount
represents an income tax refund due to a refundable Earned Income Tax Credit and renters
property tax credit), to a high of $11,249 for a family earning $150,000 and living in New York,
New York.
The District’s 2019 income tax structure included six rates, with the highest rate of 8.95 percent
applying to income over $1,000,000. The District’s income tax burden was below the average for
the 44 states that levied an income tax for a family earning $25,000 and $50,000, and the second
lowest overall at the $25,000 income level due to a refundable Earned Income Tax Credit and
renters property tax credit. The income tax burdens in DC were higher than the 44-city average
for the highest three income levels, resulting from the progressive structure of the District’s
income tax.
Property tax: All 51 cities in this study levy a tax on real property located within the city,
and effective tax rates range from a high of $4.27 per $100 of assessed value in Bridgeport,
Connecticut, to a low of $0.35 per $100 of assessed value in Honolulu, Hawaii (Table 4, page
33). In addition, several jurisdictions allow tax exemptions and credits in the calculation of the
real property tax liability (Table 6, page 36). Property tax burdens range from a low of $164 on a
family earning $50,000 a year and living in Boston, Massachusetts (which has a generous
homestead exemption/credit), to a high of $16,272 on a family earning $150,000/year and living
in Newark, New Jersey.
In 2019, the District taxed residential property at a rate of $0.85 per $100 of assessed
value; and offered a $74,850 homestead deduction for owner-occupied residences. DC’s property
tax burdens were below the 50-city average for the top four income levels (all of those assumed
to own homes). However, the District’s property tax burden for those earning $25,000 (who are
assumed to rent) was the third highest of all the cities (topped only by Boston and New York
City). This is due to the high cost of rental housing, and the assumption that a portion of rental
payments goes toward the property tax. (This does not include a property tax credit available to
lower-income homeowners and renters called the Schedule H credit, which is administered
through the income tax and thus reflected in the income tax burdens in this report.)
Sales tax: As shown in Table 7, page 40, residents in 46 of the 51 cities studied are
subject to some form of sales and use tax. In 2019, the highest combined (state + local) sales tax
rates were in Los Angeles, California (10.5 percent); Chicago, Illinois (10.25 percent); Seattle,
Washington (10.1 percent); Birmingham, Alabama (10.0 percent); and New Orleans, Louisiana
(9.45 percent). Residents of Honolulu, Hawaii; Portland, Maine; and Milwaukee, Wisconsin,
have the lowest combined sales tax rates. These lowest rates range from 4.5 to 5.6 percent total.
Sales tax burdens in jurisdictions levying a general sales tax ranged from a low of $779 for a
family earning $25,000 in Boston, Massachusetts; to a high of $3,245 for a family earning
$150,000 in Birmingham, Alabama.
The District’s general sales tax of six percent is the fourth lowest of the rates in all 51
cities (the same as six other jurisdictions having the same rate), when looking at total state and
local sales tax rates combined. Consequently, sales tax burdens in DC were lower than the 50-
city average at all five income levels.
Auto tax: Table 9, page 44, indicates that residents in all 51 cities in this study pay some
type of automobile registration fee or tax—usually either a flat rate per vehicle or by weight of
the vehicle. In addition, either state or local personal property taxes on automobiles are levied in
10 of the cities. Auto tax burdens ranged from a low of $103 for a family earning $50,000 in
New Orleans, Louisiana, to a high of $3,279 for a family earning $150,000 in Providence, Rhode
Island.
The District’s annual auto registration fees range from $72 to $155, depending on vehicle
weight, and are among the highest in the study; however, DC does not charge an annual excise
tax or personal property tax on automobiles. District gas tax rates were 23.5 cents per gallon, and
DC auto tax burdens were below the 50-city average for all five income levels.
There is no single pattern that characterizes either a high or low tax burden city. Details
concerning the various taxes levied and why the tax burdens differ from one jurisdiction to

Executive Summary
2019 Tax Rates and Tax Burdens in the District of Columbia: A Nationwide Comparison
viii
another are presented in this publication. Part I compares selected tax burdens in DC with those
of the most populous city in each state, through December 31, 2019. Part II contains tax rate
tables for DC and the 50 states for 12 different types of taxes as of January 1, 2020.
2019 Tax Rates and Tax Burdens in the District of Columbia: A Nationwide Comparison
ix
ACKNOWLEDGMENT
Each year the Government of the District of Columbia, Office of the Chief Financial
Officer, Office of Revenue Analysis publishes several reports to provide information to the
residents and taxpayers of the District of Columbia about the tax rates of states and large cities.
The reports contain information about the rates and burdens of major taxes in the District of
Columbia compared with states and the largest city in those states.
This publication contains two reports: (I) Tax Burdens in Washington, DC Compared
with Those in the Largest City in Each State, 2019 and (II) A Comparison of Selected Tax Rates
in the District of Columbia with Those in the 50 States as of January 1, 2020. This information is
requested annually by committees of the US Congress and the District of Columbia Council. It is
provided pursuant to Public Law 93-407.
Correspondence concerning “Tax Rates and Tax Burdens in the District of Columbia – A
Nationwide Comparison” should be addressed to Lori Metcalf, Fiscal Analyst, Economic Affairs
Administration, Office of Revenue Analysis, 1101 4th Street, SW, Suite W770, Washington, DC
20024, telephone (202) 727-7775.
Appreciation is extended to the many state and local officials in various state offices who
responded to our state survey and provided data in response to our follow up inquiries. Their
cooperation in providing information and their helpful suggestions make this publication
possible. I would also like to thank Lori Metcalf, who conducted the research and prepared this
document, and Kevin Hundelt, Farhad Niami, Charlotte Otabor, and Bob Zuraski who offered
editing assistance.
Norton Francis,
Chief Economist &
Deputy Chief Financial Officer (Interim)
April 2021
2019 Tax Rates and Tax Burdens in the District of Columbia: A Nationwide Comparison
1
Part I
Tax Burdens in Washington, DC Compared with Those in the Largest City in Each State
2019
Part I: Tax Burdens in Washington, DC Compared with Those in the Largest City in Each State
2019 Tax Rates and Tax Burdens in the District of Columbia: A Nationwide Comparison
2
Overview
There is a wide diversity in state and local tax systems in the United States. The fifty
states and the District of Columbia employ a broad range of taxes and fees to fund state and local
government operations. The combination of taxes and fees used by a particular jurisdiction is
dependent upon many factors, including its revenue needs, the local government tax base, the
fiscal relationships between the state and the local government, constitutional and legal
limitations on the powers of taxation, and the jurisdiction’s philosophy of government taxation.
The District’s tax structure includes taxes typically imposed by local governments, such
as real and personal property taxes, deed taxes, and others. At the same time, the District also
levies taxes usually associated with the state level of government, such as individual and
corporate income taxes, excise taxes, and motor vehicle related taxes. About two-thirds of the
District’s locally generated revenues come from taxes usually administered by a state.
The District is often compared to other cities, or states, independently, and without
considering its unique situation of having taxes that both a city and a state normally levy.
Therefore, a primary goal of this study is to add the nominal state and local tax rates in a
consistent way to provide a comparison of tax burdens across major taxes in the District and the
largest city in each state. Further, this study defines the term ‘tax burden’ as the dollar amount of
taxes owed if the final incidence of each major tax examined (income, property, sales, and auto)
is on the individual.1
This study compares the income, property, sales, and auto tax burdens in 51 different
jurisdictions for a hypothetical family of three, at five different income levels. For context,
Appendix Table 27 presents data on population and recent changes in population in these
jurisdictions. Appendix Map 10 shows the population of the largest cities as a portion of total
state population and illustrates how many people, and what portion of each state are represented
by the combined tax rates presented in this study.
Useful information and insights can be gleaned from comparing the tax burdens in one
jurisdiction with the burdens in other jurisdictions. However, in evaluating or interpreting these
comparisons, consideration should be given to special circumstances within each jurisdiction that
may affect tax burdens. Further, these tax burden comparisons reflect the assumptions used in
their computation. For this reason, it is important to study the methodology used in the report
before drawing conclusions. The methodology used in this report is best suited to provide a
relative comparison of tax burdens, within a single tax type and within a single year, across each
of the 51 cities studied.
As in past years, readers are advised not to compare the hypothetical tax burdens across
years; any number of small changes in the assumptions of the study can result in misleading
information under such comparisons. The purpose of the study remains to compare tax burdens
on a hypothetical household in different jurisdictions in a specific year, and not over time.
Further, the report does not include all taxes levied in each jurisdiction, as there are state
and/or local taxes not captured in the calculations here. However, the report makes every effort
1 This approach differs from the use of the phrase ‘tax burden’ that may be more common in the field of economics, which includes an economic
analysis of which group bears the ‘burden’ of a tax by ultimately having to pay it, also known as the ‘incidence’ of a tax.
Part I: Tax Burdens in Washington, DC Compared with Those in the Largest City in Each State
2019 Tax Rates and Tax Burdens in the District of Columbia: A Nationwide Comparison
3
to consistently capture and measure tax burdens across jurisdictions for the taxes we include,
making comparisons of the relative tax burdens presented a key feature of the report.
Why Do Tax Burdens Differ from One City to Another?
In the following chapters, the differences in tax burdens for the largest city in each state
in the United States will be discussed. The assumptions used to compute the various tax burdens
will affect the relative tax burdens for the 51 cities. This is especially true for the real estate tax,
because both the methodology used to derive housing values and the relative housing values
from one income level to another and from one city to another are important determinants of the
real property tax burden. However, no matter what set of assumptions is used in such a study;
there will be substantial tax burden differences from one city to another. Some of the reasons for
these differences are as follows:
1) This study only measures major state and local tax burdens for individuals.
Business tax burdens also differ substantially from one city to another. Many
cities, because of a large manufacturing base or because of a dominant
industry, can shift a large portion of the tax burden away from individuals to
businesses. Cities in natural resource states, for example, may shift a
substantial portion of the tax burden to industry, thus exporting, to some
extent, their local government tax burden. Convention and tourist activity in
cities such as Chicago, Las Vegas, New York City, and Washington, DC, can
help reduce local tax burdens by increasing sales tax, gasoline tax, and
parking tax revenues from non-residents, another form of tax exporting.
2) Service demands in each of the 51 cities may vary a great deal. Cold weather
services, such as snow removal, in northern cities may increase costs.
Furthermore, residents of some cities simply desire, or are accustomed to,
more government services than residents of other cities.
3) The costs of providing services may differ substantially from one city to
another. Wage levels, efficiency of the work force, and costs of overhead
items, such as utilities, may be very different.
4) The tax base of each city is different. Cities that have a relatively large
percentage of employed residents will normally have a broad tax base. This
type of city can levy taxes at lower rates than can those with low levels of
employment or high levels of exempt property. External forces, such as the
federal presence in Washington, DC, can restrict the tax base. The tax base
can also be defined by the scope of a tax. For example, it is desirable from a
social point of view to exempt groceries from the sales tax; however, such an
exemption can narrow the sales tax base and may require a higher sales tax
rate to raise enough revenues.
5) The proportion of public versus private services may differ from one city to
another. Some cities may provide services such as garbage collection and
hospital care, while in other cities the private sector may perform these

Part I: Tax Burdens in Washington, DC Compared with Those in the Largest City in Each State
2019 Tax Rates and Tax Burdens in the District of Columbia: A Nationwide Comparison
4
services for a fee.
As a result, a city in which the private sector performs such functions may
have a lower tax burden than one in which these functions are performed by
the city. In these instances, the fees charged by the private sector represent
payments by individuals for public services that are not reflected in tax
burdens.
6) Certain taxes that are not discussed in this study may affect state and local tax
burdens. Taxes which are levied on individuals, but not covered by the study,
include liquor and cigarette taxes and taxes on public utility bills. Rates for
some of these taxes are listed at the end of the report.
As noted above, the number and kind of public services each city provides necessarily
has a bearing on the amount of revenue that must be raised. The tax burden comparisons in this
report should be studied in the context of these differing conditions, in addition to the
assumptions and methodologies used.
In addition to these factors which may apply to any jurisdiction, the District’s
circumstances further set it apart from other state and local governments. The Government
Accountability Office (GAO) has documented in the past that the District has had a structural
imbalance, due primarily to two factors. First, the District has a higher service delivery cost than
the average state fiscal system—due to the higher rates of poverty and crime associated with an
urban area, as well as a higher cost of living.2 Further, the District’s revenue capacity is restricted
by the federal presence—the District cannot tax the income of non-residents who work in the city,
and as of Tax Year 2019 property assessments, 31 percent of the land value in the District is tax
exempt.3 In spite of these restrictions, GAO notes that the District has a high revenue capacity.
The city’s economic and fiscal situation has changed over the past two decades; however, these
factors remain relevant when considering the District’s tax structure and its tax burdens.
2 “Structural Imbalance and Management Issues.” GAO–03–666. Government Accountability Office. Washington, DC: 2003. p. 1.
3 “DC Tax Facts 2020.” 2019 Tax Exempt Land Value as a % of Total Taxable and Exempt Land Value. Government of the District of
Columbia, Office of the Chief Financial Officer, Office of Revenue Analysis. Washington, DC: 2020. p. 49.
Part I: Tax Burdens in Washington, DC Compared with Those in the Largest City in Each State
2019 Tax Rates and Tax Burdens in the District of Columbia: A Nationwide Comparison
5
CHAPTER I
How Tax Burdens are Computed for the Largest City in Each State
Many taxpayers in the United States are aware that the amount of state and local tax
liability of an individual taxpayer varies from one jurisdiction to another. The extent of these
differences in state and local tax burdens across the country, however, may not be fully
recognized.
The taxing systems of states and local jurisdictions differ in many aspects. The
relationship of state taxes to federal tax law is one of several factors causing differences in tax
burdens from one state to another. Other differences reflect decisions by state and local
governments on what should and should not be subject to tax. For example, several states do not
levy an individual income tax, although for many others it represents a major source of state
funding. Tax burdens also differ because some states can shift a larger portion of governmental
costs to business and may be able to “export” some of their tax burden. This has been true, for
example, for energy producing states and states specializing in tourism.
This report compares the major state and local tax burdens of hypothetical households in
Washington, DC, with the burden for the households in the largest city in each of the 50 states
for 2019. The four major taxes used in the comparison are the individual income tax, the real
property tax on residential property, the general sales and use tax, and automobile taxes,
including the gasoline tax, registration fees, excise tax, and the personal property tax. This study
does not incorporate the effects of differing local tax burdens on the federal individual income
tax burden. Income and property taxes are deductible in computing federal income taxes and the
effect of federal deductibility is to reduce the overall difference in tax burdens between
jurisdictions.
All tax burdens reflect state and local tax rates. Tax burdens are compared for a
hypothetical family that consists of two wage-earning spouses and one school-age child. The
gross family annual income levels used are: $25,000, $50,000, $75,000, $100,000, and $150,000,
and income is assumed to have been earned in the city. The wage and salary split is assumed to
be 70-30 between the two spouses. The families at the top four income levels are assumed to
own a single-family home and to reside within the confines of the city. At the $25,000 income
level, the study assumes that the household rents and does not own its housing unit. The
assumptions used in the calculation of each major tax type are indicated on the following pages.
Part I: Tax Burdens in Washington, DC Compared with Those in the Largest City in Each State
2019 Tax Rates and Tax Burdens in the District of Columbia: A Nationwide Comparison
6
• Housing Values. Housing values across income levels in the 2019 study are based on
data from the US Census Bureau’s American Community Survey (ACS) and adjusted
using a linear multiplier for the different income levels. This involves dividing the
median house value of each metropolitan statistical area (MSA) by the MSA’s median
household income of mortgage holders, and then multiplying that number by each
income level for which home ownership is assumed ($50,000, $75,000, $100,000, and
$150,000).
• Mortgage Interest. The mortgage interest amount (for use as an itemized deduction in
the income tax) in the 2019 study is derived by calculating an amortization schedule for
the estimated home value for each income level in each city. Home values for the
Mortgage Interest Deduction (MID) are calculated in the same manner as in the previous
bullet, based on median house values and median incomes for mortgage holders for a
house purchased in 2014.
• Renters versus Owners. The hypothetical family at the $25,000 income level in this
year’s study is assumed to rent, rather than own a home. Given the real estate values in
most cities around the country, the assumption that families earning $25,000 per year rent
may be more realistic than the assumption that they own a home.
Individual Income Tax
The five income levels used in this study are divided between wage and salary income. In
previous versions of this report, capital gains and interest income were included, as well as the
assumptions of major itemized deductions on the following page. However, capital gains and
interest income are not included in the current report to remove some of the variation that
inconsistently changed the original income levels used, with little methodological benefit. (See
the following page for more information on the itemized deductions that continue to be included
in this report.) The following income levels are used for the income tax starting point in each
state and the District of Columbia, where Spouse 1 is assumed to earn 70 percent of the total
income and Spouse 2 is assumed to earn 30 percent.
Gross
Income:
$25,000 $50,000 $75,000 $100,000 $150,000
Spouse 1: $17,500 $35,000 $52,500
$70,000 $105,000
Spouse 2: 7,500 15,000 22,500 30,000 45,000
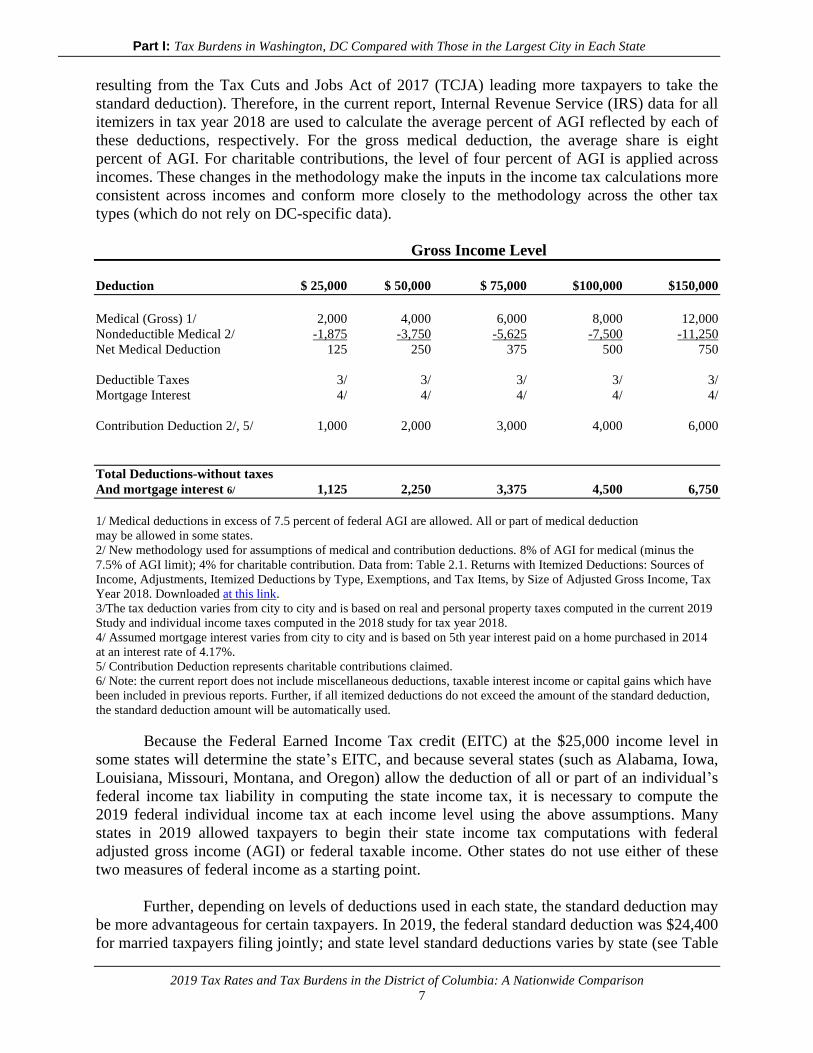
Total itemized deductions used for calculating state and local income taxes, which are
also used in the federal tax computation, are shown below. The methodology for two of the
itemized deductions—the medical and dental expenses deduction and the charitable contribution
deduction—have changed for the current report. In the past, the amounts for these deductions
were based on actual average deduction amounts for taxpayers within a range around each
income level for Washington, DC, taxpayers who were married filing jointly and had itemized
deductions. However, the pool of married taxpayers filing jointly that also itemized was
insufficient at the lower income levels to produce representative deduction amounts (perhaps
Part I: Tax Burdens in Washington, DC Compared with Those in the Largest City in Each State
2019 Tax Rates and Tax Burdens in the District of Columbia: A Nationwide Comparison
7
resulting from the Tax Cuts and Jobs Act of 2017 (TCJA) leading more taxpayers to take the
standard deduction). Therefore, in the current report, Internal Revenue Service (IRS) data for all
itemizers in tax year 2018 are used to calculate the average percent of AGI reflected by each of
these deductions, respectively. For the gross medical deduction, the average share is eight
percent of AGI. For charitable contributions, the level of four percent of AGI is applied across
incomes. These changes in the methodology make the inputs in the income tax calculations more
consistent across incomes and conform more closely to the methodology across the other tax
types (which do not rely on DC-specific data).
Gross Income Level
Deduction $ 25,000 $ 50,000 $ 75,000 $100,000 $150,000
Medical (Gross) 1/ 2,000 4,000 6,000 8,000 12,000
Nondeductible Medical 2/ -1,875 -3,750 -5,625 -7,500 -11,250
Net Medical Deduction 125 250 375 500 750
Deductible Taxes 3/ 3/ 3/ 3/ 3/
Mortgage Interest 4/ 4/ 4/ 4/ 4/
Contribution Deduction 2/, 5/ 1,000 2,000 3,000 4,000 6,000
Total Deductions-without taxes
And mortgage interest 6/ 1,125 2,250 3,375 4,500 6,750
1/ Medical deductions in excess of 7.5 percent of federal AGI are allowed. All or part of medical deduction
may be allowed in some states.
2/ New methodology used for assumptions of medical and contribution deductions. 8% of AGI for medical (minus the
7.5% of AGI limit); 4% for charitable contribution. Data from: Table 2.1. Returns with Itemized Deductions: Sources of
Income, Adjustments, Itemized Deductions by Type, Exemptions, and Tax Items, by Size of Adjusted Gross Income, Tax
Year 2018. Downloaded at this link.
3/The tax deduction varies from city to city and is based on real and personal property taxes computed in the current 2019
Study and individual income taxes computed in the 2018 study for tax year 2018.
4/ Assumed mortgage interest varies from city to city and is based on 5th year interest paid on a home purchased in 2014
at an interest rate of 4.17%.
5/ Contribution Deduction represents charitable contributions claimed.
6/ Note: the current report does not include miscellaneous deductions, taxable interest income or capital gains which have
been included in previous reports. Further, if all itemized deductions do not exceed the amount of the standard deduction,
the standard deduction amount will be automatically used.
Because the Federal Earned Income Tax credit (EITC) at the $25,000 income level in
some states will determine the state’s EITC, and because several states (such as Alabama, Iowa,
Louisiana, Missouri, Montana, and Oregon) allow the deduction of all or part of an individual’s
federal income tax liability in computing the state income tax, it is necessary to compute the
2019 federal individual income tax at each income level using the above assumptions. Many
states in 2019 allowed taxpayers to begin their state income tax computations with federal
adjusted gross income (AGI) or federal taxable income. Other states do not use either of these
two measures of federal income as a starting point.
Further, depending on levels of deductions used in each state, the standard deduction may
be more advantageous for certain taxpayers. In 2019, the federal standard deduction was $24,400
for married taxpayers filing jointly; and state level standard deductions varies by state (see Table
Part I: Tax Burdens in Washington, DC Compared with Those in the Largest City in Each State
2019 Tax Rates and Tax Burdens in the District of Columbia: A Nationwide Comparison
8
14 for more detail on state income tax parameters). Because the federal standard deduction was
significantly increased in the TCJA of 2017, more of the families included will now take the
standard deduction. For the current study of tax year 2019, all families earning $75,000 per year
and below, and most (41 of 51) of the families earning $100,000, would take the federal standard
deduction as it was higher than the itemized deductions assumed for these income levels in the
report.
The 2019 deductible real and personal property taxes computed in the current year’s 51-
city study are used for the 2019 property tax deduction. For the 2019 state and local individual
income tax deduction, 2018 income tax burdens from the previous year’s study were used
(unless the calculated sales tax burdens were higher, which was often the case for the lower two
income levels). Each of these figures was used in computing the 2019 federal income tax burden,
which is the starting point for the state income tax burden calculations.
Real Property Tax
Real property tax burdens in the 51 cities are a function of residential real estate market
values, assessed values and the ratio of the two, and the tax rate. Some jurisdictions allow certain
deductions from the value of residential property before the tax is calculated while others allow
credits against the calculated real estate tax. These deductions and/or credits are normally limited
to owner-occupied properties.
The nominal property tax rates for each of the 51 cities, presented in Table 4 (page 33)
indicate a wide range in these rates. This information is based upon survey data received from
various state agencies and/or local assessors and is intended to represent the total rate applicable
to a homeowner in each city, inclusive of any state, city, and other local property taxes. In
addition to tax rate differences, data presented in Table 5 (page 35) indicate that the assumed
market value of a residence for purposes of this study varies widely from one city to another at
all income levels. For example, based on extrapolations of 2019 American Community Survey
(ACS) data, the estimated house value at the $75,000 income level ranges from a high of
$432,277 in Honolulu, Hawaii, to a low of $123,661 in Charleston, West Virginia.
The housing values for each income level (except the $25,000 income level) shown in
Table 5 are derived from 2019 ACS data. A series of assumptions and calculations were made to
estimate the median house value in each city, for each income level used in the report. First, data
on median house values and median household incomes of mortgage holders were retrieved from
the Census Bureau’s American Community Survey 2019. Data were collected for the
Metropolitan Statistical Area (MSA) within which the largest city in each state falls.4
Since the focus of this study is identifying the median house value at the $50,000,
$75,000, $100,000, and $150,000-income levels, a linear multiplier was calculated based on the
median house value in the MSA divided by the median household income of mortgage holders in
that MSA. This multiplier was used to scale the house values to the various income levels in the
report by multiplying them by each income level to determine the hypothetical house value at
that level. This assumption serves as an input for both the property tax burden calculations and
the mortgage interest deduction for the income tax burden. This method, which has been used in
4 Newark, New Jersey, falls in the New York City MSA and Wilmington, Delaware, falls in the Philadelphia MSA, thus those
MSA data are used for both cities. A sensitivity analysis presented in the 2013 Tax Rates and Tax Burdens Report shows how
this choice affects the findings.
Part I: Tax Burdens in Washington, DC Compared with Those in the Largest City in Each State
2019 Tax Rates and Tax Burdens in the District of Columbia: A Nationwide Comparison
9
each of the Tax Burden Studies since 2012, assumes that house values increase in a linear
fashion with income, which is the case up to near $100,000 of annual income (all median
household incomes in the 51 cities are below this level). Since 2014, the median household
income of mortgage holders, rather than the median income of all households, within an MSA is
used to calculate the linear multiplier.
The use of the above methodology is an attempt to reflect the different values of housing
in different parts of the country and at different income levels. Data from the 2019 ACS were
used for estimating house values because they are the latest data comparable for all the
jurisdictions in this study. It is important to note that these are hypothetical values based on
income levels and do not represent average values for a particular jurisdiction.
For the present 2019 Study (just as in the 2018 Study), median sales ratio statistics have
been included where available to derive an “effective assessment level” that results from
multiplying the statutory assessment level times the median sales ratio statistic.5 A sales ratio (or
assessment sales ratio) is the ratio of the assessed value of the property to the sales price, or
market value of the property; the median is the median ratio value of all the properties included
in the study.6 Median sales ratios are a measure of the property valuation and assessment
practices within a jurisdiction. If property assessments do not keep up with market value,
residents’ property taxes will be lower than they would otherwise be if taxed at the full market
value of the property. Including the available median sales ratio statistic into the property tax
burden calculations is an attempt to reflect how property tax systems in each jurisdiction are
administered in practice.
In computing property tax burdens, it is also necessary to consider the various
exemptions and credits noted in Table 6 (page 36). The variety of real property tax exemptions,
most of which apply only to residential real property, is very broad. Table 6 does not include
senior citizen exemptions and credits that are available in many states, nor can it adjust for
“caps” on the growth of assessed values or limitations on tax liability over time. Some states
have a type of assessment limitation or valuation freeze. For example, strict limits in California
mean many families’ assessments would be much lower than those assumed here, particularly if
they have owned their home for many years. Table 4 (page 33), which compares residential real
estate tax rates for each city, does not reflect the various exemptions and credits noted in Table 6.
Other exemptions and credits may be available, such as those mentioned above for senior
citizens, but are also not reflected in Table 4 because seniors are not included in the hypothetical
households of this study. However, the property tax burdens computed and shown in Tables 1a-e
of this study reflect the provisions in Table 6 applicable to families owning and residing in their
homes. In certain jurisdictions, such as DC, MN, and VT, renters or property tax credits or
refunds are provided through the income tax and in these cases those values are reflected in the
income tax burdens.
Property Tax Equivalent of Rent
As previously noted, the study assumes that the family with an annual income of $25,000
5 For Vermont, the Common Level of Appraisal value that is used for school funding equalization is used in lieu of a sales ratio
statistic. Similarly, an equalization statistic is used for Illinois. 6 “Glossary for Property Appraisal and Assessment,” International Association of Assessing Officers. 2013. Page 150.
https://www.iaao.org/media/Pubs/IAAO_GLOSSARY.pdf.
Part I: Tax Burdens in Washington, DC Compared with Those in the Largest City in Each State
2019 Tax Rates and Tax Burdens in the District of Columbia: A Nationwide Comparison
10
does not own a home (and as a result does not pay property tax directly), but instead rents.
Because renters indirectly pay property taxes through their rent,7 this study computes a
percentage of said rent constituting property taxes. This concept is called the property tax
equivalent of rent (PTER) and is an important tool in comparing the incidence of the property tax
on renters versus homeowners. In a 2020 50-State Property Tax Comparison report, the Lincoln
Institute of Land Policy and the Minnesota Center for Fiscal Excellence note that states vary in
how they tax rental properties in comparison to homesteads; on average, cities tax apartments 34
percent more than homesteads.8 Their report presents a table illustrating this information for the
largest city in each state; Charleston, South Carolina, has the largest difference in effective rates
between apartment buildings and homesteads, taxing apartments more than four times the
effective rate of that levied on homesteads.9 Conversely, in six of the largest cities in each state
(and DC), apartments are given preferential treatment over homesteads with the most preference
toward apartments given in Bridgeport, CT.10 In eight cities, apartments are given the same
treatment as homesteads.
To relieve the implicit tax burden on renters that exists in various locations, some states
have a property tax circuit breaker program that offsets renters’ tax burdens (often through the
income tax since they do not pay property taxes directly). These programs must make
assumptions of the PTER to calculate the amount that renters are paying in property taxes, and
the amount of relief they will receive through the circuit breaker program. Of the states that offer
circuit breaker programs, the PTER assumptions generally range from six to 25 percent (NM has
a low of six percent while MA uses a 25 percent assumption); on average, states assume that 17
percent of rent goes toward paying property taxes.11 DC’s circuit breaker program assumes 20
percent.
Prior to the 2016 Tax Burden Study, a 20 percent assumption was used with some
reservation given that it has a large impact on the calculated tax burdens of the families earning
$25,000 per year. The assumption often seemed unrealistic in cities with higher rental prices in
which calculated PTERs would be the highest, especially given that rental buildings in more
competitive markets may not be able to pass on all taxes paid since prices are set by the local
market. And as the Lincoln report illustrates, the specific PTER level in a city is primarily based
on the tax system in each jurisdiction. It is not clear whether states with higher PTER
percentages in their circuit breakers have data leading to the choice of PTER percentage in their
state, or if these states are using the circuit breaker to provide a subsidy to lower income renters
hit hardest by higher rental markets.12 In a January 2016 report, the Minnesota Department of
Revenue (MN DOR) used several techniques based on both ACS and internal tax data to assess
the percentage of rent that constitutes property taxes throughout Minnesota. MN DOR found the
statewide PTER hovered around 15 percent each year from 2009 to 2014, though in Minneapolis
7 “50-State Property Tax Comparison Study for Taxes Paid in 2019.” The Lincoln Institute of Land Policy and the
Minnesota Center for Fiscal Excellence. June 2020: pg. 4. 8 Ibid. 9 Ibid, pg. 104-5. 10 Ibid. The study found that in Washington, DC, the classification ratio between apartments and homesteads is 1.07, indicating
that homesteads are treated slightly preferentially to rental buildings by the property tax rates (exclusive of credits) in DC. 11 Based on analysis of state programs in the Lincoln Institute of Land Policy’s Significant Features of the Property Tax
Database for 2017. 12 This discussion does not intend to assess appropriate levels of PTER used in circuit breaker programs. It is intended solely to
consider whether and how these levels are used as an input for the Tax Burden Study’s calculation of renter’s tax burdens as
compared to homeowner’s tax burdens across the 50 states.
Part I: Tax Burdens in Washington, DC Compared with Those in the Largest City in Each State
2019 Tax Rates and Tax Burdens in the District of Columbia: A Nationwide Comparison
11
it was often up to 16.9 percent.13
After considering the available information we decided to use a level of 15 percent for
PTER in the 2016 Study and have continued to do so through the current 2019 Study to attempt
to be more realistic in the property tax burden on renters, particularly in cities with more
expensive rental markets. Future refinements may be made as new information and data become
available. The PTER in each city was calculated as 15 percent of median rents in each MSA.
These data were obtained from the US Department of Housing and Urban Development.14 This
flat assumption means that any variation in the property tax burden for renters (families earning
$25,000) is driven by the housing market in each jurisdiction, and not the tax system in place.
Even with the lower assumption of PTER in the current study, this number still implies
that the lowest income families in the report are spending, on average, 43 percent of their
incomes on rent, with that portion being as high as 81 percent in Boston and New York City and
74 percent in Washington, DC. However, viewed in the context of some DC metro area statistics
it may not be that unrealistic. In 2017, of renters earning less than $50,000/year, more than 80
percent were spending over 30 percent of their income on rent.15 A 2017 DC Fiscal Policy
Institute (DCFPI) analysis of 2014 Census data found that 42 percent of extremely low-income
renters (earning between $16,100 - $32,100/year for a family of four) in DC paid 80 percent of
their income or more in rent.16 Further, a 2018 DCFPI analysis of 2016 Census data found that
63 percent of renters at this income level paid more than half of their income in rent.17
Sales and Use Tax
The sales tax burdens included in this study are based on information from the 2019
Bureau of Labor Statistics’ Consumer Expenditure Survey (CES), and local and state sales tax
rates. The CES provides data on average consumer expenditures by income level. The average
expenditures by income level have been adjusted for a 3-person household. The same CES
categories have been included since the 2013 Tax Burden Study and include: food (at home);
food (away from home); over the counter drugs; housekeeping supplies, household furnishings,
and equipment; apparel and footwear; new and used cars and trucks; vehicle finance charges,
maintenance and repairs, and insurance; vehicle rentals, leases, and licenses and other charges;
public and other transportation; entertainment: fees and admissions, audio visual equipment and
services, and reading; and personal care products and services.18
The CES expenditure data and the specific state and local tax rates on each type of item are used
to determine the sales tax that these expenditures would generate. The state and local general
13 The MN Renter’s Property Tax Refund program allowed renters to qualify for a refund on their rent of up to 17% of rent paid
(dependent on the renter’s income level) in 2018. 14 US Department of Housing and Urban Development, “2019 50th Percentile Rent Estimates.” Data for studio apartments used.
HUD provides data for Newark, NJ, but not for Wilmington, DE (thus the value for Philadelphia, PA, is used). 15 Analysis of US Census Bureau, 2013-2017 American Community Survey 5-Year Estimates. 16 Zippel, Claire. “A Broken Foundation: Affordable Housing Crisis Threatens DC’s Lowest-Income Residents.”
DC Fiscal Policy Institute. December 8, 2016. 17 Zippel, Claire. “Building the Foundation: A Blueprint for Creating Affordable Housing for DC’s Lowest-Income Residents.”
DC Fiscal Policy Institute. April 4, 2018 18 In cases where a category includes items that are both taxed and not taxed, such as “drugs” which includes both
prescription and over the counter (OTC) drugs, the expenditure amount is divided by two before applying the tax rate of the
item that is taxed (For example, states often tax OTC drugs but not prescription drugs. Similarly, states often tax personal care
products, but not personal care services.)
Part I: Tax Burdens in Washington, DC Compared with Those in the Largest City in Each State
2019 Tax Rates and Tax Burdens in the District of Columbia: A Nationwide Comparison
12
sales tax rates in each city are reported in Table 7, page 40. It is important to note that the sales
tax burdens will be a function of the size of the sales tax base in a particular jurisdiction and the
specific sales tax rates that apply to the consumer items included.
Automobile Taxes
Automobile taxes included in this study are gasoline taxes, motor vehicle registration fees
(state and local), excise taxes, and personal property taxes levied on automobiles. Table 10 (page
44) summarizes automobile ownership assumptions for each income level, including types of
vehicles, weight, value, and annual gasoline consumption.
Part I: Tax Burdens in Washington, DC Compared with Those in the Largest City in Each State
2019 Tax Rates and Tax Burdens in the District of Columbia: A Nationwide Comparison
13
CHAPTER II
Overall Tax Burdens for Hypothetical Families in the Largest City in Each State
The major state and local tax burdens by tax type for the five different income levels used
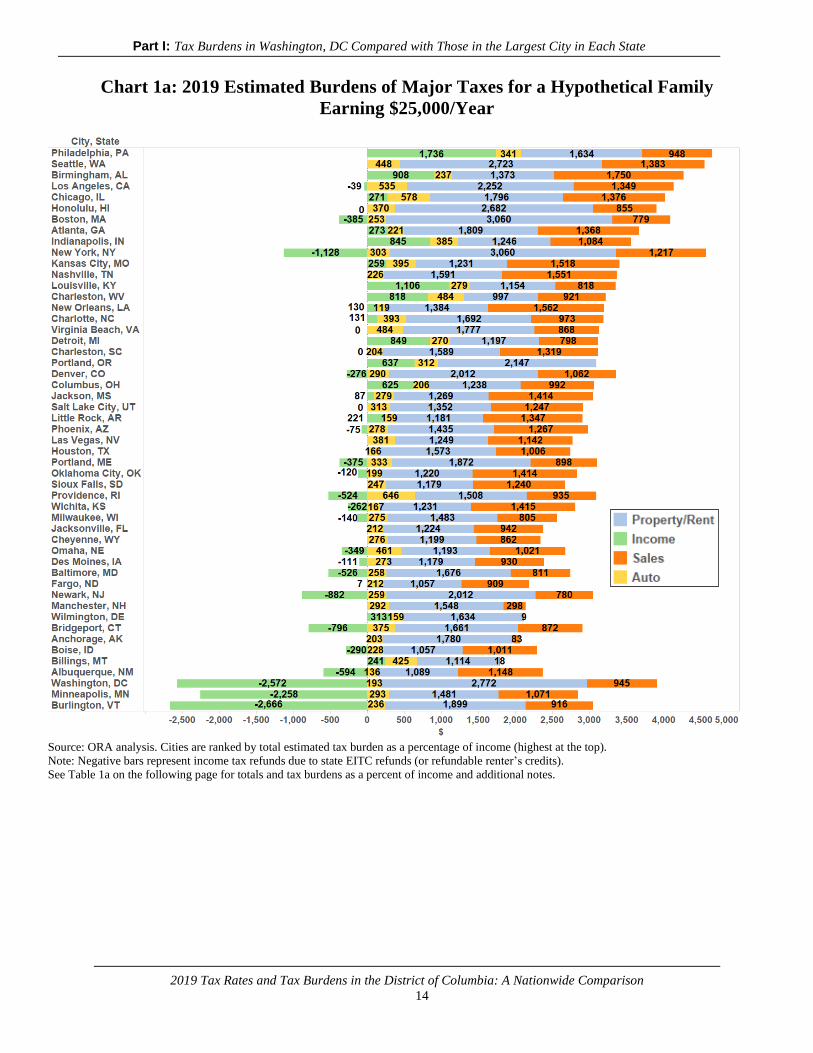
in this study are presented in Tables 1a-e (pages 14-23). As reflected in Table 1, tax burdens
across the 51 cities vary widely at all income levels. At the $25,000 income level, the $4,660
combined burden of all four taxes added together for Philadelphia, Pennsylvania, is significantly
greater than the tax burden of $385 that a similar taxpayer in Burlington, Vermont, would pay.
At the $150,000 income level, the Bridgeport, Connecticut, tax burden of $24,341 is over four
times the Anchorage, Alaska, tax burden of $5,805. Differences in state and local tax structures,
as well as housing markets and costs-of-living, contribute to the variation.
The highest combined tax burdens at the $25,000 income level occur in Philadelphia,
Pennsylvania; Seattle, Washington; Birmingham, Alabama; Los Angeles, California; and
Chicago, Illinois. Philadelphia’s local wage tax adds to the state income tax to make it the
highest income tax burden at this income level. The high property tax burdens (which are
assumed to be a portion of rent) due to expensive real estate markets in Seattle and Los Angeles
put them on this list, while Birmingham’s high sales tax burden contributes to its ranking. The
lowest combined tax burdens of all four taxes added together at the $25,000 income level occur
in Burlington, Vermont; Minneapolis, Minnesota; Washington, DC; Albuquerque, New Mexico;
and Billings, Montana. Each of these (except Montana) has a refundable EITC, and Burlington,
Vermont; Washington, DC; and Minneapolis, Minnesota, each offer a renter’s refund through the
income tax, which contributes to their low rankings. Though Montana does not have a state
EITC, it also does not have a sales tax which reduces the tax burden, particularly for low-income
households.
The highest combined tax burdens of all four taxes added together at the $150,000
income level occur in Bridgeport, Connecticut; Newark, New Jersey; Detroit, Michigan;
Baltimore, Maryland; and Portland, Oregon. The lowest combined tax burdens at this income
level are Anchorage, Alaska; Nashville, Tennessee; Cheyenne, Wyoming; Sioux Falls, South
Dakota; and Fargo, North Dakota. These lower tax burdens are primarily a result of the lack of
an income tax in all but one (ND) of these jurisdictions. Map 1 (page 24) illustrates the combined
burden of all four taxes for a family earning $75,000/year.19
No single pattern characterizes a high or a low tax burden city. High tax burden cities
generally have a graduated individual income tax rate and/or high real estate tax rates and
moderate to high housing values. Low tax burden cities generally have a low or no individual
income tax and average or below average property tax rates.
19 See the Appendix (page 72) for maps showing the combined burdens by state for the other income levels.
Part I: Tax Burdens in Washington, DC Compared with Those in the Largest City in Each State
2019 Tax Rates and Tax Burdens in the District of Columbia: A Nationwide Comparison
14
Chart 1a: 2019 Estimated Burdens of Major Taxes for a Hypothetical Family
Earning $25,000/Year
Source: ORA analysis. Cities are ranked by total estimated tax burden as a percentage of income (highest at the top).
Note: Negative bars represent income tax refunds due to state EITC refunds (or refundable renter’s credits).
See Table 1a on the following page for totals and tax burdens as a percent of income and additional notes.
Part I: Tax Burdens in Washington, DC Compared with Those in the Largest City in Each State
2019 Tax Rates and Tax Burdens in the District of Columbia: A Nationwide Comparison
15
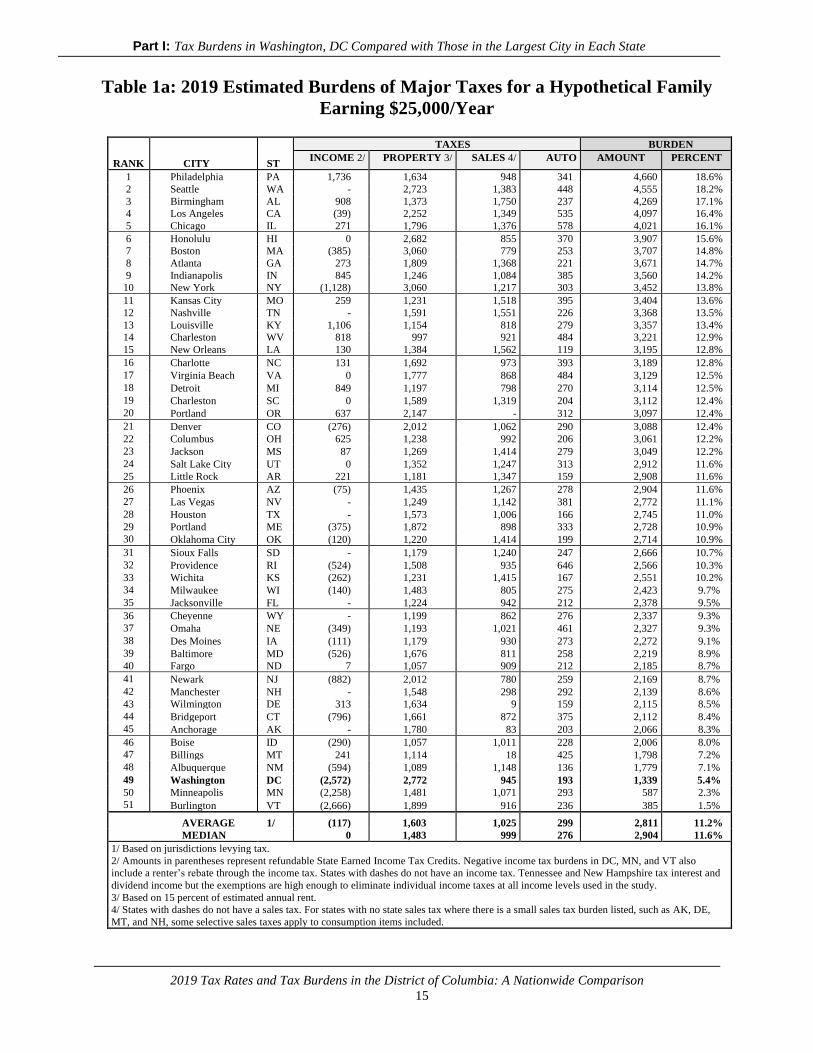
Table 1a: 2019 Estimated Burdens of Major Taxes for a Hypothetical Family
Earning $25,000/Year
RANK
CITY ST
TAXES BURDEN
INCOME 2/ PROPERTY 3/ SALES 4/ AUTO AMOUNT PERCENT
1 Philadelphia PA 1,736 1,634 948 341 4,660 18.6%
2 Seattle WA - 2,723 1,383 448 4,555 18.2%
3 Birmingham AL 908 1,373 1,750 237 4,269 17.1%
4 Los Angeles CA (39) 2,252 1,349 535 4,097 16.4%
5 Chicago IL 271 1,796 1,376 578 4,021 16.1%
6 Honolulu HI 0 2,682 855 370 3,907 15.6%
7 Boston MA (385) 3,060 779 253 3,707 14.8%
8 Atlanta GA 273 1,809 1,368 221 3,671 14.7%
9 Indianapolis IN 845 1,246 1,084 385 3,560 14.2%
10 New York NY (1,128) 3,060 1,217 303 3,452 13.8%
11 Kansas City MO 259 1,231 1,518 395 3,404 13.6%
12 Nashville TN - 1,591 1,551 226 3,368 13.5%
13 Louisville KY 1,106 1,154 818 279 3,357 13.4%
14 Charleston WV 818 997 921 484 3,221 12.9%
15 New Orleans LA 130 1,384 1,562 119 3,195 12.8%
16 Charlotte NC 131 1,692 973 393 3,189 12.8%
17 Virginia Beach VA 0 1,777 868 484 3,129 12.5%
18 Detroit MI 849 1,197 798 270 3,114 12.5%
19 Charleston SC 0 1,589 1,319 204 3,112 12.4%
20 Portland OR 637 2,147 - 312 3,097 12.4%
21 Denver CO (276) 2,012 1,062 290 3,088 12.4%
22 Columbus OH 625 1,238 992 206 3,061 12.2%
23 Jackson MS 87 1,269 1,414 279 3,049 12.2%
24 Salt Lake City UT 0 1,352 1,247 313 2,912 11.6%
25 Little Rock AR 221 1,181 1,347 159 2,908 11.6%
26 Phoenix AZ (75) 1,435 1,267 278 2,904 11.6%
27 Las Vegas NV - 1,249 1,142 381 2,772 11.1%
28 Houston TX - 1,573 1,006 166 2,745 11.0%
29 Portland ME (375) 1,872 898 333 2,728 10.9%
30 Oklahoma City OK (120) 1,220 1,414 199 2,714 10.9%
31 Sioux Falls SD - 1,179 1,240 247 2,666 10.7%
32 Providence RI (524) 1,508 935 646 2,566 10.3%
33 Wichita KS (262) 1,231 1,415 167 2,551 10.2%
34 Milwaukee WI (140) 1,483 805 275 2,423 9.7%
35 Jacksonville FL - 1,224 942 212 2,378 9.5%
36 Cheyenne WY - 1,199 862 276 2,337 9.3%
37 Omaha NE (349) 1,193 1,021 461 2,327 9.3%
38 Des Moines IA (111) 1,179 930 273 2,272 9.1%
39 Baltimore MD (526) 1,676 811 258 2,219 8.9%
40 Fargo ND 7 1,057 909 212 2,185 8.7%
41 Newark NJ (882) 2,012 780 259 2,169 8.7%
42 Manchester NH - 1,548 298 292 2,139 8.6%
43 Wilmington DE 313 1,634 9 159 2,115 8.5%
44 Bridgeport CT (796) 1,661 872 375 2,112 8.4%
45 Anchorage AK - 1,780 83 203 2,066 8.3%
46 Boise ID (290) 1,057 1,011 228 2,006 8.0%
47 Billings MT 241 1,114 18 425 1,798 7.2%
48 Albuquerque NM (594) 1,089 1,148 136 1,779 7.1%
49 Washington DC (2,572) 2,772 945 193 1,339 5.4%
50 Minneapolis MN (2,258) 1,481 1,071 293 587 2.3%
51 Burlington VT (2,666) 1,899 916 236 385 1.5%
AVERAGE 1/ (117) 1,603 1,025 299 2,811 11.2%
MEDIAN 0 1,483 999 276 2,904 11.6%
1/ Based on jurisdictions levying tax.
2/ Amounts in parentheses represent refundable State Earned Income Tax Credits. Negative income tax burdens in DC, MN, and VT also
include a renter’s rebate through the income tax. States with dashes do not have an income tax. Tennessee and New Hampshire tax interest and
dividend income but the exemptions are high enough to eliminate individual income taxes at all income levels used in the study.
3/ Based on 15 percent of estimated annual rent.
4/ States with dashes do not have a sales tax. For states with no state sales tax where there is a small sales tax burden listed, such as AK, DE,
MT, and NH, some selective sales taxes apply to consumption items included.
Part I: Tax Burdens in Washington, DC Compared with Those in the Largest City in Each State
2019 Tax Rates and Tax Burdens in the District of Columbia: A Nationwide Comparison
16
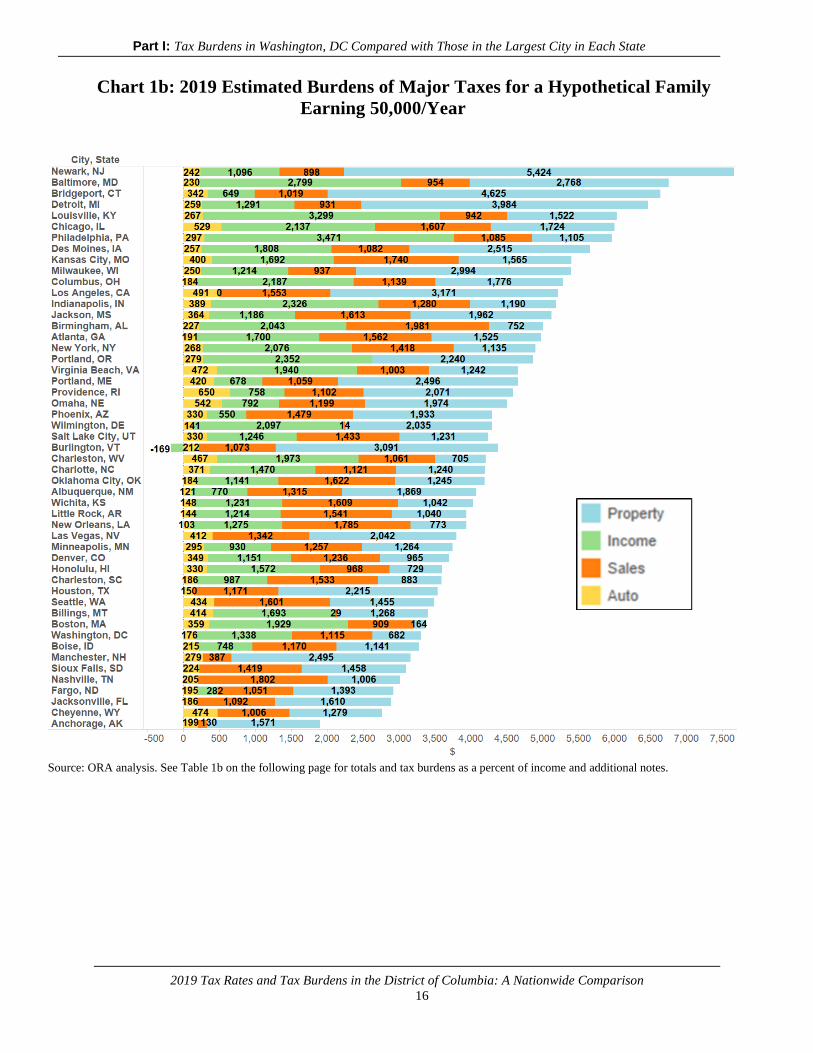
Chart 1b: 2019 Estimated Burdens of Major Taxes for a Hypothetical Family
Earning 50,000/Year
Source: ORA analysis. See Table 1b on the following page for totals and tax burdens as a percent of income and additional notes.
Part I: Tax Burdens in Washington, DC Compared with Those in the Largest City in Each State
2019 Tax Rates and Tax Burdens in the District of Columbia: A Nationwide Comparison
17
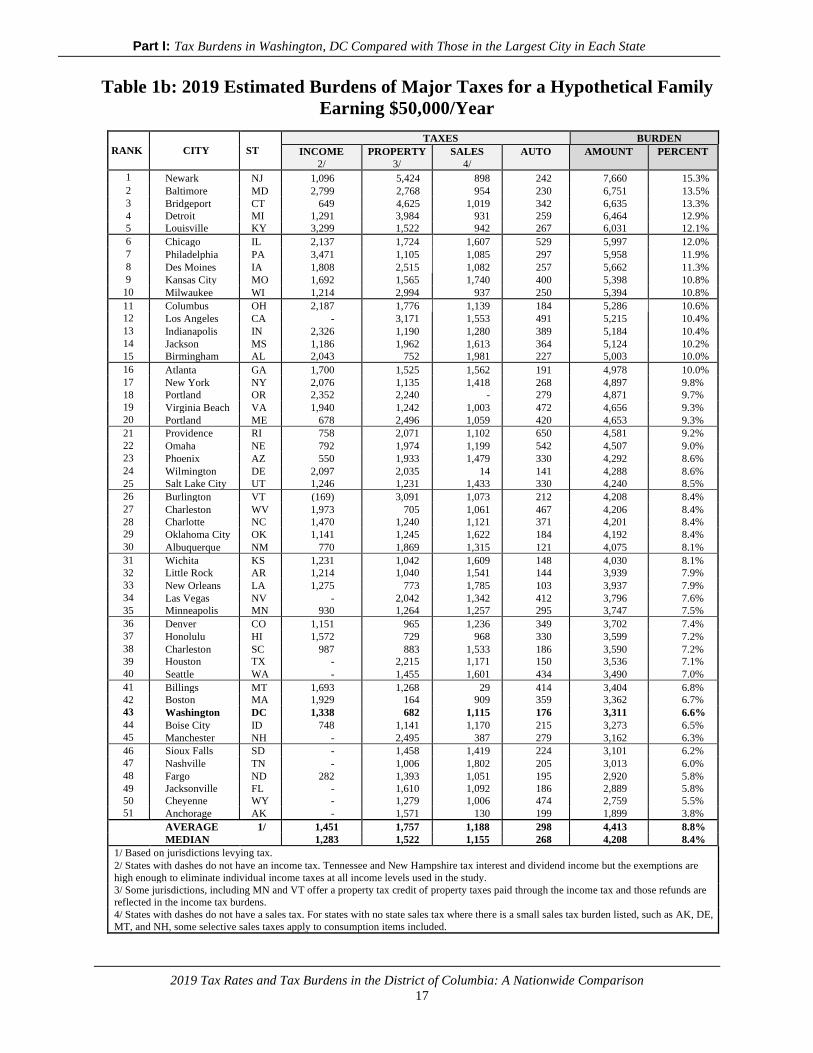
Table 1b: 2019 Estimated Burdens of Major Taxes for a Hypothetical Family
Earning $50,000/Year
RANK
CITY
ST
TAXES BURDEN
INCOME
2/
PROPERTY
3/
SALES
4/
AUTO AMOUNT PERCENT
1 Newark NJ 1,096 5,424 898 242 7,660 15.3%
2 Baltimore MD 2,799 2,768 954 230 6,751 13.5%
3 Bridgeport CT 649 4,625 1,019 342 6,635 13.3%
4 Detroit MI 1,291 3,984 931 259 6,464 12.9%
5 Louisville KY 3,299 1,522 942 267 6,031 12.1%
6 Chicago IL 2,137 1,724 1,607 529 5,997 12.0%
7 Philadelphia PA 3,471 1,105 1,085 297 5,958 11.9%
8 Des Moines IA 1,808 2,515 1,082 257 5,662 11.3%
9 Kansas City MO 1,692 1,565 1,740 400 5,398 10.8%
10 Milwaukee WI 1,214 2,994 937 250 5,394 10.8%
11 Columbus OH 2,187 1,776 1,139 184 5,286 10.6%
12 Los Angeles CA - 3,171 1,553 491 5,215 10.4%
13 Indianapolis IN 2,326 1,190 1,280 389 5,184 10.4%
14 Jackson MS 1,186 1,962 1,613 364 5,124 10.2%
15 Birmingham AL 2,043 752 1,981 227 5,003 10.0%
16 Atlanta GA 1,700 1,525 1,562 191 4,978 10.0%
17 New York NY 2,076 1,135 1,418 268 4,897 9.8%
18 Portland OR 2,352 2,240 - 279 4,871 9.7%
19 Virginia Beach VA 1,940 1,242 1,003 472 4,656 9.3%
20 Portland ME 678 2,496 1,059 420 4,653 9.3%
21 Providence RI 758 2,071 1,102 650 4,581 9.2%
22 Omaha NE 792 1,974 1,199 542 4,507 9.0%
23 Phoenix AZ 550 1,933 1,479 330 4,292 8.6%
24 Wilmington DE 2,097 2,035 14 141 4,288 8.6%
25 Salt Lake City UT 1,246 1,231 1,433 330 4,240 8.5%
26 Burlington VT (169) 3,091 1,073 212 4,208 8.4%
27 Charleston WV 1,973 705 1,061 467 4,206 8.4%
28 Charlotte NC 1,470 1,240 1,121 371 4,201 8.4%
29 Oklahoma City OK 1,141 1,245 1,622 184 4,192 8.4%
30 Albuquerque NM 770 1,869 1,315 121 4,075 8.1%
31 Wichita KS 1,231 1,042 1,609 148 4,030 8.1%
32 Little Rock AR 1,214 1,040 1,541 144 3,939 7.9%
33 New Orleans LA 1,275 773 1,785 103 3,937 7.9%
34 Las Vegas NV - 2,042 1,342 412 3,796 7.6%
35 Minneapolis MN 930 1,264 1,257 295 3,747 7.5%
36 Denver CO 1,151 965 1,236 349 3,702 7.4%
37 Honolulu HI 1,572 729 968 330 3,599 7.2%
38 Charleston SC 987 883 1,533 186 3,590 7.2%
39 Houston TX - 2,215 1,171 150 3,536 7.1%
40 Seattle WA - 1,455 1,601 434 3,490 7.0%
41 Billings MT 1,693 1,268 29 414 3,404 6.8%
42 Boston MA 1,929 164 909 359 3,362 6.7%
43 Washington DC 1,338 682 1,115 176 3,311 6.6%
44 Boise City ID 748 1,141 1,170 215 3,273 6.5%
45 Manchester NH - 2,495 387 279 3,162 6.3%
46 Sioux Falls SD - 1,458 1,419 224 3,101 6.2%
47 Nashville TN - 1,006 1,802 205 3,013 6.0%
48 Fargo ND 282 1,393 1,051 195 2,920 5.8%
49 Jacksonville FL - 1,610 1,092 186 2,889 5.8%
50 Cheyenne WY - 1,279 1,006 474 2,759 5.5%
51 Anchorage AK - 1,571 130 199 1,899 3.8%
AVERAGE 1/ 1,451 1,757 1,188 298 4,413 8.8%
MEDIAN 1,283 1,522 1,155 268 4,208 8.4%
1/ Based on jurisdictions levying tax.
2/ States with dashes do not have an income tax. Tennessee and New Hampshire tax interest and dividend income but the exemptions are
high enough to eliminate individual income taxes at all income levels used in the study.
3/ Some jurisdictions, including MN and VT offer a property tax credit of property taxes paid through the income tax and those refunds are
reflected in the income tax burdens.
4/ States with dashes do not have a sales tax. For states with no state sales tax where there is a small sales tax burden listed, such as AK, DE,
MT, and NH, some selective sales taxes apply to consumption items included.
Part I: Tax Burdens in Washington, DC Compared with Those in the Largest City in Each State
2019 Tax Rates and Tax Burdens in the District of Columbia: A Nationwide Comparison
18
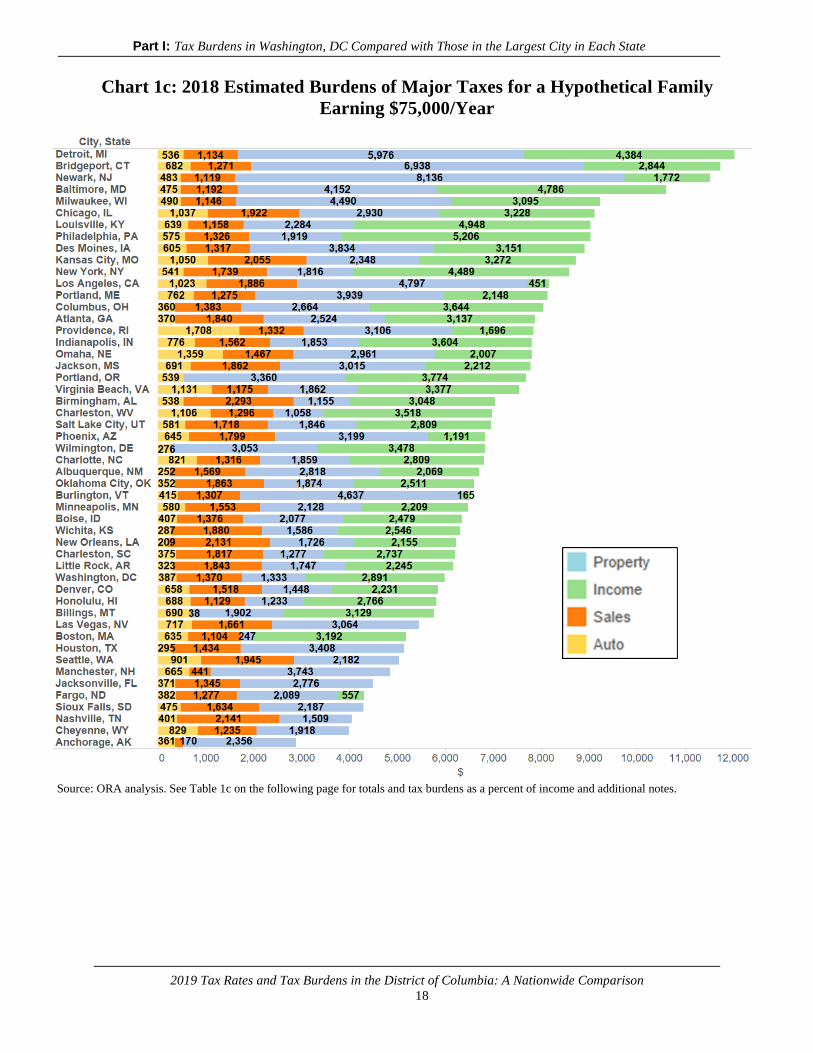
Chart 1c: 2018 Estimated Burdens of Major Taxes for a Hypothetical Family
Earning $75,000/Year
Source: ORA analysis. See Table 1c on the following page for totals and tax burdens as a percent of income and additional notes.

Part I: Tax Burdens in Washington, DC Compared with Those in the Largest City in Each State
2019 Tax Rates and Tax Burdens in the District of Columbia: A Nationwide Comparison
19
Table 1c: 2019 Estimated Burdens of Major Taxes for a Hypothetical Family
Earning $75,000/Year
RANK
CITY ST
TAXES BURDEN
INCOME 2/ PROPERTY 3/ SALES 4/ AUTO AMOUNT PERCENT
1 Detroit MI 4,384 5,976 1,134 536 12,030 16.0%
2 Bridgeport CT 2,844 6,938 1,271 682 11,735 15.6%
3 Newark NJ 1,772 8,136 1,119 483 11,510 15.3%
4 Baltimore MD 4,786 4,152 1,192 475 10,605 14.1%
5 Milwaukee WI 3,095 4,490 1,146 490 9,221 12.3%
6 Chicago IL 3,228 2,930 1,922 1,037 9,118 12.2%
7 Louisville KY 4,948 2,284 1,158 639 9,028 12.0%
8 Philadelphia PA 5,206 1,919 1,326 575 9,027 12.0%
9 Des Moines IA 3,151 3,834 1,317 605 8,907 11.9%
10 Kansas City MO 3,272 2,348 2,055 1,050 8,725 11.6%
11 New York NY 4,489 1,816 1,739 541 8,586 11.4%
12 Los Angeles CA 451 4,797 1,886 1,023 8,157 10.9%
13 Portland ME 2,148 3,939 1,275 762 8,125 10.8%
14 Columbus OH 3,644 2,664 1,383 360 8,050 10.7%
15 Atlanta GA 3,137 2,524 1,840 370 7,871 10.5%
16 Providence RI 1,696 3,106 1,332 1,708 7,842 10.5%
17 Indianapolis IN 3,604 1,853 1,562 776 7,795 10.4%
18 Omaha NE 2,007 2,961 1,467 1,359 7,794 10.4%
19 Jackson MS 2,212 3,015 1,862 691 7,780 10.4%
20 Portland OR 3,774 3,360 - 539 7,672 10.2%
21 Virginia Beach VA 3,377 1,862 1,175 1,131 7,545 10.1%
22 Birmingham AL 3,048 1,155 2,293 538 7,034 9.4%
23 Charleston WV 3,518 1,058 1,296 1,106 6,978 9.3%
24 Salt Lake City UT 2,809 1,846 1,718 581 6,954 9.3%
25 Phoenix AZ 1,191 3,199 1,799 645 6,834 9.1%
26 Wilmington DE 3,478 3,053 19 276 6,825 9.1%
27 Charlotte NC 2,809 1,859 1,316 821 6,806 9.1%
28 Albuquerque NM 2,069 2,818 1,569 252 6,708 8.9%
29 Oklahoma City OK 2,511 1,874 1,863 352 6,600 8.8%
30 Burlington VT 165 4,637 1,307 415 6,523 8.7%
31 Minneapolis MN 2,209 2,128 1,553 580 6,470 8.6%
32 Boise ID 2,479 2,077 1,376 407 6,338 8.5%
33 Wichita KS 2,546 1,586 1,880 287 6,300 8.4%
34 New Orleans LA 2,155 1,726 2,131 209 6,221 8.3%
35 Charleston SC 2,737 1,277 1,817 375 6,207 8.3%
36 Little Rock AR 2,245 1,747 1,843 323 6,157 8.2%
37 Washington DC 2,891 1,333 1,370 387 5,980 8.0%
38 Denver CO 2,231 1,448 1,518 658 5,856 7.8%
39 Honolulu HI 2,766 1,233 1,129 688 5,816 7.8%
40 Billings MT 3,129 1,902 38 690 5,759 7.7%
41 Las Vegas NV - 3,064 1,661 717 5,442 7.3%
42 Boston MA 3,192 247 1,104 635 5,177 6.9%
43 Houston TX - 3,408 1,434 295 5,137 6.8%
44 Seattle WA - 2,182 1,945 901 5,028 6.7%
45 Manchester NH - 3,743 441 665 4,849 6.5%
46 Jacksonville FL - 2,776 1,345 371 4,492 6.0%
47 Fargo ND 557 2,089 1,277 382 4,305 5.7%
48 Sioux Falls SD - 2,187 1,634 475 4,296 5.7%
49 Nashville TN - 1,509 2,141 401 4,051 5.4%
50 Cheyenne WY - 1,918 1,235 829 3,982 5.3%
51 Anchorage AK - 2,356 170 361 2,887 3.8%
AVERAGE 1/ 2,809 2,713 1,428 617 7,042 9.4%
MEDIAN 2,827 2,284 1,379 575 6,825 9.1%
1/ Based on jurisdictions levying tax.
2/ States with dashes do not have an income tax. Tennessee and New Hampshire tax interest and dividend income but the exemptions are high
enough to eliminate individual income taxes at all income levels used in the study. 3/ Some jurisdictions, including MN and VT offer a property
tax credit of property taxes paid through the income tax and those refunds are reflected in the income tax burdens.
4/ States with dashes do not have a sales tax. For states with no state sales tax where there is a small sales tax burden listed, such as AK, DE,
MT, and NH, some selective sales taxes apply to consumption items included.
Part I: Tax Burdens in Washington, DC Compared with Those in the Largest City in Each State
2019 Tax Rates and Tax Burdens in the District of Columbia: A Nationwide Comparison
20
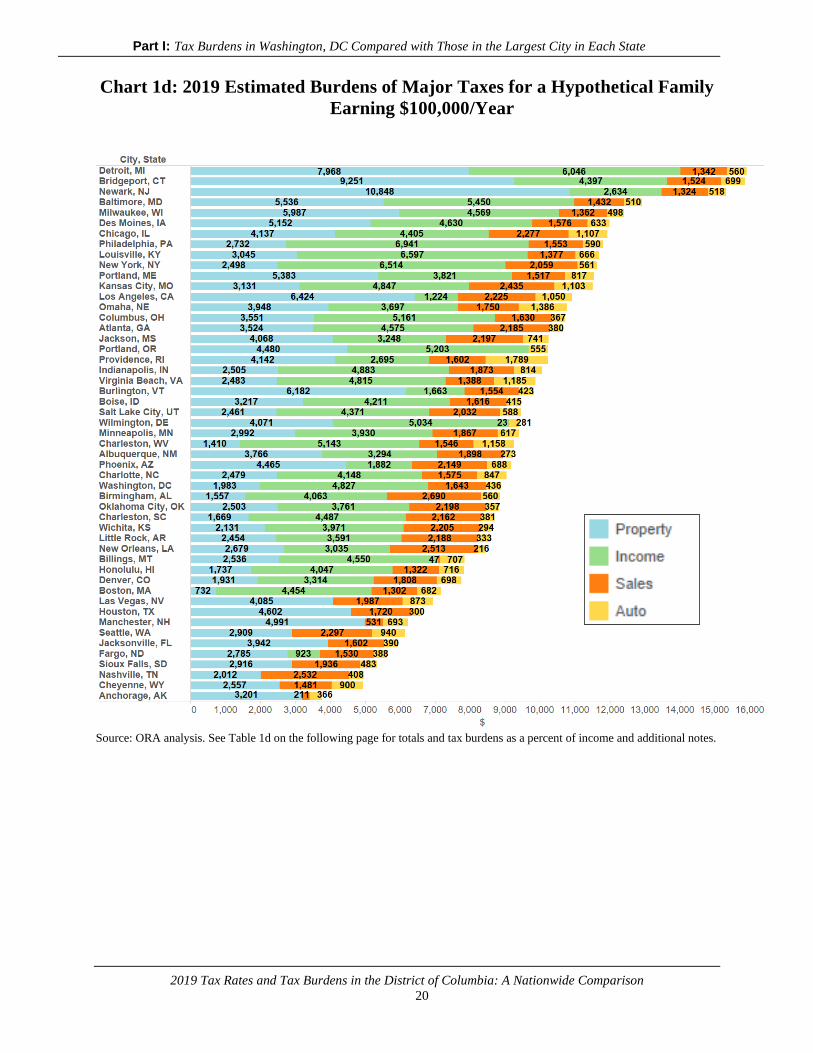
Chart 1d: 2019 Estimated Burdens of Major Taxes for a Hypothetical Family
Earning $100,000/Year
Source: ORA analysis. See Table 1d on the following page for totals and tax burdens as a percent of income and additional notes.
Part I: Tax Burdens in Washington, DC Compared with Those in the Largest City in Each State
2019 Tax Rates and Tax Burdens in the District of Columbia: A Nationwide Comparison
21
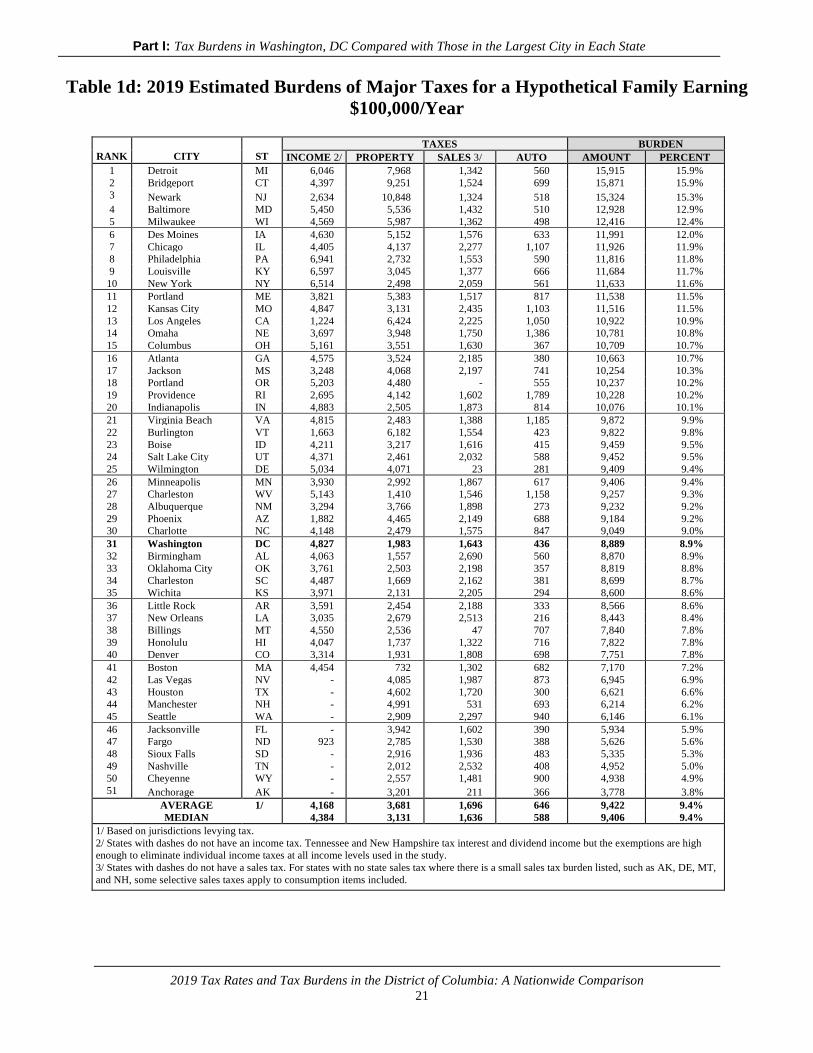
Table 1d: 2019 Estimated Burdens of Major Taxes for a Hypothetical Family Earning
$100,000/Year
RANK
CITY
ST
TAXES BURDEN
INCOME 2/ PROPERTY SALES 3/ AUTO AMOUNT PERCENT
1 Detroit MI 6,046 7,968 1,342 560 15,915 15.9%
2 Bridgeport CT 4,397 9,251 1,524 699 15,871 15.9%
3 Newark NJ 2,634 10,848 1,324 518 15,324 15.3%
4 Baltimore MD 5,450 5,536 1,432 510 12,928 12.9%
5 Milwaukee WI 4,569 5,987 1,362 498 12,416 12.4%
6 Des Moines IA 4,630 5,152 1,576 633 11,991 12.0%
7 Chicago IL 4,405 4,137 2,277 1,107 11,926 11.9%
8 Philadelphia PA 6,941 2,732 1,553 590 11,816 11.8%
9 Louisville KY 6,597 3,045 1,377 666 11,684 11.7%
10 New York NY 6,514 2,498 2,059 561 11,633 11.6%
11 Portland ME 3,821 5,383 1,517 817 11,538 11.5%
12 Kansas City MO 4,847 3,131 2,435 1,103 11,516 11.5%
13 Los Angeles CA 1,224 6,424 2,225 1,050 10,922 10.9%
14 Omaha NE 3,697 3,948 1,750 1,386 10,781 10.8%
15 Columbus OH 5,161 3,551 1,630 367 10,709 10.7%
16 Atlanta GA 4,575 3,524 2,185 380 10,663 10.7%
17 Jackson MS 3,248 4,068 2,197 741 10,254 10.3%
18 Portland OR 5,203 4,480 - 555 10,237 10.2%
19 Providence RI 2,695 4,142 1,602 1,789 10,228 10.2%
20 Indianapolis IN 4,883 2,505 1,873 814 10,076 10.1%
21 Virginia Beach VA 4,815 2,483 1,388 1,185 9,872 9.9%
22 Burlington VT 1,663 6,182 1,554 423 9,822 9.8%
23 Boise ID 4,211 3,217 1,616 415 9,459 9.5%
24 Salt Lake City UT 4,371 2,461 2,032 588 9,452 9.5%
25 Wilmington DE 5,034 4,071 23 281 9,409 9.4%
26 Minneapolis MN 3,930 2,992 1,867 617 9,406 9.4%
27 Charleston WV 5,143 1,410 1,546 1,158 9,257 9.3%
28 Albuquerque NM 3,294 3,766 1,898 273 9,232 9.2%
29 Phoenix AZ 1,882 4,465 2,149 688 9,184 9.2%
30 Charlotte NC 4,148 2,479 1,575 847 9,049 9.0%
31 Washington DC 4,827 1,983 1,643 436 8,889 8.9%
32 Birmingham AL 4,063 1,557 2,690 560 8,870 8.9%
33 Oklahoma City OK 3,761 2,503 2,198 357 8,819 8.8%
34 Charleston SC 4,487 1,669 2,162 381 8,699 8.7%
35 Wichita KS 3,971 2,131 2,205 294 8,600 8.6%
36 Little Rock AR 3,591 2,454 2,188 333 8,566 8.6%
37 New Orleans LA 3,035 2,679 2,513 216 8,443 8.4%
38 Billings MT 4,550 2,536 47 707 7,840 7.8%
39 Honolulu HI 4,047 1,737 1,322 716 7,822 7.8%
40 Denver CO 3,314 1,931 1,808 698 7,751 7.8%
41 Boston MA 4,454 732 1,302 682 7,170 7.2%
42 Las Vegas NV - 4,085 1,987 873 6,945 6.9%
43 Houston TX - 4,602 1,720 300 6,621 6.6%
44 Manchester NH - 4,991 531 693 6,214 6.2%
45 Seattle WA - 2,909 2,297 940 6,146 6.1%
46 Jacksonville FL - 3,942 1,602 390 5,934 5.9%
47 Fargo ND 923 2,785 1,530 388 5,626 5.6%
48 Sioux Falls SD - 2,916 1,936 483 5,335 5.3%
49 Nashville TN - 2,012 2,532 408 4,952 5.0%
50 Cheyenne WY - 2,557 1,481 900 4,938 4.9%
51 Anchorage AK - 3,201 211 366 3,778 3.8%
AVERAGE 1/ 4,168 3,681 1,696 646 9,422 9.4%
MEDIAN 4,384 3,131 1,636 588 9,406 9.4%
1/ Based on jurisdictions levying tax.
2/ States with dashes do not have an income tax. Tennessee and New Hampshire tax interest and dividend income but the exemptions are high
enough to eliminate individual income taxes at all income levels used in the study.
3/ States with dashes do not have a sales tax. For states with no state sales tax where there is a small sales tax burden listed, such as AK, DE, MT,
and NH, some selective sales taxes apply to consumption items included.
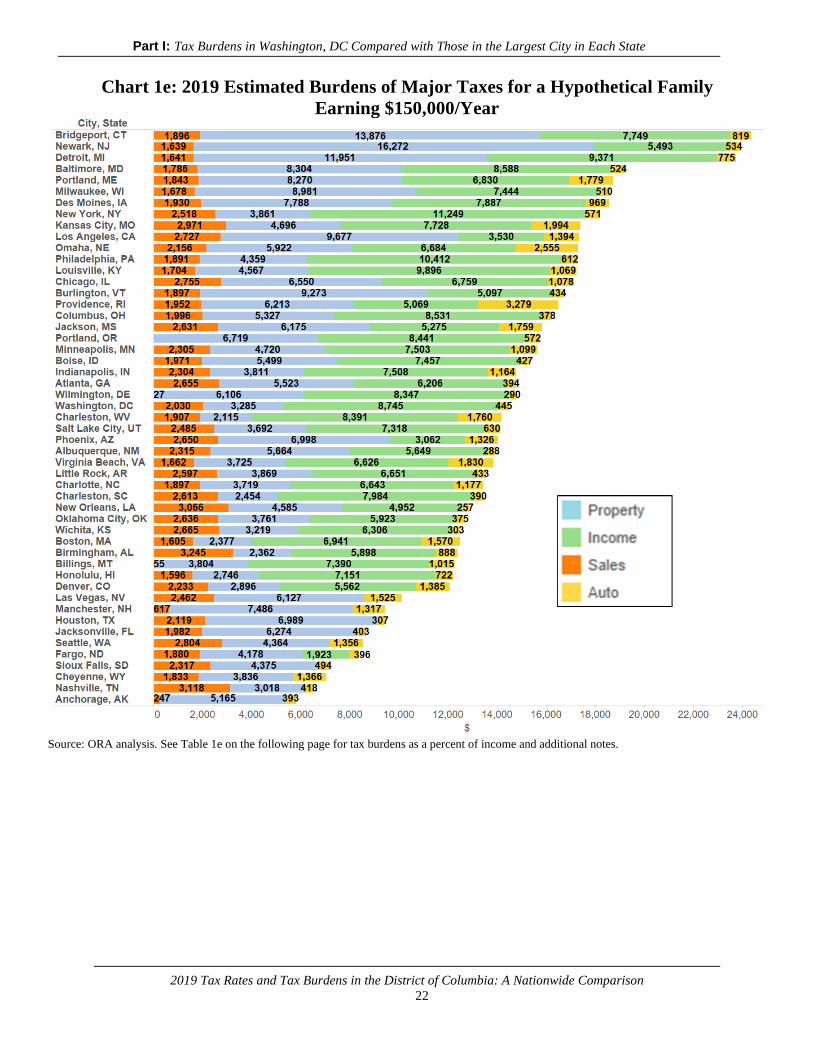
Part I: Tax Burdens in Washington, DC Compared with Those in the Largest City in Each State
2019 Tax Rates and Tax Burdens in the District of Columbia: A Nationwide Comparison
22
Chart 1e: 2019 Estimated Burdens of Major Taxes for a Hypothetical Family
Earning $150,000/Year
Source: ORA analysis. See Table 1e on the following page for tax burdens as a percent of income and additional notes.
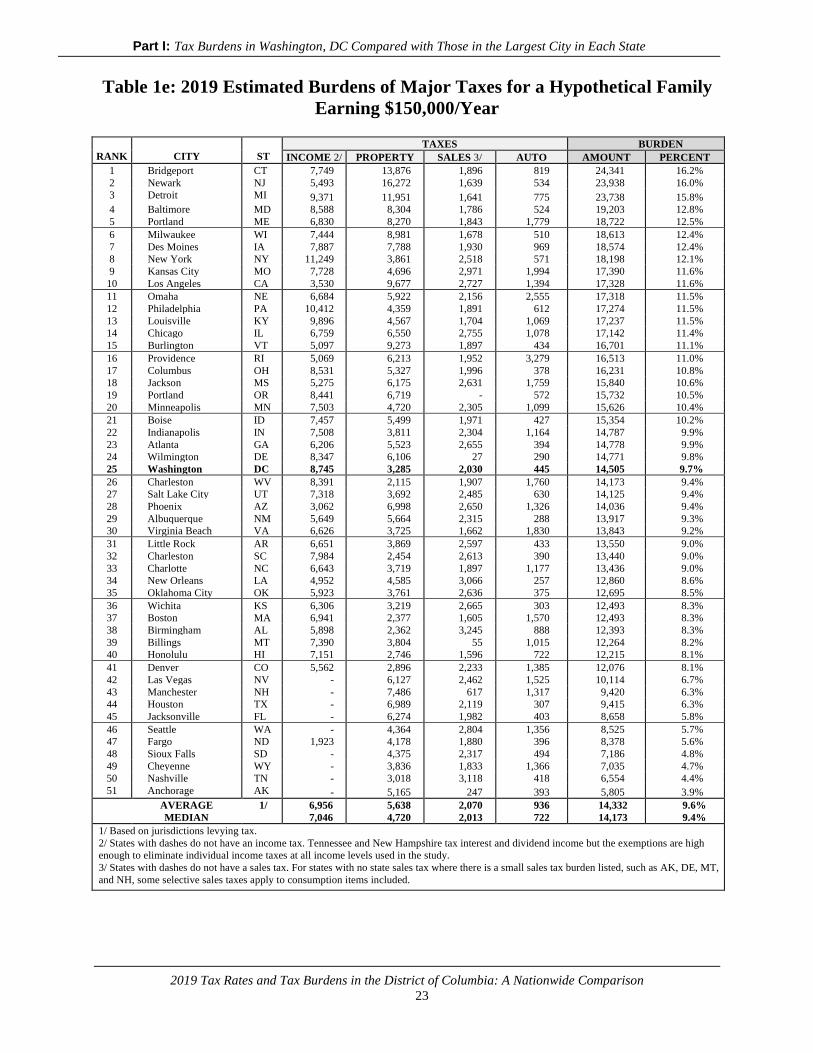
Part I: Tax Burdens in Washington, DC Compared with Those in the Largest City in Each State
2019 Tax Rates and Tax Burdens in the District of Columbia: A Nationwide Comparison
23
Table 1e: 2019 Estimated Burdens of Major Taxes for a Hypothetical Family
Earning $150,000/Year
RANK
CITY
ST
TAXES BURDEN
INCOME 2/ PROPERTY SALES 3/ AUTO AMOUNT PERCENT
1 Bridgeport CT 7,749 13,876 1,896 819 24,341 16.2%
2 Newark NJ 5,493 16,272 1,639 534 23,938 16.0%
3 Detroit MI 9,371 11,951 1,641 775 23,738 15.8%
4 Baltimore MD 8,588 8,304 1,786 524 19,203 12.8%
5 Portland ME 6,830 8,270 1,843 1,779 18,722 12.5%
6 Milwaukee WI 7,444 8,981 1,678 510 18,613 12.4%
7 Des Moines IA 7,887 7,788 1,930 969 18,574 12.4%
8 New York NY 11,249 3,861 2,518 571 18,198 12.1%
9 Kansas City MO 7,728 4,696 2,971 1,994 17,390 11.6%
10 Los Angeles CA 3,530 9,677 2,727 1,394 17,328 11.6%
11 Omaha NE 6,684 5,922 2,156 2,555 17,318 11.5%
12 Philadelphia PA 10,412 4,359 1,891 612 17,274 11.5%
13 Louisville KY 9,896 4,567 1,704 1,069 17,237 11.5%
14 Chicago IL 6,759 6,550 2,755 1,078 17,142 11.4%
15 Burlington VT 5,097 9,273 1,897 434 16,701 11.1%
16 Providence RI 5,069 6,213 1,952 3,279 16,513 11.0%
17 Columbus OH 8,531 5,327 1,996 378 16,231 10.8%
18 Jackson MS 5,275 6,175 2,631 1,759 15,840 10.6%
19 Portland OR 8,441 6,719 - 572 15,732 10.5%
20 Minneapolis MN 7,503 4,720 2,305 1,099 15,626 10.4%
21 Boise ID 7,457 5,499 1,971 427 15,354 10.2%
22 Indianapolis IN 7,508 3,811 2,304 1,164 14,787 9.9%
23 Atlanta GA 6,206 5,523 2,655 394 14,778 9.9%
24 Wilmington DE 8,347 6,106 27 290 14,771 9.8%
25 Washington DC 8,745 3,285 2,030 445 14,505 9.7%
26 Charleston WV 8,391 2,115 1,907 1,760 14,173 9.4%
27 Salt Lake City UT 7,318 3,692 2,485 630 14,125 9.4%
28 Phoenix AZ 3,062 6,998 2,650 1,326 14,036 9.4%
29 Albuquerque NM 5,649 5,664 2,315 288 13,917 9.3%
30 Virginia Beach VA 6,626 3,725 1,662 1,830 13,843 9.2%
31 Little Rock AR 6,651 3,869 2,597 433 13,550 9.0%
32 Charleston SC 7,984 2,454 2,613 390 13,440 9.0%
33 Charlotte NC 6,643 3,719 1,897 1,177 13,436 9.0%
34 New Orleans LA 4,952 4,585 3,066 257 12,860 8.6%
35 Oklahoma City OK 5,923 3,761 2,636 375 12,695 8.5%
36 Wichita KS 6,306 3,219 2,665 303 12,493 8.3%
37 Boston MA 6,941 2,377 1,605 1,570 12,493 8.3%
38 Birmingham AL 5,898 2,362 3,245 888 12,393 8.3%
39 Billings MT 7,390 3,804 55 1,015 12,264 8.2%
40 Honolulu HI 7,151 2,746 1,596 722 12,215 8.1%
41 Denver CO 5,562 2,896 2,233 1,385 12,076 8.1%
42 Las Vegas NV - 6,127 2,462 1,525 10,114 6.7%
43 Manchester NH - 7,486 617 1,317 9,420 6.3%
44 Houston TX - 6,989 2,119 307 9,415 6.3%
45 Jacksonville FL - 6,274 1,982 403 8,658 5.8%
46 Seattle WA - 4,364 2,804 1,356 8,525 5.7%
47 Fargo ND 1,923 4,178 1,880 396 8,378 5.6%
48 Sioux Falls SD - 4,375 2,317 494 7,186 4.8%
49 Cheyenne WY - 3,836 1,833 1,366 7,035 4.7%
50 Nashville TN - 3,018 3,118 418 6,554 4.4%
51 Anchorage AK - 5,165 247 393 5,805 3.9%
AVERAGE 1/ 6,956 5,638 2,070 936 14,332 9.6%
MEDIAN 7,046 4,720 2,013 722 14,173 9.4%
1/ Based on jurisdictions levying tax.
2/ States with dashes do not have an income tax. Tennessee and New Hampshire tax interest and dividend income but the exemptions are high
enough to eliminate individual income taxes at all income levels used in the study.
3/ States with dashes do not have a sales tax. For states with no state sales tax where there is a small sales tax burden listed, such as AK, DE, MT,
and NH, some selective sales taxes apply to consumption items included.
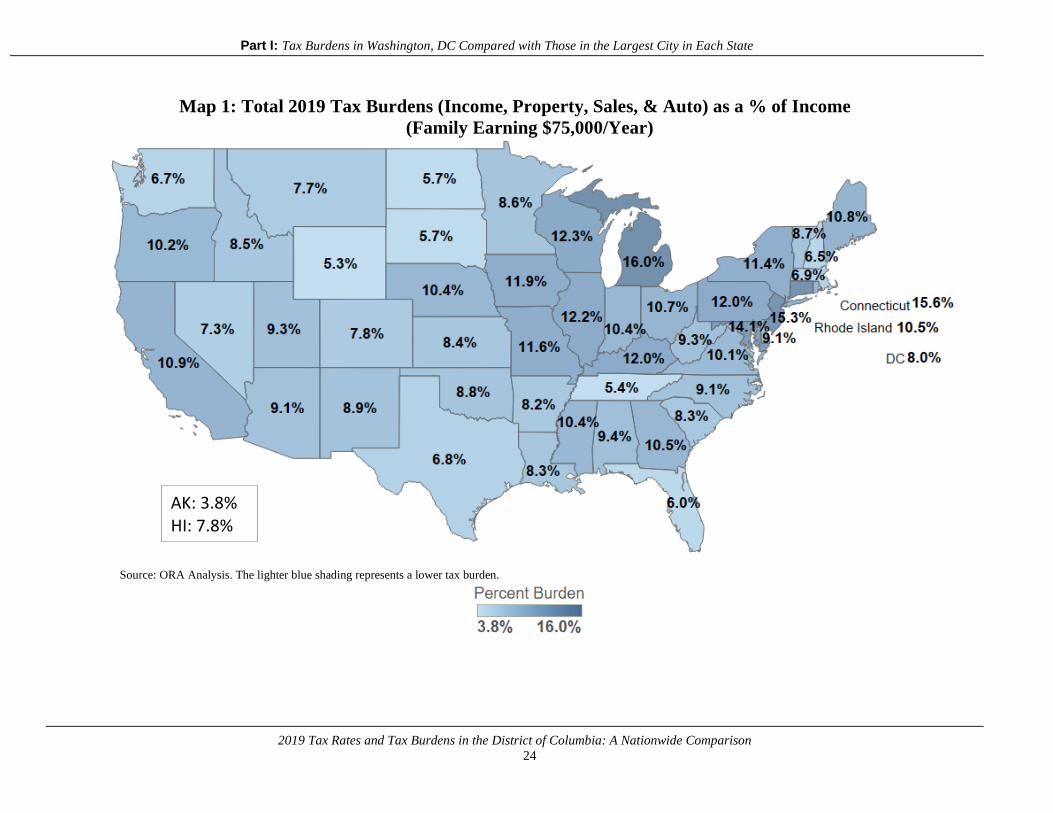
Part I: Tax Burdens in Washington, DC Compared with Those in the Largest City in Each State
2019 Tax Rates and Tax Burdens in the District of Columbia: A Nationwide Comparison
24
Map 1: Total 2019 Tax Burdens (Income, Property, Sales, & Auto) as a % of Income
(Family Earning $75,000/Year)
Source: ORA Analysis. The lighter blue shading represents a lower tax burden.
AK: 3.8% HI: 7.8%
Part I: Tax Burdens in Washington, DC Compared with Those in the Largest City in Each State
2019 Tax Rates and Tax Burdens in the District of Columbia: A Nationwide Comparison
25
CHAPTER III
Comparing Specific Tax Burdens for a Hypothetical Family of
Three in the Largest City in Each State
Individual Income Tax
Residents of 44 of the 51 cities in the study are subject to some type of an individual
income tax at the state and/or local levels (In NH and TN only interest and dividends are subject
to the income tax, but they are included in this count). Individual income tax burdens vary
widely due to factors such as differences in tax base, tax rates, exemptions, deductions, and
treatment of federal taxes. These variations are reflected in the individual income tax burdens
shown in Table 3 (page 30) and Chart 2 (page 27).
In twenty-four of the cities that are in states that levy an income tax, the percentage of
income paid in individual income taxes by the family earning $25,000 per year is zero percent
(or less than zero due to refundable credits). Notably, residents of Burlington, Vermont would
receive a refund of $2,666, making it the lowest income tax burden on a family earning $25,000
per year. The highest income tax burden at this lower income level is $1,736, or 6.94 percent in
Philadelphia, Pennsylvania, and next at $1,106, or 4.4 percent in Louisville, Kentucky. At the
$150,000 income level, the burden ranges from a low of $1,923, or 1.3 percent of income in
Fargo, North Dakota, to $11,249 or 7.5 percent in New York City, New York. (New Hampshire
and Tennessee income taxes are applicable only to interest and dividend income and the
exemptions are high enough to eliminate individual income taxes at all income levels used in the
study).
Chart 2 on page 27 provides the income tax burdens on each hypothetical family, sorted
by the family earning $150,000 per year. Viewing the data this way allows an assessment of how
income tax burdens differ between the low- and high-income families in a city and state. Map 2
on page 28 presents the income tax burdens for the family earning $75,000/year.
Several state individual income tax systems are indexed for inflation either for their rate
brackets or credits or both. Indexing allows dollar amounts imbedded in the tax code to retain
their value and not erode. For example, a $10,000 bracket, the level at which income is taxed at a
certain rate, established in 2010 would have a “real” value of just over $12,000 now and
indexing would keep that value up to date. Absent indexing, a taxpayer would have more of their
income which presumably is growing with inflation exposed to the next bracket and a higher
rate. States that tax a percentage of federal net taxable income or a percentage of the federal
liability implicitly accept the federal indexing of tax brackets, exemptions, and the standard
deduction. Table 2 (page 29) lists the various portions that are indexed.
As Table 3 indicates, there are several types of individual income tax systems including
graduated state and local rates, graduated state and flat local rates, flat state and local rates (or
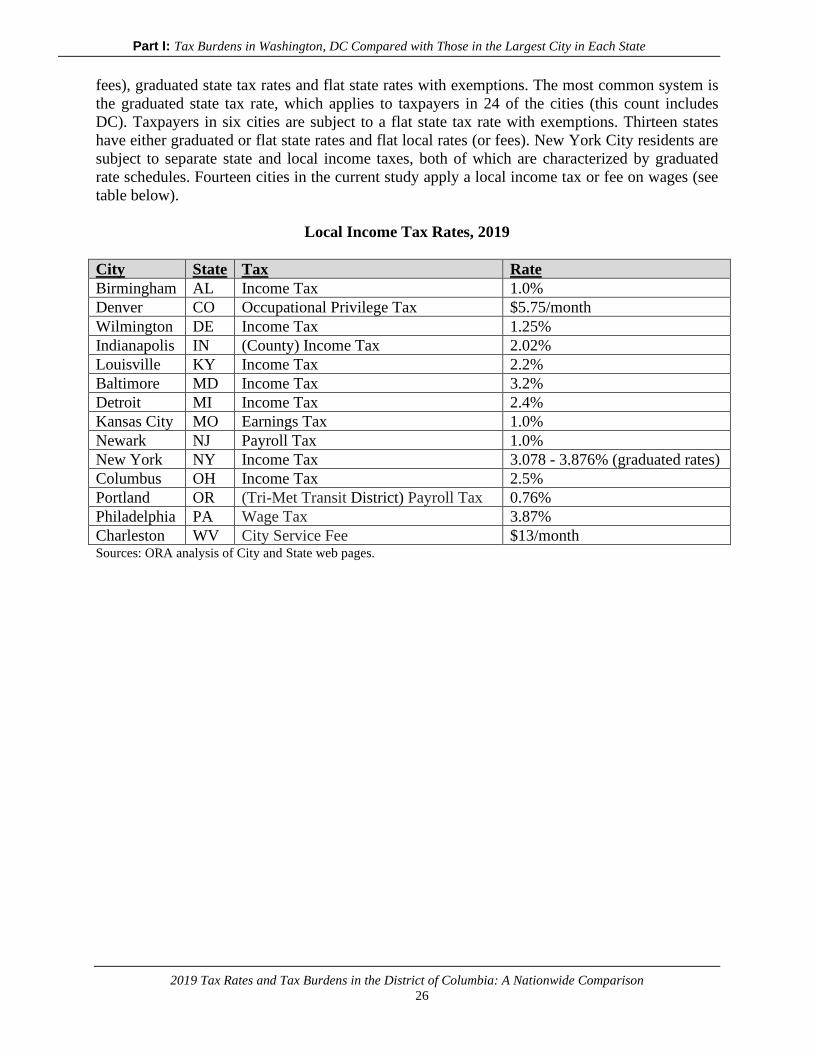
Part I: Tax Burdens in Washington, DC Compared with Those in the Largest City in Each State
2019 Tax Rates and Tax Burdens in the District of Columbia: A Nationwide Comparison
26
fees), graduated state tax rates and flat state rates with exemptions. The most common system is
the graduated state tax rate, which applies to taxpayers in 24 of the cities (this count includes
DC). Taxpayers in six cities are subject to a flat state tax rate with exemptions. Thirteen states
have either graduated or flat state rates and flat local rates (or fees). New York City residents are
subject to separate state and local income taxes, both of which are characterized by graduated
rate schedules. Fourteen cities in the current study apply a local income tax or fee on wages (see
table below).
Local Income Tax Rates, 2019
City State Tax Rate
Birmingham AL Income Tax 1.0%
Denver CO Occupational Privilege Tax $5.75/month
Wilmington DE Income Tax 1.25%
Indianapolis IN (County) Income Tax 2.02%
Louisville KY Income Tax 2.2%
Baltimore MD Income Tax 3.2%
Detroit MI Income Tax 2.4%
Kansas City MO Earnings Tax 1.0%
Newark NJ Payroll Tax 1.0%
New York NY Income Tax 3.078 - 3.876% (graduated rates)
Columbus OH Income Tax 2.5%
Portland OR (Tri-Met Transit District) Payroll Tax 0.76%
Philadelphia PA Wage Tax 3.87%
Charleston WV City Service Fee $13/month Sources: ORA analysis of City and State web pages.
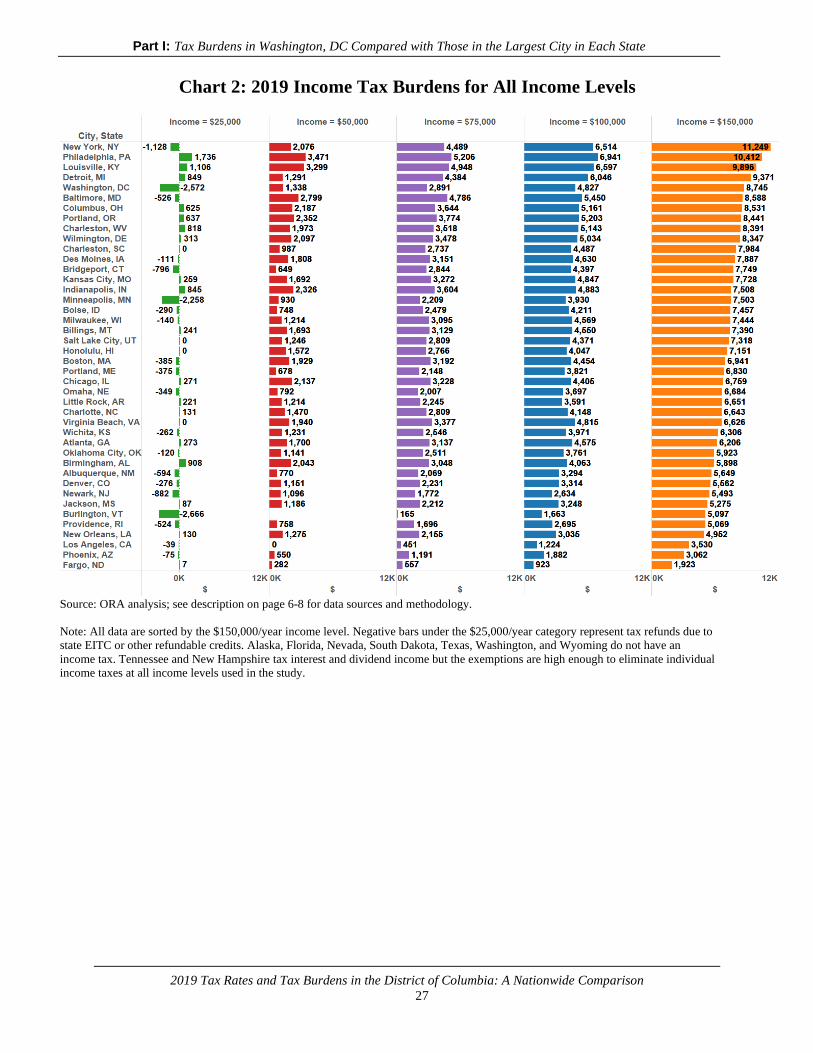
Part I: Tax Burdens in Washington, DC Compared with Those in the Largest City in Each State
2019 Tax Rates and Tax Burdens in the District of Columbia: A Nationwide Comparison
27
Chart 2: 2019 Income Tax Burdens for All Income Levels
Source: ORA analysis; see description on page 6-8 for data sources and methodology.
Note: All data are sorted by the $150,000/year income level. Negative bars under the $25,000/year category represent tax refunds due to
state EITC or other refundable credits. Alaska, Florida, Nevada, South Dakota, Texas, Washington, and Wyoming do not have an
income tax. Tennessee and New Hampshire tax interest and dividend income but the exemptions are high enough to eliminate individual
income taxes at all income levels used in the study.
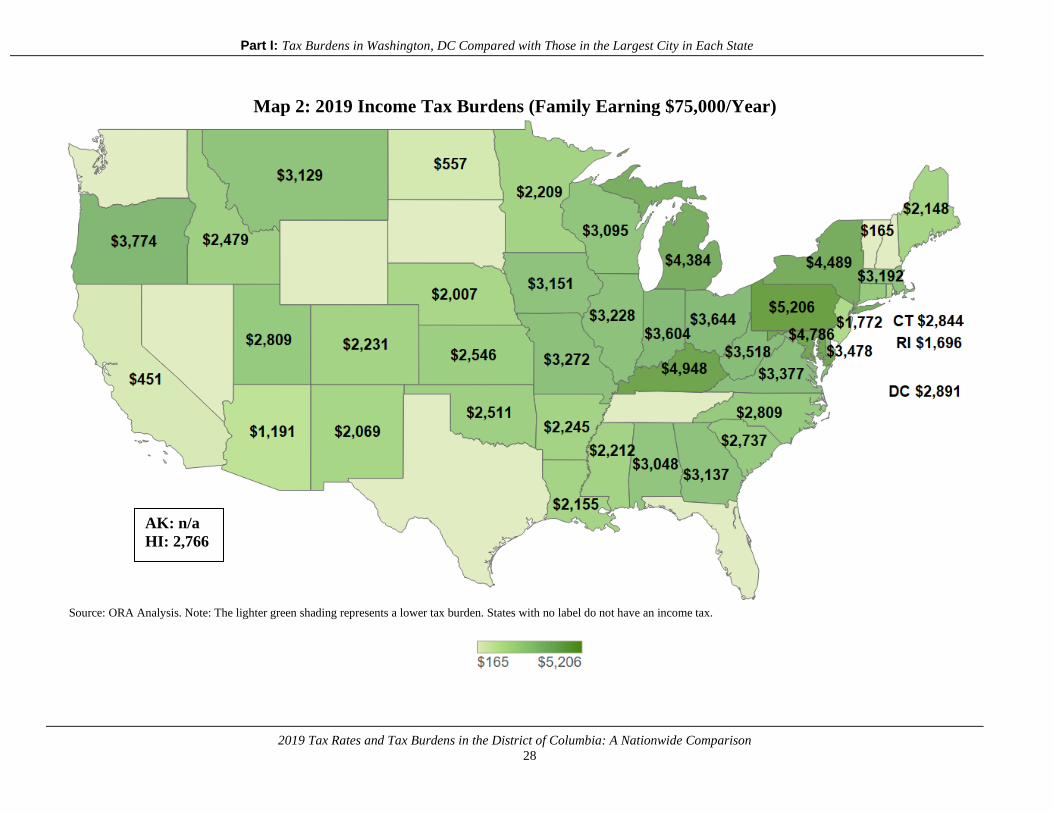
Part I: Tax Burdens in Washington, DC Compared with Those in the Largest City in Each State
2019 Tax Rates and Tax Burdens in the District of Columbia: A Nationwide Comparison
28
Map 2: 2019 Income Tax Burdens (Family Earning $75,000/Year)
Source: ORA Analysis. Note: The lighter green shading represents a lower tax burden. States with no label do not have an income tax.
AK: n/a
HI: 2,766

Part I: Tax Burdens in Washington, DC Compared with Those in the Largest City in Each State
2019 Tax Rates and Tax Burdens in the District of Columbia: A Nationwide Comparison
29
Table 2: States That Index Some Part of Their Individual Income Tax, 2019
STATE
INDEXED PORTION
Arizona Tax brackets, standard deduction, personal exemption
Arkansas Tax brackets, personal exemption
California Tax brackets (partial), exemption (credit), standard deduction
Colorado Standard deduction
Idaho Tax brackets, standard deduction,
Illinois Personal exemption
Iowa Tax brackets, standard deduction
Kentucky Standard deduction
Maine Tax brackets, standard deduction
Michigan Personal exemption
Minnesota Tax brackets, exemptions, standard deduction
Missouri Tax brackets, standard deduction
Montana Tax brackets, exemptions, standard deduction
Nebraska Tax brackets, Personal exemption, standard deduction
New Mexico Standard deduction
North Dakota Tax brackets, standard deduction
Ohio Tax brackets, personal exemption
Oregon Tax brackets (up to $125,000), standard deduction credit, personal exemption
Rhode Island Tax brackets, standard deduction, personal exemption
South Carolina Tax brackets, standard deduction, personal exemption
Utah Standard deduction
Vermont Tax brackets, standard deduction, personal exemption
Washington, DC Standard deduction
Wisconsin Tax brackets, standard deduction Sources: State Web Pages; Federation of Tax Administrators, "State Individual Income Tax Rates (as of January 1, 2019)"; Federation of Tax
Administrators, “State Individual Income Taxes: Federal Starting Points (as of July 1, 2019).” Wolters Kluwer/CCH 2019 State Tax Handbook;
Tax Foundation, “Inflation Adjusting State Tax Codes: A Primer,” October 29, 2019.
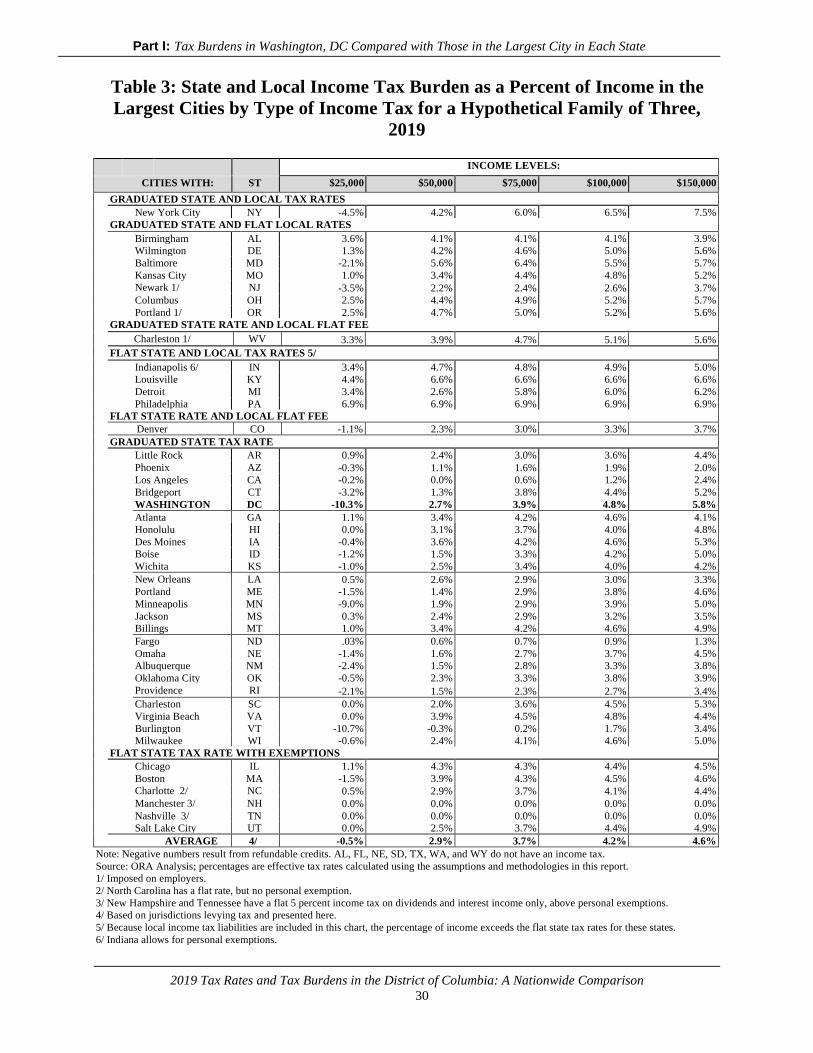
Part I: Tax Burdens in Washington, DC Compared with Those in the Largest City in Each State
2019 Tax Rates and Tax Burdens in the District of Columbia: A Nationwide Comparison
30
Table 3: State and Local Income Tax Burden as a Percent of Income in the
Largest Cities by Type of Income Tax for a Hypothetical Family of Three,
2019 INCOME LEVELS:
CITIES WITH: ST $25,000 $50,000 $75,000 $100,000 $150,000
GRADUATED STATE AND LOCAL TAX RATES New York City NY -4.5% 4.2% 6.0% 6.5% 7.5% GRADUATED STATE AND FLAT LOCAL RATES
Birmingham AL 3.6% 4.1% 4.1% 4.1% 3.9% Wilmington DE 1.3% 4.2% 4.6% 5.0% 5.6% Baltimore MD -2.1% 5.6% 6.4% 5.5% 5.7% Kansas City MO 1.0% 3.4% 4.4% 4.8% 5.2% Newark 1/ NJ -3.5% 2.2% 2.4% 2.6% 3.7% Columbus OH 2.5% 4.4% 4.9% 5.2% 5.7% Portland 1/ OR 2.5% 4.7% 5.0% 5.2% 5.6% GRADUATED STATE RATE AND LOCAL FLAT FEE
Charleston 1/ WV 3.3% 3.9% 4.7% 5.1% 5.6%
FLAT STATE AND LOCAL TAX RATES 5/
Indianapolis 6/ IN 3.4% 4.7% 4.8% 4.9% 5.0% Louisville KY 4.4% 6.6% 6.6% 6.6% 6.6% Detroit MI 3.4% 2.6% 5.8% 6.0% 6.2% Philadelphia PA 6.9% 6.9% 6.9% 6.9% 6.9% FLAT STATE RATE AND LOCAL FLAT FEE Denver CO -1.1% 2.3% 3.0% 3.3% 3.7% GRADUATED STATE TAX RATE
Little Rock AR 0.9% 2.4% 3.0% 3.6% 4.4% Phoenix AZ -0.3% 1.1% 1.6% 1.9% 2.0% Los Angeles CA -0.2% 0.0% 0.6% 1.2% 2.4% Bridgeport CT -3.2% 1.3% 3.8% 4.4% 5.2% WASHINGTON DC -10.3% 2.7% 3.9% 4.8% 5.8% Atlanta GA 1.1% 3.4% 4.2% 4.6% 4.1% Honolulu HI 0.0% 3.1% 3.7% 4.0% 4.8% Des Moines IA -0.4% 3.6% 4.2% 4.6% 5.3% Boise ID -1.2% 1.5% 3.3% 4.2% 5.0% Wichita KS -1.0% 2.5% 3.4% 4.0% 4.2% New Orleans LA 0.5% 2.6% 2.9% 3.0% 3.3% Portland ME -1.5% 1.4% 2.9% 3.8% 4.6% Minneapolis MN -9.0% 1.9% 2.9% 3.9% 5.0% Jackson MS 0.3% 2.4% 2.9% 3.2% 3.5% Billings MT 1.0% 3.4% 4.2% 4.6% 4.9% Fargo ND .03% 0.6% 0.7% 0.9% 1.3% Omaha NE -1.4% 1.6% 2.7% 3.7% 4.5% Albuquerque NM -2.4% 1.5% 2.8% 3.3% 3.8% Oklahoma City OK -0.5% 2.3% 3.3% 3.8% 3.9% Providence RI -2.1% 1.5% 2.3% 2.7% 3.4% Charleston SC 0.0% 2.0% 3.6% 4.5% 5.3% Virginia Beach VA 0.0% 3.9% 4.5% 4.8% 4.4% Burlington VT -10.7% -0.3% 0.2% 1.7% 3.4% Milwaukee WI -0.6% 2.4% 4.1% 4.6% 5.0% FLAT STATE TAX RATE WITH EXEMPTIONS
Chicago IL 1.1% 4.3% 4.3% 4.4% 4.5% Boston MA -1.5% 3.9% 4.3% 4.5% 4.6% Charlotte 2/ NC 0.5% 2.9% 3.7% 4.1% 4.4% Manchester 3/ NH 0.0% 0.0% 0.0% 0.0% 0.0% Nashville 3/ TN 0.0% 0.0% 0.0% 0.0% 0.0%
Salt Lake City UT 0.0% 2.5% 3.7% 4.4% 4.9%
AVERAGE 4/ -0.5% 2.9% 3.7% 4.2% 4.6%
Note: Negative numbers result from refundable credits. AL, FL, NE, SD, TX, WA, and WY do not have an income tax.
Source: ORA Analysis; percentages are effective tax rates calculated using the assumptions and methodologies in this report.
1/ Imposed on employers.
2/ North Carolina has a flat rate, but no personal exemption.
3/ New Hampshire and Tennessee have a flat 5 percent income tax on dividends and interest income only, above personal exemptions.
4/ Based on jurisdictions levying tax and presented here.
5/ Because local income tax liabilities are included in this chart, the percentage of income exceeds the flat state tax rates for these states.
6/ Indiana allows for personal exemptions.

Part I: Tax Burdens in Washington, DC Compared with Those in the Largest City in Each State
2019 Tax Rates and Tax Burdens in the District of Columbia: A Nationwide Comparison
31
Real Property Tax
All 51 cities in the study levy a property tax on residential property located within the
city. The real property tax is a function of housing values, real estate tax rates, assessment
practice, homeowner exemptions, and credits. Nominal rates used in Table 4 (page 33) represent
the “announced” rates levied by the jurisdiction, while effective rates take into account how the
assessed value differs from market value in each city. Effective rates range from a high of $4.27
per $100 of assessed value in Bridgeport, Connecticut to $0.35 per $100 of assessed value in
Honolulu, Hawaii. Statutory assessment levels vary dramatically from 1.35 percent of assessed
value in Billings, Montana, to 100 percent assessment in twenty cities, including the District of
Columbia.
As previously mentioned, the current 2019 report includes median sales ratio statistics
where available to derive an “effective assessment level” that results from multiplying the
statutory assessment level times the median sales ratio statistic (see Table 4, page 33).
Local assessors, state tax and county officials provided the nominal rates, assessment
levels, and median sales ratios of each city and state. Research of government web sites was
performed to fill in any gaps to present the most accurate and updated information. The District’s
effective property tax rate (net of assessment value and median sales ratio) is among the lowest
of the 51 cities, ranking 44th. Chart 3 (page 34) provides a graphic of these rates.
The assumed housing values in the 51 cities at each of the five income levels are
presented in Table 5 (page 35). Housing values at the same income level vary a great deal based
on housing markets in each city. As previously mentioned, these housing values are extrapolated
from Census data and represent a hypothetical house value for each income level. In addition,
several jurisdictions allow tax exemptions and credits in the calculation of the property tax.
These exemptions and credits are noted in Table 6 (page 36). This study does not consider the
impact of property tax caps that are available in some jurisdictions.
At all four of the income levels for which home ownership is assumed ($50,000 to
$150,000), Newark, New Jersey;20 Bridgeport, Connecticut; Detroit, Michigan; Los Angeles,
California; and Burlington, Vermont and have the highest property tax burdens, in that order for
each income level. For these cities, high property tax burdens primarily result from a
combination of high real estate tax rates and high housing values, as can be seen in Table 4 (page
33) and Table 5 (page 35). (The families in Burlington, Vermont, earning up to $100,000 in the
study would receive a property tax credit through the income tax, and those amounts are
reflected in the income tax burdens in this report).
At the $50,000-income level, the lowest property tax burdens can be found in Boston,
Massachusetts; Washington, DC; Charleston, West Virginia; and Honolulu, Hawaii. At the
$75,000-, $100,000- and $150,000-income levels, the lowest are in Boston, Massachusetts;
Birmingham, Alabama; Honolulu, Hawaii; Charleston, West Virginia; and Charleston, South
Carolina. These low real estate tax burdens result from a combination of low effective real estate
tax rates, below average housing values, or an exemption program.
20 Newark, NJ, is in the New York City (NYC) Metropolitan Statistical Area, thus the data used for Newark are the same as for
NYC. See page 55 of the 2013 Tax Rates and Tax Burdens Study for a sensitivity analysis of how several cities’ (including
Newark’s) property tax burdens would change using city-level data.

Part I: Tax Burdens in Washington, DC Compared with Those in the Largest City in Each State
2019 Tax Rates and Tax Burdens in the District of Columbia: A Nationwide Comparison
32
At the $25,000-income level, it is assumed that the families rent rather than own a home.
At this level, New York, New York; Boston, Massachusetts; Washington, DC; Seattle,
Washington; and Honolulu, Hawaii, have the highest property tax burdens (assumed as a portion
of rent). This trend is solely due to the high cost of housing in these metropolitan areas, as actual
property tax rates are not applied in the case of rental housing (as previously mentioned, 15
percent of the annual rent is assumed to go toward paying the property tax).
Map 3 below illustrates the range of property tax burdens for a family earning $75,000 a
year. The darker the blue shading in a state, the higher the burden is. Chart 4 (page 37) presents
property tax burdens at each income level on one chart, sorted by the (rental) tax burden on the
family earning $25,000 per year. Viewing the data this way illustrates the differing burdens on
renters versus homeowners (however, as noted, the methodology for calculating the property tax
burdens on the lowest income group—using the property tax equivalent of rent—is different than
the property tax burden calculations for the other four income groups).
Map 3: 2019 Property Tax Burdens ($)
(Family earning $75,000/year)
Source: ORA Analysis. The lighter blue shading represents a lower tax burden.
AK: $2,356
HI: $1,233
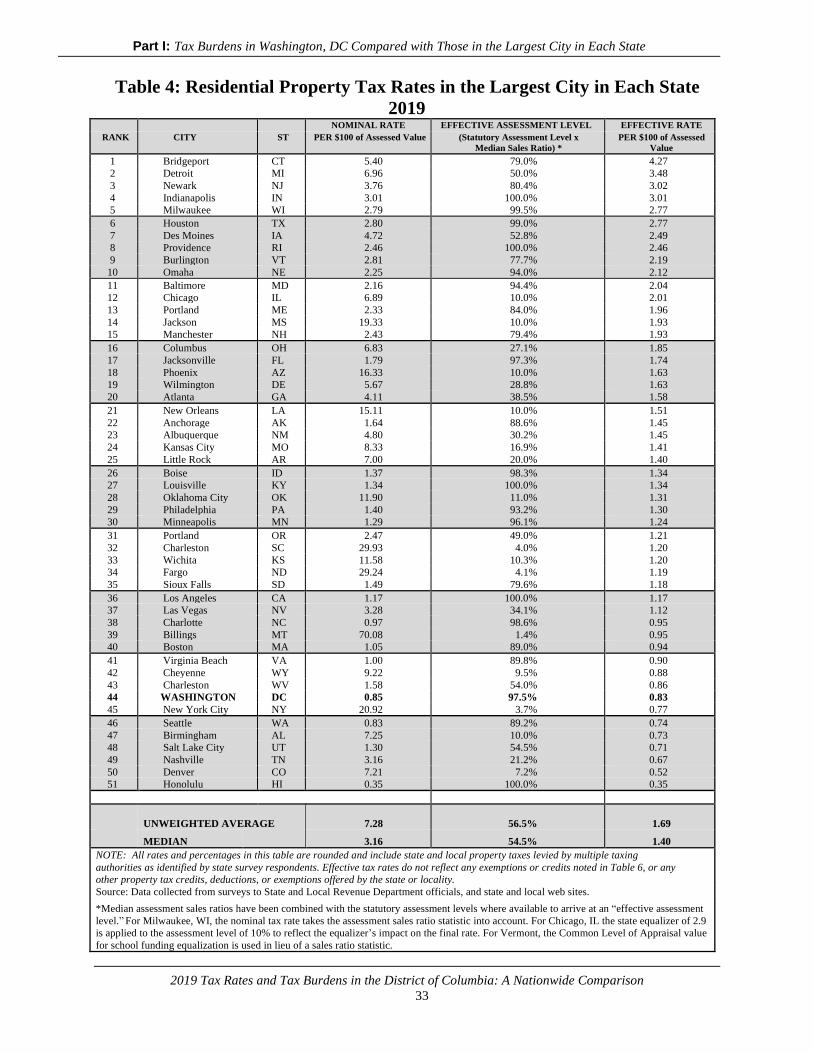
Part I: Tax Burdens in Washington, DC Compared with Those in the Largest City in Each State
2019 Tax Rates and Tax Burdens in the District of Columbia: A Nationwide Comparison
33
Table 4: Residential Property Tax Rates in the Largest City in Each State
2019 NOMINAL RATE EFFECTIVE ASSESSMENT LEVEL EFFECTIVE RATE
RANK CITY ST PER $100 of Assessed Value (Statutory Assessment Level x
Median Sales Ratio) *
PER $100 of Assessed
Value
1 Bridgeport CT 5.40 79.0% 4.27
2 Detroit MI 6.96 50.0% 3.48
3 Newark NJ 3.76 80.4% 3.02
4 Indianapolis IN 3.01 100.0% 3.01
5 Milwaukee WI 2.79 99.5% 2.77
6 Houston TX 2.80 99.0% 2.77
7 Des Moines IA 4.72 52.8% 2.49
8 Providence RI 2.46 100.0% 2.46
9 Burlington VT 2.81 77.7% 2.19
10 Omaha NE 2.25 94.0% 2.12
11 Baltimore MD 2.16 94.4% 2.04
12 Chicago IL 6.89 10.0% 2.01
13 Portland ME 2.33 84.0% 1.96
14 Jackson MS 19.33 10.0% 1.93
15 Manchester NH 2.43 79.4% 1.93
16 Columbus OH 6.83 27.1% 1.85
17 Jacksonville FL 1.79 97.3% 1.74
18 Phoenix AZ 16.33 10.0% 1.63
19 Wilmington DE 5.67 28.8% 1.63
20 Atlanta GA 4.11 38.5% 1.58
21 New Orleans LA 15.11 10.0% 1.51
22 Anchorage AK 1.64 88.6% 1.45
23 Albuquerque NM 4.80 30.2% 1.45
24 Kansas City MO 8.33 16.9% 1.41
25 Little Rock AR 7.00 20.0% 1.40
26 Boise ID 1.37 98.3% 1.34
27 Louisville KY 1.34 100.0% 1.34
28 Oklahoma City OK 11.90 11.0% 1.31
29 Philadelphia PA 1.40 93.2% 1.30
30 Minneapolis MN 1.29 96.1% 1.24
31 Portland OR 2.47 49.0% 1.21
32 Charleston SC 29.93 4.0% 1.20
33 Wichita KS 11.58 10.3% 1.20
34 Fargo ND 29.24 4.1% 1.19
35 Sioux Falls SD 1.49 79.6% 1.18
36 Los Angeles CA 1.17 100.0% 1.17
37 Las Vegas NV 3.28 34.1% 1.12
38 Charlotte NC 0.97 98.6% 0.95
39 Billings MT 70.08 1.4% 0.95
40 Boston MA 1.05 89.0% 0.94
41 Virginia Beach VA 1.00 89.8% 0.90
42 Cheyenne WY 9.22 9.5% 0.88
43 Charleston WV 1.58 54.0% 0.86
44 WASHINGTON DC 0.85 97.5% 0.83
45 New York City NY 20.92 3.7% 0.77
46 Seattle WA 0.83 89.2% 0.74
47 Birmingham AL 7.25 10.0% 0.73
48 Salt Lake City UT 1.30 54.5% 0.71
49 Nashville TN 3.16 21.2% 0.67
50 Denver CO 7.21 7.2% 0.52
51 Honolulu HI 0.35 100.0% 0.35
UNWEIGHTED AVERAGE
7.28 56.5% 1.69
MEDIAN 3.16 54.5% 1.40
NOTE: All rates and percentages in this table are rounded and include state and local property taxes levied by multiple taxing
authorities as identified by state survey respondents. Effective tax rates do not reflect any exemptions or credits noted in Table 6, or any
other property tax credits, deductions, or exemptions offered by the state or locality.
Source: Data collected from surveys to State and Local Revenue Department officials, and state and local web sites.
*Median assessment sales ratios have been combined with the statutory assessment levels where available to arrive at an “effective assessment
level.” For Milwaukee, WI, the nominal tax rate takes the assessment sales ratio statistic into account. For Chicago, IL the state equalizer of 2.9
is applied to the assessment level of 10% to reflect the equalizer’s impact on the final rate. For Vermont, the Common Level of Appraisal value
for school funding equalization is used in lieu of a sales ratio statistic.
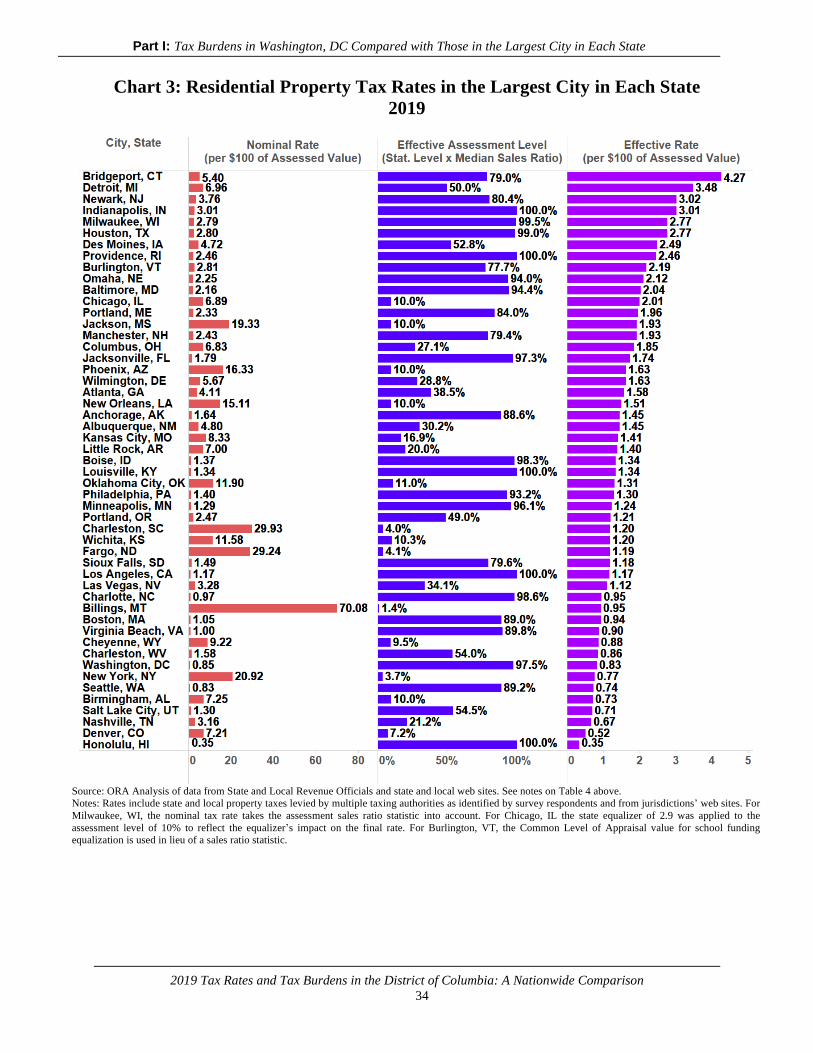
Part I: Tax Burdens in Washington, DC Compared with Those in the Largest City in Each State
2019 Tax Rates and Tax Burdens in the District of Columbia: A Nationwide Comparison
34
Chart 3: Residential Property Tax Rates in the Largest City in Each State
2019
Source: ORA Analysis of data from State and Local Revenue Officials and state and local web sites. See notes on Table 4 above.
Notes: Rates include state and local property taxes levied by multiple taxing authorities as identified by survey respondents and from jurisdictions’ web sites. For
Milwaukee, WI, the nominal tax rate takes the assessment sales ratio statistic into account. For Chicago, IL the state equalizer of 2.9 was applied to the
assessment level of 10% to reflect the equalizer’s impact on the final rate. For Burlington, VT, the Common Level of Appraisal value for school funding
equalization is used in lieu of a sales ratio statistic.
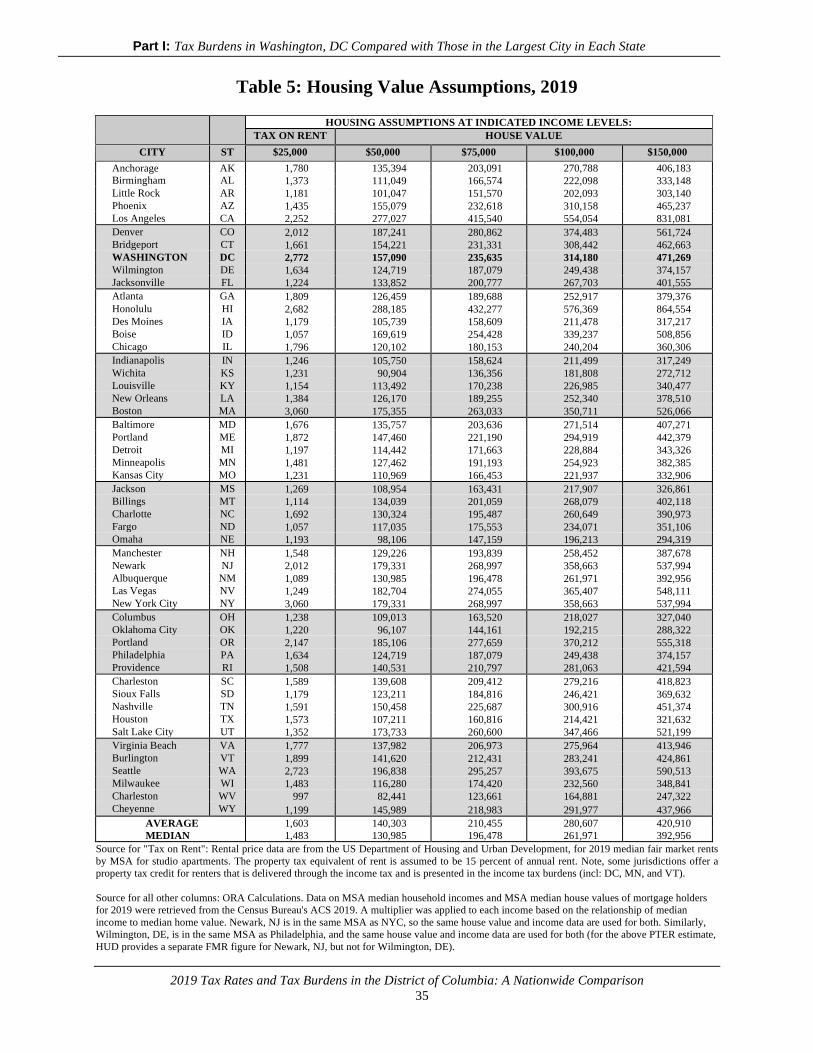
Part I: Tax Burdens in Washington, DC Compared with Those in the Largest City in Each State
2019 Tax Rates and Tax Burdens in the District of Columbia: A Nationwide Comparison
35
Table 5: Housing Value Assumptions, 2019
HOUSING ASSUMPTIONS AT INDICATED INCOME LEVELS:
TAX ON RENT HOUSE VALUE
CITY ST $25,000 $50,000 $75,000 $100,000 $150,000
Anchorage AK 1,780 135,394 203,091 270,788 406,183
Birmingham AL 1,373 111,049 166,574 222,098 333,148
Little Rock AR 1,181 101,047 151,570 202,093 303,140
Phoenix AZ 1,435 155,079 232,618 310,158 465,237
Los Angeles CA 2,252 277,027 415,540 554,054 831,081
Denver CO 2,012 187,241 280,862 374,483 561,724
Bridgeport CT 1,661 154,221 231,331 308,442 462,663
WASHINGTON DC 2,772 157,090 235,635 314,180 471,269
Wilmington DE 1,634 124,719 187,079 249,438 374,157
Jacksonville FL 1,224 133,852 200,777 267,703 401,555
Atlanta GA 1,809 126,459 189,688 252,917 379,376
Honolulu HI 2,682 288,185 432,277 576,369 864,554
Des Moines IA 1,179 105,739 158,609 211,478 317,217
Boise ID 1,057 169,619 254,428 339,237 508,856
Chicago IL 1,796 120,102 180,153 240,204 360,306
Indianapolis IN 1,246 105,750 158,624 211,499 317,249
Wichita KS 1,231 90,904 136,356 181,808 272,712
Louisville KY 1,154 113,492 170,238 226,985 340,477
New Orleans LA 1,384 126,170 189,255 252,340 378,510
Boston MA 3,060 175,355 263,033 350,711 526,066
Baltimore MD 1,676 135,757 203,636 271,514 407,271
Portland ME 1,872 147,460 221,190 294,919 442,379
Detroit MI 1,197 114,442 171,663 228,884 343,326
Minneapolis MN 1,481 127,462 191,193 254,923 382,385
Kansas City MO 1,231 110,969 166,453 221,937 332,906
Jackson MS 1,269 108,954 163,431 217,907 326,861
Billings MT 1,114 134,039 201,059 268,079 402,118
Charlotte NC 1,692 130,324 195,487 260,649 390,973
Fargo ND 1,057 117,035 175,553 234,071 351,106
Omaha NE 1,193 98,106 147,159 196,213 294,319
Manchester NH 1,548 129,226 193,839 258,452 387,678
Newark NJ 2,012 179,331 268,997 358,663 537,994
Albuquerque NM 1,089 130,985 196,478 261,971 392,956
Las Vegas NV 1,249 182,704 274,055 365,407 548,111
New York City NY 3,060 179,331 268,997 358,663 537,994
Columbus OH 1,238 109,013 163,520 218,027 327,040
Oklahoma City OK 1,220 96,107 144,161 192,215 288,322
Portland OR 2,147 185,106 277,659 370,212 555,318
Philadelphia PA 1,634 124,719 187,079 249,438 374,157
Providence RI 1,508 140,531 210,797 281,063 421,594
Charleston SC 1,589 139,608 209,412 279,216 418,823
Sioux Falls SD 1,179 123,211 184,816 246,421 369,632
Nashville TN 1,591 150,458 225,687 300,916 451,374
Houston TX 1,573 107,211 160,816 214,421 321,632
Salt Lake City UT 1,352 173,733 260,600 347,466 521,199
Virginia Beach VA 1,777 137,982 206,973 275,964 413,946
Burlington VT 1,899 141,620 212,431 283,241 424,861
Seattle WA 2,723 196,838 295,257 393,675 590,513
Milwaukee WI 1,483 116,280 174,420 232,560 348,841
Charleston WV 997 82,441 123,661 164,881 247,322
Cheyenne WY 1,199 145,989 218,983 291,977 437,966
AVERAGE 1,603 140,303 210,455 280,607 420,910
MEDIAN 1,483 130,985 196,478 261,971 392,956
Source for "Tax on Rent": Rental price data are from the US Department of Housing and Urban Development, for 2019 median fair market rents
by MSA for studio apartments. The property tax equivalent of rent is assumed to be 15 percent of annual rent. Note, some jurisdictions offer a
property tax credit for renters that is delivered through the income tax and is presented in the income tax burdens (incl: DC, MN, and VT).
Source for all other columns: ORA Calculations. Data on MSA median household incomes and MSA median house values of mortgage holders
for 2019 were retrieved from the Census Bureau's ACS 2019. A multiplier was applied to each income based on the relationship of median
income to median home value. Newark, NJ is in the same MSA as NYC, so the same house value and income data are used for both. Similarly,
Wilmington, DE, is in the same MSA as Philadelphia, and the same house value and income data are used for both (for the above PTER estimate,
HUD provides a separate FMR figure for Newark, NJ, but not for Wilmington, DE).
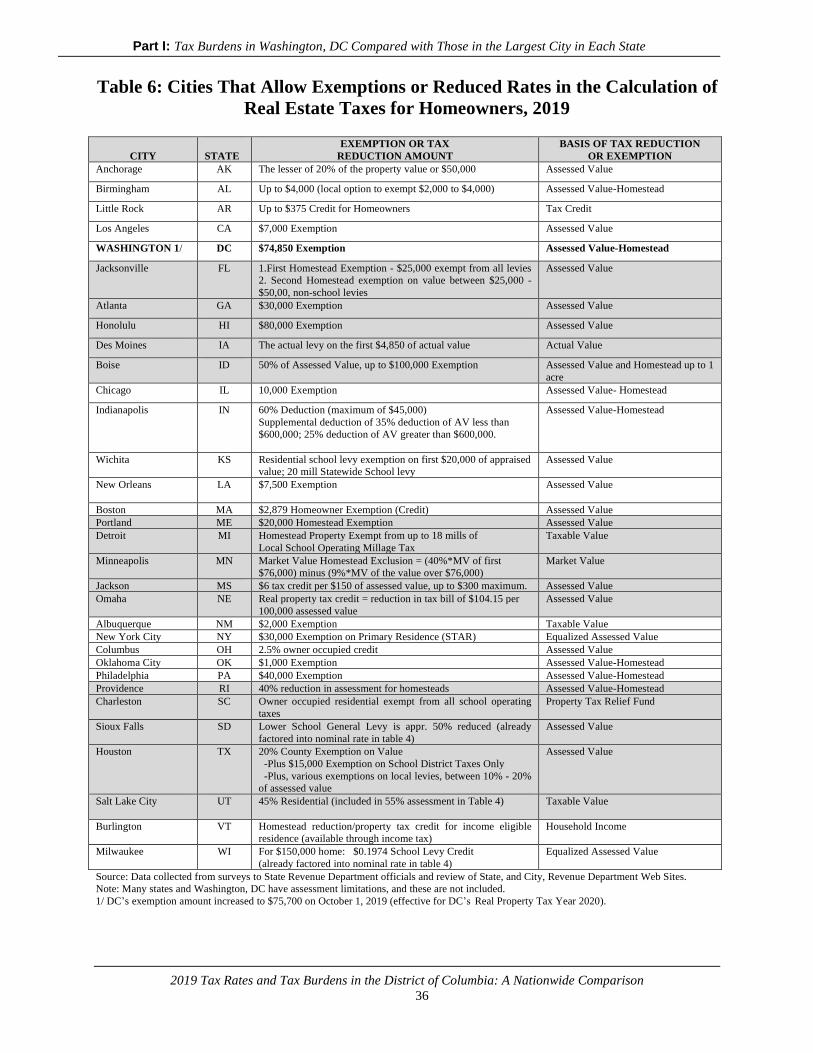
Part I: Tax Burdens in Washington, DC Compared with Those in the Largest City in Each State
2019 Tax Rates and Tax Burdens in the District of Columbia: A Nationwide Comparison
36
Table 6: Cities That Allow Exemptions or Reduced Rates in the Calculation of
Real Estate Taxes for Homeowners, 2019
CITY
STATE
EXEMPTION OR TAX
REDUCTION AMOUNT
BASIS OF TAX REDUCTION
OR EXEMPTION
Anchorage AK The lesser of 20% of the property value or $50,000 Assessed Value
Birmingham AL Up to $4,000 (local option to exempt $2,000 to $4,000) Assessed Value-Homestead
Little Rock AR Up to $375 Credit for Homeowners Tax Credit
Los Angeles CA $7,000 Exemption Assessed Value
WASHINGTON 1/ DC $74,850 Exemption Assessed Value-Homestead
Jacksonville FL 1.First Homestead Exemption - $25,000 exempt from all levies
2. Second Homestead exemption on value between $25,000 -
$50,00, non-school levies
Assessed Value
Atlanta GA $30,000 Exemption Assessed Value
Honolulu HI $80,000 Exemption Assessed Value
Des Moines IA The actual levy on the first $4,850 of actual value Actual Value
Boise ID 50% of Assessed Value, up to $100,000 Exemption Assessed Value and Homestead up to 1
acre
Chicago IL 10,000 Exemption Assessed Value- Homestead
Indianapolis IN 60% Deduction (maximum of $45,000)
Supplemental deduction of 35% deduction of AV less than
$600,000; 25% deduction of AV greater than $600,000.
Assessed Value-Homestead
Wichita KS
Residential school levy exemption on first $20,000 of appraised
value; 20 mill Statewide School levy
Assessed Value
New Orleans LA $7,500 Exemption Assessed Value
Boston MA $2,879 Homeowner Exemption (Credit) Assessed Value
Portland ME $20,000 Homestead Exemption Assessed Value
Detroit MI Homestead Property Exempt from up to 18 mills of
Local School Operating Millage Tax
Taxable Value
Minneapolis MN Market Value Homestead Exclusion = (40%*MV of first
$76,000) minus (9%*MV of the value over $76,000)
Market Value
Jackson MS $6 tax credit per $150 of assessed value, up to $300 maximum. Assessed Value
Omaha NE Real property tax credit = reduction in tax bill of $104.15 per
100,000 assessed value
Assessed Value
Albuquerque NM $2,000 Exemption Taxable Value
New York City NY $30,000 Exemption on Primary Residence (STAR) Equalized Assessed Value
Columbus OH 2.5% owner occupied credit Assessed Value
Oklahoma City OK $1,000 Exemption Assessed Value-Homestead
Philadelphia PA $40,000 Exemption Assessed Value-Homestead
Providence RI 40% reduction in assessment for homesteads Assessed Value-Homestead
Charleston SC Owner occupied residential exempt from all school operating
taxes
Property Tax Relief Fund
Sioux Falls SD Lower School General Levy is appr. 50% reduced (already
factored into nominal rate in table 4)
Assessed Value
Houston TX 20% County Exemption on Value
-Plus $15,000 Exemption on School District Taxes Only
-Plus, various exemptions on local levies, between 10% - 20%
of assessed value
Assessed Value
Salt Lake City UT 45% Residential (included in 55% assessment in Table 4) Taxable Value
Burlington VT Homestead reduction/property tax credit for income eligible
residence (available through income tax)
Household Income
Milwaukee WI For $150,000 home: $0.1974 School Levy Credit
(already factored into nominal rate in table 4)
Equalized Assessed Value
Source: Data collected from surveys to State Revenue Department officials and review of State, and City, Revenue Department Web Sites.
Note: Many states and Washington, DC have assessment limitations, and these are not included.
1/ DC’s exemption amount increased to $75,700 on October 1, 2019 (effective for DC’s Real Property Tax Year 2020).
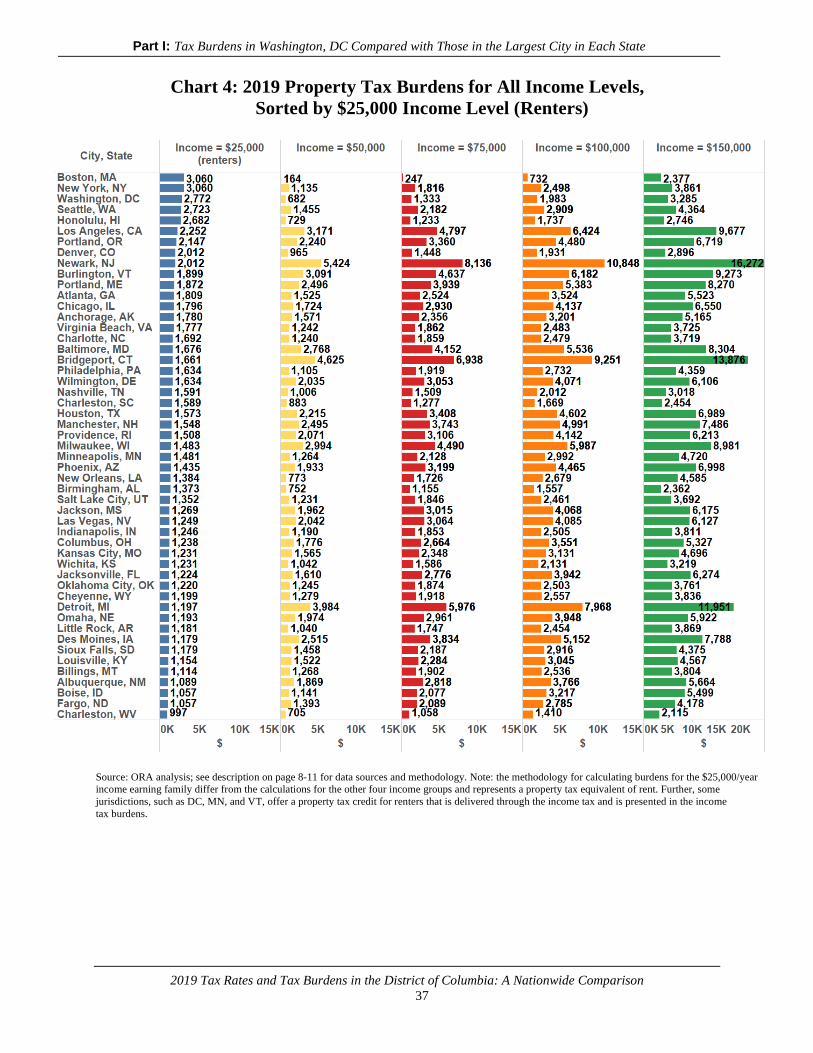
Part I: Tax Burdens in Washington, DC Compared with Those in the Largest City in Each State
2019 Tax Rates and Tax Burdens in the District of Columbia: A Nationwide Comparison
37
Chart 4: 2019 Property Tax Burdens for All Income Levels,
Sorted by $25,000 Income Level (Renters)
Source: ORA analysis; see description on page 8-11 for data sources and methodology. Note: the methodology for calculating burdens for the $25,000/year
income earning family differ from the calculations for the other four income groups and represents a property tax equivalent of rent. Further, some
jurisdictions, such as DC, MN, and VT, offer a property tax credit for renters that is delivered through the income tax and is presented in the income
tax burdens.
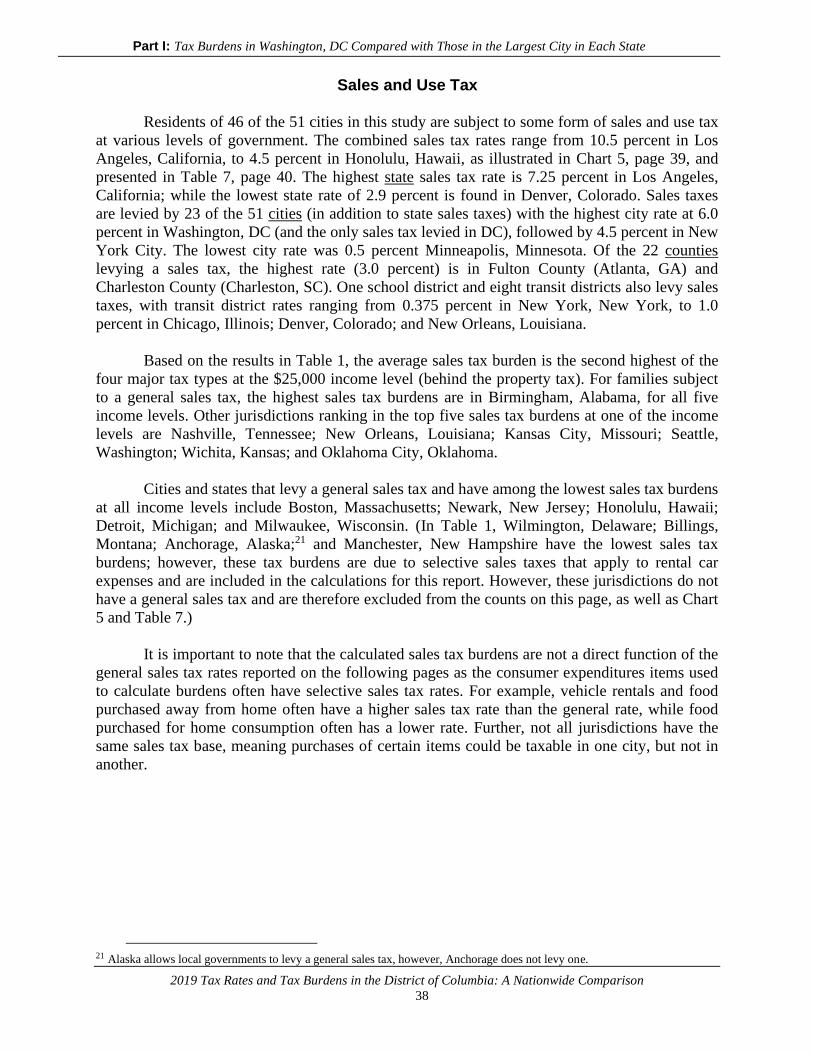
Part I: Tax Burdens in Washington, DC Compared with Those in the Largest City in Each State
2019 Tax Rates and Tax Burdens in the District of Columbia: A Nationwide Comparison
38
Sales and Use Tax
Residents of 46 of the 51 cities in this study are subject to some form of sales and use tax
at various levels of government. The combined sales tax rates range from 10.5 percent in Los
Angeles, California, to 4.5 percent in Honolulu, Hawaii, as illustrated in Chart 5, page 39, and
presented in Table 7, page 40. The highest state sales tax rate is 7.25 percent in Los Angeles,
California; while the lowest state rate of 2.9 percent is found in Denver, Colorado. Sales taxes
are levied by 23 of the 51 cities (in addition to state sales taxes) with the highest city rate at 6.0
percent in Washington, DC (and the only sales tax levied in DC), followed by 4.5 percent in New
York City. The lowest city rate was 0.5 percent Minneapolis, Minnesota. Of the 22 counties
levying a sales tax, the highest rate (3.0 percent) is in Fulton County (Atlanta, GA) and
Charleston County (Charleston, SC). One school district and eight transit districts also levy sales
taxes, with transit district rates ranging from 0.375 percent in New York, New York, to 1.0
percent in Chicago, Illinois; Denver, Colorado; and New Orleans, Louisiana.
Based on the results in Table 1, the average sales tax burden is the second highest of the
four major tax types at the $25,000 income level (behind the property tax). For families subject
to a general sales tax, the highest sales tax burdens are in Birmingham, Alabama, for all five
income levels. Other jurisdictions ranking in the top five sales tax burdens at one of the income
levels are Nashville, Tennessee; New Orleans, Louisiana; Kansas City, Missouri; Seattle,
Washington; Wichita, Kansas; and Oklahoma City, Oklahoma.
Cities and states that levy a general sales tax and have among the lowest sales tax burdens
at all income levels include Boston, Massachusetts; Newark, New Jersey; Honolulu, Hawaii;
Detroit, Michigan; and Milwaukee, Wisconsin. (In Table 1, Wilmington, Delaware; Billings,
Montana; Anchorage, Alaska;21 and Manchester, New Hampshire have the lowest sales tax
burdens; however, these tax burdens are due to selective sales taxes that apply to rental car
expenses and are included in the calculations for this report. However, these jurisdictions do not
have a general sales tax and are therefore excluded from the counts on this page, as well as Chart
5 and Table 7.)
It is important to note that the calculated sales tax burdens are not a direct function of the
general sales tax rates reported on the following pages as the consumer expenditures items used
to calculate burdens often have selective sales tax rates. For example, vehicle rentals and food
purchased away from home often have a higher sales tax rate than the general rate, while food
purchased for home consumption often has a lower rate. Further, not all jurisdictions have the
same sales tax base, meaning purchases of certain items could be taxable in one city, but not in
another.
21 Alaska allows local governments to levy a general sales tax, however, Anchorage does not levy one.
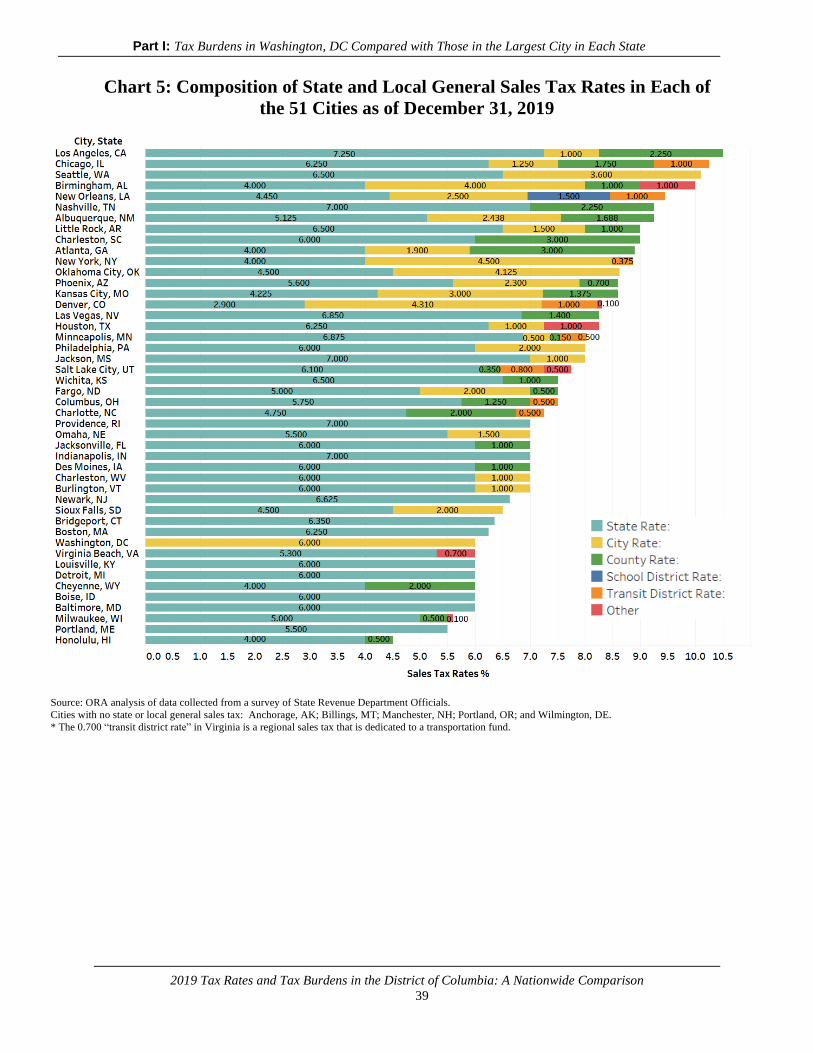
Part I: Tax Burdens in Washington, DC Compared with Those in the Largest City in Each State
2019 Tax Rates and Tax Burdens in the District of Columbia: A Nationwide Comparison
39
Chart 5: Composition of State and Local General Sales Tax Rates in Each of
the 51 Cities as of December 31, 2019
Source: ORA analysis of data collected from a survey of State Revenue Department Officials.
Cities with no state or local general sales tax: Anchorage, AK; Billings, MT; Manchester, NH; Portland, OR; and Wilmington, DE. * The 0.700 “transit district rate” in Virginia is a regional sales tax that is dedicated to a transportation fund.
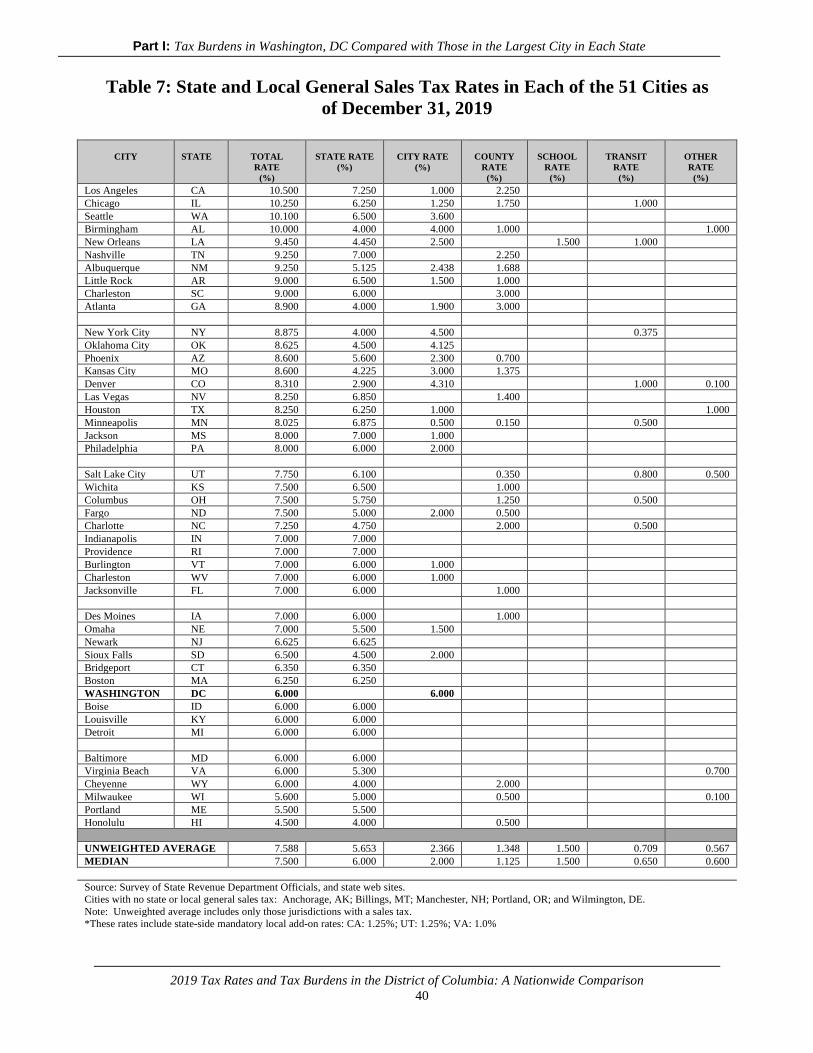
Part I: Tax Burdens in Washington, DC Compared with Those in the Largest City in Each State
2019 Tax Rates and Tax Burdens in the District of Columbia: A Nationwide Comparison
40
Table 7: State and Local General Sales Tax Rates in Each of the 51 Cities as
of December 31, 2019
CITY
STATE
TOTAL
RATE
(%)
STATE RATE
(%)
CITY RATE
(%)
COUNTY
RATE
(%)
SCHOOL
RATE
(%)
TRANSIT
RATE
(%)
OTHER
RATE
(%)
Los Angeles CA 10.500 7.250 1.000 2.250
Chicago IL 10.250 6.250 1.250 1.750 1.000
Seattle WA 10.100 6.500 3.600
Birmingham AL 10.000 4.000 4.000 1.000 1.000
New Orleans LA 9.450 4.450 2.500 1.500 1.000
Nashville TN 9.250 7.000 2.250
Albuquerque NM 9.250 5.125 2.438 1.688
Little Rock AR 9.000 6.500 1.500 1.000
Charleston SC 9.000 6.000 3.000
Atlanta GA 8.900 4.000 1.900 3.000
New York City NY 8.875 4.000 4.500 0.375
Oklahoma City OK 8.625 4.500 4.125
Phoenix AZ 8.600 5.600 2.300 0.700
Kansas City MO 8.600 4.225 3.000 1.375
Denver CO 8.310 2.900 4.310 1.000 0.100
Las Vegas NV 8.250 6.850 1.400
Houston TX 8.250 6.250 1.000 1.000
Minneapolis MN 8.025 6.875 0.500 0.150 0.500
Jackson MS 8.000 7.000 1.000
Philadelphia PA 8.000 6.000 2.000
Salt Lake City UT 7.750 6.100 0.350 0.800 0.500
Wichita KS 7.500 6.500 1.000
Columbus OH 7.500 5.750 1.250 0.500
Fargo ND 7.500 5.000 2.000 0.500
Charlotte NC 7.250 4.750 2.000 0.500
Indianapolis IN 7.000 7.000
Providence RI 7.000 7.000
Burlington VT 7.000 6.000 1.000
Charleston WV 7.000 6.000 1.000
Jacksonville FL 7.000 6.000 1.000
Des Moines IA 7.000 6.000 1.000
Omaha NE 7.000 5.500 1.500
Newark NJ 6.625 6.625
Sioux Falls SD 6.500 4.500 2.000
Bridgeport CT 6.350 6.350
Boston MA 6.250 6.250
WASHINGTON DC 6.000 6.000
Boise ID 6.000 6.000
Louisville KY 6.000 6.000
Detroit MI 6.000 6.000
Baltimore MD 6.000 6.000
Virginia Beach VA 6.000 5.300 0.700
Cheyenne WY 6.000 4.000 2.000
Milwaukee WI 5.600 5.000 0.500 0.100
Portland ME 5.500 5.500
Honolulu HI 4.500 4.000 0.500
UNWEIGHTED AVERAGE 7.588 5.653 2.366 1.348 1.500 0.709 0.567
MEDIAN 7.500 6.000 2.000 1.125 1.500 0.650 0.600
Source: Survey of State Revenue Department Officials, and state web sites.
Cities with no state or local general sales tax: Anchorage, AK; Billings, MT; Manchester, NH; Portland, OR; and Wilmington, DE.
Note: Unweighted average includes only those jurisdictions with a sales tax.
*These rates include state-side mandatory local add-on rates: CA: 1.25%; UT: 1.25%; VA: 1.0%
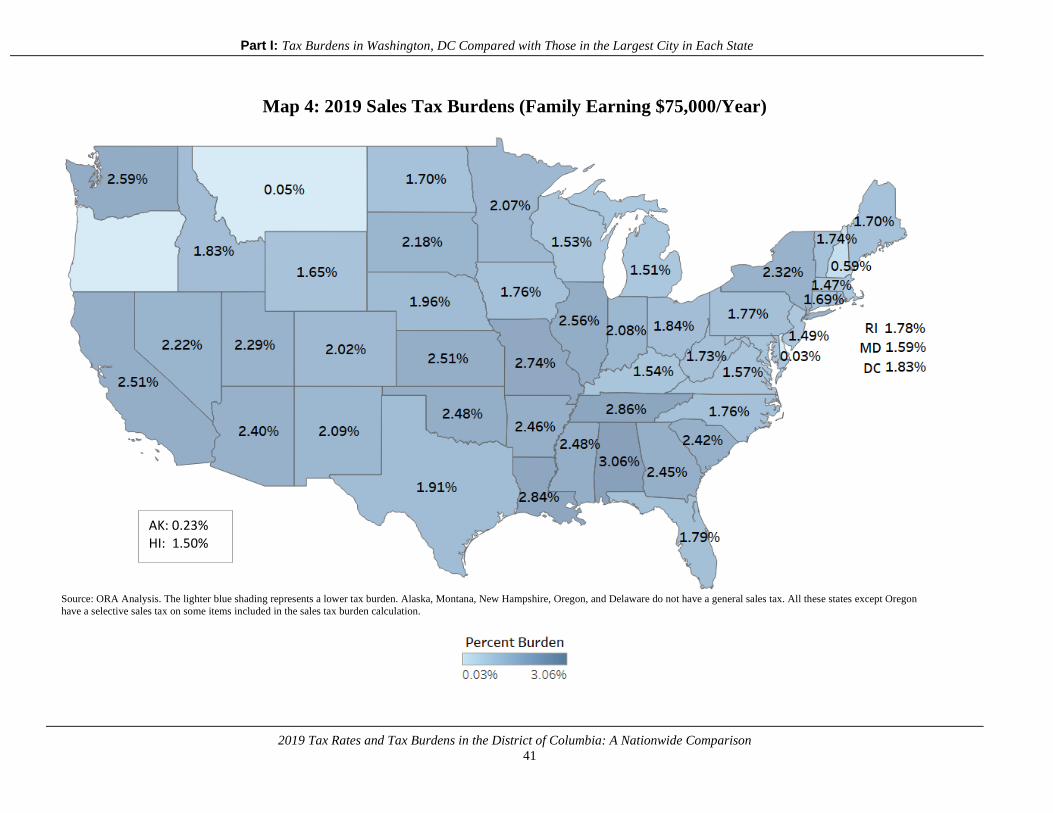
Part I: Tax Burdens in Washington, DC Compared with Those in the Largest City in Each State
2019 Tax Rates and Tax Burdens in the District of Columbia: A Nationwide Comparison
41
Map 4: 2019 Sales Tax Burdens (Family Earning $75,000/Year)
Source: ORA Analysis. The lighter blue shading represents a lower tax burden. Alaska, Montana, New Hampshire, Oregon, and Delaware do not have a general sales tax. All these states except Oregon
have a selective sales tax on some items included in the sales tax burden calculation.
AK: 0.23%
HI: 1.50%
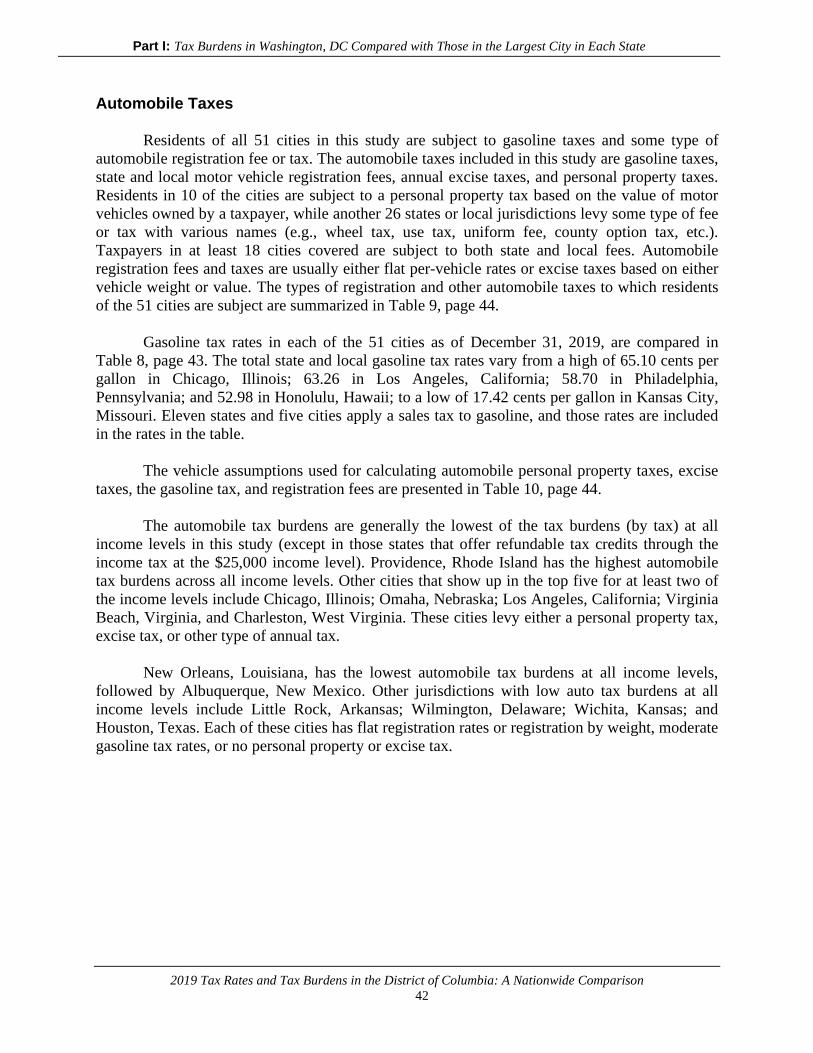
Part I: Tax Burdens in Washington, DC Compared with Those in the Largest City in Each State
2019 Tax Rates and Tax Burdens in the District of Columbia: A Nationwide Comparison
42
Automobile Taxes
Residents of all 51 cities in this study are subject to gasoline taxes and some type of
automobile registration fee or tax. The automobile taxes included in this study are gasoline taxes,
state and local motor vehicle registration fees, annual excise taxes, and personal property taxes.
Residents in 10 of the cities are subject to a personal property tax based on the value of motor
vehicles owned by a taxpayer, while another 26 states or local jurisdictions levy some type of fee
or tax with various names (e.g., wheel tax, use tax, uniform fee, county option tax, etc.).
Taxpayers in at least 18 cities covered are subject to both state and local fees. Automobile
registration fees and taxes are usually either flat per-vehicle rates or excise taxes based on either
vehicle weight or value. The types of registration and other automobile taxes to which residents
of the 51 cities are subject are summarized in Table 9, page 44.
Gasoline tax rates in each of the 51 cities as of December 31, 2019, are compared in
Table 8, page 43. The total state and local gasoline tax rates vary from a high of 65.10 cents per
gallon in Chicago, Illinois; 63.26 in Los Angeles, California; 58.70 in Philadelphia,
Pennsylvania; and 52.98 in Honolulu, Hawaii; to a low of 17.42 cents per gallon in Kansas City,
Missouri. Eleven states and five cities apply a sales tax to gasoline, and those rates are included
in the rates in the table.
The vehicle assumptions used for calculating automobile personal property taxes, excise
taxes, the gasoline tax, and registration fees are presented in Table 10, page 44.
The automobile tax burdens are generally the lowest of the tax burdens (by tax) at all
income levels in this study (except in those states that offer refundable tax credits through the
income tax at the $25,000 income level). Providence, Rhode Island has the highest automobile
tax burdens across all income levels. Other cities that show up in the top five for at least two of
the income levels include Chicago, Illinois; Omaha, Nebraska; Los Angeles, California; Virginia
Beach, Virginia, and Charleston, West Virginia. These cities levy either a personal property tax,
excise tax, or other type of annual tax.
New Orleans, Louisiana, has the lowest automobile tax burdens at all income levels,
followed by Albuquerque, New Mexico. Other jurisdictions with low auto tax burdens at all
income levels include Little Rock, Arkansas; Wilmington, Delaware; Wichita, Kansas; and
Houston, Texas. Each of these cities has flat registration rates or registration by weight, moderate
gasoline tax rates, or no personal property or excise tax.
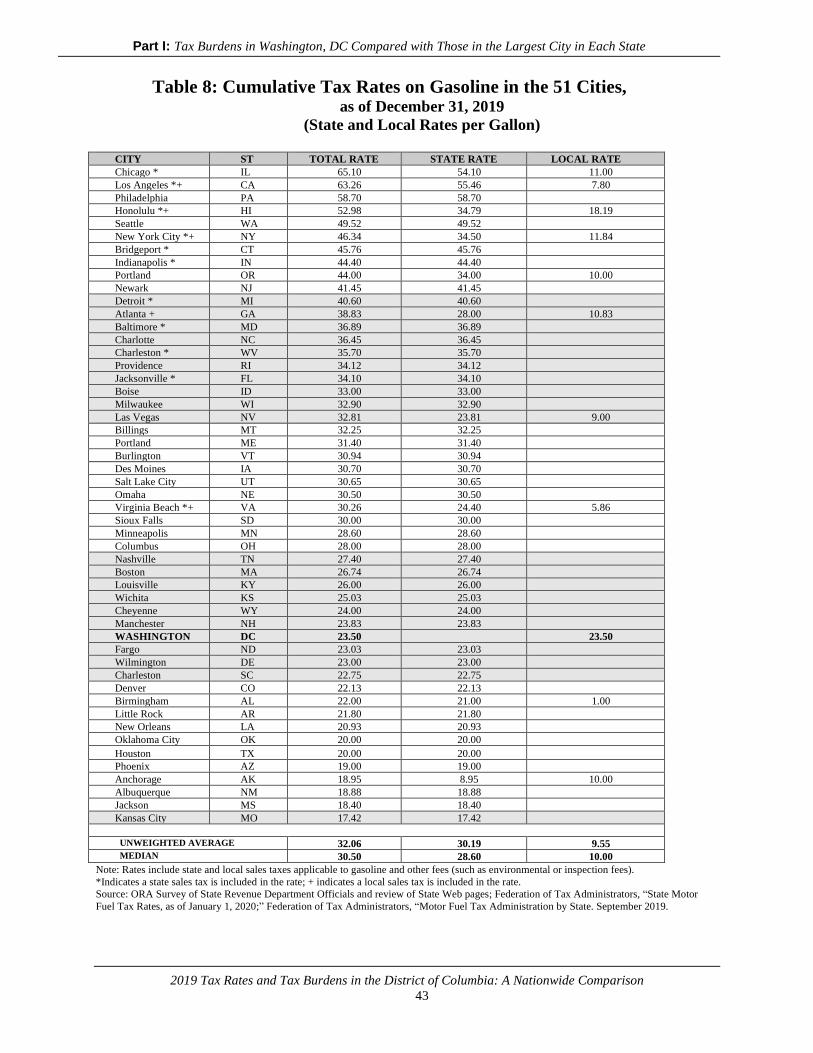
Part I: Tax Burdens in Washington, DC Compared with Those in the Largest City in Each State
2019 Tax Rates and Tax Burdens in the District of Columbia: A Nationwide Comparison
43
Table 8: Cumulative Tax Rates on Gasoline in the 51 Cities, as of December 31, 2019
(State and Local Rates per Gallon)
CITY ST TOTAL RATE STATE RATE LOCAL RATE
Chicago * IL 65.10 54.10 11.00
Los Angeles *+ CA 63.26 55.46 7.80
Philadelphia PA 58.70 58.70
Honolulu *+ HI 52.98 34.79 18.19
Seattle WA 49.52 49.52
New York City *+ NY 46.34 34.50 11.84
Bridgeport * CT 45.76 45.76
Indianapolis * IN 44.40 44.40
Portland OR 44.00 34.00 10.00
Newark NJ 41.45 41.45
Detroit * MI 40.60 40.60
Atlanta + GA 38.83 28.00 10.83
Baltimore * MD 36.89 36.89
Charlotte NC 36.45 36.45
Charleston * WV 35.70 35.70
Providence RI 34.12 34.12
Jacksonville * FL 34.10 34.10
Boise ID 33.00 33.00
Milwaukee WI 32.90 32.90
Las Vegas NV 32.81 23.81 9.00
Billings MT 32.25 32.25
Portland ME 31.40 31.40
Burlington VT 30.94 30.94
Des Moines IA 30.70 30.70
Salt Lake City UT 30.65 30.65
Omaha NE 30.50 30.50
Virginia Beach *+ VA 30.26 24.40 5.86
Sioux Falls SD 30.00 30.00
Minneapolis MN 28.60 28.60
Columbus OH 28.00 28.00
Nashville TN 27.40 27.40
Boston MA 26.74 26.74
Louisville KY 26.00 26.00
Wichita KS 25.03 25.03
Cheyenne WY 24.00 24.00
Manchester NH 23.83 23.83
WASHINGTON DC 23.50 23.50
Fargo ND 23.03 23.03
Wilmington DE 23.00 23.00
Charleston SC 22.75 22.75
Denver CO 22.13 22.13
Birmingham AL 22.00 21.00 1.00
Little Rock AR 21.80 21.80
New Orleans LA 20.93 20.93
Oklahoma City OK 20.00 20.00
Houston TX 20.00 20.00
Phoenix AZ 19.00 19.00
Anchorage AK 18.95 8.95 10.00
Albuquerque NM 18.88 18.88
Jackson MS 18.40 18.40
Kansas City MO 17.42 17.42 UNWEIGHTED AVERAGE 32.06 30.19 9.55 MEDIAN 30.50 28.60 10.00
Note: Rates include state and local sales taxes applicable to gasoline and other fees (such as environmental or inspection fees).
*Indicates a state sales tax is included in the rate; + indicates a local sales tax is included in the rate.
Source: ORA Survey of State Revenue Department Officials and review of State Web pages; Federation of Tax Administrators, “State Motor
Fuel Tax Rates, as of January 1, 2020;” Federation of Tax Administrators, “Motor Fuel Tax Administration by State. September 2019.
Part I: Tax Burdens in Washington, DC Compared with Those in the Largest City in Each State
2019 Tax Rates and Tax Burdens in the District of Columbia: A Nationwide Comparison
44
Table 9: Summary of Types of Automobile Registration Taxes 2019
(50 states + DC)
TYPE OF REGISTRATION NUMBER OF STATES (& DC)
Flat Rate Only 22
Weight Only 13
Weight and Age 5
Horsepower Only 1
Age Only 3
Value Only 2
Value and Age 3
Value, Age, and Weight 2
51
OTHER AUTO TAXES (INCLUDING LOCAL) *
Personal Property 10
Excise 4
Other fees or taxes (incl. local registration) 26
*Based on State Survey responses. An excise tax is only applied in auto tax burden calculation if it is an annual tax.
Table 10: Automobile Tax Assumptions 2019
Market
Values
Estimated
Estimated
Engine Mileage Annual
Income Size Retail Trade-In Loan Per Gasoline
Level Description of
Auto
Liters 1/ Weight
2/
Year Price 2/ Value 2/ Value 2/ Gallon 1/ Usage 3/
$ 25,000 Sedan, 4 Door 1.8 2,920 lbs. 2016 $13,575 $10,300 $13,439 29 517 gallons
4-cylinder, Auto
$ 50,000 Sedan, 4 Door 1.4 2,930 lbs. 2018 $14,100 $10,950 $13,959 34 441 gallons
4 Cylinder, Manual
$ 75,000 Sedan, 4 Door 2.5 3,340 lbs. 2018 $20,175 $16,400 $19,973 33 455 gallons
4 Cylinder, Automatic
4WD Utility, 4 Door 3.5 4,464 lbs. 2013 $18,050 $14,875 $17,870 19 395 gallons*
6 Cylinder, Automatic
$100,000 Sedan, 4 Door 2.5 3,906 lbs. 2018 $22,925 $18,725 $22,696 30 500 gallons
6 Cylinder, Automatic
4WD Utility, 4 Door 3.5 4,697 lbs. 2013 $17,675 $14,250 $17,498 20 375 gallons*
6 Cylinder, Automatic
$150,000 Sedan, 4 Door 2.0 3,814 lbs. 2019 $54,220 $50,580 $53,678 25 600 gallons
6 Cylinder, Automatic
AWD Utility, 4 Door 3.5 4,095 lbs. 2015 $18,550 $15,150 $18,365 24 313 gallons*
6 Cylinder, Automatic
1/ Gas Mileage Guide, EPA fuel economy estimates for city driving, US Department of Energy. http://www.fueleconomy.gov/
2/ National Automobile Dealers Association Used Car Guide. http://www.nadaguides.com
3/ Assumes 15,000 miles driven for primary car; 7,500 for secondary car (secondary car denoted with an asterisk).
Part I: Tax Burdens in Washington, DC Compared with Those in the Largest City in Each State
2019 Tax Rates and Tax Burdens in the District of Columbia: A Nationwide Comparison
45
Chart 6: 2019 Auto Tax Burdens, Family Earning $75,000/year
Source: ORA Analysis. See pages 41-43 for methodology and assumptions.
Part I: Tax Burdens in Washington, DC Compared with Those in the Largest City in Each State
2019 Tax Rates and Tax Burdens in the District of Columbia: A Nationwide Comparison
46
CHAPTER IV
How Do Tax Burdens in Washington, DC Compare with
Those in the Largest City in Each State?
The nation’s capital, Washington, DC, is unique in many respects. It has a special status in
which the day-to-day activities and functions of state, county, city, and special districts are
combined in one governmental unit. The District’s Mayor and the 13-member District of
Columbia Council combine the functions of the executive and legislative bodies of each of these
governmental units. Due to this combination of responsibilities, the District has the taxing
powers of a state, a county, and a municipality, although these powers are limited by actions of
the federal government. The graduated income tax, the general sales and use tax, and the per
gallon gasoline tax are all comparable in form to those levied by most states. The property tax
based on assessed value is like the type levied in cities and counties. As a result, the tax burden
of District residents should be compared to the combined state and local burdens borne by
residents of other large cities.
The District of Columbia has a relatively high percentage of low-income taxpayers, which
limits the District's revenue-raising capacity. Despite these limitations, the District of Columbia
must perform and provide funding for functions usually provided at both state and local levels of
government. The non-municipal functions include responsibility for welfare programs, physical
and mental health care, and maintenance of the public education and state university systems.
The burden of each of the four major taxes for Washington, DC, is compared with the 50-
city average at all income levels in Table 11, page 49 and the individual tax comparisons are
described in more detail in the following sections. Further, Chart 7, on page 50 illustrates the
comparisons between DC’s overall combined burden and the 50-city average at each income
level. These two visuals show that DC’s combined tax burdens are lower than the 50-city
average for the lowest four income levels in the study, and higher than the average for the top
income level of $150,000 per year.
Individual Income Tax
As shown in Table 11 and based on the assumptions made in this report, the individual
income tax burden for Washington, DC is below the 50-city average at the $25,000 and $50,000
level (the average is based on the cities and states that levy an income tax). The income tax
burden at the $75,000-, $100,000-, and $150,000-income levels is gradually higher in DC than
for the average of the cities levying an income tax. This is due to the District’s more progressive
income tax. Washington, DC levied an individual income tax with six rates in tax year 2019: 4.0
percent on the first $10,000 of taxable income; 6.0 percent on the next $30,000 of taxable
Part I: Tax Burdens in Washington, DC Compared with Those in the Largest City in Each State
2019 Tax Rates and Tax Burdens in the District of Columbia: A Nationwide Comparison
47
income; 6.5 percent on taxable income over $40,000 up to $60,000; 8.5 percent on taxable
income over $60,000 up to $350,000; 8.75 percent on taxable income greater than $350,000 and
less than $1,000,000, and 8.95 percent on taxable income over $1,000,000.
As a result of the 2017 Tax Cuts and Jobs Act (TCJA) and DC’s federal conformity provisions,
DC personal exemptions are reduced to zero for 2019, and the federal standard deduction will
apply. Thus, a standard deduction of $24,400 for joint married filers ($12,200 for married filing
separately) was in effect for the period of this study. Itemized deductions are the same as those
allowed in computing the federal income tax (with a limit of $10,000 on state and local
deductions that can be itemized on the federal schedule A), and the District does not allow the
deduction of its own individual income tax. Washington, DC also has “circuit-breaker” property
tax relief programs for both elderly and non-elderly qualified homeowners and renters, through
which a credit can be claimed against a taxpayer’s income tax liability (a Schedule H renters’
credit is applied through the income tax).
The District’s income tax rates have changed and become more progressive in recent
years, with slightly decreasing rates on income between $40,000 and $60,000 and between
$350,000 and $1,000,000, while rates slightly increased on income over $1,000,000. Federal law
prohibits Washington, DC from taxing the earnings of non-residents working within the city, a
restriction not imposed on any other city in the nation. Partly because of this, the District of
Columbia taxes residents at a higher rate than it might otherwise since about 59 percent of the
income earned in the District of Columbia is earned by non-residents.22
Real Property Tax
As previously noted, and based on the assumptions in this report, the property tax
burdens in the District of Columbia are below the 50-city average at the $50,000-, $75,000-,
$100,000- and $150,000-income levels. The property tax burden, as calculated in this study, is
higher at the $25,000-income level in Washington, DC, than the average for the 50 cities (and
second highest overall), which reflects the high cost of rental housing in the District. (However,
DC’s $1,200 property tax credit administered through the income tax was applied and is counted
in the family’s income tax burden. Taking that into account would place the DC renter’s tax
burden below the national average.) Although the District’s house values are higher than the 50-
city average at each income level, these rankings for assumed homeowners highlight the
District’s relatively low property tax burden for homeowners, as compared to the other 50 cities.
The tax on residential property in the District of Columbia is based on the assessed value
of the property, which is assessed at a statutory level of 100 percent of its estimated market
value.23 The tax rate on residential owner-occupied property in the District is $0.85 per $100 of
assessed value for 2019. DC homeowners may deduct a homestead exemption of $74,850 from
the assessed base before calculation of the property tax for all owner-occupied dwellings. The
District has capped the growth of property assessments at 10 percent, when calculating the tax
due. The calculations in this study do not adjust for capped growth.
22 “District of Columbia Economic and Revenue Trends: December 2020.” Data point for FY19. Government of the District of Columbia, Office
of the Chief Financial Officer, Office of Revenue Analysis. Washington, DC: 2020. p. 6. 23 As detailed on page 9, median sales ratios were included where available to represent the actual level of assessment compared to market
values. DC’s most recent median assessment sales ratio is 97.5%.
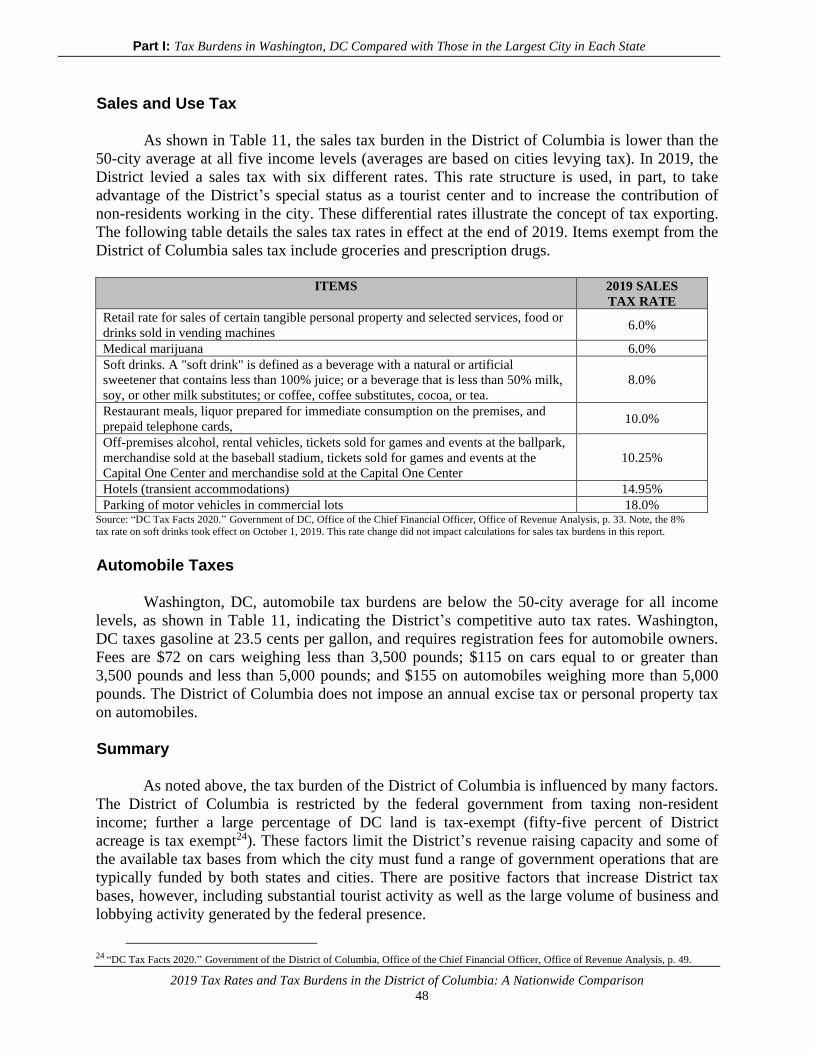
Part I: Tax Burdens in Washington, DC Compared with Those in the Largest City in Each State
2019 Tax Rates and Tax Burdens in the District of Columbia: A Nationwide Comparison
48
Sales and Use Tax
As shown in Table 11, the sales tax burden in the District of Columbia is lower than the
50-city average at all five income levels (averages are based on cities levying tax). In 2019, the
District levied a sales tax with six different rates. This rate structure is used, in part, to take
advantage of the District’s special status as a tourist center and to increase the contribution of
non-residents working in the city. These differential rates illustrate the concept of tax exporting.
The following table details the sales tax rates in effect at the end of 2019. Items exempt from the
District of Columbia sales tax include groceries and prescription drugs.
ITEMS 2019 SALES
TAX RATE
Retail rate for sales of certain tangible personal property and selected services, food or
drinks sold in vending machines 6.0%
Medical marijuana 6.0%
Soft drinks. A "soft drink" is defined as a beverage with a natural or artificial
sweetener that contains less than 100% juice; or a beverage that is less than 50% milk,
soy, or other milk substitutes; or coffee, coffee substitutes, cocoa, or tea.
8.0%
Restaurant meals, liquor prepared for immediate consumption on the premises, and
prepaid telephone cards, 10.0%
Off-premises alcohol, rental vehicles, tickets sold for games and events at the ballpark,
merchandise sold at the baseball stadium, tickets sold for games and events at the
Capital One Center and merchandise sold at the Capital One Center
10.25%
Hotels (transient accommodations) 14.95%
Parking of motor vehicles in commercial lots 18.0% Source: “DC Tax Facts 2020.” Government of DC, Office of the Chief Financial Officer, Office of Revenue Analysis, p. 33. Note, the 8%
tax rate on soft drinks took effect on October 1, 2019. This rate change did not impact calculations for sales tax burdens in this report.
Automobile Taxes
Washington, DC, automobile tax burdens are below the 50-city average for all income
levels, as shown in Table 11, indicating the District’s competitive auto tax rates. Washington,
DC taxes gasoline at 23.5 cents per gallon, and requires registration fees for automobile owners.
Fees are $72 on cars weighing less than 3,500 pounds; $115 on cars equal to or greater than
3,500 pounds and less than 5,000 pounds; and $155 on automobiles weighing more than 5,000
pounds. The District of Columbia does not impose an annual excise tax or personal property tax
on automobiles.
Summary
As noted above, the tax burden of the District of Columbia is influenced by many factors.
The District of Columbia is restricted by the federal government from taxing non-resident
income; further a large percentage of DC land is tax-exempt (fifty-five percent of District
acreage is tax exempt24). These factors limit the District’s revenue raising capacity and some of
the available tax bases from which the city must fund a range of government operations that are
typically funded by both states and cities. There are positive factors that increase District tax
bases, however, including substantial tourist activity as well as the large volume of business and
lobbying activity generated by the federal presence.
24 “DC Tax Facts 2020.” Government of the District of Columbia, Office of the Chief Financial Officer, Office of Revenue Analysis, p. 49.
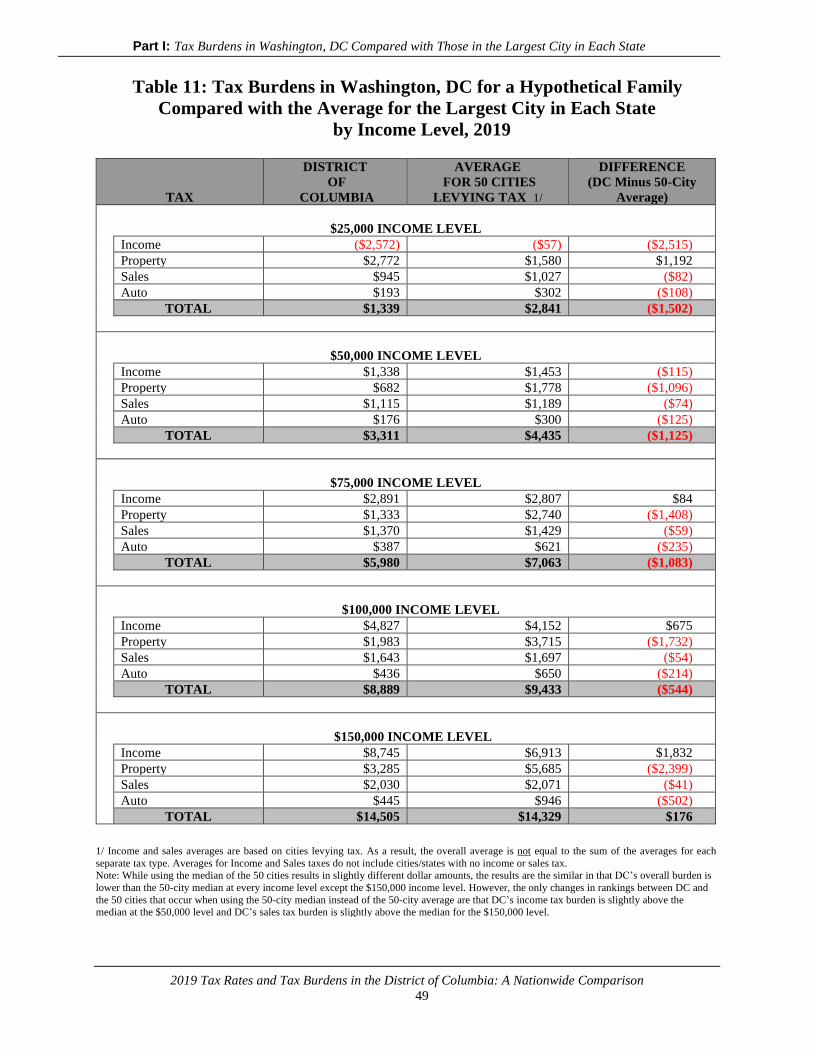
Part I: Tax Burdens in Washington, DC Compared with Those in the Largest City in Each State
2019 Tax Rates and Tax Burdens in the District of Columbia: A Nationwide Comparison
49
Table 11: Tax Burdens in Washington, DC for a Hypothetical Family
Compared with the Average for the Largest City in Each State
by Income Level, 2019
TAX
DISTRICT
OF
COLUMBIA
AVERAGE
FOR 50 CITIES
LEVYING TAX 1/
DIFFERENCE
(DC Minus 50-City
Average)
$25,000 INCOME LEVEL
Income ($2,572) ($57) ($2,515)
Property $2,772 $1,580 $1,192
Sales $945 $1,027 ($82)
Auto $193 $302 ($108)
TOTAL $1,339 $2,841 ($1,502)
$50,000 INCOME LEVEL
Income $1,338 $1,453 ($115)
Property $682 $1,778 ($1,096)
Sales $1,115 $1,189 ($74)
Auto $176 $300 ($125)
TOTAL $3,311 $4,435 ($1,125)
$75,000 INCOME LEVEL
Income $2,891 $2,807 $84
Property $1,333 $2,740 ($1,408)
Sales $1,370 $1,429 ($59)
Auto $387 $621 ($235)
TOTAL $5,980 $7,063 ($1,083)
$100,000 INCOME LEVEL
Income $4,827 $4,152 $675
Property $1,983 $3,715 ($1,732)
Sales $1,643 $1,697 ($54)
Auto $436 $650 ($214)
TOTAL $8,889 $9,433 ($544)
$150,000 INCOME LEVEL
Income $8,745 $6,913 $1,832
Property $3,285 $5,685 ($2,399)
Sales $2,030 $2,071 ($41)
Auto $445 $946 ($502)
TOTAL $14,505 $14,329 $176
1/ Income and sales averages are based on cities levying tax. As a result, the overall average is not equal to the sum of the averages for each
separate tax type. Averages for Income and Sales taxes do not include cities/states with no income or sales tax.
Note: While using the median of the 50 cities results in slightly different dollar amounts, the results are the similar in that DC’s overall burden is
lower than the 50-city median at every income level except the $150,000 income level. However, the only changes in rankings between DC and
the 50 cities that occur when using the 50-city median instead of the 50-city average are that DC’s income tax burden is slightly above the
median at the $50,000 level and DC’s sales tax burden is slightly above the median for the $150,000 level.
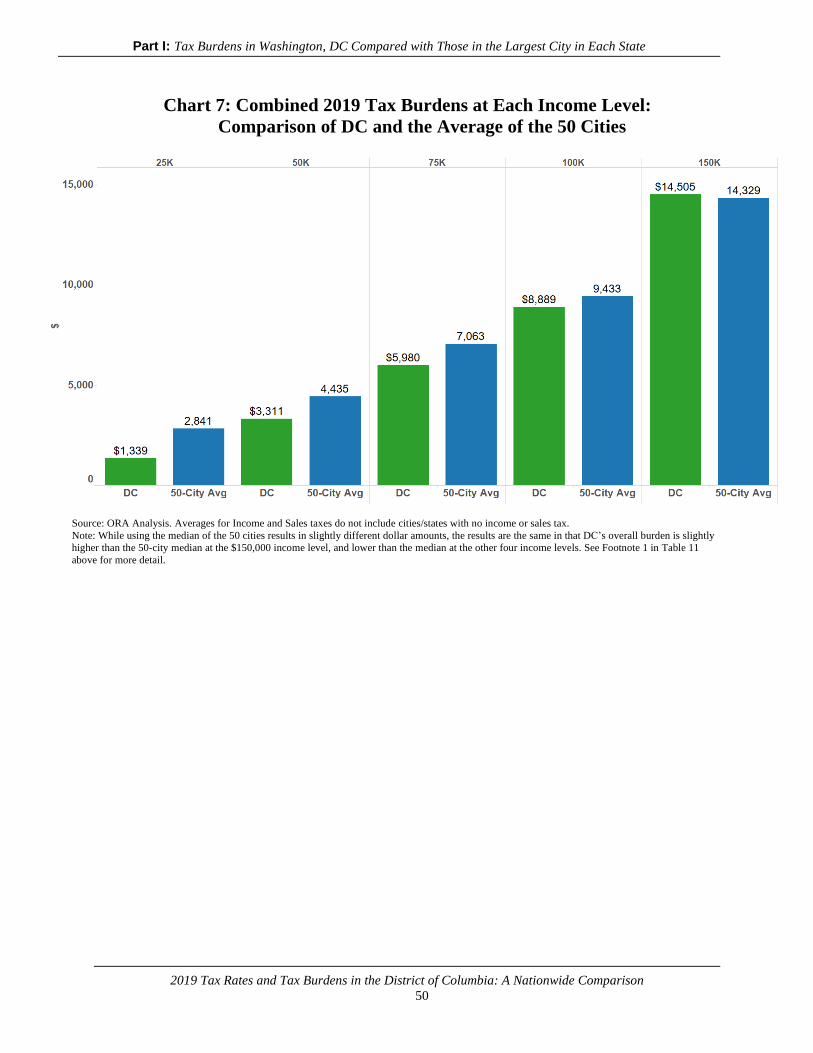
Part I: Tax Burdens in Washington, DC Compared with Those in the Largest City in Each State
2019 Tax Rates and Tax Burdens in the District of Columbia: A Nationwide Comparison
50
Chart 7: Combined 2019 Tax Burdens at Each Income Level:
Comparison of DC and the Average of the 50 Cities
Source: ORA Analysis. Averages for Income and Sales taxes do not include cities/states with no income or sales tax. Note: While using the median of the 50 cities results in slightly different dollar amounts, the results are the same in that DC’s overall burden is slightly
higher than the 50-city median at the $150,000 income level, and lower than the median at the other four income levels. See Footnote 1 in Table 11
above for more detail.
Part II: A Comparison of Selected Tax Rates in the District of Columbia with Those in the 50 States as of Jan. 1, 2020
2019 Tax Rates and Tax Burdens in the District of Columbia: A Nationwide Comparison
51
Part II
A Comparison of Selected Tax Rates in the
District of Columbia with Those in the 50 States
as of January 1, 2020
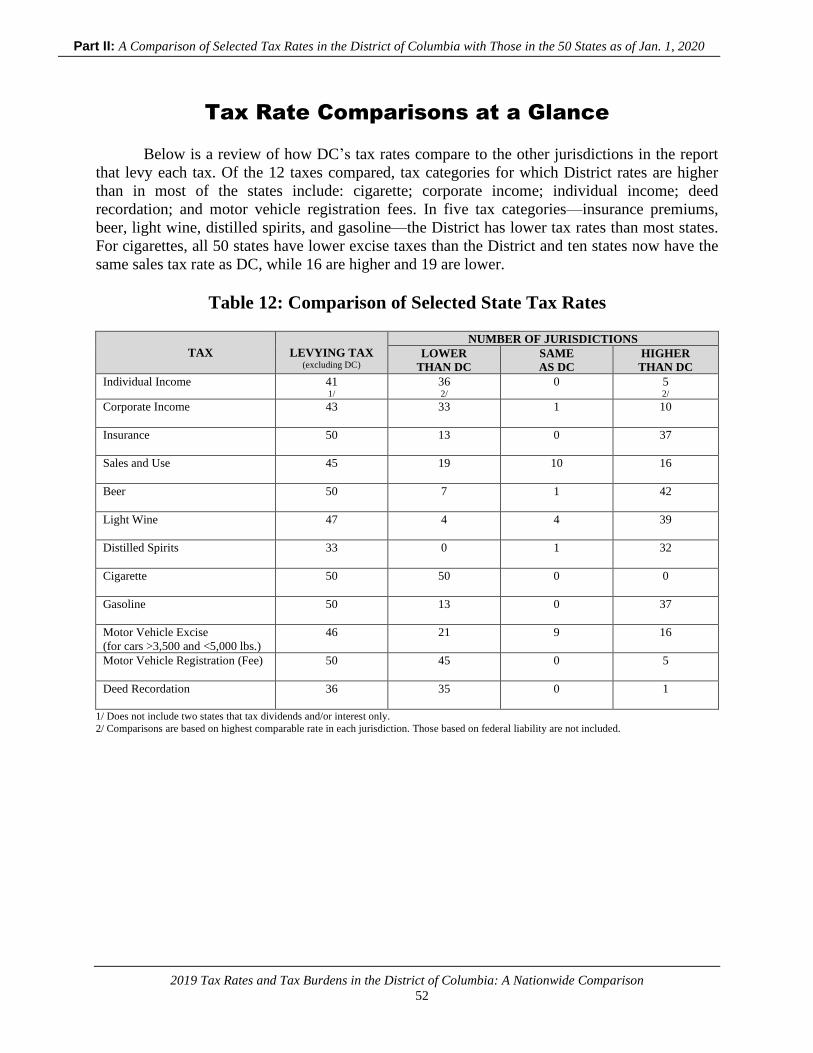
Part II: A Comparison of Selected Tax Rates in the District of Columbia with Those in the 50 States as of Jan. 1, 2020
2019 Tax Rates and Tax Burdens in the District of Columbia: A Nationwide Comparison
52
Tax Rate Comparisons at a Glance
Below is a review of how DC’s tax rates compare to the other jurisdictions in the report
that levy each tax. Of the 12 taxes compared, tax categories for which District rates are higher
than in most of the states include: cigarette; corporate income; individual income; deed
recordation; and motor vehicle registration fees. In five tax categories—insurance premiums,
beer, light wine, distilled spirits, and gasoline—the District has lower tax rates than most states.
For cigarettes, all 50 states have lower excise taxes than the District and ten states now have the
same sales tax rate as DC, while 16 are higher and 19 are lower.
Table 12: Comparison of Selected State Tax Rates
TAX
LEVYING TAX (excluding DC)
NUMBER OF JURISDICTIONS
LOWER
THAN DC
SAME
AS DC
HIGHER
THAN DC
Individual Income 41 1/
36 2/
0 5 2/
Corporate Income 43
33 1 10
Insurance 50
13 0 37
Sales and Use 45
19 10 16
Beer 50
7 1 42
Light Wine 47
4 4 39
Distilled Spirits 33
0 1 32
Cigarette 50
50 0 0
Gasoline 50
13 0 37
Motor Vehicle Excise
(for cars >3,500 and <5,000 lbs.)
46
21 9 16
Motor Vehicle Registration (Fee) 50
45 0 5
Deed Recordation 36
35 0 1
1/ Does not include two states that tax dividends and/or interest only.
2/ Comparisons are based on highest comparable rate in each jurisdiction. Those based on federal liability are not included.
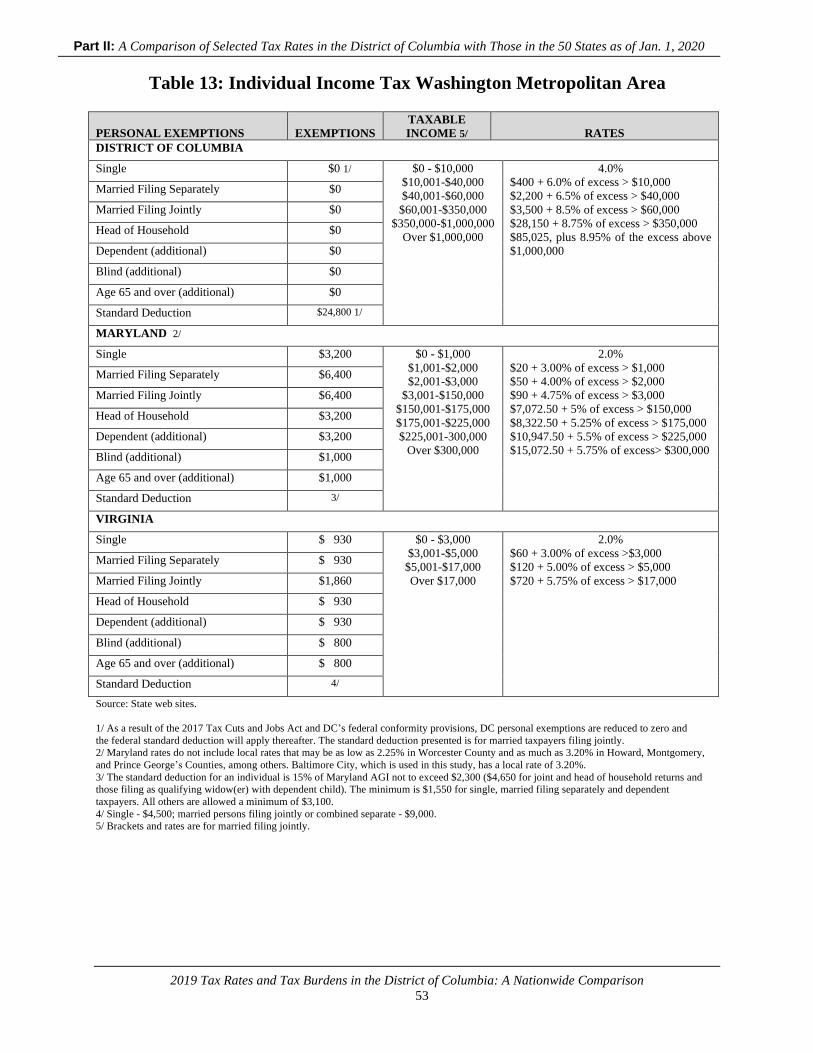
Part II: A Comparison of Selected Tax Rates in the District of Columbia with Those in the 50 States as of Jan. 1, 2020
2019 Tax Rates and Tax Burdens in the District of Columbia: A Nationwide Comparison
53
Table 13: Individual Income Tax Washington Metropolitan Area
PERSONAL EXEMPTIONS
EXEMPTIONS
TAXABLE
INCOME 5/
RATES
DISTRICT OF COLUMBIA
Single $0 1/ $0 - $10,000
$10,001-$40,000
$40,001-$60,000
$60,001-$350,000
$350,000-$1,000,000
Over $1,000,000
4.0%
$400 + 6.0% of excess > $10,000
$2,200 + 6.5% of excess > $40,000
$3,500 + 8.5% of excess > $60,000
$28,150 + 8.75% of excess > $350,000
$85,025, plus 8.95% of the excess above
$1,000,000
Married Filing Separately $0
Married Filing Jointly $0
Head of Household $0
Dependent (additional) $0
Blind (additional) $0
Age 65 and over (additional) $0
Standard Deduction $24,800 1/
MARYLAND 2/
Single $3,200 $0 - $1,000
$1,001-$2,000
$2,001-$3,000
$3,001-$150,000
$150,001-$175,000
$175,001-$225,000
$225,001-300,000
Over $300,000
2.0%
$20 + 3.00% of excess > $1,000
$50 + 4.00% of excess > $2,000
$90 + 4.75% of excess > $3,000
$7,072.50 + 5% of excess > $150,000
$8,322.50 + 5.25% of excess > $175,000
$10,947.50 + 5.5% of excess > $225,000
$15,072.50 + 5.75% of excess> $300,000
Married Filing Separately $6,400
Married Filing Jointly $6,400
Head of Household $3,200
Dependent (additional) $3,200
Blind (additional) $1,000
Age 65 and over (additional) $1,000
Standard Deduction 3/
VIRGINIA
Single $ 930 $0 - $3,000
$3,001-$5,000
$5,001-$17,000
Over $17,000
2.0%
$60 + 3.00% of excess >$3,000
$120 + 5.00% of excess > $5,000
$720 + 5.75% of excess > $17,000
Married Filing Separately $ 930
Married Filing Jointly $1,860
Head of Household $ 930
Dependent (additional) $ 930
Blind (additional) $ 800
Age 65 and over (additional) $ 800
Standard Deduction 4/
Source: State web sites.
1/ As a result of the 2017 Tax Cuts and Jobs Act and DC’s federal conformity provisions, DC personal exemptions are reduced to zero and
the federal standard deduction will apply thereafter. The standard deduction presented is for married taxpayers filing jointly.
2/ Maryland rates do not include local rates that may be as low as 2.25% in Worcester County and as much as 3.20% in Howard, Montgomery,
and Prince George’s Counties, among others. Baltimore City, which is used in this study, has a local rate of 3.20%.
3/ The standard deduction for an individual is 15% of Maryland AGI not to exceed $2,300 ($4,650 for joint and head of household returns and
those filing as qualifying widow(er) with dependent child). The minimum is $1,550 for single, married filing separately and dependent
taxpayers. All others are allowed a minimum of $3,100.
4/ Single - $4,500; married persons filing jointly or combined separate - $9,000.
5/ Brackets and rates are for married filing jointly.
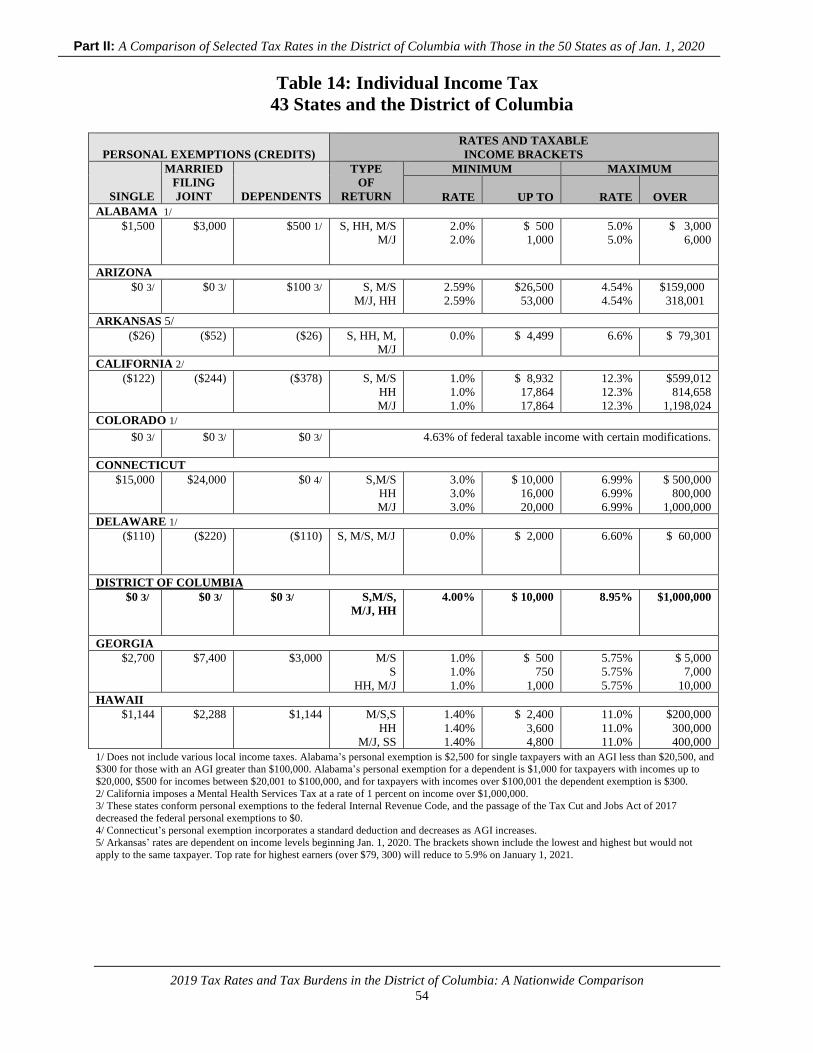
Part II: A Comparison of Selected Tax Rates in the District of Columbia with Those in the 50 States as of Jan. 1, 2020
2019 Tax Rates and Tax Burdens in the District of Columbia: A Nationwide Comparison
54
Table 14: Individual Income Tax
43 States and the District of Columbia
PERSONAL EXEMPTIONS (CREDITS) RATES AND TAXABLE
INCOME BRACKETS
SINGLE
MARRIED
FILING
JOINT
DEPENDENTS
TYPE
OF
RETURN
MINIMUM MAXIMUM
RATE
UP TO
RATE
OVER ALABAMA 1/
$1,500 $3,000 $500 1/ S, HH, M/S M/J
2.0%
2.0%
$ 500 1,000
5.0%
5.0%
$ 3,000 6,000
ARIZONA
$0 3/ $0 3/ $100 3/ S, M/S
M/J, HH
2.59%
2.59%
$26,500
53,000 4.54%
4.54%
$159,000
318,001
ARKANSAS 5/ ($26) ($52) ($26) S, HH, M,
M/J
0.0% $ 4,499 6.6% $ 79,301
CALIFORNIA 2/ ($122) ($244) ($378) S, M/S
HH
M/J
1.0%
1.0%
1.0%
$ 8,932
17,864
17,864
12.3%
12.3%
12.3%
$599,012
814,658
1,198,024 COLORADO 1/
$0 3/ $0 3/ $0 3/ 4.63% of federal taxable income with certain modifications.
CONNECTICUT
$15,000 $24,000 $0 4/ S,M/S HH
M/J
3.0%
3.0%
3.0%
$ 10,000
16,000
20,000
6.99%
6.99%
6.99%
$ 500,000
800,000
1,000,000 DELAWARE 1/
($110) ($220) ($110) S, M/S, M/J 0.0%
$ 2,000
6.60%
$ 60,000
DISTRICT OF COLUMBIA
$0 3/ $0 3/ $0 3/ S,M/S,
M/J, HH 4.00% $ 10,000 8.95% $1,000,000
GEORGIA
$2,700 $7,400 $3,000 M/S S
HH, M/J
1.0%
1.0%
1.0%
$ 500
750
1,000
5.75%
5.75%
5.75%
$ 5,000
7,000
10,000 HAWAII
$1,144
$2,288 $1,144 M/S,S HH
M/J, SS
1.40%
1.40%
1.40%
$ 2,400
3,600
4,800
11.0%
11.0%
11.0%
$200,000
300,000
400,000 1/ Does not include various local income taxes. Alabama’s personal exemption is $2,500 for single taxpayers with an AGI less than $20,500, and
$300 for those with an AGI greater than $100,000. Alabama’s personal exemption for a dependent is $1,000 for taxpayers with incomes up to
$20,000, $500 for incomes between $20,001 to $100,000, and for taxpayers with incomes over $100,001 the dependent exemption is $300.
2/ California imposes a Mental Health Services Tax at a rate of 1 percent on income over $1,000,000.
3/ These states conform personal exemptions to the federal Internal Revenue Code, and the passage of the Tax Cut and Jobs Act of 2017
decreased the federal personal exemptions to $0.
4/ Connecticut’s personal exemption incorporates a standard deduction and decreases as AGI increases.
5/ Arkansas’ rates are dependent on income levels beginning Jan. 1, 2020. The brackets shown include the lowest and highest but would not
apply to the same taxpayer. Top rate for highest earners (over $79, 300) will reduce to 5.9% on January 1, 2021.
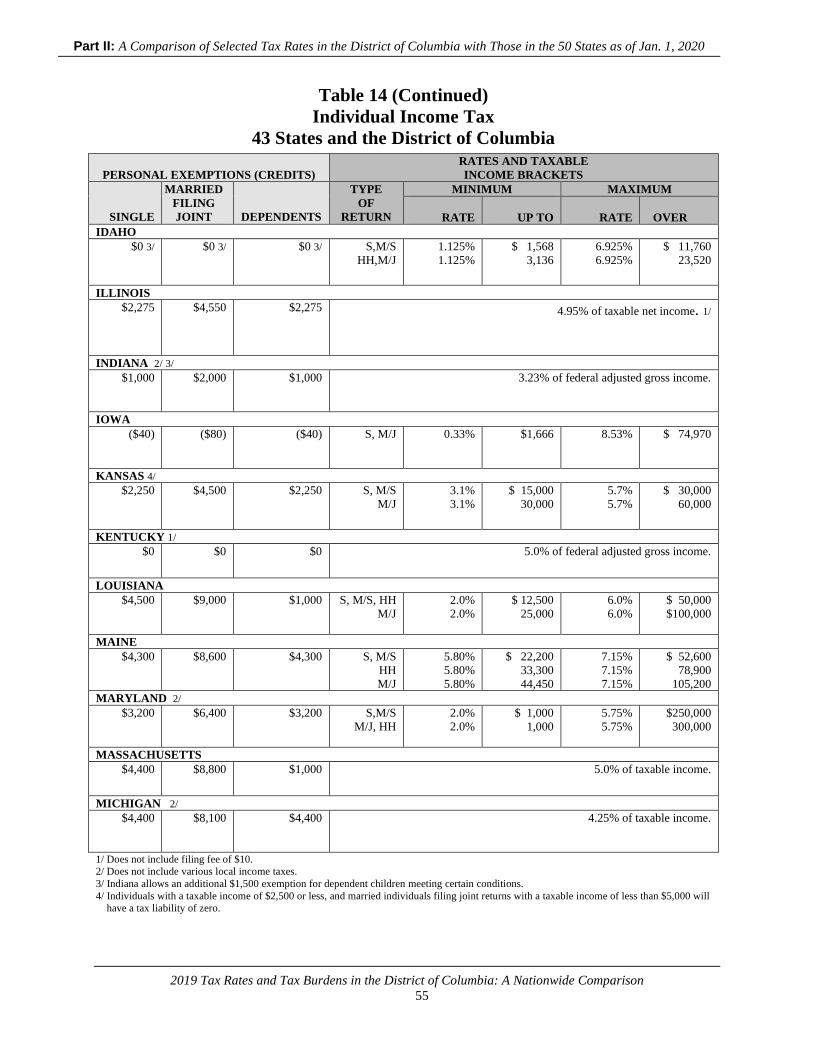
Part II: A Comparison of Selected Tax Rates in the District of Columbia with Those in the 50 States as of Jan. 1, 2020
2019 Tax Rates and Tax Burdens in the District of Columbia: A Nationwide Comparison
55
Table 14 (Continued)
Individual Income Tax
43 States and the District of Columbia
PERSONAL EXEMPTIONS (CREDITS) RATES AND TAXABLE
INCOME BRACKETS
SINGLE
MARRIED
FILING
JOINT
DEPENDENTS
TYPE
OF
RETURN
MINIMUM MAXIMUM
RATE
UP TO
RATE
OVER IDAHO
$0 3/ $0 3/ $0 3/ S,M/S HH,M/J
1.125%
1.125%
$ 1,568 3,136
6.925%
6.925%
$ 11,760 23,520
ILLINOIS
$2,275 $4,550
$2,275 4.95% of taxable net income. 1/
INDIANA 2/ 3/
$1,000 $2,000 $1,000
3.23% of federal adjusted gross income.
IOWA ($40) ($80) ($40) S, M/J 0.33% $1,666 8.53% $ 74,970
KANSAS 4/ $2,250 $4,500 $2,250 S, M/S
M/J 3.1%
3.1%
$ 15,000 30,000
5.7%
5.7%
$ 30,000 60,000
KENTUCKY 1/
$0 $0 $0 5.0% of federal adjusted gross income.
LOUISIANA $4,500 $9,000 $1,000 S, M/S, HH
M/J
2.0%
2.0%
$ 12,500
25,000
6.0%
6.0%
$ 50,000
$100,000
MAINE $4,300 $8,600 $4,300 S, M/S
HH
M/J
5.80%
5.80%
5.80%
$ 22,200
33,300
44,450
7.15%
7.15%
7.15%
$ 52,600
78,900
105,200
MARYLAND 2/
$3,200 $6,400 $3,200 S,M/S
M/J, HH
2.0%
2.0%
$ 1,000
1,000 5.75%
5.75%
$250,000
300,000
MASSACHUSETTS
$4,400 $8,800 $1,000 5.0% of taxable income.
MICHIGAN 2/
$4,400 $8,100 $4,400 4.25% of taxable income.
1/ Does not include filing fee of $10.
2/ Does not include various local income taxes.
3/ Indiana allows an additional $1,500 exemption for dependent children meeting certain conditions.
4/ Individuals with a taxable income of $2,500 or less, and married individuals filing joint returns with a taxable income of less than $5,000 will
have a tax liability of zero.
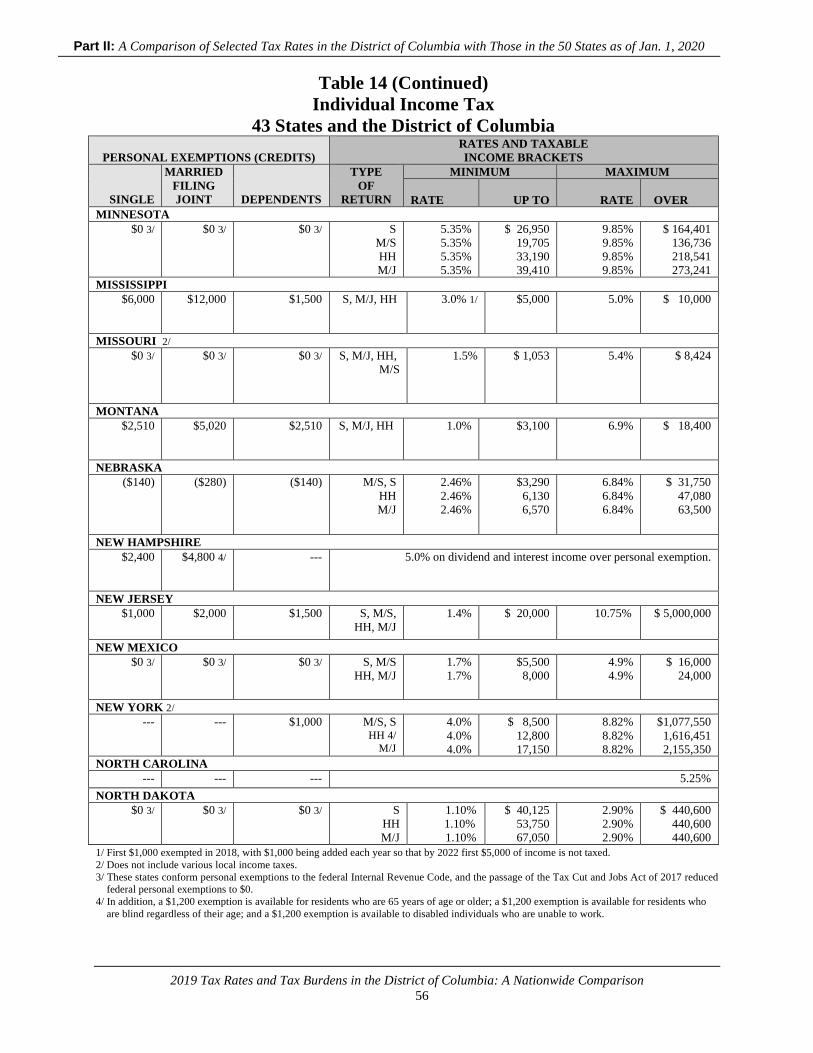
Part II: A Comparison of Selected Tax Rates in the District of Columbia with Those in the 50 States as of Jan. 1, 2020
2019 Tax Rates and Tax Burdens in the District of Columbia: A Nationwide Comparison
56
Table 14 (Continued)
Individual Income Tax
43 States and the District of Columbia
PERSONAL EXEMPTIONS (CREDITS) RATES AND TAXABLE
INCOME BRACKETS
SINGLE
MARRIED
FILING
JOINT
DEPENDENTS
TYPE
OF
RETURN
MINIMUM MAXIMUM
RATE
UP TO
RATE
OVER MINNESOTA
$0 3/ $0 3/ $0 3/ S
M/S
HH
M/J
5.35%
5.35%
5.35%
5.35%
$ 26,950
19,705
33,190
39,410
9.85%
9.85%
9.85%
9.85%
$ 164,401
136,736
218,541
273,241
MISSISSIPPI $6,000 $12,000
$1,500
S, M/J, HH 3.0% 1/
$5,000
5.0% $ 10,000
MISSOURI 2/ $0 3/ $0 3/ $0 3/ S, M/J, HH,
M/S
1.5% $ 1,053
5.4% $ 8,424
MONTANA $2,510 $5,020 $2,510 S, M/J, HH 1.0% $3,100
6.9% $ 18,400
NEBRASKA ($140) ($280) ($140) M/S, S
HH
M/J
2.46%
2.46%
2.46%
$3,290 6,130
6,570
6.84%
6.84%
6.84%
$ 31,750
47,080
63,500
NEW HAMPSHIRE
$2,400 $4,800 4/ --- 5.0% on dividend and interest income over personal exemption.
NEW JERSEY $1,000 $2,000 $1,500 S, M/S,
HH, M/J
1.4%
$ 20,000
10.75%
$ 5,000,000
NEW MEXICO
$0 3/ $0 3/ $0 3/ S, M/S
HH, M/J
1.7%
1.7%
$5,500
8,000 4.9%
4.9%
$ 16,000
24,000
NEW YORK 2/
--- --- $1,000 M/S, S HH 4/
M/J
4.0%
4.0%
4.0%
$ 8,500
12,800
17,150
8.82%
8.82%
8.82%
$1,077,550
1,616,451
2,155,350
NORTH CAROLINA
--- --- --- 5.25%
NORTH DAKOTA
$0 3/ $0 3/ $0 3/ S
HH
M/J
1.10%
1.10%
1.10%
$ 40,125
53,750
67,050
2.90%
2.90%
2.90%
$ 440,600
440,600
440,600 1/ First $1,000 exempted in 2018, with $1,000 being added each year so that by 2022 first $5,000 of income is not taxed.
2/ Does not include various local income taxes.
3/ These states conform personal exemptions to the federal Internal Revenue Code, and the passage of the Tax Cut and Jobs Act of 2017 reduced
federal personal exemptions to $0.
4/ In addition, a $1,200 exemption is available for residents who are 65 years of age or older; a $1,200 exemption is available for residents who
are blind regardless of their age; and a $1,200 exemption is available to disabled individuals who are unable to work.
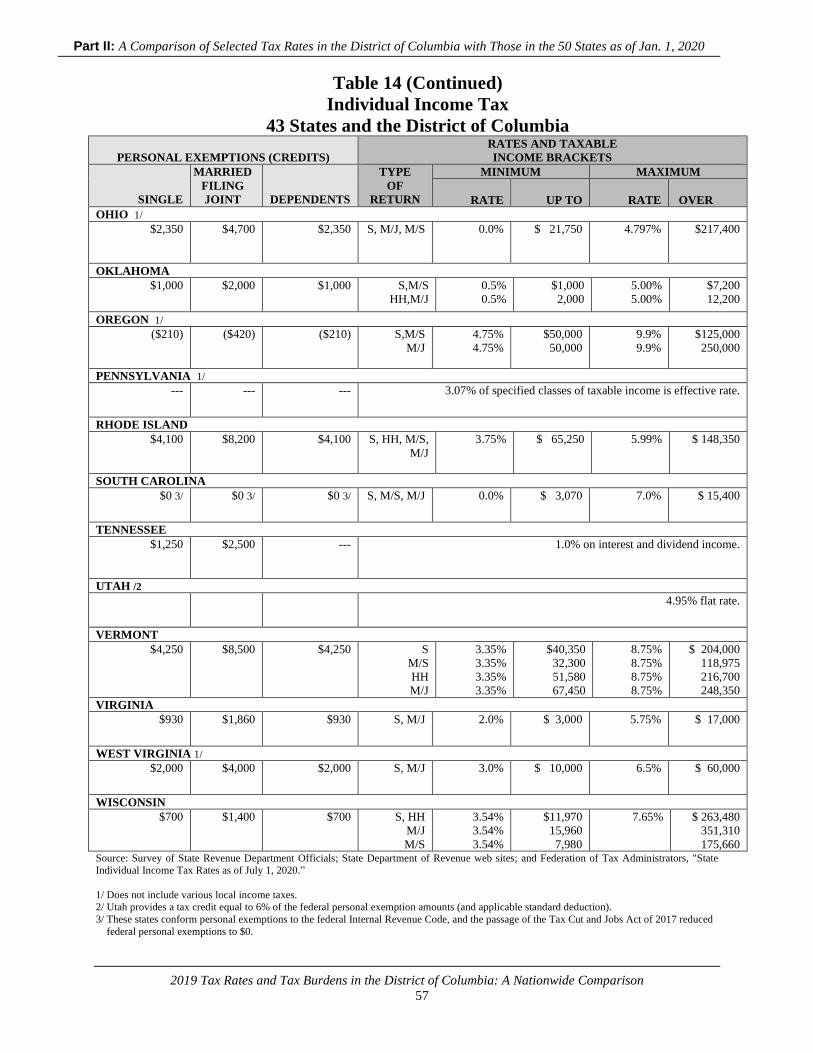
Part II: A Comparison of Selected Tax Rates in the District of Columbia with Those in the 50 States as of Jan. 1, 2020
2019 Tax Rates and Tax Burdens in the District of Columbia: A Nationwide Comparison
57
Table 14 (Continued)
Individual Income Tax
43 States and the District of Columbia
PERSONAL EXEMPTIONS (CREDITS) RATES AND TAXABLE
INCOME BRACKETS
SINGLE
MARRIED
FILING
JOINT
DEPENDENTS
TYPE
OF
RETURN
MINIMUM MAXIMUM
RATE
UP TO
RATE
OVER OHIO 1/
$2,350
$4,700
$2,350
S, M/J, M/S 0.0% $ 21,750 4.797% $217,400
OKLAHOMA $1,000 $2,000 $1,000 S,M/S
HH,M/J
0.5%
0.5%
$1,000
2,000
5.00%
5.00%
$7,200
12,200
OREGON 1/
($210) ($420) ($210) S,M/S
M/J
4.75%
4.75%
$50,000
50,000
9.9%
9.9%
$125,000
250,000
PENNSYLVANIA 1/
--- --- --- 3.07% of specified classes of taxable income is effective rate.
RHODE ISLAND
$4,100 $8,200 $4,100 S, HH, M/S,
M/J
3.75%
$ 65,250
5.99%
$ 148,350
SOUTH CAROLINA
$0 3/ $0 3/ $0 3/ S, M/S, M/J
0.0% $ 3,070
7.0%
$ 15,400
TENNESSEE
$1,250 $2,500 --- 1.0% on interest and dividend income.
UTAH /2
4.95% flat rate.
VERMONT
$4,250 $8,500 $4,250 S
M/S
HH
M/J
3.35%
3.35%
3.35%
3.35%
$40,350
32,300
51,580
67,450
8.75%
8.75%
8.75%
8.75%
$ 204,000
118,975
216,700
248,350
VIRGINIA
$930 $1,860 $930 S, M/J 2.0%
$ 3,000 5.75%
$ 17,000
WEST VIRGINIA 1/
$2,000 $4,000 $2,000 S, M/J
3.0%
$ 10,000 6.5%
$ 60,000
WISCONSIN
$700
$1,400 $700 S, HH
M/J
M/S
3.54%
3.54%
3.54%
$11,970
15,960
7,980
7.65%
$ 263,480
351,310
175,660 Source: Survey of State Revenue Department Officials; State Department of Revenue web sites; and Federation of Tax Administrators, "State
Individual Income Tax Rates as of July 1, 2020.”
1/ Does not include various local income taxes.
2/ Utah provides a tax credit equal to 6% of the federal personal exemption amounts (and applicable standard deduction).
3/ These states conform personal exemptions to the federal Internal Revenue Code, and the passage of the Tax Cut and Jobs Act of 2017 reduced
federal personal exemptions to $0.
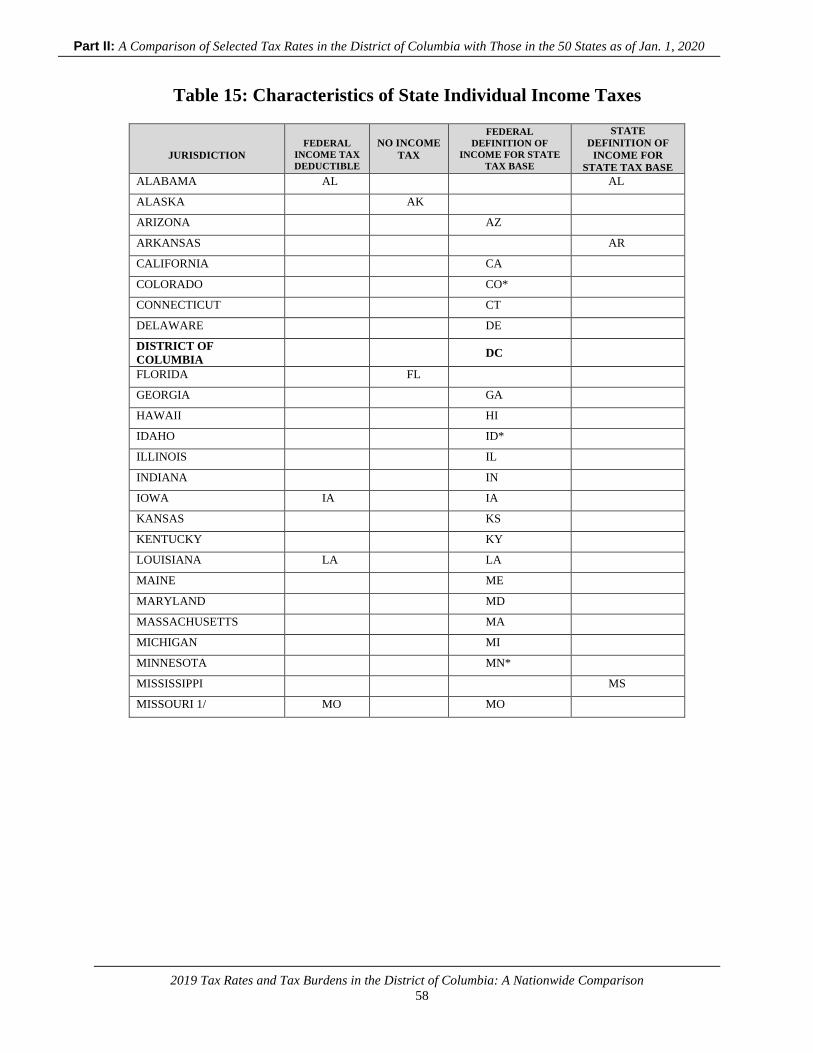
Part II: A Comparison of Selected Tax Rates in the District of Columbia with Those in the 50 States as of Jan. 1, 2020
2019 Tax Rates and Tax Burdens in the District of Columbia: A Nationwide Comparison
58
Table 15: Characteristics of State Individual Income Taxes
JURISDICTION
FEDERAL
INCOME TAX
DEDUCTIBLE
NO INCOME
TAX
FEDERAL
DEFINITION OF
INCOME FOR STATE
TAX BASE
STATE
DEFINITION OF
INCOME FOR
STATE TAX BASE
ALABAMA AL AL
ALASKA AK
ARIZONA AZ
ARKANSAS AR
CALIFORNIA CA
COLORADO CO*
CONNECTICUT CT
DELAWARE DE
DISTRICT OF
COLUMBIA DC
FLORIDA FL
GEORGIA GA
HAWAII HI
IDAHO ID*
ILLINOIS IL
INDIANA IN
IOWA IA IA
KANSAS KS
KENTUCKY KY
LOUISIANA LA LA
MAINE ME
MARYLAND MD
MASSACHUSETTS MA
MICHIGAN MI
MINNESOTA MN*
MISSISSIPPI MS
MISSOURI 1/ MO MO
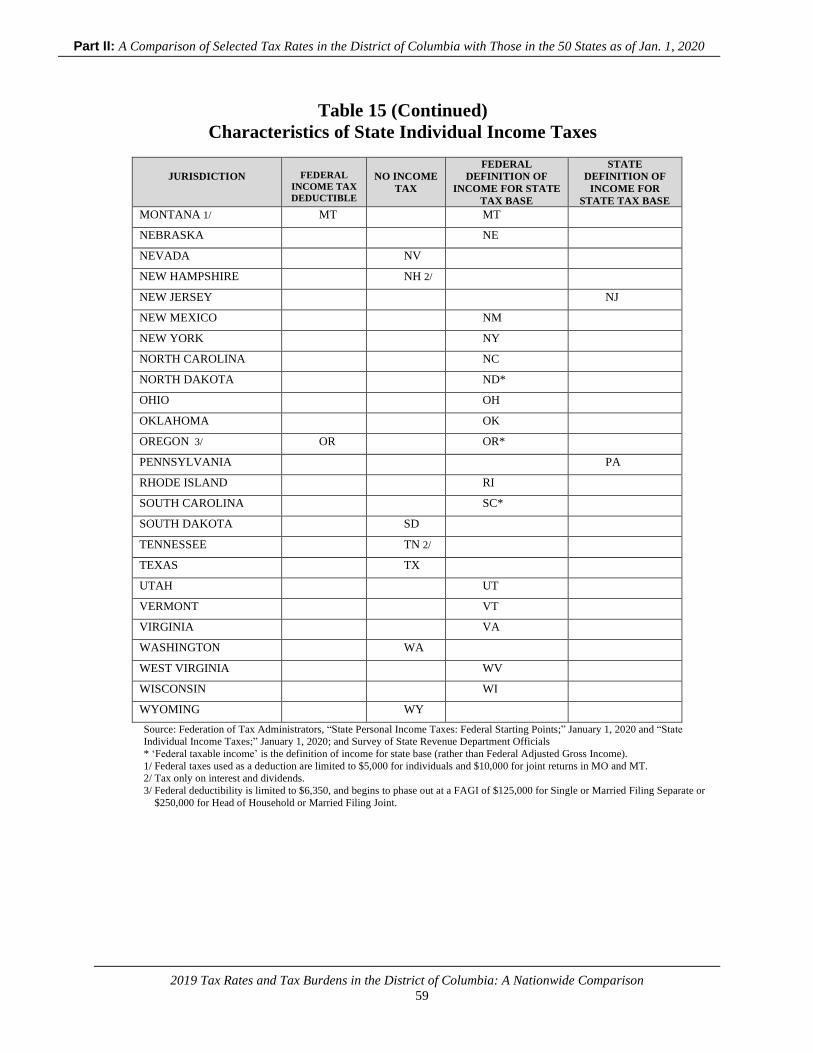
Part II: A Comparison of Selected Tax Rates in the District of Columbia with Those in the 50 States as of Jan. 1, 2020
2019 Tax Rates and Tax Burdens in the District of Columbia: A Nationwide Comparison
59
Table 15 (Continued)
Characteristics of State Individual Income Taxes
JURISDICTION
FEDERAL
INCOME TAX
DEDUCTIBLE
NO INCOME
TAX
FEDERAL
DEFINITION OF
INCOME FOR STATE
TAX BASE
STATE
DEFINITION OF
INCOME FOR
STATE TAX BASE
MONTANA 1/ MT MT
NEBRASKA NE
NEVADA NV
NEW HAMPSHIRE NH 2/
NEW JERSEY NJ
NEW MEXICO NM
NEW YORK NY
NORTH CAROLINA NC
NORTH DAKOTA ND*
OHIO OH
OKLAHOMA OK
OREGON 3/ OR OR*
PENNSYLVANIA PA
RHODE ISLAND RI
SOUTH CAROLINA SC*
SOUTH DAKOTA SD
TENNESSEE TN 2/
TEXAS TX
UTAH UT
VERMONT VT
VIRGINIA VA
WASHINGTON WA
WEST VIRGINIA WV
WISCONSIN WI
WYOMING WY
Source: Federation of Tax Administrators, “State Personal Income Taxes: Federal Starting Points;” January 1, 2020 and “State
Individual Income Taxes;” January 1, 2020; and Survey of State Revenue Department Officials
* ‘Federal taxable income’ is the definition of income for state base (rather than Federal Adjusted Gross Income).
1/ Federal taxes used as a deduction are limited to $5,000 for individuals and $10,000 for joint returns in MO and MT.
2/ Tax only on interest and dividends.
3/ Federal deductibility is limited to $6,350, and begins to phase out at a FAGI of $125,000 for Single or Married Filing Separate or
$250,000 for Head of Household or Married Filing Joint.
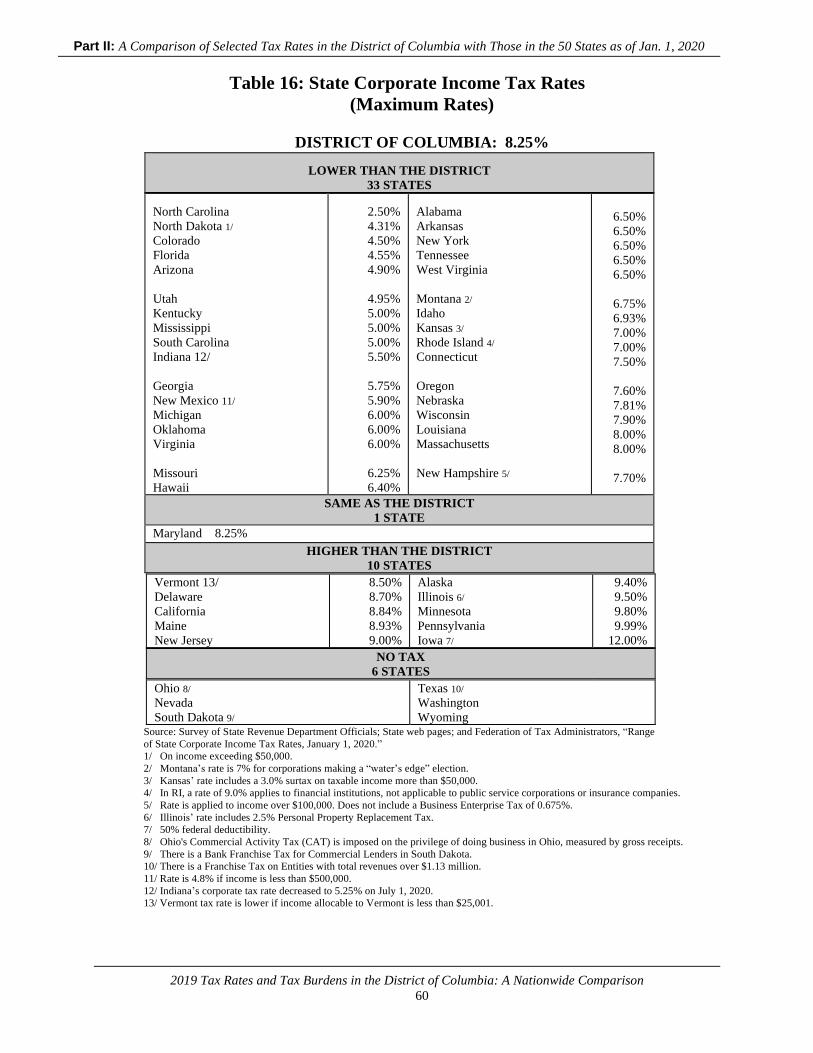
Part II: A Comparison of Selected Tax Rates in the District of Columbia with Those in the 50 States as of Jan. 1, 2020
2019 Tax Rates and Tax Burdens in the District of Columbia: A Nationwide Comparison
60
Table 16: State Corporate Income Tax Rates
(Maximum Rates)
DISTRICT OF COLUMBIA: 8.25%
LOWER THAN THE DISTRICT
33 STATES North Carolina
North Dakota 1/
Colorado
Florida
Arizona
Utah
Kentucky
Mississippi
South Carolina
Indiana 12/
Georgia
New Mexico 11/
Michigan
Oklahoma
Virginia
Missouri
Hawaii
2.50%
4.31%
4.50%
4.55%
4.90%
4.95%
5.00%
5.00%
5.00%
5.50%
5.75%
5.90%
6.00%
6.00%
6.00%
6.25%
6.40%
Alabama
Arkansas
New York
Tennessee
West Virginia
Montana 2/
Idaho
Kansas 3/
Rhode Island 4/
Connecticut
Oregon
Nebraska
Wisconsin
Louisiana
Massachusetts
New Hampshire 5/
6.50%
6.50%
6.50%
6.50%
6.50%
6.75%
6.93%
7.00%
7.00%
7.50%
7.60%
7.81%
7.90%
8.00%
8.00%
7.70%
SAME AS THE DISTRICT
1 STATE
Maryland 8.25%
HIGHER THAN THE DISTRICT
10 STATES Vermont 13/
Delaware
California
Maine
New Jersey
8.50%
8.70%
8.84%
8.93%
9.00%
Alaska
Illinois 6/
Minnesota
Pennsylvania
Iowa 7/
9.40%
9.50%
9.80%
9.99%
12.00%
NO TAX
6 STATES Ohio 8/
Nevada
South Dakota 9/
Texas 10/
Washington
Wyoming
Source: Survey of State Revenue Department Officials; State web pages; and Federation of Tax Administrators, “Range
of State Corporate Income Tax Rates, January 1, 2020.”
1/ On income exceeding $50,000.
2/ Montana’s rate is 7% for corporations making a “water’s edge” election.
3/ Kansas’ rate includes a 3.0% surtax on taxable income more than $50,000.
4/ In RI, a rate of 9.0% applies to financial institutions, not applicable to public service corporations or insurance companies.
5/ Rate is applied to income over $100,000. Does not include a Business Enterprise Tax of 0.675%.
6/ Illinois’ rate includes 2.5% Personal Property Replacement Tax.
7/ 50% federal deductibility.
8/ Ohio's Commercial Activity Tax (CAT) is imposed on the privilege of doing business in Ohio, measured by gross receipts.
9/ There is a Bank Franchise Tax for Commercial Lenders in South Dakota.
10/ There is a Franchise Tax on Entities with total revenues over $1.13 million.
11/ Rate is 4.8% if income is less than $500,000.
12/ Indiana’s corporate tax rate decreased to 5.25% on July 1, 2020.
13/ Vermont tax rate is lower if income allocable to Vermont is less than $25,001.

Part II: A Comparison of Selected Tax Rates in the District of Columbia with Those in the 50 States as of Jan. 1, 2020
2019 Tax Rates and Tax Burdens in the District of Columbia: A Nationwide Comparison
61
Table 17: State Gross Premiums Tax Rates on Foreign (Out-of-State) Life
Insurers
(Maximum Rates)
DISTRICT OF COLUMBIA: 1.7%
LOWER THAN THE DISTRICT
13 STATES Illinois
New York 1/
South Carolina
Wyoming
Iowa
Nebraska
Michigan
0.50%
0.70%
0.75%
0.75%
1.00%
1.00%
1.25%
New Hampshire
Indiana
Ohio
Idaho
Kentucky
Connecticut
1.25%
1.30%
1.40%
1.50%
1.50%
1.50%
HIGHER THAN THE DISTRICT
37 STATES Florida
Tennessee
Texas
Arizona
North Carolina
Colorado
Delaware
Kansas
Maine
Maryland
Massachusetts
Minnesota
Missouri
New Jersey
North Dakota
Oregon
Pennsylvania
Rhode Island
Vermont
Washington
1.75%
1.75%
1.75%
1.75%
1.90%
2.00%
2.00%
2.00%
2.00%
2.00%
2.00%
2.00%
2.00%
2.00%
2.00%
2.00%
2.00%
2.00%
2.00%
2.00%
Wisconsin
Georgia
Louisiana
Oklahoma
Utah
Virginia
Alabama
California
Arkansas
South Dakota
Alaska
Hawaii
Montana
Mississippi
New Mexico
West Virginia
Nevada
2.00%
2.25%
2.25%
2.25%
2.25%
2.25%
2.30%
2.35%
2.50%
2.50%
2.70%
2.75%
2.75%
3.00%
3.00%
3.00%
3.50%
Source: Survey of State Revenue Department Officials; state statutes; and Gentry, John D., “Taxation of Insurance
Companies.” Informational Paper 10. Wisconsin Legislative Fiscal Bureau. January 2019.
1/ Life insurers pay a franchise tax which is equal to the sum of the premiums tax and a tax based on the highest of four
bases, plus a tax on subsidiary capital. The sum of the two components cannot be less than 1.5% or greater than 2% of
premiums.
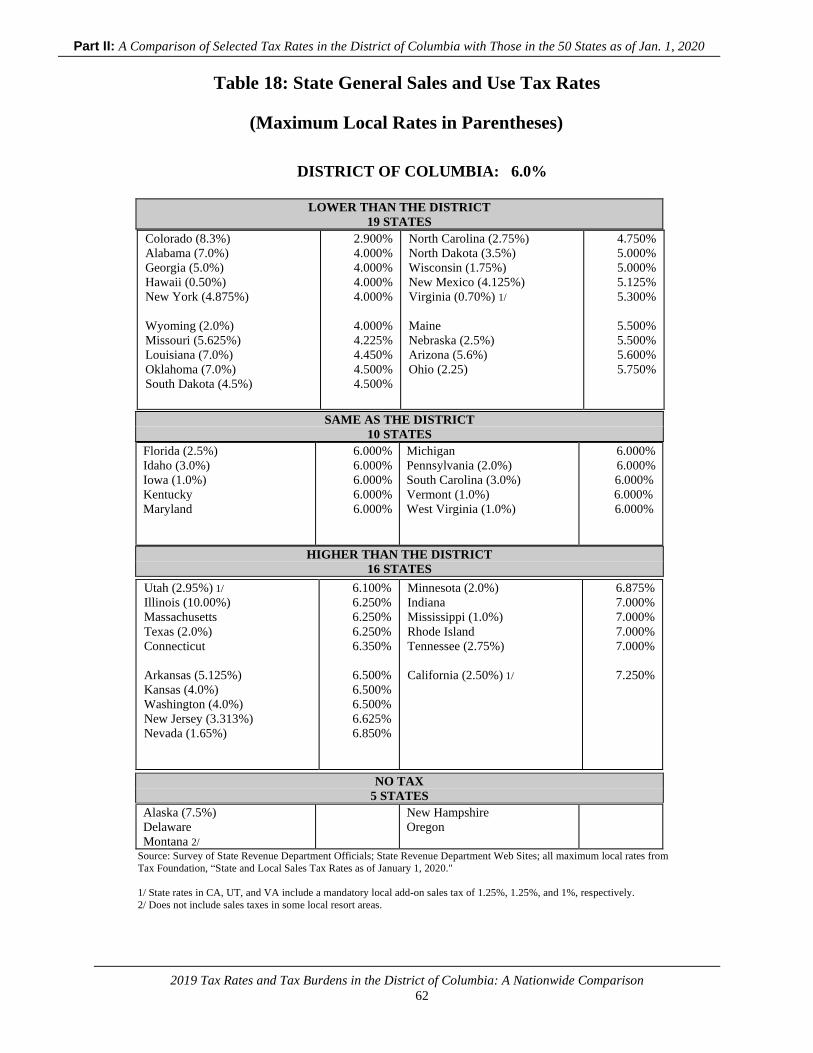
Part II: A Comparison of Selected Tax Rates in the District of Columbia with Those in the 50 States as of Jan. 1, 2020
2019 Tax Rates and Tax Burdens in the District of Columbia: A Nationwide Comparison
62
Table 18: State General Sales and Use Tax Rates
(Maximum Local Rates in Parentheses)
DISTRICT OF COLUMBIA: 6.0%
LOWER THAN THE DISTRICT
19 STATES Colorado (8.3%)
Alabama (7.0%)
Georgia (5.0%)
Hawaii (0.50%)
New York (4.875%)
Wyoming (2.0%)
Missouri (5.625%)
Louisiana (7.0%)
Oklahoma (7.0%)
South Dakota (4.5%)
2.900%
4.000%
4.000%
4.000%
4.000%
4.000%
4.225%
4.450%
4.500%
4.500%
North Carolina (2.75%)
North Dakota (3.5%)
Wisconsin (1.75%)
New Mexico (4.125%)
Virginia (0.70%) 1/
Maine
Nebraska (2.5%)
Arizona (5.6%)
Ohio (2.25)
4.750%
5.000%
5.000%
5.125%
5.300%
5.500%
5.500%
5.600%
5.750%
SAME AS THE DISTRICT
10 STATES
Florida (2.5%)
Idaho (3.0%)
Iowa (1.0%)
Kentucky
Maryland
6.000%
6.000%
6.000%
6.000%
6.000%
Michigan
Pennsylvania (2.0%)
South Carolina (3.0%)
Vermont (1.0%)
West Virginia (1.0%)
6.000%
6.000%
6.000%
6.000%
6.000%
HIGHER THAN THE DISTRICT
16 STATES Utah (2.95%) 1/
Illinois (10.00%)
Massachusetts
Texas (2.0%)
Connecticut
Arkansas (5.125%)
Kansas (4.0%)
Washington (4.0%)
New Jersey (3.313%)
Nevada (1.65%)
6.100%
6.250%
6.250%
6.250%
6.350%
6.500%
6.500%
6.500%
6.625%
6.850%
Minnesota (2.0%)
Indiana
Mississippi (1.0%)
Rhode Island
Tennessee (2.75%)
California (2.50%) 1/
6.875%
7.000%
7.000%
7.000%
7.000%
7.250%
NO TAX
5 STATES
Alaska (7.5%)
Delaware
Montana 2/
New Hampshire
Oregon
Source: Survey of State Revenue Department Officials; State Revenue Department Web Sites; all maximum local rates from
Tax Foundation, “State and Local Sales Tax Rates as of January 1, 2020."
1/ State rates in CA, UT, and VA include a mandatory local add-on sales tax of 1.25%, 1.25%, and 1%, respectively.
2/ Does not include sales taxes in some local resort areas.
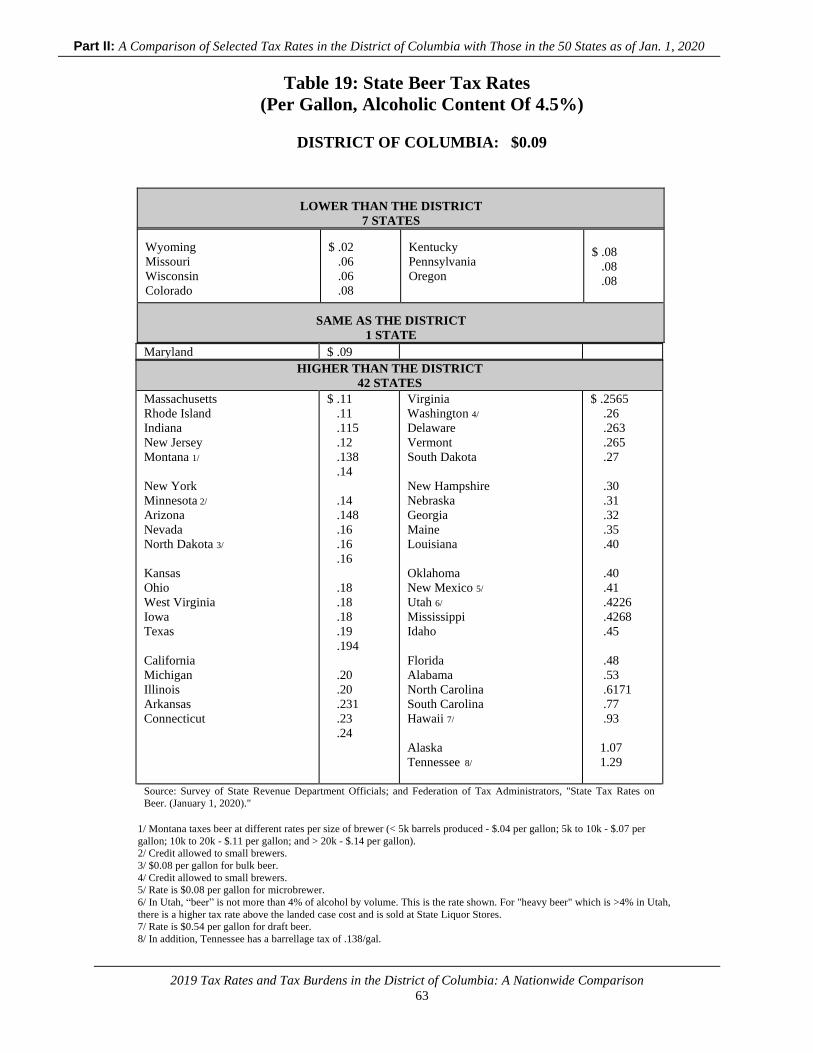
Part II: A Comparison of Selected Tax Rates in the District of Columbia with Those in the 50 States as of Jan. 1, 2020
2019 Tax Rates and Tax Burdens in the District of Columbia: A Nationwide Comparison
63
Table 19: State Beer Tax Rates
(Per Gallon, Alcoholic Content Of 4.5%)
DISTRICT OF COLUMBIA: $0.09
LOWER THAN THE DISTRICT
7 STATES Wyoming
Missouri
Wisconsin Colorado
$ .02
.06
.06
.08
Kentucky
Pennsylvania
Oregon
$ .08
.08
.08
SAME AS THE DISTRICT
1 STATE Maryland $ .09
HIGHER THAN THE DISTRICT
42 STATES Massachusetts
Rhode Island Indiana
New Jersey
Montana 1/
New York
Minnesota 2/
Arizona
Nevada
North Dakota 3/
Kansas
Ohio
West Virginia
Iowa
Texas
California
Michigan
Illinois
Arkansas
Connecticut
$ .11
.11
.115
.12
.138
.14
.14
.148
.16
.16
.16
.18
.18
.18
.19
.194
.20
.20
.231
.23
.24
Virginia
Washington 4/
Delaware
Vermont
South Dakota
New Hampshire
Nebraska
Georgia
Maine
Louisiana
Oklahoma
New Mexico 5/
Utah 6/
Mississippi
Idaho
Florida
Alabama
North Carolina
South Carolina
Hawaii 7/
Alaska
Tennessee 8/
$ .2565
.26
.263
.265
.27
.30
.31
.32
.35
.40
.40
.41
.4226
.4268
.45
.48
.53
.6171
.77
.93
1.07
1.29
Source: Survey of State Revenue Department Officials; and Federation of Tax Administrators, "State Tax Rates on
Beer. (January 1, 2020)."
1/ Montana taxes beer at different rates per size of brewer (< 5k barrels produced - $.04 per gallon; 5k to 10k - $.07 per
gallon; 10k to 20k - $.11 per gallon; and > 20k - $.14 per gallon).
2/ Credit allowed to small brewers.
3/ $0.08 per gallon for bulk beer.
4/ Credit allowed to small brewers.
5/ Rate is $0.08 per gallon for microbrewer.
6/ In Utah, “beer” is not more than 4% of alcohol by volume. This is the rate shown. For "heavy beer" which is >4% in Utah,
there is a higher tax rate above the landed case cost and is sold at State Liquor Stores.
7/ Rate is $0.54 per gallon for draft beer.
8/ In addition, Tennessee has a barrellage tax of .138/gal.
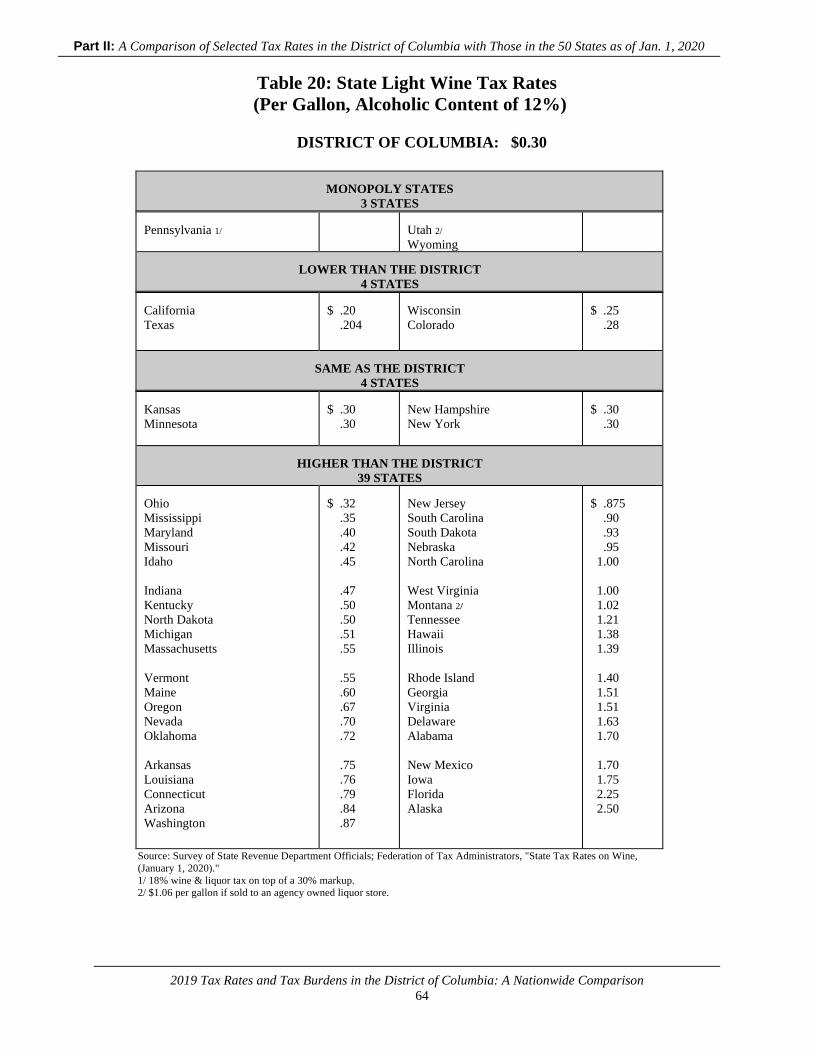
Part II: A Comparison of Selected Tax Rates in the District of Columbia with Those in the 50 States as of Jan. 1, 2020
2019 Tax Rates and Tax Burdens in the District of Columbia: A Nationwide Comparison
64
Table 20: State Light Wine Tax Rates
(Per Gallon, Alcoholic Content of 12%)
DISTRICT OF COLUMBIA: $0.30
MONOPOLY STATES
3 STATES Pennsylvania 1/
Utah 2/
Wyoming
LOWER THAN THE DISTRICT
4 STATES California
Texas
$ .20
.204
Wisconsin
Colorado
$ .25
.28
SAME AS THE DISTRICT
4 STATES Kansas
Minnesota
$ .30
.30
New Hampshire
New York
$ .30
.30
HIGHER THAN THE DISTRICT
39 STATES Ohio
Mississippi
Maryland
Missouri
Idaho
Indiana
Kentucky
North Dakota
Michigan
Massachusetts
Vermont
Maine
Oregon
Nevada
Oklahoma
Arkansas
Louisiana
Connecticut
Arizona
Washington
$ .32
.35
.40
.42
.45
.47
.50
.50
.51
.55
.55
.60
.67
.70
.72
.75
.76
.79
.84
.87
New Jersey
South Carolina
South Dakota
Nebraska
North Carolina
West Virginia
Montana 2/
Tennessee
Hawaii
Illinois
Rhode Island
Georgia
Virginia
Delaware
Alabama
New Mexico
Iowa
Florida
Alaska
$ .875
.90
.93
.95
1.00
1.00
1.02
1.21
1.38
1.39
1.40
1.51
1.51
1.63
1.70
1.70
1.75
2.25
2.50
Source: Survey of State Revenue Department Officials; Federation of Tax Administrators, "State Tax Rates on Wine,
(January 1, 2020)."
1/ 18% wine & liquor tax on top of a 30% markup.
2/ $1.06 per gallon if sold to an agency owned liquor store.
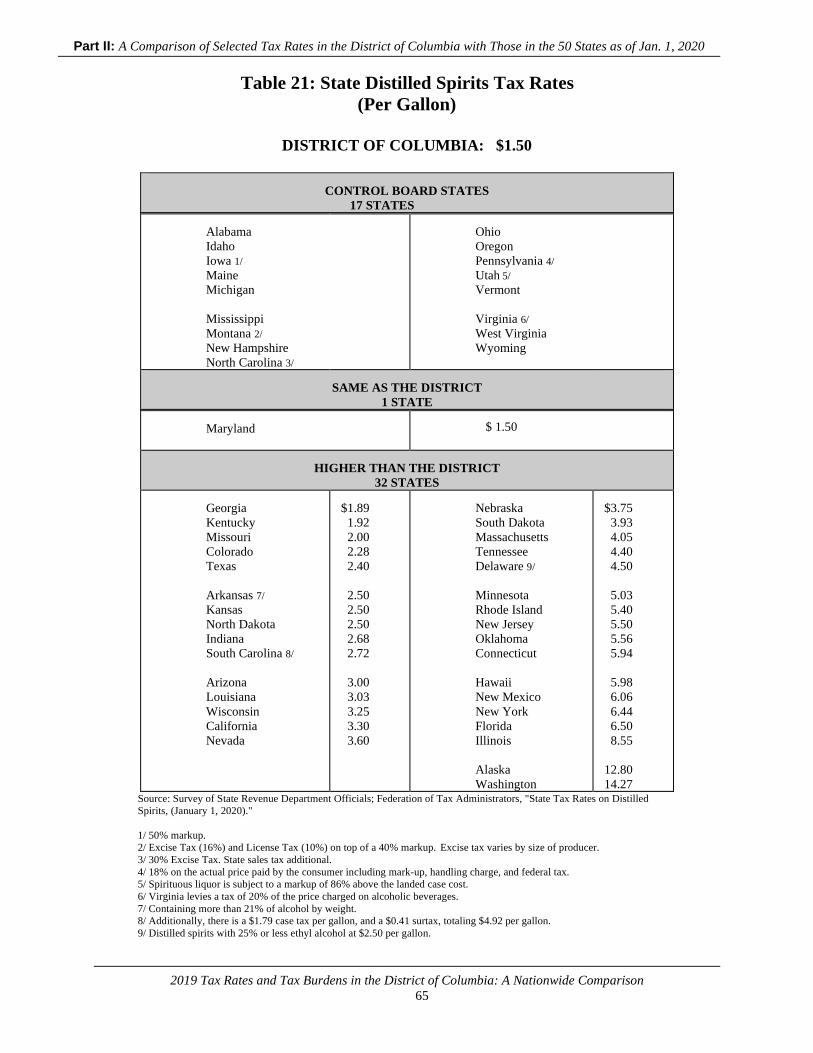
Part II: A Comparison of Selected Tax Rates in the District of Columbia with Those in the 50 States as of Jan. 1, 2020
2019 Tax Rates and Tax Burdens in the District of Columbia: A Nationwide Comparison
65
Table 21: State Distilled Spirits Tax Rates
(Per Gallon)
DISTRICT OF COLUMBIA: $1.50
CONTROL BOARD STATES
17 STATES
Alabama
Idaho
Iowa 1/
Maine
Michigan
Mississippi
Montana 2/
New Hampshire
North Carolina 3/
Ohio
Oregon
Pennsylvania 4/
Utah 5/
Vermont
Virginia 6/
West Virginia
Wyoming
SAME AS THE DISTRICT
1 STATE Maryland
$ 1.50
HIGHER THAN THE DISTRICT
32 STATES Georgia
Kentucky
Missouri
Colorado
Texas
Arkansas 7/
Kansas
North Dakota
Indiana
South Carolina 8/
Arizona
Louisiana
Wisconsin
California
Nevada
$1.89
1.92
2.00
2.28
2.40
2.50
2.50
2.50
2.68
2.72
3.00
3.03
3.25
3.30
3.60
Nebraska
South Dakota
Massachusetts
Tennessee
Delaware 9/
Minnesota
Rhode Island
New Jersey
Oklahoma
Connecticut
Hawaii
New Mexico
New York
Florida
Illinois
Alaska
Washington
$3.75
3.93
4.05
4.40
4.50
5.03
5.40
5.50
5.56
5.94
5.98
6.06
6.44
6.50
8.55
12.80
14.27 Source: Survey of State Revenue Department Officials; Federation of Tax Administrators, "State Tax Rates on Distilled
Spirits, (January 1, 2020)."
1/ 50% markup.
2/ Excise Tax (16%) and License Tax (10%) on top of a 40% markup. Excise tax varies by size of producer.
3/ 30% Excise Tax. State sales tax additional.
4/ 18% on the actual price paid by the consumer including mark-up, handling charge, and federal tax. 5/ Spirituous liquor is subject to a markup of 86% above the landed case cost.
6/ Virginia levies a tax of 20% of the price charged on alcoholic beverages.
7/ Containing more than 21% of alcohol by weight.
8/ Additionally, there is a $1.79 case tax per gallon, and a $0.41 surtax, totaling $4.92 per gallon.
9/ Distilled spirits with 25% or less ethyl alcohol at $2.50 per gallon.
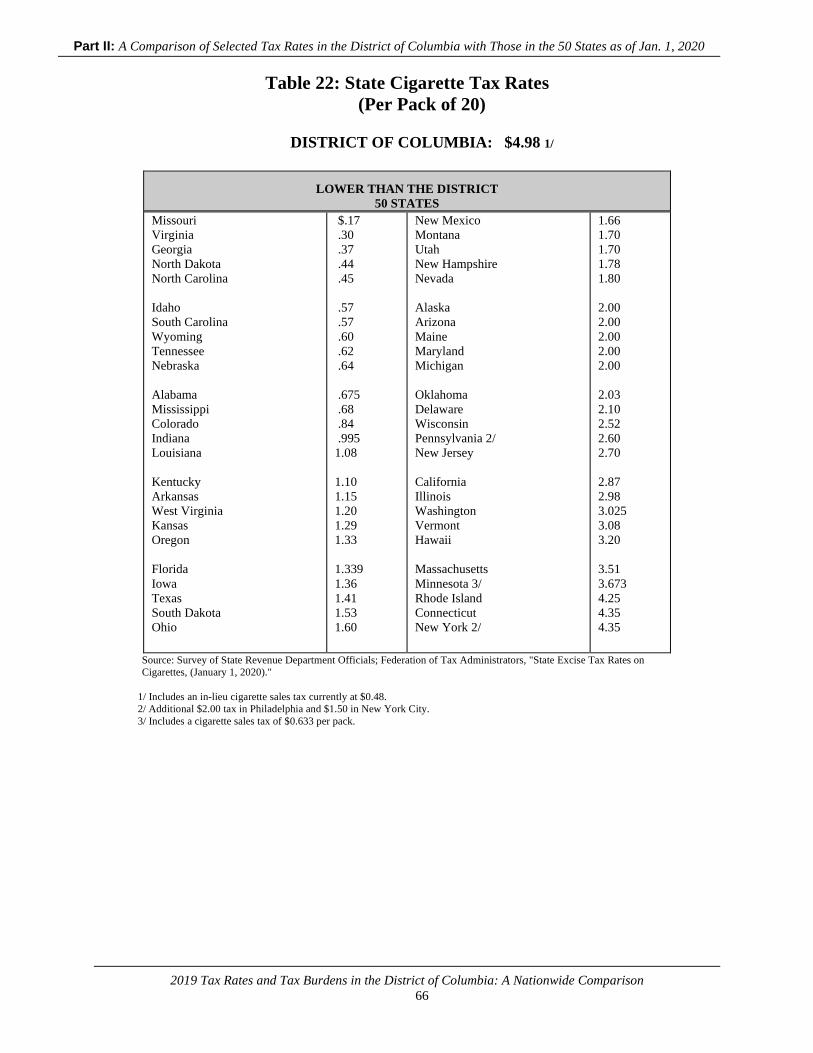
Part II: A Comparison of Selected Tax Rates in the District of Columbia with Those in the 50 States as of Jan. 1, 2020
2019 Tax Rates and Tax Burdens in the District of Columbia: A Nationwide Comparison
66
Table 22: State Cigarette Tax Rates
(Per Pack of 20)
DISTRICT OF COLUMBIA: $4.98 1/
LOWER THAN THE DISTRICT
50 STATES Missouri
Virginia
Georgia
North Dakota
North Carolina
Idaho
South Carolina
Wyoming
Tennessee
Nebraska
Alabama
Mississippi
Colorado
Indiana
Louisiana
Kentucky
Arkansas
West Virginia
Kansas
Oregon
Florida
Iowa
Texas
South Dakota
Ohio
$.17
.30
.37
.44
.45
.57
.57
.60
.62
.64
.675
.68
.84
.995
1.08
1.10
1.15
1.20
1.29
1.33
1.339
1.36
1.41
1.53
1.60
New Mexico
Montana
Utah
New Hampshire
Nevada
Alaska
Arizona
Maine
Maryland
Michigan
Oklahoma
Delaware
Wisconsin
Pennsylvania 2/
New Jersey
California
Illinois
Washington
Vermont
Hawaii
Massachusetts
Minnesota 3/
Rhode Island
Connecticut
New York 2/
1.66
1.70
1.70
1.78
1.80
2.00
2.00
2.00
2.00
2.00
2.03
2.10
2.52
2.60
2.70
2.87
2.98
3.025
3.08
3.20
3.51
3.673
4.25
4.35
4.35
Source: Survey of State Revenue Department Officials; Federation of Tax Administrators, "State Excise Tax Rates on
Cigarettes, (January 1, 2020)."
1/ Includes an in-lieu cigarette sales tax currently at $0.48.
2/ Additional $2.00 tax in Philadelphia and $1.50 in New York City.
3/ Includes a cigarette sales tax of $0.633 per pack.
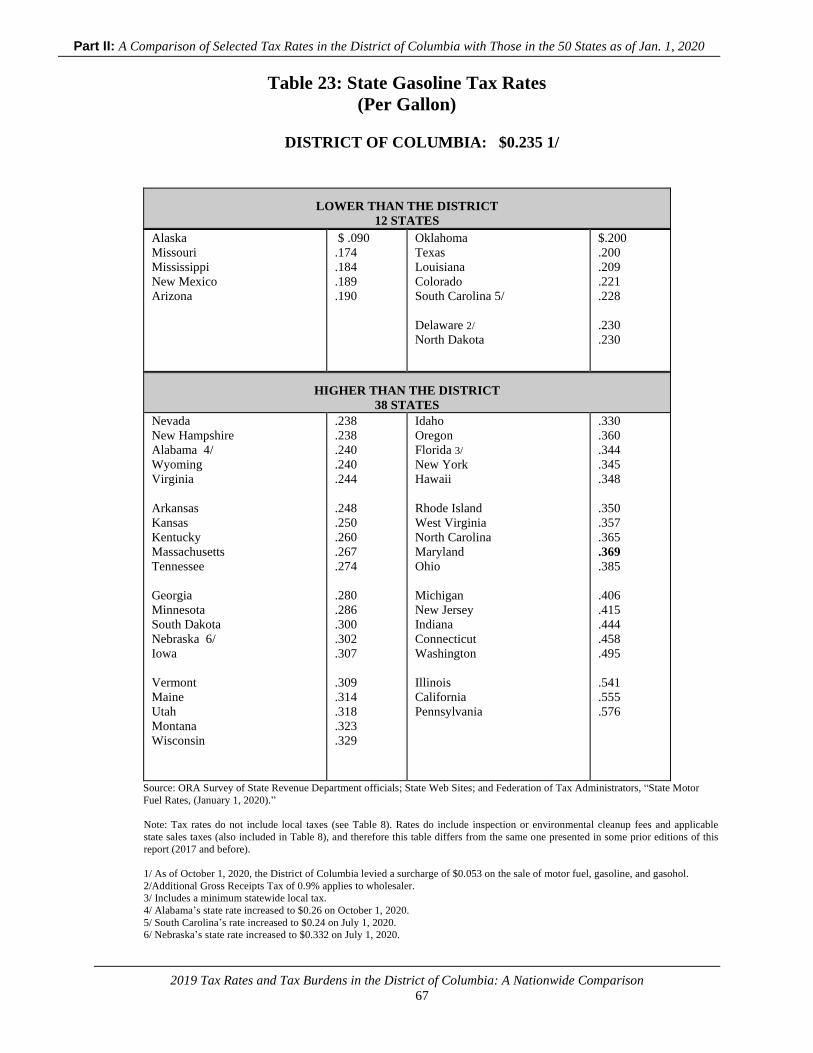
Part II: A Comparison of Selected Tax Rates in the District of Columbia with Those in the 50 States as of Jan. 1, 2020
2019 Tax Rates and Tax Burdens in the District of Columbia: A Nationwide Comparison
67
Table 23: State Gasoline Tax Rates
(Per Gallon)
DISTRICT OF COLUMBIA: $0.235 1/
LOWER THAN THE DISTRICT
12 STATES Alaska
Missouri
Mississippi
New Mexico
Arizona
$ .090
.174
.184
.189
.190
Oklahoma
Texas
Louisiana
Colorado
South Carolina 5/
Delaware 2/
North Dakota
$.200
.200
.209
.221
.228
.230
.230
HIGHER THAN THE DISTRICT
38 STATES Nevada
New Hampshire
Alabama 4/
Wyoming
Virginia
Arkansas
Kansas
Kentucky
Massachusetts
Tennessee
Georgia
Minnesota
South Dakota
Nebraska 6/
Iowa
Vermont
Maine
Utah
Montana
Wisconsin
.238
.238
.240
.240
.244
.248
.250
.260
.267
.274
.280
.286
.300
.302
.307
.309
.314
.318
.323
.329
Idaho
Oregon
Florida 3/
New York
Hawaii
Rhode Island
West Virginia
North Carolina
Maryland
Ohio
Michigan
New Jersey
Indiana
Connecticut
Washington
Illinois
California
Pennsylvania
.330
.360
.344
.345
.348
.350
.357
.365
.369
.385
.406
.415
.444
.458
.495
.541
.555
.576
Source: ORA Survey of State Revenue Department officials; State Web Sites; and Federation of Tax Administrators, “State Motor
Fuel Rates, (January 1, 2020).”
Note: Tax rates do not include local taxes (see Table 8). Rates do include inspection or environmental cleanup fees and applicable
state sales taxes (also included in Table 8), and therefore this table differs from the same one presented in some prior editions of this
report (2017 and before).
1/ As of October 1, 2020, the District of Columbia levied a surcharge of $0.053 on the sale of motor fuel, gasoline, and gasohol.
2/Additional Gross Receipts Tax of 0.9% applies to wholesaler.
3/ Includes a minimum statewide local tax.
4/ Alabama’s state rate increased to $0.26 on October 1, 2020.
5/ South Carolina’s rate increased to $0.24 on July 1, 2020.
6/ Nebraska’s state rate increased to $0.332 on July 1, 2020.
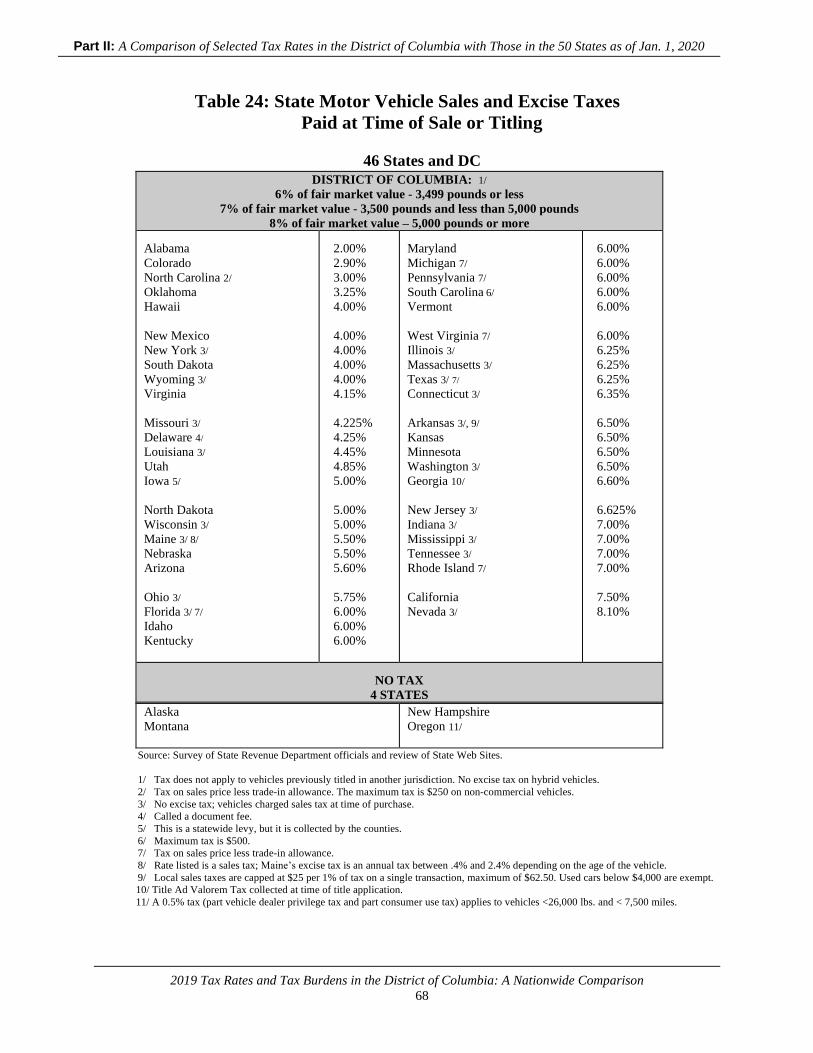
Part II: A Comparison of Selected Tax Rates in the District of Columbia with Those in the 50 States as of Jan. 1, 2020
2019 Tax Rates and Tax Burdens in the District of Columbia: A Nationwide Comparison
68
Table 24: State Motor Vehicle Sales and Excise Taxes
Paid at Time of Sale or Titling
46 States and DC DISTRICT OF COLUMBIA: 1/
6% of fair market value - 3,499 pounds or less
7% of fair market value - 3,500 pounds and less than 5,000 pounds
8% of fair market value – 5,000 pounds or more Alabama
Colorado
North Carolina 2/
Oklahoma
Hawaii
New Mexico
New York 3/
South Dakota
Wyoming 3/
Virginia
Missouri 3/
Delaware 4/
Louisiana 3/
Utah
Iowa 5/
North Dakota
Wisconsin 3/
Maine 3/ 8/
Nebraska
Arizona
Ohio 3/
Florida 3/ 7/
Idaho
Kentucky
2.00%
2.90%
3.00%
3.25%
4.00%
4.00%
4.00%
4.00%
4.00%
4.15%
4.225%
4.25%
4.45%
4.85%
5.00%
5.00%
5.00%
5.50%
5.50%
5.60%
5.75%
6.00%
6.00%
6.00%
Maryland
Michigan 7/
Pennsylvania 7/
South Carolina 6/
Vermont
West Virginia 7/
Illinois 3/
Massachusetts 3/
Texas 3/ 7/
Connecticut 3/
Arkansas 3/, 9/
Kansas
Minnesota
Washington 3/
Georgia 10/
New Jersey 3/
Indiana 3/
Mississippi 3/
Tennessee 3/
Rhode Island 7/
California
Nevada 3/
6.00%
6.00%
6.00%
6.00%
6.00%
6.00%
6.25%
6.25%
6.25%
6.35%
6.50%
6.50%
6.50%
6.50%
6.60%
6.625%
7.00%
7.00%
7.00%
7.00%
7.50%
8.10%
NO TAX
4 STATES Alaska
Montana
New Hampshire
Oregon 11/
Source: Survey of State Revenue Department officials and review of State Web Sites.
1/ Tax does not apply to vehicles previously titled in another jurisdiction. No excise tax on hybrid vehicles.
2/ Tax on sales price less trade-in allowance. The maximum tax is $250 on non-commercial vehicles.
3/ No excise tax; vehicles charged sales tax at time of purchase.
4/ Called a document fee.
5/ This is a statewide levy, but it is collected by the counties.
6/ Maximum tax is $500.
7/ Tax on sales price less trade-in allowance.
8/ Rate listed is a sales tax; Maine’s excise tax is an annual tax between .4% and 2.4% depending on the age of the vehicle.
9/ Local sales taxes are capped at $25 per 1% of tax on a single transaction, maximum of $62.50. Used cars below $4,000 are exempt.
10/ Title Ad Valorem Tax collected at time of title application.
11/ A 0.5% tax (part vehicle dealer privilege tax and part consumer use tax) applies to vehicles <26,000 lbs. and < 7,500 miles.
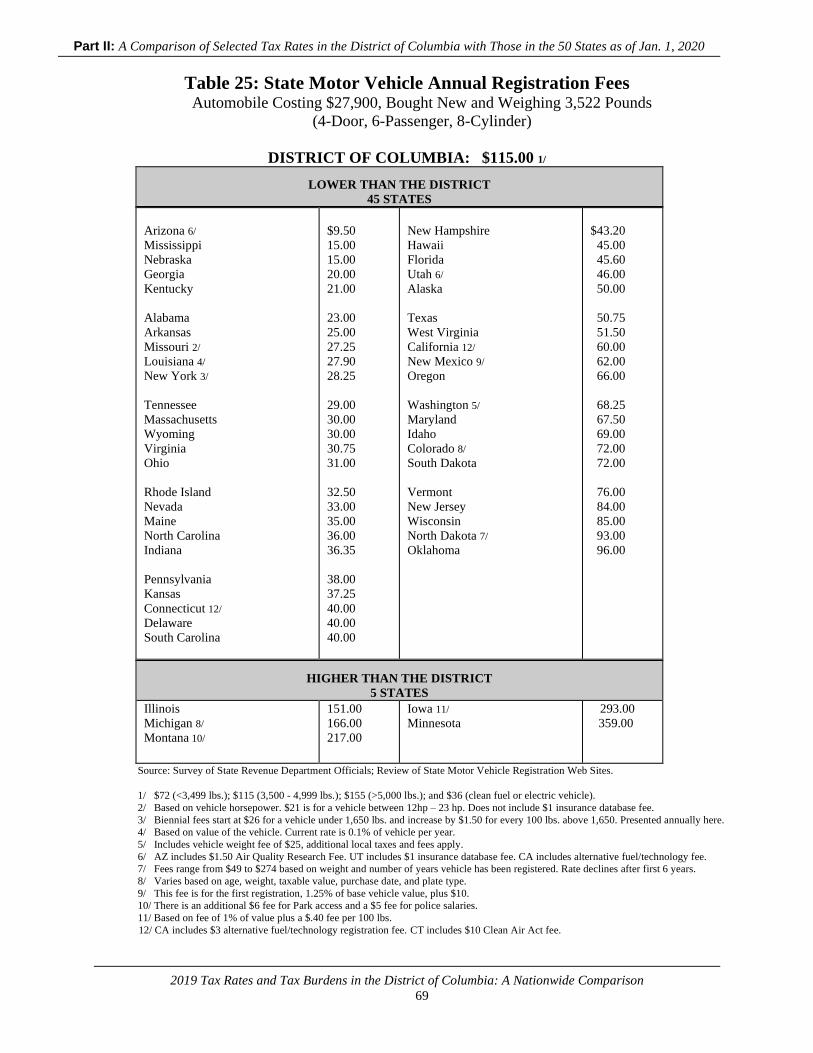
Part II: A Comparison of Selected Tax Rates in the District of Columbia with Those in the 50 States as of Jan. 1, 2020
2019 Tax Rates and Tax Burdens in the District of Columbia: A Nationwide Comparison
69
Table 25: State Motor Vehicle Annual Registration Fees Automobile Costing $27,900, Bought New and Weighing 3,522 Pounds
(4-Door, 6-Passenger, 8-Cylinder)
DISTRICT OF COLUMBIA: $115.00 1/
LOWER THAN THE DISTRICT
45 STATES
Arizona 6/
Mississippi
Nebraska
Georgia
Kentucky
Alabama
Arkansas
Missouri 2/
Louisiana 4/
New York 3/
Tennessee
Massachusetts
Wyoming
Virginia
Ohio
Rhode Island
Nevada
Maine
North Carolina
Indiana
Pennsylvania
Kansas
Connecticut 12/
Delaware
South Carolina
$9.50
15.00
15.00
20.00
21.00
23.00
25.00
27.25
27.90
28.25
29.00
30.00
30.00
30.75
31.00
32.50
33.00
35.00
36.00
36.35
38.00
37.25
40.00
40.00
40.00
New Hampshire
Hawaii
Florida
Utah 6/
Alaska
Texas
West Virginia
California 12/
New Mexico 9/
Oregon
Washington 5/
Maryland
Idaho
Colorado 8/
South Dakota
Vermont
New Jersey
Wisconsin
North Dakota 7/
Oklahoma
$43.20
45.00
45.60
46.00
50.00
50.75
51.50
60.00
62.00
66.00
68.25
67.50
69.00
72.00
72.00
76.00
84.00
85.00
93.00
96.00
HIGHER THAN THE DISTRICT
5 STATES Illinois
Michigan 8/
Montana 10/
151.00
166.00
217.00
Iowa 11/
Minnesota 293.00
359.00
Source: Survey of State Revenue Department Officials; Review of State Motor Vehicle Registration Web Sites.
1/ $72 (<3,499 lbs.); $115 (3,500 - 4,999 lbs.); $155 (>5,000 lbs.); and $36 (clean fuel or electric vehicle).
2/ Based on vehicle horsepower. $21 is for a vehicle between 12hp – 23 hp. Does not include $1 insurance database fee.
3/ Biennial fees start at $26 for a vehicle under 1,650 lbs. and increase by $1.50 for every 100 lbs. above 1,650. Presented annually here.
4/ Based on value of the vehicle. Current rate is 0.1% of vehicle per year.
5/ Includes vehicle weight fee of $25, additional local taxes and fees apply.
6/ AZ includes $1.50 Air Quality Research Fee. UT includes $1 insurance database fee. CA includes alternative fuel/technology fee.
7/ Fees range from $49 to $274 based on weight and number of years vehicle has been registered. Rate declines after first 6 years.
8/ Varies based on age, weight, taxable value, purchase date, and plate type.
9/ This fee is for the first registration, 1.25% of base vehicle value, plus $10.
10/ There is an additional $6 fee for Park access and a $5 fee for police salaries.
11/ Based on fee of 1% of value plus a $.40 fee per 100 lbs.
12/ CA includes $3 alternative fuel/technology registration fee. CT includes $10 Clean Air Act fee.
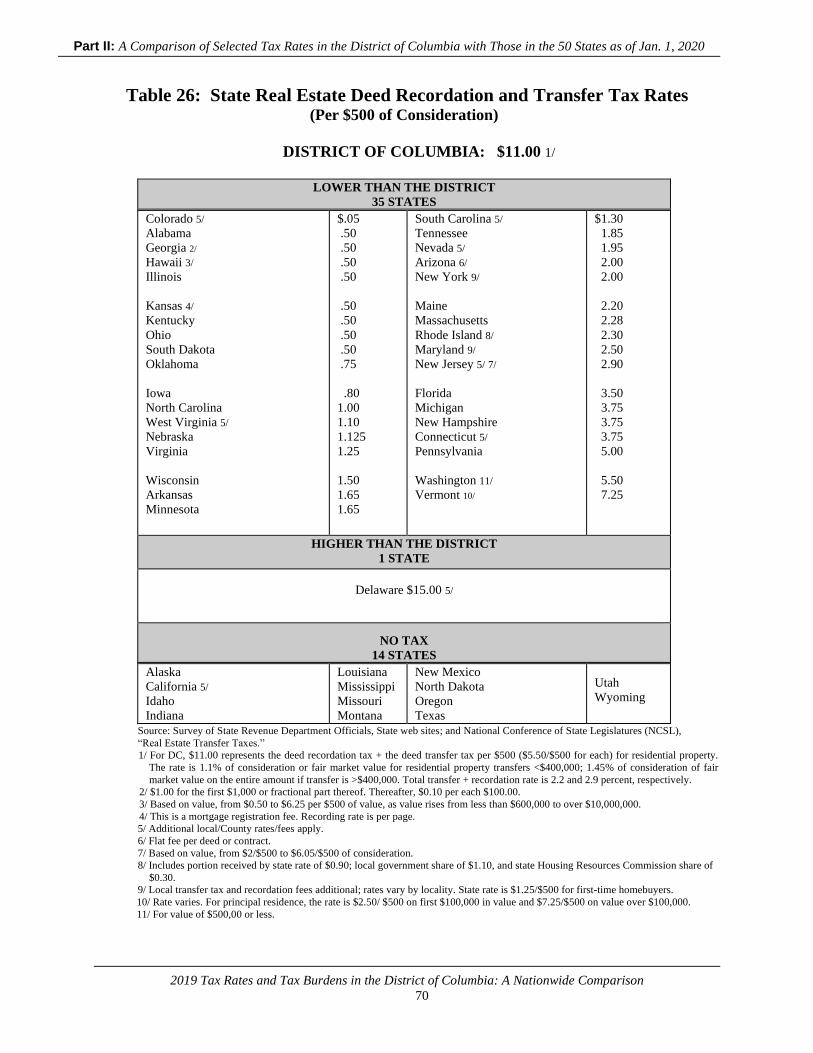
Part II: A Comparison of Selected Tax Rates in the District of Columbia with Those in the 50 States as of Jan. 1, 2020
2019 Tax Rates and Tax Burdens in the District of Columbia: A Nationwide Comparison
70
Table 26: State Real Estate Deed Recordation and Transfer Tax Rates (Per $500 of Consideration)
DISTRICT OF COLUMBIA: $11.00 1/
LOWER THAN THE DISTRICT
35 STATES Colorado 5/
Alabama
Georgia 2/
Hawaii 3/
Illinois
Kansas 4/
Kentucky
Ohio
South Dakota
Oklahoma
Iowa
North Carolina
West Virginia 5/
Nebraska
Virginia
Wisconsin
Arkansas
Minnesota
$.05
.50
.50
.50
.50
.50
.50
.50
.50
.75
.80
1.00
1.10
1.125
1.25
1.50
1.65
1.65
South Carolina 5/
Tennessee
Nevada 5/
Arizona 6/
New York 9/
Maine
Massachusetts
Rhode Island 8/
Maryland 9/
New Jersey 5/ 7/
Florida
Michigan
New Hampshire
Connecticut 5/
Pennsylvania
Washington 11/
Vermont 10/
$1.30
1.85
1.95
2.00
2.00
2.20
2.28
2.30
2.50
2.90
3.50
3.75
3.75
3.75
5.00
5.50
7.25
HIGHER THAN THE DISTRICT
1 STATE
Delaware $15.00 5/
NO TAX
14 STATES Alaska
California 5/
Idaho
Indiana
Louisiana
Mississippi
Missouri
Montana
New Mexico
North Dakota
Oregon
Texas
Utah
Wyoming
Source: Survey of State Revenue Department Officials, State web sites; and National Conference of State Legislatures (NCSL),
“Real Estate Transfer Taxes.”
1/ For DC, $11.00 represents the deed recordation tax + the deed transfer tax per $500 ($5.50/$500 for each) for residential property.
The rate is 1.1% of consideration or fair market value for residential property transfers <$400,000; 1.45% of consideration of fair
market value on the entire amount if transfer is >$400,000. Total transfer + recordation rate is 2.2 and 2.9 percent, respectively.
2/ $1.00 for the first $1,000 or fractional part thereof. Thereafter, $0.10 per each $100.00.
3/ Based on value, from $0.50 to $6.25 per $500 of value, as value rises from less than $600,000 to over $10,000,000.
4/ This is a mortgage registration fee. Recording rate is per page.
5/ Additional local/County rates/fees apply.
6/ Flat fee per deed or contract.
7/ Based on value, from $2/$500 to $6.05/$500 of consideration.
8/ Includes portion received by state rate of $0.90; local government share of $1.10, and state Housing Resources Commission share of
$0.30.
9/ Local transfer tax and recordation fees additional; rates vary by locality. State rate is $1.25/$500 for first-time homebuyers.
10/ Rate varies. For principal residence, the rate is $2.50/ $500 on first $100,000 in value and $7.25/$500 on value over $100,000.
11/ For value of $500,00 or less.

2019 Tax Rates and Tax Burdens in the District of Columbia: A Nationwide Comparison
71
Appendix
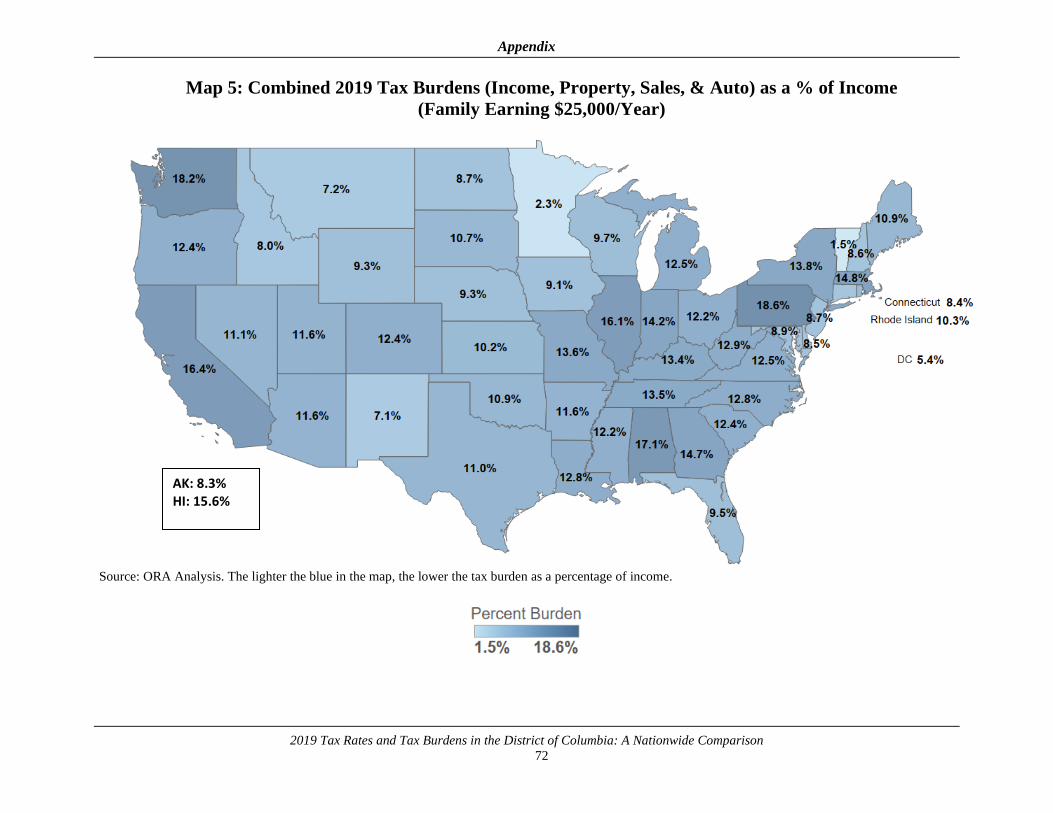
Appendix
2019 Tax Rates and Tax Burdens in the District of Columbia: A Nationwide Comparison
72
Map 5: Combined 2019 Tax Burdens (Income, Property, Sales, & Auto) as a % of Income
(Family Earning $25,000/Year)
Source: ORA Analysis. The lighter the blue in the map, the lower the tax burden as a percentage of income.
AK: 8.3% HI: 15.6%
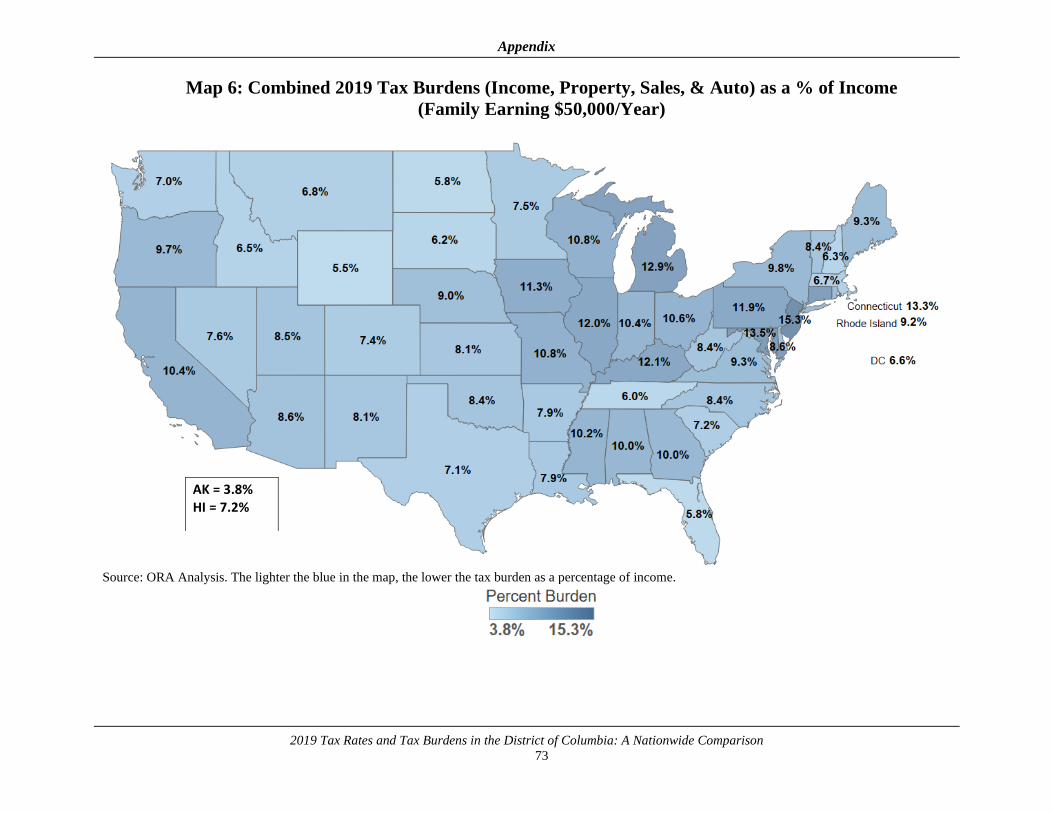
Appendix
2019 Tax Rates and Tax Burdens in the District of Columbia: A Nationwide Comparison
73
Map 6: Combined 2019 Tax Burdens (Income, Property, Sales, & Auto) as a % of Income
(Family Earning $50,000/Year)
Source: ORA Analysis. The lighter the blue in the map, the lower the tax burden as a percentage of income.
AK = 3.8%
HI = 7.2%
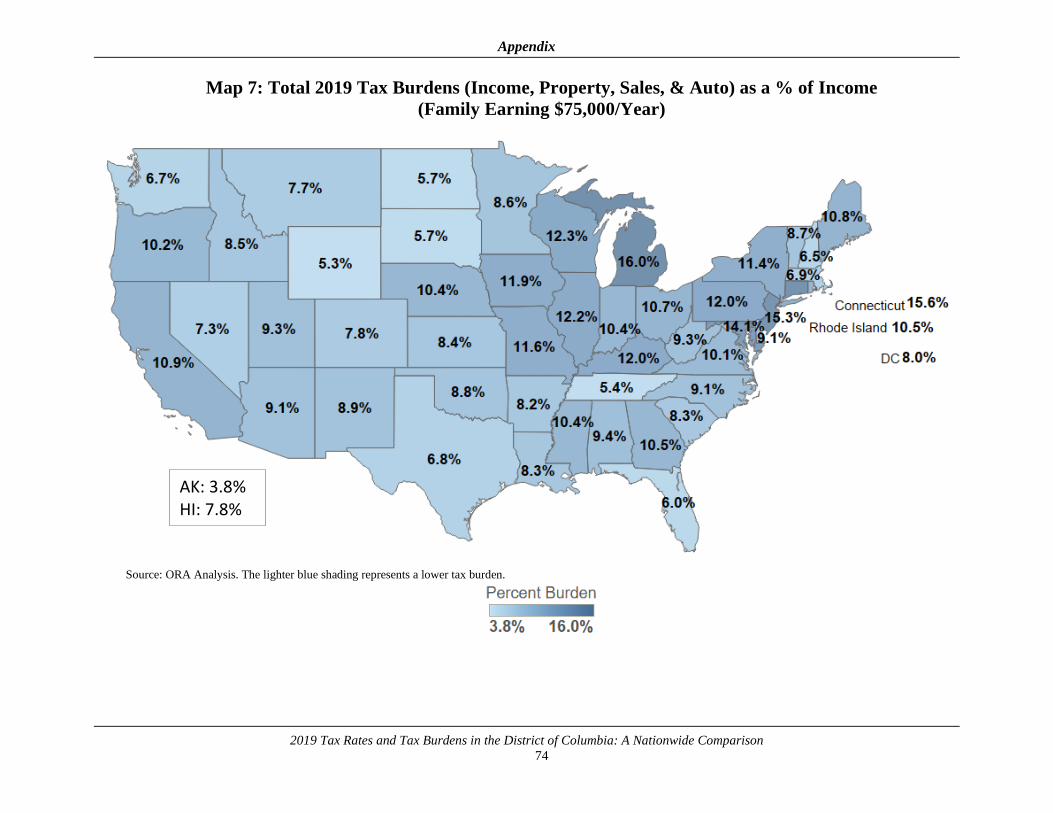
Appendix
2019 Tax Rates and Tax Burdens in the District of Columbia: A Nationwide Comparison
74
Map 7: Total 2019 Tax Burdens (Income, Property, Sales, & Auto) as a % of Income
(Family Earning $75,000/Year)
Source: ORA Analysis. The lighter blue shading represents a lower tax burden.
AK: 3.8% HI: 7.8%
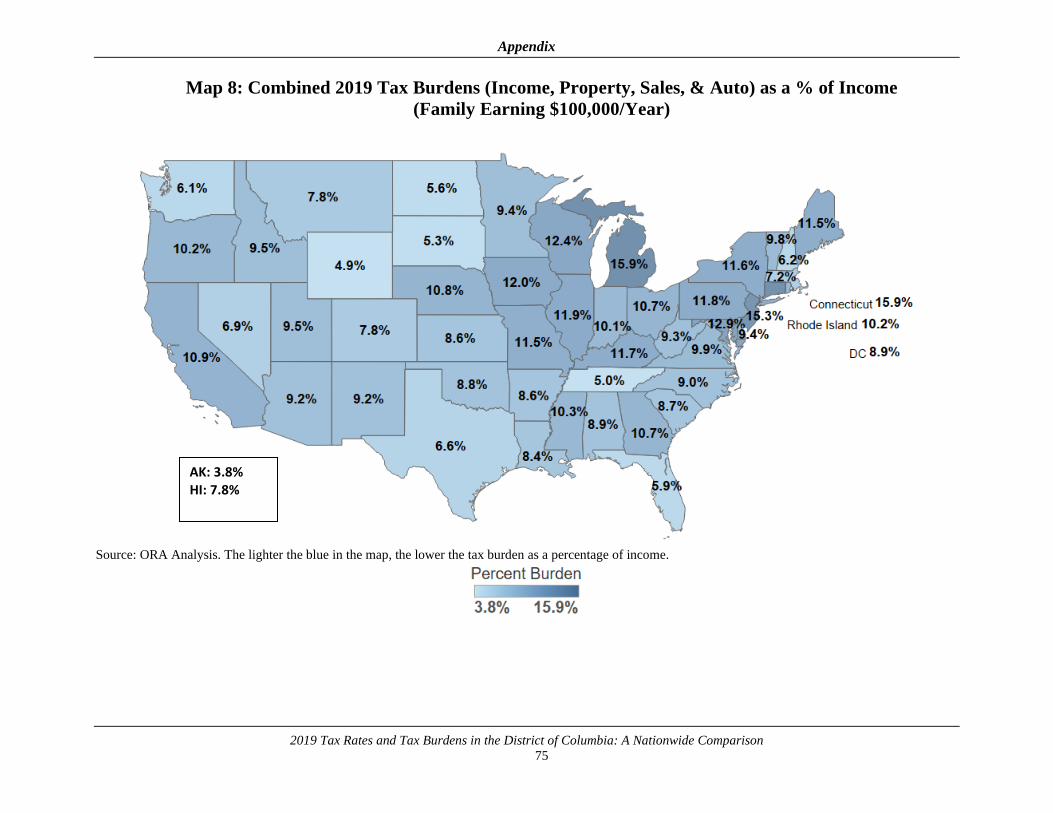
Appendix
2019 Tax Rates and Tax Burdens in the District of Columbia: A Nationwide Comparison
75
Map 8: Combined 2019 Tax Burdens (Income, Property, Sales, & Auto) as a % of Income
(Family Earning $100,000/Year)
Source: ORA Analysis. The lighter the blue in the map, the lower the tax burden as a percentage of income.
AK: 3.8% HI: 7.8%
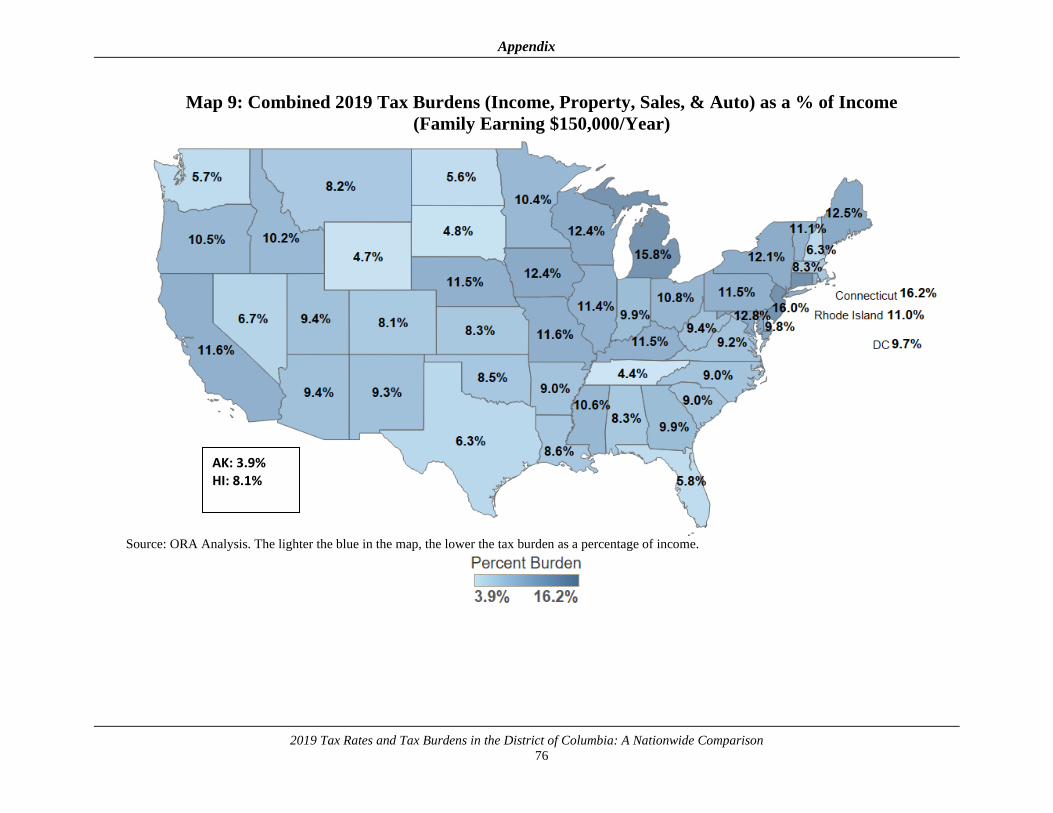
Appendix
2019 Tax Rates and Tax Burdens in the District of Columbia: A Nationwide Comparison
76
Map 9: Combined 2019 Tax Burdens (Income, Property, Sales, & Auto) as a % of Income
(Family Earning $150,000/Year)
Source: ORA Analysis. The lighter the blue in the map, the lower the tax burden as a percentage of income.
AK: 3.9% HI: 8.1%
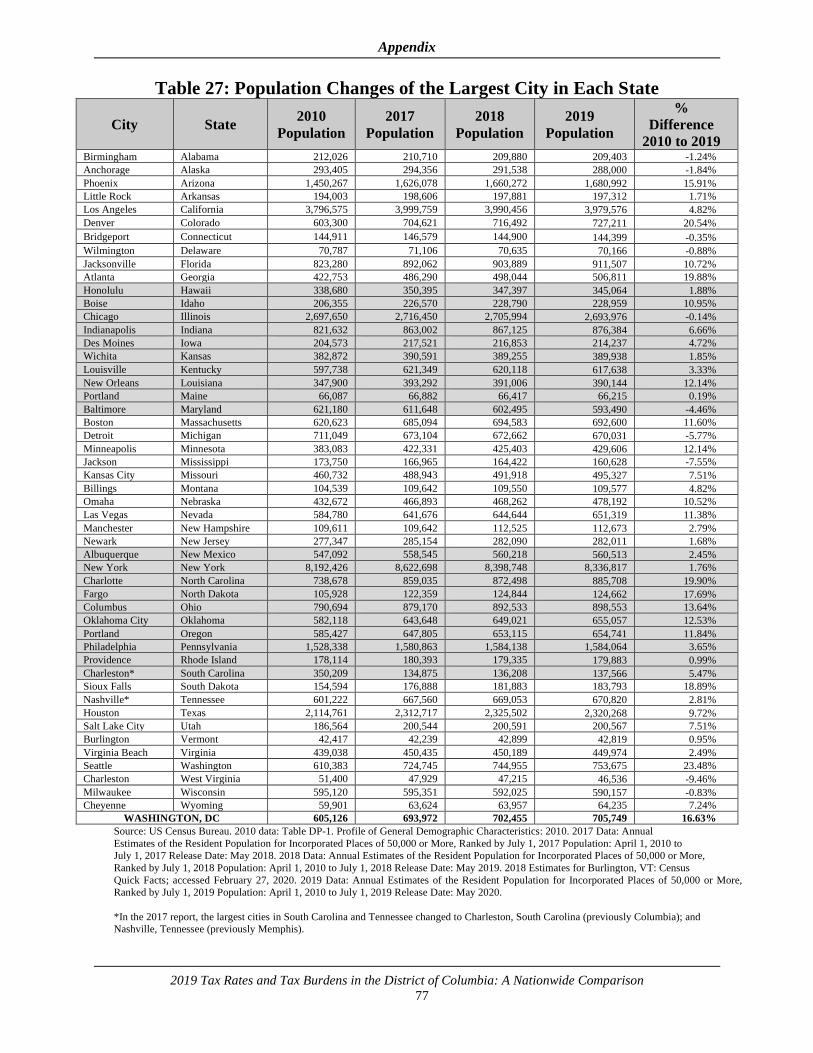
Appendix
2019 Tax Rates and Tax Burdens in the District of Columbia: A Nationwide Comparison
77
Table 27: Population Changes of the Largest City in Each State
City State 2010
Population
2017
Population
2018
Population
2019
Population
%
Difference
2010 to 2019 Birmingham Alabama 212,026 210,710 209,880 209,403 -1.24%
Anchorage Alaska 293,405 294,356 291,538 288,000 -1.84%
Phoenix Arizona 1,450,267 1,626,078 1,660,272 1,680,992 15.91%
Little Rock Arkansas 194,003 198,606 197,881 197,312 1.71%
Los Angeles California 3,796,575 3,999,759 3,990,456 3,979,576 4.82%
Denver Colorado 603,300 704,621 716,492 727,211 20.54%
Bridgeport Connecticut 144,911 146,579 144,900 144,399 -0.35%
Wilmington Delaware 70,787 71,106 70,635 70,166 -0.88%
Jacksonville Florida 823,280 892,062 903,889 911,507 10.72%
Atlanta Georgia 422,753 486,290 498,044 506,811 19.88%
Honolulu Hawaii 338,680 350,395 347,397 345,064 1.88%
Boise Idaho 206,355 226,570 228,790 228,959 10.95%
Chicago Illinois 2,697,650 2,716,450 2,705,994 2,693,976 -0.14%
Indianapolis Indiana 821,632 863,002 867,125 876,384 6.66%
Des Moines Iowa 204,573 217,521 216,853 214,237 4.72%
Wichita Kansas 382,872 390,591 389,255 389,938 1.85%
Louisville Kentucky 597,738 621,349 620,118 617,638 3.33%
New Orleans Louisiana 347,900 393,292 391,006 390,144 12.14%
Portland Maine 66,087 66,882 66,417 66,215 0.19%
Baltimore Maryland 621,180 611,648 602,495 593,490 -4.46%
Boston Massachusetts 620,623 685,094 694,583 692,600 11.60%
Detroit Michigan 711,049 673,104 672,662 670,031 -5.77%
Minneapolis Minnesota 383,083 422,331 425,403 429,606 12.14%
Jackson Mississippi 173,750 166,965 164,422 160,628 -7.55%
Kansas City Missouri 460,732 488,943 491,918 495,327 7.51%
Billings Montana 104,539 109,642 109,550 109,577 4.82%
Omaha Nebraska 432,672 466,893 468,262 478,192 10.52%
Las Vegas Nevada 584,780 641,676 644,644 651,319 11.38%
Manchester New Hampshire 109,611 109,642 112,525 112,673 2.79%
Newark New Jersey 277,347 285,154 282,090 282,011 1.68%
Albuquerque New Mexico 547,092 558,545 560,218 560,513 2.45%
New York New York 8,192,426 8,622,698 8,398,748 8,336,817 1.76%
Charlotte North Carolina 738,678 859,035 872,498 885,708 19.90%
Fargo North Dakota 105,928 122,359 124,844 124,662 17.69%
Columbus Ohio 790,694 879,170 892,533 898,553 13.64%
Oklahoma City Oklahoma 582,118 643,648 649,021 655,057 12.53%
Portland Oregon 585,427 647,805 653,115 654,741 11.84%
Philadelphia Pennsylvania 1,528,338 1,580,863 1,584,138 1,584,064 3.65%
Providence Rhode Island 178,114 180,393 179,335 179,883 0.99%
Charleston* South Carolina 350,209 134,875 136,208 137,566 5.47%
Sioux Falls South Dakota 154,594 176,888 181,883 183,793 18.89%
Nashville* Tennessee 601,222 667,560 669,053 670,820 2.81%
Houston Texas 2,114,761 2,312,717 2,325,502 2,320,268 9.72%
Salt Lake City Utah 186,564 200,544 200,591 200,567 7.51%
Burlington Vermont 42,417 42,239 42,899 42,819 0.95%
Virginia Beach Virginia 439,038 450,435 450,189 449,974 2.49%
Seattle Washington 610,383 724,745 744,955 753,675 23.48%
Charleston West Virginia 51,400 47,929 47,215 46,536 -9.46%
Milwaukee Wisconsin 595,120 595,351 592,025 590,157 -0.83%
Cheyenne Wyoming 59,901 63,624 63,957 64,235 7.24%
WASHINGTON, DC 605,126 693,972 702,455 705,749 16.63%
Source: US Census Bureau. 2010 data: Table DP-1. Profile of General Demographic Characteristics: 2010. 2017 Data: Annual
Estimates of the Resident Population for Incorporated Places of 50,000 or More, Ranked by July 1, 2017 Population: April 1, 2010 to
July 1, 2017 Release Date: May 2018. 2018 Data: Annual Estimates of the Resident Population for Incorporated Places of 50,000 or More,
Ranked by July 1, 2018 Population: April 1, 2010 to July 1, 2018 Release Date: May 2019. 2018 Estimates for Burlington, VT: Census Quick Facts; accessed February 27, 2020. 2019 Data: Annual Estimates of the Resident Population for Incorporated Places of 50,000 or More,
Ranked by July 1, 2019 Population: April 1, 2010 to July 1, 2019 Release Date: May 2020.
*In the 2017 report, the largest cities in South Carolina and Tennessee changed to Charleston, South Carolina (previously Columbia); and
Nashville, Tennessee (previously Memphis).
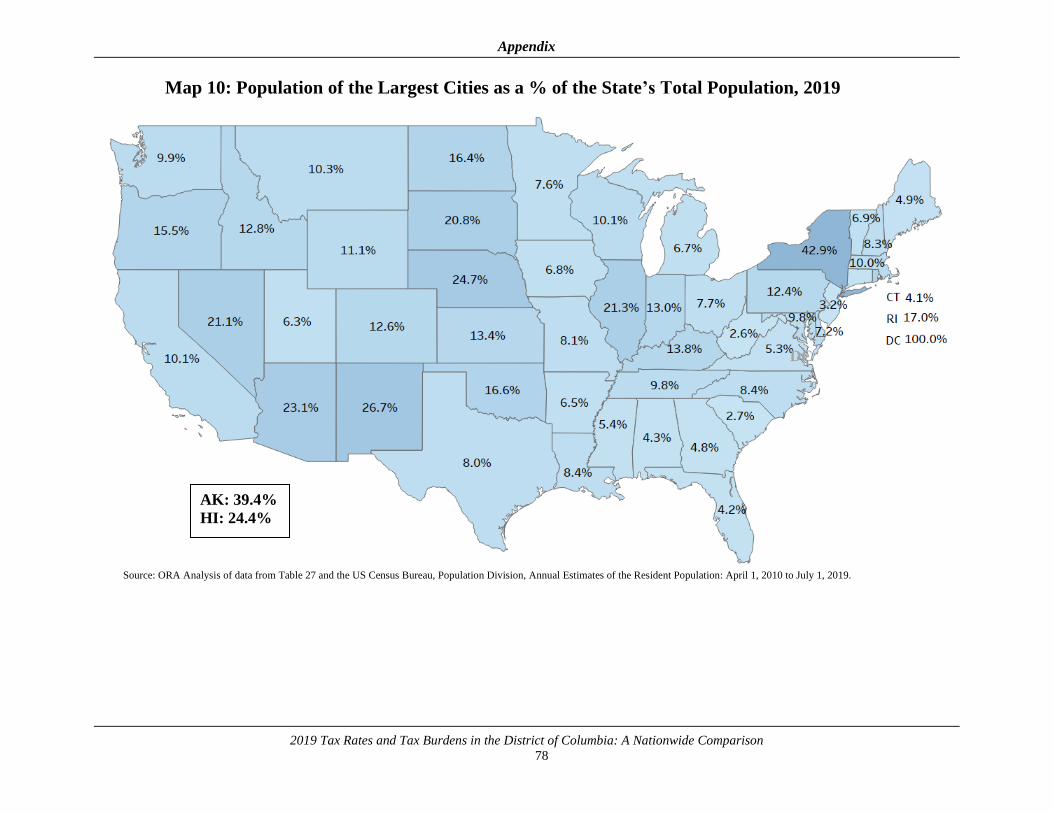
Appendix
2019 Tax Rates and Tax Burdens in the District of Columbia: A Nationwide Comparison
78
Map 10: Population of the Largest Cities as a % of the State’s Total Population, 2019
Source: ORA Analysis of data from Table 27 and the US Census Bureau, Population Division, Annual Estimates of the Resident Population: April 1, 2010 to July 1, 2019.
AK: 39.4%
HI: 24.4%
DC
2019 Tax Rates and Tax Burdens in the District of Columbia: A Nationwide Comparison
79
Office Locations and Telephone Numbers
Office of the Chief Financial Officer
The John A. Wilson Building
1350 Pennsylvania Avenue, NW, Suite 203
Washington, DC 20004
Office hours: Monday through Friday, 8:00 a.m. – 6:00 p.m.
(202) 727-2476
Office of the Chief Financial Officer
Fitzroy Lee, Chief Financial Officer (Interim)
Angell Jacobs, Chief of Staff and Deputy Chief Financial Officer
David Tseng, General Counsel
Alok Chadda, Chief Information Officer
Paul Lundquist, Executive Director for Management and Administration
David Umansky, Public Affairs Officer
Timothy Barry, Executive Director for Integrity & Oversight
Marshelle Richardson, Chief Risk Officer
Jeffrey Gander, Continuous Improvement Officer
Office of Revenue Analysis (ORA)
Norton Francis, Deputy Chief Financial Officer (Interim)
1101 4th Street, SW, Suite W770, Washington, DC 20024
(202) 727-7775
Office of Budget and Planning (OBP)
Eric Cannady, Deputy Chief Financial Officer
1350 Pennsylvania Avenue, NW, Suite 229, Washington, DC 20004
(202) 727-6234
Office of Finance and Treasury (OFT)
Carmen Pigler, Deputy Chief Financial Officer and Treasurer
1101 4th Street, SW, Suite W800, Washington, DC 20024
(202) 727-6055
Office of Financial Operations and Systems (OFOS)
Bill Slack, Deputy Chief Financial Officer
1100 4th Street, SW, Suite E800, Washington, DC 20024
(202) 442-8200
Office of Tax and Revenue (OTR)
Keith Richardson, Deputy Chief Financial Officer
1101 4th Street, SW, Suite W750, Washington, DC 20024
(202) 442-6200
DC Lottery Ridgely Bennett, Executive Director
Economic Development and Regulation Leroy Clay III, Associate Chief Financial Officer
EventsDC Henry Mosley, Associate Chief Financial Officer
Government Operations Angelique Hayes Rice, Associate Chief Financial Officer
Government Services George Dines, Associate Chief Financial Officer
Human Support Services Delicia Moore, Associate Chief Financial Officer
Not-for-Profit Hospital Corporation Lilian Chukwuma, Chief Financial Officer, United
Medical Center
Primary and Secondary Education Deloras Shepherd, Associate Chief Financial Officer
Public Safety and Justice David Garner, Associate Chief Financial Officer

Prepared By:
Government of the District of Columbia
Office of Revenue Analysis
1101 4th Street, SW
Suite W770
Washington, DC 20024
(202) 727-7775