Embed Size (px)
Citation preview

151
C H A P T E R 5
Tax Policy
Economists agree that taxes affect people’s incentives and behavior. For example, allowing tax deductions for educational expenses makes it
cheaper to go to college, which may encourage more people to go to college. Taxes can also discourage people from engaging in certain activities. Taxes on cigarettes, for example, make them more expensive to purchase, which may discourage people from buying them. Similarly, taxes on dividends (periodic distributions of a firm’s profits to stockholders) and capital gains (the growth in value of an asset, such as corporate stock) decrease the return people receive from investing their money, which might cause them to invest less. When a higher tax rate is imposed on an activity, people have less incentive to engage in that activity. To encourage people to work and invest more, the tax rates on labor and investment income should be reduced. Over the past 8 years, several policy changes have resulted in lower tax rates for both individuals and businesses.
Individual income tax rates for all income levels are lower now than they were in 2001. Also, specific incentives have been established to reduce the adverse tax consequences of certain desirable activities, from running a small business to buying an alternative-fuel vehicle. Lower tax rates have increased the benefit to these activities; in particular, lower tax rates on dividends and capital gains helped business investment expand, thereby increasing the amount of capital per worker which improves worker productivity. Tax relief has contributed to the solid economic growth and job creation that prevailed over most of the past several years.
However, important challenges remain. Foremost among these is the fact that most of these tax reductions are scheduled to expire at the end of 2010. Allowing them to expire would constitute one of the largest tax increases in history and could have serious consequences for the U.S. economy. Another challenge is to further reduce business tax burdens and thereby encourage busi-ness investment in the United States. The United States should continue to attract such investment in today’s global economy in order to develop better jobs for U.S. workers and to continue improving our standard of living.
Of course, individuals and businesses would prefer not to be taxed at all. Yet governments perform many functions desired by citizens—such as building roads and bridges, maintaining law and order, and providing for the national defense—and impose taxes to raise revenue for these activities. While this chapter focuses on the economic effects of taxes, it should be noted that this is only one side of the Government’s budget; a complete analysis of

152 | Economic Report of the President
fiscal policy should consider the economic effects of both the revenue and spending sides of the budget.
The key points of this chapter are:• Taxes alter individual and business incentives and have the potential
to distort their behavior. This Administration consistently fought to reduce tax burdens on individuals and businesses; tax rates are now much lower than they were just 8 years ago.
• Taxreductionsoverthepast8yearshaveimprovedincentivestowork,save, and invest.
• Globally, nations compete for businesses and the associated jobs; theUnited States may need to reduce tax rates on businesses to remain competitive in today’s world.
• Futuregoalsshouldincludepermanentlyextendingthetaxreliefofthepast 8 years and reforming the Alternative Minimum Tax (AMT).
Individual Income Tax ReformGovernments impose taxes to obtain the revenue needed to perform their
duties. The transfer of resources from individuals to the government does not directly impose a burden on the overall economy because the ability to purchase goods and services shifts from the individual to the government—there is no net loss for the economy as a whole. However, taxes can impose a considerable burden on the economy for other reasons. Most significantly, taxes interfere with the efficient allocation of resources by altering the rewards from working, saving, and investing.
Resources are allocated efficiently when individuals and firms allocate them to the activities for which they are best suited, thus achieving the highest possible output for the economy. Without taxes, individuals and firms can allocate resources in the most efficient manner possible. With taxes, people receive lower benefits from taxed activities and adjust their behavior accord-ingly. (In some cases, such as when people engage in an activity that produces negative consequences for others, imposing a tax can improve economic effi-ciency; for example, high taxes on cigarettes can reduce the damage caused by secondhand smoke.)
High tax rates on labor income can induce people to reduce the time they spend working. This is particularly true for people with flexible work weeks and in households with a second worker. High tax rates on dividends and capital gains discourage people from investing and reduce the funds avail-able in financial markets. In turn, this reduces business investment, which reduces the amount of capital available in the economy. Less capital means less machinery and equipment for each worker to use, making workers less

Chapter 5 | 153
productive and leading to reductions in wages. The net result of these tax-caused changes is an inefficient allocation of resources: output is lower than it would have been in the absence of taxes. Economic research indicates that the total economic burden imposed on the economy for each dollar of income tax revenue collected actually exceeds 1 dollar, but estimates of the exact burden vary widely.
A second problem arises when people engage in activities to avoid paying taxes. The possibilities here include both legal activities, such as using complicated tax shelters to prevent income from being taxed, and illegal activities, such as not filing a tax return. While the great majority of people pay the taxes they owe, the latest Internal Revenue Service (IRS) estimate suggests that the gap between the amount of tax people owed and the amount actually paid was approximately $290 billion in 2001, or 13.7 percent of all taxes owed. One consequence of people failing to pay their fair share of taxes is that a higher tax rate must be imposed on those who do comply with tax laws in order to collect the desired amount of revenue.
Lowering Tax Rates Stimulates Economic GrowthTaxing earned income reduces incentives to work because it reduces the
return from work. Similarly, taxing capital income (such as interest, divi-dends, and capital gains) reduces the return from saving and investing and therefore reduces the incentive to save and invest. The changes in incen-tives, along with any associated behavioral changes that result from changes in tax rates, are what economists mean when they assert that taxes “distort” the normal operation of labor and capital markets. When taxes are imposed on choices people make, distortions tend to occur and markets operate at less than peak efficiency. Because different types of taxes create different types and sizes of distortions, one goal of tax policy should be to choose tax rates that minimize the distortions and the accompanying inefficiencies whenever possible.
key determinants of the effect a tax system has on the economy are the average tax rate—the fraction of income paid in taxes—and the marginal tax rate—the amount of tax owed on an additional (that is, marginal) dollar of income. A high average tax rate tends to discourage people from engaging in an activity at all. For example, a high average tax rate on labor income can reduce the total after-tax return so much that it discourages people from working at all. In contrast, a high marginal tax rate on labor income reduces an individual’s after-tax return from increased work effort and from investing in additional education. The example in Box 5-1 examines this particular issue in more detail. Because education levels positively affect productivity, economic growth will generally be higher when people acquire more education.

154 | Economic Report of the President
By reducing both average and marginal tax rates on labor and capital income at almost every income level, the tax policies of the past 8 years reduced the distortionary effects of these taxes and thereby improved the efficiency of the labor and capital markets and of the U.S. economy as a whole.
Box 5-1: Encouraging Human Capital Investment
High marginal tax rates can discourage people from pursuing additional education and improving their skills to qualify for a higher-paying job. To see this, consider a high school teacher who is choosing between continuing to work for about $50,000 per year (the median salary for high school teachers in 2007), and getting additional educa-tion so he can become a school principal and earn $80,000 per year (the median salary for elementary and secondary education administrators in 2007). Although there may be other factors, suppose this worker’s main concern is his after-tax income.
Consider the impact of two different tax regimes: In the first regime, assume the high school teacher would owe $5,000 per year in income tax and the principal would owe $12,500 per year in income tax. The differ-ence, $7,500, is the additional tax he would owe if he were to acquire the skills needed to be a principal. Comparing this amount to the expected increase in income ($30,000), we see that the marginal tax rate imposed on the additional income is 25 percent ($7,500/$30,000). In the second regime, assume an alternate tax system in which the high school teacher owes $3,000 per year in tax and the principal owes $15,000 per year in tax. Under this new system, the tax impact of acquiring additional skills is $12,000. Comparing this to the expected increase in income (still $30,000) reveals that the marginal tax rate imposed on the additional income is 40 percent ($12,000/$30,000).
The larger marginal tax rate in the second regime means the worker experiences a smaller increase in after-tax income; thus, his incentive to acquire the skills necessary for the higher-paying job is smaller in this regime and may cause him not to pursue additional education.
As an aside, notice that if the worker chooses to stay a high school teacher, he pays more in income tax in the first regime ($5,000) than he would in the second ($3,000). Part of the reason the first regime has a lower marginal tax rate for additional education is that there is a higher average tax rate on lower-earning individuals than in the second regime.
Chapter 5 | 155
Increased Work IncentivesA labor income tax decreases the incentive workers have to supply labor to
the market by reducing their take-home pay. Workers may choose to work fewer hours, and some may even choose not to work at all. These behavioral changes reduce the efficiency of the labor market and of the economy as a whole. The tax relief of 2001 reduced tax rates on labor income and thereby reduced the distortions and efficiency losses created by taxing wages.
Economists have found that different people can be affected differently by taxes. Some people exhibit very little change in labor supply as tax rates vary, while others may enter or exit the workforce entirely. Consider a married couple in which one person works at a full-time job; call this person the primary breadwinner for the family and assume he makes $50,000 per year and works a fixed 40-hour week. The other person has the option of working at an hourly job and can earn up to $10,000 per year, depending on how many hours she works; call this person the secondary earner. When there is a change in tax rates, the breadwinner will probably continue to work the same amount of time because of the importance of his income to the family and his fixed work hours. However, the work decisions for the secondary earner are not as clear. Because married couples are taxed on their combined income, any income earned by the secondary earner will be taxed at the marginal tax rate facing the couple. Because an income tax lowers the reward for working outside the home, it makes other activities (such as leisure or raising a family) look relatively more attractive compared to work. An increase in the marginal tax rate facing the couple could reduce the return the secondary earner receives from working by enough to cause her to choose not to work at all. Alternatively, if a worker wants to earn a specific amount of income, higher tax rates could cause her to increase work time.
In practice, economists find the labor supply of married men to be relatively stable regardless of changes in tax rates. Research shows, however, the labor supply of married women to be quite sensitive to changes in tax rates, although this sensitivity has declined over the last few decades as labor force participation by women aged 25–54 increased from about 50 percent in 1970 to over 75 percent in 2008.
The tax relief of the past 8 years reduced marginal tax rates at almost every income level, reduced the distortions inherent in taxing earned income, and thereby increased the rewards from working and encouraged more people to work. In addition, tax relief that reduced marriage penalties improved the incentives for secondary earners to participate in the labor force.

156 | Economic Report of the President
Increased Saving and Investment IncentivesWhen individuals receive income, they can either spend it for current
consumption or save it to finance future consumption. Financial interme-diaries, such as banks and insurance companies, pool individual savings to finance capital investments. For example, a bank may combine the savings deposits of many individuals to make a loan to a small business owner. The business owner plans to make a profit so she can pay interest on her loan, which the bank uses to pay interest to the depositors. Similarly, when people purchase stock in a company, the company can use the funds to invest in new machinery and equipment. These new assets generate income for the company that gets returned to the investor in the form of dividends or capital gains. These investments increase the amount of machinery and equipment used by each worker, raising the productivity of workers; this helps to increase workers’ wages and, ultimately, increases the average standard of living for Americans.
An important tax policy issue is the double taxation of income earned from saving and investing. Taxing this income discourages individual saving and investment, which reduces the funds available to finance new businesses and for existing businesses to expand. Currently, corporations first pay tax on their profit, then the after-tax profit is either distributed to shareholders as dividends or reinvested in the company by retaining it and allowing shareholders to benefit via capital gains (that is, increased equity); either way, the shareholder then pays taxes on the income he or she earns. As a result, income from new capital investment by corporations, financed by individual equity investment, is taxed twice—once by a tax on the corporation’s profit, and again by a tax on the dividends and capital gains earned by the individual investor. This double taxation of corporate income generates an effective tax rate on equity investment that is greater than either the statutory corporate tax rate or the individual income tax rate. Ultimately, such taxes lower the capital-to-labor ratio, suppress wages, and harm long-run economic growth. Box 5-2 gives an example of how double taxation can slow economic growth.
The tax reductions of the past 8 years increased individual incentives to save and invest. In 2001, the top marginal income tax rate was reduced from 39.6 percent to 35 percent, thus reducing the tax on flow-through businesses (businesses whose profits are not taxed directly; instead, any profit they earn “flows through” the business to the owners, who then pay individual income tax on it). Before 2003, capital gains were taxed at a maximum of 20 percent, and dividends were taxed as ordinary income (at a maximum rate of 38.6 percent in 2002). As part of the Jobs and Growth Tax Relief Reconciliation Act of 2003 (JGTRRA), the maximum tax rate for long-term capital gains and dividends was reduced to 15 percent. (The next section elaborates on the significance of reducing tax rates on dividend income.)

Chapter 5 | 157
Dividend Tax ReliefA major Administration accomplishment was reducing the tax rate applied
to corporate dividends. JGTRRA reclassified dividends so they are taxed at the same rate as long-term capital gains, currently a maximum of 15 percent. As Chart 5-1 shows, the change appears to have been effective in expanding dividend payments: since 2003, real dividend income has grown at an average of 11.1 percent per year, while from 1983 until 2003, real dividend income grew at an average of only 5.8 percent per year. (The 2004 spike in the chart reflects a special one-time dividend paid by Microsoft Corporation.)
Box 5-2: Double Taxation Slows Economic Growth
From an individual perspective, the act of saving reduces consumption today so more can be consumed in the future. Similarly, when firms invest they reduce present production so they can be more productive and profitable in the future. Taxing capital income lowers the return to saving and investment, which encourages current consumption and discourages future consumption. For example, suppose a corporation is considering selling additional stock to finance the construction of a new plant. The corporation expects that the net return on this investment (the return after subtracting depreciation) will be 10 percent. Suppose further that individuals will purchase the shares if they receive a return of at least 6 percent. The investment is socially beneficial because it generates a higher return (10 percent) than the savers providing the funds require (6 percent).
When the new plant begins operating, the income it generates for the firm is subject to the corporate income tax; currently, the corporate income tax has a top marginal rate of 35 percent. Similarly, individuals investing in the firm owe tax on the income they receive from their investments; currently, the top marginal rate on dividends and long-term capital gains is 15 percent.
Now consider an individual who invests $1,000 in the company’s new stock. The new plant generates $100 of net income on this investment. The firm owes 35 percent in tax, leaving $65 of after-tax profit for the firm. Suppose the firm immediately returns all of this money to the investor as a dividend. The investor owes 15 percent in tax, leaving about $55 for her to use. That is, after applying the two taxes, the investor receives a return of only 5.5 percent on her initial investment. Because this is less than her required return of 6 percent she will choose not to invest in this company’s stock and the new plant would not be built. In summary, taxing both corporate income and individual capital income can produce an effective tax rate high enough to alter saving and investment decisions enough to cause socially beneficial projects to go unfunded.

158 | Economic Report of the President
Reducing tax rates on corporate dividend payments directly reduces the double taxation of corporate income. It also reduces the incentive corpora-tions have to use debt, rather than equity, to finance purchases of new capital. The fact that corporations can deduct interest payments from taxable income, but cannot deduct dividend payments, makes it cheaper for firms to borrow (rather than issue stock) to finance additional spending. Excessive borrowing increases the chances of insolvency because the higher a firm’s debt payments, the greater the chance the firm’s income will be insufficient to cover these payments. Insofar as insolvency triggers bankruptcy, this subjects equity holders and employees to additional costs and uncertainty.
Changing the tax treatment of dividends also reduced the tax bias against paying dividends compared to retaining earnings. Paying dividends returns funds to stockholders, who can decide for themselves how to use them, rather than having to leave the funds invested in a particular company. Also, paying dividends is a way firms can provide tangible evidence of their profitability. Clear signals about how profitable different firms are help investors identify the most efficient allocation of their resources. When the tax code penalizes dividends relative to capital gains and penalizes equity financing relative to debt financing, corporate financing decisions will be inefficient.

Chapter 5 | 159
The Macroeconomic Benefits of Lower Tax RatesOver the past 8 years, tax relief has reduced distortions to labor supply,
saving, investment, and corporate governance. Making the tax relief perma-nent can substantially improve economic efficiency and increase economic activity. The Treasury Department estimates, for example, that if the tax relief of 2001 and 2003 were made permanent and were paid for by reduc-tions in future government spending, economic output would increase by 0.7 percent in the long run. The benefits would be smaller or even negative, however, if the extension of the tax relief results in additional government borrowing or future tax increases rather than spending reductions. The Treasury Department estimates, for example, that if the tax relief were made permanent but the lost revenues were made up with other tax increases, economic output would decline by 0.9 percent over the long run. The concern about long-term financing for the tax relief is particularly important because of the likelihood of rising spending pressures in the future, as discussed in Chapter 6.
A Record of Tax ReformOne of the Administration’s major tax policy objectives has been to
change tax laws so they better encourage activities that are beneficial to the economy as a whole, such as work effort, saving and investing, education, and the creation of new jobs. With regard to individual income taxes, the Administration took steps each year to reduce the burden imposed on the American taxpayer. Here are some of the highlights of the actions taken:
• TheEconomicGrowthandTaxReliefReconciliationActof2001wasthe most significant tax reduction since 1981. It created a new low 10 percent tax bracket and phased in reductions of the other existing marginal tax rates. It reduced marriage penalties by increasing the standard deduction and the lowest tax bracket threshold for married taxpayers, increased the child tax credit, and made many other tax pref-erences more generous. It also began phasing out the estate tax.
• TheJobsandGrowthTaxReliefReconciliationActof2003acceleratedthe phasing-in of many of the tax reductions enacted in 2001. It also reduced capital gains tax rates and applied the capital gains tax rates to dividends.
• The Working Families Tax Relief Act of 2004 and American JobsCreation Act of 2004 further accelerated the tax reductions previously enacted, including increasing the child tax credit to $1,000. These laws further reduced marriage penalties by making the standard deduction for joint returns twice the single standard deduction, and expanding the

160 | Economic Report of the President
10 and 15 percent tax brackets for joint returns to twice the size of the corresponding brackets for single returns.
•The Pension Protection Act of 2006 made permanent a number ofpension-related provisions of previous tax bills, such as higher dollar amounts for IRA contributions, higher dollar limits on defined contri-bution plans, and catch-up contributions for older workers.
• TheTax IncreasePreventionAct (TIPA)of2007and theEmergencyEconomic Stabilization Act of 2008 each extended AMT relief. TIPA also increased the number of personal credits that could be used to reduce AMT liability.
Each of the above measures was intended to promote long-term growth and improve economic efficiency. Another significant measure was the Economic Stimulus Act of 2008, which returned approximately $100 billion to consumers via tax rebates—up to $600 per taxpayer ($1,200 for couples filing jointly) and $300 for each dependent. Rebates were phased out for taxpayers with over $75,000 in income (over $150,000 for couples filing jointly). On the business tax side, the Economic Stimulus Act increased the dollar value of new equipment that could be deducted in 2008 and provided an expanded depreciation allowance of 50 percent on certain business prop-erty put into service in 2008. The primary purpose of these actions was to provide short-term, counter-cyclical stimulus to the economy by encour-aging short-run growth in consumer spending and business investment. Tax rebates were chosen as the best way to provide this short-term stimulus because of the speed with which they put money into the hands of people most likely to spend it. Similarly, the business tax incentives were designed to encourage firms to accelerate purchases of capital equipment, making such purchases in 2008 rather than waiting until 2009 or later. Compared to the paths consumption and investment would have otherwise followed, the rebates appear to have boosted real personal consumption expenditures in the second quarter of 2008 and the accelerated depreciation was expected to boost business investment throughout 2008.
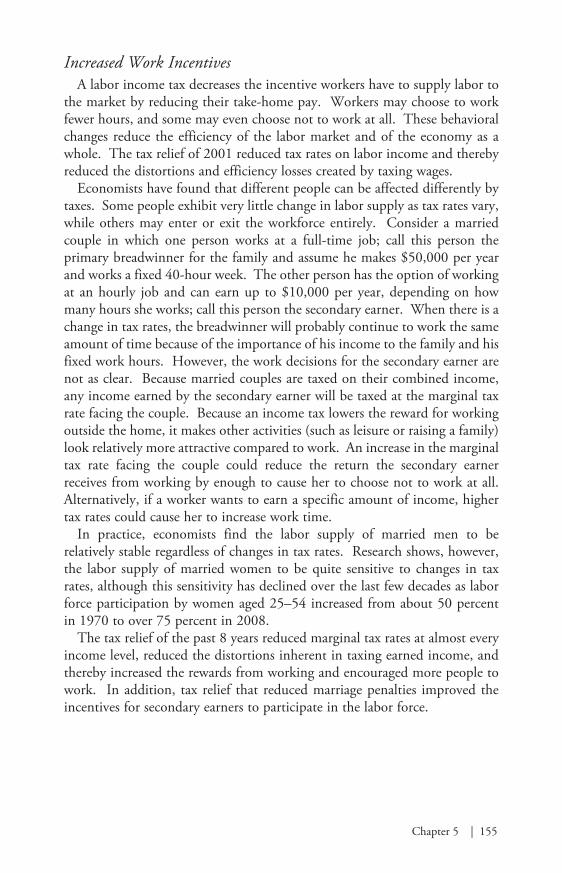
In total, the tax relief enjoyed by taxpayers from 2001 to 2008 saved Americans nearly $1.7 trillion in taxes. Chart 5-2 illustrates how those bene-fits were distributed over these years. The value for 2008 includes over $100 billion from the Economic Stimulus Act of 2008. Aside from stimulus, the amount of tax relief granted to individuals declines after 2008 because of the expiration of temporary changes to the AMT (discussed in detail later in this chapter) and declines significantly in 2011 because most of the tax reductions are scheduled to expire at the end of 2010.
Chapter 5 | 161
Lower Tax BurdensAs a result of the tax relief of the past 8 years, the average Federal individual
income tax rate declined to 20.4 percent in 2008. Without tax relief, the average Federal tax rate would have been 24.2 percent. The top half of Table 5-1 shows the rates taxpayers at different income levels face in 2008 as a result of the tax relief of the past 8 years and the tax rates they would have faced if it were not for this tax relief. Notice that taxpayers at all income levels expe-rienced a reduction in their average Federal tax rate for 2008. For example, among people in the lowest income quintile, the average Federal income tax rate would have been 5.2 percent without tax relief, but with tax relief it was only 1.1 percent; while for people in the highest income quintile, the average Federal income tax rate would have been 29 percent without tax relief, and with tax relief it was only 25.4 percent.
The distribution of the burden of Federal individual income taxes is shown in the bottom half of Table 5-1. Without tax relief, the lowest quintile would have borne 0.8 percent of the Federal tax burden in 2008. With tax relief, the lowest quintile bore only 0.2 percent of all Federal taxes. The highest income quintile was the only group to see its share of Federal taxes increase in 2008, from 66.3 percent of Federal taxes before tax relief to 68.9 percent after tax relief.

162 | Economic Report of the President
Pro-Growth Business Tax ReformThroughout the past 8 years, the Administration has worked consistently
to lower the burden of taxes on businesses, with the objectives of encour-aging greater investment, job creation, and long-term economic growth. To accomplish these goals, the Administration has pursued two primary strate-gies: first, addressing enduring aspects of the tax system that diminish returns on investment for both individuals and businesses; and second, providing new tax incentives for businesses to stimulate greater investment.
Reducing the Double Taxation of Corporate IncomeAs indicated earlier, one aspect of the current tax system that diminishes
returns on investment is the practice of double taxation of corporate income, which reduces the return to saving and investing. The Administration’s 2003 tax relief reduced the magnitude of double taxation by reducing the tax rate on both dividends and capital gains. In addition, there have been amend-ments to the legal structure of corporations that have helped reduce corporate tax burdens.
To understand these changes, it is first helpful to understand the basic framework of corporate taxation. The tax treatment of business income varies depending on the organizational structure of the firm. There are two basic classifications of corporations for purposes of taxation and regulation: (1) C corporations, the traditional large, stock-issuing corporations; and (2) flow-through businesses, which include S corporations, partnerships, and sole proprietorships. For tax purposes, the main difference between these two groups is that flow-through businesses are exempt from the corporate profits tax that is imposed on C corporations. In flow-through businesses, profits are distributed to owners and shareholders (flowing “through” the company
Table 5-1.—Estimated 2008 Effects of Individual Income Tax Relief from the Past 8 Years
Average Federal Tax Rates (percent)
Lowest Quintile
Second Quintile
Third Quintile
Fourth Quintile
Top Quintile All
With Tax Cuts ...................................... 1.1 8.3 15.0 18.1 25.4 20.4Without Tax Cuts ................................. 5.2 13.0 18.9 21.9 29.0 24.2
Share of Federal Taxes (percent)
Lowest Quintile
Second Quintile
Third Quintile
Fourth Quintile
Top Quintile All
With Tax Cuts ...................................... 0.2 3.3 10.2 17.3 68.9 100.0Without Tax Cuts ................................. 0.8 4.4 10.8 17.6 66.3 100.0
Source: Urban Institute and Brookings Institution Tax Policy Center.

Chapter 5 | 163
directly to their owners), who then pay income taxes on their gains. (There are restrictions on both size and financial activities that prevent most firms from qualifying to be S corporations.) This arrangement allows flow-through busi-ness owners to avoid the double taxation of corporate profits and to face lower effective tax rates than do shareholders of C corporations. One goal of tax relief has been to “level the playing field” by reducing the difference between the tax rates applied to income generated by S corporations and C corporations.
Two types of changes helped to reduce the burden of corporate taxes. First, regulatory changes in 2004 and 2007 relaxed some of the restrictions that limit which firms can be S corporations. In addition to increasing the maximum allowable number of shareholders, new rules were enacted to make it easier for a firm to elect to become, and to remain, an S corpora-tion. Second, each year from 2002 to 2005, and again in 2008, allowances for depreciation deductions were extended or expanded. As described below, these changes allow firms to take a greater deduction from income when new capital equipment is purchased, which effectively decreases the tax burden on income generated by that equipment.
Accelerating Depreciation AllowancesA consistent goal of the Administration has been to provide tax incentives
for businesses to invest in new facilities and equipment. One way this goal was promoted was by accelerating business depreciation allowances. When physical assets (such as machinery and equipment that can be used over and over when producing goods and services) are used by businesses, their value declines (depreciates) over time due to the wear and tear they experi-ence. With this in mind, businesses are allowed to deduct from their taxable income the dollar amount of the depreciation of their assets. The more quickly a firm is able to deduct, through depreciation, the cost of new invest-ment, the more attractive new investment becomes. Because different types of assets have different useful lives and therefore depreciate at different rates, the IRS established the Modified Accelerated Cost Recovery System, which specifies the rates at which different types of assets can be depreciated.
Accelerating depreciation rates improves investment incentives for firms. As part of a temporary stimulus program, the Administration succeeded in expanding businesses’ first-year depreciation allowance on qualified property by an additional 30 percent of its adjusted basis in 2002, to encourage greater business investment in new machinery and equipment in that year. In 2003, to provide additional short-term stimulus, the first-year depreciation allow-ance was expanded further, to 50 percent of the adjusted basis for qualified property. This expanded depreciation allowance expired in 2004, but was reintroduced—at 50 percent of the adjusted basis—as part of the Economic Stimulus Act of 2008.

164 | Economic Report of the President
Increasing Small Business ExpensingIn addition to accelerating business depreciation rates, the Administration
has supported pro-growth business tax policies by increasing the amount of “expensing” small businesses can do for their use of depreciable property. Distinct from the traditional concept of “business expensing,” which refers to a business’s ability to deduct expenses incurred that are not associated with acquiring or improving assets, Section 179 of the U.S. Internal Revenue Code allows individuals and small businesses to deduct the cost of property used to generate income, rather than having to capitalize the benefits through the depreciation schedule discussed above. The Administration expanded the capability of businesses to expense the cost of property under Section 179; in 2003, the maximum dollar amount that could be expensed under Section 179 was increased to $100,000. In 2007 the limit was again increased, to $125,000, and indexed for inflation for 2008 through 2010. Then, as part of the Economic Stimulus Act of 2008, the limit was increased to $250,000 for 2008.
Tax Credits for Research and DevelopmentFinally, a number of tax credits have been extended to businesses to
encourage the types of research and development investment that have bene-fits for the public. Economists use the term “public goods” to describe things that could easily be used by more and more people with little or no additional production cost. From a social perspective, private companies generally make insufficient investments in public goods, such as scientific research to develop new technologies for health care or to expand utilization of renewable energy resources. This “underinvestment” occurs because companies pursue invest-ment projects based on the potential value to themselves and generally do not consider the full benefit to society that could result from the investment.
For example, suppose a company was considering investing in research to develop a vaccine against diabetes. Once developed, the company would sell the drug at a price set high enough to recover its research costs and to generate some profit. Ultimately, the company would evaluate the merits of the investment based on the profit it expected to receive from selling the vaccine relative to the profit it could earn on other possible investments. Unfortunately, the price the firm would need to charge could exceed what some people who would benefit from the drug can afford to pay. As a result, some people who could benefit from the vaccine will not get it, and the company will underestimate the full value of this research investment. That is, the research will have a public value that is greater than its private value to the company. Put another way, for goods with large social benefits, private markets tend to offer smaller returns than are needed to result in efficient levels of investment.

Chapter 5 | 165
Tax credits can be used to “fill the gap,” by providing the company with an additional incentive that will encourage it to undertake this publicly beneficial investment. In the area of alternative energy, the Administration successfully extended existing research and development tax credits and expanded upon them in 2005 and 2006, providing an additional 20 percent credit for qualified energy research and increasing the percentage of research and development expenses that qualify for the credit. In 2005 and 2006, private industry research and development grew notably. Annual research and development spending by private industry grew by only 2.9 percent per year over the 20 years from 1985 through 2004. Subsequently, private industry research and development grew at an average rate of 5.1 percent per year in 2005 and 2006.
International CompetitivenessToday’s global economy enjoys more economic interconnectedness than
ever before. Efficiency improvements in information, communication, and transportation technologies have increased the ability of international firms to compete with U.S. firms in domestic and international markets. Associated improvements in the international mobility of capital mean that modern companies have a high degree of international flexibility regarding the loca-tion of new facilities. Thus, companies that want to open new facilities can compare investment opportunities across the globe to find locations with the highest after-tax return. As a result, a country’s corporate tax policy, including its statutory tax rates, can have a significant impact on both job creation and the competitiveness of businesses within that country. There is ample evidence that companies include tax considerations when determining where to locate new facilities, a fact that has led to a sense of competition between countries as they try to attract companies by reducing their respective corporate tax rates.
To illustrate the trend toward lower corporate tax rates, Chart 5-3 shows the statutory corporate tax rate for the United States and the average (weighted by gross domestic product (GDP)) statutory corporate tax rate for non-U.S. members of the Organization for Economic Co-operation and Development (OECD) since 1981. (State and local rates are combined with the Federal statutory rates where appropriate.) During the early 1980s, the United States had a statutory corporate tax rate of nearly 50 percent, which was higher than the OECD average. Significant tax reform in 1986 reduced the United States’s combined (Federal and State) rate to about 39 percent, a level it has roughly maintained since then. While this change reduced the U.S. tax rate to well below that of most other OECD countries in the late

166 | Economic Report of the President
1980s, other countries soon began reducing their corporate tax rates as well. By 2008, the non-U.S. OECD average corporate tax rate had fallen to about 30 percent, and the non-U.S. median corporate tax rate stood at 27.5 percent. Table 5-2 gives statutory tax rates for most OECD countries; the United States currently has the second highest statutory corporate tax rate of any industrialized country, less than 1 percentage point below Japan’s.
That said, the United States offers companies a more generous depreciation allowance than do most other countries—only Italy and Greece offer greater allowances (see Table 5-2). When considered together, the high statutory tax rate in the United States is somewhat mitigated by its generous depreciation allowance. However, as shown in the last column of Table 5-2, the United States still has the fourth highest effective marginal tax rate on equity-financed projects, which can dampen the competitiveness of U.S. businesses and can dissuade firms from locating new facilities—and the associated jobs—here in the United States.
Future ChallengesThe tax policy changes of the past 8 years have considerably reduced the
burden on taxpayers and improved the efficiency of U.S. income tax laws. However, there is more work to be done. In addition to making these changes a permanent part of the tax code, the AMT needs to be reformed or even eliminated, and the tax code should be greatly simplified because complying with its incredible complexity consumes resources that could be put to better use elsewhere.
Making Tax Relief Permanent Failing to extend the tax relief enacted over the past 8 years would amount
to one of the largest tax increases in history. Individuals at all income levels, from low-income Earned Income Tax Credit recipients to high-income taxpayers, would be negatively affected. The total increase would average nearly 1.9 percent of GDP per year over the next 10 years and would increase the tax burden on the economy to well above the average over the past 40 years of 18.3 percent of GDP.
Taxing business income reduces the incentive people have to invest in businesses. Tax relief has encouraged greater business investment over the last several years. Going back to the high tax rates of the 1990s could reduce busi-ness investment, which could in turn reduce workers’ wages and economic growth. In an international context, higher corporate tax rates would make locating new businesses in the United States less attractive, and would further depress jobs and growth.

Chapter 5 | 167
Table 5-2.—Statutory Corporate Income Tax Rates, Depreciation Allowances, and Effective Marginal Tax Rates for Selected OECD Countries, 2005
Country
Statutory Corporate Income
Tax Rate (percent)
Discounted Value of Depreciation Allowance—
Equipment (equity)
Effective Marginal Tax Rate
Equipment (equity; percent)
Japan....................................................................... 40 73 28United States .......................................................... 39 79 24Germany .................................................................. 38 71 29Italy.......................................................................... 37 82 19Canada .................................................................... 36 73 25Spain ....................................................................... 35 78 21Belgium ................................................................... 34 75 22France ...................................................................... 34 77 20Switzerland ............................................................. 34 78 20Greece ..................................................................... 32 87 12Netherlands............................................................. 32 73 21Australia .................................................................. 30 66 24United Kingdom ...................................................... 30 73 20Norway .................................................................... 28 67 22Portugal ................................................................... 28 79 15Sweden ................................................................... 28 78 16Finland ..................................................................... 26 73 17Austria ..................................................................... 25 66 20Ireland ..................................................................... 13 66 10
Average (unweighted) ............................................. 31 75 20
G-7 Average (unweighted) ...................................... 36 76 24
Source: Institute for Fiscal Studies, Corporate Tax Database.

168 | Economic Report of the President
These lower tax rates have had many positive consequences for the economy. Lower taxes for individuals increased people’s disposable income, allowing them to save more and spend more. Lower taxes for businesses increased business incentives to invest in new capital assets, which will improve worker productivity and wages and increase their international competitiveness. Letting tax relief expire will remove many of the gains made in each of these areas.
Fixing the Alternative Minimum TaxThe first minimum tax was enacted in 1969 in response to a Treasury
Department report that a number of high-income taxpayers had no Federal income tax liability in 1966. The Alternative Minimum Tax, which is a parallel tax system with its own set of exemptions, deductions, and tax rates, was intended to ensure that high-income taxpayers pay their fair share of taxes. A major difference between the regular income tax laws and the AMT is that several significant deductions allowed under the regular income tax—such as personal exemptions, State and local income taxes, and business expenses—are not allowed under the AMT.
Technically, all taxpayers are required to compute their tax liability under both the regular income tax laws and the AMT and then pay the larger tax amount. Having to compute one’s tax liability twice increases both compli-ance costs and the complexity of the tax code. In practice, the large income exemption available under the AMT means low-income taxpayers hardly ever owe more under the AMT. For many years, middle-income taxpayers were similarly unaffected by the AMT. However, the major problem with the AMT is that, unlike the regular tax exemptions and bracket thresholds, the AMT values are not indexed for inflation. This means that, as people’s incomes naturally rise, even if only with inflation, an increasing number of middle-income taxpayers find themselves having a greater tax liability under the AMT than they do under the regular tax code. To counteract this problem, the exemption has been permanently increased several times, most recently in 1993, to $45,000 for joint returns and to $33,750 for singles. Above the exemption amount, the AMT tax rate is 26 percent on the first $175,000 of taxable income and 28 percent thereafter. (Adjusting for infla-tion, the $45,000 exemption in 1993 is worth more than $66,000 in 2008 dollars.)
In its first year of operation, the minimum tax affected only 19,000 taxpayers and raised about $122 million, meaning this tax caused these taxpayers to owe $122 million more in tax than they owed under the regular tax laws. In 2007, the AMT affected over 4 million taxpayers and raised roughly $26 billion in revenue (about 1 percent of all Federal revenue). Under current law, these

Chapter 5 | 169
numbers are projected to increase to over 29 million taxpayers and over $100 billion in revenue in 2009.
Chart 5-4 shows the number of taxpayers who are forecast to be affected by the AMT under different future policies. Under current law—with the AMT parameters returning to their 1993 levels after 2008 and tax relief expiring at the end of 2010—the number of AMT-affected taxpayers will rise sharply in 2009, ultimately reaching nearly 44 million taxpayers in 2018. In 2008, Congress enacted an AMT “patch,” which adjusted the AMT parameters for 1 year to $69,950 for joint returns and $46,200 for singles (Congress has enacted short-term changes to the AMT parameters several times since 2001). If this patch is permanently extended and tax relief is allowed to expire at the end of 2010, the number of AMT-affected taxpayers would rise to 8 million in 2018. Alternately, if tax relief is extended (the “policy baseline” lines in Chart 5-4) the number of AMT-affected taxpayers will grow to 56 million in 2018 if the AMT parameters are allowed to return to their 1993 levels or to 21 million taxpayers if the AMT patch is permanently extended.
Taxpayers with many dependents or significant business deductions and those in high-tax States are more likely to be subject to the AMT. Three reductions to taxable income allowed under regular tax laws but not under the AMT are personal exemptions, miscellaneous business deductions, and State and local taxes. Taxpayers claiming more dependents may be accustomed to

170 | Economic Report of the President
seeing a large reduction in taxable income because of the personal exemption allowed for each dependent, but no corresponding reduction is available under the AMT. Similarly, miscellaneous business deductions, allowable under the regular tax laws when they exceed 2 percent of adjusted gross income (AGI), are not deductible under the AMT. Taxpayers in a State with relatively high income taxes or relatively high property taxes receive a relatively large deduc-tion under the regular tax laws but receive no relief for this expense under the AMT. The result of these items not being deductible under the AMT is that people with these deductions are more likely to be subject to the AMT than are people without these deductions. Among otherwise similar people, taxpayers with these deductions generally still pay less in Federal income tax than do people without these deductions, but the existence of the AMT reduces the tax benefit these deductions provide and means these people will have the extra work of filling out the additional form(s) required for the AMT.
Prior to 1998, most personal credits (such as the education tax credits and the child and dependent care credit) could not be used to reduce tax liability owed under the AMT. In fact, even if a taxpayer did not owe additional tax under the AMT, he or she would be prohibited from using the full amount of a credit if it would reduce his or her tax liability below the level determined under the AMT. This reduction in credit usefulness was yet another way people could be “hit” by the AMT.
AMT Reform IdeasThe most obvious way to deal with the AMT would be to abolish it entirely,
although this would require the Federal Government to forgo over $1.7 tril-lion in revenue over the next 10 years (assuming tax relief is extended through at least 2018). Short of that, there are several incremental approaches that could be used. One alternative would be for Congress to enact permanent inflation indexing of the AMT income exemption and other parameters. The recent experiences when 1-year increases in the AMT exemptions were enacted make clear that a permanent solution is needed. Other ways to reduce the impact of the AMT on the middle class include allowing deduc-tions for personal exemptions and State and local taxes. Prohibiting taxpayers from using their personal exemptions under the AMT means the AMT treats large families differently than the regular tax code does, and effectively makes it more expensive for people to raise a family.
Simplifying the Tax CodeFinally, it remains difficult to overstate the complexity of the U.S. Internal
Revenue Code: at standard print sizes, it would fill thousands of pages, with more added nearly every year. Deductions, exemptions, phase-outs, credits, and the AMT add complexity to the tax code that makes it challenging for

Chapter 5 | 171
ordinary people to determine their tax liability. See Box 5-3 for a fuller discussion of these issues.
Box 5-3: Tax Code Complexity
The U.S. individual income tax system is extremely difficult to understand and, as a result, imposes a substantial burden on taxpayers in the form of time and money spent complying with its various rules. There are dozens of tax credits and deductions, many of which target specific social goals. As the number of credits and deductions has grown over the years, the number of overlapping provisions has also increased, which often creates complicated interactions among provisions. Further, eligibility can vary across similar tax preferences due to idiosyncratic definitions and complicated phase-out provisions intended to limit tax benefits to lower-income taxpayers. For example:• Thetaxcodecurrentlycontainsadozenspecialtaxpreferencesrelating
to educational expenses. Three commonly utilized preferences—the Hope credit, the Lifetime Learning credit, and the tuition deduction—help families meet the costs of post-secondary education, but each provision varies in terms of eligibility and benefits. Also, the use of one tax provision may affect a student’s ability to use one of the other provisions and can even affect a student’s eligibility for subsidized student loans or Pell Grants.
• Phase-out provisions reduce the benefit of certain tax preferences(such as personal exemptions and the tuition deduction) for high-income taxpayers. Similarly, the maximum allowable amount of itemized deductions can be reduced for taxpayers with an AGI above $159,950 (in 2008). These provisions require additional calculations for taxpayers and also effectively increase their marginal tax rate. In 2008, an estimated 13 percent of taxpayers who itemized deductions will have their allowable itemized deductions reduced.
• Whentheparentsofaqualifyingchildfileseparatetaxreturns,thetaxcode contains a number of special rules to determine which parent can claim the child as a dependent. These rules depend on the marital status and adjusted gross income of the parents as well as on the amount of time the child lives with each parent.
• Topreventparentsfromshiftinginvestmentincometotheirchildren,the unearned income of dependent filers is taxed at the parents’ marginal tax rate. However, to limit this provision to higher-income families, this applies only to a child’s unearned income in excess of a certain limit ($1,800 in 2008).
• As discussed in the text, the AMT, which requires taxpayers tocalculate their tax liability a second time using a different set of tax rules and rates, affects a growing number of taxpayers.
172 | Economic Report of the President
Complying with these complex laws costs taxpayers time and money. It takes time to read and understand the laws, to collect the relevant data and keep records, and to fill in the forms themselves (or to have someone else do it). In fact, the tax laws are so complex that an entire industry of lawyers and accountants exists to help people comply with the laws and even to find ways to avoid paying the taxes they owe. The resources used in this industry are unavailable for use to produce other goods and services. In effect, other than for tax-related purposes, there are no consumable goods or services produced by these resources—one could argue that the economy is wasting these resources. Several studies have examined the social cost of the complexity of our tax code. A Government summary of these studies concludes that the annual cost of complying with the tax laws averages at least 1 percent of GDP (about $140 billion in 2008) and may be even higher. Tax reform that substantially simplified the tax code would free up these resources for more beneficial uses.
ConclusionTaxes distort incentives to work, save, and invest. By lowering individual
income tax rates at all income levels over the past 8 years, the Administration has substantially reduced these distortions and increased incentives to work, save, and invest. Lower Federal tax rates on capital gains and dividend income, along with the temporary increases in depreciation allowances, increased business incentives to purchase new capital equipment and reduced the double taxation of corporate income. Each of these changes improves the efficiency of the tax structure, enhances economic growth, and improves our standard of living over the long run. However, most of these tax reductions are scheduled to expire at the end of 2010, which would eliminate many of the gains made over the past 8 years. Allowing these tax reductions to expire will increase taxes for all income groups, with the lower- and middle-income groups experiencing the largest percentage increases.
Despite the improvements of the past 8 years, there remains much to be done to make the tax code as efficient as possible. In the international arena, the relatively low U.S. corporate tax rates of the late 1980s were left unchanged while most other developed countries dramatically reduced rates. As a result, U.S. corporate tax rates are now among the highest in the devel-oped world. This handicap is partly offset by other tax provisions, such as generous depreciation allowances. But the resulting tax burden still places U.S. companies at a competitive disadvantage relative to companies in lower-tax jurisdictions, and it reduces our ability to attract capital in an environment where capital is highly mobile across international borders. In addition, two

Chapter 5 | 173
long-standing problems needing attention are the Alternative Minimum Tax and the complexity of the U.S. income tax laws. Without its annual “patch,” the AMT would affect more than 20 million more taxpayers each year.