Embed Size (px)
Citation preview
IGF-OECD PROGRAM TO ADDRESS BEPS IN MINING
TAX INCENTIVES IN MINING: MINIMISING RISKS TO REVENUE
SUPPLEMENTARY GUIDANCE:How to Use Financial Modelling to Estimate the Cost of Tax Incentives
© 2018 The International Institute for Sustainable Development Published by the International Institute for Sustainable Development
TAX INCENTIVES IN MINING: MINIMISING RISKS TO REVENUE
Supplementary Guidance: How to Use Financial Modelling to Estimate the Cost of Tax Incentives
Author: Iain Steel
This supplementary guidance note is intended to accompany the IGF Financial Model which is licensed under a Creative Commons Attribution-ShareAlike 4.0 International Licence (CC BY-SA 4.0). The model may be freely used, quoted, shared and adapted provided that i) the source is fully acknowledged and ii) any adaptations of this material are distributed under the same licence.
IGF is very interested in how this model is being used, so we request that you reach out to us via email notifying us of use of these resources. Note this is not a requirement of the licence or permission request, and you do not have to wait for a response from IGF in order to use these resources—we are seeking to keep a dialogue with users in order to provide updates, track progress and gather usage statistics. Our contact email is [email protected].
International Institute for Sustainable Development
The International Institute for Sustainable Development (IISD) is an independent think tank championing sustainable solutions to 21st– century problems. Our mission is to promote human development and environmental sustainability. We do this through research, analysis and knowledge products that support sound policy-making. Our big-picture view allows us to address the root causes of some of the greatest challenges facing our planet today: ecological destruction, social exclusion, unfair laws and economic rules, a changing climate. IISD’s staff of over 120 people, plus over 50 associates and 100 consultants, come from across the globe and from many disciplines. Our work affects lives in nearly 100 countries. Part scientist, part strategist—IISD delivers the knowledge to act.
IISD is registered as a charitable organization in Canada and has 501(c) (3) status in the United States. IISD receives core operating support from the Province of Manitoba and project funding from numerous governments inside and outside Canada, United Nations agencies, foundations, the private sector and individuals.
Intergovernmental Forum on Mining, Minerals, Metals and Sustainable Development (IGF)
The Intergovernmental Forum on Mining, Minerals, Metals and Sustainable Development (IGF) is a member-driven organization which provides national governments the opportunity to work collectively to achieve their sustainable mining goals. It is devoted to optimizing the benefits of mining to achieve poverty reduction, inclusive growth, social development and environmental stewardship. The IGF serves as a unique global venue for dialogue between its 67 member country governments, mining companies, industry associations and civil society.
Secretariat functions are provided by the International Institute for Sustainable Development, which manages the day-to-day operations of the IGF and provides logistical, administrative and strategic support for its activities. The program is undertaken with the financial support of the Government of Canada provided through Global Affairs Canada.
IISD HEAD OFFICE
111 Lombard Avenue Suite 325 Winnipeg, Manitoba Canada R3B 0T4
IISD.org @IISD_news
IGF/IISD OTTAWA OFFICE
220 Laurier Avenue W. Suite 1100 Ottawa, Ontario Canada K1P 5Z9
IGFMining.org @IGFMining
Secretariat hosted by:
Secretariat funded by:
Report funded by:
iii
THE HIDDEN COST OF MINING TAX INCENTIVES: SUPPLEMENTARY GUIDANCE
Table of ContentsIntroduction ..........................................................................................................................................................................................1
About this supplementary guidance......................................................................................................................................................2
Who is this guidance for? .................................................................................................................................................................................2
Section One. A Framework for Modelling Behavioural Responses to Mining Tax Incentives.................. 3
Section Two. The IGF Mining Tax Incentives Financial Model .................................................................................. 5
Understanding the Model ..................................................................................................................................................................................6
Using the Model ...........................................................................................................................................................................................................8
Adapting the Model .............................................................................................................................................................................................. 11
Section Three: Estimating the Direct Cost of Tax Incentives ...............................................................................19
Estimating the Direct Cost of a Single Tax Incentive ......................................................................................................20
Section Four: Estimating the Cost of Behavioural Responses to Mining Tax Incentives .......................26
Section Five: Testing Cost Estimates ................................................................................................................................. 38
Conclusions and Best Practices ............................................................................................................................................44
Annex 1. The Basics of Financial Modelling .....................................................................................................................47

iv
THE HIDDEN COST OF MINING TAX INCENTIVES: SUPPLEMENTARY GUIDANCE
List of FiguresFigure 1. Entities and Cash Flows in the IGF Financial Model .......................................................................................7
Figure 2: The Dashboard ..............................................................................................................................................................................8
Figure 3. The Sensitivity Worksheet .................................................................................................................................................. 9
Figure 4. The Inputs Worksheet..........................................................................................................................................................10
Figure 5. Combinations of Fiscal and Behavioural Assumptions and their Associated Outputs ......................................................................................................................................................................................12
Figure 6. Order of Tax Calculations in the Model ................................................................................................................ 14
Figure 7. Data Flows Through the Benchmark, Incentive, and Behavioural Worksheets .....................15
Figure 8. Data Flows Through the Impacts Worksheet ...................................................................................................16
Figure 9. Data Flows Through the Model ...................................................................................................................................... 17
Figure 10. NPV at Different Cut-Off Grades Under the Benchmark and Incentive Fiscal Regimes ..................................................................................................................................................................................................30
Figure 11. Direct and Behavioural Costs from 10-year Income Tax Holiday with High-Grading 31
Figure 12. Randomly-Generated Prices for MCS ................................................................................................................. 35
Figure 13. Randomly-Generated Prices with Behavioural Response .................................................................. 36
Figure 14. NPV Cost of 10-year Tax Holiday at Different Gold Prices .............................................................43
Figure 15. NPV Cost of 10% Rate Reduction at Different Gold Prices ............................................................43
Figure 16. Steps for Estimating the total cost of Tax Incentives in Mining ...................................................45
List of TablesTable 1. Framework for Modelling Behavioural Responses .............................................................................................4
Table 2. Worksheets in the Model ...................................................................................................................................................... 11
Table 3. Calculation Sections in the Benchmark, Incentive and Behavioural Worksheets ...............13
Table 4. Assumptions for the Benchmark Fiscal Regime..............................................................................................20
Table 5. Government Revenue under the Benchmark Fiscal Regime .................................................................20
Table 6. Assumptions for Import Duty Exemption...............................................................................................................21
Table 7. Cost of Import Duty Exemption .....................................................................................................................................21
Table 8. Costing of Import Duty Exemption .............................................................................................................................21
Table 9. Assumptions for Multiple Tax Incentives ...............................................................................................................22
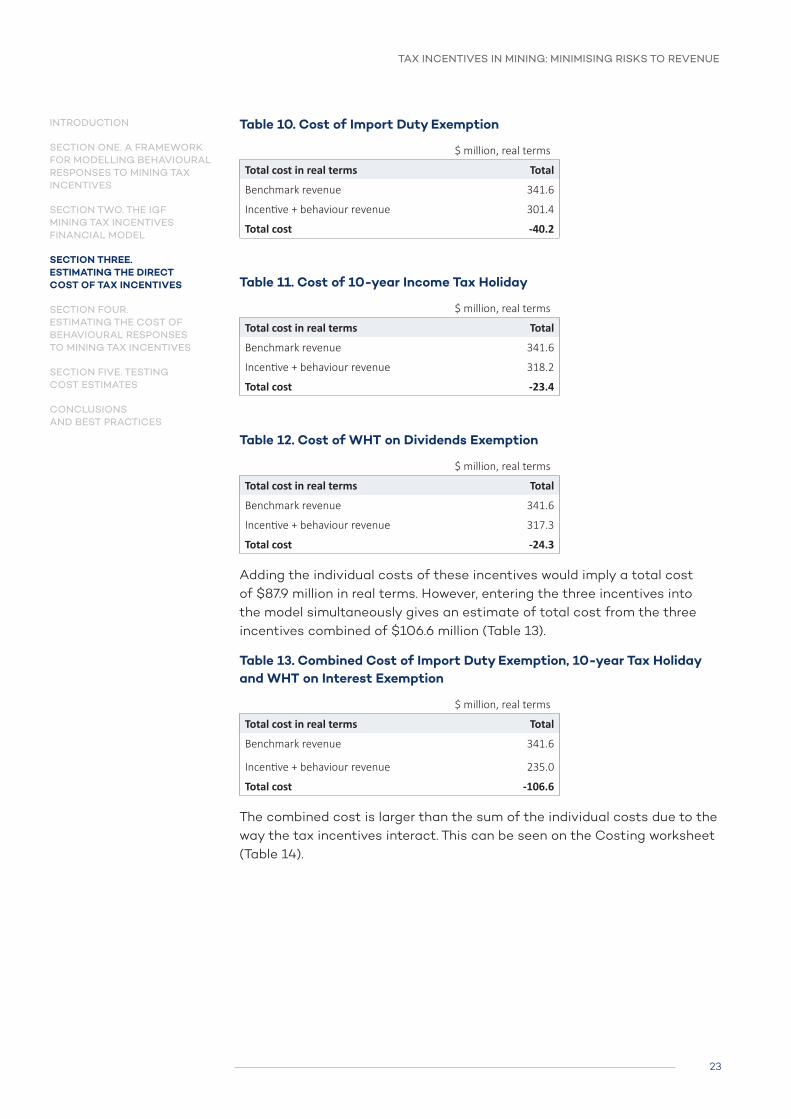
Table 10. Cost of Import Duty Exemption ..................................................................................................................................23
Table 11. Cost of 10-year Income Tax Holiday ......................................................................................................................23
Table 12. Cost of WHT on Dividends Exemption...................................................................................................................23
Table 13. Combined Cost of Import Duty Exemption, 10-year Tax Holiday and WHT on Interest Exemption ...................................................................................................................................................................23
Table 14. Detailed Costing of Import Duty Exemption, 10-year Tax Holiday and WHT on Interest Exemption .................................................................................................................................................................. 24
Table 15: Benchmark Fiscal Regimes for Costings of Multiple Tax Incentives ........................................... 25
Table 16. Scorecard of Multiple Tax Incentives..................................................................................................................... 25

v
THE HIDDEN COST OF MINING TAX INCENTIVES: SUPPLEMENTARY GUIDANCE
Table 17. Types of Tax Incentives and their Related Behavioural Responses ...............................................27
Table 18. Scenarios at Different Cut-Off Grades in the IGF Financial Model ............................................ 29
Table 19. Assumptions for Income Tax Holiday .................................................................................................................... 29
Table 20. Behavioural Assumptions for High-Grading in Response to an Income Tax Holiday ..30
Table 21. Cost of Income Tax Holiday with High-Grading Behavioural Response ..................................30
Table 22. Cost of 10-year Income Tax Holiday with High-Grading in Discounted Terms.................31
Table 23. Assumptions for Withholding Tax on Interest Exemption with Excessive Interest Deductions ............................................................................................................................................................................................................32
Table 24. Total Cost of WHT on Interest Exemption with Excessive Interest Deductions .......................................................................................................................................................................................32
Table 25. Cost of Withholding Tax on Interest Exemption with Excessive Interest Deductions .33
Table 26. Cost of Excessive Interest Deductions with a 15% WHT on Interest .........................................33
Table 27. Rates and Thresholds for Sliding-Scale Royalty.......................................................................................... 34
Table 28. Dead Zones Above Each Royalty Rate Threshold ...................................................................................... 34
Table 29. Monte Carlo Simulation Results of Behavioural Response to Sliding-Scale Royalty .. 36
Table 30. Scenario Modelling and Sensitivity Analysis .................................................................................................. 39
Table 31. Suggested Parameters and Data Sources for Scenario Modelling .............................................. 40
Table 32. Suggested Parameters for Sensitivity Analysis of Tax Incentives .............................................. 41
Table 33. Assumptions for 10-year Income Tax Holiday ..............................................................................................42
Table 34. Assumptions for 10 per cent Income Tax Rate Reduction ..................................................................42
Table 35. Cost of 10-year Holiday in Real Terms ...............................................................................................................42
Table 36. Cost of 10% Rate Reduction in Real Terms ....................................................................................................42
Table 37. Cost of 10-year Holiday in NPV Terms ................................................................................................................42
Table 38. Cost of 10% Rate Reduction in NPV Terms ....................................................................................................42

INTRODUCTION

2
TAX INCENTIVES IN MINING: MINIMISING RISKS TO REVENUE
INTRODUCTION
SECTION ONE. A FRAMEWORK FOR MODELLING BEHAVIOURAL RESPONSES TO MINING TAX INCENTIVES
SECTION TWO. THE IGF MINING TAX INCENTIVES FINANCIAL MODEL
SECTION THREE. ESTIMATING THE DIRECT COST OF TAX INCENTIVES
SECTION FOUR. ESTIMATING THE COST OF BEHAVIOURAL RESPONSES TO MINING TAX INCENTIVES
SECTION FIVE. TESTING COST ESTIMATES
CONCLUSIONS AND BEST PRACTICES
IntroductionFinancial models are representations of the real world intended to give useful insight. They can be used to help governments make better-informed decisions, such as whether to provide a tax incentive to a mining project given the expected impact on government revenues and investor returns.
Financial modelling is not new, although a lack of modelling expertise in developing countries compromises government efforts to design effective fiscal regimes and negotiate contracts.1 Outside of governments there are various organisations involved in financial modelling. The International Monetary Fund (IMF) uses the Fiscal Analysis of Resource Industries (FARI) framework to evaluate extractive industry fiscal regimes. In the future they intend to expand FARI modelling to assist revenue administrations to model the tax gap between actual and expected revenues. Practitioners in the non-profit sector include the Columbia Center on Sustainable Investment (CCSI), International Institute for Sustainable Development (IISD), Natural Resource Governance Institute (NRGI) and the Overseas Development Institute (ODI). OpenOil, a company based in Berlin, has developed an open-source approach to financial modelling of extractive industry projects and has published models of projects in Latin America, Africa and Asia.
About this supplementary guidanceThis guidance is focused specifically on how governments can use financial models to estimate the unintended revenue losses that result from mining investors changing their behaviour in response to tax incentives. It is intended to supplement Tax Incentives in Mining: Minimising risks to revenue, guidance material prepared under a programme of cooperation between the OECD and the Inter-Governmental Forum on Mining (IGF). It is not intended to replicate general guidance and technical assistance offered by international organisations, non-profits and private companies.
Who is this guidance for?The guidance is for users who have some knowledge of financial modelling, such as government officials in ministries of mining or finance that are tasked with building financial models to advise decision-makers on fiscal regime design or contract negotiation. Knowledge of the basics of financial modelling is therefore assumed and this guidance does not teach users how to build a basic financial model of a mining project. The modelling tool adds new insights on how to integrate tax incentives into financial models and how to test the revenue impact of potential behavioural responses. See Annex 1 for suggested guidance material on basic financial modelling.
1 See Running the Numbers: How African Governments Model Extractive Projects, African Development Bank and OpenOil (2017).

SECTION ONE. A FRAMEWORK
FOR MODELLING BEHAVIOURAL
RESPONSES TO MINING TAX
INCENTIVES

4
TAX INCENTIVES IN MINING: MINIMISING RISKS TO REVENUE
Section One. A Framework for Modelling Behavioural Responses to Mining Tax IncentivesThis framework expands on conventional methods for estimating the cost of tax incentives in mining by incorporating behavioural responses – how companies might change their behaviour to maximise the financial benefit of incentives. This approach can help governments to estimate the total potential cost of incentives and reveal the hidden costs of tax incentives in mining.
Table 1. Framework for Modelling Behavioural Responses
Step 1 Estimate government revenue under the benchmark fiscal regime• The benchmark fiscal regime depends on the purpose of the
modelº When modelling the mining fiscal regime, the benchmark
will be the general tax treatment that applies to corporate entities, found in domestic tax law
º When modelling an individual mining contract, the benchmark will be the mining fiscal regime found in tax law and/or mining law
• Benchmark revenue is government revenue estimated under the benchmark fiscal regime
Step 2 Estimate the direct cost of tax incentives• Tax incentives are added to the model to estimate incentive
revenue (government revenue under the incentive fiscal regime)• The difference between benchmark revenue and incentive revenue
is the direct cost of tax incentives
Step 3 Estimate the behavioural cost of tax incentives• Investors may change their behaviour to maximise the financial
benefit of tax incentives beyond what government anticipated (behavioural response), resulting in unintended revenue losses
• Assumptions about how investors change their behaviour are incorporated into the financial model to estimate incentive + behaviour revenue
• The difference between incentive + behaviour revenue and incentive revenue is the behavioural cost of tax incentives
Step 4 Estimate the total cost from tax incentives• The direct cost and behavioural cost added together is total cost• This is arithmetically the same as the difference between
incentive + behaviour revenue and benchmark revenue
INTRODUCTION
SECTION ONE. A FRAMEWORK FOR MODELLING BEHAVIOURAL RESPONSES TO MINING TAX INCENTIVES
SECTION TWO. THE IGF MINING TAX INCENTIVES FINANCIAL MODEL
SECTION THREE. ESTIMATING THE DIRECT COST OF TAX INCENTIVES
SECTION FOUR. ESTIMATING THE COST OF BEHAVIOURAL RESPONSES TO MINING TAX INCENTIVES
SECTION FIVE. TESTING COST ESTIMATES
CONCLUSIONS AND BEST PRACTICES

SECTION TWO. THE IGF MINING TAX INCENTIVES
FINANCIAL MODEL

6
TAX INCENTIVES IN MINING: MINIMISING RISKS TO REVENUE
Section Two: The IGF Mining Tax Incentives Financial ModelThe IGF has released a beta-stage financial model for estimating the total cost of tax incentives in mining, including behavioural responses as set out in Tax Incentives in Mining: Minimising risks to revenue. It was used to produce most of the examples in this note.
The model is pre-configured for a representative medium-sized surface gold mine in sub-Saharan Africa and typical tax and royalty fiscal regime. The project assumptions are based on data from the World Bank Sourcebook and various technical reported filed with securities administrations. It can be used to examine the cost of tax incentives on the representative gold mine, but users should note that the insights gained may not apply more broadly to other projects with different commodity types, cost bases, and fiscal regimes. Every mining project is unique, and financial modelling needs to reflect the specifics of the project and fiscal regime that applies to it.
The IGF has therefore released the model under [Creative Commons Attribution-ShareAlike 4.0 International License (CC BY-SA 4.0)] so that users can make changes to the model to adapt it to local circumstances. The model follows the FAST Standard2 of financial modelling to help with transferability and to make it as easy as possible for users to make structural changes, for example to change the mine type, commodity or fiscal regime. Users who intend to adapt the model should first read this guidance to get a better understanding of the model’s architecture.
Understanding the ModelThe model is a full economic model that includes dynamic modelling of mining processes and cash flows, government revenues, financing flows, and the impact of tax incentives and behavioural responses on each of these. The main entities in the model are:
• the mine project, which includes a domestic mining company and overseas affiliates providing services, debt and equity to the project; and
• the government, which collects royalties and taxes from the mining company and withholds tax on outbound payments for services, interest and dividends to overseas affiliates of the domestic mining company and third-party service providers, lenders and investors.
The model first estimates project pre-tax cash flow at the aggregate level, without considering the allocation of cash flows to domestic and overseas entities within the corporate group or to the government via the fiscal
2 A set of rules providing guidance on the structure and design of efficient spreadsheets, maintained by the FAST Standard Organisation. See Annex 1 for guidance on financial modelling standards.
INTRODUCTION
SECTION ONE. A FRAMEWORK FOR MODELLING BEHAVIOURAL RESPONSES TO MINING TAX INCENTIVES
SECTION TWO. THE IGF MINING TAX INCENTIVES FINANCIAL MODEL
SECTION THREE. ESTIMATING THE DIRECT COST OF TAX INCENTIVES
SECTION FOUR. ESTIMATING THE COST OF BEHAVIOURAL RESPONSES TO MINING TAX INCENTIVES
SECTION FIVE. TESTING COST ESTIMATES
CONCLUSIONS AND BEST PRACTICES

7
TAX INCENTIVES IN MINING: MINIMISING RISKS TO REVENUE
regime. This is effectively the total potential cash benefit from the project, which is then shared between the government and private sector.
The share of cash flow that goes to government is determined by:
• the fiscal regime, which includes taxes and royalties levied on the domestic mining company and withholding taxes on payments for services, interest and dividends made to overseas companies; and
• the transfer prices and other assumptions for transactions between the domestic mining company and overseas affiliates that impact on the tax base (e.g. the profits of the domestic company and the value of outbound payments to affiliates for services, debt interest and dividends).
The main results from the model are government revenue, the government take, project returns (Net Present Value (NPV), Internal Rate of Return (IRR) and payback periods), and the impact of tax incentives on each of these.3 Project returns and indicators are presented at the corporate group level, rather than for the domestic mining company, i.e. the share of pre-tax cash flow that goes to the private sector rather than government.
Figure 1. Entities and Cash Flows in the IGF Financial Model
3 For a full explanation of government take, NPV, IRR and payback period see the IMF FARI methodology.
Taxe
s
Government
Mining company
Contractors, suppliers etc.
Overseas affi liateOverseas affi liate
Lenders Refi nery
Overseas affi liate
Pro
ject
fi n
anc
e
WH
T o
n in
tere
st
WH
T o
n d
ivid
end
s
WH
T o
n se
rvic
es
Roy
alt
y
Debt and equity fi nancing
Ad
min
cos
tsM
anag
emen
t fe
es +
mar
k-up
Sales at transfer p
rice
DividendsDebt interest
Sa
les
at
ma
rket
pri
ce
Dir
ect
oper
ati
ng a
nd c
ap
ita
l cos
ts
Project cash fl ow
Related-party fi nancing fl ow
Related-party transaction
Taxes on mining company
Taxes on third parties
Financial fl ow not in model
Government
Mining company
Overseas affi liate
Third party
INTRODUCTION
SECTION ONE. A FRAMEWORK FOR MODELLING BEHAVIOURAL RESPONSES TO MINING TAX INCENTIVES
SECTION TWO. THE IGF MINING TAX INCENTIVES FINANCIAL MODEL
SECTION THREE. ESTIMATING THE DIRECT COST OF TAX INCENTIVES
SECTION FOUR. ESTIMATING THE COST OF BEHAVIOURAL RESPONSES TO MINING TAX INCENTIVES
SECTION FIVE. TESTING COST ESTIMATES
CONCLUSIONS AND BEST PRACTICES
8
TAX INCENTIVES IN MINING: MINIMISING RISKS TO REVENUE
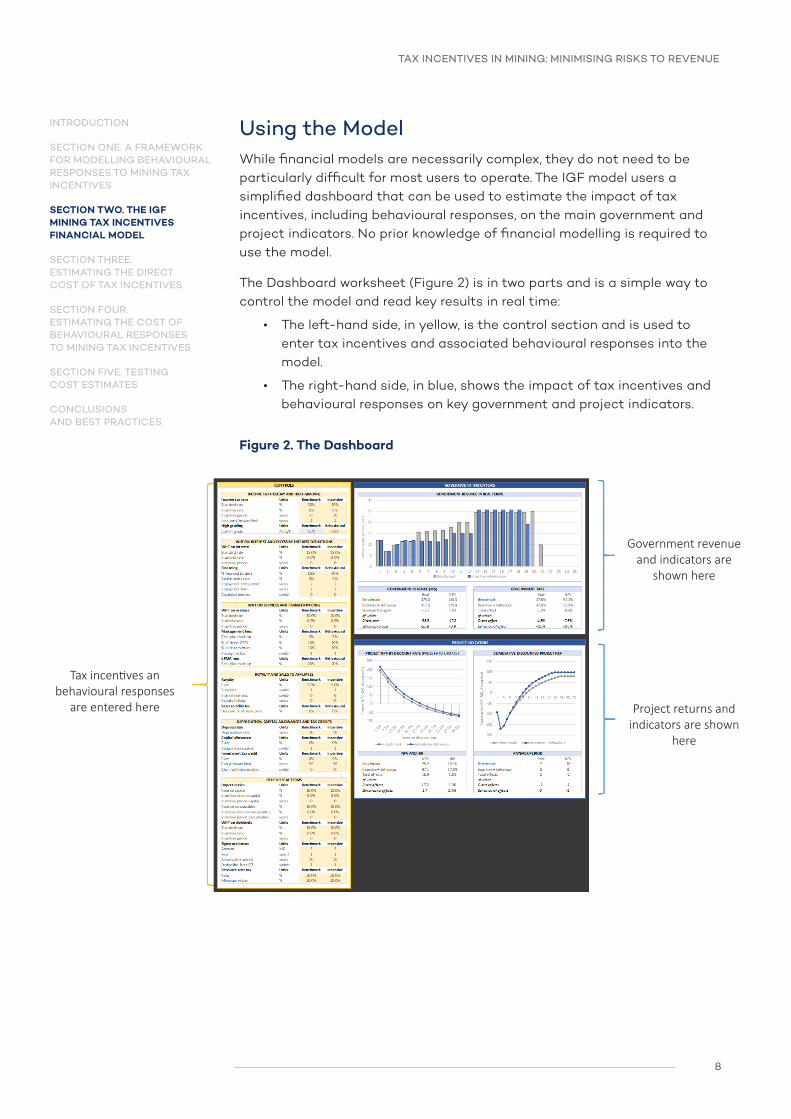
Using the ModelWhile financial models are necessarily complex, they do not need to be particularly difficult for most users to operate. The IGF model users a simplified dashboard that can be used to estimate the impact of tax incentives, including behavioural responses, on the main government and project indicators. No prior knowledge of financial modelling is required to use the model.
The Dashboard worksheet (Figure 2) is in two parts and is a simple way to control the model and read key results in real time:
• The left-hand side, in yellow, is the control section and is used to enter tax incentives and associated behavioural responses into the model.
• The right-hand side, in blue, shows the impact of tax incentives and behavioural responses on key government and project indicators.
Figure 2. The Dashboard
INTRODUCTION
SECTION ONE. A FRAMEWORK FOR MODELLING BEHAVIOURAL RESPONSES TO MINING TAX INCENTIVES
SECTION TWO. THE IGF MINING TAX INCENTIVES FINANCIAL MODEL
SECTION THREE. ESTIMATING THE DIRECT COST OF TAX INCENTIVES
SECTION FOUR. ESTIMATING THE COST OF BEHAVIOURAL RESPONSES TO MINING TAX INCENTIVES
SECTION FIVE. TESTING COST ESTIMATES
CONCLUSIONS AND BEST PRACTICES
Government revenue and indicators are
shown here
Project returns and indicators are shown
here
Tax incentives an behavioural responses
are entered here
9
TAX INCENTIVES IN MINING: MINIMISING RISKS TO REVENUE
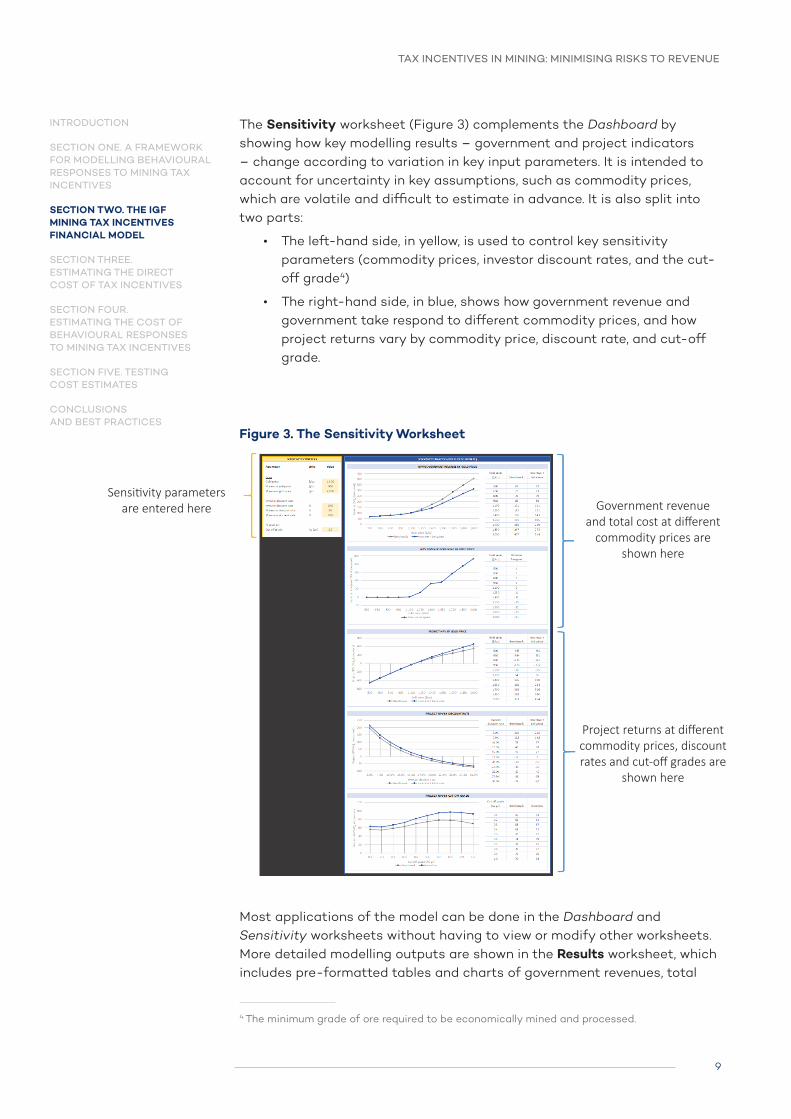
The Sensitivity worksheet (Figure 3) complements the Dashboard by showing how key modelling results – government and project indicators – change according to variation in key input parameters. It is intended to account for uncertainty in key assumptions, such as commodity prices, which are volatile and difficult to estimate in advance. It is also split into two parts:
• The left-hand side, in yellow, is used to control key sensitivity parameters (commodity prices, investor discount rates, and the cut-off grade4)
• The right-hand side, in blue, shows how government revenue and government take respond to different commodity prices, and how project returns vary by commodity price, discount rate, and cut-off grade.
Figure 3. The Sensitivity Worksheet
Most applications of the model can be done in the Dashboard and Sensitivity worksheets without having to view or modify other worksheets. More detailed modelling outputs are shown in the Results worksheet, which includes pre-formatted tables and charts of government revenues, total
4 The minimum grade of ore required to be economically mined and processed.
INTRODUCTION
SECTION ONE. A FRAMEWORK FOR MODELLING BEHAVIOURAL RESPONSES TO MINING TAX INCENTIVES
SECTION TWO. THE IGF MINING TAX INCENTIVES FINANCIAL MODEL
SECTION THREE. ESTIMATING THE DIRECT COST OF TAX INCENTIVES
SECTION FOUR. ESTIMATING THE COST OF BEHAVIOURAL RESPONSES TO MINING TAX INCENTIVES
SECTION FIVE. TESTING COST ESTIMATES
CONCLUSIONS AND BEST PRACTICES
Government revenue and total cost at different
commodity prices are shown here
Project returns at different commodity prices, discount rates and cut-off grades are
shown here
Sensitivity parameters are entered here

10
TAX INCENTIVES IN MINING: MINIMISING RISKS TO REVENUE
cost, and project indicators. These can be used directly in documents and slide decks to present modelling results. The Costing worksheet shows the detailed breakdown of total cost by direct effects and behavioural effects for each tax instrument, and the Scorecard tab can be used to generate tables of multiple tax incentives.
The model can be adapted to different surface gold mines by changing the operational and cost assumptions on the Inputs worksheet (Figure 4). These include:
• Geological information on the ore deposit, such as mineral reserves and grades.
• Operational assumptions, such as the time-period required for investment, the mine production rate, and the capacity of the processing plant.
• Cost assumptions, including investment costs to develop the mine, and unit operating costs for mining and processing.
All cost and other financial data are entered to the model in real terms. Consistent with the FAST Standard, input cells are highlighted in yellow and are the only cells that need to be changed to set new assumptions.
Figure 4. The Inputs Worksheet
INTRODUCTION
SECTION ONE. A FRAMEWORK FOR MODELLING BEHAVIOURAL RESPONSES TO MINING TAX INCENTIVES
SECTION TWO. THE IGF MINING TAX INCENTIVES FINANCIAL MODEL
SECTION THREE. ESTIMATING THE DIRECT COST OF TAX INCENTIVES
SECTION FOUR. ESTIMATING THE COST OF BEHAVIOURAL RESPONSES TO MINING TAX INCENTIVES
SECTION FIVE. TESTING COST ESTIMATES
CONCLUSIONS AND BEST PRACTICES

11
TAX INCENTIVES IN MINING: MINIMISING RISKS TO REVENUE
Adapting the ModelThe IGF model can be used for surface gold mines with a typical tax and royalty regime without needing to make any structural changes to the model. To adapt the model to different mine types and commodities, or to make structural changes to the fiscal regime, users must make changes to the working sheets in the model. The IGF has released the model under a Creative Commons Attribution-ShareAlike 4.0 International Licence (CC BY-SA 4.0) and used the FAST Standard to make this as easy as possible, but users make structural changes to the model at their own risk.
This section sets out the model’s architecture in greater detail to help users to adapt the model to their own specific needs. Users should note that, as the model produces three distinct sets of outputs based on different combinations of fiscal regime and behavioural assumptions, structural changes need to be made in triplicate to each of the three main working sheets (Benchmark, Incentive and Behavioural).
a) Worksheets in the Model
The model consists of several worksheets of different types as defined under the FAST Standard: control and presentation; foundation; working; and presentation (Table 2).
Table 2. Worksheets in the Model
Worksheet Type Description
Cover Presentation Provides contextual information on the model.
Dashboard Control and presentation
Main sheet enabling users to add tax incentives and associated behavioural responses and immediately see their impact on government revenue and project returns.
Sensitivity Control and presentation
Shows the sensitivity of government revenue and total cost estimates to the gold price, and project returns across a range of prices, discount rates and cut-off grades.
Inputs Foundation Input sheet for entering economic, project, and fiscal regime assumptions to the model, other than those set on the Dashboard and Sensitivity worksheets.
T&E Working Timing and escalation sheet used to calculate flags for timing events and escalation factors for inflation and discounting.
Benchmark Working Calculates benchmark revenue based on benchmark fiscal and behavioural assumptions set on the Dashboard and Inputs worksheets.
Incentive Working Calculates incentive revenue based on incentive fiscal and benchmark behavioural assumptions set on the Dashboard and Inputs worksheets.
Behavioural Working Calculates incentive + behaviour revenue based on incentive fiscal and behavioural response assumptions set on the Dashboard and Inputs worksheets.
INTRODUCTION
SECTION ONE. A FRAMEWORK FOR MODELLING BEHAVIOURAL RESPONSES TO MINING TAX INCENTIVES
SECTION TWO. THE IGF MINING TAX INCENTIVES FINANCIAL MODEL
SECTION THREE. ESTIMATING THE DIRECT COST OF TAX INCENTIVES
SECTION FOUR. ESTIMATING THE COST OF BEHAVIOURAL RESPONSES TO MINING TAX INCENTIVES
SECTION FIVE. TESTING COST ESTIMATES
CONCLUSIONS AND BEST PRACTICES

12
TAX INCENTIVES IN MINING: MINIMISING RISKS TO REVENUE
Worksheet Type Description
Impacts Working Calculates direct cost, behavioural cost and total cost from benchmark, incentive and incentive + behaviour revenue.
Chart data Working Data used for charts on the Dashboard and Results worksheets.
Results Presentation Pre-formatted tables and charts showing key modelling results: government revenue; total cost; government indicators and the impact of tax incentives on those indicators; project cash flows; investor indicators; and the impact of tax incentives on project cash flow and investor indicators.
Costing Presentation Disaggregation of the total cost estimate by (a) direct and behavioural costs and (b) fiscal instrument.
Scorecard Presentation Used to generate scorecards of multiple tax incentives combined.
b) The T&E Worksheet
The T&E (timing and escalation) worksheet calculates timing flags (used to demarcate different time periods and events such as the beginning of commercial production) and escalation factors for inflation and discounting (used to convert real-term inputs into nominal- and discounted-terms). See the FAST Standard for more information on timing flags and the FARI Methodology for discounting.
c) The Benchmark, Incentive and Behavioural Worksheets
The Benchmark, Incentive and Behavioural worksheets calculate government revenue and project returns for different combinations of assumptions (Figure 5).
Figure 5. Combinations of Fiscal and Behavioural Assumptions and their Associated Outputs
FISCAL REGIME
BE
HA
VIO
UR
AL
AS
SU
MP
TIO
NS
Benchmark Incentive
Benchmark
Behavioural
Benchmark revenue Incentive revenue
N/AIncentive + behaviour
revenue
INTRODUCTION
SECTION ONE. A FRAMEWORK FOR MODELLING BEHAVIOURAL RESPONSES TO MINING TAX INCENTIVES
SECTION TWO. THE IGF MINING TAX INCENTIVES FINANCIAL MODEL
SECTION THREE. ESTIMATING THE DIRECT COST OF TAX INCENTIVES
SECTION FOUR. ESTIMATING THE COST OF BEHAVIOURAL RESPONSES TO MINING TAX INCENTIVES
SECTION FIVE. TESTING COST ESTIMATES
CONCLUSIONS AND BEST PRACTICES
13
TAX INCENTIVES IN MINING: MINIMISING RISKS TO REVENUE
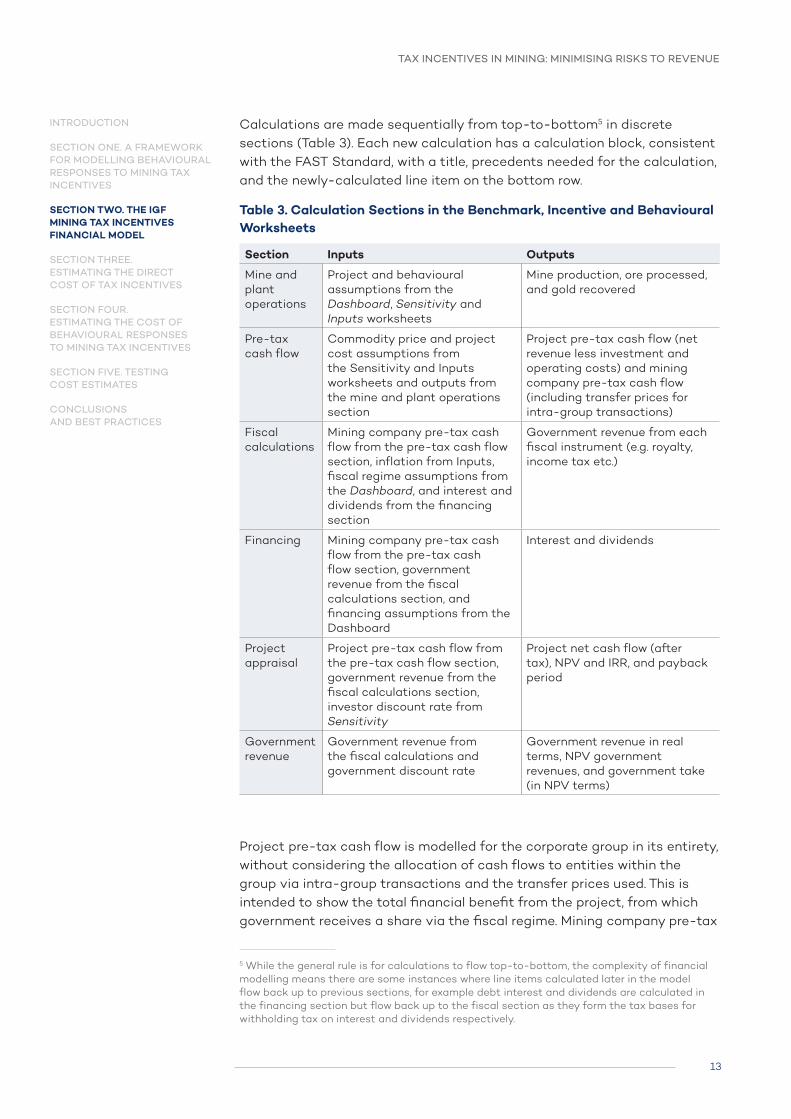
Calculations are made sequentially from top-to-bottom5 in discrete sections (Table 3). Each new calculation has a calculation block, consistent with the FAST Standard, with a title, precedents needed for the calculation, and the newly-calculated line item on the bottom row.
Table 3. Calculation Sections in the Benchmark, Incentive and Behavioural Worksheets
Section Inputs Outputs
Mine and plant operations
Project and behavioural assumptions from the Dashboard, Sensitivity and Inputs worksheets
Mine production, ore processed, and gold recovered
Pre-tax cash flow
Commodity price and project cost assumptions from the Sensitivity and Inputs worksheets and outputs from the mine and plant operations section
Project pre-tax cash flow (net revenue less investment and operating costs) and mining company pre-tax cash flow (including transfer prices for intra-group transactions)
Fiscal calculations
Mining company pre-tax cash flow from the pre-tax cash flow section, inflation from Inputs, fiscal regime assumptions from the Dashboard, and interest and dividends from the financing section
Government revenue from each fiscal instrument (e.g. royalty, income tax etc.)
Financing Mining company pre-tax cash flow from the pre-tax cash flow section, government revenue from the fiscal calculations section, and financing assumptions from the Dashboard
Interest and dividends
Project appraisal
Project pre-tax cash flow from the pre-tax cash flow section, government revenue from the fiscal calculations section, investor discount rate from Sensitivity
Project net cash flow (after tax), NPV and IRR, and payback period
Government revenue
Government revenue from the fiscal calculations and government discount rate
Government revenue in real terms, NPV government revenues, and government take (in NPV terms)
Project pre-tax cash flow is modelled for the corporate group in its entirety, without considering the allocation of cash flows to entities within the group via intra-group transactions and the transfer prices used. This is intended to show the total financial benefit from the project, from which government receives a share via the fiscal regime. Mining company pre-tax
5 While the general rule is for calculations to flow top-to-bottom, the complexity of financial modelling means there are some instances where line items calculated later in the model flow back up to previous sections, for example debt interest and dividends are calculated in the financing section but flow back up to the fiscal section as they form the tax bases for withholding tax on interest and dividends respectively.
INTRODUCTION
SECTION ONE. A FRAMEWORK FOR MODELLING BEHAVIOURAL RESPONSES TO MINING TAX INCENTIVES
SECTION TWO. THE IGF MINING TAX INCENTIVES FINANCIAL MODEL
SECTION THREE. ESTIMATING THE DIRECT COST OF TAX INCENTIVES
SECTION FOUR. ESTIMATING THE COST OF BEHAVIOURAL RESPONSES TO MINING TAX INCENTIVES
SECTION FIVE. TESTING COST ESTIMATES
CONCLUSIONS AND BEST PRACTICES

14
TAX INCENTIVES IN MINING: MINIMISING RISKS TO REVENUE
cash flows are also modelled, taking account of transactions with affiliates, and are used to determine liabilities for domestic taxes and royalties. Outbound payments from the mining company to overseas affiliates for services, interest, and dividends form the tax bases for withholding taxes. The model can therefore be used to estimate the impact of different transfer-pricing assumptions on government revenue and project returns at the corporate group level, i.e. the share of pre-tax cash flow that goes to government versus private sector.
Real-terms cash flow is converted into nominal terms for fiscal calculations to give a more accurate representation of the tax system, consistent with the FARI methodology. Taxes are calculated sequentially so that the impact of upstream taxes are incorporated in downstream taxes, e.g. royalty payments are deducted from taxable income before calculating income tax. Revenue from each fiscal instrument is converted back into real terms for consistency with other model outputs.
Figure 6. Order of Tax Calculations in the Model
INTRODUCTION
SECTION ONE. A FRAMEWORK FOR MODELLING BEHAVIOURAL RESPONSES TO MINING TAX INCENTIVES
SECTION TWO. THE IGF MINING TAX INCENTIVES FINANCIAL MODEL
SECTION THREE. ESTIMATING THE DIRECT COST OF TAX INCENTIVES
SECTION FOUR. ESTIMATING THE COST OF BEHAVIOURAL RESPONSES TO MINING TAX INCENTIVES
SECTION FIVE. TESTING COST ESTIMATES
CONCLUSIONS AND BEST PRACTICES

15
TAX INCENTIVES IN MINING: MINIMISING RISKS TO REVENUE
The main outputs from the Benchmark, Incentive, and Behavioural worksheets (government revenue, government indicators, project returns and project indicators) are exported to:
• The Dashboard worksheet, where they are used in the presentation of headline results.
• The Sensitivity worksheet, where the results are shown across a range of prices, discount rates and cut-off grades.
• The Impacts worksheet, where they are used to estimate direct effects, indirect effects and total effects (see below).
• The Results, Costing and Scorecard worksheets, where they are presented in pre-formatted tables and charts.
Figure 7. Data Flows Through the Benchmark, Incentive, and Behavioural Worksheets
INTRODUCTION
SECTION ONE. A FRAMEWORK FOR MODELLING BEHAVIOURAL RESPONSES TO MINING TAX INCENTIVES
SECTION TWO. THE IGF MINING TAX INCENTIVES FINANCIAL MODEL
SECTION THREE. ESTIMATING THE DIRECT COST OF TAX INCENTIVES
SECTION FOUR. ESTIMATING THE COST OF BEHAVIOURAL RESPONSES TO MINING TAX INCENTIVES
SECTION FIVE. TESTING COST ESTIMATES
CONCLUSIONS AND BEST PRACTICES

16
TAX INCENTIVES IN MINING: MINIMISING RISKS TO REVENUE
d) The Impacts Worksheet
The Impacts worksheet takes outputs from the Benchmark, Incentive, and Behavioural worksheets and calculates the difference between them to estimate the impact of tax incentives and behavioural responses:
• Direct effects are calculated as Incentive outputs minus Benchmark outputs
• Behavioural effects are calculated as Incentive + behaviour outputs minus Incentive outputs
• Total effects are the sum of direct and behavioural effects, which is arithmetically identical to incentive + behaviour outputs minus benchmark outputs
The main outputs from the Impacts worksheet (direct effects, behavioural effects and total effects on key government and project metrics) are exported to:
• The Dashboard worksheet, where they are used in the presentation of headline results.
• The Sensitivity worksheet, where the results are shown across a range of prices, discount rates and cut-off grades.
• The Results, Costing and Scorecard worksheets, where they are presented in pre-formatted tables and charts.
Figure 8. Data Flows Through the Impacts Worksheet
INTRODUCTION
SECTION ONE. A FRAMEWORK FOR MODELLING BEHAVIOURAL RESPONSES TO MINING TAX INCENTIVES
SECTION TWO. THE IGF MINING TAX INCENTIVES FINANCIAL MODEL
SECTION THREE. ESTIMATING THE DIRECT COST OF TAX INCENTIVES
SECTION FOUR. ESTIMATING THE COST OF BEHAVIOURAL RESPONSES TO MINING TAX INCENTIVES
SECTION FIVE. TESTING COST ESTIMATES
CONCLUSIONS AND BEST PRACTICES
17
TAX INCENTIVES IN MINING: MINIMISING RISKS TO REVENUE
e) Chart Data Worksheet
The Chart Data worksheet is used to generate the charts found on the Dashboard and Results worksheets. Data for the charts are imported from the main working sheets and the title and labels for charts are entered here.
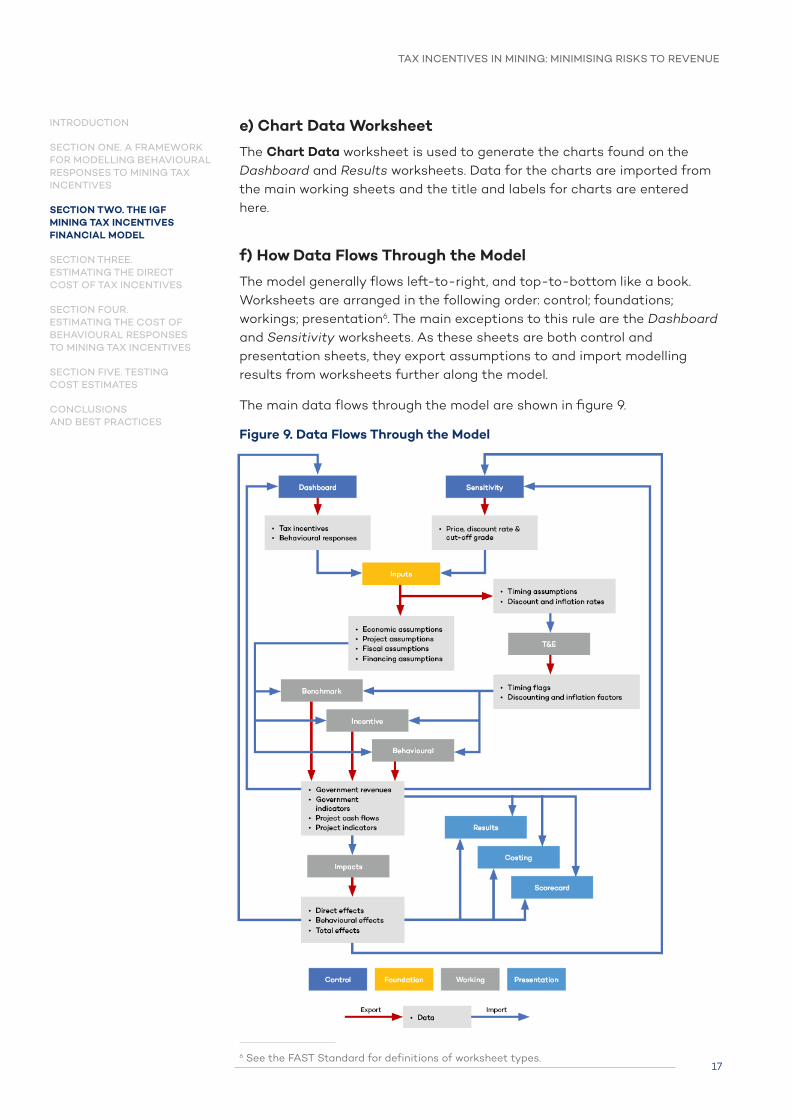
f) How Data Flows Through the Model
The model generally flows left-to-right, and top-to-bottom like a book. Worksheets are arranged in the following order: control; foundations; workings; presentation6. The main exceptions to this rule are the Dashboard and Sensitivity worksheets. As these sheets are both control and presentation sheets, they export assumptions to and import modelling results from worksheets further along the model.
The main data flows through the model are shown in figure 9.
Figure 9. Data Flows Through the Model
6 See the FAST Standard for definitions of worksheet types.
INTRODUCTION
SECTION ONE. A FRAMEWORK FOR MODELLING BEHAVIOURAL RESPONSES TO MINING TAX INCENTIVES
SECTION TWO. THE IGF MINING TAX INCENTIVES FINANCIAL MODEL
SECTION THREE. ESTIMATING THE DIRECT COST OF TAX INCENTIVES
SECTION FOUR. ESTIMATING THE COST OF BEHAVIOURAL RESPONSES TO MINING TAX INCENTIVES
SECTION FIVE. TESTING COST ESTIMATES
CONCLUSIONS AND BEST PRACTICES
18
TAX INCENTIVES IN MINING: MINIMISING RISKS TO REVENUE
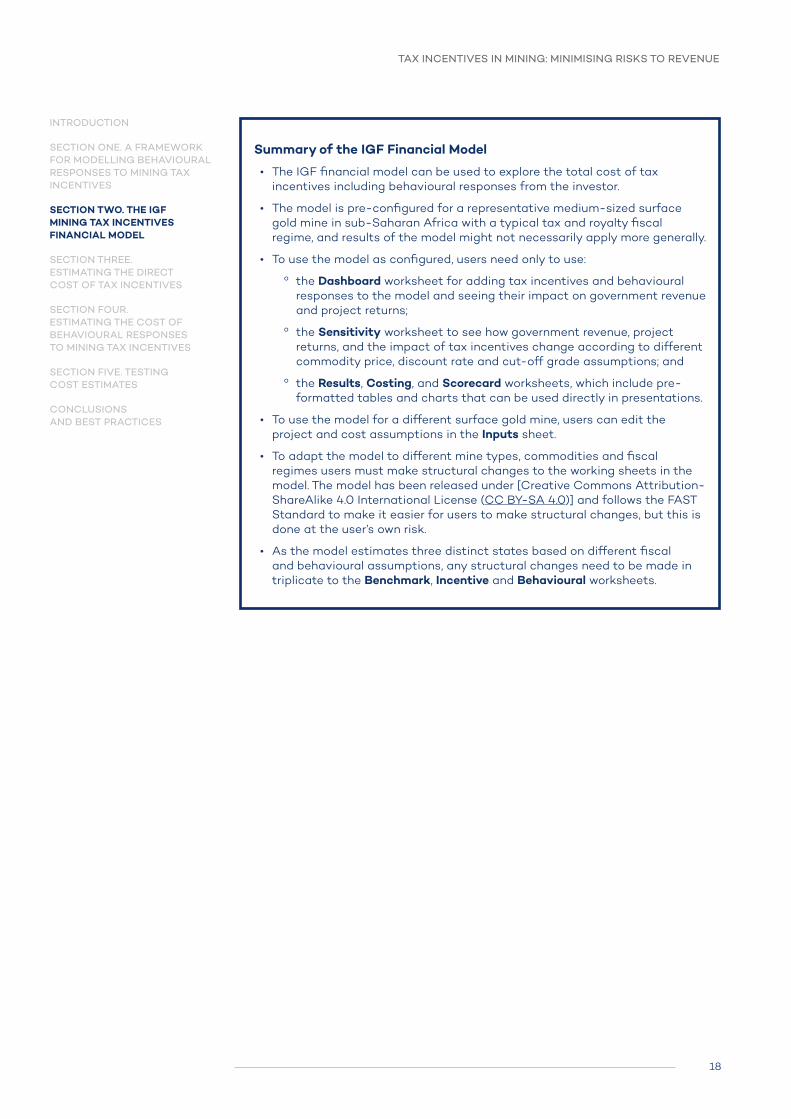
Summary of the IGF Financial Model
• The IGF financial model can be used to explore the total cost of tax incentives including behavioural responses from the investor.
• The model is pre-configured for a representative medium-sized surface gold mine in sub-Saharan Africa with a typical tax and royalty fiscal regime, and results of the model might not necessarily apply more generally.
• To use the model as configured, users need only to use:
º the Dashboard worksheet for adding tax incentives and behavioural responses to the model and seeing their impact on government revenue and project returns;
º the Sensitivity worksheet to see how government revenue, project returns, and the impact of tax incentives change according to different commodity price, discount rate and cut-off grade assumptions; and
º the Results, Costing, and Scorecard worksheets, which include pre-formatted tables and charts that can be used directly in presentations.
• To use the model for a different surface gold mine, users can edit the project and cost assumptions in the Inputs sheet.
• To adapt the model to different mine types, commodities and fiscal regimes users must make structural changes to the working sheets in the model. The model has been released under [Creative Commons Attribution-ShareAlike 4.0 International License (CC BY-SA 4.0)] and follows the FAST Standard to make it easier for users to make structural changes, but this is done at the user’s own risk.
• As the model estimates three distinct states based on different fiscal and behavioural assumptions, any structural changes need to be made in triplicate to the Benchmark, Incentive and Behavioural worksheets.
INTRODUCTION
SECTION ONE. A FRAMEWORK FOR MODELLING BEHAVIOURAL RESPONSES TO MINING TAX INCENTIVES
SECTION TWO. THE IGF MINING TAX INCENTIVES FINANCIAL MODEL
SECTION THREE. ESTIMATING THE DIRECT COST OF TAX INCENTIVES
SECTION FOUR. ESTIMATING THE COST OF BEHAVIOURAL RESPONSES TO MINING TAX INCENTIVES
SECTION FIVE. TESTING COST ESTIMATES
CONCLUSIONS AND BEST PRACTICES

SECTION THREE: ESTIMATING THE DIRECT COST OF TAX INCENTIVES

20
TAX INCENTIVES IN MINING: MINIMISING RISKS TO REVENUE
Section Three. Estimating the Direct Cost of Tax IncentivesThe direct cost of a tax incentive is the difference between government revenue under the benchmark fiscal regime and revenues with the tax incentive included. When combining more than one incentive, the costs are estimated by entering all incentives into the model at the same time.
Estimating the Direct Cost of a Single Tax IncentiveThis example uses the IGF financial model to estimate the direct cost of an import duty exemption.
Under the benchmark fiscal regime (Table 4) and a gold price of $1,250/oz, total government revenues are estimated at $341.6 million in real terms, with import duties contributing $63.8 million (Table 5).
The import duty exemption is entered to the Dashboard worksheet under the Incentive regime by changing the effective duty rates on capital and consumables to 0 per cent (see Table 6)7.
7 The model allows users to set two rates for most fiscal instruments – a standard rate and an incentive rate – and a time-period for which the incentive rate applies, before reverting to the standard rate. An alternative way to enter the import duty exemption into the model is to set the incentive rate at 0 per cent and the incentive period at 25 years (the entire time-span for the model).
Table 4. Assumptions for the Benchmark Fiscal Regime
FISCAL ASSUMPTIONS Units Benchmark
Signature bonus
Signature bonus amount M$ 5
Import duties
Effective duty rate on capital % 10%
Effective duty rate on consumables
% 10%
Royalty
Royalty rate % 5%
Corporate income tax
Income tax rate % 30%
Loss carry forward limit years 4
Depreciation rate years 10
Resource rent tax
Resource rent tax rate % 20%
Resource rent tax uplift % 15%
Withholding taxes
WHT on services rate % 15%
WHT on interest rate % 15%
WHT on dividends rate % 10%
Table 5. Government Revenue under the Benchmark Fiscal Regime
INTRODUCTION
SECTION ONE. A FRAMEWORK FOR MODELLING BEHAVIOURAL RESPONSES TO MINING TAX INCENTIVES
SECTION TWO. THE IGF MINING TAX INCENTIVES FINANCIAL MODEL
SECTION THREE. ESTIMATING THE DIRECT COST OF TAX INCENTIVES
SECTION FOUR. ESTIMATING THE COST OF BEHAVIOURAL RESPONSES TO MINING TAX INCENTIVES
SECTION FIVE. TESTING COST ESTIMATES
CONCLUSIONS AND BEST PRACTICES
$ million, real terms
Benchmark revenue Total
Signature bonus 5.0
Import duties 63.8
Royalty 110.8
Income tax 112.3
Resource rent tax 0.0
Withholding on services 19.0
Withholding on interest 6.4
Withholding on dividends 24.3Benchmark revenue 341.6

21
TAX INCENTIVES IN MINING: MINIMISING RISKS TO REVENUE
Table 6. Assumptions for Import Duty Exemption
FISCAL ASSUMPTIONS Units Benchmark Incentive
Import duties
Effective duty rate on capital % 10% 0%
Effective duty rate on consumables % 10% 0%
The model now calculates:
• Benchmark revenue with import duties at 10 per cent
• Incentive revenue with import duties at 0 per cent
• Direct costs as incentive revenue less benchmark revenue
The direct cost is estimated at $40.2 million in real terms (Table 7), less than the $63.8 million estimated as import duties under the benchmark fiscal regime.
Table 7. Cost of Import Duty Exemption
$ million, real terms
Total cost in real terms Total
Benchmark revenue 341.6
Incentive + behaviour revenue 301.4
Total cost -40.2
The breakdown of impacts on the Costing worksheet shows why total cost from the import duty exemption is less than total import duties estimated under the benchmark fiscal regime (Table 8).
Table 8. Costing of Import Duty Exemption $ million, real terms
Real terms
Benchmarka
Direct costsb
Behavioural costs
c
Total costb+c
Incentive +behavioural
a+b+c
Signature bonus 5.5 0.0 0.0 0.0 5.0
Import duties A 63.8 -63.8 0.0 -63.8 0.0
Royalty 110.8 0.0 0.0 0.0 110.8
Income tax B 112.3 19.2 0.0 19.2 131.5
Resource rent tax 0.0 0.0 0.0 0.0 0.0
WHT on services 19.0 0.0 0.0 0.0 19.0
WHT on interest C 6.4 -0.2 0.0 -0.2 6.2
WHT dividends D 24.3 4.6 0.0 4.6 28.9
Revenue E 341.6 -40.2 0.0 -40.2 301.4
% of benchmark -11.8% 0.0% -11.8% 88.2%
Note: figures may not sum due to rounding
INTRODUCTION
SECTION ONE. A FRAMEWORK FOR MODELLING BEHAVIOURAL RESPONSES TO MINING TAX INCENTIVES
SECTION TWO. THE IGF MINING TAX INCENTIVES FINANCIAL MODEL
SECTION THREE. ESTIMATING THE DIRECT COST OF TAX INCENTIVES
SECTION FOUR. ESTIMATING THE COST OF BEHAVIOURAL RESPONSES TO MINING TAX INCENTIVES
SECTION FIVE. TESTING COST ESTIMATES
CONCLUSIONS AND BEST PRACTICES

22
TAX INCENTIVES IN MINING: MINIMISING RISKS TO REVENUE
The difference between estimated revenue from import duties under the benchmark regime and the direct cost of an exemption from import duties is explained by the impact on other tax bases:
(A) As the project is now exempt from import duties, the entire $63.8 million from import duties is lost due to the incentive
(B) As import duties are a cost to the mining company, the exemption reduces operating costs, which increases table income and therefore income tax revenue
(C) Exempting import duties on capital also decreases the project’s financing requirement, so less is borrowed, debt interest reduced and withholding tax on interest marginally lower
(D) Higher profits after tax leads to higher dividend payments, increasing revenues from withholding tax on dividends
(E) The total direct effects are the sum of these
Estimating the Combined Cost of Multiple Tax Incentives
The combined cost of multiple tax incentives should be estimated by entering all incentives into the model simultaneously. This is necessary because adding together the individual costs of incentives may not capture the impact of one tax instrument on the base of others.
The assumptions for an import duty exemption, 10-year income tax holiday and exemption from withholding tax on dividends are set out in Table 9.
Table 9. Assumptions for Multiple Tax Incentives
FISCAL ASSUMPTIONS Units Benchmark Incentive
Import duties
Effective duty rate on capital % 10% 0%
Effective duty rate on consumables % 10% 0%
Corporate Income tax
Income tax rate % 30% 30%
Income tax holiday rate % 0% 0%
Income tax holiday period years 0 10
Withholding taxes
WHT on dividends standard rate % 10% 0%
The direct cost of each incentive is first estimated individually (Tables 10, 11 and 12).
INTRODUCTION
SECTION ONE. A FRAMEWORK FOR MODELLING BEHAVIOURAL RESPONSES TO MINING TAX INCENTIVES
SECTION TWO. THE IGF MINING TAX INCENTIVES FINANCIAL MODEL
SECTION THREE. ESTIMATING THE DIRECT COST OF TAX INCENTIVES
SECTION FOUR. ESTIMATING THE COST OF BEHAVIOURAL RESPONSES TO MINING TAX INCENTIVES
SECTION FIVE. TESTING COST ESTIMATES
CONCLUSIONS AND BEST PRACTICES
23
TAX INCENTIVES IN MINING: MINIMISING RISKS TO REVENUE
Table 10. Cost of Import Duty Exemption
$ million, real terms
Total cost in real terms Total
Benchmark revenue 341.6
Incentive + behaviour revenue 301.4
Total cost -40.2
Table 11. Cost of 10-year Income Tax Holiday
$ million, real terms
Total cost in real terms Total
Benchmark revenue 341.6
Incentive + behaviour revenue 318.2
Total cost -23.4
Table 12. Cost of WHT on Dividends Exemption
$ million, real terms
Total cost in real terms Total
Benchmark revenue 341.6
Incentive + behaviour revenue 317.3
Total cost -24.3
Adding the individual costs of these incentives would imply a total cost of $87.9 million in real terms. However, entering the three incentives into the model simultaneously gives an estimate of total cost from the three incentives combined of $106.6 million (Table 13).
Table 13. Combined Cost of Import Duty Exemption, 10-year Tax Holiday and WHT on Interest Exemption
$ million, real terms
Total cost in real terms Total
Benchmark revenue 341.6
Incentive + behaviour revenue 235.0
Total cost -106.6
The combined cost is larger than the sum of the individual costs due to the way the tax incentives interact. This can be seen on the Costing worksheet (Table 14).
INTRODUCTION
SECTION ONE. A FRAMEWORK FOR MODELLING BEHAVIOURAL RESPONSES TO MINING TAX INCENTIVES
SECTION TWO. THE IGF MINING TAX INCENTIVES FINANCIAL MODEL
SECTION THREE. ESTIMATING THE DIRECT COST OF TAX INCENTIVES
SECTION FOUR. ESTIMATING THE COST OF BEHAVIOURAL RESPONSES TO MINING TAX INCENTIVES
SECTION FIVE. TESTING COST ESTIMATES
CONCLUSIONS AND BEST PRACTICES

24
TAX INCENTIVES IN MINING: MINIMISING RISKS TO REVENUE
Table 14. Detailed Costing of Import Duty Exemption, 10-year Tax Holiday and WHT on Interest Exemption
$ million, real terms
Real terms
Benchmarka
Direct costsb
Behavioural costs
c
Total costb+c
Incentive +behavioural
a+b+c
Signature bonus 5.0 0.0 0.0 0.0 0.0
Import duties A 63.8 -63.8 0.0 -63.8 0.0
Royalty 110.8 0.0 0.0 0.0 110.8
Income tax B 112.3 -18.3 0.0 -18.3 94.0
Resource rent tax 0.0 0.0 0.0 0.0 0.0
WHT on services 19.0 0.0 0.0 0.0 19.0
WHT on interest C 6.4 -0.2 0.0 -0.2 6.2
WHT dividends D 24.3 -24.3 0.0 -24.3 0.0
Revenue E 341.6 -106.6 0.0 -106.6 235.0
% of benchmark -31.2% 0.0% -31.2% 68.8%
Note: figures may not sum due to rounding.
The combined cost is greater than the sum of the individual costs due to interactions between incentives:
(A) The entire $63.8 million of import duties is lost due to the exemption.
(B) While this increases profit, which would partially offset the cost of the import duty exemption, the 10-year income tax holiday means those profits also go untaxed for the first 10 years of the project.
(C) As before, there is a small impact on the financing requirement and therefore lower WHT on interest.
(D) Higher profits after tax from the import duty exemption and tax holiday means larger dividend payments, which also go untaxed due to the exemption from withholding tax.
(E) The total cost is $106.6 million, greater than the sum of the individual incentives when applied separately.
This example illustrates how some combinations of tax incentives can combine to erode the tax base. This combination of incentives both increases profits (through the import duty exemption) and allows those profits to go entirely untaxed for 10 years through the combination of the income tax holiday and exemption from withholding on dividends which means distributions to shareholders are also untaxed. Combining income tax holidays with exemptions or reductions in withholding on dividends is a risky combination for host governments that can lead to significant profit shifting.
INTRODUCTION
SECTION ONE. A FRAMEWORK FOR MODELLING BEHAVIOURAL RESPONSES TO MINING TAX INCENTIVES
SECTION TWO. THE IGF MINING TAX INCENTIVES FINANCIAL MODEL
SECTION THREE. ESTIMATING THE DIRECT COST OF TAX INCENTIVES
SECTION FOUR. ESTIMATING THE COST OF BEHAVIOURAL RESPONSES TO MINING TAX INCENTIVES
SECTION FIVE. TESTING COST ESTIMATES
CONCLUSIONS AND BEST PRACTICES

25
TAX INCENTIVES IN MINING: MINIMISING RISKS TO REVENUE
Estimating the Individual Contributions of Multiple Tax Incentives
Entering all incentives into the model simultaneously gives the combined cost but not the cost of each tax incentive. The individual contribution of each incentive can be determined by estimating costs sequentially, incorporating the previous incentive(s) into the benchmark fiscal regime for the subsequent cost estimate to isolate the impact of the latest incentive.
Table 15: Benchmark Fiscal Regimes for Costings of Multiple Tax Incentives
Tax Incentive Benchmark Regime for Cost Estimate
1st Tax Incentive Benchmark Regime
2nd Tax Incentive Benchmark Regime + 1st Tax Incentive
3rd Tax Incentive Benchmark Regime + 1st Tax Incentive + 2nd Tax Incentive
nth Tax Incentive Benchmark Regime + 1st Tax Incentive + 2nd Tax Incentive + … + nth-1 Tax Incentive
A scorecard is a table showing the costs of multiple tax incentives estimated sequentially, summing to the total cost of the combined incentives on the bottom line (Table 16).
Table 16. Scorecard of Multiple Tax Incentives
Total cost in real terms
Real (M$) NPV (M$)
Import duty exemption -40.2 -20.8
10-year income tax holiday -33.7 -15.8
WHT on dividends exemption -32.6 -9.1
Total cost of incentives -106.6 -45.8
The order in which costs of incentives is estimated in a scorecard impacts on their individual cost estimates. If the costs of the above incentives are estimated in a different order their individual scorecard costs would change, but the total cost would remain $106.6 million. Users should therefore consider the order in which incentives are costed and the impact of that on presentation.
Summary of Estimating the Direct Costs of Tax Incentives
• The direct cost of an incentive is the difference between government revenue under the benchmark fiscal regime and government revenue with the tax incentive incorporated.
• Tax incentives are usually entered to the IGF Financial Model by changing the standard tax rate or setting an incentive tax rate and incentive rate period on the Dashboard.
• The combined cost of multiple tax incentives is modelled by entering all incentives into the model at the same time, but can’t usually be estimated by summing the individual costs.
• The individual costs of combined tax incentives can be estimated sequentially, incorporating the previous incentive(s) into the benchmark fiscal regime used to estimate the cost of the subsequent incentive.
• A scorecard is a table of the costs of multiple tax incentives estimated sequentially, summing to the combined cost on the bottom line, but note that the order in which costs are estimated changes the individual cost estimates in the scorecard.
INTRODUCTION
SECTION ONE. A FRAMEWORK FOR MODELLING BEHAVIOURAL RESPONSES TO MINING TAX INCENTIVES
SECTION TWO. THE IGF MINING TAX INCENTIVES FINANCIAL MODEL
SECTION THREE. ESTIMATING THE DIRECT COST OF TAX INCENTIVES
SECTION FOUR. ESTIMATING THE COST OF BEHAVIOURAL RESPONSES TO MINING TAX INCENTIVES
SECTION FIVE. TESTING COST ESTIMATES
CONCLUSIONS AND BEST PRACTICES
SECTION FOUR: ESTIMATING
THE COST OF BEHAVIOURAL
RESPONSES TO MINING TAX
INCENTIVES

27
TAX INCENTIVES IN MINING: MINIMISING RISKS TO REVENUE
Section Four. Estimating the Cost of Behavioural Responses to Mining Tax IncentivesTax incentives may cause investors to change their behaviour to maximise the financial benefits beyond what government anticipated, resulting in unintended revenue losses. It is important to capture these behavioural responses in financial models to estimate the additional cost to government.
Detailed guidance on different types of mining tax incentives and their related behavioural responses is provided in Tax Incentives in Mining: Minimising risks to revenue and not repeated here. This guidance focuses on how to incorporate these behavioural responses into financial models and determine reasonable parameters to test the impact on government revenue. Making informed assumptions about behavioural responses requires judgement and is unlikely to be 100 per cent accurate. Even so, it can give an indication of risk and potential orders of magnitude, which can lead to better decisions about the use of tax incentives.
Table 17. Types of Tax Incentives and their Related Behavioural Responses
Tax Incentive Potential Behavioural Response
Income tax holidays Investors may increase their income during the tax-free period by speeding up the rate of production, shifting the profits offshore.
Export processing zones (EPZ)
EPZs may set up competing fiscal regimes between the mineral processing facility and the mine. In response, investors may seek to reduce the mining company’s taxable income by selling ore at below market prices to its related-party smelter, shifting more profit into the lower-taxed entity in the EPZ.
Royalty-based incentives
A royalty holiday may lead investors to shift revenues into the tax-free period, like an income tax holiday. A sliding-scale royalty may encourage tax-planning through mineral price manipulation to avoid falling into a higher royalty bracket, even for sales to unrelated parties.
Withholding tax relief on interest and services
Investors may increase the amount of interest expense, and charges for administrative services paid to foreign affiliates, to shift income tax to offshore affiliates in low-tax jurisdictions.
Cost-based incentives (e.g. accelerated depreciation)
Investors may inflate their capital expenditure (money spent on buildings, equipment and machinery) above what is needed to maximise the tax benefit (‘gold plating’).
Import duty relief Investors may increase the cost of machinery and equipment purchased from related parties to increase deductible expenses for income tax.
INTRODUCTION
SECTION ONE. A FRAMEWORK FOR MODELLING BEHAVIOURAL RESPONSES TO MINING TAX INCENTIVES
SECTION TWO. THE IGF MINING TAX INCENTIVES FINANCIAL MODEL
SECTION THREE. ESTIMATING THE DIRECT COST OF TAX INCENTIVES
SECTION FOUR. ESTIMATING THE COST OF BEHAVIOURAL RESPONSES TO MINING TAX INCENTIVES
SECTION FIVE. TESTING COST ESTIMATES
CONCLUSIONS AND BEST PRACTICES
28
TAX INCENTIVES IN MINING: MINIMISING RISKS TO REVENUE
Tax Incentive Potential Behavioural Response
Fiscal stabilisation (i.e. freezing the mining tax regime)
Combining tax incentives with excessive use of fiscal stability provisions will magnify the adverse impacts of tax incentives, including the unintended consequences, by potentially cutting off government ability to correct mistakes and stem unexpectedly large revenue losses.
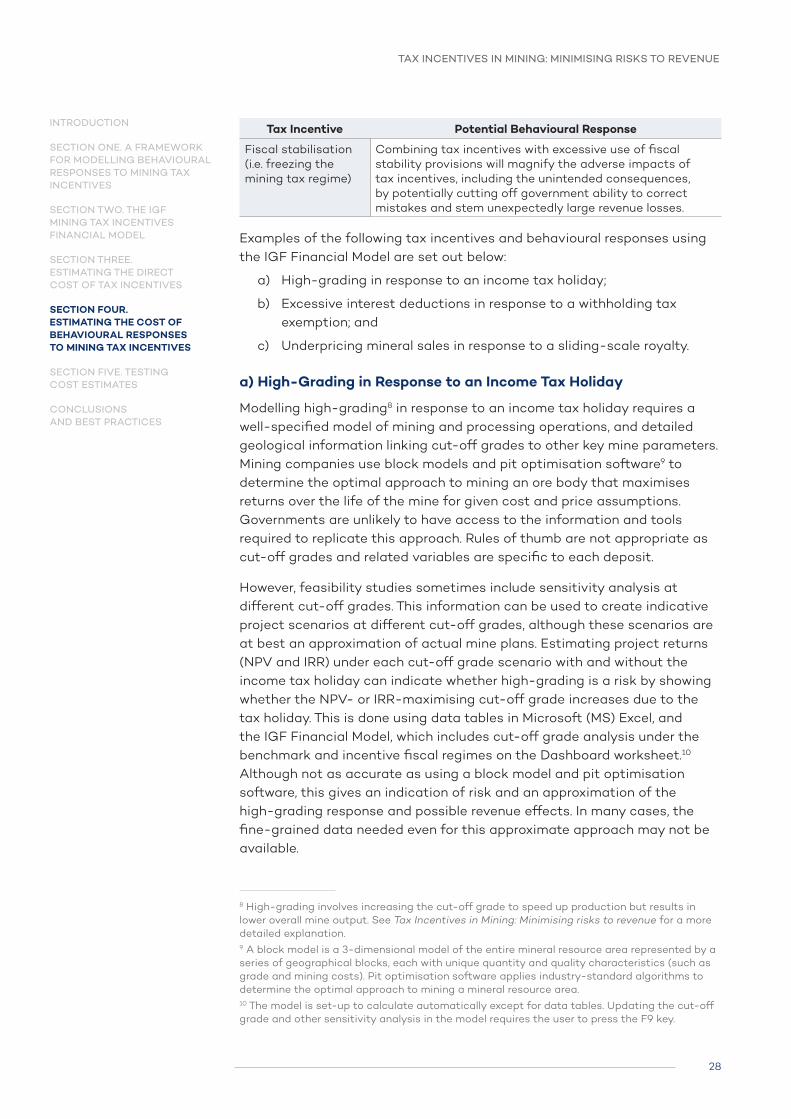
Examples of the following tax incentives and behavioural responses using the IGF Financial Model are set out below:
a) High-grading in response to an income tax holiday;
b) Excessive interest deductions in response to a withholding tax exemption; and
c) Underpricing mineral sales in response to a sliding-scale royalty.
a) High-Grading in Response to an Income Tax Holiday
Modelling high-grading8 in response to an income tax holiday requires a well-specified model of mining and processing operations, and detailed geological information linking cut-off grades to other key mine parameters. Mining companies use block models and pit optimisation software9 to determine the optimal approach to mining an ore body that maximises returns over the life of the mine for given cost and price assumptions. Governments are unlikely to have access to the information and tools required to replicate this approach. Rules of thumb are not appropriate as cut-off grades and related variables are specific to each deposit.
However, feasibility studies sometimes include sensitivity analysis at different cut-off grades. This information can be used to create indicative project scenarios at different cut-off grades, although these scenarios are at best an approximation of actual mine plans. Estimating project returns (NPV and IRR) under each cut-off grade scenario with and without the income tax holiday can indicate whether high-grading is a risk by showing whether the NPV- or IRR-maximising cut-off grade increases due to the tax holiday. This is done using data tables in Microsoft (MS) Excel, and the IGF Financial Model, which includes cut-off grade analysis under the benchmark and incentive fiscal regimes on the Dashboard worksheet.10 Although not as accurate as using a block model and pit optimisation software, this gives an indication of risk and an approximation of the high-grading response and possible revenue effects. In many cases, the fine-grained data needed even for this approximate approach may not be available.
8 High-grading involves increasing the cut-off grade to speed up production but results in lower overall mine output. See Tax Incentives in Mining: Minimising risks to revenue for a more detailed explanation.9 A block model is a 3-dimensional model of the entire mineral resource area represented by a series of geographical blocks, each with unique quantity and quality characteristics (such as grade and mining costs). Pit optimisation software applies industry-standard algorithms to determine the optimal approach to mining a mineral resource area.10 The model is set-up to calculate automatically except for data tables. Updating the cut-off grade and other sensitivity analysis in the model requires the user to press the F9 key.
INTRODUCTION
SECTION ONE. A FRAMEWORK FOR MODELLING BEHAVIOURAL RESPONSES TO MINING TAX INCENTIVES
SECTION TWO. THE IGF MINING TAX INCENTIVES FINANCIAL MODEL
SECTION THREE. ESTIMATING THE DIRECT COST OF TAX INCENTIVES
SECTION FOUR. ESTIMATING THE COST OF BEHAVIOURAL RESPONSES TO MINING TAX INCENTIVES
SECTION FIVE. TESTING COST ESTIMATES
CONCLUSIONS AND BEST PRACTICES

29
TAX INCENTIVES IN MINING: MINIMISING RISKS TO REVENUE
The representative gold mine used in the IGF Financial Model includes different scenarios for the quantity of ore, average grade, and strip ratio11 as set out in Table 18.
Table 18. Scenarios at Different Cut-Off Grades in the IGF Financial Model
Cut-off grade (Au (g/t))
Quantity of ore (Mt)
Average grade (Au (g/t))
Strip ratio (waste:ore)
1.00 32.6 1.97 9.0
0.90 36.7 1.85 7.9
0.80 40.7 1.75 7.0
0.70 44.9 1.66 6.3
0.60 48.8 1.58 5.7
0.50 51.9 1.52 5.3
0.40 54.2 1.47 5.0
0.30 55.8 1.44 4.9
0.20 56.6 1.42 4.8
0.10 57.0 1.42 4.7
Increasing the cut-off grade has the following effect on the mine operations and pre-tax cash flows in the model:
• the overall quantity of ore decreases, as more rock falls below the cut-off grade and is treated as waste rather than ore sent for processing, which reduces the life of the mine;
• the average grade of ore increases, meaning the amount of gold recovered each year at full processing capacity increases, which increases annual revenue; and
• the amount of waste increases, which increases mining operating costs.
Entering the income tax holiday into the IGF Financial Model (Table 19) means the NPV and IRR at each cut-off grade using the benchmark and incentive fiscal regimes can be estimated (Figure 10).
Table 19. Assumptions for Income Tax Holiday
FISCAL ASSUMPTIONS Units Benchmark Incentive
Corporate Income tax
Income tax rate % 30% 30%
Income tax holiday rate % 0% 0%
Income tax holiday period years 0 10
11 The ratio of the volume of waste (or ‘overburden’) required to be mined per unit of valuable ore, expressed as waste:ore. E.g. a strip ratio of 3:1 requires 3 tonnes of waste to be mined per 1 tonne of ore.
INTRODUCTION
SECTION ONE. A FRAMEWORK FOR MODELLING BEHAVIOURAL RESPONSES TO MINING TAX INCENTIVES
SECTION TWO. THE IGF MINING TAX INCENTIVES FINANCIAL MODEL
SECTION THREE. ESTIMATING THE DIRECT COST OF TAX INCENTIVES
SECTION FOUR. ESTIMATING THE COST OF BEHAVIOURAL RESPONSES TO MINING TAX INCENTIVES
SECTION FIVE. TESTING COST ESTIMATES
CONCLUSIONS AND BEST PRACTICES

30
TAX INCENTIVES IN MINING: MINIMISING RISKS TO REVENUE
Figure 10. NPV at Different Cut-Off Grades Under the Benchmark and Incentive Fiscal Regimes
The cut-off grade analysis suggests there is a risk of high-grading in response to the income tax holiday, as the NPV-maximising cut-off grade increases from 0.7 Au g/t to 0.8 Au g/t. The possible high-grading behavioural response is added to the model (Table 20).
Table 20. Behavioural Assumptions for High-Grading in Response to an Income Tax Holiday
BEHAVIOURAL ASSUMPTIONS Units Benchmark Behavioural
Production
Cut-off grade Au (g/t) 0.70 0.80
The IGF Financial Model estimates the direct cost of the income tax holiday and the cost of the high-grading behavioural response (Table 21).
Table 21. Cost of Income Tax Holiday with High-Grading Behavioural Response
$ million, real terms
Total cost in real terms Total
Benchmark revenue 341.6
Incentive + behaviour revenue 294.7
Total cost -46.9
of which:
Direct cost: -23.4
Behavioural cost -23.5
Note: figures may not sum due to rounding.
The direct cost of the income tax holiday is $23.4 million in real terms, but the high-grading response results in a further revenue loss of $23.5 million, giving a total cost of $46.9 million in real terms. The contribution of direct and behavioural effects is shown in figure 11.
INTRODUCTION
SECTION ONE. A FRAMEWORK FOR MODELLING BEHAVIOURAL RESPONSES TO MINING TAX INCENTIVES
SECTION TWO. THE IGF MINING TAX INCENTIVES FINANCIAL MODEL
SECTION THREE. ESTIMATING THE DIRECT COST OF TAX INCENTIVES
SECTION FOUR. ESTIMATING THE COST OF BEHAVIOURAL RESPONSES TO MINING TAX INCENTIVES
SECTION FIVE. TESTING COST ESTIMATES
CONCLUSIONS AND BEST PRACTICES
31
TAX INCENTIVES IN MINING: MINIMISING RISKS TO REVENUE
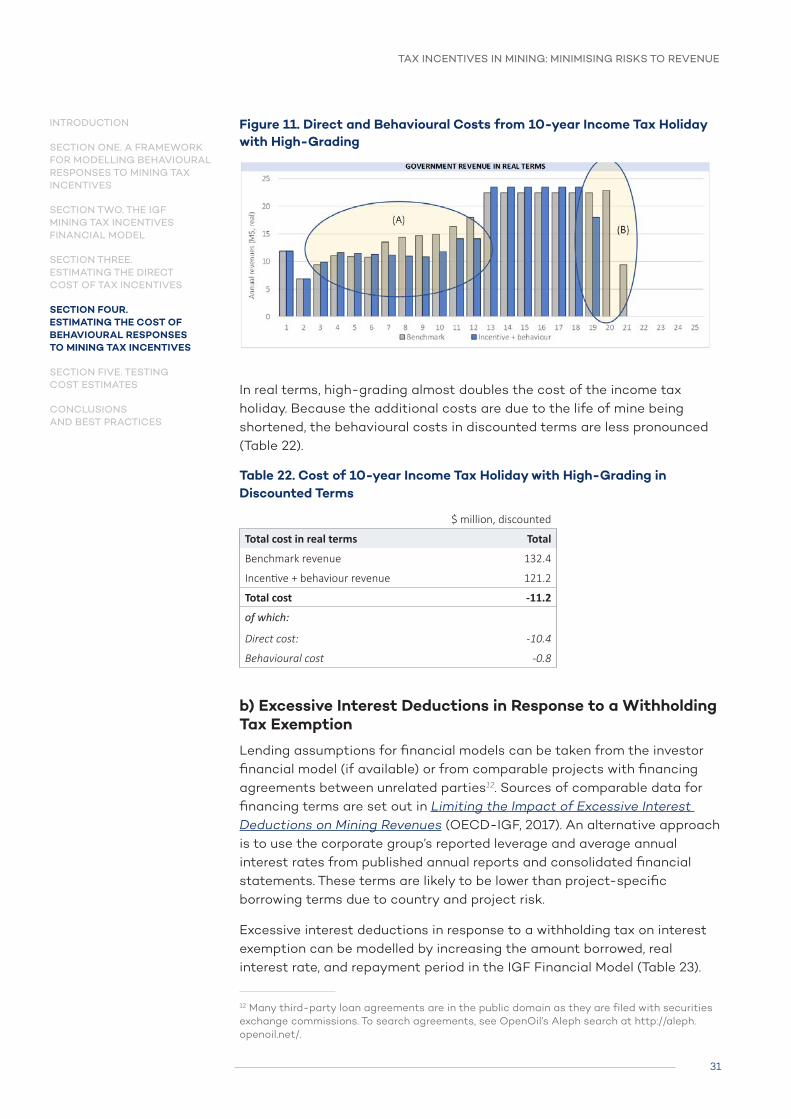
Figure 11. Direct and Behavioural Costs from 10-year Income Tax Holiday with High-Grading
In real terms, high-grading almost doubles the cost of the income tax holiday. Because the additional costs are due to the life of mine being shortened, the behavioural costs in discounted terms are less pronounced (Table 22).
Table 22. Cost of 10-year Income Tax Holiday with High-Grading in Discounted Terms
$ million, discounted
Total cost in real terms Total
Benchmark revenue 132.4
Incentive + behaviour revenue 121.2
Total cost -11.2
of which:
Direct cost: -10.4
Behavioural cost -0.8
b) Excessive Interest Deductions in Response to a Withholding Tax Exemption
Lending assumptions for financial models can be taken from the investor financial model (if available) or from comparable projects with financing agreements between unrelated parties12. Sources of comparable data for financing terms are set out in Limiting the Impact of Excessive Interest Deductions on Mining Revenues (OECD-IGF, 2017). An alternative approach is to use the corporate group’s reported leverage and average annual interest rates from published annual reports and consolidated financial statements. These terms are likely to be lower than project-specific borrowing terms due to country and project risk.
Excessive interest deductions in response to a withholding tax on interest exemption can be modelled by increasing the amount borrowed, real interest rate, and repayment period in the IGF Financial Model (Table 23).
12 Many third-party loan agreements are in the public domain as they are filed with securities exchange commissions. To search agreements, see OpenOil’s Aleph search at http://aleph.openoil.net/.
INTRODUCTION
SECTION ONE. A FRAMEWORK FOR MODELLING BEHAVIOURAL RESPONSES TO MINING TAX INCENTIVES
SECTION TWO. THE IGF MINING TAX INCENTIVES FINANCIAL MODEL
SECTION THREE. ESTIMATING THE DIRECT COST OF TAX INCENTIVES
SECTION FOUR. ESTIMATING THE COST OF BEHAVIOURAL RESPONSES TO MINING TAX INCENTIVES
SECTION FIVE. TESTING COST ESTIMATES
CONCLUSIONS AND BEST PRACTICES
32
TAX INCENTIVES IN MINING: MINIMISING RISKS TO REVENUE
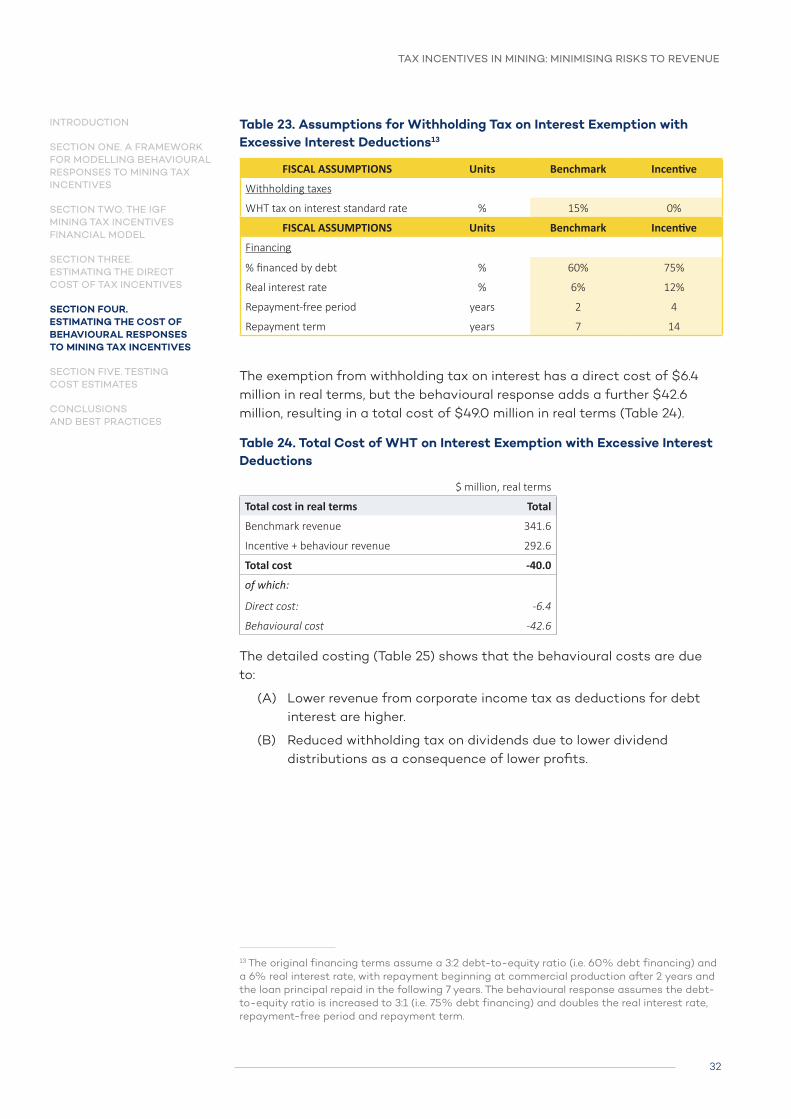
Table 23. Assumptions for Withholding Tax on Interest Exemption with Excessive Interest Deductions13
FISCAL ASSUMPTIONS Units Benchmark Incentive
Withholding taxes
WHT tax on interest standard rate % 15% 0%
FISCAL ASSUMPTIONS Units Benchmark Incentive
Financing
% financed by debt % 60% 75%
Real interest rate % 6% 12%
Repayment-free period years 2 4
Repayment term years 7 14
The exemption from withholding tax on interest has a direct cost of $6.4 million in real terms, but the behavioural response adds a further $42.6 million, resulting in a total cost of $49.0 million in real terms (Table 24).
Table 24. Total Cost of WHT on Interest Exemption with Excessive Interest Deductions
$ million, real terms
Total cost in real terms Total
Benchmark revenue 341.6
Incentive + behaviour revenue 292.6
Total cost -40.0
of which:
Direct cost: -6.4
Behavioural cost -42.6
The detailed costing (Table 25) shows that the behavioural costs are due to:
(A) Lower revenue from corporate income tax as deductions for debt interest are higher.
(B) Reduced withholding tax on dividends due to lower dividend distributions as a consequence of lower profits.
13 The original financing terms assume a 3:2 debt-to-equity ratio (i.e. 60% debt financing) and a 6% real interest rate, with repayment beginning at commercial production after 2 years and the loan principal repaid in the following 7 years. The behavioural response assumes the debt-to-equity ratio is increased to 3:1 (i.e. 75% debt financing) and doubles the real interest rate, repayment-free period and repayment term.
INTRODUCTION
SECTION ONE. A FRAMEWORK FOR MODELLING BEHAVIOURAL RESPONSES TO MINING TAX INCENTIVES
SECTION TWO. THE IGF MINING TAX INCENTIVES FINANCIAL MODEL
SECTION THREE. ESTIMATING THE DIRECT COST OF TAX INCENTIVES
SECTION FOUR. ESTIMATING THE COST OF BEHAVIOURAL RESPONSES TO MINING TAX INCENTIVES
SECTION FIVE. TESTING COST ESTIMATES
CONCLUSIONS AND BEST PRACTICES

33
TAX INCENTIVES IN MINING: MINIMISING RISKS TO REVENUE
Table 25. Cost of Withholding Tax on Interest Exemption with Excessive Interest Deductions
$ million, real terms
Real terms
Benchmarka
Direct costsb
Behavioural costs
c
Total costb+c
Incentive +behavioural
a+b+c
Signature bonus 5.0 0.0 0.0 0.0 5.0
Import duties 63.8 0.0 0.0 0.0 63.8
Royalty 110.8 0.0 0.0 0.0 110.8
Income tax A 112.3 0.0 -29.2 -29.2 83.1
Resource rent tax 0.0 0.0 0.0 0.0 0.0
WHT on services 19.0 0.0 0.0 0.0 19.0
WHT on interest 6.4 -6.4 0.0 -6.4 0.0
WHT dividends B 24.3 0.0 -13.4 -13.4 10.9
Revenue 341.6 -6.4 -42.6 -19.0 292.6
% of benchmark -1.9% -12.5% -14.3% 85.7%
Note: figures may not sum due to rounding.
Withholding tax on interest can act as protection against excessive interest deductions by imposing a direct financial cost on increasing interest payments. Had tax been withheld at 15 per cent on debt interest the total cost from excessive interest deductions would have been only $18.2 million in real terms (Table 26), significantly less than the $42.6 million estimated with the exemption in place.
Table 26. Cost of Excessive Interest Deductions with a 15% WHT on Interest
$ million, real terms
Total cost in real terms Total
Benchmark revenue 341.6
Incentive + behaviour revenue 323.4
Total cost -18.2
of which:
Direct cost: 0.0
Behavioural cost -18.2
c) Underpricing Mineral Sales in Response to a Sliding-Scale Royalty
Sliding-scale royalties that use an ‘aggregate structure’ (i.e. where the royalty rate steps up or down depending on which band the price is in) create an incentive to underprice minerals near to the rate threshold to pay royalties at the lower rate14. This incentive exists even for transactions between unrelated parties, as both buyer and seller can benefit from paying a lower royalty within a price range just above the threshold for
14 This incentive does not exist for an incremental sliding-scale royalty, where the rate is applied within each price band rather than to the aggregate value.
INTRODUCTION
SECTION ONE. A FRAMEWORK FOR MODELLING BEHAVIOURAL RESPONSES TO MINING TAX INCENTIVES
SECTION TWO. THE IGF MINING TAX INCENTIVES FINANCIAL MODEL
SECTION THREE. ESTIMATING THE DIRECT COST OF TAX INCENTIVES
SECTION FOUR. ESTIMATING THE COST OF BEHAVIOURAL RESPONSES TO MINING TAX INCENTIVES
SECTION FIVE. TESTING COST ESTIMATES
CONCLUSIONS AND BEST PRACTICES

34
TAX INCENTIVES IN MINING: MINIMISING RISKS TO REVENUE
a rate change – buyers because they pay less, and sellers because they receive more net of royalties paid at the lower rate. This creates a price ‘dead zone’ just above each rate threshold where transactions are unlikely to take place because both parties benefit from reducing the price to the threshold limit.
In the IGF Financial Model, the royalty type is set to 3 on the Dashboard tab to select sliding-scale (aggregate structure). The rates and thresholds are entered on the inputs sheet as per Table 27.
Table 27. Rates and Thresholds for Sliding-Scale Royalty
Band Lower Limit ($/oz) Upper Limit ($/oz) Royalty Rate (%)
1 0 500 1%
2 500 750 2%
3 750 1,000 3%
4 1,000 1,250 4%
5 1.250 1,500 5%
6 1,500 N/A 6%
The dead zone above each boundary can be calculated by comparing the net price after royalty just above the upper limit of each band with the net price after royalty at the threshold. For example, the net price after royalty at the upper limit of band 1 is $495/oz, given by $500/oz less $5/oz royalty paid at a 1% rate. Just above the threshold, at $501/oz, the net royalty received is $490.98/oz, given by $501/oz less $10.02/oz royalty at the 2% rate. Both buyer and seller are therefore better off at the $500/oz price than the $501/oz price.
Excel’s goal seek function can be used to calculate the price above the threshold where the net price after royalty is equal to the net price at the threshold. In this case, a price of $505.10/oz gives the same net price, ($505.10/oz less $10.10/oz royalty at the 2% rate gives a net price of $495/oz). At any gold price between $500/oz and $505.10/oz there is an incentive for buyers and sellers to transact at $500/oz. The dead zone above each royalty rate threshold is set out in Table 28 below. This analysis was undertaken outside of the IGF mining tax incentives model.
Table 28. Dead Zones Above Each Royalty Rate Threshold
Band Lower Limit ($/oz) Upper Limit ($/oz)Dead Zone Limit
($/oz)
1 0 500 N/A
2 500 750 505.1
3 750 1,000 757.7
4 1,000 1,250 1,010.4
5 1,250 1,500 1,263.2
6 1,500 N/A 1,516.0
INTRODUCTION
SECTION ONE. A FRAMEWORK FOR MODELLING BEHAVIOURAL RESPONSES TO MINING TAX INCENTIVES
SECTION TWO. THE IGF MINING TAX INCENTIVES FINANCIAL MODEL
SECTION THREE. ESTIMATING THE DIRECT COST OF TAX INCENTIVES
SECTION FOUR. ESTIMATING THE COST OF BEHAVIOURAL RESPONSES TO MINING TAX INCENTIVES
SECTION FIVE. TESTING COST ESTIMATES
CONCLUSIONS AND BEST PRACTICES

35
TAX INCENTIVES IN MINING: MINIMISING RISKS TO REVENUE
This behavioural response can be modelled using Monte Carlo Simulation (MCS)15, where the modelling results are estimated numerous times at different randomly-generated prices. The historical mean price, standard deviation and a normal distribution are used to generate the random price variable. Prices are simulated 1,000 times based on this probability distribution function and broadly follow a normal distribution around the historical mean price of $1,272/oz (Figure 12). In 1,000 simulations the price falls within a dead zone 58 times, or 5.8% of simulations. For the behavioural response, any randomly generated price that falls within a dead zone is reduced to the upper threshold of the previous band. This causes prices to cluster below threshold changes (Figure 13). As with the dead zone analysis, this has been undertaken outside of the IGF mining tax incentive model and cannot be replicated without additions to the model.
Figure 12. Randomly-Generated Prices for MCS
15 Monte Carlo Simulation involves running multiple iterations of the model with one or more input variables generated randomly, usually based on probability distribution functions. For mining projects, varying the commodity price is a common approach as results are usually highly sensitive to prices. Random prices can be generated from historical data, i.e. using the mean and standard deviation to generate a probability distribution function based on a normal distribution.
INTRODUCTION
SECTION ONE. A FRAMEWORK FOR MODELLING BEHAVIOURAL RESPONSES TO MINING TAX INCENTIVES
SECTION TWO. THE IGF MINING TAX INCENTIVES FINANCIAL MODEL
SECTION THREE. ESTIMATING THE DIRECT COST OF TAX INCENTIVES
SECTION FOUR. ESTIMATING THE COST OF BEHAVIOURAL RESPONSES TO MINING TAX INCENTIVES
SECTION FIVE. TESTING COST ESTIMATES
CONCLUSIONS AND BEST PRACTICES

36
TAX INCENTIVES IN MINING: MINIMISING RISKS TO REVENUE
Figure 13. Randomly-Generated Prices with Behavioural Response
Government revenue is then estimated 1,000 times using the randomly-generated prices and 1,000 times using random prices with behavioural response using Excel’s data tables function (Table 29). The average behavioural cost from price manipulation is $4.7 million (A), or 1.1 per cent of benchmark revenue. The highest observed cost from price manipulation is $115.8 million (B), or 26.4 per cent of benchmark revenue, while the average cost of just those simulations where price manipulation occurs is $83.1 million (C), or 18.9 per cent of benchmark revenue. This suggests that the behavioural cost from price manipulation in response to a sliding-scale royalty can be significant if market prices are frequently near to a royalty rate threshold.
Table 29. Monte Carlo Simulation Results of Behavioural Response to Sliding-Scale Royalty
$ million, real terms
MONTE CARLO SIMULATION RESULTS
Real terms NPV
M$ % benchmark
M$ % benchmark
Average revenue, random prices 439.5 100% 190.9 100%
Average revenue, random prices with behavioural
434.8 98.9% 188.7 98.9%
Average behavourial costs A -4.7 -1.1% -2.2 -1.1%
Highest observed behavioural cost B -115.8 -26.4% -52.9% -27.7%
Average cost when behavioural price used C -83.1 -18.9% -38.5 -20.2%
Memo:
Number of iterations 1,000
Number of iterations with behavioural price 58
% of iterations with behavioural price 5.8%
INTRODUCTION
SECTION ONE. A FRAMEWORK FOR MODELLING BEHAVIOURAL RESPONSES TO MINING TAX INCENTIVES
SECTION TWO. THE IGF MINING TAX INCENTIVES FINANCIAL MODEL
SECTION THREE. ESTIMATING THE DIRECT COST OF TAX INCENTIVES
SECTION FOUR. ESTIMATING THE COST OF BEHAVIOURAL RESPONSES TO MINING TAX INCENTIVES
SECTION FIVE. TESTING COST ESTIMATES
CONCLUSIONS AND BEST PRACTICES
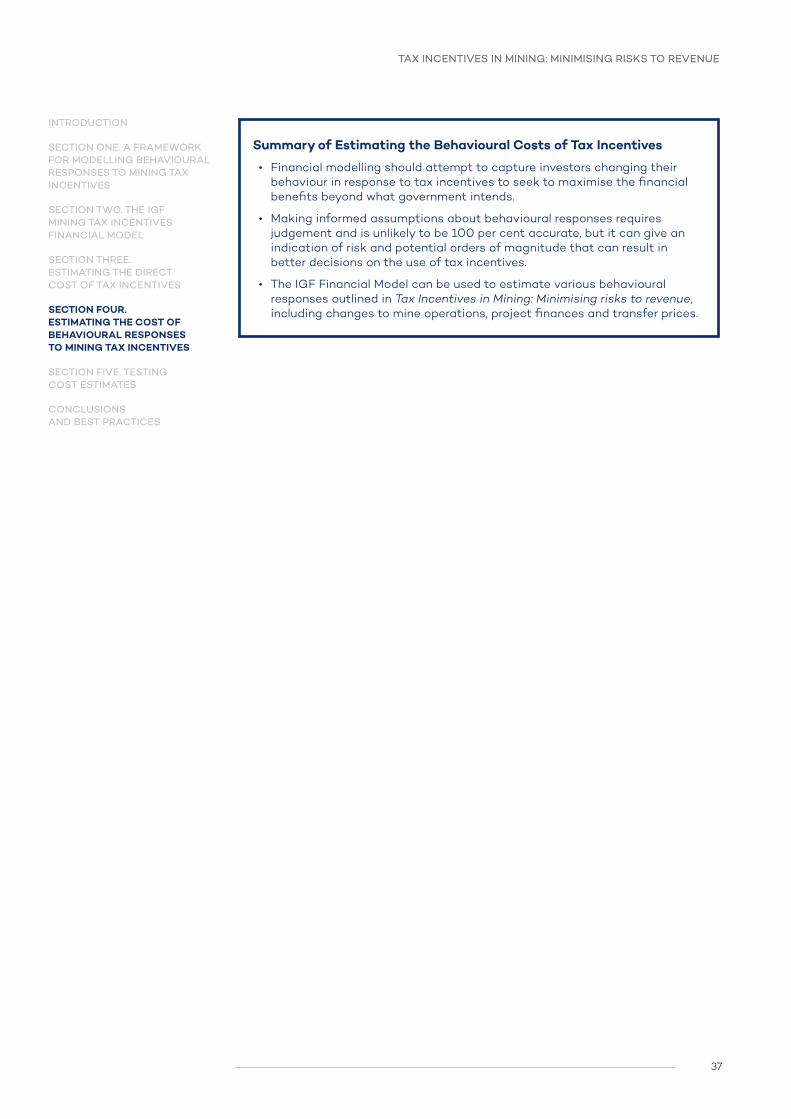
37
TAX INCENTIVES IN MINING: MINIMISING RISKS TO REVENUE
Summary of Estimating the Behavioural Costs of Tax Incentives
• Financial modelling should attempt to capture investors changing their behaviour in response to tax incentives to seek to maximise the financial benefits beyond what government intends.
• Making informed assumptions about behavioural responses requires judgement and is unlikely to be 100 per cent accurate, but it can give an indication of risk and potential orders of magnitude that can result in better decisions on the use of tax incentives.
• The IGF Financial Model can be used to estimate various behavioural responses outlined in Tax Incentives in Mining: Minimising risks to revenue, including changes to mine operations, project finances and transfer prices.
INTRODUCTION
SECTION ONE. A FRAMEWORK FOR MODELLING BEHAVIOURAL RESPONSES TO MINING TAX INCENTIVES
SECTION TWO. THE IGF MINING TAX INCENTIVES FINANCIAL MODEL
SECTION THREE. ESTIMATING THE DIRECT COST OF TAX INCENTIVES
SECTION FOUR. ESTIMATING THE COST OF BEHAVIOURAL RESPONSES TO MINING TAX INCENTIVES
SECTION FIVE. TESTING COST ESTIMATES
CONCLUSIONS AND BEST PRACTICES

SECTION FIVE: TESTING COST
ESTIMATES

39
TAX INCENTIVES IN MINING: MINIMISING RISKS TO REVENUE
Section Five. Testing Cost EstimatesMining project cash flows are uncertain due to volatile commodity prices, limits to geological data, and changes in production costs. The costs of tax incentives are often also uncertain because of these factors. For example, if the price of gold increases, the cost to government of providing an income tax holiday or reduced royalty rate will also increase. It is important to test the cost estimates of tax incentives for sensitivity to changes in underlying variables such as prices and costs. Two modelling approaches are frequently used: scenario modelling and sensitivity analysis (Table 30).
Table 30. Scenario Modelling and Sensitivity Analysis
Technique Description
Scenario Modelling Scenario modelling involves generating realistic scenarios from changing the values of key input parameters.
A common approach is to define three scenarios:
• Base case – key inputs based on most likely value from best available information (e.g. central price forecast from a range of independent forecasts)
• Better case – key inputs based on optimistic but realistic values (e.g. highest price forecast from a range of independent forecasts)
• Worse case – key inputs based on pessimistic but realistic values (e.g. lowest price forecast from a range of independent forecasts)
Scenarios do not need to be complex. A few key parameters varied in each scenario is usually sufficient to capture different expected output, price and costs (see Table 31).
Sensitivity Analysis Sensitivity analysis involves changing only one input parameter at a time and making estimates at multiple points across a range of values.
The range of values used for the input parameter should be broader than the values used in the better- and worse- case scenarios so that ‘tail risks’ are identified.16
Commodity price is a common input parameter for sensitivity analysis as mining project results are often highly sensitive to price. If the better- and worse- case scenarios use the highest and lowest forward-looking forecasts, sensitivity analysis should be performed at a broader range of prices, for example between the historical low- and high-prices. Suggested parameters are set out in Table 32.
16 Tail risks are events that have a low probability of occurring but large impacts if they do occur.
INTRODUCTION
SECTION ONE. A FRAMEWORK FOR MODELLING BEHAVIOURAL RESPONSES TO MINING TAX INCENTIVES
SECTION TWO. THE IGF MINING TAX INCENTIVES FINANCIAL MODEL
SECTION THREE. ESTIMATING THE DIRECT COST OF TAX INCENTIVES
SECTION FOUR. ESTIMATING THE COST OF BEHAVIOURAL RESPONSES TO MINING TAX INCENTIVES
SECTION FIVE. TESTING COST ESTIMATES
CONCLUSIONS AND BEST PRACTICES

40
TAX INCENTIVES IN MINING: MINIMISING RISKS TO REVENUE
Table 31. Suggested Parameters and Data Sources for Scenario Modelling
Input Parameter Suggested Approach Data Sources
Commodity Price
Base: central price forecast from a range of independent forecasts or futures market data
Better: highest price forecast
Worse: lowest price forecast
Where multiple forecasts are not available or do not provide a wide enough range in price assumptions, the interquartile range from historical price data can be used
Price forecasts by the IMF, World Bank, governments of major exporters, economic and industry analysts and commentators
Futures market data from exchanges
Historical price data from the IMF and World Bank
Production Base: capacity utilisation and ramp-up17 from feasibility study or investor model
Better: higher capacity utilisation and faster ramp-up
Worse: lower capacity utilisation and slower ramp-up
Feasibility study, investor financial model and other company reports
Performance of comparable mines18
Capital Costs Base: estimates in feasibility study or investor financial model
Better: low of target range in feasibility study19
Worse: high of target range in feasibility study
Feasibility study
Data from comparable mines in technical reports to exchanges or mine cost databases
Operating Costs
Base: estimates in feasibility study or investor financial model
Better: lower unit costs based on range in feasibility study or lower input cost inflation
Worse: higher unit costs based on range in feasibility study or higher input cost inflation
Feasibility study
Central bank for input cost inflation forecasts
17 Capacity utilisation refers to the percentage of a mine or processing facility’s maximum capacity that is realised. For example, a plant with 10 Mt per year capacity and 90% utilisation would process 9 Mt per year of ore. A newly-commissioned mine or plant rarely starts at full capacity utilisation. Ramp-up refers to the period of time during which capacity utilisation starts lower and increases over time up to the full capacity utilisation.18 See for example Precious Metals & Minerals. Ramp-ups: What to expect when expecting a new mine. Royal Bank of Canada Capital Markets (2017).19 Feasibility studies often specify a target range for capital costs (e.g. +/-15%) depending on the level of engineering work completed.
INTRODUCTION
SECTION ONE. A FRAMEWORK FOR MODELLING BEHAVIOURAL RESPONSES TO MINING TAX INCENTIVES
SECTION TWO. THE IGF MINING TAX INCENTIVES FINANCIAL MODEL
SECTION THREE. ESTIMATING THE DIRECT COST OF TAX INCENTIVES
SECTION FOUR. ESTIMATING THE COST OF BEHAVIOURAL RESPONSES TO MINING TAX INCENTIVES
SECTION FIVE. TESTING COST ESTIMATES
CONCLUSIONS AND BEST PRACTICES
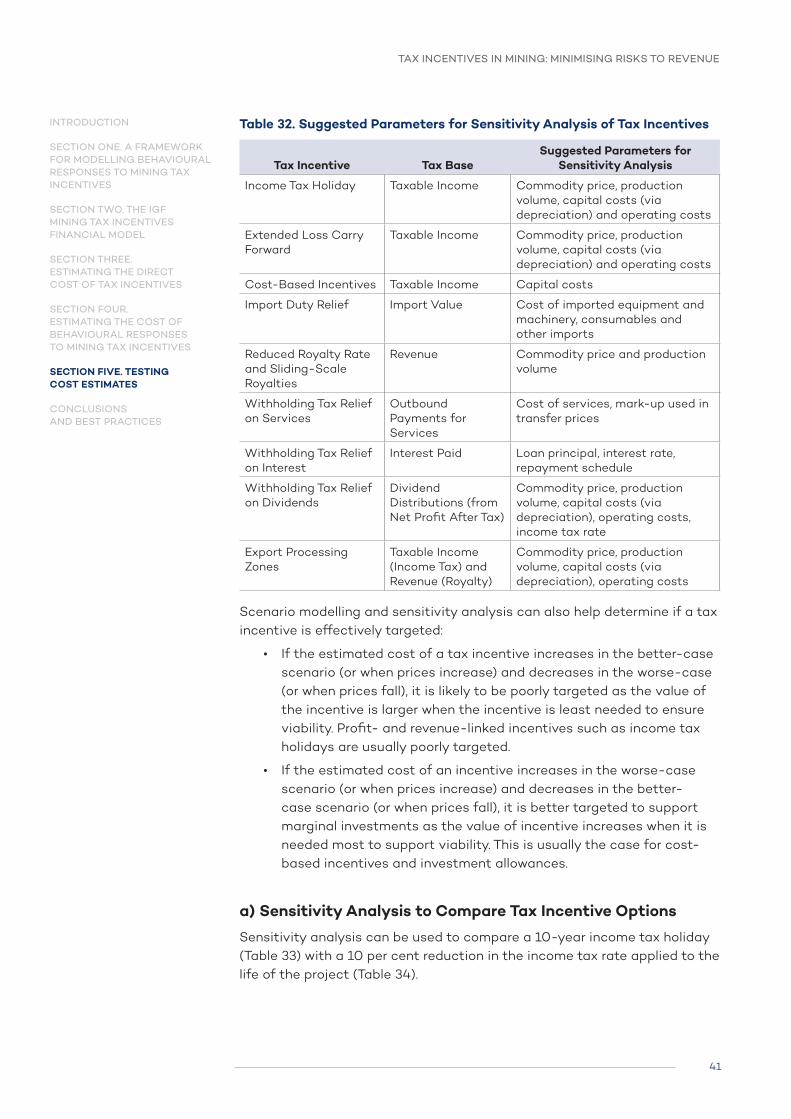
41
TAX INCENTIVES IN MINING: MINIMISING RISKS TO REVENUE
Table 32. Suggested Parameters for Sensitivity Analysis of Tax Incentives
Tax Incentive Tax BaseSuggested Parameters for
Sensitivity Analysis
Income Tax Holiday Taxable Income Commodity price, production volume, capital costs (via depreciation) and operating costs
Extended Loss Carry Forward
Taxable Income Commodity price, production volume, capital costs (via depreciation) and operating costs
Cost-Based Incentives Taxable Income Capital costs
Import Duty Relief Import Value Cost of imported equipment and machinery, consumables and other imports
Reduced Royalty Rate and Sliding-Scale Royalties
Revenue Commodity price and production volume
Withholding Tax Relief on Services
Outbound Payments for Services
Cost of services, mark-up used in transfer prices
Withholding Tax Relief on Interest
Interest Paid Loan principal, interest rate, repayment schedule
Withholding Tax Relief on Dividends
Dividend Distributions (from Net Profit After Tax)
Commodity price, production volume, capital costs (via depreciation), operating costs, income tax rate
Export Processing Zones
Taxable Income (Income Tax) and Revenue (Royalty)
Commodity price, production volume, capital costs (via depreciation), operating costs
Scenario modelling and sensitivity analysis can also help determine if a tax incentive is effectively targeted:
• If the estimated cost of a tax incentive increases in the better-case scenario (or when prices increase) and decreases in the worse-case (or when prices fall), it is likely to be poorly targeted as the value of the incentive is larger when the incentive is least needed to ensure viability. Profit- and revenue-linked incentives such as income tax holidays are usually poorly targeted.
• If the estimated cost of an incentive increases in the worse-case scenario (or when prices increase) and decreases in the better-case scenario (or when prices fall), it is better targeted to support marginal investments as the value of incentive increases when it is needed most to support viability. This is usually the case for cost-based incentives and investment allowances.
a) Sensitivity Analysis to Compare Tax Incentive Options
Sensitivity analysis can be used to compare a 10-year income tax holiday (Table 33) with a 10 per cent reduction in the income tax rate applied to the life of the project (Table 34).
INTRODUCTION
SECTION ONE. A FRAMEWORK FOR MODELLING BEHAVIOURAL RESPONSES TO MINING TAX INCENTIVES
SECTION TWO. THE IGF MINING TAX INCENTIVES FINANCIAL MODEL
SECTION THREE. ESTIMATING THE DIRECT COST OF TAX INCENTIVES
SECTION FOUR. ESTIMATING THE COST OF BEHAVIOURAL RESPONSES TO MINING TAX INCENTIVES
SECTION FIVE. TESTING COST ESTIMATES
CONCLUSIONS AND BEST PRACTICES
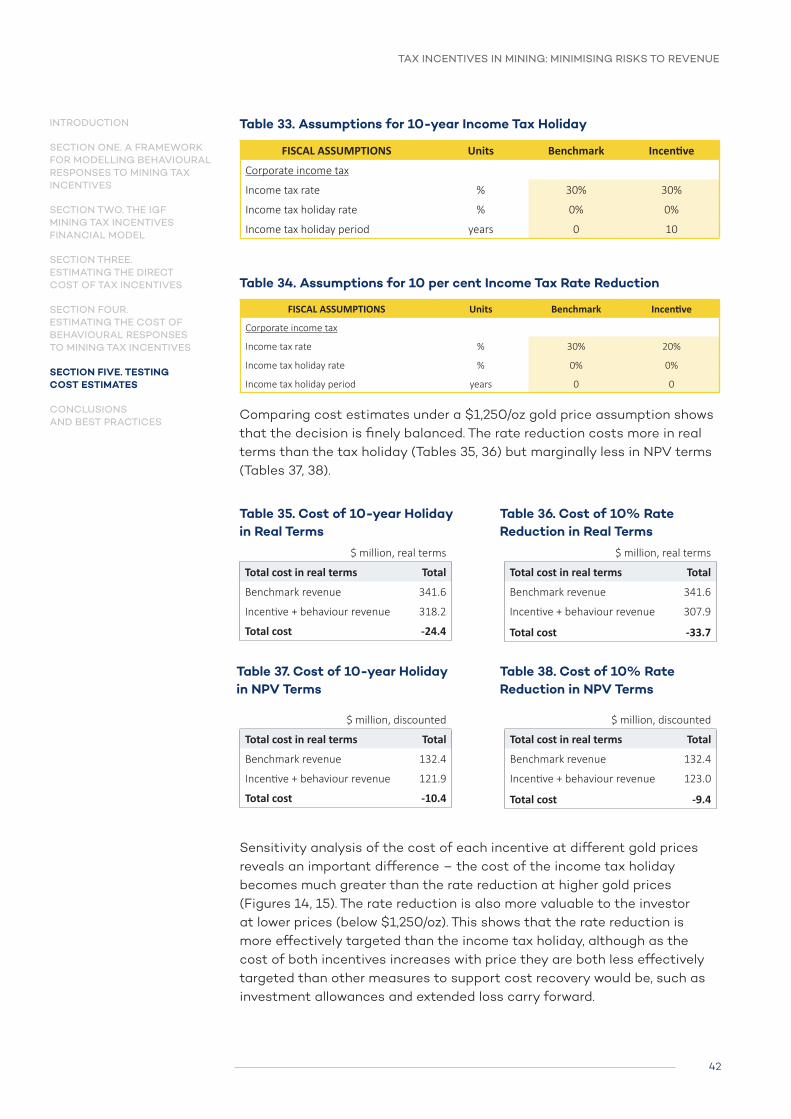
42
TAX INCENTIVES IN MINING: MINIMISING RISKS TO REVENUE
Table 33. Assumptions for 10-year Income Tax Holiday
FISCAL ASSUMPTIONS Units Benchmark Incentive
Corporate income tax
Income tax rate % 30% 30%
Income tax holiday rate % 0% 0%
Income tax holiday period years 0 10
Table 34. Assumptions for 10 per cent Income Tax Rate Reduction
FISCAL ASSUMPTIONS Units Benchmark Incentive
Corporate income tax
Income tax rate % 30% 20%
Income tax holiday rate % 0% 0%
Income tax holiday period years 0 0
Comparing cost estimates under a $1,250/oz gold price assumption shows that the decision is finely balanced. The rate reduction costs more in real terms than the tax holiday (Tables 35, 36) but marginally less in NPV terms (Tables 37, 38).
Table 35. Cost of 10-year Holiday in Real Terms
Table 36. Cost of 10% Rate Reduction in Real Terms
Table 37. Cost of 10-year Holiday in NPV Terms
Table 38. Cost of 10% Rate Reduction in NPV Terms
Sensitivity analysis of the cost of each incentive at different gold prices reveals an important difference – the cost of the income tax holiday becomes much greater than the rate reduction at higher gold prices (Figures 14, 15). The rate reduction is also more valuable to the investor at lower prices (below $1,250/oz). This shows that the rate reduction is more effectively targeted than the income tax holiday, although as the cost of both incentives increases with price they are both less effectively targeted than other measures to support cost recovery would be, such as investment allowances and extended loss carry forward.
INTRODUCTION
SECTION ONE. A FRAMEWORK FOR MODELLING BEHAVIOURAL RESPONSES TO MINING TAX INCENTIVES
SECTION TWO. THE IGF MINING TAX INCENTIVES FINANCIAL MODEL
SECTION THREE. ESTIMATING THE DIRECT COST OF TAX INCENTIVES
SECTION FOUR. ESTIMATING THE COST OF BEHAVIOURAL RESPONSES TO MINING TAX INCENTIVES
SECTION FIVE. TESTING COST ESTIMATES
CONCLUSIONS AND BEST PRACTICES
$ million, real terms
Total cost in real terms Total
Benchmark revenue 341.6
Incentive + behaviour revenue 318.2
Total cost -24.4
$ million, real terms
Total cost in real terms Total
Benchmark revenue 341.6
Incentive + behaviour revenue 307.9
Total cost -33.7
$ million, discounted
Total cost in real terms Total
Benchmark revenue 132.4
Incentive + behaviour revenue 121.9
Total cost -10.4
$ million, discounted
Total cost in real terms Total
Benchmark revenue 132.4
Incentive + behaviour revenue 123.0
Total cost -9.4

43
TAX INCENTIVES IN MINING: MINIMISING RISKS TO REVENUE
Figure 14. NPV Cost of 10-year Tax Holiday at Different Gold Prices
Figure 15. NPV Cost of 10% Rate Reduction at Different Gold Prices
Summary of Testing Cost Estimates
• Mining projects are highly uncertain and cost estimates should be tested under different assumptions to reflect this uncertainty using scenario modelling or sensitivity analysis.
• Scenario modelling involves identifying a set of input parameters and defining different values for each to generate scenarios based on realistic expectations (e.g. ‘base case’, ‘better case’ and ‘worse case’).
• Sensitivity analysis involves changing only one input parameter (most commonly the commodity price) and estimating costs at multiple points across a broader range of values than used in scenario modelling, which can help identify tail risks.
• Scenario modelling and sensitivity analysis can help determine if a tax incentive is targeted effectively.
º A well-targeted incentive will cost more (and therefore be worth more to the investor) when mine performance is worse (e.g. under the worse-case scenario or lower commodity prices) and cost less when mine performance is better (e.g. most cost-based incentives)
º A poorly-targeted incentive will cost more when mine performance is better (e.g. under the better-case scenario or higher commodity prices) and cost less (and therefore be worth less to the investor) when mine performance is worse (e.g. profit- and revenue-based incentives)
INTRODUCTION
SECTION ONE. A FRAMEWORK FOR MODELLING BEHAVIOURAL RESPONSES TO MINING TAX INCENTIVES
SECTION TWO. THE IGF MINING TAX INCENTIVES FINANCIAL MODEL
SECTION THREE. ESTIMATING THE DIRECT COST OF TAX INCENTIVES
SECTION FOUR. ESTIMATING THE COST OF BEHAVIOURAL RESPONSES TO MINING TAX INCENTIVES
SECTION FIVE. TESTING COST ESTIMATES
CONCLUSIONS AND BEST PRACTICES

CONCLUSIONS AND BEST
PRACTICES

45
TAX INCENTIVES IN MINING: MINIMISING RISKS TO REVENUE
Conclusions and Best Practices
1. Tax incentives can result in investors changing their behaviour to maximise the financial benefit beyond what government intends. These ‘behavioural responses’ should be incorporated into cost estimates using financial models.
2. The IGF Financial Model, released alongside this note, can be used to estimate the total cost of tax incentives, including behavioural responses, for an illustrative medium-sized surface gold mine in Africa. The model can also be adapted for use on specific mining projects or the techniques borrowed by governments to develop their own financial models.
3. The total cost of tax incentives, including the behavioural response, can be estimated in four steps (Figure 16).
Figure 16. Steps for Estimating the total cost of Tax Incentives in Mining
4. Multiple tax incentives should be modelled simultaneously due to interactions across the tax system. The individual contribution of incentives can be determined by estimating sequentially, incorporating previous incentives into the benchmark fiscal regime, and presented in a scorecard.
5. Making informed assumptions about behavioural responses requires judgement and is unlikely to be 100 per cent accurate. Even so, it can give an indication of risk and potential orders of magnitude, which can lead to better decisions on the use of tax incentives for mining projects.
INTRODUCTION
SECTION ONE. A FRAMEWORK FOR MODELLING BEHAVIOURAL RESPONSES TO MINING TAX INCENTIVES
SECTION TWO. THE IGF MINING TAX INCENTIVES FINANCIAL MODEL
SECTION THREE. ESTIMATING THE DIRECT COST OF TAX INCENTIVES
SECTION FOUR. ESTIMATING THE COST OF BEHAVIOURAL RESPONSES TO MINING TAX INCENTIVES
SECTION FIVE. TESTING COST ESTIMATES
CONCLUSIONS AND BEST PRACTICES

46
TAX INCENTIVES IN MINING: MINIMISING RISKS TO REVENUE
6. Mining projects are uncertain due to volatile prices, limits to geological data, and changes in production costs. Estimates of the costs of tax incentives should be tested under different assumptions using scenario modelling or sensitivity analysis.
INTRODUCTION
SECTION ONE. A FRAMEWORK FOR MODELLING BEHAVIOURAL RESPONSES TO MINING TAX INCENTIVES
SECTION TWO. THE IGF MINING TAX INCENTIVES FINANCIAL MODEL
SECTION THREE. ESTIMATING THE DIRECT COST OF TAX INCENTIVES
SECTION FOUR. ESTIMATING THE COST OF BEHAVIOURAL RESPONSES TO MINING TAX INCENTIVES
SECTION FIVE. TESTING COST ESTIMATES
CONCLUSIONS AND BEST PRACTICES

47
TAX INCENTIVES IN MINING: MINIMISING RISKS TO REVENUE
Annex 1. The Basics of Financial ModellingOpenOil define three stages of financial models for mining:
• Stage 1. Project Cashflow Model (a model of cashflows of the project before considering the fiscal regime or how the project is financed)
• Stage 2. Project Fiscal Model (the cashflow model plus the fiscal regime (e.g. corporate income tax, royalty etc.) excluding any consideration of how the project is financed by the investor)
• Stage 3. Project Economic Model (the final state where the outcome is a fiscal model including the effect of the financing structure)
A stage 2 or stage 3 model can be used to estimate the cost of tax incentives. Stage 3 models are more accurate because they include project finance, which impacts on income tax and withholding taxes, and as some behavioural responses to tax incentives can involve changes to how the project is financed. For example, a lower rate of withholding tax on interest can trigger excessive interest deductions by investors.
Using a modelling standard (Box A.1.) can help impose good modelling practices and ensure that models are consistent within and across organisations, making it easier to transfer models from person-to-person and reducing the time required to learn new models.
The results of financial models are only ever as good as the inputs and assumptions used. See Table 4 in Tax Incentives in Mining: Minimising risks to revenue for a list of information required to model mining tax incentives.
There are various financial models of mining projects in the public domain:
• Gold benchmarking model (CCSI)
• Fiscal Analysis of Resource Industries (FARI) model (IMF)
• Mongolia Macro-fiscal Model (NRGI)
• Library of FAST-compliant project models (OpenOil)
For further guidance on the basics of financial modelling see:
• Fiscal Analysis of Resource Industries (FARI) Technical Note and Manual (IMF)
• OpenOil’s standardized open-source approach to financial modelling (OpenOil)
• Financial Modelling Handbook (crowdsourced)
• Financial Modelling Courses (F1F9)
Box A.1. Financial Modelling Standards
• Best Practice Spreadsheet Modelling (BPMS). An off-the-shelf corporate policy document developed and maintained by the Spreadsheet Standards Review Board (SSRB).
• FAST. A set of rules providing guidance on the structure and design of efficient spreadsheets, maintained by the FAST Standard Organisation.
• SMART. A best-practice methodology for financial forecasting and scenario analysis developed by Corality.