Embed Size (px)
Citation preview

Tarkington ISD
2012-2013
Texas Academic Performance Report
Public Hearing
February 2014
2013 Accountability Rating
Met Standard
1
2
TAPR Overview
Due to changes in legislation, the performance report formerly known as the Academic Excellence Indicator System (AEIS) report is now the Texas Academic Performance Report (TAPR)
AEIS was published from 1990-91 to 2011-12. Archived AEIS reports may be found on the AEIS Archives page through TEA
The TAPR provides information on the performance of students in each school and district in Texas. The reports also provide extensive information on school and district staff, programs, and student demographics.

Accessing the TAPR Report
3
2 3
1 http://ritter.tea.state.tx.us/perfreport/tapr/index.html www.tarkingtonisd.net Central Administration and Campus Offices
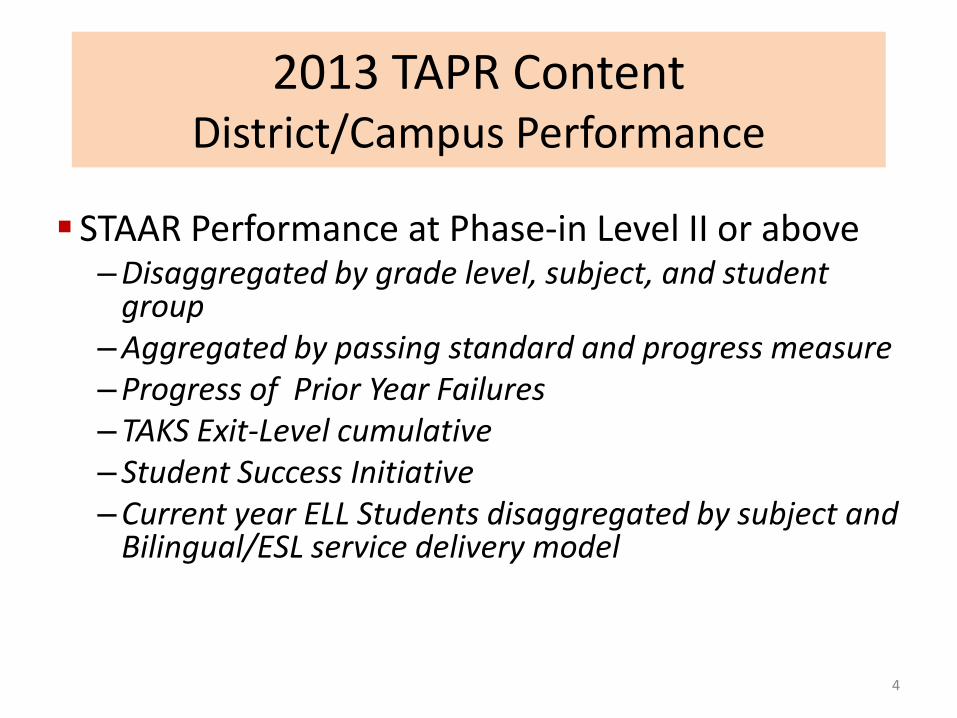
2013 TAPR Content District/Campus Performance
4
STAAR Performance at Phase-in Level II or above –Disaggregated by grade level, subject, and student
group –Aggregated by passing standard and progress measure –Progress of Prior Year Failures –TAKS Exit-Level cumulative –Student Success Initiative –Current year ELL Students disaggregated by subject and
Bilingual/ESL service delivery model

5
2013 TAPR Content District/Campus Performance (continued)
Participation Rate Attendance Rate Annual Dropout Rates Graduation Rates

6
2013 TAPR Content District/Campus Performance (continued)
College Readiness Indicators – RHSP and DAP Graduates – Advanced Courses/Dual Enrollment – Texas Success Initiative (TSI) – College-Ready Graduates – AP/IB Results, SAT/ACT Results – Graduates Enrolled in a Texas Institution of Higher
Education (IHE) – Gradates in a Texas IHE Completing One Year
Without Remediation
7
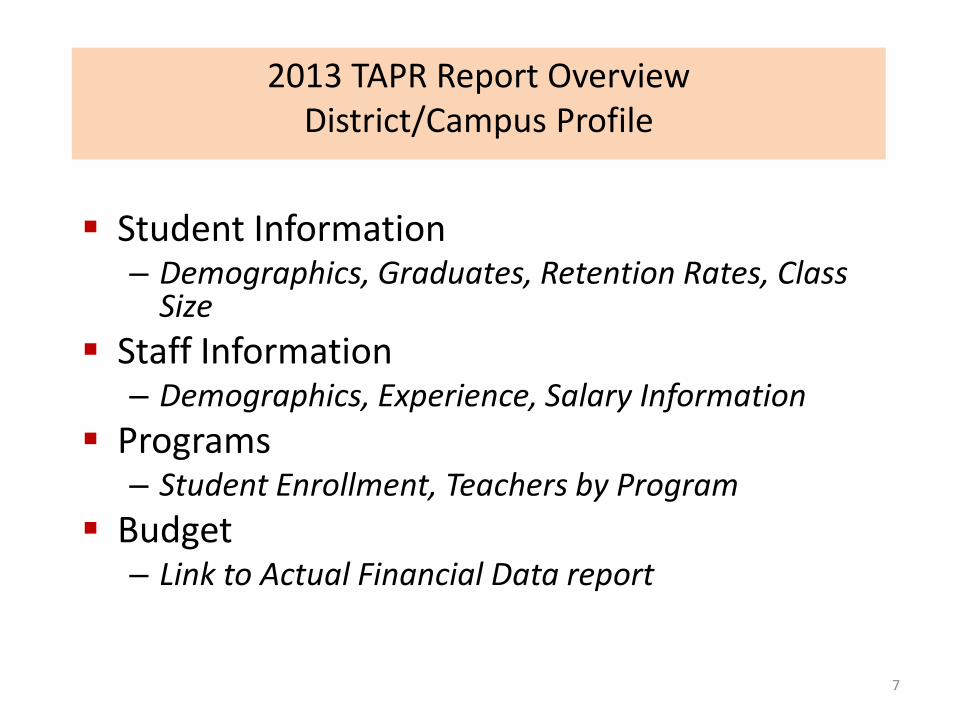
2013 TAPR Report Overview District/Campus Profile
Student Information – Demographics, Graduates, Retention Rates, Class
Size
Staff Information – Demographics, Experience, Salary Information
Programs – Student Enrollment, Teachers by Program
Budget – Link to Actual Financial Data report

State Assessments-% passing
8
Sum of All Grades Tested Level III
Advanced
TISD
2012
TISD
2013
State
2013
TISD
2012
TISD
2013
State
2013
Reading /ELA 75 80 80 10 12 17
Math 72 79 79 7 9 15
Writing 63 64 63 3 3 4
Science 79 80 82 6 6 10
Social Studies 74 73 76 6 7 9
All Test 73 76 77 7 8 13
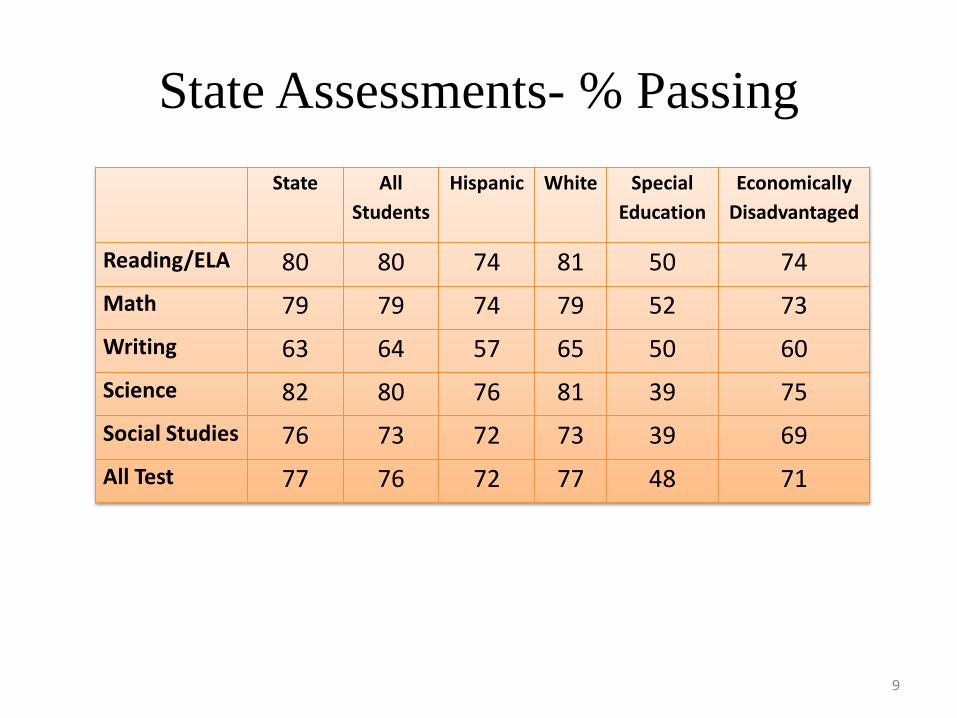
State Assessments- % Passing
9
State All
Students
Hispanic White Special
Education
Economically
Disadvantaged
Reading/ELA 80 80 74 81 50 74
Math 79 79 74 79 52 73
Writing 63 64 57 65 50 60
Science 82 80 76 81 39 75
Social Studies 76 73 72 73 39 69
All Test 77 76 72 77 48 71

EXIT LEVEL - TAKS Cumulative Passing Rate
TISD
Class of 2012
TISD
Class of 2013
State
Class of 2013
91% 91% 94%
This measure is intended to show the relative success of districts in their efforts to help all their students pass the exit level TAKS, which is a requirement for graduation. The TAKS cumulative pass rate shows the percent of students who first took the TAKS exit-level test in spring 2011, and eventually passed all TAKS tests taken (in the same district) by spring 2012.
10

Student Success Initiative ( Grades 5,8)
READING
TISD
Grade 5
2013
State
Grade 5
2013
TISD
Grade 8
2013
State
Grade 8
2013
% Required Accelerated
Instruction 16 23 15 17
% Met Standard 91 87 92 90
MATH
% Required Accelerated
Instruction 31 26 19 24
% Met Standard 85 88 87 86
11

Attendance Rates
12
TISD
2010-2011
TISD
2011-2012
State
2011-2012
95.1% 95.4% 95.9%
Annual Dropout Rate
TISD
2010-2011
TISD
2011-2012
State
2011-2012
Grades 7-8 0.0% 0.0% 0.3%
Grades 9-12 1.1% 0.5% 2.4%

Completion Rates by % (4-year longitudinal)
13
TISD
Class of 2011
TISD
Class of 2012
State
Class of 2012
Graduated 88.5% 92.8% 87.7%
Received GED 2.9% 1.4% 1.0%
Continued HS 5.8% 2.9% 5.0%
Dropped Out (4-yr) 2.9% 2.9% 6.3%

College Readiness Indicators
14
TISD
2010-11
TISD
2011-2012
State
2011-2012
16.1% 17.2% 30.6%
Completion of advanced/dual enrollment courses
Recommended/Distinguished Graduates
TISD
Class of 2011
TISD
Class of 2012
State
Class of 2012
63.6% 60.1% 80.5%
% of students who complete and received credit for at least 1 advanced course in grades 9-12.

College Readiness Indicators
15
Texas Success Initiative (TSI) –
Higher Education Readiness Component
TISD
2012
TISD
2013
State
2013
ELA 51% 66% 65%
Math 68% 62% 66%
This indicator shows the % of grade 11 students who are considered ready to begin college-level work, based on their performance on the TAKS exit-level examination.
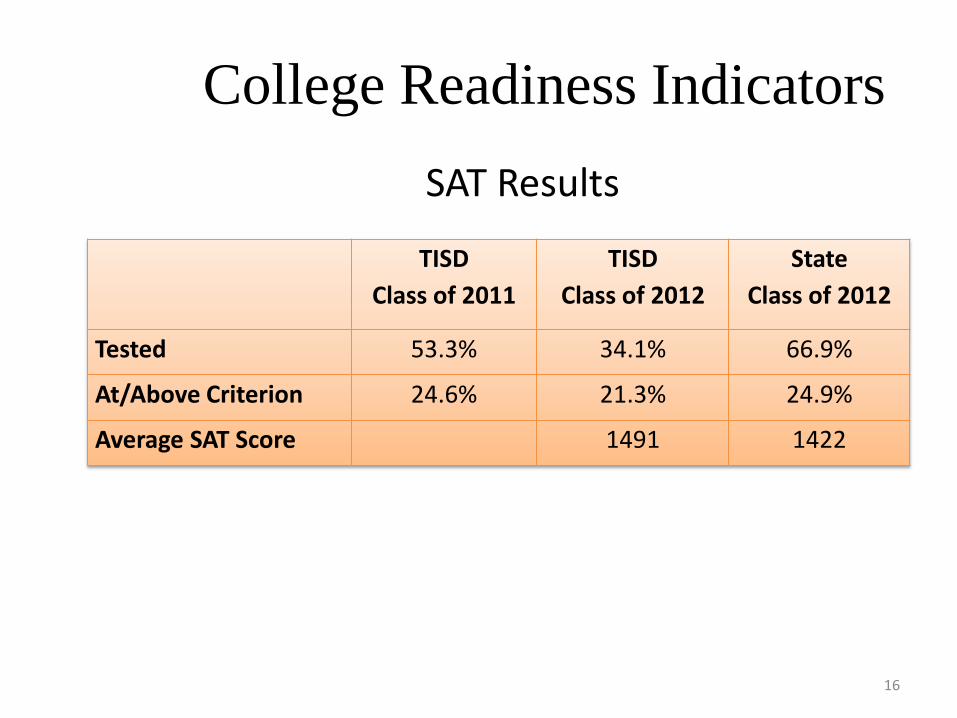
College Readiness Indicators
16
TISD
Class of 2011
TISD
Class of 2012
State
Class of 2012
Tested 53.3% 34.1% 66.9%
At/Above Criterion 24.6% 21.3% 24.9%
Average SAT Score 1491 1422
SAT Results

College Readiness Indicators
17
College Ready-Graduates
TISD
Class of 2011
TISD
Class of 2012
State
Class of 2012
ELA 67% 58% 69%
Math 63% 63% 70%
Both subjects 50% 48% 57%
This is based on Exit Level TAKS ELA/Math and SAT scores.

Texas High School Graduates from FY 2011 Enrolled in Texas Public or Independent Higher Education Fall 2012
18
Liberty County
Total HS Graduates
% Enrolled Higher Education
Liberty 121 50%
Dayton 254 57%
Tarkington 132 48%
Cleveland 141 47%
Hull-Daisetta 38 42%
Hardin 79 38%
Source: Texas Higher Education Coordinating Board and Texas Education Agency

Texas High School Graduates from FY 2011
Enrolled in Texas Public or Independent Higher Education Fall 2012
GPA for 1st Year in Public Higher Education in Texas
19
District
Total Grad 2 or 4 year Institute
<2.49 2.50-4.00
Unknown
Tarkington 60 40% 55% 5%
Hardin 27 48% 48% 3%
Cleveland 63 65% 26% 7%
Dayton 141 43% 47% 9%
Liberty 58 44% 44% 10%
Hull- Daisetta 14 43% 50% 7%
Source: Texas Higher Education Coordinating Board and Texas Education Agency
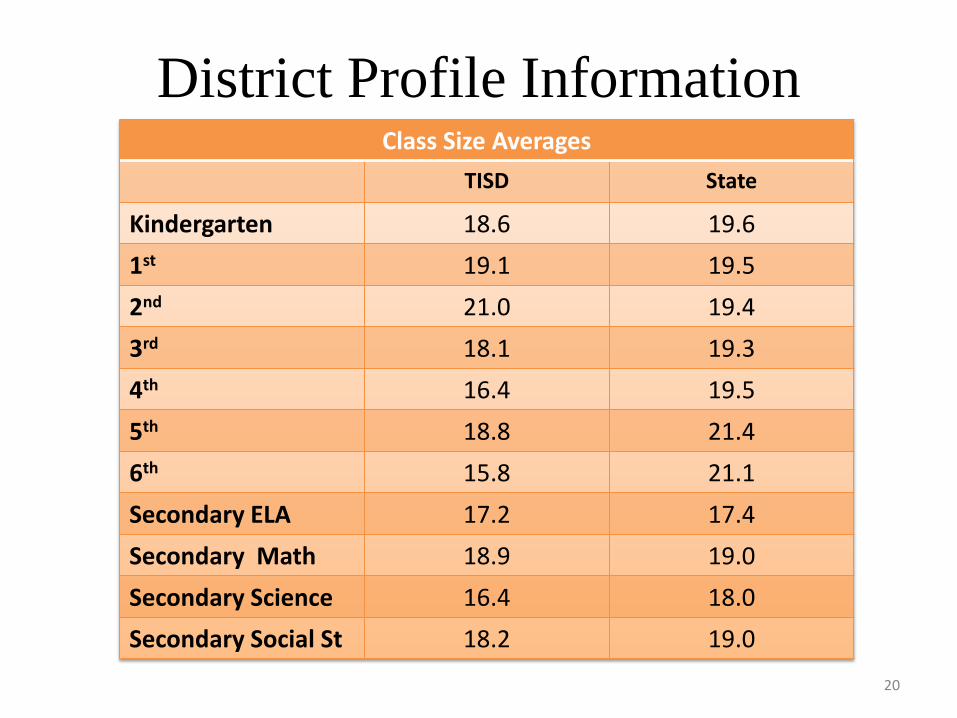
District Profile Information
20
Class Size Averages
TISD State
Kindergarten 18.6 19.6
1st 19.1 19.5
2nd 21.0 19.4
3rd 18.1 19.3
4th 16.4 19.5
5th 18.8 21.4
6th 15.8 21.1
Secondary ELA 17.2 17.4
Secondary Math 18.9 19.0
Secondary Science 16.4 18.0
Secondary Social St 18.2 19.0

Staff Information
21
TISD STATE
Professional Staff (153.4) 58.8% 63.9%
Bachelors (101) 76.1% 75.4%
Masters (30) 23.2% 23.1%
Years of Experience
Beginning Teachers 3.0% 7.0%
1-5 Years 38.4% 26.1%
6-10 Years 24.0% 22.7%
11-20 Years 36.9% 26.9%
Over 20 Years 31.0% 17.3%
Average Years Experience 13.1 11.5
Average Years Experience within District 8.0 8.0
Turnover Rate Teachers 7.3% 15.3%

2011-2012
Actual Financial Data
22
TISD STATE
Revenue
All funds per student $8,846 $9,969
Adopted Tax Rate 1.1600 1.2379
Revenue by Source
Local Tax 29.95% 42.34%
State 57.35% 41.25%
Federal 7.57% 12.27%

23
•Check In Computer Program - Each campus office:visitors sign in, scan drivers licenses
•Monthly Emergency drills and tabletop scenarios
•District staff trained on issues regarding bullying, sexual harassment and child abuse
•Mandatory drug testing for participants in extra-curricular school activities and student
drivers
•Red Ribbon Week activities and through the D.A.R.E. program
•TBSI Non-Violent Crisis Intervention training was made available to District
employees
•Emergency Operations Manual is updated each year
•All campuses have one main entry into the building via the office.
•Unannounced campus security checks
•Campus counselors provide students and teachers with information regarding dating
violence (HS,MS),bullying and personal safety
•Character Building Programs at TPS, TIS,
•District Safety Audit every three years
Our district is continuing to study and implement safe school policies and
procedures. We are also continually seeking ways to involve our staff, students,
parents and the community in our effort to have a positive safe school
environment.
School Violence Prevention/Violence Intervention Policies and Procedures

Report on Violent and Criminal Incidents
2012-2013
24
PEIMS Discipline Action Reason Codes for Violent
/Criminal Incidents
Primary Intermediate Middle
School
High
School
2: Conduct punishable as a felony 0 0 0 0 4: Possessed, sold, or used controlled substance 0 0 0 3 5: Possessed, sold, used or was under the influence of an alcoholic
beverage. 0 0 0 1
6: Abuse of a volatile chemical 0 0 0 0 7: Public lewdness or indecent exposure 0 0 0 0 8: Retaliation against school employee 0 0 0 0 11: Used, exhibited, or possessed firearm 0 0 0 0 12: Used, exhibited, or possessed illegal knife 0 0 0 0 13: Used, exhibited, or possessed illegal club 0 0 0 0 14: Used, exhibited, or possessed weapon 0 0 0 0 16: Arson 0 0 0 0 17: Murder, attempted murder 0 0 0 0 18: Indecency with a child 0 0 0 0 19: Aggravated kidnapping 0 0 0 0 22: Criminal mischief 0 0 0 1 26: Terroristic threat 0 0 0 0 29: Aggravated assault on school employee 0 0 0 0 30: Aggravated assault on student 0 0 0 0 31: Sexual assault or aggravated sexual assault on school employee 0 0 0 0
32: Sexual assault or aggravated sexual assault on student 0 0 0 0 36: Felony controlled substance 0 0 0 0 37: Felony alcohol violation 0 0 0 0
Total incidents per campus 0 0 0 5


![Yom HaShoah Services and Ceremonies - … HaShoah Services and Ceremonies [2] Midwest Region — Indiana Bureau of Jewish Education Location: Tarkington Theatre 3 Center Green Carmel,](https://img.dokumen.tips/doc/110x75/5ae580e17f8b9a3d3b8bef7a/yom-hashoah-services-and-ceremonies-hashoah-services-and-ceremonies-2-midwest.jpg)