Embed Size (px)
Citation preview

TALKING TRENDS
Macroeconomics and markets
April 2018
No. 3 (23)
The bulletin is based on data as of 11.04.2018.
The views expressed in the bulletin
are solely those of the authors and do not necessarily reflect the official position of the Bank of Russia.
Please send your comments and suggestions to [email protected]
Research and
Forecasting
Department Bulletin

Серия до кла до в о б э ко но мичеСких
иССледо ва ниях 2 No. 3 / April 2017
Talking Trends
CONTENTS
Executive summary ____________________________________________________ 3
1. Monthly summary ___________________________________________________ 5
1.1. Inflation ________________________________________________________ 5
1.1.1. Inflation accelerates but remains low ______________________________________ 5 1.1.2. PMI price indexes: growth is gradually accelerating __________________________ 9 1.1.3. Underlying inflation in March ____________________________________________ 9
1.2. Economic performance ___________________________________________ 10
1.2.1. 2017 GDP: growth slows down temporarily in the second half _________________ 10 1.2.2. Industrial output in February: a slight drop as the moderately positive trend holds __ 13 1.2.3. Composite PMI: economic growth slows down in Russia and globally ___________ 15 1.2.4. Retail slowdown in February is temporary _________________________________ 17 1.2.5. Inflation risks from the labour market side are on the rise _____________________ 20 1.2.6. Unemployment declines on the back of cyclical growth in labour demand ________ 24 1.2.8. Q1 growth in lending to the economy hit the high of this phase of economic growth_ 26 1.2.9. Organisations posted poorer net financial results despite higher sales profits _____ 27
1.3. Global economy, financial and commodity markets ___________________ 30
1.3.1. New restrictions put Russian financial markets under pressure_________________ 30
2. Outlook: leading indicators ___________________________________________ 33
2.1. Global leading indicators _________________________________________ 33
2.1.1. Global PMI fell to a 16-month low _______________________________________ 33
2.2. What do Russian leading indicators suggest? ________________________ 34
2.2.1. Analysts revised again the expected end-2018 inflation downwards _____________ 34 2.2.2. GDP growth projections: fluctuations in short-term statistics do not impede
sustainable growth ________________________________________________________ 34
3. In focus. Retail expansion: key trends and outlook _______________________ 36
Серия до кла до в о б э ко но мичеСких
иССледо ва ниях 3 No. 3 / April 2017
Talking Trends
Executive summary
1. Monthly summary
Between March and early April, inflation was unchanged and low. The trend
towards its return to 4% is not expected to emerge before the second half of the
year, notwithstanding a rise in short-term inflation risks. Having said that, economic
activity continued to expand. Overall, the economy is gaining traction on a slow but
sustainable growth path. The surge in geopolitical strains has been no threat to the
stability of financial markets, although it has indeed led to a surge in volatility.
o Temporary factors account for the March acceleration in inflation to 2.4%. The
steadiest components of consumer prices retained low growth rates. At the
same time, the short-term risks of inflation accelerating to a point above 4% are
slightly up on the back of an accelerated wage growth pace and a weaker ruble
in April. Key medium-term proinflationary risks remain in place. Among them are
possible drastic changes in consumer behaviour, accelerating growth in
consumer lending, unstable and elevated inflation expectations, the state of the
labour market and risks related to external factors, alongside the uncertainty of
fiscal policy dimensions after 2018. The Bank of Russia’s policy fosters reduced
inflation risks and the anchoring of inflation at a level close to 4% over the
forecast horizon.
o The economy in March expectedly slowed down slightly to a level consistent
with its potential (approximately 1.5% a year). There was concurrent growth in
the uncertainly over short-term economic performance. These developments
come on the back of mixed factors: on the one hand, there is growth in
geopolitical tensions; on the other hand, oil prices are rising. In defiance of this
environment, economic expansion is progressing at paces that are close to
potential.
o Russian financial markets saw a strong rise in volatility in early April, driven by
the impact of geopolitical factors. However, this volatility does not pose a threat
to macroeconomic stability.
2. Outlook
The slide in most major economies’ PMIs from local maximums suggests mounting
risks to global economic growth and financial markets will emerge in the near
future.
The leading GDP growth indicator is still indicative of a positive short-term outlook
for the Russian economy.

Серия до кла до в о б э ко но мичеСких
иССледо ва ниях 4 No. 3 / April 2017
Talking Trends
3. In focus. Retail expansion: key trends and outlook
Consumers’ recently acquired habit of doing shopping when goods are on
promotions alongside their preference for private labels are expected to constrain
growth in consumer prices.
Consumer prices are further pressured by dynamically expanding e-commerce,
especially cross-border web stores.
Strengthening market consolidation processes will possibly help individual players
boost their market positions and trigger a certain acceleration in consumer price
growth, going forward.

Серия до кла до в о б э ко но мичеСких
иССледо ва ниях 5 No. 3 / April 2017
Talking Trends
1. Monthly summary
1.1. Inflation
In March, inflation slightly accelerated to 2.4%. This acceleration was expected
given that the stocks of vegetables including potatoes depleted earlier than last year.
Having said this, the stable components of inflation remain low relative to the Bank of
Russia’s target. Short-term inflation risks were up on February on the back of exchange
rate movements and accelerated wage growth paces which are unsupported by
productivity growth.
Consumer prices, loans and deposits, as well as macroeconomic indicators have
yet to fully respond to recent monetary policy decisions. This factor and a gradual
transition to neutral monetary policy alongside the dying-out of temporary tailwinds are
set to gradually move inflation closer to 4% in 2018 and sustain it at this level in
subsequent years.
Mid-term proinflationary risks are dominant. Key risks include a potentially rapid
switch to a consumer behaviour pattern, to the detriment of savings, and accelerated
consumer lending, elevated and unsteady inflation expectations, possible skill shortages
in the labour market and the uncertainty over fiscal policy dimensions in the next few
years. An increasingly volatile currency market, impacted on by geopolitical factors, could
add to proinflationary risks.
1.1.1. Inflation accelerates but remains low
Annual inflation was up to 2.35% in March on 2.18% in February against the
backdrop of accelerated growth in fruit and vegetable prices. We estimate
seasonally adjusted consumer price growth at 0.23% MoM (2.8% on an annualised
basis) vs 0.07-0.10% MoM seen in the January to February period.
Modified core inflation indicators suggest inflationary pressure remains low.
The emerging reverse trend in global food prices may potentially lead to a gradual
rise in domestic food prices that have registered near-zero growth for the fourth
month in a row1.
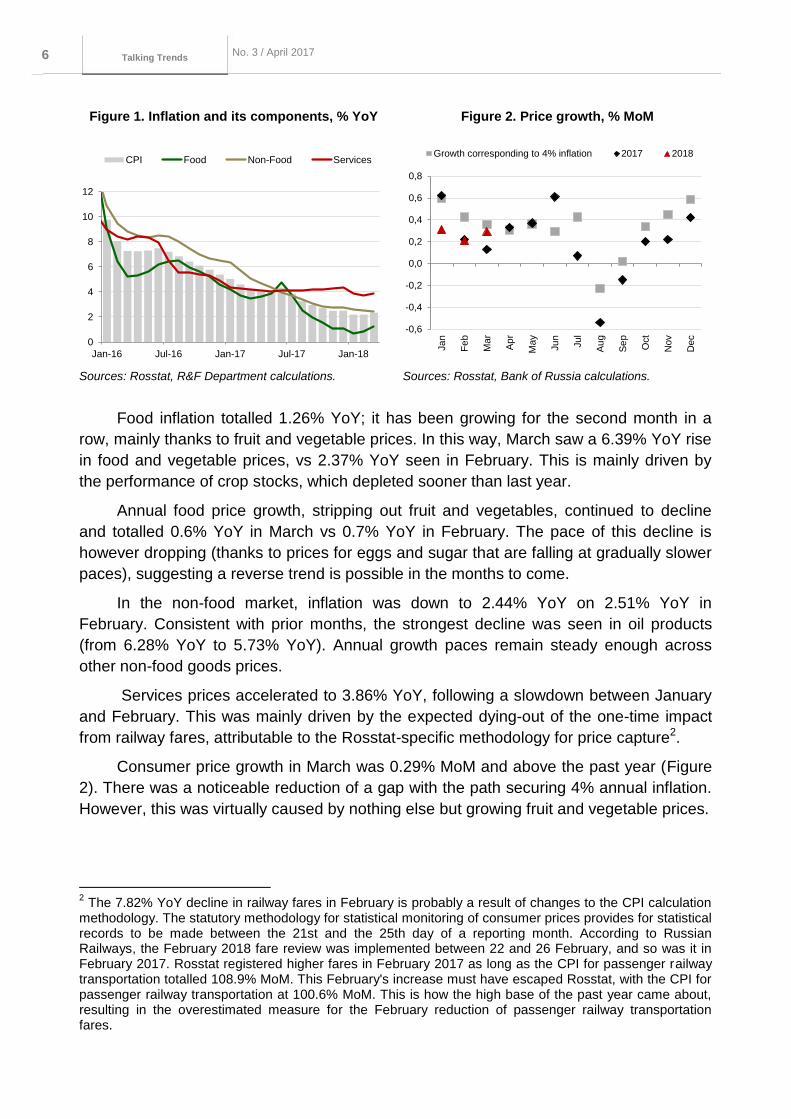
Inflation accelerated to 2.35% YoY in March from 2.18% YoY in February (Figure 1).
1 Seasonally adjusted growth excluding fruit and vegetables.
Серия до кла до в о б э ко но мичеСких
иССледо ва ниях 6 No. 3 / April 2017
Talking Trends
Figure 1. Inflation and its components, % YoY Figure 2. Price growth, % MoM
Sources: Rosstat, R&F Department calculations. Sources: Rosstat, Bank of Russia calculations.
Food inflation totalled 1.26% YoY; it has been growing for the second month in a
row, mainly thanks to fruit and vegetable prices. In this way, March saw a 6.39% YoY rise
in food and vegetable prices, vs 2.37% YoY seen in February. This is mainly driven by
the performance of crop stocks, which depleted sooner than last year.
Annual food price growth, stripping out fruit and vegetables, continued to decline
and totalled 0.6% YoY in March vs 0.7% YoY in February. The pace of this decline is
however dropping (thanks to prices for eggs and sugar that are falling at gradually slower
paces), suggesting a reverse trend is possible in the months to come.
In the non-food market, inflation was down to 2.44% YoY on 2.51% YoY in
February. Consistent with prior months, the strongest decline was seen in oil products
(from 6.28% YoY to 5.73% YoY). Annual growth paces remain steady enough across
other non-food goods prices.
Services prices accelerated to 3.86% YoY, following a slowdown between January
and February. This was mainly driven by the expected dying-out of the one-time impact
from railway fares, attributable to the Rosstat-specific methodology for price capture2.
Consumer price growth in March was 0.29% MoM and above the past year (Figure
2). There was a noticeable reduction of a gap with the path securing 4% annual inflation.
However, this was virtually caused by nothing else but growing fruit and vegetable prices.
2 The 7.82% YoY decline in railway fares in February is probably a result of changes to the CPI calculation
methodology. The statutory methodology for statistical monitoring of consumer prices provides for statistical records to be made between the 21st and the 25th day of a reporting month. According to Russian Railways, the February 2018 fare review was implemented between 22 and 26 February, and so was it in February 2017. Rosstat registered higher fares in February 2017 as long as the CPI for passenger railway transportation totalled 108.9% MoM. This February's increase must have escaped Rosstat, with the CPI for passenger railway transportation at 100.6% MoM. This is how the high base of the past year came about, resulting in the overestimated measure for the February reduction of passenger railway transportation fares.
0
2
4
6
8
10
12
Jan-16 Jul-16 Jan-17 Jul-17 Jan-18
CPI Food Non-Food Services
-0,6
-0,4
-0,2
0,0
0,2
0,4
0,6
0,8
Jan
Fe
b
Mar
Ap
r
May
Jun
Jul
Au
g
Se
p
Oct
Nov
Dec
Growth corresponding to 4% inflation 2017 2018
Серия до кла до в о б э ко но мичеСких
иССледо ва ниях 7 No. 3 / April 2017
Talking Trends
Figure 3. Seasonally adjusted price growth, %
MoM
Figure 4. Modified indicators
of core inflation, % MoM
Sources: Rosstat, Bank of Russia calculations. Sources: Rosstat, R&F Department calculations.
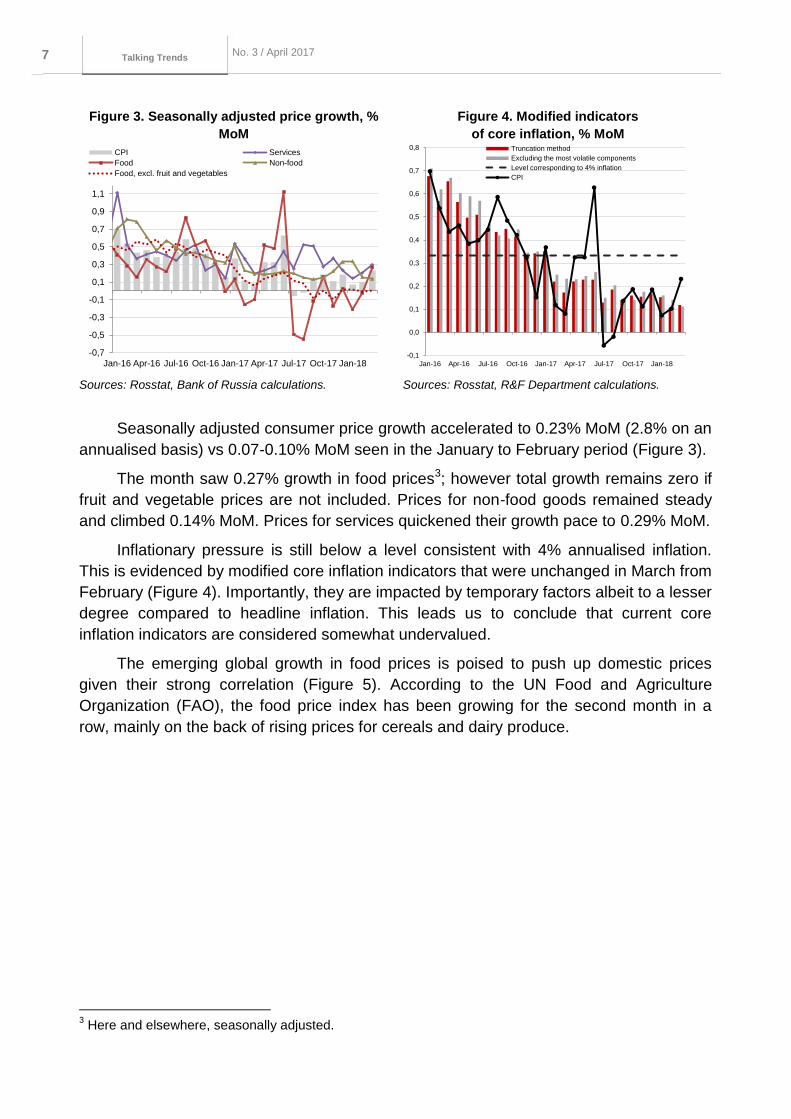
Seasonally adjusted consumer price growth accelerated to 0.23% MoM (2.8% on an
annualised basis) vs 0.07-0.10% MoM seen in the January to February period (Figure 3).
The month saw 0.27% growth in food prices3; however total growth remains zero if
fruit and vegetable prices are not included. Prices for non-food goods remained steady
and climbed 0.14% MoM. Prices for services quickened their growth pace to 0.29% MoM.
Inflationary pressure is still below a level consistent with 4% annualised inflation.
This is evidenced by modified core inflation indicators that were unchanged in March from
February (Figure 4). Importantly, they are impacted by temporary factors albeit to a lesser
degree compared to headline inflation. This leads us to conclude that current core
inflation indicators are considered somewhat undervalued.
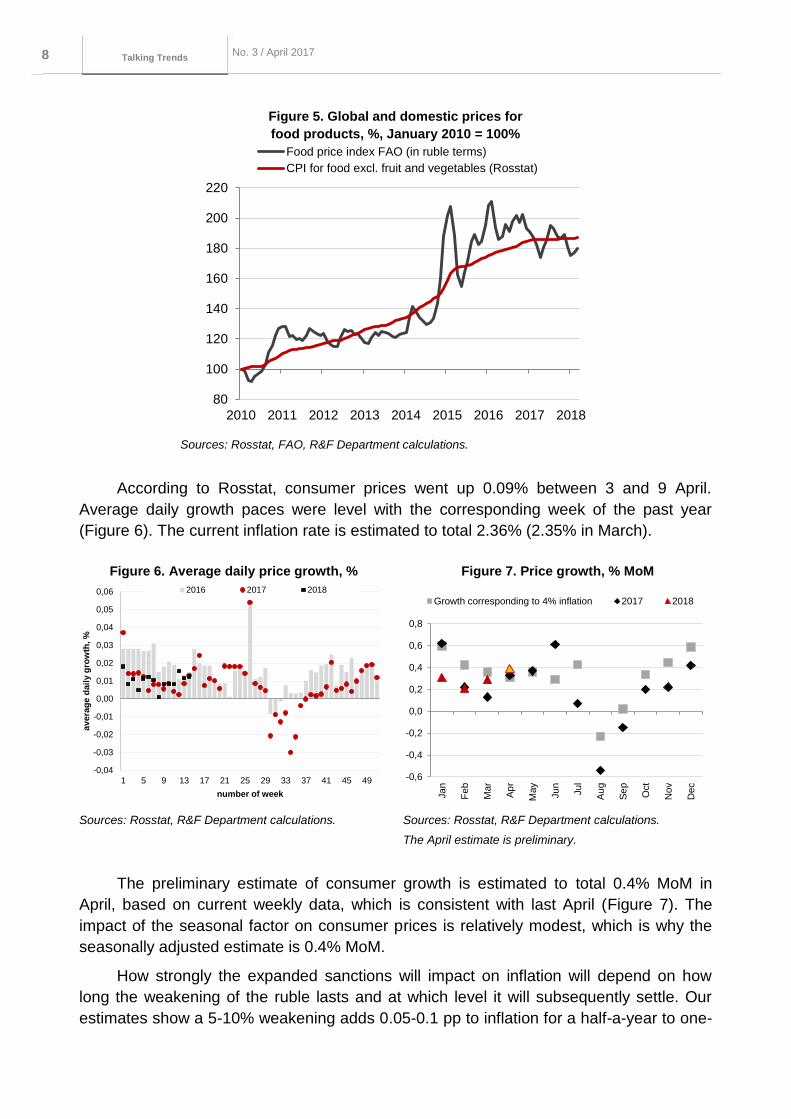
The emerging global growth in food prices is poised to push up domestic prices
given their strong correlation (Figure 5). According to the UN Food and Agriculture
Organization (FAO), the food price index has been growing for the second month in a
row, mainly on the back of rising prices for cereals and dairy produce.
3 Here and elsewhere, seasonally adjusted.
-0,7
-0,5
-0,3
-0,1
0,1
0,3
0,5
0,7
0,9
1,1
Jan-16 Apr-16 Jul-16 Oct-16 Jan-17 Apr-17 Jul-17 Oct-17 Jan-18
CPI Services
Food Non-food
Food, excl. fruit and vegetables
-0,1
0,0
0,1
0,2
0,3
0,4
0,5
0,6
0,7
0,8
Jan-16 Apr-16 Jul-16 Oct-16 Jan-17 Apr-17 Jul-17 Oct-17 Jan-18
Truncation method
Excluding the most volatile components
Level corresponding to 4% inflation
CPI
Серия до кла до в о б э ко но мичеСких
иССледо ва ниях 8 No. 3 / April 2017
Talking Trends
Figure 5. Global and domestic prices for
food products, %, January 2010 = 100%
Sources: Rosstat, FAO, R&F Department calculations.
According to Rosstat, consumer prices went up 0.09% between 3 and 9 April.
Average daily growth paces were level with the corresponding week of the past year
(Figure 6). The current inflation rate is estimated to total 2.36% (2.35% in March).
Figure 6. Average daily price growth, % Figure 7. Price growth, % MoM
Sources: Rosstat, R&F Department calculations. Sources: Rosstat, R&F Department calculations.
The April estimate is preliminary.
The preliminary estimate of consumer growth is estimated to total 0.4% MoM in
April, based on current weekly data, which is consistent with last April (Figure 7). The
impact of the seasonal factor on consumer prices is relatively modest, which is why the
seasonally adjusted estimate is 0.4% MoM.
How strongly the expanded sanctions will impact on inflation will depend on how
long the weakening of the ruble lasts and at which level it will subsequently settle. Our
estimates show a 5-10% weakening adds 0.05-0.1 pp to inflation for a half-a-year to one-
80
100
120
140
160
180
200
220
2010 2011 2012 2013 2014 2015 2016 2017 2018
Food price index FAO (in ruble terms)
CPI for food excl. fruit and vegetables (Rosstat)
-0,04
-0,03
-0,02
-0,01
0,00
0,01
0,02
0,03
0,04
0,05
0,06
1 5 9 13 17 21 25 29 33 37 41 45 49
avera
ge d
ail
y g
row
th, %
number of week
2016 2017 2018
-0,6
-0,4
-0,2
0,0
0,2
0,4
0,6
0,8
Jan
Fe
b
Mar
Ap
r
May
Jun
Jul
Au
g
Se
p
Oct
Nov
Dec
Growth corresponding to 4% inflation 2017 2018
Серия до кла до в о б э ко но мичеСких
иССледо ва ниях 9 No. 3 / April 2017
Talking Trends
year period. Also, the exchange rate settling at a new lower level would affect food
sooner than non-food prices, particularly fruit and vegetable prices. The first reason for
this is seasonal growth in the proportion of fruit and vegetable imports between late
spring and early summer. Secondly, there are longer lags in the procurement of non-food
products.
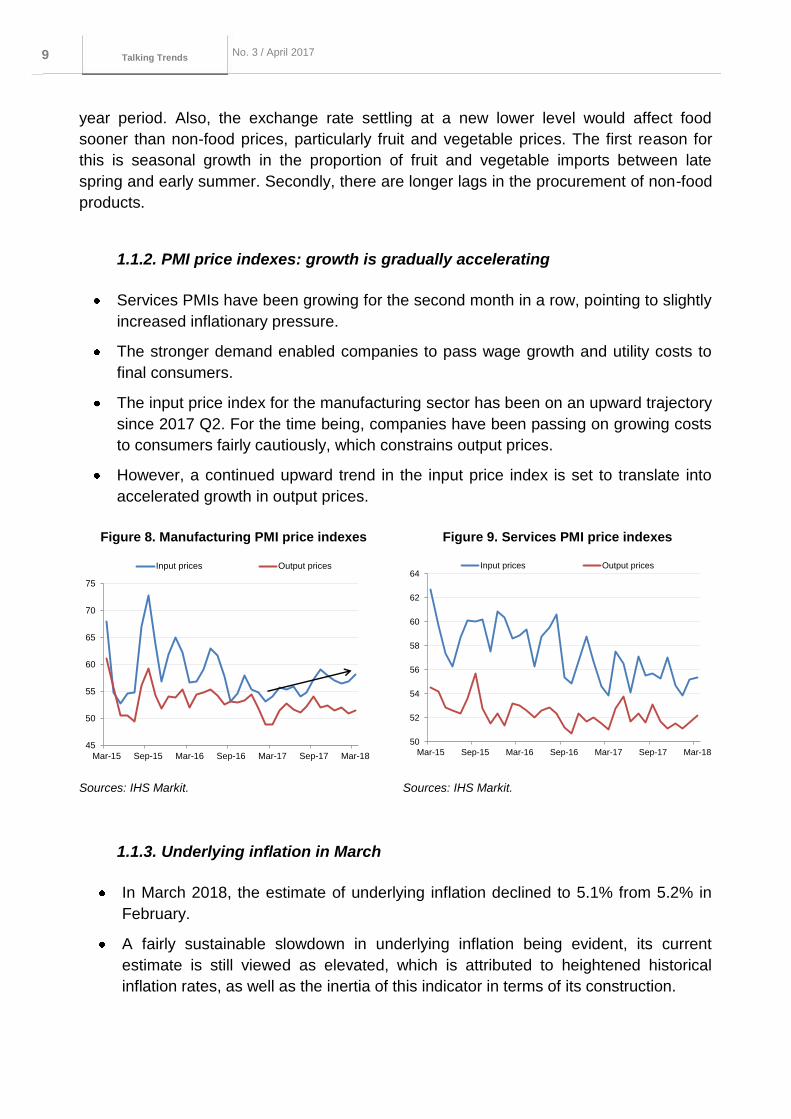
1.1.2. PMI price indexes: growth is gradually accelerating
Services PMIs have been growing for the second month in a row, pointing to slightly
increased inflationary pressure.
The stronger demand enabled companies to pass wage growth and utility costs to
final consumers.
The input price index for the manufacturing sector has been on an upward trajectory
since 2017 Q2. For the time being, companies have been passing on growing costs
to consumers fairly cautiously, which constrains output prices.
However, a continued upward trend in the input price index is set to translate into
accelerated growth in output prices.
Figure 8. Manufacturing PMI price indexes Figure 9. Services PMI price indexes
Sources: IHS Markit. Sources: IHS Markit.
1.1.3. Underlying inflation in March
In March 2018, the estimate of underlying inflation declined to 5.1% from 5.2% in
February.
A fairly sustainable slowdown in underlying inflation being evident, its current
estimate is still viewed as elevated, which is attributed to heightened historical
inflation rates, as well as the inertia of this indicator in terms of its construction.
45
50
55
60
65
70
75
Mar-15 Sep-15 Mar-16 Sep-16 Mar-17 Sep-17 Mar-18
Input prices Output prices
50
52
54
56
58
60
62
64
Mar-15 Sep-15 Mar-16 Sep-16 Mar-17 Sep-17 Mar-18
Input prices Output prices

Серия до кла до в о б э ко но мичеСких
иССледо ва ниях 10 No. 3 / April 2017
Talking Trends
Over a mid-term horizon, the risks of annual inflation moving upwards from 4% still
prevail over the risks of its downward movement away from the target.
Figure 10. CPI, CCPI and historical estimates for underlying
inflation, % YoY
Sources: Rosstat, R&F Department calculations.
1.2. Economic performance
The Russian economy had a good start to 2018. The acceleration was helped by
one-off temporary tailwinds - which also partially offset the slowdown late last year.
Current macroeconomic indicators and survey data suggest economic expansion
continued in the first half of 2018. Moving forward, growth will be supported by higher
domestic demand as real wages increase and the global economy grows. However, there
is stronger uncertainty over short-term GDP trends, driven by a variety of mixed external
factors.
1.2.1. 2017 GDP: growth slows down temporarily in the second half
As follows from a preliminary estimate for 2017 Q4 GDP growth, there was a
substantial slowdown in both annualised GDP and quarterly seasonally adjusted
data.
Behind this is inventory, a volatile component that is difficult to measure.
Against this backdrop, expansion in domestic demand has been sustainable and
consistent with GDP, totalling 1.5% in 2018.
0
2
4
6
8
10
12
14
16
18
2006 2007 2008 2009 2010 2011 2012 2013 2014 2015 2016 2017 2018
CPI Core CPI Underlying inflation

Серия до кла до в о б э ко но мичеСких
иССледо ва ниях 11 No. 3 / April 2017
Talking Trends
In April, Rosstat issued its updated GDP growth estimates including updates on
2015 and 2016, as well as the first preliminary estimate for 2017 Q4 GDP. Our primary
focus is on quarterly estimates.
Figure 11. Contribution of core components to GDP growth, on a year-on-year basis, pp
Source: Rosstat, R&F Department calculations.
In the fourth quarter of 2017, annualised economic growth slowed down
considerably, totalling 0.9% YoY vs 2.2% YoY in the third quarter. The estimate for the
third quarter was substantially upgraded (+0.4 pp on 1.8% YoY previously), which
highlights an even more pronounced drop in the fourth quarter. The current shrinkage is
seemingly based on the preliminary nature of Q4 GDP estimates. However, there was
also a strong downward revision of the R&F Department's seasonally adjusted Q2
estimates, updated based on new statistics. Having said this, our understanding is that it
would be incorrect to read recent data as a quality change for the worse in economic
activity.
Current data show both YoY and QoQ GDP slowdown in the fourth quarter occurred
mainly on the back of poorer gross fixed capital formation, specifically, on the back of the
negative contribution of inventories. Their decline in late 2017 proved stronger than
traditional seasonal trends for the fourth quarter suggested. However, inventories are
known as the most volatile GDP component, normally revised each time an overall GDP
estimate is updated.
-10%
-8%
-6%
-4%
-2%
0%
2%
4%
6%
8%
I 2
01
5
II 2
01
5
III 2
01
5
IV 2
01
5
I 2
01
6
II 2
01
6
III 2
01
6
IV 2
01
6
I 2
01
7
II 2
01
7
III 2
01
7
IV 2
01
7
Consumption Capital formation Net Exports GDP

Серия до кла до в о б э ко но мичеСких
иССледо ва ниях 12 No. 3 / April 2017
Talking Trends
Figure 12. Net export components and their
contribution to annual growth rates, pp
Figure 13. Investment and consumption, and
their contribution to annual growth, pp
Sources: Rosstat, R&F Department calculations. Sources: Rosstat, R&F Department calculations.
At the same time, gross fixed capital formation in the fourth quarter IV, even when
annualised, showed only a slightly worse performance (slowdown to 3.4% YoY against
4.0% QoQ in Q3), while quarter-on-quarter seasonally adjusted growth even picked up its
pace (from 0.5% QoQ to 0.7% QoQ). The same is true of final consumption expenditure
which, viewed on an annual basis, saw stabilisation (3.3% against 3.2% YoY in Q3), with
only a slight quarter-on-quarter deceleration (0.7% vs 1.2% QoQ respectively). This leads
us to conclude that domestic demand remained fairly strong in the period. Naturally, this
was accompanied by slightly accelerated imports, while volumes of exports continued to
show favourable developments as key export commodities sustained on a positive path.
Figure 14. Core GDP components, % QoQ, seasonally adjusted
Source: Rosstat, R&F Department calculations.
-4%
-2%
0%
2%
4%
6%
8%
I 20
15
II 2
015
III 2
01
5
IV 2
015
I 20
16
II 2
016
III 2
01
6
IV 2
016
I 20
17
II 2
017
III 2
01
7
IV 2
017
Exports Imports Net Exports
-10%
-8%
-6%
-4%
-2%
0%
2%
4%
6%
I 20
15
II 2
015
III 2
01
5
IV 2
015
I 20
16
II 2
016
III 2
01
6
IV 2
016
I 20
17
II 2
017
III 2
01
7
IV 2
017
Consumption Investments (GFCF) Inventories
-6%
-4%
-2%
0%
2%
4%
6%
8%
I 2016 II 2016 III 2016 IV 2016 I 2017 II 2017 III 2017 IV 2017
GDP Consumption Capital formation
Investments (GFCF) Exports Imports
Серия до кла до в о б э ко но мичеСких
иССледо ва ниях 13 No. 3 / April 2017
Talking Trends
Based on a review of GDP data for the total 2017 vs preliminary February 2018
statistics, the following changes should be noted. The GDP structure by expenditure
highlights a slight upward adjustment in the growth of imports, which is viewed as natural
given Rosstat's upward revision of the contribution of final consumption expenditure to
annual GDP growth. Importantly, the correction changed Rosstat's previously published
contribution of public expenditure turned positive but dropped relative to 2016. As a
matter of fact, in Rosstat's new version, the total contribution of fixed capital formation to
GDP growth in 2017 even edged down. The upward revision of the gross fixed capital
formation estimate was set off by a downgrade in the estimate of inventories.
As shown by a more detailed study of recent macroeconomic statistics, preliminary
GDP estimates (for more details, see Subsection 2.2.2. GDP growth projections:
fluctuations in short-term statistics do not impede sustainable growth) and leading
indicators, there was no essential deterioration in GDP data. Also, Rosstat's updated
GDP structure suggests stabilised domestic demand.
1.2.2. Industrial output in February: a slight drop as the moderately positive
trend holds
The swings in production are overwhelmingly attributable to the natural volatility of
short-term statistical indicators.
This suggests that slow economic growth, close to its potential, is ongoing.
Industrial output growth slowed down to 1.5% YoY, while the manufacturing sector
reported 1.9% YoY growth.
Several estimates suggest that once statistical and temporal factors are excluded,
there emerges continued growth in industrial production, following a short-lived drop
in late 2017.
Rosstat estimates captured the following decline in February’s industrial production
index: -1.3% MoM. Also, growth paces vs last February are positive: +1.5% YoY. In
particular, positive trends sustain in the mining (+0.3% YoY) and the manufacturing
sector (+1.9% YoY), as well as electricity, gas and steam supply (+1.8% YoY) and water
supply (+1.4% YoY), that is especially evident following their contraction in January.
Seasonally adjusted R&F Department estimates showcase a much more modest
drop in industrial production of 0.5% MoM. Our calculations also show the manufacturing
sector reported a contraction of 0.5% MoM SA. At the same time, the mining sector's
output was level with January; electricity, gas and steam supply and water supply were
up 1.5-2% MoM SA.

Серия до кла до в о б э ко но мичеСких
иССледо ва ниях 14 No. 3 / April 2017
Talking Trends
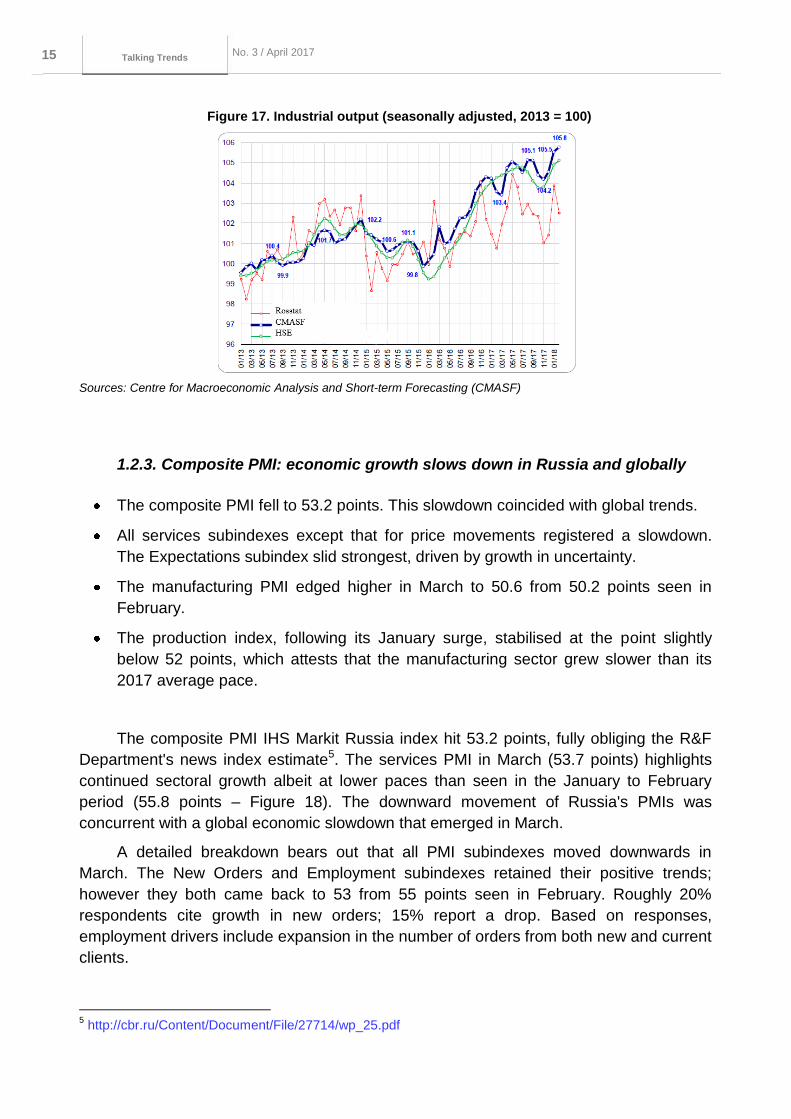
We cannot read this drop as any reason for a reverse in the current trend. Based on
R&F Department trend estimation4, the industrial production index has been positive for
three consecutive months (Figure 15), with the February growth totalling +0.2% MoM.
More so, net positive growth rates are seen across all subindexes, and the positive trend
in the manufacturing sector has maintained since mid-2015 (Figure 16). Respondents for
the industrial sector's February PMI also noted muted growth expansion (51.9), with the
New Orders category gaining the best score (51.7).
This modest growth is further confirmed by the Centre for Macroeconomic Analysis
and Short-term Forecasting data: they record +0.2% MoM growth in the seasonally
adjusted indicator. Their product breakdown singles out gas production (+2.3% MoM),
supported by the cold weather conditions, and the motor industry (+1.1% MoM), where a
gradual recovery follows the 2015 shrinkage.
These data in their entirety suggest that the February drop is within the range of
regular industrial production index swings. Therefore, the upward trend, backed up by
positive producer and buyer sentiment in early 2018, is highly likely to sustain in the
months to come, as the 2018 economic growth is set to total 1.5-2.0%, a pace consistent
with its potential.
Figure 15. Industrial production index
(2014 = 100)
Figure 16. Mining output and manufacturing
sector output indexes (2014 = 100)
Sources: Rosstat, R&F Department calculations. Sources: Rosstat, R&F Department calculations.
4 Obtained in the course of the TRAMO/SEATS procedure for seasonal adjustment.
98
99
100
101
102
103
104
2014 2015 2016 2017 2018
IP - SA IP - trend
98
99
100
101
102
103
104
105
106
107
108
2014 2015 2016 2017 2018
Mining - SA
Mining - trend
Manufacturing - SA
Manufacturing - trend
Серия до кла до в о б э ко но мичеСких
иССледо ва ниях 15 No. 3 / April 2017
Talking Trends
Figure 17. Industrial output (seasonally adjusted, 2013 = 100)
Sources: Centre for Macroeconomic Analysis and Short-term Forecasting (CMASF)
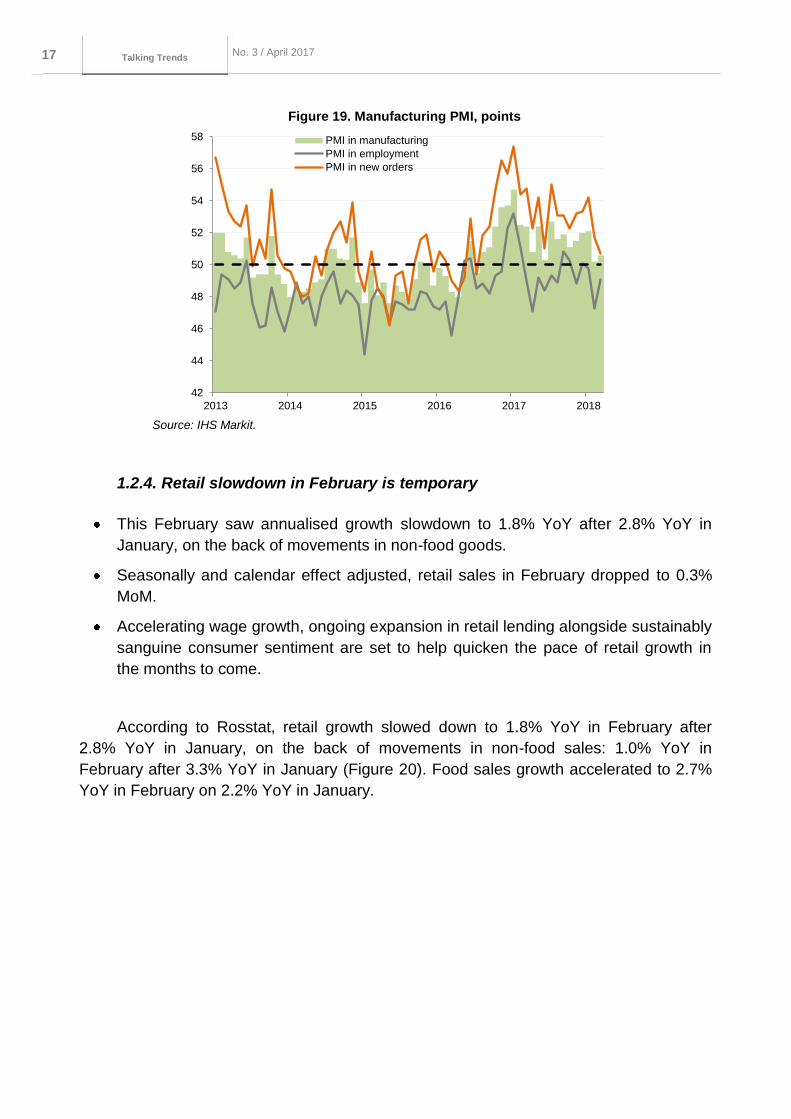
1.2.3. Composite PMI: economic growth slows down in Russia and globally
The composite PMI fell to 53.2 points. This slowdown coincided with global trends.
All services subindexes except that for price movements registered a slowdown.
The Expectations subindex slid strongest, driven by growth in uncertainty.
The manufacturing PMI edged higher in March to 50.6 from 50.2 points seen in
February.
The production index, following its January surge, stabilised at the point slightly
below 52 points, which attests that the manufacturing sector grew slower than its
2017 average pace.
The composite PMI IHS Markit Russia index hit 53.2 points, fully obliging the R&F
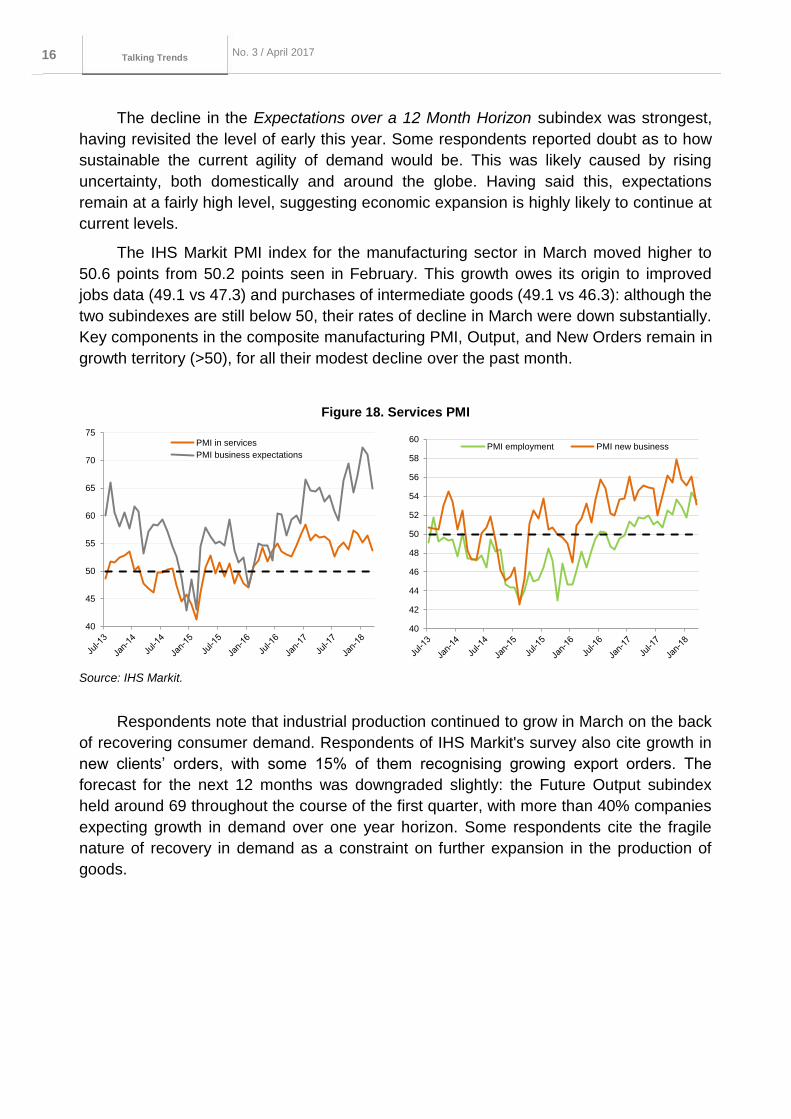
Department's news index estimate5. The services PMI in March (53.7 points) highlights
continued sectoral growth albeit at lower paces than seen in the January to February
period (55.8 points – Figure 18). The downward movement of Russia's PMIs was
concurrent with a global economic slowdown that emerged in March.
A detailed breakdown bears out that all PMI subindexes moved downwards in
March. The New Orders and Employment subindexes retained their positive trends;
however they both came back to 53 from 55 points seen in February. Roughly 20%
respondents cite growth in new orders; 15% report a drop. Based on responses,
employment drivers include expansion in the number of orders from both new and current
clients.
5 http://cbr.ru/Content/Document/File/27714/wp_25.pdf
Серия до кла до в о б э ко но мичеСких
иССледо ва ниях 16 No. 3 / April 2017
Talking Trends
The decline in the Expectations over a 12 Month Horizon subindex was strongest,
having revisited the level of early this year. Some respondents reported doubt as to how
sustainable the current agility of demand would be. This was likely caused by rising
uncertainty, both domestically and around the globe. Having said this, expectations
remain at a fairly high level, suggesting economic expansion is highly likely to continue at
current levels.
The IHS Markit PMI index for the manufacturing sector in March moved higher to
50.6 points from 50.2 points seen in February. This growth owes its origin to improved
jobs data (49.1 vs 47.3) and purchases of intermediate goods (49.1 vs 46.3): although the
two subindexes are still below 50, their rates of decline in March were down substantially.
Key components in the composite manufacturing PMI, Output, and New Orders remain in
growth territory (>50), for all their modest decline over the past month.
Figure 18. Services PMI
Source: IHS Markit.
Respondents note that industrial production continued to grow in March on the back
of recovering consumer demand. Respondents of IHS Markit's survey also cite growth in
new clients’ orders, with some 15% of them recognising growing export orders. The
forecast for the next 12 months was downgraded slightly: the Future Output subindex
held around 69 throughout the course of the first quarter, with more than 40% companies
expecting growth in demand over one year horizon. Some respondents cite the fragile
nature of recovery in demand as a constraint on further expansion in the production of
goods.
40
45
50
55
60
65
70
75PMI in services
PMI business expectations
40
42
44
46
48
50
52
54
56
58
60PMI employment PMI new business
Серия до кла до в о б э ко но мичеСких
иССледо ва ниях 17 No. 3 / April 2017
Talking Trends
Figure 19. Manufacturing PMI, points
Source: IHS Markit.
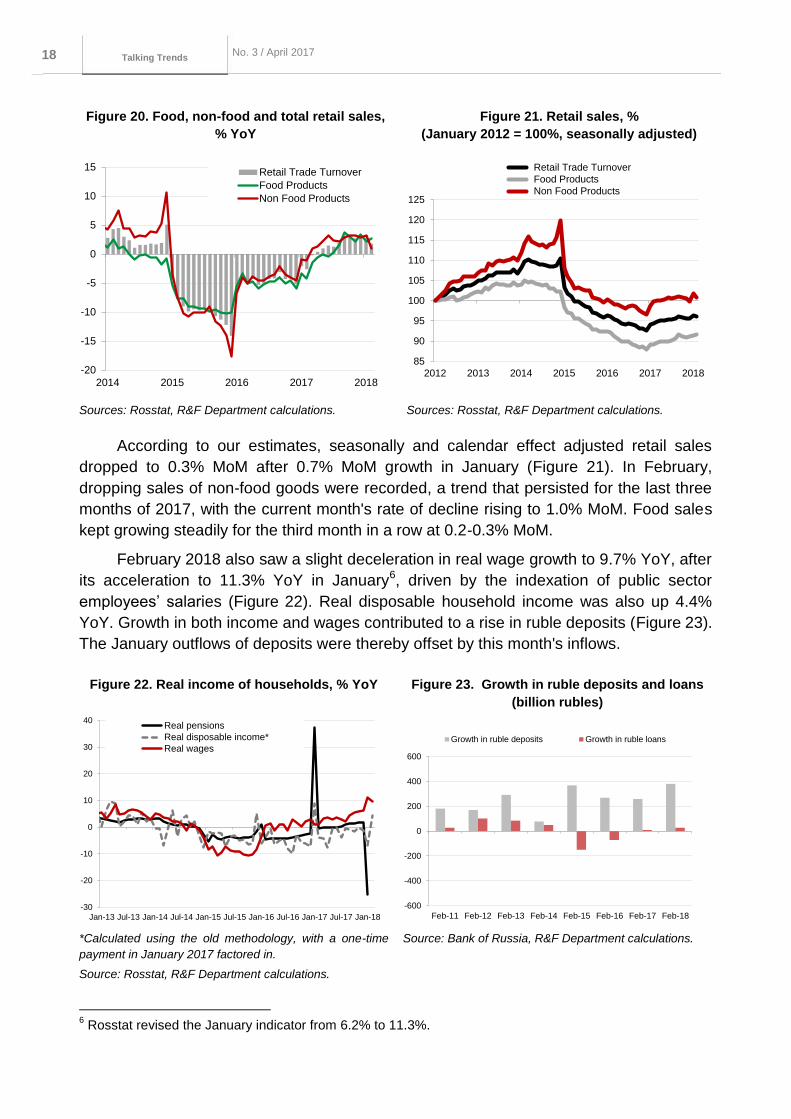
1.2.4. Retail slowdown in February is temporary
This February saw annualised growth slowdown to 1.8% YoY after 2.8% YoY in
January, on the back of movements in non-food goods.
Seasonally and calendar effect adjusted, retail sales in February dropped to 0.3%
MoM.
Accelerating wage growth, ongoing expansion in retail lending alongside sustainably
sanguine consumer sentiment are set to help quicken the pace of retail growth in
the months to come.
According to Rosstat, retail growth slowed down to 1.8% YoY in February after
2.8% YoY in January, on the back of movements in non-food sales: 1.0% YoY in
February after 3.3% YoY in January (Figure 20). Food sales growth accelerated to 2.7%
YoY in February on 2.2% YoY in January.
42
44
46
48
50
52
54
56
58
2013 2014 2015 2016 2017 2018
PMI in manufacturing
PMI in employment
PMI in new orders
Серия до кла до в о б э ко но мичеСких
иССледо ва ниях 18 No. 3 / April 2017
Talking Trends
Figure 20. Food, non-food and total retail sales,
% YoY
Figure 21. Retail sales, %
(January 2012 = 100%, seasonally adjusted)
Sources: Rosstat, R&F Department calculations. Sources: Rosstat, R&F Department calculations.
According to our estimates, seasonally and calendar effect adjusted retail sales
dropped to 0.3% MoM after 0.7% MoM growth in January (Figure 21). In February,
dropping sales of non-food goods were recorded, a trend that persisted for the last three
months of 2017, with the current month's rate of decline rising to 1.0% MoM. Food sales
kept growing steadily for the third month in a row at 0.2-0.3% MoM.
February 2018 also saw a slight deceleration in real wage growth to 9.7% YoY, after
its acceleration to 11.3% YoY in January6, driven by the indexation of public sector
employees’ salaries (Figure 22). Real disposable household income was also up 4.4%
YoY. Growth in both income and wages contributed to a rise in ruble deposits (Figure 23).
The January outflows of deposits were thereby offset by this month's inflows.
6 Rosstat revised the January indicator from 6.2% to 11.3%.
-20
-15
-10
-5
0
5
10
15
2014 2015 2016 2017 2018
Retail Trade Turnover
Food Products
Non Food Products
85
90
95
100
105
110
115
120
125
2012 2013 2014 2015 2016 2017 2018
Retail Trade Turnover
Food Products
Non Food Products
Figure 22. Real income of households, % YoY Figure 23. Growth in ruble deposits and loans
(billion rubles)
*Calculated using the old methodology, with a one-time
payment in January 2017 factored in.
Source: Rosstat, R&F Department calculations.
Source: Bank of Russia, R&F Department calculations.
-30
-20
-10
0
10
20
30
40
Jan-13 Jul-13 Jan-14 Jul-14 Jan-15 Jul-15 Jan-16 Jul-16 Jan-17 Jul-17 Jan-18
Real pensions
Real disposable income*
Real wages
-600
-400
-200
0
200
400
600
Feb-11 Feb-12 Feb-13 Feb-14 Feb-15 Feb-16 Feb-17 Feb-18
Growth in ruble deposits Growth in ruble loans
Серия до кла до в о б э ко но мичеСких
иССледо ва ниях 19 No. 3 / April 2017
Talking Trends
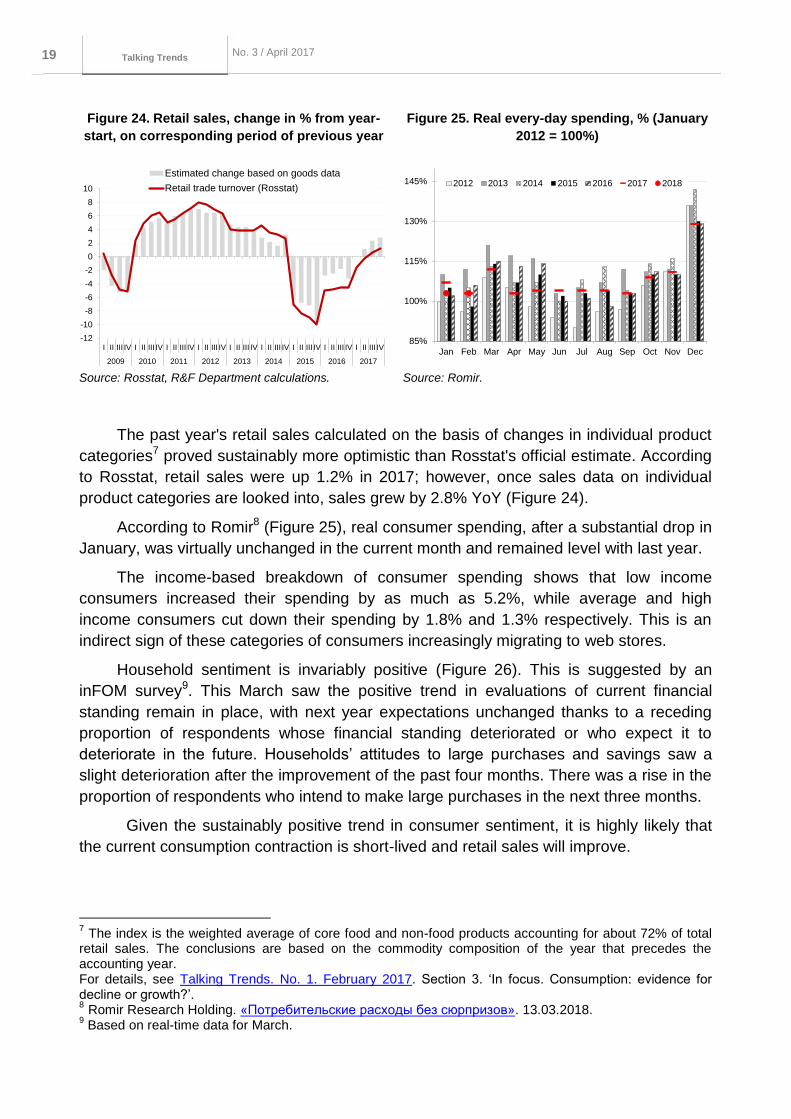
The past year's retail sales calculated on the basis of changes in individual product
categories7 proved sustainably more optimistic than Rosstat's official estimate. According
to Rosstat, retail sales were up 1.2% in 2017; however, once sales data on individual
product categories are looked into, sales grew by 2.8% YoY (Figure 24).
According to Romir8 (Figure 25), real consumer spending, after a substantial drop in
January, was virtually unchanged in the current month and remained level with last year.
The income-based breakdown of consumer spending shows that low income
consumers increased their spending by as much as 5.2%, while average and high
income consumers cut down their spending by 1.8% and 1.3% respectively. This is an
indirect sign of these categories of consumers increasingly migrating to web stores.
Household sentiment is invariably positive (Figure 26). This is suggested by an
inFOM survey9. This March saw the positive trend in evaluations of current financial
standing remain in place, with next year expectations unchanged thanks to a receding
proportion of respondents whose financial standing deteriorated or who expect it to
deteriorate in the future. Households’ attitudes to large purchases and savings saw a
slight deterioration after the improvement of the past four months. There was a rise in the
proportion of respondents who intend to make large purchases in the next three months.
Given the sustainably positive trend in consumer sentiment, it is highly likely that
the current consumption contraction is short-lived and retail sales will improve.
7 The index is the weighted average of core food and non-food products accounting for about 72% of total
retail sales. The conclusions are based on the commodity composition of the year that precedes the accounting year. For details, see Talking Trends. No. 1. February 2017. Section 3. ‘In focus. Consumption: evidence for decline or growth?’. 8 Romir Research Holding. «Потребительские расходы без сюрпризов». 13.03.2018. 9 Based on real-time data for March.
Figure 24. Retail sales, change in % from year-
start, on corresponding period of previous year
Figure 25. Real every-day spending, % (January
2012 = 100%)
Source: Rosstat, R&F Department calculations. Source: Romir.
-12
-10
-8
-6
-4
-2
0
2
4
6
8
10
I II III IV I II III IV I II III IV I II III IV I II III IV I II III IV I II III IV I II III IV I II III IV
2009 2010 2011 2012 2013 2014 2015 2016 2017
Estimated change based on goods data
Retail trade turnover (Rosstat)
85%
100%
115%
130%
145%
Jan Feb Mar Apr May Jun Jul Aug Sep Oct Nov Dec
2012 2013 2014 2015 2016 2017 2018

Серия до кла до в о б э ко но мичеСких
иССледо ва ниях 20 No. 3 / April 2017
Talking Trends
Figure 26. Consumer sentiment index and its components
Source: inFOM survey.
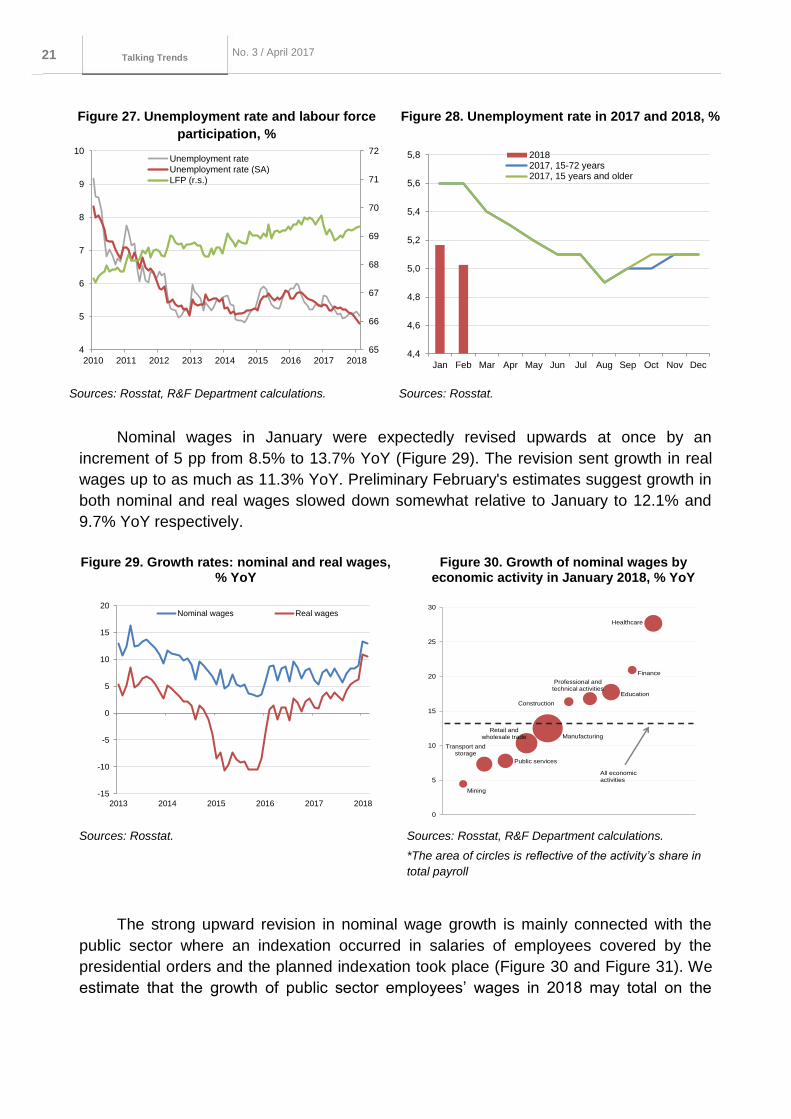
1.2.5. Inflation risks from the labour market side are on the rise
In February, unemployment, at a seasonally adjusted 4.8%, hit a new all-time low,
which is indicative of growing pressure on the private sector’s wages.
The annual growth pace of nominal wages in January was revised upwards by 5 pp,
essentially driven by public sector and oil sector data.
The growth of nominal wages may exceed 10% for 2018, thereby bringing about
conditions for accelerated inflation.
Unemployment rate was 5.0% in February vs 5.2% in January. In the first two
months of the current year, unemployment rates are approximately 0.5 pp lower than in
the corresponding period of the past year. A seasonally adjusted unemployment rate hit a
new historical low of 4.8%, reflecting the overall decline in the number of available labour
resources (Figure 27).
Beginning from 2018, Rosstat changes the methodology10 for calculating this
indicator, with so far little implications for its performance, though (Figure 28). The 2017
and 2018 methodology collation makes it clear that unemployment rate remained virtually
unchanged. This suggests fundamental rather than technical factors are behind the
decline in unemployment.
10
According to Rosstat, since 2018, economically active population has included people aged 15 and older; previously, people aged 15-72 were included.
30
40
50
60
70
80
90
100
110
120
Jan-14 Jul-14 Jan-15 Jul-15 Jan-16 Jul-16 Jan-17 Jul-17 Jan-18
Consumer sentiment index
Estimates of personal financial well-being (last year)
Expectations of personal financial well-being (1 year ahead)
Index of Big-Budget Purchases
Index of Savings
Index of Purchases on Credit
Серия до кла до в о б э ко но мичеСких
иССледо ва ниях 21 No. 3 / April 2017
Talking Trends
Figure 27. Unemployment rate and labour force
participation, %
Figure 28. Unemployment rate in 2017 and 2018, %
Sources: Rosstat, R&F Department calculations. Sources: Rosstat.
Nominal wages in January were expectedly revised upwards at once by an
increment of 5 pp from 8.5% to 13.7% YoY (Figure 29). The revision sent growth in real
wages up to as much as 11.3% YoY. Preliminary February's estimates suggest growth in
both nominal and real wages slowed down somewhat relative to January to 12.1% and
9.7% YoY respectively.
Figure 29. Growth rates: nominal and real wages, % YoY
Figure 30. Growth of nominal wages by economic activity in January 2018, % YoY
Sources: Rosstat. Sources: Rosstat, R&F Department calculations.
*The area of circles is reflective of the activity’s share in
total payroll
The strong upward revision in nominal wage growth is mainly connected with the
public sector where an indexation occurred in salaries of employees covered by the
presidential orders and the planned indexation took place (Figure 30 and Figure 31). We
estimate that the growth of public sector employees’ wages in 2018 may total on the
65
66
67
68
69
70
71
72
4
5
6
7
8
9
10
2010 2011 2012 2013 2014 2015 2016 2017 2018
Unemployment rate
Unemployment rate (SA)
LFP (r.s.)
4,4
4,6
4,8
5,0
5,2
5,4
5,6
5,8
Jan Feb Mar Apr May Jun Jul Aug Sep Oct Nov Dec
20182017, 15-72 years2017, 15 years and older
-15
-10
-5
0
5
10
15
20
2013 2014 2015 2016 2017 2018
Nominal wages Real wages
Mining
Transport and storage
Public services
Retail and wholesale trade Manufacturing
Construction
Professional and technical activities
Education
Finance
Healthcare
0
5
10
15
20
25
30
All economic activities
Серия до кла до в о б э ко но мичеСких
иССледо ва ниях 22 No. 3 / April 2017
Talking Trends
order of 13-15% YoY, while the 2019 growth is set to decline consistent with inflation
(4%) barring any other salary reviews.
Figure 31. Nominal wage growth in the private
and public sector, % YoY
Figure 32. Nominal wage growth in the private
sector including and excluding oil refining, %
YoY
Sources: Rosstat, R&F Department calculations.
*The dotted line stands for monthly YoY growth, the solid
line stands for the rolling average for 6 months.
Sources: Rosstat, R&F Department calculations.
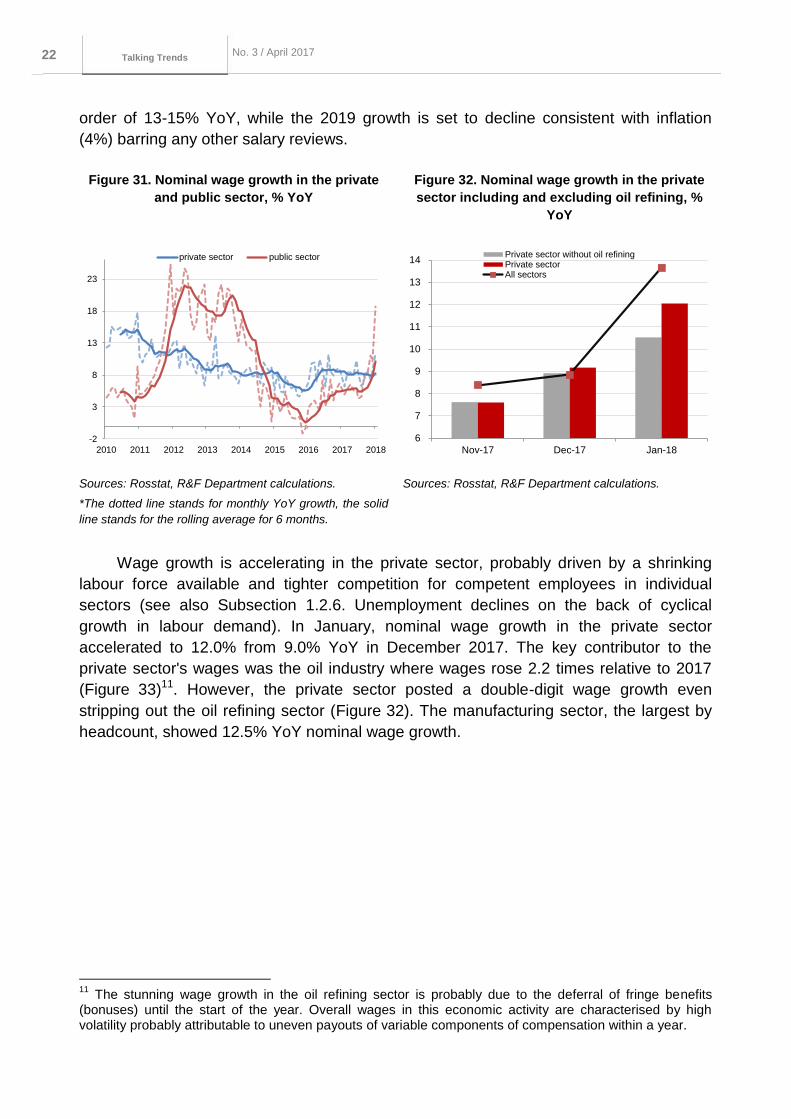
Wage growth is accelerating in the private sector, probably driven by a shrinking
labour force available and tighter competition for competent employees in individual
sectors (see also Subsection 1.2.6. Unemployment declines on the back of cyclical
growth in labour demand). In January, nominal wage growth in the private sector
accelerated to 12.0% from 9.0% YoY in December 2017. The key contributor to the
private sector's wages was the oil industry where wages rose 2.2 times relative to 2017
(Figure 33)11. However, the private sector posted a double-digit wage growth even
stripping out the oil refining sector (Figure 32). The manufacturing sector, the largest by
headcount, showed 12.5% YoY nominal wage growth.
11
The stunning wage growth in the oil refining sector is probably due to the deferral of fringe benefits (bonuses) until the start of the year. Overall wages in this economic activity are characterised by high volatility probably attributable to uneven payouts of variable components of compensation within a year.
-2
3
8
13
18
23
2010 2011 2012 2013 2014 2015 2016 2017 2018
private sector public sector
6
7
8
9
10
11
12
13
14
Nov-17 Dec-17 Jan-18
Private sector without oil refiningPrivate sectorAll sectors
Серия до кла до в о б э ко но мичеСких
иССледо ва ниях 23 No. 3 / April 2017
Talking Trends
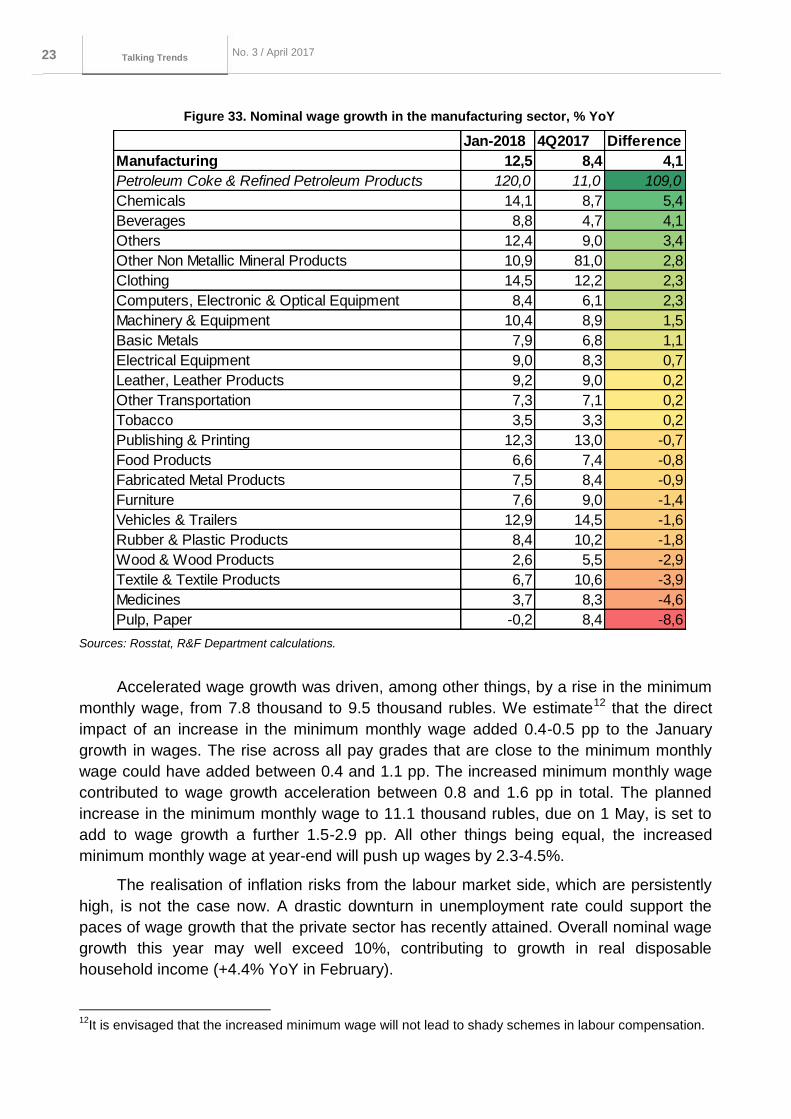
Figure 33. Nominal wage growth in the manufacturing sector, % YoY
Sources: Rosstat, R&F Department calculations.
Accelerated wage growth was driven, among other things, by a rise in the minimum
monthly wage, from 7.8 thousand to 9.5 thousand rubles. We estimate12 that the direct
impact of an increase in the minimum monthly wage added 0.4-0.5 pp to the January
growth in wages. The rise across all pay grades that are close to the minimum monthly
wage could have added between 0.4 and 1.1 pp. The increased minimum monthly wage
contributed to wage growth acceleration between 0.8 and 1.6 pp in total. The planned
increase in the minimum monthly wage to 11.1 thousand rubles, due on 1 May, is set to
add to wage growth a further 1.5-2.9 pp. All other things being equal, the increased
minimum monthly wage at year-end will push up wages by 2.3-4.5%.
The realisation of inflation risks from the labour market side, which are persistently
high, is not the case now. A drastic downturn in unemployment rate could support the
paces of wage growth that the private sector has recently attained. Overall nominal wage
growth this year may well exceed 10%, contributing to growth in real disposable
household income (+4.4% YoY in February).
12
It is envisaged that the increased minimum wage will not lead to shady schemes in labour compensation.
Jan-2018 4Q2017 Difference
Manufacturing 12,5 8,4 4,1
Petroleum Coke & Refined Petroleum Products 120,0 11,0 109,0
Chemicals 14,1 8,7 5,4
Beverages 8,8 4,7 4,1
Others 12,4 9,0 3,4
Other Non Metallic Mineral Products 10,9 81,0 2,8
Clothing 14,5 12,2 2,3
Computers, Electronic & Optical Equipment 8,4 6,1 2,3
Machinery & Equipment 10,4 8,9 1,5
Basic Metals 7,9 6,8 1,1
Electrical Equipment 9,0 8,3 0,7
Leather, Leather Products 9,2 9,0 0,2
Other Transportation 7,3 7,1 0,2
Tobacco 3,5 3,3 0,2
Publishing & Printing 12,3 13,0 -0,7
Food Products 6,6 7,4 -0,8
Fabricated Metal Products 7,5 8,4 -0,9
Furniture 7,6 9,0 -1,4
Vehicles & Trailers 12,9 14,5 -1,6
Rubber & Plastic Products 8,4 10,2 -1,8
Wood & Wood Products 2,6 5,5 -2,9
Textile & Textile Products 6,7 10,6 -3,9
Medicines 3,7 8,3 -4,6
Pulp, Paper -0,2 8,4 -8,6
Серия до кла до в о б э ко но мичеСких
иССледо ва ниях 24 No. 3 / April 2017
Talking Trends
1.2.6. Unemployment declines on the back of cyclical growth in labour
demand
The extended unemployment indicators declined in the course of 2017 at a quicker
pace than the standard U3 indicator, which suggests an ongoing shift in the labour
market's balance to a labour shortage.
Unemployment reduction is mostly driven by growing demand for labour, while
changes in the age structure can account for a mere 0.1 of the 0.4 pp reduction in
unemployment in 2017.
The extended unemployment indicators point to an ongoing shift in the labour
market's balance to a labour shortage. They are declining at a faster pace that the
standard unemployment rate (U3) calculated by Rosstat.
The U613 indicator, which includes workers with a work week under 30 hours, went
down in 2017 to 12.9% from 13.4% in 2016 (Figure 34). Therefore, companies have
increasingly scarce resources to expand production without additional jobs. Another
indicator exposing reduced underutilisation of labour resources is the potential work
force, which is included into the extended unemployment indicator U514. It fell from 9.0 to
8.5%. All the three indicators are at their all-time lows.
The direct impact from the changing age structure on reduction in unemployment
appears moderate. Our estimates show this explains a mere 0.1 of the 0.4 pp reduction in
unemployment in 2017 vs 2016 (Figure 35). Among other factors dragging down
unemployment is cyclical growth in labour demand. Corporate demand for manpower
reported to state employment offices is recovering quickly, following a sharp decline
between late 2014 – early 2015 (Figure 35). HeadHunter’s data also confirm that demand
for job force is growing quickly: between January and March, growth in vacancies totalled
44.0% YoY15.
13
Includes the number of unemployed; economically inactive population that is not seeking employment but is willing to take on a job; and those employed for less than 30 hours a week. 14
Includes the number of unemployed and economically inactive population that is not seeking employment but is willing to take on a job. 15
https://stats.hh.ru

Серия до кла до в о б э ко но мичеСких
иССледо ва ниях 25 No. 3 / April 2017
Talking Trends
Figure 34. Extended unemployment indicators
(seasonally adjusted), %
Figure 35. Factors driving lower 2017
unemployment* vs 2016, %
Sources: Rosstat, R&F Department calculations. Sources: Rosstat, R&F Department calculations.
* Unemployment indicators are calculated for those aged 15-59
following changes to the calculation methodology covering older age
groups.
Figure 36. Corporate demand for manpower
reported to state employment offices, thousand
employees
Figure 37. The Beveridge curve
Sources: Rosstat. Sources: Rosstat, R&F Department calculations.
The Beveridge curve is a graphical representation of the relationship between
demand for labour and unemployment rate16 (Figure 37). Overall unemployment trends in
2015-2017 are mainly explained by cyclical factors, that is, decreased / increased
demand for labour. However, it is interesting to note that those years saw a significant
16
A graphical representation of the relationship between unemployment and the job vacancy rate. The curve was named after the British economist William Beveridge (1879-1963). A division into years is based on statistical tests for structural gaps in a linear regression, and is in our view a fairly good representation of crucial labour market changes. A movement along the curve usually denotes a change in unemployment rate caused by cyclical factors, while a shift in the curve signals the presence of structural factors. The latter factors include, among other things, demographic factors and changes in the levels of frictional and structural unemployment.
4,0
6,0
8,0
10,0
12,0
14,0
16,0
18,0
2010 2011 2012 2013 2014 2015 2016 2017
U3 U5 U6
5,2
5,6 0,3
0,1
5,0
5,1
5,2
5,3
5,4
5,5
5,6
5,7
Unemploymentrate, 2016
age structure other factors Unemploymentrate, 2017
1,2
1,4
1,6
1,8
2,0
2,2
2,4
2,6
2010 2011 2012 2013 2014 2015 2016 2017 2018 1,1
1,3
1,5
1,7
1,9
2,1
2,3
2,5
4,5 5,0 5,5 6,0 6,5 7,0 7,5 8,0 8,5 9,0
lev
el
of
av
ail
ab
le j
ob
s,
%
Unemployment rate, %
2004-2007 2007-2009 2009-2012 2012-2014 2015-2018

Серия до кла до в о б э ко но мичеСких
иССледо ва ниях 26 No. 3 / April 2017
Talking Trends
shift leftwards in the curve relative to prior years, suggesting the natural rates of
unemployment may have declined.
1.2.8. Q1 growth in lending to the economy hit the high of this phase of
economic growth
In the first quarter, growth in lending to the economy hit the highest reading at this
stage of economic recovery.
Mortgage lending showed the highest growth rate, while consumer and corporate
lending also demonstrated sustainable growth.
Overdue loans increased to 6.9% in the corporate loan portfolio and dropped to
6.7% in the retail loan portfolio in the first quarter.
Growth in lending to the economy proved the most significant at the current stage of
economic growth in 2018 Q1. According to our estimates, annualised three-month growth
in lending17 to the economy exceeded 12% in the first quarter.
Growth in the corporate loan portfolio (adjusted for seasonality and foreign
exchange revaluation) slowed in March compared to previous months (Figure 38). This
was triggered both by the shrinking corporate FX loan portfolio and slower growth18 of
ruble lending. Nevertheless, growth rates remain considerably high, exceeding the
average monthly growth - in 2015-2017. That said, the revival is largely driven by short-
term lending (Figure 41).
Figure 38. Lending, % MoM (seasonally and FX
revaluation adjusted)
Figure 39. Ruble retail lending and its main
components, % MoM (seasonally adjusted)
Source: Bank of Russia calculations. Source: Bank of Russia calculations.
17
Adjusted for seasonality and foreign exchange revaluation 18
Seasonally adjusted.
-2,0
-1,5
-1,0
-0,5
0,0
0,5
1,0
1,5
2,0
Jan-15 Jul-15 Jan-16 Jul-16 Jan-17 Jul-17 Jan-18
corporate lending retail lending
-2,0
-1,5
-1,0
-0,5
0,0
0,5
1,0
1,5
2,0
2,5
3,0
Jan-15 Jul-15 Jan-16 Jul-16 Jan-17 Jul-17 Jan-18
other credits mortgage
Серия до кла до в о б э ко но мичеСких
иССледо ва ниях 27 No. 3 / April 2017
Talking Trends
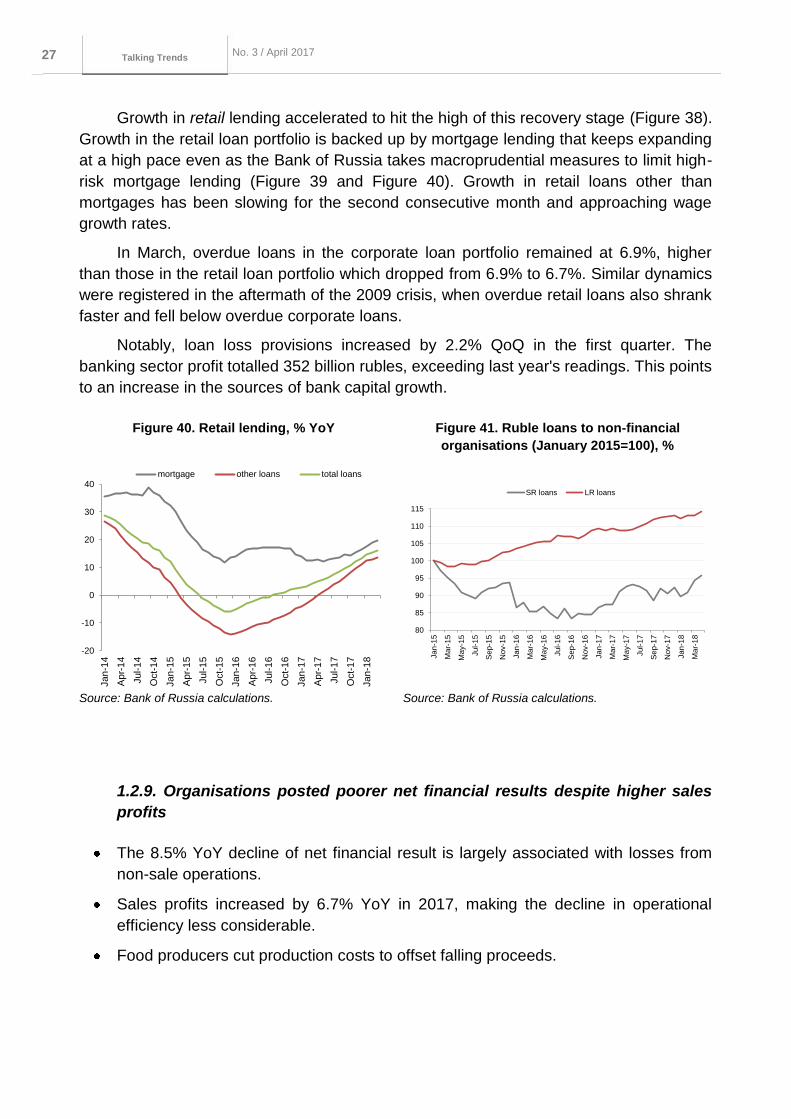
Growth in retail lending accelerated to hit the high of this recovery stage (Figure 38).
Growth in the retail loan portfolio is backed up by mortgage lending that keeps expanding
at a high pace even as the Bank of Russia takes macroprudential measures to limit high-
risk mortgage lending (Figure 39 and Figure 40). Growth in retail loans other than
mortgages has been slowing for the second consecutive month and approaching wage
growth rates.
In March, overdue loans in the corporate loan portfolio remained at 6.9%, higher
than those in the retail loan portfolio which dropped from 6.9% to 6.7%. Similar dynamics
were registered in the aftermath of the 2009 crisis, when overdue retail loans also shrank
faster and fell below overdue corporate loans.
Notably, loan loss provisions increased by 2.2% QoQ in the first quarter. The
banking sector profit totalled 352 billion rubles, exceeding last year's readings. This points
to an increase in the sources of bank capital growth.
Figure 40. Retail lending, % YoY
Figure 41. Ruble loans to non-financial
organisations (January 2015=100), %
Source: Bank of Russia calculations. Source: Bank of Russia calculations.
1.2.9. Organisations posted poorer net financial results despite higher sales
profits
The 8.5% YoY decline of net financial result is largely associated with losses from
non-sale operations.
Sales profits increased by 6.7% YoY in 2017, making the decline in operational
efficiency less considerable.
Food producers cut production costs to offset falling proceeds.
-20
-10
0
10
20
30
40
Ja
n-1
4
Ap
r-1
4
Jul-1
4
Oct-
14
Ja
n-1
5
Apr-
15
Ju
l-1
5
Oct-
15
Ja
n-1
6
Ap
r-1
6
Ju
l-1
6
Oct-
16
Ja
n-1
7
Ap
r-1
7
Jul-1
7
Oct-
17
Ja
n-1
8
mortgage other loans total loans
80
85
90
95
100
105
110
115
Jan
-15
Ma
r-1
5
Ma
y-1
5
Jul-
15
Se
p-1
5
Nov-1
5
Jan
-16
Ma
r-1
6
Ma
y-1
6
Jul-
16
Se
p-1
6
Nov-1
6
Jan
-17
Ma
r-1
7
Ma
y-1
7
Jul-
17
Se
p-1
7
Nov-1
7
Jan
-18
Ma
r-1
8
SR loans LR loans
Серия до кла до в о б э ко но мичеСких
иССледо ва ниях 28 No. 3 / April 2017
Talking Trends
Greater production efficiency helps agricultural producers retain high profitability
despite the price downturn. This structural factor may keep food inflation low in the
future.
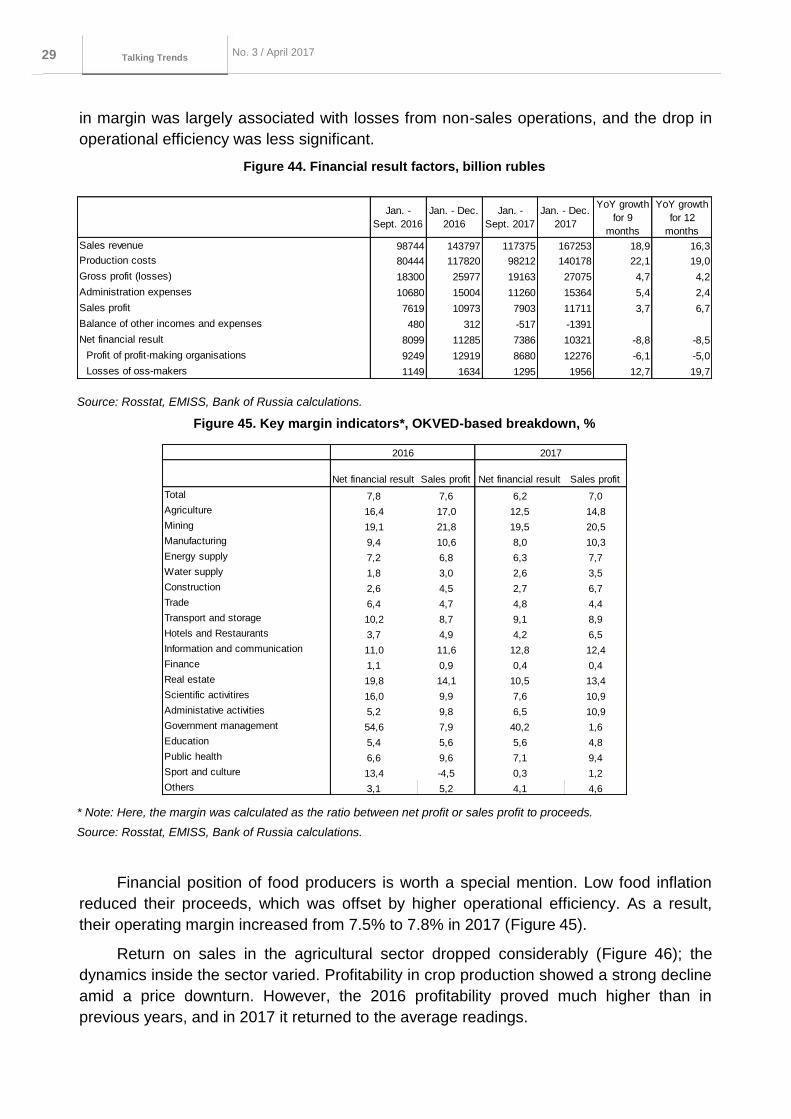
According to Rosstat, companies’ 2017 net financial result19 totalled 10.3 trillion
rubles, 8.5% less than a year earlier. Importantly, a lower financial result has so far failed
to restrict investment. Fixed capital investment increased by 4.4% YoY in 2017.
Figure 42. Non-sales operation balance (billion
rubles) and RUB/USD exchange rate (% QoQ)
Figure 43. Economic margins*, %
* Breakdown through 2016 was based on the OKVED
classifier; the OKVED-2 classifier has been applied since
2017. Quarterly data since 2013 Q1.
Source: Rosstat, Bank of Russia calculations.
* Note: The margin was calculated as the ratio between
net profit or sales profit to proceeds.
Source: Rosstat, Bank of Russia calculations.
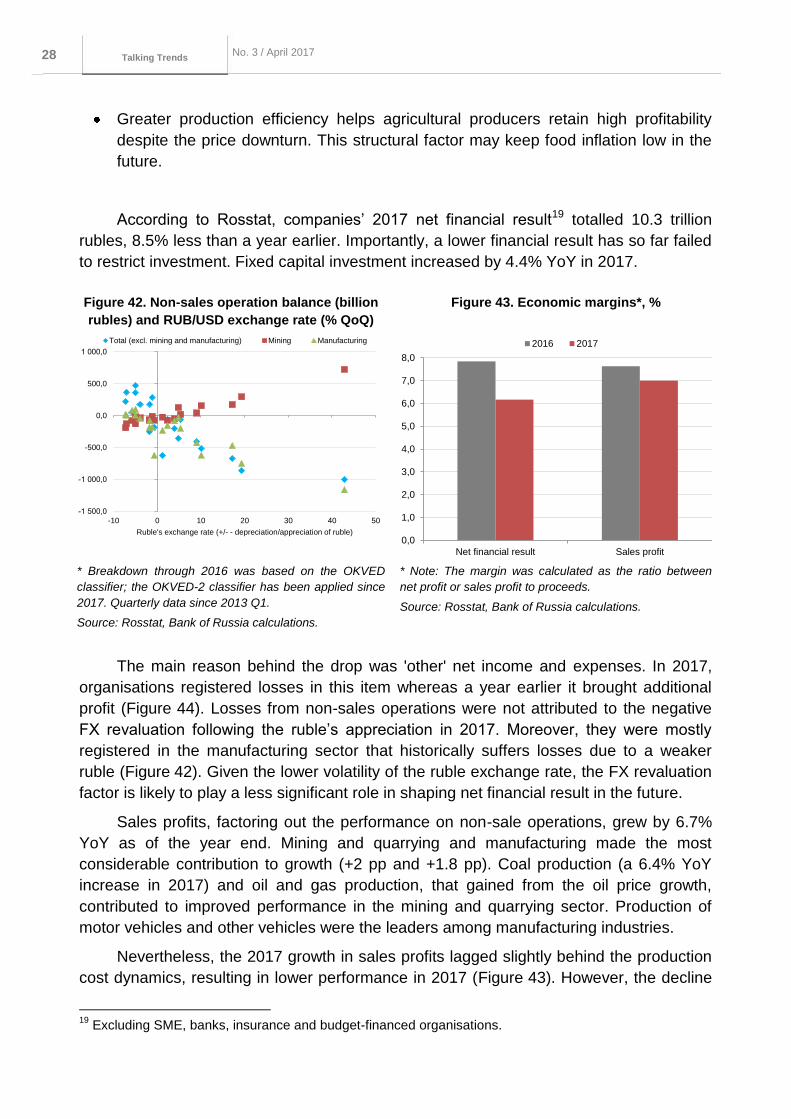
The main reason behind the drop was 'other' net income and expenses. In 2017,
organisations registered losses in this item whereas a year earlier it brought additional
profit (Figure 44). Losses from non-sales operations were not attributed to the negative
FX revaluation following the ruble’s appreciation in 2017. Moreover, they were mostly
registered in the manufacturing sector that historically suffers losses due to a weaker
ruble (Figure 42). Given the lower volatility of the ruble exchange rate, the FX revaluation
factor is likely to play a less significant role in shaping net financial result in the future.
Sales profits, factoring out the performance on non-sale operations, grew by 6.7%
YoY as of the year end. Mining and quarrying and manufacturing made the most
considerable contribution to growth (+2 pp and +1.8 pp). Coal production (a 6.4% YoY
increase in 2017) and oil and gas production, that gained from the oil price growth,
contributed to improved performance in the mining and quarrying sector. Production of
motor vehicles and other vehicles were the leaders among manufacturing industries.
Nevertheless, the 2017 growth in sales profits lagged slightly behind the production
cost dynamics, resulting in lower performance in 2017 (Figure 43). However, the decline
19
Excluding SME, banks, insurance and budget-financed organisations.
-1 500,0
-1 000,0
-500,0
0,0
500,0
1 000,0
-10 0 10 20 30 40 50
Ruble's exchange rate (+/- - depreciation/appreciation of ruble)
Total (excl. mining and manufacturing) Mining Manufacturing
0,0
1,0
2,0
3,0
4,0
5,0
6,0
7,0
8,0
Net financial result Sales profit
2016 2017
Серия до кла до в о б э ко но мичеСких
иССледо ва ниях 29 No. 3 / April 2017
Talking Trends
in margin was largely associated with losses from non-sales operations, and the drop in
operational efficiency was less significant.
Figure 44. Financial result factors, billion rubles
Source: Rosstat, EMISS, Bank of Russia calculations.
Figure 45. Key margin indicators*, OKVED-based breakdown, %
* Note: Here, the margin was calculated as the ratio between net profit or sales profit to proceeds.
Source: Rosstat, EMISS, Bank of Russia calculations.
Financial position of food producers is worth a special mention. Low food inflation
reduced their proceeds, which was offset by higher operational efficiency. As a result,
their operating margin increased from 7.5% to 7.8% in 2017 (Figure 45).
Return on sales in the agricultural sector dropped considerably (Figure 46); the
dynamics inside the sector varied. Profitability in crop production showed a strong decline
amid a price downturn. However, the 2016 profitability proved much higher than in
previous years, and in 2017 it returned to the average readings.
Jan. -
Sept. 2016
Jan. - Dec.
2016
Jan. -
Sept. 2017
Jan. - Dec.
2017
YoY growth
for 9
months
YoY growth
for 12
months
Sales revenue 98744 143797 117375 167253 18,9 16,3
Production costs 80444 117820 98212 140178 22,1 19,0
Gross profit (losses) 18300 25977 19163 27075 4,7 4,2
Administration expenses 10680 15004 11260 15364 5,4 2,4
Sales profit 7619 10973 7903 11711 3,7 6,7
Balance of other incomes and expenses 480 312 -517 -1391
Net financial result 8099 11285 7386 10321 -8,8 -8,5
Profit of profit-making organisations 9249 12919 8680 12276 -6,1 -5,0
Losses of oss-makers 1149 1634 1295 1956 12,7 19,7
Net financial result Sales profit Net financial result Sales profit
Total 7,8 7,6 6,2 7,0
Agriculture 16,4 17,0 12,5 14,8
Mining 19,1 21,8 19,5 20,5
Manufacturing 9,4 10,6 8,0 10,3
Energy supply 7,2 6,8 6,3 7,7
Water supply 1,8 3,0 2,6 3,5
Construction 2,6 4,5 2,7 6,7
Trade 6,4 4,7 4,8 4,4
Transport and storage 10,2 8,7 9,1 8,9
Hotels and Restaurants 3,7 4,9 4,2 6,5
Information and communication 11,0 11,6 12,8 12,4
Finance 1,1 0,9 0,4 0,4
Real estate 19,8 14,1 10,5 13,4
Scientific activitires 16,0 9,9 7,6 10,9
Administative activities 5,2 9,8 6,5 10,9
Government management 54,6 7,9 40,2 1,6
Education 5,4 5,6 5,6 4,8
Public health 6,6 9,6 7,1 9,4
Sport and culture 13,4 -4,5 0,3 1,2
Others 3,1 5,2 4,1 4,6
2016 2017
Серия до кла до в о б э ко но мичеСких
иССледо ва ниях 30 No. 3 / April 2017
Talking Trends
Nevertheless, agricultural profitability remains considerably higher than the
economy’s average. This ensures a leeway in the rate and scale of the cost pass-through
into prices of agricultural produce, thus, limiting inflation risks. The high margins of
agricultural producers amid falling prices for their products (-8.1% YoY in February 2018)
point to the important role of higher efficiency, as a structural factor, in keeping food
inflation low. This factor is very likely to continue to keep food price growth rates low,
while monetary policy tightness (or softness) will have a minor effect on food inflation.
Figure 46. Profitability indicators in agriculture, %
*Note: Here, the margin was calculated as the ratio between net profit or sales profit to
proceeds.
Source: Rosstat, Bank of Russia calculations.
1.3. Global economy, financial and commodity markets
1.3.1. New restrictions put Russian financial markets under pressure
Increasing geopolitical tensions have put Russian financial markets under pressure.
Having said that, markets needed no additional efforts from the Bank of Russia to
effectively manage external shocks; this is indicative of their maturity.
Russian risk premium has added almost 50 bp over the month. Should this change
be sustainable, the key rate corresponding to neutral monetary policy is set to go
up.
Higher risks to the global economy caused by growing protectionism affect global
financial markets’ performance.
2016 2017 2014 2015 2016 2017
Agriculture 16,4 12,5 17,0 14,8
Annual crops 22,7 12,6 24,3 15,8
Cereal crops 21,6 12,7 24,3 16,0
leguminous crops 20,7 13,0 26,8 20,1
Oil seeds 28,2 22,4 32,1 24,1
Vegetables, tuber crops, roots 25,2 10,7 23,0 13,3
Vegetables 15,9 11,3 12,9 14,7
Potato 14,0 4,9 -1,7 -11,9
Sugar beet 33,8 10,3 31,7 12,8
Plantation crop 25,5 10,7 22,8 14,0
Transpla 7,0 -3,7 15,3 10,4
Animal Breeding 9,3 9,1 9,6 11,2
Cattle breeding 13,3 12,2 8,9 9,6
Pigs 12,0 16,4 16,4 21,0
Poultry 4,1 3,2 7,2 7,1
Hunting -4,3 -33,9 -17,5 -86,8
Forestry 10,4 -0,4 7,3 5,1
Fishery 35,5 33,1 37,3 33,3
Sales profitNet financial result

Серия до кла до в о б э ко но мичеСких
иССледо ва ниях 31 No. 3 / April 2017
Talking Trends
The growth of the USD Libor rate has recently outpaced other market rates.
However, these developments are highly likely to prove temporary and do not point
to growing credit risks on the international interbank market.
Global markets
Reciprocal duties imposed by the US and China, and higher geopolitical risks
associated with the situation in the Middle East determined the performance of global
financial markets in the past month. In this environment stock markets hit the lows
registered during the February correction and closed the quarter with falling asset prices
for the first time since early 2016.
Overall emerging market currencies weakened over the past month, however,
countries showed mixed dynamics. The worst performance was registered among the
currencies of the countries that suffered from growing domestic political uncertainty or an
external shock.
Volatility in global markets remained elevated compared with the 2017 readings,
supporting demand for haven assets. Growing uncertainty worldwide is unlikely to allow
volatility indicators to return to record lows in the near future.
Yield margins on US and EU government bonds widened to hit fresh highs. In the
US, an upward pressure on yields is exerted by the normalisation prospects of the Fed’s
policy under the new Chair and the forecast growth in bond issue following the tax reform
that increases budget deficit. The ECB continues quantitative easing, scales back its
asset purchase programme only gradually and is unlikely to rush into rate hikes.
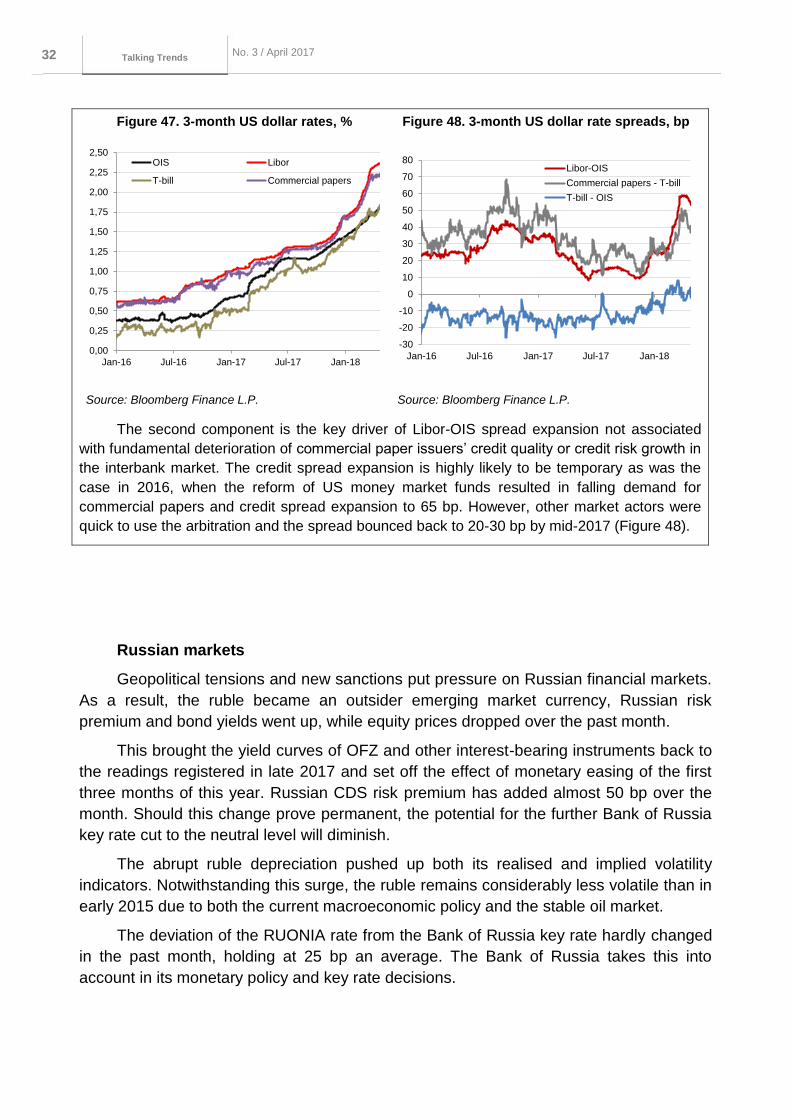
Libor rate growth
The 3-month Libor exceeded 2.25%, (Figure 47) recently outpacing basic rates in
its rise. The Libor-OIS spread20 approached 60 bp, the highest reading since 2009
(Figure 48). The spread expansion may be attributed to two components:
The expanding yield spread between US Treasury bonds and OIS, triggered by the
growing issue of government bonds (Figure 48, T-bill – OIS).
The increasing credit spread between commercial papers (CP) and the US Treasury
bond yield (Figure 48, Commercial papers – T-bill). This was caused, among other
things, by the repatriation of corporate profits to the US under the tax reform. Funds on
accounts outside the US were invested, among other things, in the CP market, whereas
parent companies had to apply for additional bank loans or place debt securities to fund
their operations or corporate actions such as buyback or mergers and acquisitions. Now
that account balances outside the US are declining, the demand for CP is falling.
Meanwhile, firms may use the repatriated funds to redeem previous debts and avoid
returning to the CP market, temporarily maintaining the credit spread elevated.
20
An Overnight Indexed Swap is a rate on the fixed leg of the interest rate swap whose floating leg is the effective federal funds rate.
Серия до кла до в о б э ко но мичеСких
иССледо ва ниях 32 No. 3 / April 2017
Talking Trends
Figure 47. 3-month US dollar rates, % Figure 48. 3-month US dollar rate spreads, bp
Source: Bloomberg Finance L.P. Source: Bloomberg Finance L.P.
The second component is the key driver of Libor-OIS spread expansion not associated
with fundamental deterioration of commercial paper issuers’ credit quality or credit risk growth in
the interbank market. The credit spread expansion is highly likely to be temporary as was the
case in 2016, when the reform of US money market funds resulted in falling demand for
commercial papers and credit spread expansion to 65 bp. However, other market actors were
quick to use the arbitration and the spread bounced back to 20-30 bp by mid-2017 (Figure 48).
Russian markets
Geopolitical tensions and new sanctions put pressure on Russian financial markets.
As a result, the ruble became an outsider emerging market currency, Russian risk
premium and bond yields went up, while equity prices dropped over the past month.
This brought the yield curves of OFZ and other interest-bearing instruments back to
the readings registered in late 2017 and set off the effect of monetary easing of the first
three months of this year. Russian CDS risk premium has added almost 50 bp over the
month. Should this change prove permanent, the potential for the further Bank of Russia
key rate cut to the neutral level will diminish.
The abrupt ruble depreciation pushed up both its realised and implied volatility
indicators. Notwithstanding this surge, the ruble remains considerably less volatile than in
early 2015 due to both the current macroeconomic policy and the stable oil market.
The deviation of the RUONIA rate from the Bank of Russia key rate hardly changed
in the past month, holding at 25 bp an average. The Bank of Russia takes this into
account in its monetary policy and key rate decisions.
0,00
0,25
0,50
0,75
1,00
1,25
1,50
1,75
2,00
2,25
2,50
Jan-16 Jul-16 Jan-17 Jul-17 Jan-18
OIS Libor
T-bill Commercial papers
-30
-20
-10
0
10
20
30
40
50
60
70
80
Jan-16 Jul-16 Jan-17 Jul-17 Jan-18
Libor-OIS
Commercial papers - T-bill
T-bill - OIS
Серия до кла до в о б э ко но мичеСких
иССледо ва ниях 33 No. 3 / April 2017
Talking Trends
2. Outlook: leading indicators
2.1. Global leading indicators
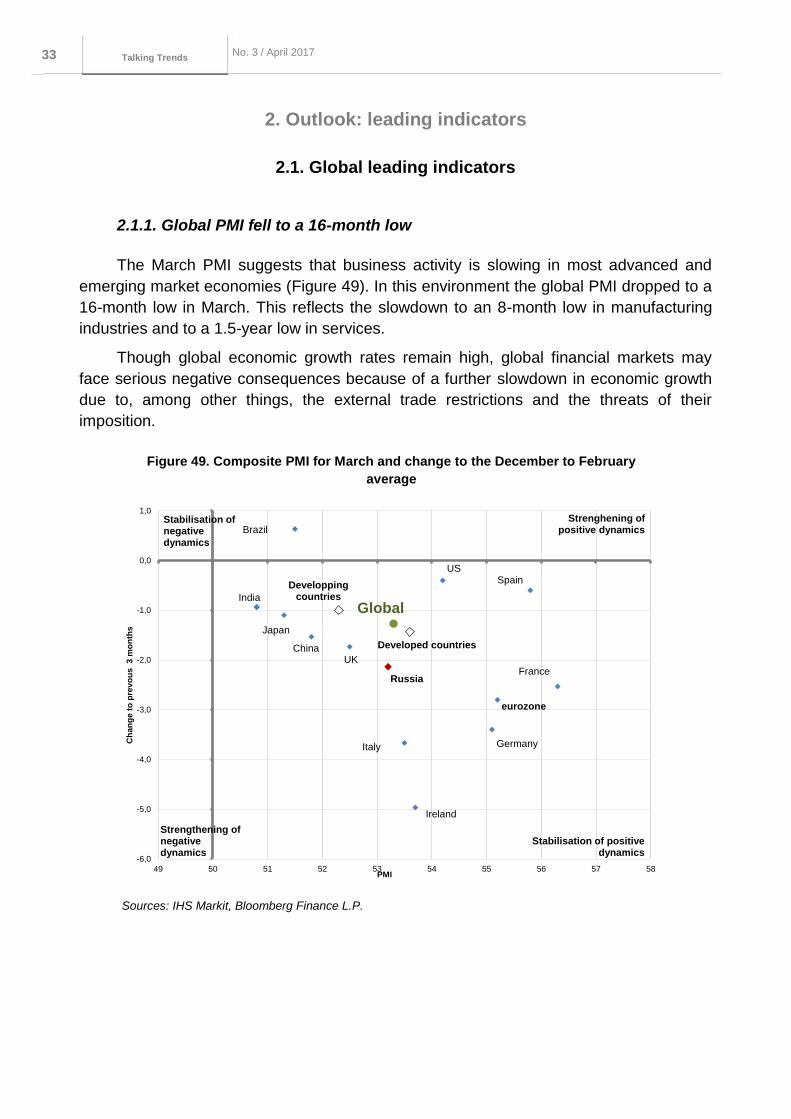
2.1.1. Global PMI fell to a 16-month low
The March PMI suggests that business activity is slowing in most advanced and
emerging market economies (Figure 49). In this environment the global PMI dropped to a
16-month low in March. This reflects the slowdown to an 8-month low in manufacturing
industries and to a 1.5-year low in services.
Though global economic growth rates remain high, global financial markets may
face serious negative consequences because of a further slowdown in economic growth
due to, among other things, the external trade restrictions and the threats of their
imposition.
Figure 49. Composite PMI for March and change to the December to February
average
Sources: IHS Markit, Bloomberg Finance L.P.
Global
Germany
Ireland
Spain
Italy
UKFrance
India
China
Russia
Japan
US
Brazil
eurozone
Developping countries
Developed countries
-6,0
-5,0
-4,0
-3,0
-2,0
-1,0
0,0
1,0
49 50 51 52 53 54 55 56 57 58
Ch
an
ge
to
pre
vo
us
3
mo
nth
s
PMI
Stabilisation of negativedynamics
Strengthening of negative dynamics
Strenghening of positive dynamics
Stabilisation of positive dynamics
Серия до кла до в о б э ко но мичеСких
иССледо ва ниях 34 No. 3 / April 2017
Talking Trends
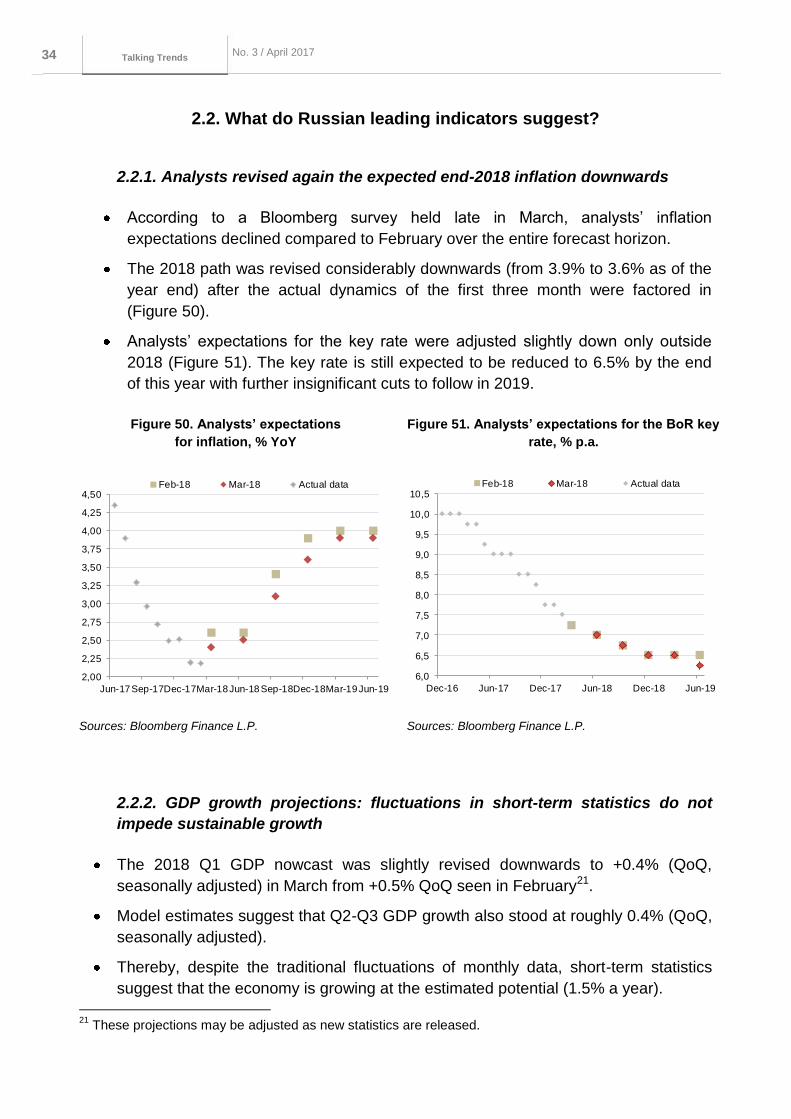
2.2. What do Russian leading indicators suggest?
2.2.1. Analysts revised again the expected end-2018 inflation downwards
According to a Bloomberg survey held late in March, analysts’ inflation
expectations declined compared to February over the entire forecast horizon.
The 2018 path was revised considerably downwards (from 3.9% to 3.6% as of the
year end) after the actual dynamics of the first three month were factored in
(Figure 50).
Analysts’ expectations for the key rate were adjusted slightly down only outside
2018 (Figure 51). The key rate is still expected to be reduced to 6.5% by the end
of this year with further insignificant cuts to follow in 2019.
Figure 50. Analysts’ expectations
for inflation, % YoY
Figure 51. Analysts’ expectations for the BoR key
rate, % p.a.
Sources: Bloomberg Finance L.P.
Sources: Bloomberg Finance L.P.
2.2.2. GDP growth projections: fluctuations in short-term statistics do not
impede sustainable growth
The 2018 Q1 GDP nowcast was slightly revised downwards to +0.4% (QoQ,
seasonally adjusted) in March from +0.5% QoQ seen in February21.
Model estimates suggest that Q2-Q3 GDP growth also stood at roughly 0.4% (QoQ,
seasonally adjusted).
Thereby, despite the traditional fluctuations of monthly data, short-term statistics
suggest that the economy is growing at the estimated potential (1.5% a year).
21
These projections may be adjusted as new statistics are released.
2,00
2,25
2,50
2,75
3,00
3,25
3,50
3,75
4,00
4,25
4,50
Jun-17Sep-17Dec-17Mar-18Jun-18 Sep-18Dec-18Mar-19Jun-19
Feb-18 Mar-18 Actual data
6,0
6,5
7,0
7,5
8,0
8,5
9,0
9,5
10,0
10,5
Dec-16 Jun-17 Dec-17 Jun-18 Dec-18 Jun-19
Feb-18 Mar-18 Actual data

Серия до кла до в о б э ко но мичеСких
иССледо ва ниях 35 No. 3 / April 2017
Talking Trends
Our 2018 GDP model estimates do not factor in possible fallouts from budgetary,
geopolitical and other factors (e.g., the OPEC+ deal) on GDP growth. This may
serve as a ground for their further downward revision as new statistics are released
during the year.
March February
% QoQ SA % QoQ SA
2018 Q1 0.4 0.5
2018 Q2 0.4 0.4 - 0.5
2018 Q3 0.4 0.4
Серия до кла до в о б э ко но мичеСких
иССледо ва ниях 36 No. 3 / April 2017
Talking Trends
3. In focus. Retail expansion: key trends and outlook
Consumers’ recently acquired habit of doing shopping when goods are on
promotions alongside their preference for private labels are expected to constrain
growth in consumer prices.
Another factor curbing consumer price growth is dynamically expanding e-
commerce, especially cross-border web stores.
Consumer price growth is also constrained by a stronger market consolidation and
tougher competition between major retail chains.
Having said that, market consolidation may enhance the market power of individual
actors triggering a faster increase in consumer prices.
High regulatory pressure on trade may also cause proinflationary effects. It
increases commercial organisations’ costs which are likely to be translated in retail
prices as demand recovers.
Amid restricted purchasing power, low inflation and growing competition, retailers try
to enhance efficiency and cut costs through own production, direct imports, shared
storage facilities, wholesale trade and e-commerce.
This March, the Bank of Russia held a round table meeting with representatives of
retail chains and retailers associations. The meeting discussed retail sale dynamics, the
effect of inflation slowdown on trade financial indicators, changes in consumer behaviour,
the impact of e-commerce, tougher competition between chains and cost cuts in retail.
The discussion allows revealing the following trends in retail trade and forecasting its
2018 development.
Consumer demand remains highly sensitive to price fluctuations despite
rising consumer activity
2015-2016 registered a decline in physical retail trade turnover. In late 2017,
consumer demand started to recover in both food and non-food segments. Analysts
expect this recovery to have the pace of 2-3% a year and to last for roughly two to three
years. Having said that, the market’s further development will differ from that before the
crisis. This results from changes in consumer behaviour and tougher competition, which
call for cost-cutting in retail and higher efficiency.
In 2017, drivers of consumer demand recovery may include the downturn in prices
of certain socially important foods, the increase in the number of goods retail chains offer
on promotions, and growing consumer lending.
An INFOLine research shows that discount sales of alcohol, coffee, home care
products and perfumes exceed 50%. Overall, promotional sales account for more than
20% of sales in retail chains. Thrifty consumer behaviour is expected to hold throughout
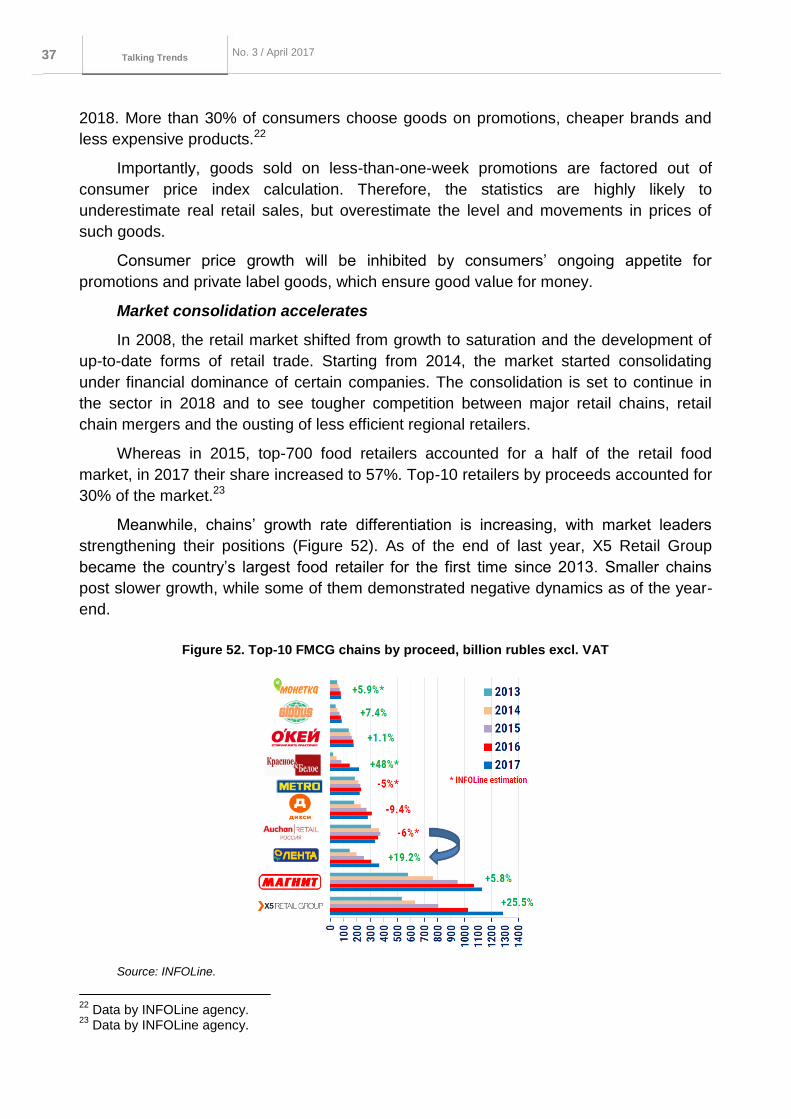
Серия до кла до в о б э ко но мичеСких
иССледо ва ниях 37 No. 3 / April 2017
Talking Trends
2018. More than 30% of consumers choose goods on promotions, cheaper brands and
less expensive products.22
Importantly, goods sold on less-than-one-week promotions are factored out of
consumer price index calculation. Therefore, the statistics are highly likely to
underestimate real retail sales, but overestimate the level and movements in prices of
such goods.
Consumer price growth will be inhibited by consumers’ ongoing appetite for
promotions and private label goods, which ensure good value for money.
Market consolidation accelerates
In 2008, the retail market shifted from growth to saturation and the development of
up-to-date forms of retail trade. Starting from 2014, the market started consolidating
under financial dominance of certain companies. The consolidation is set to continue in
the sector in 2018 and to see tougher competition between major retail chains, retail
chain mergers and the ousting of less efficient regional retailers.
Whereas in 2015, top-700 food retailers accounted for a half of the retail food
market, in 2017 their share increased to 57%. Top-10 retailers by proceeds accounted for
30% of the market.23
Meanwhile, chains’ growth rate differentiation is increasing, with market leaders
strengthening their positions (Figure 52). As of the end of last year, X5 Retail Group
became the country’s largest food retailer for the first time since 2013. Smaller chains
post slower growth, while some of them demonstrated negative dynamics as of the year-
end.
Figure 52. Top-10 FMCG chains by proceed, billion rubles excl. VAT
Source: INFOLine.
22
Data by INFOLine agency. 23
Data by INFOLine agency.
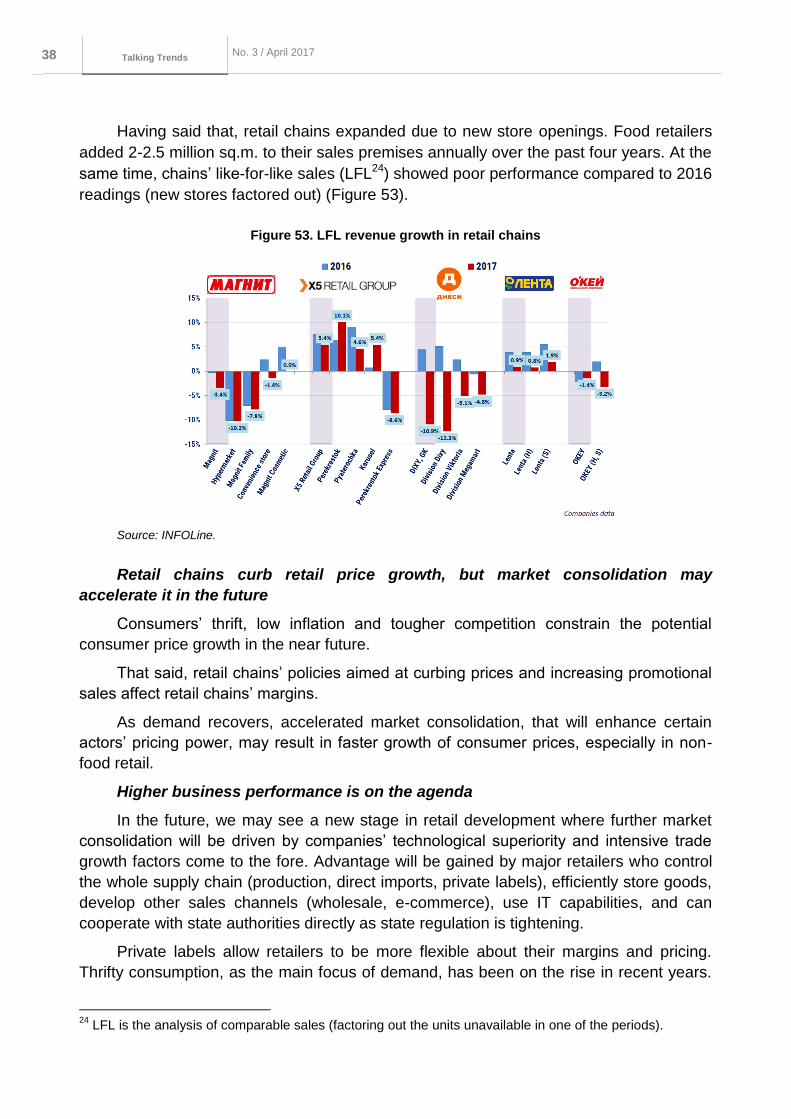
Серия до кла до в о б э ко но мичеСких
иССледо ва ниях 38 No. 3 / April 2017
Talking Trends
Having said that, retail chains expanded due to new store openings. Food retailers
added 2-2.5 million sq.m. to their sales premises annually over the past four years. At the
same time, chains’ like-for-like sales (LFL24) showed poor performance compared to 2016
readings (new stores factored out) (Figure 53).
Figure 53. LFL revenue growth in retail chains
Source: INFOLine.
Retail chains curb retail price growth, but market consolidation may
accelerate it in the future
Consumers’ thrift, low inflation and tougher competition constrain the potential
consumer price growth in the near future.
That said, retail chains’ policies aimed at curbing prices and increasing promotional
sales affect retail chains’ margins.
As demand recovers, accelerated market consolidation, that will enhance certain
actors’ pricing power, may result in faster growth of consumer prices, especially in non-
food retail.
Higher business performance is on the agenda
In the future, we may see a new stage in retail development where further market
consolidation will be driven by companies’ technological superiority and intensive trade
growth factors come to the fore. Advantage will be gained by major retailers who control
the whole supply chain (production, direct imports, private labels), efficiently store goods,
develop other sales channels (wholesale, e-commerce), use IT capabilities, and can
cooperate with state authorities directly as state regulation is tightening.
Private labels allow retailers to be more flexible about their margins and pricing.
Thrifty consumption, as the main focus of demand, has been on the rise in recent years.
24
LFL is the analysis of comparable sales (factoring out the units unavailable in one of the periods).

Серия до кла до в о б э ко но мичеСких
иССледо ва ниях 39 No. 3 / April 2017
Talking Trends
Retail chains are set to launch or purchase food production and agricultural companies
as private labels account for a larger share of purchases.
The trend towards wholesale development has come to the fore. Magnit has
launched wholesale stores Magnit-Opt, Metro is developing its franchise network Fasol,
and Lenta is launching B2B programmes.
E-commerce is on the rise
The AITC data suggest that the Russian e-commerce market expanded by 13% in
2017; this figure is lower compared to the 2016 reading (21%). However, analysts
estimate that this year the e-commerce market will grow by another 20% to 1,250 billion
rubles. Despite the high growth rates, e-commerce only accounts for roughly 3% of the
total retail trade turnover and affects it insignificantly.
Cross-border trade makes a large contribution to e-commerce (+24% in 2017), while
online sales in the domestic market demonstrate slower growth (+8% in the same period)
(Figure 54).
Figure 54. Russian e-commerce market
Source: AITC.
Thereby, foreign online retailers and shopping sites are expanding. Cross-border
trade accounted for 36% of all purchases made online in 2017. Regulatory deficiencies
burden foreign companies with lower costs associated with import VAT and customs
duties, certification and consumer protection than Russian market players. As a result,
such businesses earn much higher profits. This forces Russian online retailers to move
their trade infrastructure outside Russia. They build logistic hubs in the border area and
ship from these hubs without customs clearance.
This calls for the need to make the terms of trade equal for Russian and foreign e-
retailers. Importantly, such regulatory alignment is highly likely to bring up prices in online
and offline stores.
92% 85% 81%76%
71% 71% 67% 64%8%
15% 19%
24%
29%29%
33%36%
2010 2011 2012 2013 2014 2015 2016 2017
domestic trade cross-border trade
260bln rub
330bln rub
405bln rub
544bln rub
713bln rub
760bln rub
920bln rub
1040bln rub
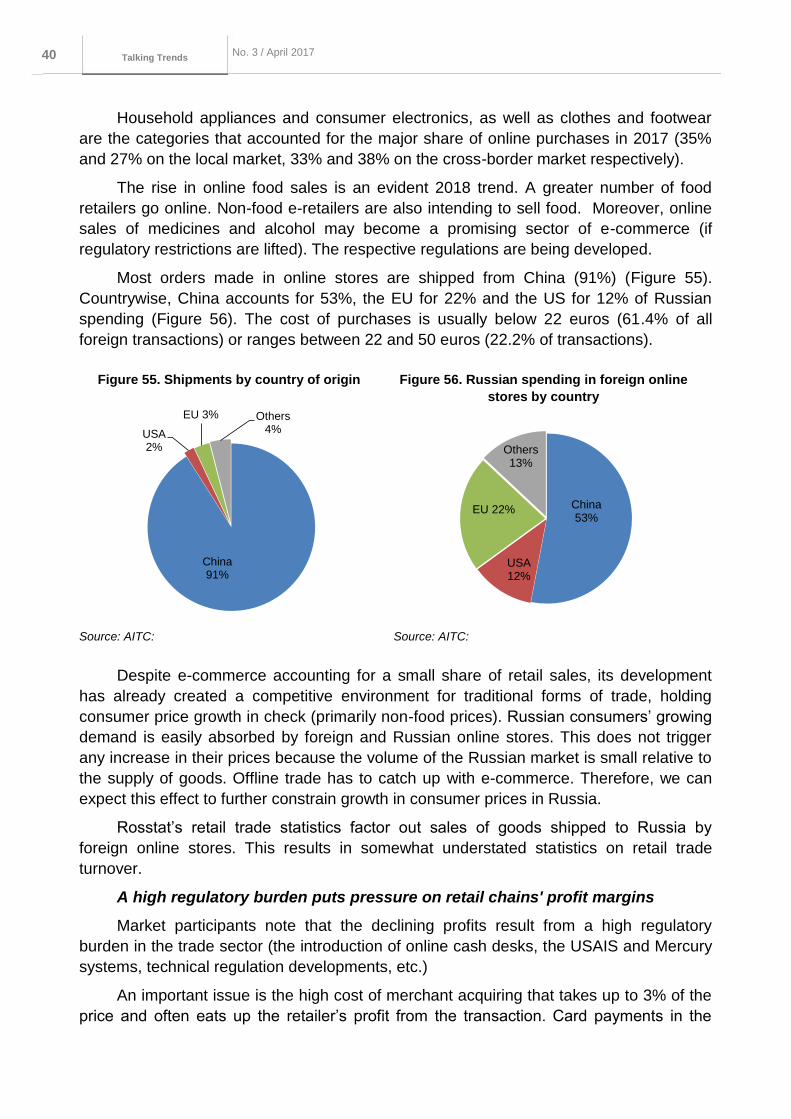
Серия до кла до в о б э ко но мичеСких
иССледо ва ниях 40 No. 3 / April 2017
Talking Trends
Household appliances and consumer electronics, as well as clothes and footwear
are the categories that accounted for the major share of online purchases in 2017 (35%
and 27% on the local market, 33% and 38% on the cross-border market respectively).
The rise in online food sales is an evident 2018 trend. A greater number of food
retailers go online. Non-food e-retailers are also intending to sell food. Moreover, online
sales of medicines and alcohol may become a promising sector of e-commerce (if
regulatory restrictions are lifted). The respective regulations are being developed.
Most orders made in online stores are shipped from China (91%) (Figure 55).
Countrywise, China accounts for 53%, the EU for 22% and the US for 12% of Russian
spending (Figure 56). The cost of purchases is usually below 22 euros (61.4% of all
foreign transactions) or ranges between 22 and 50 euros (22.2% of transactions).
Figure 55. Shipments by country of origin Figure 56. Russian spending in foreign online
stores by country
Source: AITC: Source: AITC:
Despite e-commerce accounting for a small share of retail sales, its development
has already created a competitive environment for traditional forms of trade, holding
consumer price growth in check (primarily non-food prices). Russian consumers’ growing
demand is easily absorbed by foreign and Russian online stores. This does not trigger
any increase in their prices because the volume of the Russian market is small relative to
the supply of goods. Offline trade has to catch up with e-commerce. Therefore, we can
expect this effect to further constrain growth in consumer prices in Russia.
Rosstat’s retail trade statistics factor out sales of goods shipped to Russia by
foreign online stores. This results in somewhat understated statistics on retail trade
turnover.
A high regulatory burden puts pressure on retail chains' profit margins
Market participants note that the declining profits result from a high regulatory
burden in the trade sector (the introduction of online cash desks, the USAIS and Mercury
systems, technical regulation developments, etc.)
An important issue is the high cost of merchant acquiring that takes up to 3% of the
price and often eats up the retailer’s profit from the transaction. Card payments in the
China91%
USA2%
EU 3% Others4%
China53%
USA12%
EU 22%
Others13%

Серия до кла до в о б э ко но мичеСких
иССледо ва ниях 41 No. 3 / April 2017
Talking Trends
consumer market have been adding 5% annually over the past three years and account
for almost 30-40% of total payments depending of the retail chain’s specialisation. The
respective increase in the cost of merchant acquiring services reduces profit margins of
trade companies.

Серия до кла до в о б э ко но мичеСких
иССледо ва ниях 42 No. 3 / April 2017
Talking Trends
Research and Forecasting Department
Alexander Morozov
Director
Dmitry Chernyadyev
Natalia Karlova
Aleksey Kiselev
Mariam Mamedli
Maria Pomelnikova
Alexey Porshakov
Yelena Puzanova
Arina Sapova
Yulia Ushakova
Sergey Vlasov
Ksenia Yakovleva
Aleksandra Zhivaikina