Embed Size (px)
Citation preview

No. 2JUNE 2018
MONETARY POLICY REPORT
Moscow

DEAR READERS,
In order to improve the effectiveness of the Bank of Russia’s information policy with regard to its monetary policy and to assess the relevance of and demand for the materials published, we would be grateful if you could answer the following questions.
1. Do you consider there to be an optimal level of detail in the material presented?
2. Which subjects, in your opinion, should be illustrated in this report?
3. Do you have any other comments or suggestions regarding the report?
4. What is your professional field of interest?
Many thanks in advance for your assistance.
The report has been prepared based on statistics as of 9 June 2018. Data cut-off date for forecast calculations is 9 June 2018 (if statistics and other information relevant for decision-making appear after the data cut-off date, they are included in the text of the Report and may be used for the adjustment of the mid-term forecast).
An electronic version of the information and analytical review can be found on the Bank of Russia website at http://www.cbr.ru/publ/.
Please send your suggestions and comments to [email protected].
© The Central Bank of the Russian Federation, 2018

CONTENTS
SUMMARY ...................................................................................................................... 2
1. MACROECONOMIC сONdITIONS ........................................................................... 4
2. ECONOMIC OUTLOOk ........................................................................................... 21
ANNEXES ..................................................................................................................... 33
Dynamics of major items in the Russian balance of payments in 2018 Q1 ............ 33
The economic situation in Russian regions ............................................................ 34
Balance of payments forecast for 2018–2020 ........................................................ 38
Changes in the system of monetary policy instruments and other Bank of Russia measures ....................................................................... 41
Statistical tables ...................................................................................................... 44
GLOSSARY .................................................................................................................. 48
ABBREVIATIONS ........................................................................................................ 54

2 MONETARY POLICY REPORT No. 2 (22) JUNE 2018
SUMMARY
In March-May 2018, changes evolved with regard to some external and internal economic conditions and influenced both short-term and mid-term inflation forecasts and other macroeconomic indicators.
The main factor behind the revision of the mid-term inflation forecast compared with the March 2018 Monetary Policy Report No. 1 (21) (hereinafter, the MPR) became the planned increase of the value added tax in 2019 announced on 14 June. This move will influence the next year consumer price dynamics and will come through inflation expectations and a faster price correction this year.
Changes in the functioning of the Russian economy observed in March-May 2018 were also conditioned on external factors: changes in the global commodity and financial markets and in the geopolitical situation.
First, given a more sizeable and sustainable, compared to Bank of Russia expectations, increase in global oil prices, the 2018 oil price forecast has been revised across the whole range of economic development scenarios. Beyond 2018, oil price expectations remain unchanged compared with the March MPR. The Bank of Russia will base its key rate decision on the baseline scenario for the economic development, which assumes a gradual decline in oil prices from $67 per barrel in 2018 to $55 and $50 per barrel in 2019 and 2020 respectively. In addition to the baseline scenario, other decision options will be shaped by the scenario with oil prices remaining close to the levels observed in March-May 2018 (the scenario with unchanged oil prices). Similar to the March MPR, the revision of oil price assumptions has not produced any noticeable effect on the paths of key macroeconomic indicators. This points to an improved sustainability of the Russian economy to changes in external conditions, partly due to the implementation of the budget rule.
Second, amid the expansion of sanctions against Russia implemented in April, the baseline scenario assumes a slightly higher risk premium for Russia than in the March forecast. These external factors have already passed through to inflation dynamics in April-May. In 2018 Q2, annual price growth rates slightly exceeded the forecast of the March MPR. The exchange rate was more moderate than anticipated because of the expanded external sanctions. The extent of its pass-through to internal prices turned out to be smaller than might be expected, given the number of comparable instances of hikes in exchange rate volatility; however, the true length of this effect will remain to be seen in the coming months. A considerable surge in global oil prices coupled by the increase in excises early this year exerted an upward pressure on domestic fuel prices.
At the same time, the overall inflationary pressure was modest in the Russian economy in spring 2018. In March-May, the annual inflation slightly picked up to 2.4% after 2.2% in January-February. Annual growth paces were roughly 2% across non-food goods prices. Food price growth continued to be held back by a robust supply of agricultural output in the domestic markets. In Q2, the effect of this factor continued to be more pronounced than expected, but it will gradually dissipate over 2018 as the new harvest will come in. Services inflation, as expected, remained close to 4%, given, among other things, the implementation of the planned indexation of administered prices and tariffs.
The April increase in the ruble volatility triggered rather moderate response in inflation expectations and, more broadly, in external markets. In contrast to the pass-through of exchange rate movements, petrol price growth exerted a more meaningful effect on inflation expectations. According to surveys, in April-May, household inflation expectations grew negligibly compared with January-March. Business price expectations demonstrated a slightly stronger response. The expectations of professional financial market participants stayed close to 4% as earlier. So far, inflation expectations show a markedly greater resilience to short-term factors than previously. However, more time will be needed to lessen the varied nature of inflation expectations, specifically in the corporate segment, and also to bring them closer to the actual inflation and to securely anchor them near that level.

SUMMARy JUNE 2018 No. 2 (22) MONETARY POLICY REPORT 3
Given the internal and external developments, the Bank of Russia forecasts annual inflation to be 3.5-4% in late 2018 and increase for a short-term period to 4-4.5% in 2019. The consumer prices growth rate will gradually return to 4% in early 2020. Over 2018, the influence of the sanctions on the ruble exchange rate will wear out. The cost-induced effect on inflation will gradually diminish in 2018, in part due to the reduction in fuel excises introduced in June, and will dissipate over the forecast horizon amid a steady oil price downturn.
The medium term overall economic growth forecast remains similar to the March MPR. In 2018 Q1, annual GDP growth was slightly below the March forecast, totalling 1.3%. This resulted from a slowdown in fixed capital investment, including a decline in construction caused by cold weather, together with the review of the data for 2017 by Rosstat. April saw improved investment and industrial activity, confirming the temporary nature of slower economic growth in March 2018. In 2018-2020, economic growth will stay at 1.5-2%, which is in line with the potential economic growth rate in Russia. The forecast might be further updated to reflect a detailed estimate of influence that the set of fiscal measures, announced 14 June 2018, will have on economic performance. 2019 may encounter a risk of a certain slowdown in business activity. At the same time, a more considerable growth of the potential output is possible on the back of successful structural and institutional changes in the Russian economy. The measures aimed at extending the retirement age can also add to accelerated economic growth in the medium term.
The Bank of Russia’s baseline forecast suggests that the growth of consumer demand will remain moderate and will not pose any proinflationary risks for the economy. Labour remuneration dynamics which is broadly in line with Bank of Russia expectations, as well as the gradual recovery of lending activity not leading to the accumulation of excessive debt burden will continue to support the demand. The required number of transactions in the economy over the forecast horizon will be ensured by the dynamics of monetary aggregates, corresponding to economic activity dynamics and creating no additional proinflationary pressure.
Monetary conditions are getting closer to neutral. The Bank of Russia estimates that they are already causing almost no constraining impact on credit, demand and inflation dynamics. Monetary conditions evolve, among other things, under the influence of earlier decisions to cut the key rate. At the same time, the conservative approach of banks to selecting borrowers encourages a gradual increase in credit without posing risks to price and financial stability. Deposits remain attractive for households at the current interest rate levels.
With regard to the medium-term forecast, the balance of risks has shifted towards proinflationary ones till the end of 2019. The main risks are caused by fiscal policy decisions and also external factors. The Bank of Russia will pay special attention to the estimation of secondary effects of fiscal measures, including the response of inflation expectations. With regard to external conditions, accelerated yield growth in advanced economies and geopolitical factors may cause surges in volatility in financial markets and affect expectations for the exchange rate and inflation. Other risks associated with consumer and oil price volatility, wage movements and possible changes in consumer behaviour are still moderate.
Taking into account the impact of the suggested fiscal measures on inflation and inflation expectations, the transition to neutral monetary policy needs to be slower. The monetary policy stance needs to remain somewhat tight to limit the scale of secondary effects of fiscal measures and to maintain the annual consumer prices growth rate around 4%.
The Bank of Russia will consider the need to change its key rate by assessing inflation dynamics and risks, as well as economic developments against the forecast.
The compilation of this Monetary Policy Report was mainly conducted prior to the announcement of new planned fiscal measures, therefore their pass-through effects may not be fully reflected in it. The Bank of Russia will make a detailed assessment of the impact these measures will have on key macroeconomic indicators and will highlight its findings in informational and analytical materials and key publications, including in the next issues of the MPR.

4 MONETARY POLICY REPORT No. 2 (22) JUNE 2018
whereas the updated estimate is 2.1 –2.3% (see ‘Consumer Price Dynamics’ reviews1 for April and May 2018).
• Inflationary pressure remained low for most categories of the consumer basket (Chart 1.2) due to the moderate growth in internal demand as a result of the consistent transition to neutral monetary policy conditions in view of the gradual
1 http://www.cbr.ru / DKP / surveys / dinamic / .
In terms of internal economic conditions, inflation dynamics remained a key factor in monetary policy decision-making. Views on the stability of downward inflation movements, factors associated with inflation remaining below 4%, and how changes in external conditions not previously taken into account in the baseline forecast will impact inflation forecasts, – all played an important role for the Bank of Russia. However, it also assessed growth in economic activity, risks to economic growth sustainability and financial stability, and the extent to which the implemented monetary policy affects the situation as a whole and inflation dynamics in particular.
In March-May, annual inflation picked up slightly to 2.4% (2.2% in January-February), and, according to real-time statistical data, remained at this level in the first weeks of June (Chart 1.1).
The broader picture of inflation dynamics reflected the following.
• In Q2, annual inflation remained subdued (below 4%), but was slightly above the previous forecast: in the Monetary Policy Report for March 2018, the baseline scenario anticipated inflation to be slightly below 2% at the end of Q2,
1. MACROECONOMIC сONdITIONS
Chart 1.3 Overshoot of price growth forecast for certain inflation components is caused by changes in external conditions
(per cent change on corresponding month of previous year)
Chart 1.1 Annual inflation remains low due
to food products
-5
0
5
10
15
2001.16
03.16
05.16
07.16
09.16
11.16
01.17
03.17
05.17
07.17
09.17
11.17
01.18
03.18
Deciles: 80-90 70-80 60-7040-60 30-40 20-30 10-20Median CPI
Chart 1.2 Low inflationary pressure remains across the majority
of goods and services
Sources: Rosstat, Bank of Russia calculations.

1. MACRoECoNoMIC сoNDITIoNS JUNE 2018 No. 2 (22) MONETARY POLICY REPORT 5
the forecast harvest and weather conditions in Russia and globally, among other things.
• In Q2, annual inflation will bottom out and will start to accelerate in Q3 (Chart 1.4). However, given the changes in the current price growth rates that have already been observed in Q2 (Chart 1.5), inflation will approach 4% slightly faster than previously forecast. Annual growth in inflation at the end of Q3 and Q4 2018 is forecast to be 3.0– 3.5% and 3.5–4.0%, respectively.
The change in external conditions and expansion of sanctions against Russia caused an increase in current and forecast risk premium levels for Russia and depreciation in the ruble against other global currencies
easing of the Bank of Russia’s policy, together with inflation expectation dynamics.
• The annual growth in food prices continued to show the lowest rates in the inflation structure; the growth in prices for non-food goods, excluding oil products, was 2.1 –2.5% in March-May and services inflation remained close to the 4% level (Chart 1.3). In the first five months of the year, the price growth for housing and utilities services remained stable, and administered tariffs for this and other categories were indexed in line with plans for the year, at rates allowing the inflation target of 4% to be met.
• The increase in inflation relative to the forecast was due to the effects of external factors. First, the expansion of external sanctions, which caused exchange rate dynamics to deviate from the expected path (which, in turn, translated into additional price growth both for non-food and food goods, as well as services). Second, the substantial increase in global oil prices (which, among other things, had an impact on internal motor fuel prices). Both of these effects will have a temporary influence on inflation mainly in 2018.
• At the same time, supply-side factors in the food market continued to exert a significant constraining impact on price growth, and the scale of this impact was slightly greater than that which was previously forecast. It is expected that the contribution of this factor to inflation will wane over the next few months, taking into account
0
2
4
6
8
10
12
01.16
04.16
07.16
10.16
01.17
04.17
07.17
10.17
01.18
04.18
07.18
10.18
Interval of underlying inflation estimatesCore inflationCPI
Chart 1.4 Underlying inflation readings stopped falling
(per cent change on corresponding period of previous year)
Sources: Rosstat, Bank of Russia calculations.
Chart 1.5 Inflation will move close to the target faster than forecast
(seasonally adjusted monthly price growth, in annual terms, %)
Chart 1.6External sanctions led to an increase
in the risk premium for Russia...*(basis points)
* Average CDS spread for EMEs is based on the data for Brazil, China, Turkey, Mexico and Malaysia.Sources: Bloomberg, Bank of Russia calculations.

6 MONETARY POLICY REPORT No. 2 (22) JUNE 2018 1. MACRoECoNoMIC сoNDITIoNS
relative expected levels. This had an impact on inflation dynamics and also on the estimates of the neutral interest rate of the monetary policy.
one significant event which was not anticipated in the Bank of Russia’s baseline scenario and which influenced the Russian economy was the expansion of sanctions against Russia by the US on 6 April 2018. The direct effect of this measure on external flows was limited: the proportion of cross-border trade and financial transactions that the sanction restrictions could directly affect is extremely small, both with regard to balance of payments indicators and GDP overall. But the drag on investors’ sentiment and expectations was considerable. one could observe that Russia’s risk premium in the international markets grew, foreign
investors’ funds were withdrawn from Russian assets, the ruble depreciated, and stock market quotations dropped (Charts 1.6, 1.7 and 1.8). At the same time, the spell of elevated volatility was relatively short-lived; as soon as the second half of April, market participants adapted to the new conditions and the situation stabilised. The climate in the financial markets is expected to remain stable and the risks of events developing unfavourably are assessed to be low.
However, the Bank of Russia assumes that Russia’s risk premium and the ruble’s exchange rate will remain sustainably at current levels, that is, they will be higher and weaker, respectively, than forecast in the March baseline scenario. This can be explained both by expectations that
Chart 1.7 ...outflow of foreign investors’ fund...
(billions of US dollars)
* May 2018 – weekly-data based estimate.Source: EPFR Global.
Chart 1.8 ...decline in stock market prices
(1.01.2013 = 100%)
Chart 1.9 Investors’ interest in EMEs has reduced slightly
(1.01.2013 = 100%)
* Average index for EMEs includes exchange rates of the Hungarian forint, Brazilian real, Korean won, Turkish lira, Mexican peso, Polish zloty, Romanian leu, Malaysian ringgit, Philippine peso, Indonesian and Indian rupee.
Sources: Bloomberg, Bank of Russia calculations.

1. MACRoECoNoMIC сoNDITIoNS JUNE 2018 No. 2 (22) MONETARY POLICY REPORT 7
In April-May, global oil prices surged noticeably, with Urals crude prices in May reaching their highest level since 2014, exceeding $75 per barrel. This trend was shaped both by persistently stable global demand, which buoyed commodity prices in general (Chart 1.10), and supply dynamics. Local factors behind the accelerated growth in oil prices specifically included elevated geopolitical tension in the Middle East and the announcement of renewed US sanctions against Iran. At the same time, overall, the impact of supply-side factors appeared to be more stable than previously expected, and supply and demand in the global oil market were more balanced, taking into account oil stocks dynamics (in particular in the US and EU) and the sustainable global growth, among other things. This allows for the upward revision of an oil price path for this year and, to a lesser degree, for the following year (see Section 2). The baseline scenario now assumes that in 2018 Q2 the average Urals crude price will be roughly $72 per barrel (in the baseline scenario in the March MPR, the price level was $62 per barrel), and from Q3 onwards it will start to gradually fall (to $67 per barrel in Q3), reaching $50 per barrel in the medium term (no change since the March forecast). on the other hand, taking into account the high level of uncertainty traditionally associated with the demand forecast and especially the supply forecast in the global energy market, there is still the possibility of oil prices remaining persistently elevated. With this in mind, as an alternative, the Bank of Russia has considered an external situation development scenario in which Urals crude prices
the sanctions will be long-term and the growing volatility and increased sensitivity to risk generally observed in the global markets. on the one hand, this is due to the heightened uncertainty regarding the government policy of some of the world’s largest economies (primarily, the US), and on the other hand, investors’ slight revision of risks to growth in emerging market economies amid negative developments in some of them (Chart 1.9).
Considering the adjustment in market participants’ expectations with regard to economic growth and inflation in the US and the Fed’s somewhat tougher rhetoric, the baseline forecast assumes that US monetary policy will normalise slightly faster than expected in March (the increase in monetary policy rates in certain periods is shifting one quarter ahead over the forecast period, taking into account the standard 0.25 percentage-point step).
External financial conditions are also viewed as a meaningful factor for estimating the medium-term neutral interest rate for Russia’s monetary policy. The changes in the external situation in April-May do not justify a review of the wide 6 –7% range of neutral interest rate estimates previously announced by the Bank of Russia. However, taking these changes into account, the level of neutral interest rate, all things being equal, may be considered to be higher than previously anticipated.
At the same time, the pass-through of the expanded sanctions on economic activity is estimated to be negligible and not requiring a change to the forecast. Specifically, according to business monitoring data from the Bank of Russia (hereinafter, the Monitoring), most companies (approximately 70%) report that the sanctions have not had any impact on their activities and generally point to an improvement in the business climate in recent months.
The increase in global oil prices produced a more significant and sustainable effect than expected – the pace of their growth exceeded the baseline and alternative scenarios presented in the March MPR. This justified the revision of the Bank of Russia’s medium-term forecast assumptions with respect to external conditions. In the current period, the increase in prices for oil products had a slight effect on inflation, in terms of motor fuel prices.
Chart 1.10 Persistent global demand and elevated geopolitical tensions
supported raw materials prices(1.01.2013 = 100%)
8 MONETARY POLICY REPORT No. 2 (22) JUNE 2018 1. MACRoECoNoMIC сoNDITIoNS
of fuel prices’ growth to inflation in the baseline scenario could be 0.2– 0.4 pp by the end of the year (see Box ‘The additional effect of rising fuel prices on inflation’).
The substantial depreciation of the ruble, caused by external changes, was a factor behind inflation overshooting the forecast. At the same time, the extent of the increase was less than could have been expected, taking into account comparable episodes of increased exchange rate volatility. It is expected that the ruble’s depreciation will continue to pass through onto prices in the coming months, but its overall impact may be moderated by structural factors.
The depreciation of the ruble influenced the dynamics of both food and non-food goods prices, as well as services prices. A pronounced reaction to the change in exchange rate dynamics was observed in outbound tourism prices. The depreciation of the ruble, together with the growth in oil prices, as noted above, put pressure on motor fuel prices. At the same time, in April-May inflation rose less than could be expected, based on a retrospective analysis of episodes of exchange rate volatility. This can be explained by the following factors.
First, recent inflation expectations have fallen significantly and have become more resilient to the effects of short-term factors (Table 1.1). The rapid normalisation of the situation in the financial markets after a change in external conditions and the continuation of a consistent policy pursued by
remain at $70 per barrel in the medium term (see Section 2).
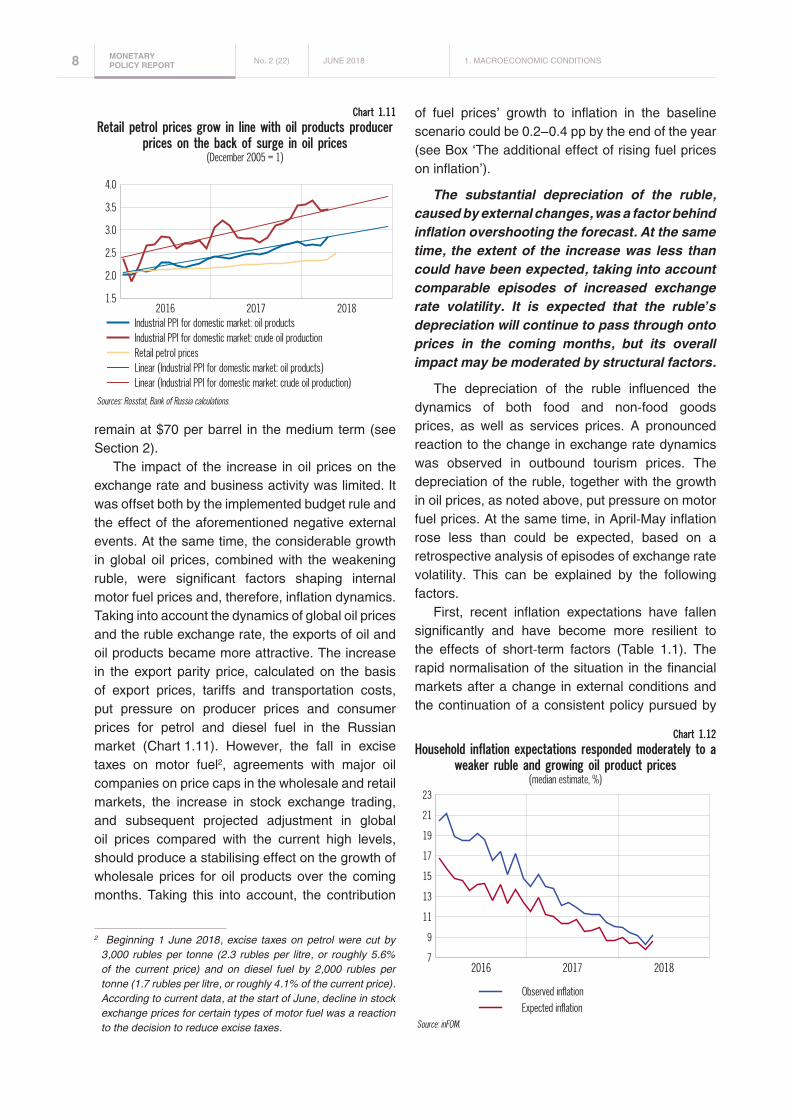
The impact of the increase in oil prices on the exchange rate and business activity was limited. It was offset both by the implemented budget rule and the effect of the aforementioned negative external events. At the same time, the considerable growth in global oil prices, combined with the weakening ruble, were significant factors shaping internal motor fuel prices and, therefore, inflation dynamics. Taking into account the dynamics of global oil prices and the ruble exchange rate, the exports of oil and oil products became more attractive. The increase in the export parity price, calculated on the basis of export prices, tariffs and transportation costs, put pressure on producer prices and consumer prices for petrol and diesel fuel in the Russian market (Chart 1.11). However, the fall in excise taxes on motor fuel2, agreements with major oil companies on price caps in the wholesale and retail markets, the increase in stock exchange trading, and subsequent projected adjustment in global oil prices compared with the current high levels, should produce a stabilising effect on the growth of wholesale prices for oil products over the coming months. Taking this into account, the contribution
2 Beginning 1 June 2018, excise taxes on petrol were cut by 3,000 rubles per tonne (2.3 rubles per litre, or roughly 5.6% of the current price) and on diesel fuel by 2,000 rubles per tonne (1.7 rubles per litre, or roughly 4.1% of the current price). According to current data, at the start of June, decline in stock exchange prices for certain types of motor fuel was a reaction to the decision to reduce excise taxes.
Chart 1.11 Retail petrol prices grow in line with oil products producer
prices on the back of surge in oil prices(December 2005 = 1)
Chart 1.12 Household inflation expectations responded moderately to a
weaker ruble and growing oil product prices(median estimate, %)

1. MACRoECoNoMIC сoNDITIoNS JUNE 2018 No. 2 (22) MONETARY POLICY REPORT 9
the Bank of Russia could buoy confidence among economic agents that price dynamics would remain stable.
May’s survey results show that household inflation expectations have not changed substantially compared with March (Chart 1.12; ‘Inflation Expectations and Consumer Sentiment’ review3 for April and May 2018). Corporate inflation
3 http://www.cbr.ru / DKP / surveys / inflation / .
expectations remained mixed when broken down by sector and region and, in March-April, increased slightly in many sectors in response to exchange rate fluctuations (Chart 1.13, Annex ‘The economic situation in Russian regions’). However, an additional corporate survey conducted as part of the Bank of Russia’s Monitoring in May showed that most companies (from 60% to 70% in various industries) do not intend to raise prices in the next three months. Low price expectations remained in
The additional effect of rising fuel prices on inflation
The relationship between fuel prices and inflation has direct and indirect effects. The direct effect is related to
household consumption of motor fuel. The proportion of fuel in the consumer basket used to calculate the CPI is 4.2%.
The indirect effect of the pass-through of motor fuel prices onto other product and service prices materialised through
businesses’ transport and energy costs. The two channels, specifically, are important: transport costs and lubricants
costs for agriculture.
overall, taking the direct and indirect contributions into account, 1% growth in motor fuel prices may make an
additional contribution of roughly 0.06 pp to annual inflation. Considering the given analysis, this estimate can be used
as a conservative estimate to calculate the inflationary effects of an increase in fuel prices.
Transport costs are included in the price of all and each product, so an increase in the price of motor fuels used
by lorries has an impact on inflation. For this channel, the impact of the CPI’s elasticity relative to motor fuel prices is
estimated at 0.8– 1%. The range of elasticity is based on the results of two different approaches. The first one is based
on an analysis of fuel consumption for transporting goods, which uses statistics on freight transportation volumes and
the structure of the transport industry. By comparing fuel costs and retail trade volumes, elasticity can be calculated
taking into account the proportion of products in the CPI basket. However, not all freight turnover is related to consumer
goods or their production, so an estimate using this approach can be considered an upper-bound estimate. The
second approach uses Rosstat statistics on the structure of retail prices. The retail price structure is formed on the
basis of surveys of manufacturing businesses and distribution companies. This indicator gives a direct estimate of fuel
costs for 66 products in the CPI basket. The fuel costs for these categories were weighted and normalised according
to products’ weighs in the consumer basket.
The second impact channel is through agricultural expenditure, as agricultural equipment and machinery are major
consumers of motor fuel. An increase in the price of fuel leads to an increase in costs, which are passed on to the
prices of agricultural products, especially products from the next harvest, so this channel has a medium-term effect.
For the channel based on agricultural expenditure, CPI elasticity for motor fuel is 0.7– 0.9%. This range of elasticity
has been also derived using two estimates. The first estimate is based on the surveys of agricultural businesses
and regional agricultural ministries in rural regions. Interviews yielded average estimates of spending on lubricants
in the agricultural industry. The overall elasticity for the entire industry was calculated on the basis of the structure of
the agricultural industry and the impact of agricultural producer prices on the CPI. The second estimate is obtained
from the statistics on the structure of expenditure on production and product sales. Taking into account the impact
of agricultural producer prices on the CPI and fuel costs in the agricultural industry, the elasticity of inflation can be
calculated for the given impact channel.
The effects considered above are predominantly typical for the instances of the indirect pass-through of motor
fuel prices on consumer prices, though they do not cover all of them. Transport costs can be part of many business
processes that are not directly related to freight transportation. In addition, the secondary effects of an increase in
motor fuel prices can feed through via inflation expectations. However, the effect of these channels seems to be less
stable, therefore their direct estimate is difficult.

10 MONETARY POLICY REPORT No. 2 (22) JUNE 2018 1. MACRoECoNoMIC сoNDITIoNS
Tabl
e 1.1
Infla
tion
expe
ctat
ions
of e
cono
mic
agen
ts
Опро
сEx
pect
atio
n ho
rizon
2014
2015
2016
2017
2018
Q1Q2
Q3Q4
Q1Q2
Q3Q4
Q1Q2
Q3Q4
Q1Q2
Q3Q4
Jan
Feb
Mar
Apr
May
Infla
tion
expe
ctat
ions
(abs
olut
e), %
Hous
ehol
ds
Publ
ic O
pini
on
Foun
datio
nne
xt
12 m
onth
s11
.811
.712
.515
.515
.715
.016
.016
.414
.714
.214
.212
.411
.210
.39.
68.
78.
98.
48.
57.
88.
6
Publ
ic O
pini
on
Foun
datio
n (B
oR
calc
ulat
ions
)
next
12
mon
ths
8.1
9.0
9.6
14.4
13.8
12.2
14.5
12.8
7.4
6.7
5.9
5.1
4.0
4.0
2.8
2.4
2.1
2.1
2.2
2.2
2.3
Prof
essi
onal
ana
lyst
sBl
oom
berg
2018
4.0
4.0
4.0
4.0
3.8
3.6
3.6
3.6
Inte
rfax
2018
4.2
4.1
4.1
3.9
3.8
3.8
3.7
4.0
3.8
Thom
son
Reut
ers
2018
4.1
4.0
4.1
3.8
3.8
3.6
3.8
3.7
Fina
ncia
l mar
kets
OFZ-
INne
xt 7
yea
rs6.
45.
85.
44.
64.
54.
64.
54.
33.
93.
73.
73.
63.
53.
73.
8OF
Z-IN
(w/o
opt
ion
adju
stm
ent)
next
7 y
ears
8.1
7.3
6.9
6.0
5.3
5.4
4.9
4.7
4.3
4.1
4.1
4.0
3.9
4.2
4.3
Bond
mar
ket
next
qua
rter
6.9
7.0
7.7
8.3
10.6
15.0
14.1
14.2
12.0
6.9
7.2
6.6
5.3
4.4
4.5
3.3
2.7
Inte
rban
k le
ndin
g m
arke
tne
xt q
uarte
r6.
77.
58.
210
.214
.817
.115
.013
.39.
95.
35.
45.
64.
63.
73.
42.
51.
9
Infla
tion
expe
ctat
ions
(bal
ance
of r
eplie
s*)
Hous
ehol
ds
Publ
ic O
pini
on
Foun
datio
nne
xt
12 m
onth
s84
8584
8376
7280
8384
7882
8079
8082
7878
7574
7676
Publ
ic O
pini
on
Foun
datio
nne
xt m
onth
7982
7677
6860
7178
7268
7076
6868
7373
6961
6263
63
Ente
rpris
es
Russ
ian
Econ
omic
Ba
rom
eter
next
3
mon
ths
2626
3270
3220
2848
1438
3646
2220
1452
2224
Bank
of R
ussi
ane
xt
3 m
onth
s14
.312
.413
.930
.314
.812
.712
.117
.312
.412
.110
.412
.46.
89.
66.
69.
46.
06.
58.
39.
4
Reta
il pr
ices
(Ros
stat
)ne
xt q
uarte
r42
4141
4331
2830
2932
2928
2727
2424
2220
Tarif
fs (R
osst
at)
next
qua
rter
65
25
76
22
55
00
43
00
5Ch
ange
com
pare
d w
ith p
revi
ous
3 m
onth
s: –
inf
latio
n ex
pect
atio
ns im
prov
ed (m
ore
than
1 s
tand
ard
devi
atio
n) –
inf
latio
n ex
pect
atio
ns im
prov
ed (l
ess
than
1 s
tand
ard
devi
atio
n) –
infla
tion
expe
ctat
ions
rem
aine
d un
chan
ged
(± 0
.2 s
tand
ard
devi
atio
ns)
– i
nfla
tion
expe
ctat
ions
det
erio
rate
d (le
ss th
an 1
sta
ndar
d de
viat
ion)
– i
nfla
tion
expe
ctat
ions
det
erio
rate
d (m
ore
than
1 s
tand
ard
devi
atio
n)*
Bala
nce
of re
plie
s is
a d
iffer
ence
in th
e sh
are
of re
plie
s of
the
resp
onde
nts,
who
exp
ect t
hat p
rices
will
incr
ease
and
that
pric
es w
ill d
ecre
ase.
Sour
ces:
Pub
lic O
pini
on F
ound
atio
n/in
FOM
sur
vey
resu
lts, R
osst
at, I
nter
fax,
Blo
ombe
rg, T
hom
son
Reut
ers,
Ban
k of
Rus
sia
calc
ulat
ions
and
Rus
sian
Eco
nom
ic B
arom
eter
.

1. MACRoECoNoMIC сoNDITIoNS JUNE 2018 No. 2 (22) MONETARY POLICY REPORT 11
agriculture (despite a slight increase). The inflation expectations of professional financial market participants, estimated both on the basis of survey results and indirect estimates based on federal government bond pricing4, remained close to 4% at the end of the year (Chart 1.14).
Second, the situation in the food market was an important factor that largely offset the growing pro-inflationary pressure from the depreciation of the ruble. The dynamics of food prices point to high supply saturation in the domestic market amid modest growth in demand. one possible explanation is that demand restrictions are also influencing the policies of retail companies, which
4 Federal government bonds with inflation-indexed face values (OFZ-IN).
can deliberately raise prices over longer periods of time or distribute the margin across various product groups. Furthermore, non-food goods prices are generally exhibiting a relatively protracted response to exchange rate fluctuations, with the delayed effects possibly manifesting themselves over the coming months.
The Bank of Russia expects that the materialised increase in the ruble exchange rate will still continue to feed into prices in the months to come. Taking this into account, inflation will approach 4% faster than previously expected.
The high supply of agricultural products in the domestic markets is continuing to constrain growth in food prices, making the biggest contribution to keeping inflation below 4%. The pass-through of this factor in Q2 continued to be more pronounced than expected, but should come to an end in the coming months.
Food price growth remained low (Chart 1.15).The depreciation of the ruble in April contributed
to a rise in food prices, but their dynamics were more modest than expected by the Bank of Russia (see ‘Consumer Price Dynamics’ review5 for April 2018). The persistently high supply of agricultural products in the domestic market continued to produce a constraining effect on prices. According to seasonally-adjusted estimates, fruit and vegetable prices mainly fell in May. Prices for the main vegetables in the ‘borsch basket’ (including beetroot, cabbage and onions) decreased, and the
5 http://www.cbr.ru / DKP / surveys / dinamic / .
Chart 1.13 The stability of business price expectations in manufacturing and trade mitigates inflation risks
(balance of replies*, seasonally adjusted, %)
* Businesses’ replies to the question: ‘How will finished product prices change (increase/decrease) over the next 3 months?’Sources: Bank of Russia, business surveys.
Chart 1.14 At end-2018, inflation expectations of professional analysts
are near the target(inflation in 2018, %)
Sources: Rosstat, Interfax, Bloomberg, Thomson Reuters.

12 MONETARY POLICY REPORT No. 2 (22) JUNE 2018 1. MACRoECoNoMIC сoNDITIoNS
price drop was especially pronounced for potatoes (largely due to the imports of cheaper potatoes from the new harvest in Egypt). The base effect also influenced the slowdown in vegetable price growth year-on-year (May 2017 saw a hike in prices for potatoes, cabbage, beetroot, carrots and onions due to the deterioration in the market climate amid the late sowing) (Chart 1.16). Active growth in the domestic output of greenhouse products also had a constraining effect on the prices of certain types of vegetables (cucumbers and tomatoes). on average, in May fruit and citrus fruit prices dropped: the slight growth in apple and pear prices (seasonally-adjusted) was offset by falling prices for other products, chiefly bananas (as a result of falling import prices from Ecuador – the main
supplier to Russia – and in the global market as a whole) and oranges.
overall, the situation in the global food markets, linked to the Russian domestic market (of meat, vegetable oils and sugar), did not put any additional pressure on prices (Chart 1.17). In March-May 2018, the moderate growth in global grain prices continued following their decline in 2016– 2017 amid good harvests in key exporting countries. This was accompanied by an increase in Russian producers’ grain and legume prices, even though they still remained below the previous year’s levels. Price growth was held back by high accumulated stocks. According to the baseline scenario, this year, Russia does not expect a repeat of last year’s record grain harvest, but its levels are still forecast
Chart 1.18 Agricultural producer prices accelerated
on the back of the weakening ruble(per cent change on previous month, seasonally adjusted)
Chart 1.17 Situation in the global food markets does not create
additional inflation risks(2002 – 2004 = 100)
Chart 1.15 The constraining effect of food inflation prevailed over
the drag from the weak ruble(per cent change on corresponding month of previous year)
Chart 1.16 ‘Borsch’ vegetables price growth declined
in May despite considerable price dispersion

1. MACRoECoNoMIC сoNDITIoNS JUNE 2018 No. 2 (22) MONETARY POLICY REPORT 13
to be relatively high. Taking this into account, grain and legume prices are expected to grow at a moderate pace, without posing any risk of exceeding inflation targets.
Supply to the food markets is already adjusting to the level of demand, but the rebalancing of the market is a gradual process. Producer prices in the agricultural industry have started to recover (Chart 1.18). Nonetheless, despite a slight revival in current price dynamics, meat and poultry, pasta and cereals, sugar and sunflower oil were still cheaper than in the previous year. Annual inflation continued to slow in the dairy market.
Taking into account the base effect, the increase in annual food inflation will continue and will evolve in summer-autumn as the new harvest is collected. Considering the forecasts of current weather conditions and existing results for the 2018 sowing campaign, annual food inflation for most agricultural crops will be slightly below the levels of the previous year (in Russia and globally). The possible shift in the product harvesting/ sale periods given the mixed weather conditions may also have an effect on the trajectory of changes in the year-on-year inflation in some months. Taking into account the combined impact of traditionally volatile supply-side factors on food price dynamics, some heterogeneity may still remain. However, overall, the Bank of Russia continues to expect a gradual natural acceleration in annual food price growth in the coming months, which will be in keeping with inflation approaching 4%.
Monetary conditions are developing in line with expectations and are gradually easing. They are moving closer to being neutral, in terms of their impact on inflation.
The reduction in the key rate in February and March by a total of 0.5 bp continued to feed into retail interest rate dynamics. In April-May, interest rates in the money market and bond market, and interest rates on banking operations were slightly below or close to the levels registered at the start of the year (Charts 1.19 and 1.20). The factors that restricted the scale of the reduction in market interest rates were the following ones:
• the slight reduction expected in the spread of money market rates relative to the key rate in
Chart 1.20 The scale of reduction in market rates was limited by the expected contraction in the spread of money market rates
to the key rate in March-May...(% p.a.)
Chart 1.19 Interest rates generally decline amid key rate cuts
(% p.a.)
* Data on interest rates on ruble bank operation for April 2018 are based on preliminary estimates.Source: Bank of Russia.
Chart 1.21 ... and the increase in risk premia
in the bond market

14 MONETARY POLICY REPORT No. 2 (22) JUNE 2018 1. MACRoECoNoMIC сoNDITIoNS
growth in the sovereign risk premium (by 0.2– 0.3 pp) (Chart 1.21);
• market participants’ slight reassessment of the medium-term potential for a reduction in monetary policy rates (Table 1.2), in line with the change in external conditions and communications on the results of April’s and June’s decisions by the Bank of Russia Board of Directors.Interest rate dynamics continued to be a decisive
component of the easing in bank lending conditions, while non-price conditions (lending terms, collateral requirements, etc.) also relaxed, but remained cautious and varied (Chart 1.22). According to bank
March-May compared with the first months of 2018 (from 0.5 to 0.25– 0.3 pp) as the seasonal liquidity ‘overhang’ formed at the start of the year shrank and banks adapted to the growing liquidity surplus (Chart 1.19; ‘Banking Sector Liquidity and Financial Markets’ reviews for January-March 20186). In the coming quarters, the spread of money market rates against the key rate is expected to remain at 0.2– 0.3 pp;
• the increase in risk premiums in the bond market amid the expansion of external sanctions and
6 http://www.cbr.ru / DKP / surveys / liquidity / .
Table 1.2
Market participants’ key rate expectations
Indicator of expected key rate movements2018
June July September October December
Money market*RUONIA futures 7.25 (7.17) 7.25 (7.13) 7.14 (7.06) 7.15 7.14 (7.03)RUONIA/ROISfix curve 7.23 (7.17) 7.14 (7.03) 7.09 (7.03) 6.99FRA 3X6 / Mosprime 3M spread 6.76 (7.24) 6.85 (7.22) 6.90 (7.21) 6.88 6.76 (7.19)OFZ* marketOFZ-PK (coupon linked to RUONIA) 7.00 (7.09) 7.04 (7.11) 7.10 (7.12) 7.15 7.20 (7.15)Analysts’ expectations**Reuters (median) as of 31.05.18*** 7.25 (7.00) 7.00 (7.00) 6.75 (6.75)Bloomberg (median) as of 27.04.18 7.25 (7.00) 6.94 (6.75) 6.79 (6.53)
– decrease – increase
* Last values as of 13.06.2018, values in brackets as of 25.04.2018.** Value in brackets: Reuters – as of 27.04.18, Bloomberg – as of 27.04.18.
*** Reuters analysts (as of 13.06.18): in June, 16 out of 25 expect the rate to remain at 7.25%, 9 – to reduce to 7.00%; Bloomberg analysts (as of 14.06.2018): in June, 20 out of 40 expect the rate to remain at 7.25%, 20 – to reduce to 7.00%; traders (ACI) (as of 14.06.2018): in June, 29 out of 31 expect the rate to remain at 7.25%, 2 – to reduce to 7.00%.
Sources: Bloomberg, Thomson Reuters, Bank of Russia calculations.
Chart 1.22 The easing of bank lending* conditions is gradual, primarily,
due to price conditions(percentage points)
* The territory of negligible changes in lending conditions (i.e. changes reported by few banks) is shown in grey.
Source: Bank of Russia.
Chart 1.23 The majority of banks assess lending conditions
as neutral or moderately softBanks’ assessment of long-term lending tightness in 2018 Q1*, %
* Characterised by the proportion of banks which chose certain degree of lending condition tightness in total credit institutions polled.
Source: Bank of Russia.

1. MACRoECoNoMIC сoNDITIoNS JUNE 2018 No. 2 (22) MONETARY POLICY REPORT 15
a more cautious approach by banks to corporate lending.
Growth rates in monetary and credit aggregates were generally in line with the scenario forecasts of the March MPR (close to the alternative scenario assuming no change in oil prices). Amid the depreciation of the ruble in Q2, they accelerated slightly and approached levels that are forecast to remain until the end of 2018 under the baseline forecast (Chart 1.24). Their growth was proportionate to the growth in borrowers’ incomes and the easing of price and non-price lending conditions.
The debt burden indicator remained close to levels assessed as neutral (Chart 1.25). The quality
surveys, most banks already view current lending conditions, in terms of their tightness, to be almost neutral or moderately soft7 (Chart 1.23), i.e. they do not restrict access to loans or demand for loans for the majority of potential borrowers. overall, their assessment reflects the dominance of more easy lending conditions in the retail lending sector and
7 According to the survey parameters, neutral conditions mean conditions that do not restrict access to loans for most groups of potential borrowers and do not exert a significant impact on the number of potential borrowers and their demand for loans; moderately easy conditions mean conditions that not only do not restrict access to loans for most potential borrowers, but also attract borrowers, thereby moderately stimulating demand for loans.
Chart 1.24 Broad money growth has slightly accelerated and will stabilise around current levels
(contribution to M2X annual growth, percentage points)
* From 1.01.2015, monetary indicators are calculated on the basis on new statistical methodology.Source: Bank of Russia.
Chart 1.25 Debt burden* in economy remains neutral
(as % of GDP)
* The debt service ratio (DSR) is viewed as the debt burden indicator. The DSR is the ratio of cash flow available to pay current debt obligations, including principal and interest, to current income value.Source: Bank of Russia.

16 MONETARY POLICY REPORT No. 2 (22) JUNE 2018 1. MACRoECoNoMIC сoNDITIoNS
of the portfolio of loans to non-financial organisations stabilised and the quality of the portfolio of loans to households improved. Credit institutions’ loan loss provisioning shrank, which contributed to an improvement in banks’ financial positions (see ‘Banking Sector Liquidity and Financial Markets’ review for April 2018).
The Bank of Russia continued to closely monitor developments in the consumer lending segment, which are of particular importance for estimating inflation and credit risks. At present, the Bank of Russia views the current growth in retail lending to be natural (in line with the improved solvency of borrowers as economic activity grows and interest rates fall) and does not rule out a slight acceleration
in this growth in the coming quarters. However, despite growth in this segment, the proportion of consumer lending in banks’ portfolios and, specifically, the change in aggregate outstanding loans remains small (Chart 1.26). The growth in household deposits, buoyed by persistently attractive real interest rates, is still stable (Chart 1.27). This will help to maintain relatively stable dynamics in households’ net financial position (balance of credit and deposit activities) and consistent savings behaviour, thereby avoiding any additional inflationary pressure through this channel (Chart 1.28).
The risks previously highlighted by the Bank of Russia in relation to a possible increase in consumer activity were not realised in this period – in particular, the effects of accelerating wage growth, changes in consumer behaviour and the effects of fiscal measures. However, medium-term uncertainty remains, primarily in relation to the impact of fiscal policy measures.
The growth in real wages, which accelerated considerably at the start of the year, has been somewhat adjusted, as expected (Chart 1.29). In April, real wages grew by 7.8% year-on-year, after 8.7% in March (10.2% for 2018 Q1), which was in line with the Bank of Russia’s forecast prepared in March. According to the Monitoring results, the proportion of companies that planned to raise wages in 2018 dropped markedly compared with the previous year, which confirms that the moderate risk of accelerating wage growth still
Chart 1.27 Growth in bank deposits remains stable
(annual growth, %)
Chart 1.26 Growth in lending remains moderate without creating risks for inflation and financial stability
(contribution of various components to annual growth rate of banks’ loan portfolio, percentage points)
* Adjusted for foreign currency revaluation.Source: Bank of Russia.

1. MACRoECoNoMIC сoNDITIoNS JUNE 2018 No. 2 (22) MONETARY POLICY REPORT 17
persists. Taking this into account, the outlook for the situation in the labour market as a whole over the coming quarters remained unchanged – wages are expected to continue to grow at close to current levels, with unemployment readings being at their natural level of 4.8– 5.0% (not putting any additional pressure on changes in wages and prices).
According to preliminary estimates, savings rate in March and April decreased and was slightly below the expected trend (Chart 1.30). The decrease in foreign exchange assets growth (the reduction in the proportion of growth in foreign exchange assets relative to disposable incomes) made a significant contribution to this change. This was due to enhanced volatility in the foreign exchange market and was consistent with the response to similar
episodes that had occurred in the period under observation. Moreover, the negative contribution of outstanding loans in 2018 to the change in savings rate remains stable overall, with the risk of a sharp increase assessed to be low. Given the stabilising ruble exchange rate, the upward adjustment in savings rate is expected to occur in the coming months, before stabilising at 7– 9% in the medium term.
With regard to the fiscal policy, the situation developed as set forth by the Bank of Russia’s short-term forecast. The consolidated budget deficit continued to shrink rapidly, outstripping planned levels due to growth in oil and gas revenues prompted by the significant increase in global energy prices. In May, budget projections for 2018
Chart 1.28 Households’ net financial position is relatively stable
(annual change in retail bank operations*, trillions of rubles)
* Positive values mean increase in net banking claims on households.Source: Bank of Russia.
Chart 1.29 Real wage growth slows down, as expected
(per cent change on corresponding month of previous year)
Chart 1.30 Reduction in savings rate is short-lived in March-April and
poses no risks to inflation(contribution to savings rate, seasonally adjusted)

18 MONETARY POLICY REPORT No. 2 (22) JUNE 2018 1. MACRoECoNoMIC сoNDITIoNS
were adjusted to take into account the updated macroeconomic forecast published by the Russian Government. The changes mainly consisted in the upward revision of the oil and gas budget revenue amid the assumed increase in oil prices (the average forecast Urals crude price for the year was revised closer to the March baseline scenario of the Bank of Russia: in 2018, to $61 per barrel from $44 per barrel, and in 2019 to $57 per barrel from $42 per barrel previously). The amount of planned budget expenses, calculated in accordance with the budget rule and assuming no change in the baseline oil price, was raised insignificantly. Taking this into account, the Bank of Russia has not changed its outlook for the developments in the budget sphere and their impact on the economy as a whole in the baseline forecast for 2018.
In May, the President of the Russian Federation issued the Presidential Decree ‘on National Goals and Strategic objectives of the Russian Federation through to 2024’, which implies the elaboration and implementation of a wide range of measures, including in areas such as increasing infrastructure investment, developing healthcare and education, improving the quality of life of citizens and supporting non-commodity and high-tech exports. The implementation of this Decree may trigger noticeable changes to budget projections in the medium term. Certainty surrounding further potential fiscal policy measures will likely emerge towards the end of 2018, and the measures will start to be actively implemented beginning in 2019.
on 14 June 2018, a range of fiscal policy measures, slated for the following year, was announced. The most noticeable changes related to raising the retirement age and increases in the value added tax in 2019. The effect of these measures on consumer price dynamics will become apparent next year, but a slight pro-inflationary effect cannot be ruled out in 2018, coming through changes in inflation expectations and a faster price adjustment.
The Bank of Russia will continue to closely monitor developments and, as more certainty takes root, will consider their changes when preparing a macroeconomic forecast.
Overall, economic activity grew in line with expectations, the contribution of demand dynamics to inflation continued to approach neutral levels, and economic growth was close
to its potential levels. In June-July, hosting the FIFA World Cup will render additional support for economic activity, though this effect will be short-term and will not be accompanied by inflation risks.
A wide range of indicators point to consumer demand growing at a moderate pace; on average, they are close to the pre-crisis levels of 2014 (Chart 1.31). In April, retail trade turnover continued to grow both month-on-month and year-on-year (Chart 1.32). This is in line with Bank of Russia expectations. Data from inFoM survey8 also point to moderate consumer activity dynamics in May: estimates of the favourability of the current situation
8 http://www.cbr.ru / DKP / surveys / inflation / .
Chart 1.31 Demand indicators has not reached their 2014 levels
(per cent change on January 2014, seasonally adjusted)
Chart 1.32 Retail trade turnover grows at a moderate pace(contribution to growth rate, on corresponding period of previous year)

1. MACRoECoNoMIC сoNDITIoNS JUNE 2018 No. 2 (22) MONETARY POLICY REPORT 19
In April, investment and production activity indicators improved, confirming the temporary nature of the slowdown in economic growth in Q1. The recovery in GDP growth rates is expected to continue in quarterly terms. Hosting the FIFA World Cup in June-July 2018 will provide additional support for economic activity. Taking into account an analysis of income and expenditure flows associated with carrying out measures related to the World Cup, the current state of the Russian economy and the experience of other countries holding similar sports events, the positive contribution of this event to economic growth could reach 0.1 –0.2 pp of GDP in 2018, according to Bank of Russia estimates. This effect will likely be implemented predominantly in Q2. It will feed primarily through an increase
for high-value purchases have improved slightly (Chart 1.33). However, those surveyed have started to mention more frequently that they have made large purchases in the past three months. According to Bank of Russia estimates, the growth in household final consumption expenditure in Q1–Q2 will stand at 3.5– 4.0% year-on-year.
With the stable consumer activity, preliminary estimates suggest that overall GDP growth in 2018 Q1 was lower than previously expected. year-on-year, GDP growth was 1.3% in real terms (it was estimated at 1.5– 2.0% in the forecast in the March MPR) (Chart 1.34). Quarterly GDP growth relative to 2017 Q4 accelerated, but to a lesser degree than forecast – to 0.3% from 0.1% relative to the previous quarter, after seasonal adjustment (the forecast in the March MPR expected it to accelerate to 0.4– 0.6%).
The growth in investment activity was below expectations (Chart 1.35). The slowing investment growth was linked in part to short-term factors – unusually cold weather in March 2018, which fed through to construction activity (see ‘Economy’ review9 for April 2018). Annual rates were also influenced by the high base effect of 2017, as well as the completion of construction projects for the FIFA World Cup and several large infrastructure projects (see Annex ‘The economic situation in Russian regions’). The dynamics of other GDP components remained in line with previous trends and were close to the baseline forecast.
9 http://www.cbr.ru / DKP / surveys / ekonomics / .
Chart 1.33 Estimate of favourableness of a time period
for large purchases(as % of total respondents)
Chart 1.34 In 2018 Q1, GDP was below expectations due
to the effect of one-off factors(GDP growth structure by expenditure, on corresponding period of previous year)
* 2018 Q1 – Bank of Russia estimate.Sources: Rosstat, Bank of Russia calculations.
Chart 1.35 In March, investment activity declined because of the cold
weather, in April its recovery started(per cent change on January 2014, seasonally adjusted)

20 MONETARY POLICY REPORT No. 2 (22) JUNE 2018 1. MACRoECoNoMIC сoNDITIoNS
in hotel and restaurant services and transport services (which will largely be in the form of services exports) and growth in retail trade turnover. The pass-through of this factor on prices will be short-term and localised only across certain categories of products and services and in a small number of regions, meaning that its impact on inflation overall will be neutral.
According to the baseline forecast, in Q2 and Q3, GDP growth relative to the previous quarter, taking into account seasonal and calendar factors, will be 0.2– 0.6% (see ‘Economy’ review for April 2018). Taking into account the base effect of the previous year, annual GDP growth in Q2 and Q3 is expected to be 1.1– 1.6%.

JUNE 2018 No. 2 (22) MONETARY POLICY REPORT 21
The changes that occurred in March-May 2018 in terms of the external and internal economic conditions were mainly reflected in short-term forecasts for inflation, components of aggregate output, monetary indicators and balance of payments parameters. However, the slight change introduced to the Bank of Russia’s macroeconomic forecast parameters for the medium term is more for fine-tuning purposes. The main factors underpinning the forecast revision compared with the March MPR were the following changes:
1. In external conditions:As already noted in Section 1, external conditions
led to a certain adjustment in the Bank of Russia’s medium-term macroeconomic forecast assumptions with respect to oil prices, risk premiums and other factors. Nonetheless, the impact of these changes on the short-term economic activity and inflation forecasts was generally modest due to the recent noticeable reduction in the Russian economy’s sensitivity to external shocks. This was aided by the budget rule, which reduced the exchange rate’s reaction to movements in external conditions, the growth of import substitution in recent years and overall improvements in the sustainability of the Russian economy.
2. In investment activity in Russia in 2018 Q1:In 2018 Q1, the pace of investment growth was
slightly worse than expected by the Bank of Russia, which led to a small downward adjustment in the gross fixed capital formation forecast for 2018 (see Section 1).
3. Active discussion of tax changes in the Russian government, including indirect consumption taxes that have a significant impact on prices.
The Bank of Russia took these changes into account when preparing its macroeconomic forecast. However, their effect will be fully reflected in future Monetary Policy Reports as information on the parameters of changes becomes clearer.
Given the adjustment in assumptions regarding the external and internal economic conditions, the baseline scenario for economic development
assumes a gradual reduction in oil prices from $67 per barrel in 2018 to $55 and $50 per barrel in 2019 and 2020 respectively. As previously, the Bank of Russia considers the baseline scenario as its basis for key rate decision-making. In addition to the baseline scenario, other decisions options will be shaped by the scenario with oil prices remaining close to the levels observed in March-May 2018 (the scenario with unchanged oil prices).
2.1. Baseline scenario
According to updated estimates, annual inflation will come close to the Bank of Russia’s target in 2018. That is, it will be slightly faster than in the forecast presented in the previous MPR, reaching 3.5– 4.0% at the end of the year. In 2019, there may be a short-term pick up in inflation to 4.0– 4.5%, but by the start of 2020, consumer price growth will return to 4%.
The anticipated increase in the value added tax in 2019 was a factor behind the upward adjustment of inflation forecasts for 2018 and the medium-term outlook. The depreciation of the ruble in April, caused in part by April’s sanctions against Russia, will primarily make an impact on inflation dynamics over the course of 2018. In future, their impact on the exchange rate will wane over the forecast horizon.
April’s expansion of the external sanctions against a number of large Russian real sector companies exerted an upward pressure on the risk premium for Russia and led to the depreciation of the ruble. The scale of the depreciation was in part offset by higher than expected oil prices in March-May. In future, over the course of 2018, the impact of the sanctions on the financial markets, business sentiment and ruble exchange rate dynamics will be neutralised. However, the potential for strengthening the ruble will be limited, taking into account the expected reduction in oil prices, as well as the overall growth in volatility in global financial
2. ECONOMIC OUTLOOk

22 MONETARY POLICY REPORT No. 2 (22) JUNE 2018 2. ECoNoMIC oUTLook
markets and investor sensitivity to risk amid the more active normalisation of monetary policy in developed countries and the revised outlook for certain emerging market economies. Based on the above, the ruble will be weaker compared with the baseline scenario in the March MPR (Chart 2.1).
These factors will push upwards consumer price growth rates in Russia in 2018, but will not lead to inflation overshooting the Bank of Russia’s target for a number of reasons (Chart 2.2). First, the effects of the budget rule will continue to smooth out the impact of volatility in the external climate on the exchange rate and, as a result, on inflation, as well as in general on Russian internal economic indicators. Second, by 2018 Q2, inflation was at a relatively low level. This was largely due to temporary factors occurring in 2017 and in early 2018 (see the December MPR). The resultant low base served as a ‘cushion’, so to speak, for inflation dynamics: under current conditions, its increase will only lead to inflation returning to the target faster.
After 2018, external conditions are not expected to have a perceptible impact on the ruble’s exchange rate and inflation in Russia. In the medium term, the combined impact of external conditions on internal prices in the baseline scenario is estimated to be relatively small and will not prevent inflation from anchoring around 4%.
In Q2, increase in pro-inflationary pressure fuelled by energy price dynamics on a greater
scale than expected in the March MPR was a factor underpinning the slight increase in the inflation forecast for 2018. The pass-through of this factor over 2018 will gradually dissipate, in part due to the introduction in June of lower excise taxes on motor fuel, and will be offset in the medium term amid the gradual reduction in oil prices.
oil prices were higher than in the baseline scenario of the March MPR. Together with the weaker ruble, they contributed to growth in both Russian energy export prices and internal oil and oil product prices, leading in turn to growing costs for Russian companies. According to Bank of Russia estimates, the impact of this factor will materialise mainly in 2018 (its effect on prices is examined in detail in Section 1).
Over the forecast period, monetary conditions will gradually continue to approach neutral levels. This will be aided by the Bank of Russia’s monetary policy decisions, aimed at maintaining price stability in the Russian economy. The final transition to a neutral monetary policy could occur slightly later than estimated by the Bank of Russia, taking into account the impact of the Government’s fiscal policy measures on inflation and inflation expectations.
2014 2015 2016 2017 2018 2019 2020
Terms of trade
I II III IV I II III IV I II III IV I II III IV I II III IV I II III IV I II III IV
0.8
1.0
1.2
1.4
1.6
1.8
2.0
Unchanged oil prices Baseline
Chart 2.1Terms of trade
Note: terms of trade are approximated by Urals crude price index in real terms (oil prices adjusted for foreign inflation).Source: Bank of Russia calculations.
2014 2015 2016 2017 2018 2019 2020
(% of corresponding period of previous year)
I II III IV I II III IV I II III IV I II III IV I II III IV I II III IV I II III IV0
2
4
6
8
10
12
14
16
18
Baseline Medium-term target
Chart 2.2Inflation
(per cent change on corresponding period of previous year)
Note: shaded areas on the forecast horizon show the probability of different inflation values. Colour gradation reflects probability intervals. Confidence intervals are symmetrical and based on historical estimates of uncertainty of inflation.Source: Bank of Russia calculations.

2. ECoNoMIC oUTLook JUNE 2018 No. 2 (22) MONETARY POLICY REPORT 23
over the forecast horizon, internal financial conditions in the Russian economy will continue to evolve amid a measured approach to risk acceptance by economic agents and will be influenced by the Bank of Russia’s monetary policy decisions, including its decisions adopted on 28 April and 15 June to keep the key rate at 7.25% p.a. Taking into account the impact of the fiscal measures proposed by the Russian Government on inflation and inflation expectations, the transition to the neutral monetary policy needs to be slower. A small degree of tightness in monetary conditions should be retained to restrict the scale of secondary effects and keep annual consumer price growth close to 4%. In the medium term, changes to the key rate will be shaped by the dynamics of inflation and economic activity relative to forecasts.
Interest rates in the economy will gradually decline under the accumulated influence of monetary policy decisions already adopted by the Bank of Russia. Considering the revised forecasts for inflation and external conditions, the potential for the key rate reduction to the neutral level has decreased compared with estimates presented in the March MPR. With regard to non-price lending conditions, as before, banks will continue to adopt a conservative approach and will be primarily guided by thorough assessments of borrowers’ financial positions. Hence, as in the baseline scenario of the March MPR, non-price lending conditions are expected to ease gradually and in a measured manner, while banks’ shift to more risky segments of the lending market will be smooth and cautious.
Banks’ policy of easing price and non-price lending conditions will help to improve access to credit and expand opportunities to use it as a funding source for investment and consumption.
Estimates of the dynamics of lending1 to the economy overall were adjusted slightly upwards compared with the March MPR (Chart 2.3). The largest adjustment was made to the estimates for 2018. The reason for this was the increased
1 Banking sector lending to the economy means all of the banking sector’s claims on non-financial and financial institutions and households in the currency of the Russian Federation, a foreign currency and precious metals, including loans issued (including overdue loans), overdue interest on loans, credit institutions’ investment in debt and equity securities and promissory notes, as well as other forms of equity interest in non-financial and financial institutions, and other accounts receivable from settlement operations involving non-financial and financial institutions and households.
contribution of the foreign currency revaluation to the change in outstanding loans amid the depreciation of the ruble in Q2. The effect of this (see Section 1) will remain over 2018, after which the ruble exchange rate dynamics, though still weaker than anticipated in the March MPR, will be comparable. Taking this into account, the annual growth in lending to the economy in 2018 will be 10–13%, after which, over the 2019–2020 horizon, it will slow to 7 –12%, moving closer to the estimates given in the March MPR. The drop in the annual growth of lending activity in the medium term is caused by the high base effect of 2018. Similarly, the estimates of lending dynamics by sector (households and organisations) were adjusted slightly compared with the March MPR, and will be discussed in more detail below.
According to Bank of Russia estimates, demand for loans in the baseline scenario will be supported primarily by income dynamics, without leading to an excessive debt burden. It will instead help to maintain balanced growth in consumer and investment activity. The aggregate debt burden corresponding to this growth2 will stabilise over the forecast horizon at roughly 20– 22% of GDP, which is in line with the estimates of the March MPR (Chart 2.4). If risks and imbalances occur in certain segments of the credit market, the Bank
2 Here and elsewhere, the debt service ratio is used as an indicator of the debt burden. This indicator is the ratio of payments on accumulated debt (including both the principal and interest) to current income value.
4
5
6
7
8
9
10
11
12
13
4
5
6
7
8
9
10
11
12
13
2017* 2018 2019 2020
Baseline – June 2018 Baseline – March 2018
Chart 2.3Baseline forecast for the growth in credit to the economy has been upgraded for 2018 considering the contribution
of exchange rate revaluation(claims on the economy, per cent change on previous year)
* Actual data for 2017 in the March and June forecasts differ due to the revision of statistics.Source: Bank of Russia calculations.

24 MONETARY POLICY REPORT No. 2 (22) JUNE 2018 2. ECoNoMIC oUTLook
of Russia will offset them using macroprudential policy measures.
The dynamics of monetary aggregates over the forecast horizon will correspond to economic activity dynamics, allowing for normal functioning of the financial system without creating any additional pro-inflationary pressure.
Money supply growth has been revised upwards compared with the March MPR – from 8 –10% to 10–13% in 2018 (Chart 2.5). This is mostly due to the upward adjustment of estimates of the growth in lending to the economy, which, as previously, will make the main contribution to the dynamics of money supply, according to the national definition, over the entire forecast period. Estimates of the contribution of the change in the banking sector’s net foreign assets to the growth in money supply has also been adjusted significantly upwards due to the ruble being weaker than in the baseline scenario of the March MPR. Further ahead, the effect of the exchange rate will gradually be offset over the forecast period. Amid the gradual slowdown in lending growth, money supply growth will move closer to the estimates in the baseline scenario of the March MPR, at 8–11% in 2019 –2020.
The contribution of banking sector’s net credit to the general government will gradually contract as the Russian Government consistently implements its fiscal consolidation policy and the mechanism to accumulate funds under the budget rule. Amid moderate funds spending, monetary base dynamics
will correspond to money supply dynamics and will be predominantly determined by changes in cash in the economy (Chart 2.6).
The contribution of business activity to inflation will remain in line with the March forecast. This will continue to be aided in part by monetary conditions developing in accordance with economic participants’ expectations amid a consistent and open monetary policy. A slight adjustment to the forecast is possible as information is updated on calculations related to tax changes being discussed by the Russian Government and on the implementation of structural and institutional transformations in the Russian economy.
Chart 2.6Credit to the economy will continue to be
the main contributor to money supply growth over the forecast horizon
(contribution of components to growth in money supply (in the national definition*), per cent change on previous year)
* In the forecast, decomposition is shown for the increase in M2 in the national definition corresponding to the middle of the forecast range.
Source: Bank of Russia calculations.
Chart 2.4Debt burden* in economy will remain relatively low
(debt service ratio, as % of GDP)
* Forecast debt burden is calculated for the credit corresponding to the middle of the forecast range.
Source: Bank of Russia calculations.
4
5
6
7
8
9
10
11
12
13
14
4
5
6
7
8
9
10
11
12
13
14
2017 2018 2019 2020
Baseline – June 2018 Baseline – March 2018
Chart 2.5Forecast growth of money supply has been upgraded in
line with the revised forecast of lending(money supply in the national definition, per cent change on previous year)
Source: Bank of Russia calculations.

2. ECoNoMIC oUTLook JUNE 2018 No. 2 (22) MONETARY POLICY REPORT 25
out of all of the GDP components, the most serious revision has been made to the estimated growth in gross fixed capital formation and gross capital formation in general.
According to estimates, in the baseline scenario, the annual growth in gross fixed capital formation (Chart 2.9) will be 2.7–3.2% in 2018 (3.5 –4.0% in the March MPR). The adjustment of gross fixed capital formation estimates is linked to two key factors:
1. The revision of GDP components for 2017 by Rosstat. The estimated annual growth in gross fixed capital formation for 2017 has been revised upwards from 3.6% to 4.3%. This upward revision of actual data due to the base effect has fed through to the lower estimated annual growth in gross fixed capital formation for 2018, compared with the forecast presented in the March MPR.
2. The weaker than expected growth in investment activity in 2018 Q1 also contributed to the reduction in the estimated annual growth in gross fixed capital formation for 2018.
In future, over the forecast period, it will be adjusted slightly downwards to sit in the range 2.2 –2.7% (2.5–3.7% in the March MPR).
The rebound in lending to corporate sector will continue to buoy investment activity in 2018 –2020. Its annual growth will be 9–11% in 2018 and 6–10% over the remainder of the forecast period (7– 9% and 7–11%, respectively, in the March MPR). In the corporate sector, as suggested in the March MPR, the reduction of credit burden is expected to continue, resulting in the corporate debt burden
According to Bank of Russia estimates, annual GDP growth under the baseline forecast will be close to potential levels in the medium term, given that the current economic structure is unchanged, remaining at 1.5 –2.0%, as in the March MPR (Charts 2.7 and 2.8). In 2019, there is a risk of a slight slowdown in business activity. However, if planned measures are successfully implemented in the medium term, economic growth is expected to be faster than in the Bank of Russia’s current forecast.
0.8
1.0
1.3
1.5
1.8
2.0
2.3
0.8
1.0
1.3
1.5
1.8
2.0
2.3
2017 2018 2019 2020
Baseline – June 2018 Baseline – March 2018
Chart 2.7Forecast of GDP growth has not been revised compared
with the March MPR(GDP, per cent change year-on-year)
Source: Bank of Russia calculations.
2014 2015 2016 2017 2018 2019 2020
(% of corresponding period of previous year)
I II III IV I II III IV I II III IV I II III IV I II III IV I II III IV I II III IV-6
-4
-2
0
2
4
6
Baseline
Chart 2.8Economic activity growth is close
to the potential level(GDP, per cent change year-on-year)
Note: shaded areas on the forecast horizon show the probability of different GDP growth values. Colour gradation reflects probability intervals. Confidence intervals are symmetrical and based on historical estimates of uncertainty of GDP growth rate.Source: Bank of Russia calculations.
1.0
1.5
2.0
2.5
3.0
3.5
4.0
4.5
5.0
1.0
1.5
2.0
2.5
3.0
3.5
4.0
4.5
5.0
2017* 2018 2019 2020Baseline – June 2018 Baseline – March 2018
Chart 2.9The forecast for gross fixed capital formation growth
has been downgraded considering the updated statistics of 2017 – early 2018
(gross fixed capital formation, per cent change on previous year)
* Actual data for 2017 in the March and June forecasts differ due to the revision of statistics.Source: Bank of Russia calculations.

26 MONETARY POLICY REPORT No. 2 (22) JUNE 2018 2. ECoNoMIC oUTLook
firming over the forecast period at roughly 16% of GDP. A greater expansion in investment activity, than in the baseline forecast, is possible if structural transformations are successfully implemented in the Russian economy (Chart 2.10).
The elevated uncertainty in 2018 amid the sanctions introduced against real sector companies in Q1 also exerted an impact on the revision of gross capital formation dynamics overall, primarily through the expectations channel and, indirectly, through ruble exchange rate dynamics. These factors are expected to cause companies to more cautiously estimate potential demand for their products. This has already been observed in part in the results of business surveys. According to the findings of the survey conducted by the Gaidar Institute for Economic Policy, current demand dynamics are considered to be relatively weak. In these conditions, estimated finished product inventories are stagnating. PMI survey data also point to a slowdown in the dynamics of new orders. The finished product inventories of companies surveyed by IHS Markit are falling.
With regard to other GDP components, the forecast adjustments were generally negligible, in particular beyond 2018.
According to estimates for the Bank of Russia’s baseline scenario, the growth in consumer demand will continue to be moderate and will not exert any pro-inflationary pressure on the economy.
The estimated growth in household final consumption expenditure for 2018 has been reduced slightly compared with the March MPR – from 3.8 –4.3% to 3.3–3.8%, primarily due to the increased cost of imported products given the depreciation of the ruble (Chart 2.11). In future, in the forecast period, the consumption path will remain within the expectations range of the March MPR. According to Bank of Russia estimates, annual growth in household final consumption expenditure in 2019 –2020 will gradually slow to 2.5–3.3%, which is generally close to the estimates presented in the March MPR (2.5–3.0%).
As previously, household income dynamics will provide the greatest support for consumer demand. With the situation in the labour market remaining balanced, wages will continue to grow in real terms, according to Bank of Russia estimates. Wage growth rates will correspond to labour productivity dynamics and will not exert any pro-inflationary pressure. In addition to income, revival in lending activity will also continue to buoy consumer demand at an annual rate of 13 –18% in 2018 and 10–13% over the remainder of the forecast period. Like in the March forecast, growth in lending will be accompanied by a negligible, in terms of volume, and smooth, in terms of dynamics, increase in the debt burden. These processes are not expected to pose any significant risks to financial stability. However, if signs of imbalances evolve in certain segments of the market, the Bank of Russia will offset them using macroprudential policy measures.
1.0
1.5
2.0
2.5
3.0
3.5
4.0
4.5
5.0
1.0
1.5
2.0
2.5
3.0
3.5
4.0
4.5
5.0
2017 2018 2019 2020
Baseline – June 2018 Baseline – March 2018
Chart 2.11Household consumption will grow sustainably, with annual projection paths slightly adjusted
(final consumption of households, per cent change on previous year)
Source: Bank of Russia calculations.
Chart 2.10Lending to businesses and households
will continue to expand(contribution to increase in claims* on the economy, per cent change on previous year)
* In the forecast, decomposition is shown for the increase in claims on the economy corresponding to the middle of the forecast range.
Source: Bank of Russia calculations.

2. ECoNoMIC oUTLook JUNE 2018 No. 2 (22) MONETARY POLICY REPORT 27
As previously, consumer and investment demand will be satisfied through domestically produced goods and imported goods. Given the weaker ruble and lower trajectory of gross fixed capital formation growth compared with the March MPR, import growth rates will also be slightly lower in real terms. In 2018, this growth will be 7.4 –7.9% (7.5–8.0% in the previous MPR), and in future,
over the forecast horizon, it will shift to 4.7–5.8% (Chart 2.13).
With the persistence of robust current dynamics and relatively stable external demand, exports are expected to grow faster in real terms (Chart 2.12). According to Bank of Russia estimates, export growth will be in the range of 3.3 –3.7% (1.8–2.3% in the previous MPR). Later on, over the
1.0
2.0
3.0
4.0
5.0
6.0
1.0
2.0
3.0
4.0
5.0
6.0
2017* 2018 2019 2020
Baseline – June 2018 Baseline – March 2018
Chart 2.122018 will see a faster growth in exports given the robust
dynamics of external demand(exports, per cent change on previous year)
* Actual data for 2017 in the March and June forecasts differ due to the revision of statistics.Source: Bank of Russia calculations.
1.0
2.0
3.0
4.0
5.0
6.0
7.0
8.0
9.0
10.0
1.0
2.0
3.0
4.0
5.0
6.0
7.0
8.0
9.0
10.0
2017* 2018 2019 2020
Baseline – June 2018 Baseline – March 2018
17.015.0
17.015.0
Chart 2.13Imports are expected to grow proportionately with demand
growth given exchange rate dynamics(imports, per cent change on previous year)
* Actual data for 2017 in the March and June forecasts differ due to the revision of statistics.Source: Bank of Russia calculations.
Table 2.1
Key parameters of the Bank of Russia’s forecast scenarios (June 2018)(growth as % of previous year)
2017 (actual)
2018 2019 2020
baseline unchanged oil price
baseline unchanged oil price
baseline unchanged oil price
Urals price, average for the year, US dollars per barrel 53 67 69 55 70 50 70
Inflation, % in December year-on-year 2.5 3.5-4.0 3.5-4.0 4.0-4.5 4.0-4.5 4.0 4.0
Inflation, yearly average 3.5 2.5-3.5 2.5-3.5 4.0 4.0 4.0 4.0
Gross domestic product 1.5 1.5-2.0 1.5-2.0 1.5-2.0 1.5-2.0 1.5-2.0 1.5-2.0
Final consumption expenditure 2.6 2.5-3.0 2.5-3.0 2.3-2.8 2.5-3.0 2.0-2.5 2.0-2.5
– households 3.4 3.3-3.8 3.4-3.8 2.8-3.3 3.2-3.6 2.5-3.0 2.5-3.0
Gross formation 7.4 0.5-1.5 0.7-1.7 2.2-3.2 3.3-4.3 1.7-2.7 2.0-3.0
– gross fixed capital formation 4.3 2.7-3.2 2.7-3.2 2.2-2.7 2.8-3.3 2.2-2.7 2.2-2.6
Exports 5.1 3.3-3.7 3.3-3.7 1.7-2.2 1.7-2.2 1.7-2.2 1.7-2.2
Imports 17.4 7.4-7.9 7.5-8.0 4.7-5.2 6.4-6.9 5.3-5.8 5.7-6.2
Money supply in national definition 10.5 10-13 11-14 8-11 8-11 8-11 8-11
Lending to non-financial organisations and households in rubles and foreign currency 8.2 10-13 11-14 7-11 7-11 7-12 7-12
– lending to non-financial and financial organisations in rubles and foreign currency, growth as % over year
7.1 9-11 10-12 6-9 6-9 6-10 7-10
– lending to households in rubles and foreign currency, growth as % over year
12 13-18 15-19 10-13 11-14 10-13 9-12
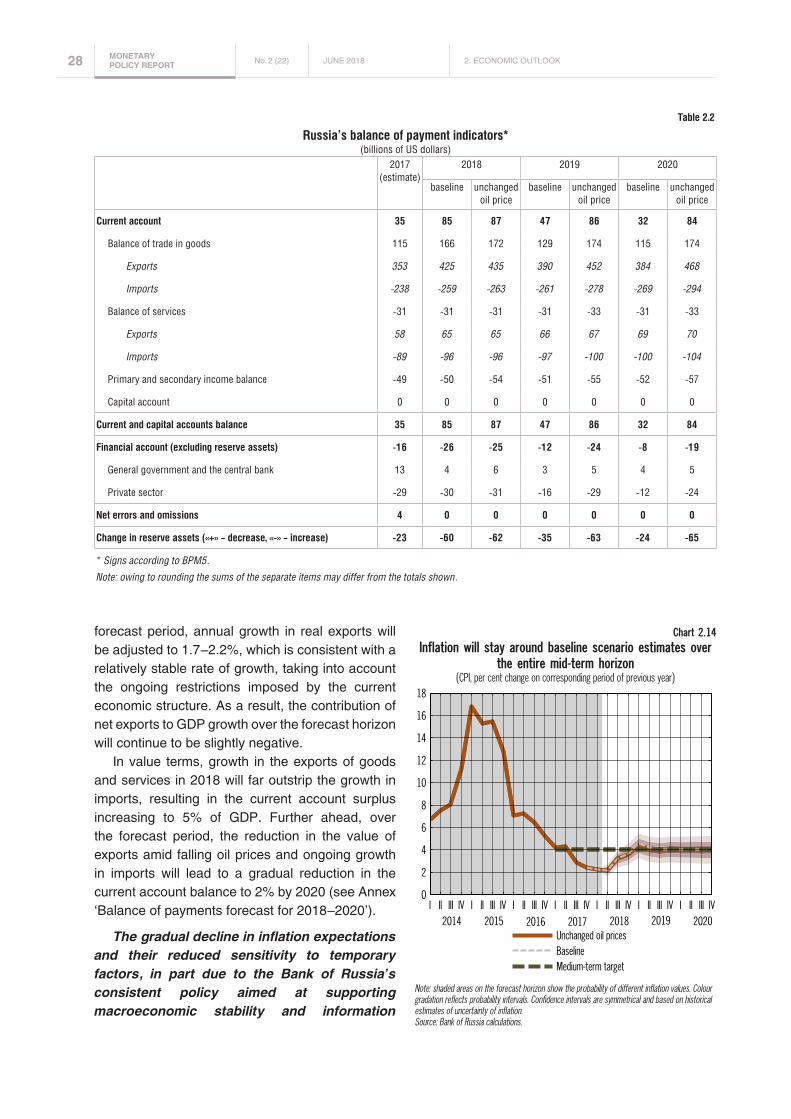
28 MONETARY POLICY REPORT No. 2 (22) JUNE 2018 2. ECoNoMIC oUTLook
forecast period, annual growth in real exports will be adjusted to 1.7 –2.2%, which is consistent with a relatively stable rate of growth, taking into account the ongoing restrictions imposed by the current economic structure. As a result, the contribution of net exports to GDP growth over the forecast horizon will continue to be slightly negative.
In value terms, growth in the exports of goods and services in 2018 will far outstrip the growth in imports, resulting in the current account surplus increasing to 5% of GDP. Further ahead, over the forecast period, the reduction in the value of exports amid falling oil prices and ongoing growth in imports will lead to a gradual reduction in the current account balance to 2% by 2020 (see Annex ‘Balance of payments forecast for 2018 –2020’).
The gradual decline in inflation expectations and their reduced sensitivity to temporary factors, in part due to the Bank of Russia’s consistent policy aimed at supporting macroeconomic stability and information
2014 2015 2016 2017 2018 2019 2020
(% of corresponding period of previous year)
I II III IV I II III IV I II III IV I II III IV I II III IV I II III IV I II III IV0
2
4
6
8
10
12
14
16
18
Unchanged oil pricesBaselineMedium-term target
Chart 2.14Inflation will stay around baseline scenario estimates over
the entire mid-term horizon(CPI, per cent change on corresponding period of previous year)
Note: shaded areas on the forecast horizon show the probability of different inflation values. Colour gradation reflects probability intervals. Confidence intervals are symmetrical and based on historical estimates of uncertainty of inflation.Source: Bank of Russia calculations.
Table 2.2
Russia’s balance of payment indicators* (billions of US dollars)
2017 (estimate)
2018 2019 2020
baseline unchanged oil price
baseline unchanged oil price
baseline unchanged oil price
Current account 35 85 87 47 86 32 84
Balance of trade in goods 115 166 172 129 174 115 174
Exports 353 425 435 390 452 384 468
Imports -238 -259 -263 -261 -278 -269 -294
Balance of services -31 -31 -31 -31 -33 -31 -33
Exports 58 65 65 66 67 69 70
Imports -89 -96 -96 -97 -100 -100 -104
Primary and secondary income balance -49 -50 -54 -51 -55 -52 -57
Capital account 0 0 0 0 0 0 0
Current and capital accounts balance 35 85 87 47 86 32 84
Financial account (excluding reserve assets) -16 -26 -25 -12 -24 -8 -19
General government and the central bank 13 4 6 3 5 4 5
Private sector -29 -30 -31 -16 -29 -12 -24
Net errors and omissions 4 0 0 0 0 0 0
Change in reserve assets («+» – decrease, «-» – increase) -23 -60 -62 -35 -63 -24 -65
* Signs according to BPM5.
Note: owing to rounding the sums of the separate items may differ from the totals shown.

2. ECoNoMIC oUTLook JUNE 2018 No. 2 (22) MONETARY POLICY REPORT 29
transparency, will help to keep inflation close to 4% over the forecast period.
To do so, the Bank of Russia uses, among other things, instruments such as materials and measures seeking to increase the financial literacy of households, on the one hand, and a set of information and analytical materials on monetary policy decision-making factors and medium-term forecast parameters, on the other hand (see the sections on the Bank of Russia website ‘Monetary Policy’, ‘Information and Analytical Materials’ and ‘Research’3).
2.2 Unchanged oil price scenarioThe revision of oil price assumptions, as in the
March MPR, has not exerted a significant impact on the trajectories of key macroeconomic indicators or the key rate, compared with the baseline scenario. As in the baseline forecast, this is a consequence of the Russian economy’s growing resilience to changes in external conditions, partly as a result of the effect of the budget rule.
Inflation will be close to baseline forecast estimates in the medium term (Chart 2.14), but the balance of factors shaping inflation dynamics will be slightly different.
In the absence of downward oil price dynamics in this scenario in 2018, the ruble will be stronger than in the baseline scenario, which will contribute to a slight easing in the inflation background.
The contribution of a change in business activity to inflation will be greater than in the baseline scenario. If oil prices remain relatively high, this will buoy commodity goods production and will exert an upward pressure on economic participants’ expectations and sentiment. In these settings, GDP growth over the forecast horizon will be close to the baseline scenario and will grow at a rate close to its potential, which the Bank of Russia estimates at 1.5 –2.0% (Charts 2.15 and 2.16), given the unchanged current economic structure. GDP growth rates may fluctuate within this range in the medium term. The achievement of higher rates is
3 ‘Monetary Policy’ section: http://www.cbr.ru / DKP / ; ‘Information and Analytical Materials’ section: http://www.cbr.ru / analytics / ; ‘Research’ section: http://www.cbr.ru / ec_research / .
conditioned on the successful implementation of structural and institutional changes in the Russian economy.
GDP growth will be buoyed over the 2018 –2019 period by accelerated growth in both consumer and investment expenditure compared with the baseline scenario (Charts 2.17 and 2.18).
The annual growth in household final consumption expenditure in 2018 will be close to the
1.0
1.3
1.5
1.8
2.0
2.3
2.5
1.0
1.3
1.5
1.8
2.0
2.3
2.5
2017 2018 2019 2020
Baseline Unchanged oil price
Chart 2.15Interval forecast for GDP growth is the same in the
baseline and alternative scenarios(GDP, per cent change on previous year)
Source: Bank of Russia calculations.
2014 2015 2016 2017 2018 2019 2020
(% of corresponding period of previous year)
I II III IV I II III IV I II III IV I II III IV I II III IV I II III IV I II III IV6
4
2
0
2
4
6
Unchanged oil prices Baseline
Chart 2.16GDP growth will slightly overshoot the baseline scenario,
with current oil prices remaining unchanged in 2018(GDP, per cent change on previous year)
Note: shaded areas on the forecast horizon show the probability of different GDP growth values. Colour gradation reflects probability intervals. Confidence intervals are symmetrical and based on historical estimates of uncertainty of GDP growth rate.Source: Bank of Russia calculations.

30 MONETARY POLICY REPORT No. 2 (22) JUNE 2018 2. ECoNoMIC oUTLook
according to Bank of Russia estimates, and will not exert any pro-inflationary pressure.
The rates of growth in gross fixed capital formation will persistently overshoot the estimates of the baseline scenario over the entire forecast period. This is predominantly linked to external conditions, which are more stable than in the baseline scenario. This is reflected in real sector sentiment and, correspondingly, in companies’ investment plans. The annual growth in gross fixed capital formation will be 2.7–3.3% in 2018 –2019, before shifting to 2.2–2.6% in the medium term. As in the baseline scenario, investment will expand on account of both own and borrowed funds. According to Bank of Russia estimates, the annual growth in
8.0
10.0
12.0
14.0
16.0
18.0
20.0
8.0
10.0
12.0
14.0
16.0
18.0
20.0
2017 2018 2019 2020
Baseline Unchanged oil price
Chart 2.19...amid a more active expansion in lending both
to households...(claims on households, per cent change on previous year)
Source: Bank of Russia calculations.
4.0
5.0
6.0
7.0
8.0
9.0
10.0
11.0
12.0
13.0
4.0
5.0
6.0
7.0
8.0
9.0
10.0
11.0
12.0
13.0
2017 2018 2019 2020
Baseline Unchanged oil price
Chart 2.20...and to companies
(claims on companies, per cent change on previous year)
Source: Bank of Russia calculations.
upper bound of the interval in the baseline scenario and, according to Bank of Russia estimates, will be 3.4 –3.8%. In future, during the forecast period, annual growth in consumption will gradually move closer to baseline scenario estimates. As in the baseline scenario, consumption will be supported primarily by growth in incomes (in particular, wages) in real terms and expanded lending activity, which will be more intensive than in the baseline scenario (Chart 2.19). The annual growth in lending to households in 2018 will be 15–19%, after which it will gradually slow in the medium term to 11–14% and 9– 12% in 2019 and 2020 respectively. The acceleration in wage growth and monetary aggregates growth will continue to be moderate,
1.0
1.5
2.0
2.5
3.0
3.5
4.0
4.5
5.0
1.0
1.5
2.0
2.5
3.0
3.5
4.0
4.5
5.0
2017 2018 2019 2020Baseline Unchanged oil price
Chart 2.17Growth in consumption will be slightly higher due to
income dynamics and sentiment...(final consumption of households, per cent change on previous year)
Source: Bank of Russia calculations.
1.0
1.5
2.0
2.5
3.0
3.5
4.0
4.5
5.0
1.0
1.5
2.0
2.5
3.0
3.5
4.0
4.5
5.0
2017 2018 2019 2020Baseline Unchanged oil price
Chart 2.18... the same is true for growth in investment...
(gross fixed capital formation, per cent change on previous year)
Source: Bank of Russia calculations.

2. ECoNoMIC oUTLook JUNE 2018 No. 2 (22) MONETARY POLICY REPORT 31
claims on the corporate sector overall will be close to baseline scenario estimates over the entire forecast period, at 10 –12% in 2018 and 6–10% in the medium term (Chart 2.20).
Taking into account the minor adjustments to the macroeconomic forecast parameters in this scenario compared with the baseline scenario, monetary policy stance under this forecast will be close to the estimates of the baseline forecast.
2.3. Medium-term forecast risksGiven the change in external and internal
conditions, the balance of risks shifted towards pro-inflationary risks slightly more than in March. With regard to the sources of risks threatening inflation and economy, factors linked to the effects of adopted fiscal decisions and the external climate for Russia prevail. As for the internal economic conditions, the main factor behind the increase in inflation risks is the possible change in fiscal policy parameters, concerning both expenditure and tax changes, including indirect consumption taxes that produce a material effect on price formation. The Bank of Russia will continue to closely monitor developments and, as more certainty takes root, will consider their changes when preparing a macroeconomic forecast.
Compared with March, uncertainty has increased slightly with regard to medium-term changes in the macroeconomic policy of some of the world’s largest economies. It intensified in April-May on the back of the existing and potential sanctions against Russia.
With regard to the largest economies, as previously, a faster normalisation of monetary policy, than assumed in the Bank of Russia’s forecast, cannot be ruled out. once materialised, this will exert an upward pressure on interest rates in global financial markets, which could make a negative impact on the appeal of EMEs’ assets, including Russian assets, to foreign investors. In addition, the enhanced risks of trade wars could cause slowing growth in the global economy, which could also feed through into the dynamics of the ruble exchange rate, inflation and inflation expectations in Russia.
As previously, the Bank of Russia will continue to monitor the situation in the global financial
markets and will take into account any changes in geopolitical conditions and the rhetoric of global central banks when drawing up its macroeconomic indicator forecasts and making monetary policy decisions.
As for the internal economic conditions, the main factor underpinning the increase in inflation risks is a possible change in fiscal policy parameters, concerning both expenditure and tax changes, including indirect consumption taxes that drag heavily on price formation. The Bank of Russia will continue to closely monitor developments and, as more certainty takes root, will consider their changes when preparing a macroeconomic forecast.
overall, the remaining risks have not undergone any significant changes compared with the March MPR and remain moderate.
First, amid the economic growth and enhanced optimism among market participants regarding the continuation of economic growth in the medium term, wages could grow more intensively than implied in the Bank of Russia’s forecasts over the forecast horizon, exceeding the growth of labour productivity. The ongoing imbalance between supply and demand in certain labour market segments (for example, in certain regions or activity types), limited labour resources mobility and insufficient skilled labour supply, among other things, all create conditions for growth to accelerate. This may potentially lead to inflation deviating upwards from the 4% target. In March-April, the situation in the labour market was in line with the Bank of Russia’s expectations (see Section 1). In future, the Bank of Russia will continue to regularly monitor wage and labour productivity dynamics in the economy.
Second, as economic participants’ optimism increases with regard to growth outlook, the faster growth not only in wages, but also in household consumer spending may be stronger than forecast, which, in turn, may be accompanied by more active growth in unsecured consumer lending. The faster (compared with the forecast parameters) and sustainable increase in consumer demand may lead to additional pro-inflationary pressure in the medium term. In addition, if the renewed demand for loans exceeds the growth in household and corporate incomes, the accumulation of excessive debt burden cannot be ruled out, which may also pose a risk to financial stability over the forecast period.
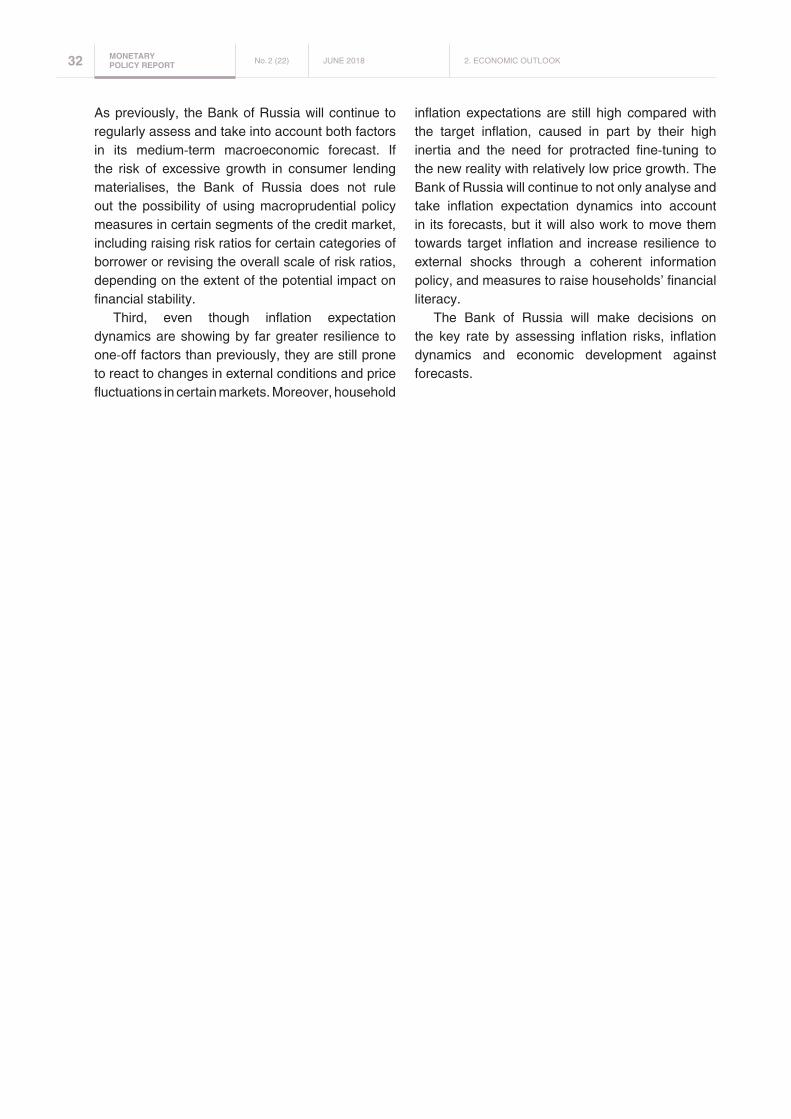
32 MONETARY POLICY REPORT No. 2 (22) JUNE 2018 2. ECoNoMIC oUTLook
As previously, the Bank of Russia will continue to regularly assess and take into account both factors in its medium-term macroeconomic forecast. If the risk of excessive growth in consumer lending materialises, the Bank of Russia does not rule out the possibility of using macroprudential policy measures in certain segments of the credit market, including raising risk ratios for certain categories of borrower or revising the overall scale of risk ratios, depending on the extent of the potential impact on financial stability.
Third, even though inflation expectation dynamics are showing by far greater resilience to one-off factors than previously, they are still prone to react to changes in external conditions and price fluctuations in certain markets. Moreover, household
inflation expectations are still high compared with the target inflation, caused in part by their high inertia and the need for protracted fine-tuning to the new reality with relatively low price growth. The Bank of Russia will continue to not only analyse and take inflation expectation dynamics into account in its forecasts, but it will also work to move them towards target inflation and increase resilience to external shocks through a coherent information policy, and measures to raise households’ financial literacy.
The Bank of Russia will make decisions on the key rate by assessing inflation risks, inflation dynamics and economic development against forecasts.

JUNE 2018 No. 2 (22) MONETARY POLICY REPORT 33
ANNEXES
dynamics of major items in the Russian balance of payments in 2018 Q1
In 2018 Q1, the current account surplus increased by roughly one third1 due to improved external trading conditions: export prices grew more than import prices on average.
The exports volume rose more than forecast, due to high oil prices. In addition to growth in global prices for many commodities, intensifying external demand helped to maintain the high rates of export growth, with physical supplies of natural gas, aluminium and ferrous metals abroad expanding. Exports were also buoyed by the bumper harvest and grain stocks from the previous year.
However, exports were constrained by the reduction in oil production in Russia in connection with oPEC and non-oPEC agreements. According to FCS data, oil and oil products export quantities
1 Here and below, changes are relative to the corresponding period of the previous year, unless otherwise indicated.
reduced by roughly 2%, largely due to supplies to EU countries. At the same time, Russia increased its supply to China by 23% in connection with an intergovernmental agreement. According to the agreement, Russia’s supply of ESPo Blend oil2 to China should increase in 2018 by 50%, to 30 million tonnes, after raising the transmission capacity of the branch of the ‘Eastern Siberia – Pacific ocean’ (ESPo) pipeline in 20173.
Additional US duties on steel and aluminium introduced at the end of March had not yet had an impact on exports in 2018 Q1. In 2017, the proportion of products affected by these duties was less than 1% of Russia’s exports of goods and services, which limits the potential impact of this measure on external trade dynamics overall.
In 2018 Q1, the imports of goods and services continued to exhibit a solid growth, surpassing expectations, amid the revival of business and consumer activity in Russia. However, import growth rates decreased on the back of the ruble
2 A blend of oil produced in Eastern Siberia and transported along the ESPO pipeline.
3 According to FCS data, aggregate exports of oil and oil products from Russia to China totalled 59 million tonnes in 2017.
Chart 1Major balance of payments components*
(billions of US dollars)
* Signs according to BPM5.** Estimate.Source: Bank of Russia.

34 MONETARY POLICY REPORT No. 2 (22) JUNE 2018 ANNEXES
depreciation. The ruble real effective exchange rate against foreign currencies decreased by 6% compared with 2017 Q1. The increase in imports was still more due to investment goods than consumer goods. Growth was registered in the import quantities of capital goods such as bulldozers, computers and telephones for cellular networks or other wireless networks. The number of imported tractors increased by almost twofold. In terms of the imports of consumer goods, Russian demand for fruits, tomatoes and other goods demonstrated a robust growth.
The contribution of price changes to the increasing imports volume grew. In dollar terms, imported goods such as telephones, computers and medicines posted considerable price increases.
At the same time, the volume of exported goods and services rose by far more compared with the imports, which was reflected in the higher foreign trade surplus. The balance of non-tradable current account components remained virtually unchanged in 2018 Q1 (Chart 1).
Higher oil prices caused an increase in reserves in 2018 Q1 due to more intensive purchases of foreign currency by the Russian Ministry of Finance under the budget rule. The repayment of foreign currency funds to the Bank of Russia as part of FX swap operations also made a significant contribution to the growth in reserves in 2018 Q1.
In 2018 Q1, Russian private sector’s net lending to the rest of the world was largely shaped by other sectors building up their foreign asset portfolios. Higher export revenues increased foreign investment opportunities for Russian companies. Additionally, compared with 2017 Q1, private sector’s net lending4 contracted, in part due to less significant reduction in banks’ foreign liabilities.
The economic situation in Russian regions
In April 2018, annual inflation remained low in all regions, but the distribution of regions by contribution to inflation was less uniform (Chart 1):
4 Adjusted by the volume of foreign currency liquidity provided by the Bank of Russia to credit organisations on a reverse basis, by the amount of operations across resident banks’ correspondent accounts at the Bank of Russia, and also by the amount of funds in foreign currency received by the Bank of Russia as part of FX swaps.
the ‘tails’, representing regions with more marked slowdowns (left tail) and accelerations (right tail) in inflation, became more pronounced. Small regions with lower income levels reported a slowdown in price growth. Due to differences in the consumption structure, the effect of the increased supply of agricultural products (given the good harvest of the previous year and the effect of expanding greenhouse production) is most pronounced in these regions characterised by a higher proportion of rural households.
The maximum slowdown in annual inflation was recorded in the Republic of Daghestan, Republic of kalmykia, the karachai-Cherkess Republic and the Chechen Republic, where more modest consumption dynamics were also observed amid
Chart 1Distribution of regions by contribution to inflation
Source: Bank of Russia.
Chart 2Price expectations of trade companies
Source: Bank of Russia.

ANNEXES JUNE 2018 No. 2 (22) MONETARY POLICY REPORT 35
the ongoing reduction in money income growth in real terms.
Inflation accelerated in regions with high income levels (Moscow, the Moscow Region and the Nizhny Novgorod Region). This was due in part to the reduction in the ruble’s exchange rate, accompanied by higher prices for imported products – the share of such products in the consumption structure of developed regions is traditionally higher than the Russian average. The mechanism of the exchange rate’s pass-through on inflation in the regions is changing: on the one hand, the process of import substitution is continuing for food goods, which makes developing regions less sensitive to exchange rate fluctuations; and on the other hand, the volume of online trade with major foreign trading platforms is growing, which is increasing high-income regions’ sensitivity to exchange rate fluctuations. overall, according to data from the Bank of Russia’s Monitoring, retail traders’ price expectations essentially have not
risen in 2018 under the influence of exchange rate movements (Chart 2).
Regional statistics confirm that the drag from short-term factors on inflation remains high (Table 1). Further on, the impact of factors constraining prices is dominant: if the regions where consumer prices are most susceptible to temporary factors (i.e. they are most volatile) are excluded from the inflation calculation, the level of inflation will be higher in the overwhelming majority of federal districts.
In the medium term, the ongoing modest inflationary pressure in the regions will be conditioned on the relationship between supply and demand dynamics. As of 2018 Q1, the consumer confidence index5 reached its pre-crisis levels (Chart 3). This points to the fact that consumers perceive the current situation as normal and do not expect any sudden improvement. At the same time, according to Monitoring data, businesses are still experiencing a slump in demand (Chart 4),
5 Based on Rosstat data.
Table 1
Inflation in April 2018, w/o volatile regions
Trimmed inflation indicators
Central Federal District
(FD)
North-Western
FD
Southern FD
North Caucasus
FD
Volga FD
Urals FD
Siberian FD
Far Eastern
FD
Inflation, YoY (April 2018) 3.1 2.5 2 1.7 2 2.3 2 2.1
Less 10% volatile regions 3.1 2.6 2 1.6 2.3 1.9 2.7 2.4
Less 20% volatile regions 3.2 2.6 2 2.1 2.3 1.9 2.4 2.4
Sources: Rosstat, Bank of Russia calculations.
Chart 3Index of consumer sentiment
Source: Bank of Russia.
Chart 4Orders in the domestic market and demand for products
Source: Bank of Russia.

36 MONETARY POLICY REPORT No. 2 (22) JUNE 2018 ANNEXES
which creates conditions for a more intensive competition for consumers, which in turn supports the constraining influence on prices.
According to current data, consumer demand is gradually recovering: in most regions, growth in retail trade turnover remains positive, but low. Broken down by district, the Central Federal District dominates, with the growth of 3.6% year-on-year in April. The moderate growth in trade is due to wage and consumer lending dynamics.
With the gradual easing of monetary conditions, nominal growth in lending at the start of 2018 was significantly higher than the previous year. However, roughly half of this growth comes from the refinancing of previously issued loans. In addition, growth in lending has been mostly observed in regions where this segment of the lending market is developed poorly and the proportion of loans in retailers’ turnover is low, pointing to the absence of any significant risks to inflation from consumer lending.
Wage growth in regions has predominantly slowed after accelerating at the beginning of the year. According to Monitoring data, compared with the previous year, the proportion of businesses planning to index their wages this year has reduced. The moderate growth in labour productivity, which will constrain wage growth in the medium term, also needs to be taken into account.
overall, economic activity in Russian regions has exhibited stable dynamics in March-April. Industry and the services sector made a significant
contribution to growth in economic activity in most districts (Chart 5). The most perceptible growth in production was recorded in the Urals region, where government orders and contracts with major federal consumers (Russian Fuel and Energy Complex, Russian Railways, Russian Ministry of Defence) make a significant contribution. According to Monitoring data, businesses have a positive view on the business climate, which, amid the growing number of positive investment signals, means that we can expect the stable growth in economic activity to continue.
However, the lack of uniformity in dynamics in the construction industry remains, with output having fallen during several of years and still having not reverted to stable growth. High growth in construction in the North Caucasus and Southern Federal Districts was due to progress in major construction projects (Chart 5): roads in the Republics of Daghestan and Adygea, in Sevastopol, residential complexes in the Republic of Adygeya, the Chechen Republic and the Republic of Crimea, and large industrial complexes in the Republics of Ingushetia and kalmykia. However, the largest economies of the Volga and Central Federal Districts are witnessing persistent negative annual growth in construction.
In addition to construction companies’ pressing problem of low demand, the weak dynamics in the industry reflected in the year-on-year data are linked to the high base effect of the previous year: the largest slump in the regions in the Volga Federal
Chart 6Number of investment signals at the main funding source
Source: Bank of Russia calculations.
Chart 5Economic activity indicator in April
Sources: Rosstat, Bank of Russia calculations.

ANNEXES JUNE 2018 No. 2 (22) MONETARY POLICY REPORT 37
District is related to the completion of stadiums for the FIFA World Cup and major projects including the bridge across the Volga river in the Nizhny Novgorod Region and the reconstruction of a major highway in the Samara Region. Nonetheless, the number of negative investment signals in the industry is gradually reducing, and in February-March, their number among private projects (by
main funding source) was comparable to the number of positive investment signals, pointing to the likelihood of trends reversal in the industry. In addition to the reduction in negative investment signals, the number of positive signals is growing, but they are still coming mostly from projects funded by the government (Chart 6).

38 MONETARY POLICY REPORT No. 2 (22) JUNE 2018 ANNEXES
Balance of payments forecast for 2018–2020
Compared with the March MPR, oil price assumptions have been revised slightly upwards and the forecast parameters of a number of macroeconomic indicators6 have been adjusted a little. These changes, as well as updates to estimates after the release of actual balance of payments data for 2018 Q1, influenced the forecast dynamics of balance of payments items.
In the baseline scenario, in 2018, oil prices are now expected to be higher ($67 per barrel on average) than in the previous MPR ($61 per barrel), due to the balance in the market, which is more favourable than previously assumed. oil reserves have shrunk significantly amid oPEC’s overfulfilment of agreements to reduce oil production and a robust growth in global demand. In addition, higher oil prices were driven by geopolitical tension in the Middle East and the return of US sanctions against Iran. At the same time, average oil prices for the year are still expected to fall to $50 per barrel in 2020 with the relaxation of restrictions under the agreement between oPEC and non-oPEC countries.
Compared with the baseline scenario of the March MPR, the current account surplus forecast has been upgraded over the entire forecast horizon due to exports. The upward revision of the forecast exports volumes is linked in part to higher oil prices in 2018, the slight increase in external demand estimates and the rapid expansion of non-oil and gas exports in 2018 Q1.
In 2018, the exports of goods and services are expected to continue to show an impressive growth overall – roughly 20%. The increase in global commodity prices, higher external demand and the FIFA World Cup in Russia will help to buoy exports. At the same time, the inflow of foreign currency in connection with the World Cup this year will be moderate. To a certain degree, the effect of this event has already manifested itself. In 2019 –2020, export volumes are expected to shrink: the increase in the quantities of supplied oil will only be partially offset by falling prices amid the easing of production restrictions under the agreement.
6 See Section 2 ‘Economic outlook’.
According to the forecast in the baseline scenario, the imports of goods and services will grow by roughly 10% in 2018 and will continue to increase over the entire forecast period amid strengthening internal demand due to growth in the Russian economy. Moreover, in 2019 –2020, the growth in imports is expected to slow on the back of the ruble depreciation, due to falling oil prices.
In 2018 –2020, the deficit of non-tradable current account components is expected to expand slightly due to payments associated with incoming foreign investment. However, it is expected to remain low as a result of the significant reduction in external debt and in expenditure on servicing this debt.
As a result, with the rapid growth in exports compared with imports in 2018, the current account surplus will increase to 5% of GDP, before falling to 2% of GDP in 2020, due to shrinking exports and continued growth in imports (Chart 1).
The private sector financial account balance in the baseline scenario will also fall from 2% of GDP (2018) to 1% of GDP (2019 –2020) due to a smaller reduction in banks’ foreign liabilities. The payment schedule assumes a reduction in Russian private sector’s external debt repayments. Unlike banks, companies will continue to build up their foreign liabilities. However, amid the expansion of sanctions, companies are expected to attract less foreign investment than assumed in the baseline scenario in the March MPR and, accordingly, there is expected to be more Russian private sector’s net lending to the rest of the world (Chart 2).
The main contribution to net lending will come from the expanded foreign assets in the private sector amid increases in companies’ incomes supported by growth in the Russian economy. Meanwhile, in 2019, demand for foreign assets is expected to wane and remain low in 2020: the reduction in oil prices will limit foreign investment opportunities for Russian companies.
The government sector, unlike the private sector, expects a net inflow of capital over the entire forecast horizon amid continued government borrowing. However, the risks of sanctions being imposed on Russian government bonds have produced a negative impact on investor sentiment. Given the drop in non-resident purchases of Russian government bonds in the secondary market in 2018 Q1, there is now expected to be a weaker inflow of capital into the government sector in 2018 –2020.

ANNEXES JUNE 2018 No. 2 (22) MONETARY POLICY REPORT 39
At the same time, the forecast growth in reserves has been raised, with the biggest increase planned for 2018. This revision is related to greater purchases of foreign currency by the Russian Ministry of Finance amid the higher oil prices. In 2018, unlike in subsequent years, the increase in reserves also takes into account the repayment of foreign currency liquidity provided by the Bank of Russia through FX swaps at the end of 2017.
In the unchanged oil price scenario, the average annual oil price is assumed to be roughly $70 per barrel over the entire forecast period. Amid the
higher energy prices and stronger external demand, the exports volume is expected to be higher than in the baseline scenario. Besides, the faster growth in the Russian economy and stronger ruble will result in higher growth in imports. overall, due to the rapid growth in exports (compared with imports) the trade surplus and current account surplus will increase noticeably in 2018 before stabilising at a higher level than in the baseline scenario.
At the same time, Russian private sector’s net lending to the rest of the world will also be higher than in the baseline scenario. Amid higher oil
Chart 1Major current account components*
(billions of US dollars)
* Baseline scenario forecast.Source: Bank of Russia.
Chart 2Major private sector* financial account components
(billions of US dollars)
* Baseline scenario forecast. Signs according to BPM5.** Excluding debt on deliveries under intergovernmental agreements.Source: Bank of Russia.

40 MONETARY POLICY REPORT No. 2 (22) JUNE 2018 ANNEXES
prices, the private sector may invest more funds to expand its foreign assets. Meanwhile, a more favourable outlook for oil prices will help to improve Russia’s investment appeal, which will create the necessary conditions for increased external borrowing by companies. As a result, with the faster growth in foreign liabilities compared with foreign
assets, private sector financial account balance will decrease in this scenario.
Reserve assets are expected to grow far more than in the baseline scenario due to the higher volume of foreign currency purchases for the Russian Ministry of Finance under the budget rule amid higher oil prices.

ANNEXES JUNE 2018 No. 2 (22) MONETARY POLICY REPORT 41
Changes in the system of monetary policy instruments and other Bank of Russia measures
Table 1
Changes in the system of monetary policy instruments and other Bank of Russia measures
The Bank of Russia changed the procedure for its deposit operations with credit institutions
On 17 May 2018, the Bank of Russia updated the procedure for its deposit operations with credit institutions, seeking to streamline their technological aspects and enhance their convenience for credit institutions. The deposit product line will only include deposit auctions and standing overnight deposit facilities. The exchange of orders is no longer required for overnight deposit facilities and the timeframe of these operations is extended. Changes have also been made to the regulatory framework governing Bank of Russia deposit operations. The new procedure is set forth in the Conditions of Bank of Russia Deposit Operations. The procedure for making contracts with credit institutions on general conditions of deposit operations has also been simplified. Starting 17 May 2018, the exchange of documents on deposit auctions between credit institutions and the Bank of Russia will be solely in electronic form
The Bank of Russia changed its approach to setting minimum price for Bank of Russia coupon bonds (coupon OBRs) placements (additional placements)
The minimum price of coupon OBRs is set individually for each placement (additional placement) auction below 100% of the nominal price, which implies the term premium to the Bank of Russia key rate. Information on the minimum price of coupon OBRs will be communicated to the market along with other parameters of placement (additional placement) auctions
The Bank of Russia decided to set interest rates on Bank of Russia operations with credit institutions as key rate spreads
This decision defines a general approach to rate-setting on Bank of Russia operations depending on the level of the key rate as the main monetary policy instrument of the Bank of Russia
The Bank of Russia changed approaches to setting interest rates on several specialised refinancing instruments
This decision was made as a part of the strategy for a phased withdrawal of special-purpose refinancing instruments. It ensures compliance with previous obligations of the Bank of Russia and takes into account the key rate’s coming to the neutral range. Starting 26 March 2018, interest rates on specialised refinancing instruments, aimed to back up SMEs, leasing and non-commodity exports, shall equal the lower of the two values: 6.50% p.a. or the Bank of Russia key rate; the interest rate on the specialised refinancing instrument aimed to back up military mortgage shall equal the key rate; the interest rate on specialised refinancing instruments aimed to back up major investment projects shall equal the lower of the two values: 9.00% p.a. or the key rate less 1.00 pp
The Bank of Russia expanded the Lombard List
In accordance with the Bank of Russia Board of Directors’ decisions, the Lombard List was supplemented with 25 bond issues on 30 March and 7 May 2018

42 MONETARY POLICY REPORT No. 2 (22) JUNE 2018 ANNEXES
Tabl
e 2
Inte
rest
rate
s on
Ban
k of R
ussia
ope
ratio
ns to
pro
vide
and
abso
rb ru
ble
liqui
dity
(%
p.a
.)
Purp
ose
Type
of i
nstru
men
tIn
stru
men
tTe
rmFr
eque
ncy
As o
f 1.0
1.18
From
12.
02.1
8Fr
om 2
6.03
.18
From
4.0
6.18
1
Liqu
idity
pro
visi
on
Stan
ding
faci
litie
s Ov
erni
ght l
oans
; lom
bard
loan
s; lo
ans
secu
red
by n
on-
mar
keta
ble
asse
ts; F
X sw
aps
(rub
le le
g)2 ;
repo
s 1
day
Daily
8.75
8.50
8.25
key
rate
+ 1
.00
Loan
s se
cure
d by
non
-mar
keta
ble
asse
ts3
From
2 to
549
day
s9.
509.
259.
00ke
y ra
te +
1.7
5
Open
mar
ket o
pera
tions
(m
inim
um in
tere
st ra
tes)
Auct
ions
to p
rovi
de lo
ans
secu
red
by n
on-m
arke
tabl
e as
sets
3 3
mon
ths
Mon
thly
48.
007.
757.
50ke
y ra
te +
0.2
5
Repo
auc
tions
1 w
eek
Wee
kly5
7.75
(k
ey ra
te)
7.50
(k
ey ra
te)
7.25
(k
ey ra
te)
7.25
(k
ey ra
te)
From
1 to
6 d
ays
Occa
sion
ally
6FX
sw
ap a
uctio
ns (r
uble
leg)
2Fr
om 1
to 2
day
s
Liqu
idity
abs
orpt
ion
Open
mar
ket o
pera
tions
(m
axim
um in
tere
st ra
tes)
Depo
sit a
uctio
nsFr
om 1
to 6
day
s
1 w
eek
Wee
kly5
OBR
auct
ions
33
mon
ths
Occa
sion
ally
Stan
ding
faci
litie
s De
posi
t ope
ratio
ns1
day,
cal
lDa
ily6.
756.
506.
25ke
y ra
te –
1.0
01 F
rom
4 J
une
2018
, int
eres
t rat
es o
n Ba
nk o
f Rus
sia
oper
atio
ns w
ith c
redi
t ins
titut
ions
are
set
as
key
rate
spr
eads
.2 F
rom
23
Dece
mbe
r 201
6, in
tere
st ra
tes
on th
e fo
reig
n cu
rren
cy le
g eq
ual L
IBO
R on
ove
rnig
ht lo
ans
in U
S do
llars
or e
uros
(dep
endi
ng o
n th
e cu
rren
cy o
f the
tran
sact
ion)
.3 O
pera
tions
con
duct
ed a
t a fl
oatin
g in
tere
st ra
te a
re li
nked
to th
e Ba
nk o
f Rus
sia
key
rate
.4 O
pera
tions
hav
e be
en d
isco
ntin
ued
sinc
e Ap
ril 2
016.
5 Eith
er a
repo
or a
dep
osit
auct
ion
is h
eld
depe
ndin
g on
the
situ
atio
n w
ith li
quid
ity. S
ee p
ress
-rel
ease
http
://w
ww
.cbr
.ru/p
ress
/PR.
aspx
?file
=190
1201
5_15
4523
if201
5-01
-19T
15_4
1_11
.htm
.6 F
ine-
tuni
ng o
pera
tions
.
Mem
o ite
m: f
rom
1 J
anua
ry 2
016,
the
valu
e of
the
Bank
of R
ussi
a re
finan
cing
rate
equ
als
its k
ey ra
te a
s of
the
resp
ectiv
e da
te.
Sour
ce: B
ank
of R
ussi
a.

ANNEXES JUNE 2018 No. 2 (22) MONETARY POLICY REPORT 43
Tabl
e 3
Inte
rest
rate
s on
spe
cialis
ed re
finan
cing
facil
ities
1 (%
p.a
.)
Purp
ose
of in
dire
ct b
ank
lend
ing
Mat
urity
Colla
tera
lAs
of
1.0
1.18
From
12
.02.
18Fr
om
26.0
3.18
From
4.
06.1
82
Larg
e-sc
ale
inve
stm
ent
proj
ects
3Up
to 3
yea
rs
Clai
ms
unde
r ban
k lo
ans
for i
nves
tmen
t pro
ject
s, w
hose
per
form
ance
is s
ecur
ed b
y th
e go
vern
men
t gu
aran
tees
of t
he R
ussi
an F
eder
atio
n6.
756.
506.
25th
e lo
wer
of t
he tw
o va
lues
: 9.
00%
p.a
. or t
he B
ank
of
Russ
ia k
ey ra
te le
ss 1
.00
pp.
Bond
s pl
aced
to fu
nd in
vest
men
t pro
ject
s an
d in
clud
ed in
the
Bank
of R
ussi
a Lo
mba
rd L
ist
Leas
ing
Up to
3 y
ears
Clai
ms
on lo
ans
to le
asin
g co
mpa
nies
6.75
6.50
6.50
the
low
er o
f the
two
valu
es:
6.50
% p
.a. o
r the
Ban
k of
Ru
ssia
key
rate
Non-
com
mod
ity e
xpor
tsUp
to 3
yea
rsCl
aim
s un
der l
oan
agre
emen
ts s
ecur
ed b
y th
e in
sura
nce
cont
ract
s of
JSC
EXI
AR6.
506.
506.
50
Smal
l and
med
ium
-size
d en
terp
rises
Up to
3 y
ears
Clai
ms
unde
r loa
n ag
reem
ents
of J
SC S
ME
Bank
4
6.50
6.50
6.50
Guar
ante
es o
f JSC
Rus
sian
Sm
all a
nd M
ediu
m B
usin
ess
Corp
orat
ion
issu
ed u
nder
the
Prog
ram
me
for E
ncou
ragi
ng L
endi
ng to
Sm
all a
nd M
ediu
m-s
ized
Ente
rpris
es
Mili
tary
mor
tgag
eUp
to 3
yea
rsM
ortg
ages
issu
ed u
nder
the
Mili
tary
Mor
tgag
e pr
ogra
mm
e7.
757.
507.
25Ba
nk o
f Rus
sia
key
rate
1 Spe
cial
ised
refin
anci
ng fa
cilit
ies
are
Bank
of R
ussi
a in
stru
men
ts a
imed
at e
ncou
ragi
ng b
ank
lend
ing
to c
erta
in s
egm
ents
of t
he e
cono
my
who
se d
evel
opm
ent i
s ha
mpe
red
by s
truct
ural
fact
ors.
Und
er th
ese
faci
litie
s, th
e Ba
nk o
f Ru
ssia
pro
vide
s fu
nds
to c
redi
t ins
titut
ions
at l
ower
rate
s an
d fo
r lon
ger m
atur
ities
com
pare
d w
ith s
tand
ard
Bank
of R
ussi
a op
erat
ions
. Spe
cial
ised
refin
anci
ng fa
cilit
ies
are
tem
pora
ry B
ank
of R
ussi
a in
stru
men
ts, w
hich
will
be
valid
unt
il co
nditi
ons
for t
heir
repl
acem
ent w
ith m
arke
t ins
trum
ents
are
cre
ated
in th
e fin
anci
al m
arke
t. Th
e pr
ovis
ion
of fu
nds
unde
r the
spe
cial
ised
faci
litie
s is
rest
ricte
d, b
ecau
se th
eir a
pplic
atio
n sh
ould
not
dis
tort
the
stan
ce o
f th
e m
onet
ary
polic
y an
d pr
even
t the
ach
ieve
men
t of i
ts k
ey o
bjec
tive
of e
nsur
ing
pric
e st
abili
ty.
2 Fro
m 4
Jun
e 20
18, i
nter
est r
ates
on
Bank
of R
ussi
a op
erat
ions
with
cre
dit i
nstit
utio
ns a
re s
et a
s ke
y ra
te s
prea
ds.
3 Pro
ject
s ar
e se
lect
ed in
com
plia
nce
with
the
rule
s es
tabl
ishe
d by
Reg
ulat
ion
of th
e Go
vern
men
t of t
he R
ussi
an F
eder
atio
n N
o. 1
016,
dat
ed 1
4 De
cem
ber 2
010,
‘On
Appr
ovin
g th
e Ru
les
to S
elec
t Inv
estm
ent P
roje
cts
and
Prin
cipa
ls fo
r the
Pro
visi
on o
f the
Rus
sian
Fed
erat
ion
Stat
e Gu
aran
tees
on
Loan
s or
Bon
ded
Loan
s At
tract
ed to
Car
ry o
ut In
vest
men
t Pro
ject
s’ o
r Reg
ulat
ion
of th
e Go
vern
men
t of t
he R
ussi
an F
eder
atio
n N
o. 1
044,
dat
ed 1
1 O
ctob
er 2
014,
‘On
Appr
ovin
g th
e Pr
ogra
mm
e to
Sup
port
Inve
stm
ent P
roje
cts
Impl
emen
ted
in th
e Ru
ssia
n Fe
dera
tion
Base
d on
Pro
ject
Fin
anci
ng’.
4 Cla
ims
unde
r loa
ns is
sued
to b
anks
and
mic
rofin
ance
org
anis
atio
ns p
artn
erin
g w
ith J
SC S
ME
Bank
und
er th
e Pr
ogra
mm
e fo
r Fin
anci
al S
uppo
rt o
f Sm
all a
nd M
ediu
m-s
ized
Ent
erpr
ises
Dev
elop
men
t for
lend
ing
to S
MEs
and
cl
aim
s un
der l
oans
issu
ed to
leas
ing
com
pani
es p
artn
erin
g w
ith J
SC S
ME
Bank
for l
easi
ng p
rope
rty
to S
MEs
.
Sour
ce: B
ank
of R
ussi
a.

44 MONETARY POLICY REPORT No. 2 (22) JUNE 2018 ANNEXES
Statistical tables
Table 1
Bank of Russia operations to provide and absorb ruble liquidity
Purpose Type of instrument Instrument Term Frequency
Bank of Russia claims on liquidity provision instruments and obligations on liquidity absorption
instruments, billions of rublesAs of
1.01.17As of
1.10.17As of
1.01.18As of
1.04.18As of
1.05.18As of
1.06.18
Liquidity provision
Standing facilities
Overnight loans
1 daydaily
0.0 0.0 0.0 0.8 0.0 2.6
Lombard loans 0.6 0.0 0.0 0.0 0.0 0.0
FX swaps 37.8 0.0 0.0 0.0 0.0 0.0
Repos 593.9 43.9 3.6 6.5 8.4 5.1Loans secured by non-marketable assets from 1 to 549 days 410.7 57.8 5.5 30.1 7.7 5.4
Open market operations
Auctions to provide loans secured by non-marketable assets
3 months monthly1
215.6 0.0 0.0 0.0 0.0 0.018 months occasionally2
Repo auctions1 week weekly3
0.0 0.0 0.0 0.0 0.0 0.0from 1 to 6 days
occasionally4FX swap auctions from 1 to 2 days 0.0 0.0 0.0 0.0 0.0 0.0
Liquidity absorption
Open market operations
Deposit auctionsfrom 1 to 6 days
396.9 886.1 2 124.9 2 520.6 2 499.8 2 608.21 week weekly3
OBR auctions 3 months occasionally - 151.3 357.4 1 139.1 1 053.8 1 216.8
Standing facilities Deposit operations 1 day, call daily 388.3 223.1 246.8 264.6 258.1 144.8
1 Operations have been discontinued since April 2016.2 Operations have been suspended since 1 July 2016.3 Either a repo or a deposit auction is held depending on the situation with liquidity.4 Fine-tuning operations.
Source: Bank of Russia.

ANNEXES JUNE 2018 No. 2 (22) MONETARY POLICY REPORT 45
Table 2
Required reserve ratios (%)
Liability typeReporting periods
From 1.01.16
From 1.04.16
From 1.07.16
From 1.08.16
From 1.12.17
Banks with a universal licence and non-bank credit institutionsTo households in rubles
4.25
4.254.25 5.00 5.00Other liabilities in rubles
To non-resident legal entities in rubles
To households in foreign currency 5.25 6.00 6.00
To non-resident legal entities in foreign currency5.25 6.25 7.00 7.00
Other liabilities in foreign currency
Banks with a basic licenceTo households in rubles
4.25
4.254.25 5.00
1.00Other liabilities in rubles
To non-resident legal entities in rubles 5.00
To households in foreign currency 5.25 6.00 6.00
To non-resident legal entities in foreign currency5.25 6.25 7.00 7.00
Other liabilities in foreign currency
Source: Bank of Russia.
Table 3
Required reserve averaging ratio
Types of credit institutions From 1.01.2016
Banks 0,8
Non-bank credit institutions 1,0
Source: Bank of Russia.
Table 4
Bank of Russia operations to provide foreign currency
Instrument Term Frequency1
Minimum auction rate and interest rate for dollar leg of FX swaps2 (as spread
to LIBOR3, pp)
Bank of Russia claims, millions of US dollars4
From 23.12.16
As of 1.01.17
As of 1.01.18
As of 1.04.18
As of 1.05.18
As of 1.06.18
Repo auctions1 week
Weekly2.00
2 635.2 0.0 0.0 0.0 0.028 days 8 719.9 0.0 0.0 0.0 0.012 months 3.00 26.2 0.0 0.0 0.0 0.0
Loan auctions28 days
Monthly2.25 0.0 0.0 0.0 0.0 0.0
365 days 3.25 0.0 0.0 0.0 0.0 0.0USD/RUB sell/buy FX swaps 1 day Daily 1.50 1 000.0 2 490.7 0.0 0.0 0.0
1 No loan auctions for any terms or 12-month repo auctions were held in 2017 and January-May 2018; regular one-week and 28-day repo auctions have been discontinued since 11 September 2017.
2 The rate for the ruble leg is equal to the Bank of Russia key rate less 1 pp.3 In respective currencies and for respective terms.4 For repos – claims on credit institutions under the second leg of repos.
Source: Bank of Russia.

46 MONETARY POLICY REPORT No. 2 (22) JUNE 2018 ANNEXES
Table 5
Bank of Russia specialised refinancing facilities1
Purpose of indirect bank
lendingMaturity Collateral
Bank of Russia claims on credit institutions, billions of rubles
Limit as of 1.03.18,
billions of rublesAs of
1.01.17As of
1.01.18As of
1.04.18As of
1.05.18As of
1.06.18Non-commodity exports
Up to 3 years
Claims under loan agreements secured by the insurance contracts of JSC EXIAR 43.4 47.4 46.4 48.7 49.0 75.00
Large-scale investment projects2
Up to 3 years
Claims under bank loans for investment projects, whose performance is secured by the government guarantees of the Russian Federation
112.6 108.3 104.7 104.7 105.4150.00
Bonds placed to finance investment projects and included in the Bank of Russia Lombard List 0.6 0.0 0.0 0.0 0.0
Small and medium-sized enterprises
Up to 3 years Claims under loan agreements of JSC SME Bank3 43.1 18.3 14.7 13.6 12.5
175.00Up to
3 years
Guarantees of JSC Russian Small and Medium Business Corporation issued under the Programme for Encouraging Lending to Small and Medium-sized Enterprises
48.2 81.5 81.4 80.5 80.5
Leasing Up to 3 years Claims on loans to leasing companies 0.0 0.2 0.2 0.2 0.2 10.00
Military mortgage
Up to 3 years
Mortgages issued under the Military Mortgage programme 29.3 29.3 21.9 21.9 21.7 30.00
1 Specialised refinancing facilities are Bank of Russia instruments aimed at encouraging bank lending to certain segments of the economy whose development is hampered by structural factors. Under these facilities, the Bank of Russia provides funds to credit institutions at lower interest rates and for longer maturities compared with standard Bank of Russia operations. Specialised refinancing facilities are temporary Bank of Russia instruments, which will be valid until conditions for their replacement with market instruments are created in the financial market. The provision of funds under the specialised facilities is restricted, because their application should not distort the stance of the monetary policy and prevent the achievement of its key objective of ensuring price stability.
2 Projects are selected in compliance with the rules established by Regulation of the Government of the Russian Federation No. 1016, dated 14 December 2010, ‘On Approving the Rules to Select Investment Projects and Principals for the Provision of the Russian Federation State Guarantees on Loans or Bonded Loans Attracted to Carry out Investment Projects’ or Regulation of the Government of the Russian Federation No. 1044, dated 11 October 2014, ‘On Approving the Programme to Support Investment Projects Implemented in the Russian Federation Based on Project Financing’.
3 Claims under loans issued to banks and microfinance organisations partnering with JSC SME Bank under the Programme for Financial Support of Small and Medium-sized Enterprises Development for lending to SMEs and claims under loans issued to leasing companies partnering with JSC SME Bank for leasing property to SMEs.
Source: Bank of Russia.

ANNEXES JUNE 2018 No. 2 (22) MONETARY POLICY REPORT 47
Tabl
e 6
Mon
etar
y po
licy
rate
s in
var
ious
cou
ntrie
sCo
untry
Polic
y ra
teCu
rren
t lev
elLa
test
revi
sion
Prev
ious
leve
lCh
ange
Num
ber o
f rat
e re
visi
ons
over
the
past
12
mon
ths
Inflation
Curr
ent l
evel
, %
12-m
onth
cha
nge,
pp
Pola
ndta
rget
rate
1.50
04
.03.
2015
2.00
-0.5
00
1.7
-0.2
0Hu
ngar
yba
se ra
te0.
90
24.0
5.20
161.
05-0
.15
02.
30.
10Cz
ech
Repu
blic
repo
rate
(14
days
)0.
75
01.0
2.20
180.
500.
253
1.9
-0.1
0Ro
man
iaba
se ra
te2.
50
07.0
5.20
182.
250.
253
5.2
4.61
Bulg
aria
base
rate
0.00
01
.02.
2016
0.01
-0.0
10
2.0
-0.6
0Se
rbia
key
polic
y ra
te3.
00
12.0
4.20
183.
25-0
.25
41.
1-2
.90
Isra
elta
rget
ove
rnig
ht ra
te0.
10
23.0
2.20
150.
25-0
.15
00.
4-0
.31
Braz
ilta
rget
rate
6.50
21
.03.
2018
6.75
-0.2
56
2.8
-1.3
2Ch
ilem
onet
ary
polic
y ra
te2.
50
18.0
5.20
172.
75-0
.25
01.
9-0
.80
Chin
ale
ndin
g ra
te (1
2 m
onth
s)4.
35
26.1
0.20
154.
60-0
.25
01.
80.
60de
posi
t rat
e (1
2 m
onth
s)1.
50
26.1
0.20
151.
75-0
.25
0re
quire
d re
serv
e ra
te16
.00
25.0
4.20
1817
.00
-1.0
01
Indi
are
vers
e re
po ra
te6.
00
02.0
8.20
176.
25-0
.25
14.
61.
59re
po ra
te5.
75
02.0
8.20
176.
00-0
.25
1In
done
sia
targ
et ra
te6.
50
16.0
6.20
166.
75-0
.25
03.
2-1
.10
Kore
a, R
epub
lic o
fba
se ra
te1.
50
30.1
1.20
171.
250.
251
1.5
-0.5
0M
alay
sia
targ
et o
vern
ight
rate
3.25
25
.01.
2018
3.00
0.25
11.
4-3
.00
Mex
ico
targ
et ra
te7.
50
08.0
2.20
187.
250.
253
4.6
-1.2
7Ph
ilipp
ines
mon
etar
y po
licy
rate
3.25
11
.05.
2018
3.00
0.25
14.
61.
70Ru
ssia
repo
auc
tion
rate
(7 d
ays)
7.25
26
.03.
2018
7.50
-0.2
56
2.4
-1.7
0So
uth
Afric
are
po ra
te6.
50
28.0
3.20
186.
75-0
.25
24.
5-0
.80
Thai
land
repo
rate
1.
50
29.0
4.20
151.
75-0
.25
01.
51.
53Tu
rkey
repo
rate
(7 d
ays)
16.5
0 28
.05.
2018
8.00
8.50
112
.20.
43
Unite
d St
ates
fede
ral f
unds
rate
(upp
er b
ound
)2.
0013
.06.
2018
1.75
0.25
32.
50.
30Eu
ro a
rea
refin
anci
ng ra
te0.
0016
.03.
2016
0.05
-0.0
50
1.9
0.50
Unite
d Ki
ngdo
mba
se ra
te0.
5002
.11.
2017
0.25
0.25
12.
4-0
.30
Japa
nov
erni
ght r
ate
0.10
19.1
2.20
080.
30-0
.20
00.
60.
20Ca
nada
targ
et o
vern
ight
rate
1.25
17.0
1.20
181.
000.
253
2.2
0.60
Aust
ralia
over
nigh
t rat
e1.
5002
.08.
2016
1.75
-0.2
50
1.9
-0.2
0Ne
w Z
eala
ndov
erni
ght r
ate
1.75
10.1
1.20
162.
00-0
.25
01.
1-1
.10
Denm
ark
lend
ing
rate
0.05
20.0
1.20
150.
20-0
.15
00.
7-0
.30
certi
ficat
e of
dep
osit
rate
-0.6
5 08
.01.
2016
-0.7
50.
100
Switz
erla
nd3m
LIB
OR -
min
-1.2
515
.01.
2015
-0.7
5-0
.50
00.
80.
403m
LIB
OR -
max
-0.2
515
.01.
2015
0.25
-0.5
00
Swed
enre
po ra
te-0
.50
11.0
2.20
16-0
.35
-0.1
50
1.8
-0.1
9No
rway
key
depo
sit r
ate
0.50
17.0
3.20
160.
75-0
.25
02.
40.
20
Not
e: a
s of
13
June
201
8, c
hang
es o
ccur
red
from
the
com
pila
tion
time
of th
e pr
evio
us M
onet
ary
Polic
y Re
port
issu
e (2
1 M
arch
201
8) a
re p
ut in
col
our.
Sour
ce: B
loom
berg
.

48 MONETARY POLICY REPORT No. 2 (22) JUNE 2018
GLOSSARY
Adaptive expectationsExpectations that depend on past inflation readings to a bigger extent than on factors influencing its future dynamics. Given a stable decrease in inflation, its adaptive expectations will exceed its actual level.
Averaging of required reservesThe right of a credit institution to meet reserve requirements set by the Bank of Russia by maintaining a share of required reserves not exceeding the averaging ratio in a correspondent account with the Bank of Russia during a specified period.
Banking sector liquidityCredit institutions’ funds held in correspondent accounts with the Bank of Russia in the currency of the Russian Federation to carry out payment transactions and to comply with the Bank of Russia’s reserve requirements.
Bank lending conditions indexA generalised indicator of changes to bank lending conditions, as calculated by the Bank of Russia based on the results of a quarterly survey among leading Russian banks operating in the lending market as follows: (share of banks reporting a significant tightening of lending conditions, %) + 0.5 x (share of banks reporting a moderate tightening of lending conditions, %) – 0.5 x (share of banks reporting a moderate easing of lending conditions, %) – (share of banks reporting a significant easing of lending conditions, %). Measured in percentage points (pp).
Bank of Russia interest rate corridor (interest rate corridor)The basis of Bank of Russia interest rate system. The centre of the corridor is set by the Bank of Russia key rate; the upper and lower bounds are rates on overnight standing facilities (deposit facilities and refinancing facilities) symmetric to the key rate.
Bank of Russia key rateThe minimum interest rate at the Bank of Russia 1-week repo auctions and the maximum interest rate at the Bank of Russia 1-week deposit auctions. It is set by the Bank of Russia Board of Directors.
Bank of Russia Lombard ListA list of securities eligible as collateral for Bank of Russia refinancing operations.
Broad money (monetary aggregate M2X)Total amount of cash in circulation and funds of the Russian Federation residents (non-financial and financial organisations (excluding banks) and households) in settlement, current and other on-demand accounts (including accounts for bank card settlements), time deposits and other types of deposits in the banking system denominated in the currency of the Russian Federation or foreign currency, and interest accrued on them.
Carry tradeA strategy in which money is borrowed at a low interest rate in order to invest in higher-yielding assets. This strategy is employed by FX and stock market players to benefit from the positive differentials between active and passive interest rates in different currencies or for different maturities.

GLoSSARy JUNE 2018 No. 2 (22) MONETARY POLICY REPORT 49
CdS spreadPremium paid by the CDS buyer to the seller, usually expressed in basis points of the nominal value of the debt and paid with a certain periodicity.
Consumer price index (CPI)The CPI measures changes over time in the overall price level of goods and services purchased by households for private consumption. This index is calculated by the Federal State Statistics Service as the ratio of the value of a fixed set of goods and services in current prices to the value of the same set of goods and services in prices of a previous (reference) period. The CPI is calculated on the basis of data on the actual structure of consumer spending being therefore one of the key indicators of household living costs.
Core inflationInflation being measured as a core consumer price index (CCPI). The difference between the CCPI and the consumer price index (CPI) lies in the CCPI calculation method, which excludes a change in prices for individual goods and services subject to the influence of administrative and seasonal factors (fruit and vegetables, fuel, passenger transportation services, telecommunications services, and the majority of housing and public utility services).
Credit default swap (CdS)An insurance contract protecting from default on reference obligations (sovereign or corporate securities with fixed yields). It is a credit derivative allowing the buyer of the contract to get insured against a certain credit event of the reference obligation issuer by paying an annuity premium (CDS spread) to the insurance seller.
Current liquidity deficit/surplusAn excess of banking sector demand for liquidity over the liquidity supply on a given day. A reverse situation, an excess of the liquidity supply over demand on a given day, is current liquidity surplus.
dollarisation of depositsA share of deposits denominated in foreign currency in total banking sector deposits.
Factors of banking sector liquidityChanges in the central bank balance-sheet items affecting banking sector liquidity, but which do not result from central bank liquidity management operations. These factors include changes in cash in circulation, changes in balances of general government accounts with the Bank of Russia, Bank of Russia operations in the domestic foreign exchange market (excluding operations regulating banking sector liquidity), as well as changes in required reserves deposited by credit institutions in required reserve accounts with the Bank of Russia.
Financial stabilityFinancial system stance characterised by the absence of systemic risks which, once evolved, may impact negatively on the process transforming savings into investment and on the real economy. In the situation of financial stability, economy demonstrates better resilience to external shocks.
Floating exchange rate regimeAccording to the IMF classification, under the floating exchange rate regime the central bank does not set targets, including operational ones, for the level of, or changes to, the exchange rate, allowing it to be shaped under the impact of market factors. However, the central bank reserves the right to purchase foreign currency to replenish international reserves or to sell it should threats to financial stability arise.

50 MONETARY POLICY REPORT No. 2 (22) JUNE 2018 GLoSSARy
Floating interest rate on Bank of Russia operationsAn interest rate tied to the Bank of Russia key rate. If the Bank of Russia Board of Directors decides to change the key rate, the interest rate applied to the loans previously provided at a floating interest rate will be adjusted by the change in the key rate with effect from the corresponding date.
Funds in general government’s accounts with the Bank of RussiaFunds in accounts with the Bank of Russia representing funds of the federal budget, the budgets of constituent territories of the Russian Federation, local budgets, government extra-budgetary funds and extra-budgetary funds of constituent territories of the Russian Federation and local authorities.
Generalised (composite) consumer confidence indexCalculated by the Federal State Statistics Service on the basis of quarterly surveys, as an arithmetical mean value of five indices: occurred and expected changes in personal wealth; occurred and expected changes in the economic situation in Russia; and the favourability of conditions for high-value purchases. Partial indices are calculated by drawing up the balance of respondents’ estimates (as a percentage). The balance of estimates is the difference between the sum of shares (as a percentage) of decisively positive and 1/2 of the rather positive answers and the sum of shares (as a percentage) of negative and 1/2 of the rather negative answers. Neutral answers are not taken into account.
Gross credit of the Bank of RussiaIncludes loans extended by the Bank of Russia to credit institutions (including banks with revoked licences), overdue loans and overdue interest on loans, funds provided by the Bank of Russia to credit institutions through repos and FX swaps (USD/RUB and EUR/RUB swaps).
Import substitutionSubstitution of imported goods by domestic goods which leads to the increase in the proportion of domestic goods in the internal market.
Inflation expectationsImplied, forecast and expected inflation levels which form the basis for economic decisions and future plans of households, firms and financial market participants (including about consumption, savings, borrowings, investment and loan/deposit rates).
Inflation risksThe risks that price growth may cause the decline in value of assets or incomes.
Inflation targeting regimeA monetary policy framework setting that the final target of the central bank is to ensure price stability, i.e. achieving and maintaining sustainably low inflation. Under this regime a quantitative inflation target is set and announced. The central bank is responsible for achieving this target. Typically, under an inflation targeting regime, the monetary policy affects the economy through interest rates. Decisions are made primarily on the basis of economic forecasts and inflation dynamics. An important feature of this regime is regular explanations to the public of decisions adopted by the central bank, which guarantees its accountability and transparency.
Interest rate corridorSee Bank of Russia interest rate corridor.
Macro Risk IndexAn index calculated by Citibank and demonstrating the perception of risk level in the global financial markets by investors. The index is bound between 0 (low risk level) to 1 (high risk level). The index is based on the historical dynamics of emerging market sovereign Eurobond yield spreads to the yield spreads of

GLoSSARy JUNE 2018 No. 2 (22) MONETARY POLICY REPORT 51
US treasuries, credit spreads on US corporate bonds, US swap spreads, and implied exchange rate, stock index and interest rate volatility.
Monetary aggregate M1Total amount of cash in circulation and funds of the Russian Federation residents (non-financial and financial organisations (excluding banks) and households) in settlement, current and other on-demand accounts (including accounts for bank card settlements) opened in the banking system in the currency of the Russian Federation and interest accrued on them.
Monetary policy transmission mechanismThe process of transferring the impulse of monetary policy decisions to the economy as a whole and to price dynamics, in particular. The process of transmitting the central bank’s signal on holding or changing the key rate and its future path from the financial market segments to the real sector and as a result to inflation. The key rate changes are translated into the economy through the following major channels: interest rate, credit, foreign currency and asset price channels.
Money supplyTotal amount of funds of the Russian Federation residents (excluding general government and credit institutions). For the purposes of economic analysis various monetary aggregates are calculated (see Monetary aggregate M1, Money supply in the national definition (monetary aggregate M2), and Broad money (monetary aggregate M2X).
Money supply in the national definition (monetary aggregate M2)Total amount of cash in circulation and funds of the Russian Federation residents (non-financial and financial organisations (excluding banks) and households) in settlement, current and other on-demand accounts (including accounts for bank card settlements), time deposits and other types of deposits in the banking system denominated in the currency of the Russian Federation and interest accrued on them.
MSCI indicesGroup of indices calculated by Morgan Stanley Capital International. Calculations are made for indices for individual countries (including Russia), global indices (for various regions, for developed/emerging economies) and ‘world’ index.
Net credit of the Bank of Russia to credit institutionsGross credit of the Bank of Russia to credit institutions net of correspondent account balances in the currency of the Russian Federation (including the averaged amount of required reserves) and deposit account balances of credit institutions with the Bank of Russia, investments by credit institutions in Bank of Russia bonds (at prices fixed as of the start of the current year), and credit institutions’ claims on the Bank of Russia under the ruble leg of FX swaps (USD/RUB swaps).
Net private capital inflow/outflowThe total balance of private sector operations involving foreign assets and liabilities recorded on the financial account of the balance of payments.
Non-price bank lending conditionsBank lending conditions, which include loan maturity and amount, requirements for the financial standing of the borrower and collateral, additional fees, and the range of lending purposes. They are assessed on the basis of surveys of credit institutions by the Bank of Russia.
Non-tradable sector of the economySector of the economy engaged in electricity, gas and water supply, construction, wholesale and retail trade, motor vehicle and motorcycle maintenance, household goods and personal appliance repairs,

52 MONETARY POLICY REPORT No. 2 (22) JUNE 2018 GLoSSARy
hotels and restaurants, transport and communications, financial activity, real estate, leasing and services, including other communal, social and personal services.
Open market operationsBank of Russia operations to regulate banking sector liquidity. They include operations on a reverse basis other than standing facilities, which are carried out with the Bank of Russia making a specific offer (usually auction-based), as well as all operations to purchase/sell securities, foreign currency and gold.
Outstanding amount on Bank of Russia refinancing operationsoutstanding amount on loans extended by the Bank of Russia to credit institutions against the collateral of securities, non-marketable assets, guarantees, gold, repo operations, and FX swaps (USD/RUB and EUR/RUB swaps).
PMI indicesIndicators of business activity based on company surveys in manufacturing and/or services industries. The PMI index series describe dynamics for the following aspects of business climate: output (or business activity for the services industry), new orders, new export orders, backlogs of work, stocks of finished goods, stocks of purchases, quantity of purchases, suppliers’ delivery times, employment, output prices (prices charged for the services industry), input prices, and expectations for activity one year ahead (for the services industry). PMI readings over 50 indicate an expansion of business activity, while readings below 50 suggest a decline.
Relative pricePrice of a commodity (commodity group) in terms of the price of another commodity (commodity group) assumed to equal one.
Repo operationA deal which consists of two legs: one party to the deal sells securities to the other party in return for cash, and then, once the deal term has expired, buys them back at a predetermined price. Repos are used by the Bank of Russia to provide credit institutions with liquidity in rubles and foreign currency in exchange for collateral in the form of securities.
Required reservesFunds maintained by credit institutions in correspondent accounts with the Bank of Russia and accounts to record required reserves in order to fulfil reserve requirements. The latter comprise required reserve ratios and a required reserve averaging ratio.
Ruble nominal effective exchange rate indexThe ruble nominal effective exchange rate index reflects changes in the exchange rate of the ruble against the currencies of Russia’s main trading partners. It is calculated as the weighted average change in the nominal exchange rates of the ruble against the currencies of these countries. The weights are determined according to the foreign trade turnover share of Russia with each country in the total foreign trade turnover of Russia with its main trading partners.
Ruble real effective exchange rate indexIt is calculated as the weighted average change in the real exchange rate of the ruble to the currencies of Russia’s main trading partners. The real exchange rate of the ruble to a foreign currency is calculated using the nominal exchange rate of the ruble to the same currency and the ratio of price levels in Russia to those in the corresponding country. When calculating the real effective exchange rate, weights are determined according to the foreign trade turnover share of Russia with each of these countries in the total foreign trade turnover of Russia with its main trading partners. The ruble real effective exchange rate index reflects changes in the competitiveness of Russian goods in comparison to those of Russia’s main trading partners.

GLoSSARy JUNE 2018 No. 2 (22) MONETARY POLICY REPORT 53
Shadow banking sectorFinancial intermediaries providing credit intermediary services whose activity is not regulated by the banking legislation.
Standing facilitiesoperations to provide and absorb liquidity carried out by the Bank of Russia on the initiative of credit institutions.
Structural liquidity deficit/surplusStructural deficit is the state of the banking sector characterised by a stable demand by credit institutions for Bank of Russia liquidity provision operations. Structural surplus is characterised by a stable liquidity surplus in credit institutions and the Bank of Russia’s need to conduct liquidity-absorbing operations. The level of structural liquidity deficit/surplus is a difference between the outstanding amount on refinancing operations and Bank of Russia liabilities on operations to absorb excess liquidity.
Structural non-oil and gas primary budget deficitBudget items that are not dependent on the phase of the business cycle and are determined by general government decisions. It is the overall budget deficit, excluding oil and gas revenues, net interest payments, one-off budget revenues, and other items directly dependent on changes in economic activity.
Structural transformationsTransformation leading to changes in the economy structure and growth factors, and also to increases in labour productivity and implementation of new technology.
Terms of foreign tradeRatio between a country’s export price index and import price index.
Tradable sector of economyEconomy sector made up of agriculture, hunting, forestry, fishery, fish farming, mining and quarrying, and manufacturing industries.
Underlying inflation Underlying inflation indicators are estimated indicators reflecting movements in prices for the majority of goods and services included in the basket used for the calculation of the consumer price index, which are shaped by general economic factors and are free from one-off effects. The indicators of the core inflation published by Rosstat and the underlying inflation published by the Bank of Russia since 2015 (trend inflation) may be categorised under this group of indicators.
Underlying inflation published since 2015 (trend inflation) Inflation indicator cleared of all shocks which are irrelevant for the monetary policy. This indicator is calculated by the Bank of Russia on the basis of dynamic factor models.
VIXCalculated by Chicago Board options Exchange index of expected volatility of S&P 500 stock index over the next 30day period. VIX is constructed as a weighted average of premiums of a wide range of prices of put and call options on the S&P 500 index.

54 MONETARY POLICY REPORT No. 2 (22) JUNE 2018
ABBREVIATIONS
AHML – Agency for Housing Mortgage Lending
BLC – bank lending conditions
bp – basis point (0.01 pp)
BPM6 – the 6th edition of the IMF’s Balance of Payments and International Investment Position Manual
BRICS – a group of five countries: Brazil, Russia, India, China and South Africa
Cbonds IFX-Cbonds – corporate bond total return index
Cbonds-Muni – municipal bond index calculated by Cbonds
CCPI – core consumer price index
CPI – consumer price index
dSR – debt service ratio (the ratio of the cash flow available to pay current debt obligations, including
principal and interest, to current income value)
ECB – European Central Bank
EME – emerging market economies
EU – European Union
FAO – Food and Agriculture organization of the United Nations
FCS – Federal Customs Service
Fed – US Federal Reserve System
FGUP – federal state unitary enterprise
FPG – fiscal policy guidelines
GdP – gross domestic product
GFCF – gross fixed capital formation
GRP – gross regional product
IBL – interbank loans
IEA – International Energy Agency
Industrial PPI – industrial producer price index
inFOM – Institute of the Public opinion Foundation
MC – management company
MIACR – Moscow Interbank Actual Credit Rate (weighted average rate on interbank loans provided)
MIACR-B – Moscow Interbank Actual Credit Rate-B-Grade (weighted average rate on interbank loans
provided to banks with speculative credit rating)
MIACR-IG – Moscow Interbank Actual Credit Rate-Investment Grade (weighted average rate on interbank
loans provided to banks with investment-grade rating)
MIC – military-industrial complex
MICEX SE – MICEX Stock Exchange
MPd – Monetary Policy Department of the Bank of Russia

ABBREVIATIoNS JUNE 2018 No. 2 (22) MONETARY POLICY REPORT 55
MTVECM, TVECM – Momentum Threshold Vector Error Correction Model, Threshold Vector Error
Correction Model
NPF – non-governmental pension fund
NPISH – non-profit institutions serving households
OBR – Bank of Russia bonds
OECd – organisation for Economic Cooperation and Development
OFZ – federal government bonds
OFZ-IN – inflation-indexed federal government bonds
OFZ-Pd – permanent coupon-income federal government bonds
OFZ-Pk – variable coupon-income federal government bonds
OJSC – open joint-stock company
OPEC – organization of the Petroleum Exporting Countries
PJSC – public joint-stock company
PMI – Purchasing Managers’ Index
pp – percentage point
PPI – producer price index
QPM – quarterly projection model of the Bank of Russia
REB – Russian Economic Barometer, monthly bulletin
RGBEY – Russian Government Bonds Effective yield until Redemption (calculated by the Moscow
Exchange)
RUONIA – Ruble overNight Index Average (reference weighted rate of overnight ruble deposits in the
Russian interbank bond market, calculated by Cbonds)
SME – small and medium-sized enterprises
SNA – system of national accounts
TCC – total cost of credit
TVP FAVAR – Time-Varying Parameter Factor-Augmented Vector Auto-Regression
VAT – value added tax
VCIOM – Russian Public opinion Research Centre
VEB – Vnesheconombank
VECM – Vector Error Correction Model