Embed Size (px)
Citation preview

Tablet User Interface Evaluation for a Portable Ultrasound System and Real time Doppler SpectrumProcessing
Aida Meredassa Kumssa
Master of Science in Engineering Cybernetics
Supervisor: Hans Torp, ITKCo-supervisor: Gabriel Kiss, ISB
Department of Engineering Cybernetics
Submission date: July 2013
Norwegian University of Science and Technology

Tablet User Interface Evaluation for a
Portable Ultrasound System and Real time
Doppler Spectrum Processing
Aida Kumssa
July 2013
MASTER THESIS
Department of Engineering cybernetics
Norwegian University of Science and Technology
Supervisor 1: Professor Hans Torp
Supervisor 2: Researcher Gabriel Kiss

2

i
Problem Description
The aim of the thesis is to further develop the user interface and signal processing module of
a portable ultrasound system, intended for midwives in rural areas of Africa, where Doppler
based blood flow measurements during pregnancy can have an important impact on reducing
the mortality of mother and unborn child. The thesis should focus on the following topics:
1. Carry out a pilot usability study (target group: midwives with no/limited ultrasound expe-
rienced) and define a minimal user interface that is necessary for successful completion
of a typical ultrasound examination.
2. Implement the proposed interface on a tablet (Android device), to be used during real-
time ultrasound scanning.
3. Optimize the quality, visualization and extract relevant parameters from the acquired Doppler
spectrum based on raw data received from the scanner.
4. Develop a robust help module for the application, allowing the user to access a set of
examples either of normal scans or acquisitions containing typical pathologic findings
that are highlighted.
5. Define a usability testing protocol and evaluate it on two different user groups: midwives
with and without prior experience in ultrasound.

ii

iii
Abstract
In this thesis, real time Doppler spectrum processing and Tablet user interface evaluation for
portable ultrasound system is done.
In most ultrasound machines, fast fourier transform and other spectral processing requires a
specialized hardware, which is costly. In order to have a low cost and portable ultrasound device
for application in rural areas, a tablet ultrasound system can be developed. The cost of such a
device can be minimized by doing as much real-time processing as possible on the tablet. In the
thesis, Doppler spectrum processing and visualization is implemented using various techniques
for application on a tablet user interface. The spectral properties are properly designed and
the required components of the spectrum rendering window are fully developed. Various user
control systems are also developed to allow user interactivity.
Tablet user interface evaluation was conducted to assess the usability of the user interface
for intended end users (midwives). Before conducting the evaluation, some improvements were
performed to the prototype user interface. The usability evaluation of the user interface was
conducted by giving usability test task over a group of midwives and evaluated using various us-
ability evaluation methods. By employing these methods, it was possible to measure the typical
usability goals such as efficiency, task completion success rate and satisfaction of the users. The
analysed results show that all the midwives have achieved high task completion success rate
and good task completion time, which is acceptable and most of the users are satisfied with the
application.
Due to some facility limitations at the beginning of the thesis work, a pilot usability study
and its subsequent user interface improvement, which were planned at the beginning, are not
included as part of this thesis.

iv

v
Preface
This is my master’s thesis work that is submitted to the department of Engineering Cybernetics
at Norwegian university of science and technology (NTNU) and the department of circulation
and medical imaging (ISB) at St. Olavs University Hospital for evaluation of my work. All the
thesis work is performed at the department of circulation and medical imaging.
Aida Kumssa
Trondheim, July 13, 2013

vi
vii
Acknowledgment
I would like to thank first my supervisors Professor Hans Torp and Researcher Gabriel Kiss for
their guidance, advice and support throughout my thesis work. Thank you for all the help and
never being tired of hearing and replying all my e-mails regarding my ideas, questions, sugges-
tions or comments.
Special thanks to Nurse-midwife /Associate Professor Eva Tegnander to her time and dedi-
cation when I was conducting the usability test on the tablet user interface evaluation for clin-
ical applications. Thank you for your effort trying to find patients during the usability test and
explaining all the clinical aspects and discussing the evaluation process in person, phone and
e-mail.
An Overwhelming thanks to my husband Dr. Bruhtesfa, for his support and love. Last but
not least, thanks for my Mom, Dad and some friends for being patient and understanding on
those very busy times.
Thanks to muffins, apples for being immediate source of energy and coffee for making me
active most time of the day.

viii
Contents
Problem Description . . . . . . . . . . . . . . . . . . . . . . . . . . . . . . . . . . . . . . . . i
Abstract . . . . . . . . . . . . . . . . . . . . . . . . . . . . . . . . . . . . . . . . . . . . . . . . iii
Preface . . . . . . . . . . . . . . . . . . . . . . . . . . . . . . . . . . . . . . . . . . . . . . . . v
Acknowledgment . . . . . . . . . . . . . . . . . . . . . . . . . . . . . . . . . . . . . . . . . . vii
Acronyms . . . . . . . . . . . . . . . . . . . . . . . . . . . . . . . . . . . . . . . . . . . . . . xiii
1 Introduction 1
1.1 Motivation . . . . . . . . . . . . . . . . . . . . . . . . . . . . . . . . . . . . . . . . . . . 1
1.2 The UMOJA Project . . . . . . . . . . . . . . . . . . . . . . . . . . . . . . . . . . . . . . 2
1.3 Earlier Work on Portable Ultrasound System . . . . . . . . . . . . . . . . . . . . . . . 2
1.4 The need for Doppler Spectrum Processing and User Interface Evaluation . . . . . 4
1.4.1 Why is Doppler spectrum processing needed? . . . . . . . . . . . . . . . . . . 4
1.4.2 Why is user interface evaluation needed? . . . . . . . . . . . . . . . . . . . . . 5
1.5 Organization of the Thesis . . . . . . . . . . . . . . . . . . . . . . . . . . . . . . . . . . 5
1.5.1 Thesis organization . . . . . . . . . . . . . . . . . . . . . . . . . . . . . . . . . . 5
2 Background 7
2.1 Umbilical Artery . . . . . . . . . . . . . . . . . . . . . . . . . . . . . . . . . . . . . . . . 7
2.2 Doppler Ultrasound . . . . . . . . . . . . . . . . . . . . . . . . . . . . . . . . . . . . . 8
2.2.1 Aliasing . . . . . . . . . . . . . . . . . . . . . . . . . . . . . . . . . . . . . . . . . 10
2.2.2 Ultrasound flow modes . . . . . . . . . . . . . . . . . . . . . . . . . . . . . . . 10
2.2.3 Smoothing . . . . . . . . . . . . . . . . . . . . . . . . . . . . . . . . . . . . . . . 11
2.3 Spectrum and Tablet User Interface Rendering Tools . . . . . . . . . . . . . . . . . . 12
2.3.1 Visualization Toolkit (VTK) . . . . . . . . . . . . . . . . . . . . . . . . . . . . . 12
ix
x CONTENTS
2.3.2 VES/Kiwi . . . . . . . . . . . . . . . . . . . . . . . . . . . . . . . . . . . . . . . . 14
2.3.3 Circular buffer . . . . . . . . . . . . . . . . . . . . . . . . . . . . . . . . . . . . . 15
2.4 Tablet User Interface Evaluation . . . . . . . . . . . . . . . . . . . . . . . . . . . . . . 16
2.4.1 Usability basics . . . . . . . . . . . . . . . . . . . . . . . . . . . . . . . . . . . . 16
2.4.2 Learning about the end users . . . . . . . . . . . . . . . . . . . . . . . . . . . . 18
2.4.3 Task analysis . . . . . . . . . . . . . . . . . . . . . . . . . . . . . . . . . . . . . . 20
2.4.4 Personas . . . . . . . . . . . . . . . . . . . . . . . . . . . . . . . . . . . . . . . . 21
2.4.5 Scenarios . . . . . . . . . . . . . . . . . . . . . . . . . . . . . . . . . . . . . . . . 21
2.4.6 Prototypes . . . . . . . . . . . . . . . . . . . . . . . . . . . . . . . . . . . . . . . 22
2.4.7 SUS - System Usability Scale . . . . . . . . . . . . . . . . . . . . . . . . . . . . 23
2.4.8 User centered design . . . . . . . . . . . . . . . . . . . . . . . . . . . . . . . . . 23
2.4.9 The human machine interaction . . . . . . . . . . . . . . . . . . . . . . . . . . 24
3 Methods 31
3.1 Spectral Processing and Visualization Methods . . . . . . . . . . . . . . . . . . . . . 31
3.1.1 VTK: useful classes and methods . . . . . . . . . . . . . . . . . . . . . . . . . . 32
3.1.2 Velocity and Time scale adjustment . . . . . . . . . . . . . . . . . . . . . . . . 35
3.1.3 Aliasing . . . . . . . . . . . . . . . . . . . . . . . . . . . . . . . . . . . . . . . . . 36
3.1.4 Spectral filtering . . . . . . . . . . . . . . . . . . . . . . . . . . . . . . . . . . . 37
3.1.5 User controls . . . . . . . . . . . . . . . . . . . . . . . . . . . . . . . . . . . . . 37
3.2 User Interface Improvement Methods . . . . . . . . . . . . . . . . . . . . . . . . . . . 38
3.3 Tablet User Interface Evaluation Methods . . . . . . . . . . . . . . . . . . . . . . . . . 38
3.3.1 Usability test events . . . . . . . . . . . . . . . . . . . . . . . . . . . . . . . . . 39
3.3.2 Who is tested . . . . . . . . . . . . . . . . . . . . . . . . . . . . . . . . . . . . . 39
3.3.3 Individual interview . . . . . . . . . . . . . . . . . . . . . . . . . . . . . . . . . 42
3.3.4 Personas . . . . . . . . . . . . . . . . . . . . . . . . . . . . . . . . . . . . . . . . 42
3.3.5 Context of product use in the test . . . . . . . . . . . . . . . . . . . . . . . . . 42
3.3.6 Usability metrics . . . . . . . . . . . . . . . . . . . . . . . . . . . . . . . . . . . 45
4 Results 47
4.1 Doppler Spectral Result . . . . . . . . . . . . . . . . . . . . . . . . . . . . . . . . . . . 47
CONTENTS xi
4.1.1 Gain adjustment . . . . . . . . . . . . . . . . . . . . . . . . . . . . . . . . . . . 49
4.1.2 Velocity resolution . . . . . . . . . . . . . . . . . . . . . . . . . . . . . . . . . . 50
4.1.3 Time scale adaptation . . . . . . . . . . . . . . . . . . . . . . . . . . . . . . . . 51
4.1.4 Axis update . . . . . . . . . . . . . . . . . . . . . . . . . . . . . . . . . . . . . . 51
4.1.5 Aliasing . . . . . . . . . . . . . . . . . . . . . . . . . . . . . . . . . . . . . . . . . 54
4.1.6 Overlap . . . . . . . . . . . . . . . . . . . . . . . . . . . . . . . . . . . . . . . . . 56
4.1.7 Temporal averaging . . . . . . . . . . . . . . . . . . . . . . . . . . . . . . . . . 58
4.1.8 Output data buffer . . . . . . . . . . . . . . . . . . . . . . . . . . . . . . . . . . 60
4.1.9 Performance of Spectrum generator and it’s issues . . . . . . . . . . . . . . . 61
4.1.10 User controls . . . . . . . . . . . . . . . . . . . . . . . . . . . . . . . . . . . . . 61
4.2 Improvement on the user interface . . . . . . . . . . . . . . . . . . . . . . . . . . . . 62
4.3 Main Findings of the Evaluation . . . . . . . . . . . . . . . . . . . . . . . . . . . . . . 62
4.3.1 Individual interviews . . . . . . . . . . . . . . . . . . . . . . . . . . . . . . . . . 62
4.3.2 Personas . . . . . . . . . . . . . . . . . . . . . . . . . . . . . . . . . . . . . . . . 66
4.3.3 Scenario . . . . . . . . . . . . . . . . . . . . . . . . . . . . . . . . . . . . . . . . 67
4.3.4 Prototype fidelity . . . . . . . . . . . . . . . . . . . . . . . . . . . . . . . . . . . 68
4.3.5 Usability test result . . . . . . . . . . . . . . . . . . . . . . . . . . . . . . . . . . 68
4.3.6 Usability test observations . . . . . . . . . . . . . . . . . . . . . . . . . . . . . 69
4.3.7 System Usability Scale(SUS) . . . . . . . . . . . . . . . . . . . . . . . . . . . . 73
4.3.8 Usability issue . . . . . . . . . . . . . . . . . . . . . . . . . . . . . . . . . . . . . 74
5 Discussion and analysis 77
5.1 Doppler Spectrum Processing . . . . . . . . . . . . . . . . . . . . . . . . . . . . . . . 77
5.2 User Interface Evaluation . . . . . . . . . . . . . . . . . . . . . . . . . . . . . . . . . . 78
6 Conclusions and Future work 81
6.1 Recommendations for Further Work . . . . . . . . . . . . . . . . . . . . . . . . . . . . 82
References 83
A Appendices 87
A.1 Guidelines Doppler Ultrasound . . . . . . . . . . . . . . . . . . . . . . . . . . . . . . 88

xii CONTENTS
A.2 Individual Interview . . . . . . . . . . . . . . . . . . . . . . . . . . . . . . . . . . . . . 89
A.3 SUS(System Usability Scale) . . . . . . . . . . . . . . . . . . . . . . . . . . . . . . . . . 90
A.4 VTK based Code for Spectrum Generation and Visualization . . . . . . . . . . . . . 91

CONTENTS xiii
acronyms
US Ultrasound
TUIwindow Tablet User Interface window
UCD User-centered design
HCI Human computer interaction
SUS System Usability Scale
L&S Lewis and Sauro
FFT Fast Fourier Transform
RFFT Reverse Fast Fourier Transform

Chapter 1
Introduction
This chapter introduces the motivation for this thesis, the general and specific problems ad-
dressed in the thesis and the components and structure of the remaining chapters of the thesis.
Section 1.1 discusses the advantages of a tablet based ultrasound system. Following this, the
UMOJA project, of which this thesis is part of, is introduced in Section 1.2. Then, earlier works
on portable ultrasound system are reviewed in Section 1.3. Section 1.4 discusses the motivations
behind this thesis in particular and discusses the two main parts of this thesis. Finally, Section
1.5 describes the organization of the rest of the thesis.
1.1 Motivation
In developing countries, there are various pregnancy related health problems. Developing coun-
tries are significantly affected by high morbidity and mortality rates among the unborn and chil-
dren below 5 years of age and high mortality rate among pregnant women as a consequence of
inadequate detection of basic, often simple, problems in pregnancy.
Ultrasound is a very important technology in the health sector that helps to monitor vari-
ous problems in the body and is the only imaging method to be used in pregnancy and widely
offered to the general population in the form of screening programs. Therefore, the access to
ultrasound technology is very essential in preventing deaths of unborn children and pregnant
women by following up their pregnancy symptoms.
Most current ultrasound systems are too expensive, less portable and very sensitive to be
1

2 CHAPTER 1. INTRODUCTION
used in the rough environment of developing countries. Therefore an ultrasound imaging sys-
tem that is robust & and low-cost needs to be designed particularly for operation in rural areas
of developing countries. Tablet form ultrasound scanner is a good solution for this. Tablet based
scanner aims to develop an ultrasound scanner in the form of a tablet that is cost effective, easy
to use, user friendly, portable, durable and of sufficiently high image quality.
1.2 The UMOJA Project
The UMOJA Project: is a project whose main objective is to develop an ultrasound imaging sys-
tem that is low-cost, super durable, easy to use and of sufficiently high image quality particularly
designed for operation in rural areas of developing countries. The project is specially targeted
for South Africa where there are a lot of pregnant women, and where they also suffer mater-
nal death and loss of their fetuses/children, as a consequence of inadequate detection of basic,
often simple, problems during pregnancy. The project is targeted to the specific needs and chal-
lenges for obstetric ultrasound in rural area of South Africa that have been identified through the
extensive experience of the National Center for Fetal Medicine at NTNU. The project to develop
the UMOJA ultrasound machine is a joint effort between the National Center for Fetal Medicine,
the Department of Circulation and Medical Imaging, and the Medical Imaging Lab, all at NTNU,
and the Norwegian company GE Vingmed Ultrasound.
1.3 Earlier Work on Portable Ultrasound System
In this section, some earlier works on portable and flexible ultrasound system implementation
are reviewed.
• This thesis builds on my project work ("A tablet user interface for Doppler ultrasound scan-
ner") that was carried out during the fall 2012 [26].
The tablet user interface developed in my project is a touch screen application that al-
lows various user interactions and controls and it is developed in a way that optimizes
the screen size of the tablet. It has a user controller in icon representations form with dif-
ferent applications for optimal use of space and effective representation. It supports also

1.3. EARLIER WORK ON PORTABLE ULTRASOUND SYSTEM 3
two finger swipe and (single/double) tap applications for controls such as zoom, sample
volume and color box. The Tablet User Interface Window (TUIwindow) mainly consists
of the the icons as user controller, bitmap and the Doppler spectrum. Successful stream-
ing of the bitmap and Doppler spectrum is implemented between the tablet and the Vivid
q scanner during scanning. The tablet user interface also supports switching to a freeze
mode where the user can stop and investigate the scanning process by going through the
stored images.
• Johan Morten Dreier’s thesis ("User centered design in rural South Africa: How well does
current best practice apply for this setting?") [23]:
This thesis focuses on user centered development process based on ISO 9142/210 to de-
velop and test the prototype of an ultrasound help system. The prototype that is used is
made by Aurotech Ultrasound AS and two prototypes of the Umoja ultrasound machine
(US machine for Umoja project) have been made by Aurotech Ultrasound AS. These pro-
totypes have main ultrasound unit connected to a power supply, probe and Ethernet cable
that connects the PC to the US unit [23].
• U697/A97: is touch screen ultrasound device made by Canyearn Medical Equipment. It is
tablet-sized form and supports various display modes to realize comparative observation
from multiple angles and direction. The GUI of this device consists of various buttons
and navigation is performed by applying touch application on the user interface. It can
be used for various applications, such as in abdominal, fetal/OB, cardiology imaging and
it also supports various probes for instance linear, convex, endorectal etc [2].
• Change projects: Change is a group at the University of Washington whose main focus
is exploring how technology can improve the lives of populations in low-income regions.
They have designed and developed a low-cost portable ultrasound device that consists of
a USB ultrasound probe and a touch screen netbook. The GUI is simple and contains the
necessary functionality for fetal imaging [7].
4 CHAPTER 1. INTRODUCTION
1.4 The need for Doppler Spectrum Processing and User Inter-
face Evaluation
1.4.1 Why is Doppler spectrum processing needed?
In my earlier project work (discussed in Section 1.3), the Doppler spectrum was processed on
the scanner side and the processed spectrum is streamed to the tablet. Fast Fourier Transform
(FFT) computation and other spectrum processing tasks are done on the ultrasound machine.
Generally, FFT computation for spectrum generation on ultrasound machine is very costly es-
pecially in-terms of hardware because it requires it’s own hardware for FFT computation.
In order to have low cost scanner for applications in rural areas, as much real-time process-
ing as possible should be done in the tablet. In the tablet, the general purpose hardware (already
used for other purposes) supports FFT computation and there is enough computation power in
the tablet to compute FFT and other spectral processing. Therefore it needs only software ap-
plication to be developed for the FFT computation and other processing; thus, a cost effective
tablet ultrasound system can be developed.
Integration into tablet user interface: The Doppler spectrum processing code development
was conducted on a windows platform and tested using a stored data of a carotid artery at first.
The spectrum processing code has been also tested in real time spectrum processing at the end.
Because of two basic limitations, the spectral processing code was not directly developed into
the tablet ultrasound system. These two limitations were 1.) the Vivid q scanner which is useful
for real time testing and 2.) the GE streamer code (a code that helps for streaming between the
scanner and tablet/laptop) were both not available at the beginning of the thesis project.
Every of spectral properties and components of Doppler spectrum have been fully devel-
oped with the stored data and some of the implementations are tested in real time processing to
make sure integration into a tablet based ultrasound is possible. Due to time limitation, it was
not possible to integrate the developed code into the tablet user interface at the end, but all the
codes and methods are developed, tested and how the development can be integrated into the
laptop/tablet will be discussed in the later parts of this thesis.

1.5. ORGANIZATION OF THE THESIS 5
1.4.2 Why is user interface evaluation needed?
Usability evaluation of user interface is very important to determine the usability of the devel-
oped user interface. Through different usability evaluation techniques of the user interface, it
helps to identify any usability problems, collect quantitative data on user’s performance (e.g.,
time on task), and helps to measure efficiency, effectiveness and satisfaction of users with the
user interface. Based on these, it is possible to recommend improvements, implement the rec-
ommendations and re-test the user interface to measure the effectiveness of the changes.
1.5 Organization of the Thesis
As described in the problem description, this thesis will emphasize on:
• Doppler spectrum processing based on a raw data.
• Evaluation of the user interface introduced in Section 1.3.
In addition to this, improvements performed on the user interface from earlier work is also in-
cluded and discussed.
Therefore the chapters in this thesis have sections that are written on each of these main
parts. In the first part of each chapter, spectrum processing is discussed and the second part of
each chapter belongs to the user interface evaluation.
1.5.1 Thesis organization
The remaining part of this thesis, consists of the following chapters.
Chapter 2 is the background chapter which introduces background theory on spectrum pro-
cessing and prototype evaluation.
Chapter 3 discusses the methods used for spectral processing and user interface evaluation.
Chapter 4 shows the important results on spectrum processing and user interface evaluation
obtained in this thesis.
Chapter 5 is a discussion chapter that discusses the results, some interpretations and possible
improvements.

6 CHAPTER 1. INTRODUCTION
Chapter 6 shows the conclusions of this thesis and recommended further work.
Appendix A includes some additional information and developed code.
Chapter 2
Background
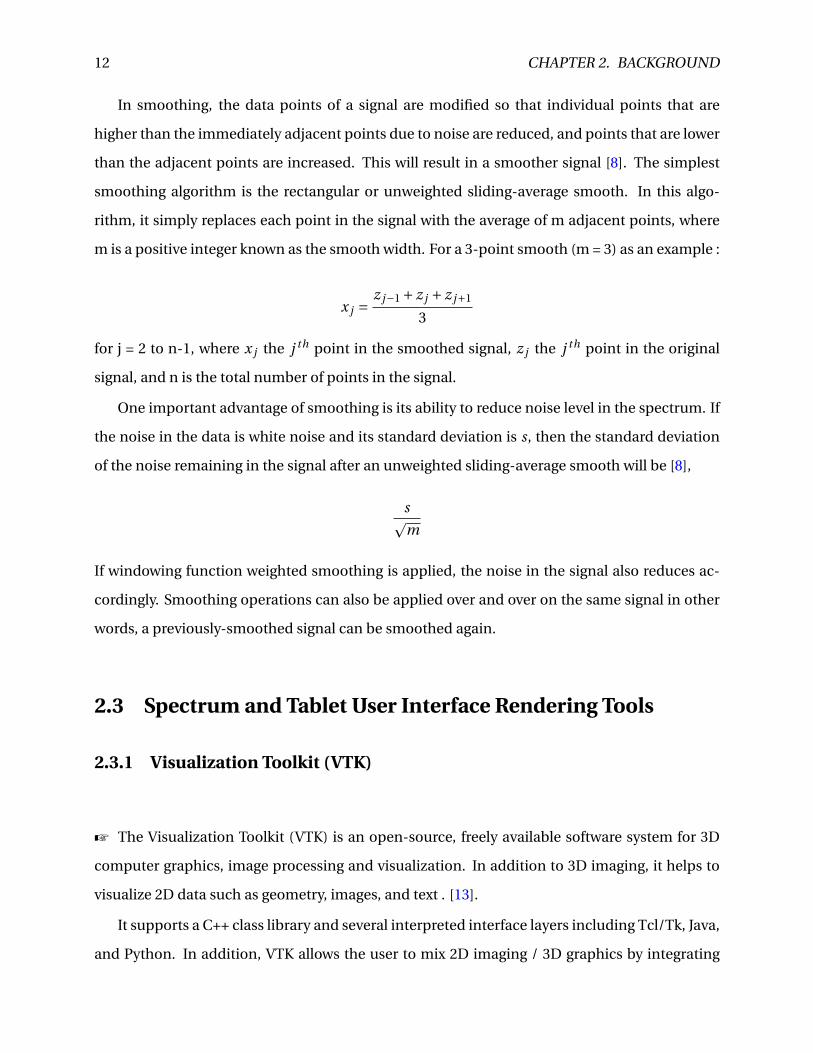
In this chapter, background information related to Doppler ultrasound, spectrum processing
and visualization and prototype evaluation is discussed. First, the umbilical artery and how it
is diagnosed using ultrasound image is discussed in Section 2.1. Section 2.2 discusses some
background information on Doppler ultrasound and spectral imaging modes. The Section 2.3
continues by discussing visualization tools such as VTK and VES which are useful in spectrum
and tablet user interface rendering. In the last part of the chapter, background theory on user
interface evaluation techniques and principles is discussed in detail.
2.1 Umbilical Artery
Z Umbilical Artery: is a paired artery that is located in the abdominal and pelvic areas. It
transports deoxyginated blood from the fetus to the placenta in the umbilical cord [4].
There are three vessels that are located in the umbilical cord, two arteries and a vein. The
blood that flows through the umbilical arteries arises from the fetus and enters the placenta.
The blood that flow through the arteries is affected by the fetal heart contraction and the status
of the placenta. The umbilical vein is used to transport the blood that is returning from the
placenta to the fetus [1].
7

8 CHAPTER 2. BACKGROUND
Figure 2.1: Systole (Sys) and diastole (D) are identified in green Note that diastole is less at 20weeks (yellow ellipse) than at 36 weeks (red ellipse). [22]
How is the Umbilical artery waveform measured?
The umbilical artery waveform is estimated by measuring the blood flow velocity at peak sys-
tole (maximal contraction of the heart) and peak diastole (maximal relaxation of the heart). The
Resistance Index is computed from these values. The Resistance Index (RI) is computed by mea-
suring the peak of systole and then dividing it by the sum of measurements at peak systole and
diastole. RI= systole/(systole+diastole)
The peak blood flow at diastole in later pregnancy is higher than in early pregnancy. As conse-
quence of this, at late trimesters, the quantity of blood flowing in the umbilical artery increases
during diastole. In other words the placenta is less resistant to blood flow, therefore provides
more blood to flow from the fetus to the placenta [22]. Figure 2.1 illustrates Doppler wave forms
at 20 and 36 weeks of pregnancy.
2.2 Doppler Ultrasound
In ultrasound scanners, a series of pulses is transmitted to detect the movement of blood. Echoes
from stationary tissue doesn’t change from pulse to pulse while echoes from moving scatterers
exhibit slight differences in the time of the received signal [21]. These differences can be mea-
sured as a direct time difference or in terms of a phase shift from which the Doppler frequency
is obtained. Then, the phase differences can be processed to produce either a color flow display

2.2. DOPPLER ULTRASOUND 9
or a Doppler sonogram. The Doppler frequency obtained from a blood flow of velocity v can be
given by,
fdoppl er = ftr ansmi t ted − fr eci ved = 2 fo v cos(θ)
c(2.1)
where fo is the transmission frequency, θ is beam/flow angle and c is speed of sound in tissue.
Doppler ultrasound measures the movement of the scatterers through the beam using the
phase angle change in the received signal. The velocity the blood can be measured from the re-
sulting Doppler frequency if the beam/flow angle is known. As equation 2.1 shows, The Doppler
frequency is dependent on blood velocity and ultrasound frequency. The choice of transmis-
sion frequency is a compromise between better sensitivity to blood flow and better penetration.
As the frequency increase, Doppler sensitivity increases but penetration depth decreases. The
Doppler frequency also increases as the angle of θ between the beam and the direction of flow
becomes smaller (as the Doppler beam becomes more aligned with the flow direction).
There are two widely known methods of transmission in Doppler ultrasound, namely con-
tinuous wave Doppler and pulsed wave Doppler.
Continuous wave Doppler: In this method, an US wave is continuously transmitted in to the
tissue with one transducer while the back scattered signal is received by another transducer.
Since the signals are continuously transmitted and received, there is no range resolution, no
limit on the maximum velocity. Due to smaller transducer used, there is poor sensitivity than
pulsed wave Doppler [15].
Pulsed wave Doppler: In this case, a short pulse of low duty cycle is transmitted at a constant
pulse repetition frequency (PRF). After a pulse is transmitted, the transducer shifts to receiving
mode and the received signal is sampled at a constant interval. As a result of this range reso-
lution is possible but there is a limit on the maximum velocity and also there is possible range
ambiguity [15] .
2.2.1 Aliasing
Aliasing is ambiguity in the Doppler signal that occurs when the blood velocity and beam/flow
angle being measured combine to give a Doppler frequency value greater than half of the pulse
repetition frequency. When pulses are transmitted at a given sampling frequency, the maximum

10 CHAPTER 2. BACKGROUND
Figure 2.2: This figure illustrates the effect of the Doppler angle in the sonogram. (A) higher-frequency Doppler signal is obtained if the beam is aligned more to the direction of flow. Inthe diagram, beam (A) is more aligned than (B) and produces higher-frequency Doppler signals.The beam/flow angle at (C) is almost 90° and there is a very poor Doppler signal. The flow at (D)is away from the beam and there is a negative signal [21]
.

2.2. DOPPLER ULTRASOUND 11
Doppler frequency that can be measured unambiguously is half the pulse repetition frequency.
fd < fs
2
This is the requirement of the Shannon sampling theorem for error free reconstruction of a sam-
pled signal and often referred to as the Nyquist limit on the sampling frequency [15]. Low pulse
repetition frequencies are used to examine low velocities. Aliasing will occur if low pulse repe-
tition frequencies or velocity scales are used and high velocities are encountered. On the other
hand if a high pulse repetition frequency is used to examine high velocities, low velocities may
not be identified [21]. Therefore, the setting of the pulse repetition frequency is a trade-off.
2.2.2 Ultrasound flow modes
The main ultrasound flow modes are spectral Doppler, color flow and amplitude flow.
Spectral or Pulsed wave Doppler: is used to provide a sonogram of the artery or vein under
investigation. The sonogram provides the distribution of velocities in the sample volume and
the absolute velocities can be measured if an accurate angle correction is made [21]. During 2D
freeze (B-mode image and color image are frozen), then best resolution of the sonogram occurs
because all the time is employed for spectral Doppler.
Factors affecting Spectral or Pulsed wave Doppler:The main factors that affect affect the ap-
pearance of the sonogram includes:
• Power and gain: Power and gain should be set so that clear signals are obtained.
• Velocity scale/pulse repetition frequency: For low velocity flows low pulse repetition fre-
quencies should be used. But if the PRF is set too low, aliasing may occur.
• Sample volume: A large gate may include signals from adjacent vessels, so the size of the
sample volume should be set appropriately.
2.2.3 Smoothing
In spectral processing, it may be sometimes necessary to apply smoothing (filtering) to achieve
a continuous and smooth variation of spectrum.
12 CHAPTER 2. BACKGROUND
In smoothing, the data points of a signal are modified so that individual points that are
higher than the immediately adjacent points due to noise are reduced, and points that are lower
than the adjacent points are increased. This will result in a smoother signal [8]. The simplest
smoothing algorithm is the rectangular or unweighted sliding-average smooth. In this algo-
rithm, it simply replaces each point in the signal with the average of m adjacent points, where
m is a positive integer known as the smooth width. For a 3-point smooth (m = 3) as an example :
x j =z j−1 + z j + z j+1
3
for j = 2 to n-1, where x j the j th point in the smoothed signal, z j the j th point in the original
signal, and n is the total number of points in the signal.
One important advantage of smoothing is its ability to reduce noise level in the spectrum. If
the noise in the data is white noise and its standard deviation is s, then the standard deviation
of the noise remaining in the signal after an unweighted sliding-average smooth will be [8],
spm
If windowing function weighted smoothing is applied, the noise in the signal also reduces ac-
cordingly. Smoothing operations can also be applied over and over on the same signal in other
words, a previously-smoothed signal can be smoothed again.
2.3 Spectrum and Tablet User Interface Rendering Tools
2.3.1 Visualization Toolkit (VTK)
Z The Visualization Toolkit (VTK) is an open-source, freely available software system for 3D
computer graphics, image processing and visualization. In addition to 3D imaging, it helps to
visualize 2D data such as geometry, images, and text . [13].
It supports a C++ class library and several interpreted interface layers including Tcl/Tk, Java,
and Python. In addition, VTK allows the user to mix 2D imaging / 3D graphics by integrating

2.3. SPECTRUM AND TABLET USER INTERFACE RENDERING TOOLS 13
imaging algorithms. It also supports a wide variety of visualization algorithms such as: tex-
ture, scalar, tensor vector and volumetric methods and advanced modeling techniques such
as: implicit modeling, cutting, mesh smoothing, contouring, polygon reduction and Delaunay
triangulation. It is cross-platform and runs on Mac, Unix, Linux and Windows platforms. It
has a broad visualization framework, supports parallel processing, and integrates with various
databases on GUI toolkits such as Tk and Qt.
vtkExtractVOI
vtkExtractVOI is a filter that selects a portion of an input structured points data set, or sub-
samples an input dataset [13]. The selected portion of region is called the Volume Of Interest,
or VOI. The output of this filter is a structured points data set. The filter treats input data of any
topological dimension such as point, line, image, or volume and can generate output data of any
topological dimension. In order to use this filter, it is needed to set the VOI limits which are i-j-k
min/max indices that specify a rectangular region in the data and these indices can be 0-offset.
It is possible also to specify a sampling rate to sub-sample the data. The main applications of
extractVOI are to sub-sample large volumes to reduce data size, extract a slice from a volume for
image processing or extracting regions of a volume with interesting data.
vtkLookupTable
vtkLookupTable is an object that is used by mapper objects to map scalar values into rgba (red-
green-blue-alpha transparency) color specification, or rgba into scalar values. By direct inser-
tion of color values, or by specifying hue, saturation, value, and alpha range and generating a
table, the color table can be created [13].
The setting of the IndexedLookup affects the behavior of this class. When IndexedLookup
is set to true, vtkLookupTable enters a mode for representing categorical color maps. in other
words by setting IndexedLookup to true, it is possible to indicate that the annotated values are
the only valid values for which entries in the color table should be returned. By taking the mod-
ulus of the color index in the list of annotations, the colors in the lookup Table are assigned to
annotated values. IndexedLookup affects the behavior of GetIndex, which in turn has effect on
the way MapScalarsThroughTable2 behaves. MapScalarsThroughTable2 will search for scalar

14 CHAPTER 2. BACKGROUND
values in AnnotatedValues and use the resulting index to determine the color when Indexed-
Lookup is set to true.
vtkAxis
vtkAxis is very important for rendering the axis properties such as axes label, tick marks and tick
labels. vtkAxis works in screen coordinates. The range of values in the axes between a Minimum
and Maximum is measured by the tick marks and labels. The Minimum and Maximum values
of vtkAxis do not increase beyond the MinimumLimit and MaximumLimit values, respectively
[13]. vtkPlotPoints is vtkAxis instances that determines scaling of the raw data for presentation.
The axis Minimum, Maximum, and Limit values can be stored both in not scaled and with log-
arithmic scale applied.
This class includes member functions such as SetPosition (set the position of the axis (LEFT,
BOTTOM, RIGHT, TOP, PARALLEL), SetPoint1 (set point 1 of the axis (in pixels), this is usually
the origin), SetPoint2(Set point 2 of the axis (in pixels), this is usually the terminus), SetNum-
berOfTicks (Set the number of tick marks for this axis and the default value is -1, which leads to
automatic calculation of nicely spaced tick marks), SetRange (Set the logical range of the axis,
in plot coordinates), Update (Update the geometry of the axis and it takes care of setting up the
tick mark locations. It Should be called by the scene before rendering.),AutoScale (this func-
tion is used to autoscale the axes after setting the minimum and maximum values. It will cause
the axes to select the best numbers that enclose the minimum and maximum values, and also
to select an appropriate number of tick marks), SetTickPositions(it sets the tick positions with
respect to the plot coordinates), SetTickLabels(it sets the tick labels for the axis.)
vtkImageFourierFilter
vtkImageFourierFilter is a class of filters that have the ability to process complex numbers. This
class has various ways and techniques for implementing Fast Fourier Transform (FFT) [13].
some of the methods for executing FFT includes ExecuteFft(Execute Fast fourier transform),
ExecuteRfft(Execute Reverse fast fourier transform), ExecuteFftStep2, ExecuteFftStepN, Execut-
eFftForwardBackward.
vtkImageFourierFilter consists of two main classes, these are vtkImageFFT(Fast Fourier Trans-

2.3. SPECTRUM AND TABLET USER INTERFACE RENDERING TOOLS 15
form) and vtkImageRFFT(Reverse Fast Fourier Transform) [13]. vtkImageFFT performs a fast
Fourier transform and the input to this filter can be real or complex data, but the output is al-
ways complex. This filter is fastest for images that have power of two sizes. It uses a butterfly
diagram for each prime factor of the dimension. It makes images with prime number dimen-
sions much slower to compute, as a result multi-dimensional FFT’s are decomposed so that
each axis executes serially. vtkImageRFFT(Reverse Fast Fourier Transform): performs the re-
verse fast Fourier transform. The input to this filter can be real or complex data, but the output
is always complex, which is the same as vtkImageRFFT. In most cases the RFFT will produce an
image with imaginary values that are all zero’s. In this case, this imaginary components can be
removed using vtkImageExtractComponents and only real parts of the image are kept.
2.3.2 VES/Kiwi
VES is the VTK OpenGL ES Rendering Toolkit. It has different C++ rendering library for mo-
bile devices using OpenGL ES 2.0. Most visualization capabilities on mobile application is per-
formed by integrating VES with the Visualization Toolkit (VTK) [12].
VES is an open-source framework that highly helps mobile visualizations on mobile hard-
ware. There are two main VES library, these are VES and Kiwi. The VES library supports render-
ing capabilities and scene management by using OpenGL ES 2.0. It uses OpenGL ES 2.0 as the
underlying rendering API, which is part of OpenGL for desktop and replaces the fixed function
transformations and fragment pipeline of OpenGL 1.x. The VES library provides a high-level,
object-oriented API for the application development to reduce time and effort to build visual-
ization applications where as OpenGL does not provide a high-level, object-oriented API for the
application development. VES library have different components such as a scene graph (a data
structure that provides spatial and logical relationships between different entities of a scene),
rendering Pipeline (update, cull, render pass algorithm for rendering), programmable Pipeline
and Geometry Data (data structure for defining geometry for the purpose of rendering).
Kiwi Platform supports a base for developing mobile applications that integrate VTK I/O, Fil-
tering, and analysis with VES rendering. Kiwi library which is is built on top of VES and VTK pro-
vides an application framework. KiwiViewer is an application that is built on the Kiwi platform
that provides basic geometry viewer capabilities on iOS and Android platforms. KiwiViewer

16 CHAPTER 2. BACKGROUND
provides a variety of file formats, including obj, stl, ply, and vtk [6].
2.3.3 Circular buffer
A circular buffer is a memory allocation process where memory is reused (reclaimed) when an
index, incremented modulo the buffer size, writes over a previously used location [3]. When
separate indices are used for inserting and removing data, it makes a bounded queue. The queue
can be safely shared between processes without further synchronization so long as one process
enqueues data and the other dequeues it.
A circular buffer with n elements is usually used to implement a queue with n −1 elements
and there is always one empty element in the buffer. The fact that there is one empty element
in the buffer is very important, if it wasn’t then it becomes difficult to distinguish between a full
and empty queue and the read and write pointers would be identical in both cases.
2.4 Tablet User Interface Evaluation
Z Evaluation is a systematic determination of a subject’s merit, worth and significance, using
criteria that is governed by a set of standards. It can aid an organization to assess any aim,
realisable concept/proposal, or any alternative, to help in decision-making; or to ascertain the
degree of achievement or value in regard to the aim and objectives and results of any such action
that has been completed or finished [25].
Before one designs and develops a system such as a user interface, one should find out how
well the current user interface is working (if there is any), set measurable usability goals, and
learn as much as possible about the users and their tasks.
In addition, evaluation of a user interface after development is essential to measure to what
extent the usability goals are achieved and how much is the usability of the interface after de-
velopment.
2.4. TABLET USER INTERFACE EVALUATION 17
2.4.1 Usability basics
Z Usability is a process by which users use a product to achieve their goals and includes their
degree of satisfaction with the process [9].
Usability measures the quality of a user’s experience when interacting with a system such as
websites, software applications, mobile technologies and any user-operated devices.
Types of Evaluations: The methods used to asses the usability of a system is divided in to
two types and these are [10].
1. Usability Evaluations: do not include users working with the product
2. Usability Tests: mainly focus on users working with the product
1 Usability Evaluations
Usability Evaluation methods involve a considerable judgement on the part of the evaluators or
testers and usually do not include representative users. Evaluations such as surveys/question-
naires, expert reviews, heuristic evaluations, observational evaluations, guideline based reviews,
etc can be considered as usability evaluation methods.
It is possible to conduct a usability evaluation as soon as the prototype is developed. Almost
all usability professionals first do a usability evaluation and then follow it up with a usability
test. They use the results obtained from the evaluation to develop hypotheses about what could
be serious problems and then develop the usability test around those hypotheses.
2 Usability Tests
This type of evaluation includes test participants and it is the only way to know if the sys-
tem(prototype) actually have problems that keep people from having a successful and satisfying
experience. It is mostly performed by having one or more users actually struggle with some as-
pect of the system. A usability test gives a chance for the system to allow users to succeed or
succeed with difficulty, or totally fail.
What is a Heuristic Evaluation?

18 CHAPTER 2. BACKGROUND
In a heuristic evaluation, usability experts review the system (user interface) and compare it
against accepted heuristics (usability principles) and the analysis results in a list of potential us-
ability issues [10]. The issues identified in a heuristic evaluation are different than those found
in a usability test, although the heuristics relate to criteria that affect the system (prototype) us-
ability. Therefore a heuristic evaluation should not replace usability testing.
Heuristic evaluation have various advantages such as, it can provide some quick and relatively
inexpensive means of feedback to the designers, assigning the correct heuristic can help sug-
gest the best corrective measures to the designers, feedback can be obtained early in the design
process, it can be used together with other usability testing methodologies, usability testing can
be conducted to further examine potential issues. Heuristic evaluation disadvantages includes,
it requires knowledge and experience to apply the heuristics effectively, it is expensive to find
trained usability experts, multiple experts should be used and aggregate their results, and the
evaluation can identify fewer major issues and more minor issues.
Usability Factors: Usability is not a single, one-dimensional property of a system(prototype);
there are various factors that affect usability and these includes,Intuitive design(understanding
of the system design), Ease of learning(how fast a user can accomplish basic tasks), Efficiency
of use (how fast an experienced user can accomplish tasks), Memorability (is about if a user can
remember enough to use the system effectively in future), Error frequency and severity(refers to
the frequency of errors made by the users while using the system, how serious the errors are, and
how users recover from the errors), Subjective satisfaction (the overall users satisfaction in using
the system). Therefore the main key to develop highly usable prototype or any usable system is
employing user-centred design which is mentioned on section 2.4.8.
Measuring Usability Goals: It is needed to create measurable usability goals in order to de-
termine the systems usability. The main usability goals include time, accuracy, overall success,
and satisfaction measures [10].
Time: Set a goal for the overall time the user will need to carry out a task on the system.
One can also break that down into separate goals for time to get to the application, use the
application, recover from an error.
Accuracy: Set a goal for the accuracy with which the user carries out the task. One can also
break it down into separate goals for the number of unproductive searches, frequency of errors
2.4. TABLET USER INTERFACE EVALUATION 19
in using the system or application and misinterpretation of information.
Success: Setting a goal to measure users success with the system is another method for mea-
suring usability goals. Success can be such as identifying an application new users will go to for
help if they need it, find the help they need there, and get back to their original task within 2
minutes, set a goal that repeat users be able to successfully complete a task without using the
help document or means.
Satisfaction: Set a goal that users are happy with their experience in using the system. One
can also set satisfaction goals for navigation, search, Content detail and language.
2.4.2 Learning about the end users
To design a user interface that satisfies the needs of users, one have to understand about the
end users. When designing a user interface, one cannot rely on assumptions about the users
and their behaviour. One needs to verify or challenge those assumptions. To learn about users’
realities, one need to get out and meet the users, work with them, and involve them in the de-
velopment so that one will understand: Their level of knowledge about the subject matter, How
they think about, group, and organize the needed information, How they work with information.
There are different techniques that that can be used to gather information about the end
users and identify their needs. The main techniques are [9, 10, 30]:
1. Usability testing: typically involves asking users to accomplish some tasks while the tester
observe actual behaviours and listen to user’s comments.The goal is to identify any usabil-
ity problems, collect quantitative data on participants’ performance such as time on task,
error rates and determine participant’s satisfaction with the product.
According to Jakob Nielsen [14], elaborate usability tests are a waste of resources; the best
results come from testing no more than 5 users and running as many small tests as you
can afford.In earlier research, Tom Landauer and Jakob Nielsen showed that the number
of usability problems found in a usability test with n users is:
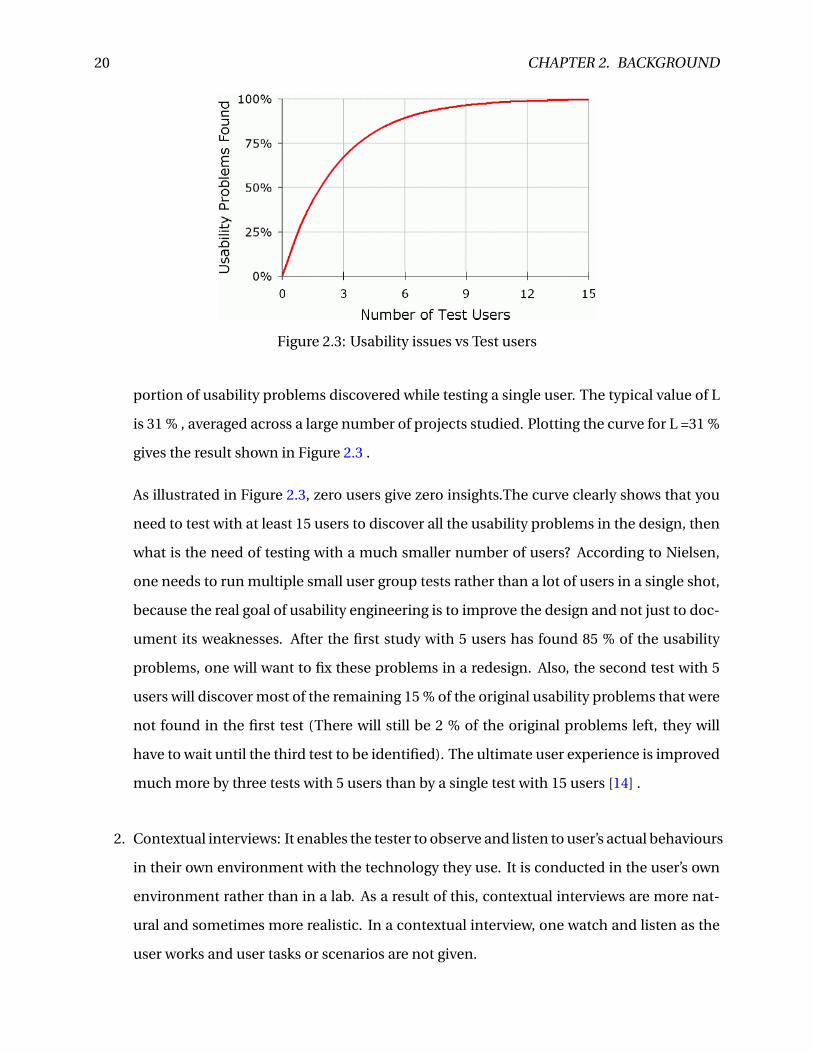
N (1− (1−L)n)
where N stands for the total number of usability problems in the design and L is the pro-
20 CHAPTER 2. BACKGROUND
Figure 2.3: Usability issues vs Test users
portion of usability problems discovered while testing a single user. The typical value of L
is 31 % , averaged across a large number of projects studied. Plotting the curve for L =31 %
gives the result shown in Figure 2.3 .
As illustrated in Figure 2.3, zero users give zero insights.The curve clearly shows that you
need to test with at least 15 users to discover all the usability problems in the design, then
what is the need of testing with a much smaller number of users? According to Nielsen,
one needs to run multiple small user group tests rather than a lot of users in a single shot,
because the real goal of usability engineering is to improve the design and not just to doc-
ument its weaknesses. After the first study with 5 users has found 85 % of the usability
problems, one will want to fix these problems in a redesign. Also, the second test with 5
users will discover most of the remaining 15 % of the original usability problems that were
not found in the first test (There will still be 2 % of the original problems left, they will
have to wait until the third test to be identified). The ultimate user experience is improved
much more by three tests with 5 users than by a single test with 15 users [14] .
2. Contextual interviews: It enables the tester to observe and listen to user’s actual behaviours
in their own environment with the technology they use. It is conducted in the user’s own
environment rather than in a lab. As a result of this, contextual interviews are more nat-
ural and sometimes more realistic. In a contextual interview, one watch and listen as the
user works and user tasks or scenarios are not given.

2.4. TABLET USER INTERFACE EVALUATION 21
3. Individual interviews: are performed with one user at a time and are a good method for
self-reported attitudes and experiences. In individual interviews, it is a talk with one user
for 30 minutes to an hour face to face, by telephone, with an instant messaging system.
Individual interviews enables a deep understanding of the people who use the system.
One can probe their attitudes, beliefs, desires, and experiences and it is possible to rate or
rank choices for system content.
4. Focus groups: It involves small group discussions lead by trained facilitators. It mostly
involves eight to 12 people in the same place.
2.4.3 Task analysis
A task analysis is a method that helps to complement what one have learned about the end
users [10]. It uncovers the users’ goals, what they want to do on the system and how to work
with the system. It can also help to show the specific task users must do to meet their goals
and what steps they take to accomplish those tasks. It helps to understand tasks that the system
must support, determine appropriate system’s content scope, refine or re-define the systems
navigation.
2.4.4 Personas
A persona is a written representation of the system’s intended users description of the goals,
expectations and values of the intended users of the system [10]. Personas do not represent all
the users or address all needs of the system . They simply focus on the major needs of the most
important user groups. Personas can inform the systems functionality, help uncover gaps, or
highlight new opportunities. Persona can represents a major user group for the system, gives a
clear picture of the user’s expectations and how they’re likely to use the system, describes real
people with backgrounds, goals, and values etc.
2.4.5 Scenarios
Scenarios are questions or tasks that users come with the system and the system should fulfil
them [10]. It is very fundamental both for designing user interface and for usability testing and
22 CHAPTER 2. BACKGROUND
it may include specific user, major user group or previously defined persona with a specific goal.
Types of Scenarios
Goal- or Task-Based Scenarios: It deals with what the user needs to accomplish and it doesn’t
provide any help or information that enables the user to complete the scenario. when this type
of scenario is given to users during usability testing, it gives them a reason to go to the system
and how they would use the system to accomplish the goal.
Elaborated Scenarios: It presents user story details and these details helps the developer a
good understanding of the user and user’s behaviour in the development of the system. Based
on this, the developer is more likely to develop content, functionality, and system behaviour
that users find comfortable and easy to work with.
Full Scale Task Scenarios: This type of scenarios include the steps to accomplish the task
and it includes all the steps that a specific user currently takes to accomplish the task or it can
describe the steps one plan to set up for users in the system. It lays out the steps from the user’s
point of view rather than from the systems point of view and it explains how the system supports
the goal-oriented scenarios that one started with.
2.4.6 Prototypes
A prototype is a draft version of the system and it should be build at any time but ideally one
should create them as early as possible. Prototyping allow you to change a product early in
the development process than to make change after one have developed the product and it
also allows to gather feedback from users while you are still planning and designing the sys-
tem(prototype). Nielsen, states that the biggest improvements in user experience come from
gathering usability data as early as possible. He estimates that it’s 100 times cheaper to make
changes before any code has been written than to wait until after the implementation is com-
plete [14].
2.4. TABLET USER INTERFACE EVALUATION 23
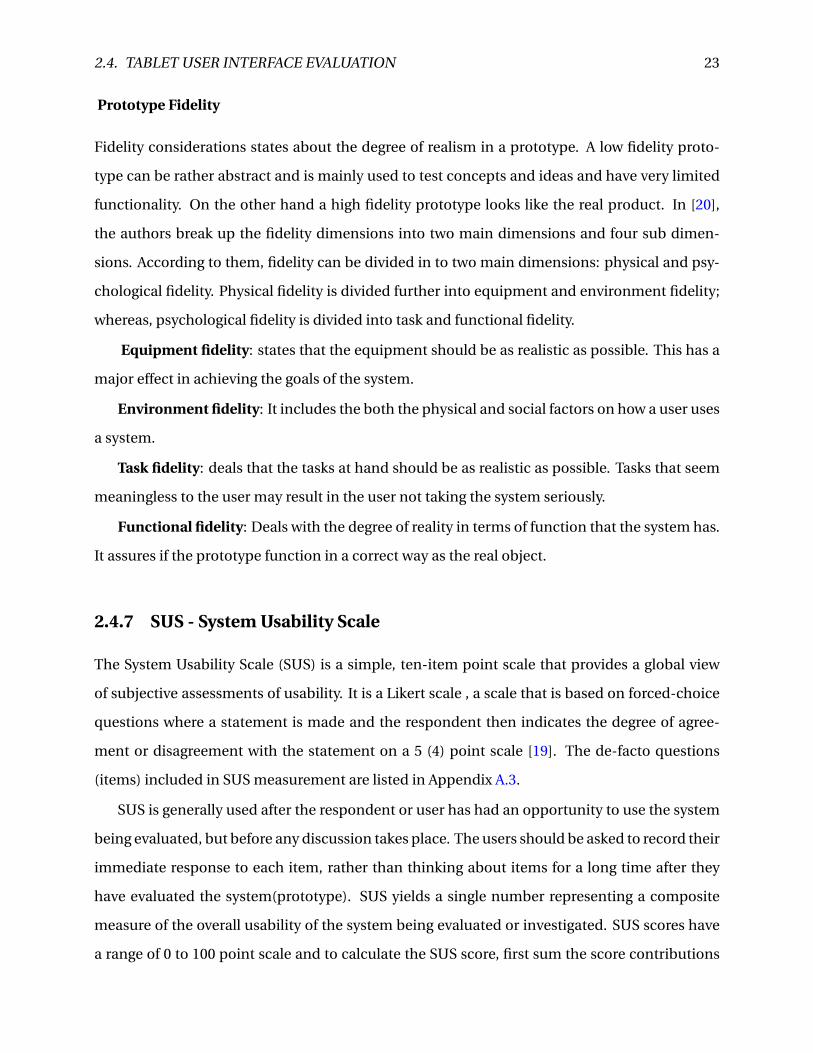
Prototype Fidelity
Fidelity considerations states about the degree of realism in a prototype. A low fidelity proto-
type can be rather abstract and is mainly used to test concepts and ideas and have very limited
functionality. On the other hand a high fidelity prototype looks like the real product. In [20],
the authors break up the fidelity dimensions into two main dimensions and four sub dimen-
sions. According to them, fidelity can be divided in to two main dimensions: physical and psy-
chological fidelity. Physical fidelity is divided further into equipment and environment fidelity;
whereas, psychological fidelity is divided into task and functional fidelity.
Equipment fidelity: states that the equipment should be as realistic as possible. This has a
major effect in achieving the goals of the system.
Environment fidelity: It includes the both the physical and social factors on how a user uses
a system.
Task fidelity: deals that the tasks at hand should be as realistic as possible. Tasks that seem
meaningless to the user may result in the user not taking the system seriously.
Functional fidelity: Deals with the degree of reality in terms of function that the system has.
It assures if the prototype function in a correct way as the real object.
2.4.7 SUS - System Usability Scale
The System Usability Scale (SUS) is a simple, ten-item point scale that provides a global view
of subjective assessments of usability. It is a Likert scale , a scale that is based on forced-choice
questions where a statement is made and the respondent then indicates the degree of agree-
ment or disagreement with the statement on a 5 (4) point scale [19]. The de-facto questions
(items) included in SUS measurement are listed in Appendix A.3.
SUS is generally used after the respondent or user has had an opportunity to use the system
being evaluated, but before any discussion takes place. The users should be asked to record their
immediate response to each item, rather than thinking about items for a long time after they
have evaluated the system(prototype). SUS yields a single number representing a composite
measure of the overall usability of the system being evaluated or investigated. SUS scores have
a range of 0 to 100 point scale and to calculate the SUS score, first sum the score contributions

24 CHAPTER 2. BACKGROUND
from each item. Each item’s score contribution will range from 0 to 4. For items 1, 3, 5, 7 and 9,
the score contribution is the scale position minus 1. For items 2, 4, 6, 8 and 10, the contribution
is 5 minus the scale position. Multiply the sum of the scores by 2.5 to obtain the overall value of
SU scale [19].
For usability and Learnability, it is good to follow the suggestions of Lewis and Sauro [27],
and calculate usability (sum of the items 1, 2, 3, 5, 6, 7, 8, and 9) and learnability (sum of the
items 4 and 10) in addition to the total score of SUS. To make the usability and learnability
scores comparable with the overall SUS value (ranging from 0 to 100), the summed score was
multiplied by 3.125 and 12.5, respectively.
2.4.8 User centered design
User-Centred Design (UCD) is a design methodology and process that focuses on the needs,
preferences and limitations of end users. The system that is going to be developed should center
the end users.
Importance of user centred design: By focusing on the end user, it is possible to satisfy
the user with a more efficient and user-friendly experience, increase loyalty, establish a more
relevant and valuable system, create a system that supports the user needs.
UCD sometimes called usability engineering, is a structured approach to producing a system
that involves users throughout the entire design process to create a system that works properly
and satisfies the users [10]. UCD involves the following techniques:
• defining user goals and objectives
• gathering requirements
• evaluating design alternatives, building and testing prototypes
• analysing usability problems, testing the system with users and proposing solutions to
problems
2.4. TABLET USER INTERFACE EVALUATION 25
2.4.9 The human machine interaction
There are different standards that are used as guideline or specification for any particular pur-
pose. Most of the Human computer interaction ( HCI) standards provide a detailed specification
of the nature of the user interface [16]. Although standard user interfaces provide the benefit of
consistency, they become out of date as technology changes, and are usually only appropriate
for limited types of users and tasks [28]. Therefore almost all the international standards for the
Human computer interaction focus on principles that produce an interface which meets user
and task needs. The Human computer interaction ( HCI) standards are mainly divided in to
two. The first approach is called "top-down" approach, that is concerned with usability as main
objective. It emphasizes mainly on the ability to use of a product for the required purpose. The
second approach is known as a product-oriented "bottom-up" view and it deals with the user
friendliness aspect of the the product. In other words it deals with the feature of the interface
that makes it easier to use. The human factors affect the quality view and these standards are
applied in the context of design and quality as an objective. The product oriented approach is
mainly concerned with the design of specific attributes, and is mostly related to the needs of the
interface designer and the role of usability in software engineering [18].
First approach
As it is mentioned above, the first view is concerned with the usability as quality objective. In ISO
9241-11 [5], usability is defined as the extent to which a product can be used by specified users
to achieve specified goals with effectiveness, efficiency and satisfaction in a specified context of
use. These kinds of standards can support and in cooperate the standards such as, specification
of overall quality and usability requirements and evaluation against these requirements (ISO
9241-11 and ISO/IEC-14598-1), incorporation of usability into a quality system (ISO 9241-11),
incorporation of usability into the design process (ISO/IEC 13407).
Second approach
The second approach is the product-oriented standards. In ISO/IEC 9126 [5], usability is de-
fined as a set of attributes of software which bear on the effort needed for use and on the indi-

26 CHAPTER 2. BACKGROUND
vidual assessment of such use by a stated or implied set of users. There are different standards
that deals with usability when it come to attributes that must be designed in to the software
product to make it user friendly. Some of these standards are: ISO 9241 (Ergonomics require-
ments), ISO/IEC 10741-1 (dialogue interaction), ISO/IEC 9126 (Software product evaluation).
These standards can be used in the following ways, to specify details of the appearance and be-
haviour of the user interface, to provide detailed guidance on the design of user interfaces, to
provide criteria for the evaluation of user interfaces. The nature of the user, task and environ-
ment affects the attributes that a product requires for usability. A product has a capability to be
used for certain context, but it has no any fundamental usability.
Usability as High Level Quality Objectives(First approach)
• ISO 9241-11 Guidance on usability (1998)
ISO 9241-11 standard, is part of the ISO 9241 series, provides the definition of usability that is
used in further related ergonomic standards [5]. Usability according to this standard is defined
as the extent to which a product can be used by specified users to achieve specified goals with
effectiveness, efficiency and satisfaction in a specified context of use. When evaluating usability
in terms of measures of user performance and satisfaction, ISO 9241-11 provides guidance on
how to describe the context of use of the product and the measures of usability in more explicit
and described way. The standard includes an explanation of how the usability of a product can
be specified and evaluated. It also explains how any component of a system affects the quality
of the whole system in use by measuring user performance and satisfaction. User performance
is measured by the extent to which the intended goals of use are achieved thereby showing its
effectiveness and the different resources such as time, money or mental effort that have to be
depleted to achieve the intended goals or efficiency. Satisfaction is measured by the extent to
which the user finds the product’s use acceptable [5].
ISO 9241-11 is concerned with the level of usability that is achieved that depends on a partic-
ular circumstances on a particular product that is used. It also emphasis that usability is depen-
dent on the context of use. The context of use includes mainly of the tasks, users, the physical
and organizational environments which may all influence the usability of a product and equip-
ment (hardware, software and materials)[16]. The Figure 2.4 illustrates the this relationship on
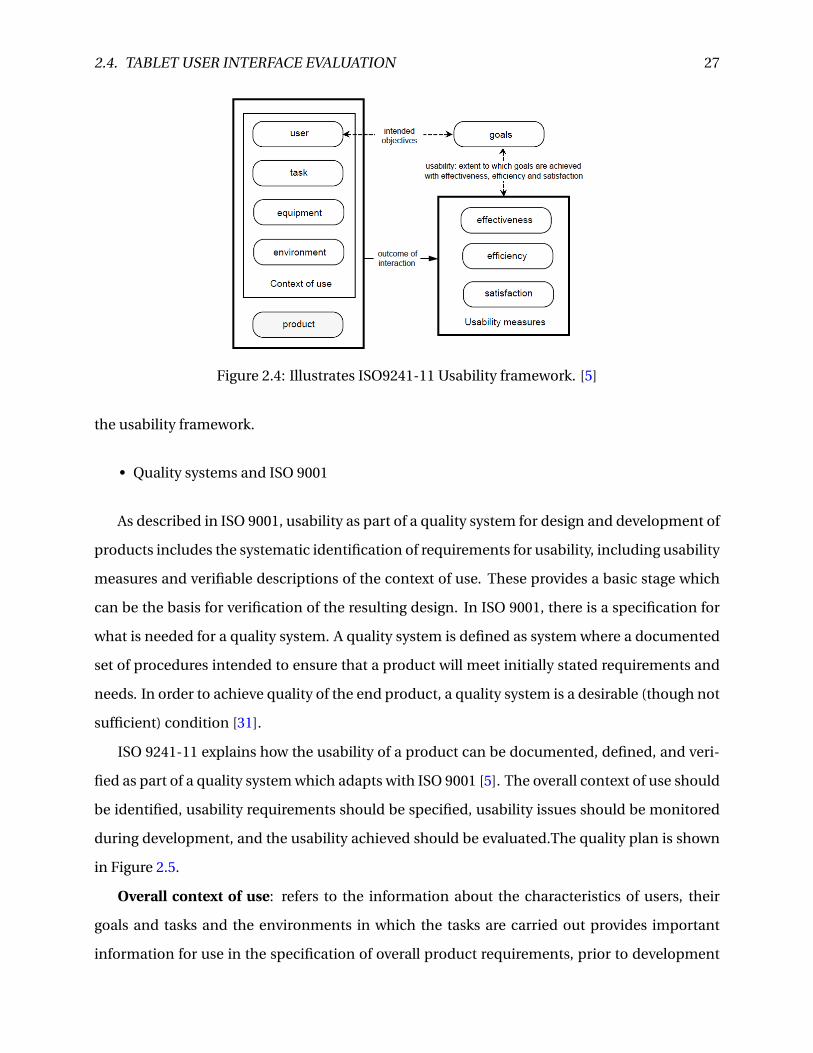
2.4. TABLET USER INTERFACE EVALUATION 27
Figure 2.4: Illustrates ISO9241-11 Usability framework. [5]
the usability framework.
• Quality systems and ISO 9001
As described in ISO 9001, usability as part of a quality system for design and development of
products includes the systematic identification of requirements for usability, including usability
measures and verifiable descriptions of the context of use. These provides a basic stage which
can be the basis for verification of the resulting design. In ISO 9001, there is a specification for
what is needed for a quality system. A quality system is defined as system where a documented
set of procedures intended to ensure that a product will meet initially stated requirements and
needs. In order to achieve quality of the end product, a quality system is a desirable (though not
sufficient) condition [31].
ISO 9241-11 explains how the usability of a product can be documented, defined, and veri-
fied as part of a quality system which adapts with ISO 9001 [5]. The overall context of use should
be identified, usability requirements should be specified, usability issues should be monitored
during development, and the usability achieved should be evaluated.The quality plan is shown
in Figure 2.5.
Overall context of use: refers to the information about the characteristics of users, their
goals and tasks and the environments in which the tasks are carried out provides important
information for use in the specification of overall product requirements, prior to development

28 CHAPTER 2. BACKGROUND
Figure 2.5: Illustrates Quality plan. [16]
of specific usability requirements [16].
Usability requirements: Prior to development of a custom system, the purchasing organiza-
tion should specify the usability requirements which the system must meet and against which
acceptance testing may be carried out. Specific contexts in which usability is to be measured
should be identified, measures of effectiveness, efficiency and satisfaction selected, and accep-
tance criteria based on these measures established [16].
Monitor usability: At various stages during the development process the developer should
measure the usability achieved against these targets. This information enables objective deci-
sions to be taken about the need for design changes to enhance usability, and about trade off
which may be appropriate between usability and other requirements [16].
Usability evaluation: The characteristics of the context in which a product is likely to be
used need to be identified. To ensure the validity of test results the users, tasks and environ-
ments used for the evaluation should match the real context of use as closely as possible [16].
• Quality of use
For the purpose of achieving a particular job, ISO 9241-11 introduces the concept of a work

2.4. TABLET USER INTERFACE EVALUATION 29
system, consisting of users, equipment, tasks and a physical and social environment. Measures
of user performance and satisfaction measure the quality of the work system in use. These mea-
sures provide information about the usability of that product in the particular context of use
provided by the rest of the work system when a product is the focus of concern.
ISO 9241-11 defines the quality of a work system in use as: Quality of a work system in use:
the extent to which specified goals can be achieved with effectiveness, efficiency and satisfac-
tion in a specified work system [16].
The difference between usability and the quality of a work system in use is a matter of focus.
When usability is evaluated, the focus is on improving a product while the other components
of the work system (user, task, equipment, and environment) are treated as given. If the main
goal is to improve the quality of the overall work system in use, any part of the work system
may be the subject of design or evaluation. In usability evaluation, it may be appropriate to
consider the amount of user training to be provided, changes in lighting, or re-organization of
the task. In this case the element which is the object of design or evaluation is considered to
be subject to potential variation, while the other elements of the work system are treated as
constant elements.
• Software quality evaluation
ISO 8402 (Quality vocabulary) defines quality as: Quality is defined as the totality of charac-
teristics of an entity that bear on its ability to satisfy stated and implied needs [24]. This defines
quality in terms of the characteristics of a product. To the extent that user needs are well-defined
and common to the intended users. In general it implies that quality is an inherent attribute of
the product. The quality of the product is affected by the needs of the people(users), for example
if different people(users) have different needs, then the quality(characteristics ) of the product
is affected accordingly.
ISO/IEC 14598-1 (Information Technology - Evaluation of Software Products - General guide)
differentiates between the idea of quality as an inherent characteristic of the product, and qual-
ity of use:

30 CHAPTER 2. BACKGROUND
Z Quality of use is defined as the extent to which an entity satisfies stated and implied needs
when used under stated conditions [17].
The main aim of software quality evaluation is to endure that the developed product meets
the needs of the users, in other words it fulfils the quality of use. In ISO 9241-11, the definition
of quality of use is similar to definitions of the quality of work system and usability. The only
difference is that ISO 9241-11 specifically defines the stated conditions in terms of users, goals
and environment and needs in terms of user performance.
The final software quality can be estimated by Internal software quality attributes (such as
the functionality, usability and efficiency attributes defined in ISO/IEC 9126).The specific in-
ternal attributes which are relevant to final quality of use will be determined by the intended
conditions of use and for an interactive product, this will rely on the needs of the final end users
and the tasks.
• Human-centred design
Human-centred approach to design is very important factor to be considered to achieve
objective of usability and quality of use. This is the subject of a standard under development:
ISO 13407 (Human centred design process for interactive systems). This standard is expected
to cover topics including: planning the usability process, incorporating human-centred design
activities in interactive system development processes, and assessing the benefits of human-
centred design.
To achieve the overall objective of usability and quality of use requires a human-centred
approach to design. This is the subject of a standard under development: ISO 13407 (Human
centred design process for interactive systems). This standard is expected to cover topics includ-
ing: planning the usability process, incorporating human-centred design activities in interactive
system development processes, and assessing the benefits of human-centred design [11].
Designing for usability: Product-oriented standards
Usable products may be designed by integrating product features and attributes that are
known to benefit users in particular contexts of use [16]. ISO 9241 provides requirements and
recommendations relating to the attributes of the hardware, software and environment which
contribute to usability, and the ergonomic principles underlying them [16].
Chapter 3
Methods
In this chapter, the methods used in spectrum generation, user interface improvement and user-
interface evaluation are discussed. As introduced in Chapter 1, one of the tasks in this thesis is
spectrum processing and visualization. In Section 3.1, methods used for spectrum computa-
tion, further processing, visualization with corresponding axis and automatic spectrum update
are discussed. Then, Section 3.2 continues by describing methods used for tablet user inter-
face improvement which is done before evaluation. Finally, Section 3.3, discusses in detail the
methods and techniques for tablet user interface evaluation.
3.1 Spectral Processing and Visualization Methods
Obtaining Doppler spectrum from raw data involves various steps. First the magnitude of the
Doppler frequency components must be computed from windowed data using FFT methods.
Then, the computed spectrum must be rendered in a platform that allows real-time updating.
Moreover, the corresponding axes for Doppler spectrum plot must be rendered and updated
accordingly. VTK is an important toolkit that has components that can be used to perform these
operations. Therefore, VTK is the main method that is used to develop most of the programming
code.
31
32 CHAPTER 3. METHODS
3.1.1 VTK: useful classes and methods
VTK has various useful classes. The most important of them that are used as a technique for the
spectrum processing and visualization are discussed in this section.
vtkImageFourierFilter
vtkImageFourierFilter is an important class that contains FFT computation methods such as
ExecuteFft. The inputs and output of the ExecuteFft method are instances of vtkImageComplex
that supports the storage of complex data.
vtkImageComplex class has public attributes for real and imaginary data that enables to
store complex (I/Q) data. For a given number of samples, the I/Q data is selected and is stored
as complex data (with real and imaginary parts) and are used as input for the ExecuteFft (Fast
fourier transform) execution method. The size of the input (stored I/Q data) should be same as
the size of the velocity bins used to compute FFT, if the size is less, then zero padding is applied
on the input until it is equal to the size of the velocity bins used. Once the size of the input com-
plex data and the velocity bins are of equal size, the ExecuteFft function is used to compute the
FFT of the array. ExecuteFft function is public member of the class vtkImageFourierFilter and it
takes I/Q data as an input, and outputs complex data too. This FFT execution method is chosen
because it is faster as compared to other FFT computation methods for instance when it is com-
pared to RFFT (Reverse Fast Fourier Transform) that produces an output with zero imaginary
parts and takes time to extract out the zero imaginary from the real image.
The ExecuteFft method is utilized in my implementation as follows. First the data of a given
packet size (which may vary from time to time) is divided into a sequence of windows of data
depending on the overlap parameter. Then the FFT of the input data is computed in a column
by column (window by window) manner for a given number of samples. That is the FFT for a
given window length is computed at a time and it shifts forward to compute the next FFT until
the whole packet length is covered. This is also one reason why this method is faster in FFT com-
putation. After FFT computation, the magnitude of the output of the FFT is computed, squared
to obtain the power, logarithmic compression is applied before applying further spectrum pro-
cessing.

3.1. SPECTRAL PROCESSING AND VISUALIZATION METHODS 33
vtkLookupTable
A method of gain adjustment is developed using one of the VTK class called vtkLookupTable.
vtkLookupTable is an object that is used by mapper objects to map scalar values into rgba (red-
green-blue-alpha transparency) color specification, or rgba into scalar values [13]. The color
table is created by specifying hue, saturation, value,and generating a table. This class has a pub-
lic member function called SetTableRange that provides a method to set the minimum/maxi-
mum scalar values for scalar mapping. It provides a method for gain adjustment by setting the
minimum scalar values to any gain factor. For scalar values less than minimum range value are
clamped to minimum range value and for scalar values greater than maximum range value are
clamped to maximum range value.
vtkExtractVOI
vtkExtractVOI is a filter that can select and extract out a needed portion of an input vtkImage-
Data. The selected portion of interest is referred to as the Volume Of Interest (VOI) and the out-
put of the extraction is an extracted structured points of vtkImageData. The filter treats three
dimensional input data (the spectrum time length in x direction, double sized velocity bin in
the y direction and 1 in the z direction) and generates an output data of the same dimensions
but of a desired extracted size. In order to use this filter, set the the Volume Of Interest, which is
bounded by the maximum and minimum (x, y, z) coordinates, that specify a rectangular region
in the data. This coordinates specify the time and velocity axes minimum and maximum values
to be extracted where the third dimension, z coordinate is assumed to be a dimension of(1,1).
When the user increases/decreases the velocity or time scale range, this filter will automati-
cally update the VOI and extract the needed spectrum with the corresponding updated velocity
and time scales. Therefore this method of extraction has been implemented to extract a slice
from a volume of the processed spectrum in a real time and interactive mode. Such extraction
allows a user to view a needed VOI in detail depending on the scanning application.

34 CHAPTER 3. METHODS
vtkAxis and Axis Update
vtkAxis provides a method for implementing axes for the velocity time sonogram representation
of the Doppler signal which is represented by time along the horizontal axis and frequency (ve-
locity) along the vertical axis. It includes different member function and data documentation
that helps to implement the axis properties. Some of the member function used to to make the
axes are:
• SetPoint1: is used to set point 1(initial) of the (velocity/time) axis which is the origin.
• SetPoint2: used to set point 2 of the velocity/time axis in pixels, which is the terminal
point.
• SetRange: used to set the range of the axis either velocity or time in plot coordinate
• SetPosition: to set the position of the axis to the left or right(velocity axis), bottom or
top(time axis).
• SetTickPositions: to set the tick positions of the velocity/time axis.
• SetTickLabels: it sets the tick labels for the velocity/time axis.
• Update: it updates the geometry of the velocity/time axis and it takes care of setting up
the tick mark locations and labels.
• AutoScale: it is used to autoscale the axes after setting the minimum and maximum values.
It will cause the velocity and time axes to select the best range that enclose the minimum
and maximum values, and also to select an appropriate number of tick marks automati-
cally.
The axis update method deals with updating the axis properties such as the tick positions,
labels, and the axes scales. There are two separate methods developed for time and velocity axes
update. Velocity axis update controls the velocity scale changes as well as the baseline changes
and the time axis update controls when there is change in time scale only. When these axes
scale is adjusted, then all the axes properties mentioned above must be updated. For the tick
position and label, there is a method in vtk called Reset() that resets the ticks and labels. When
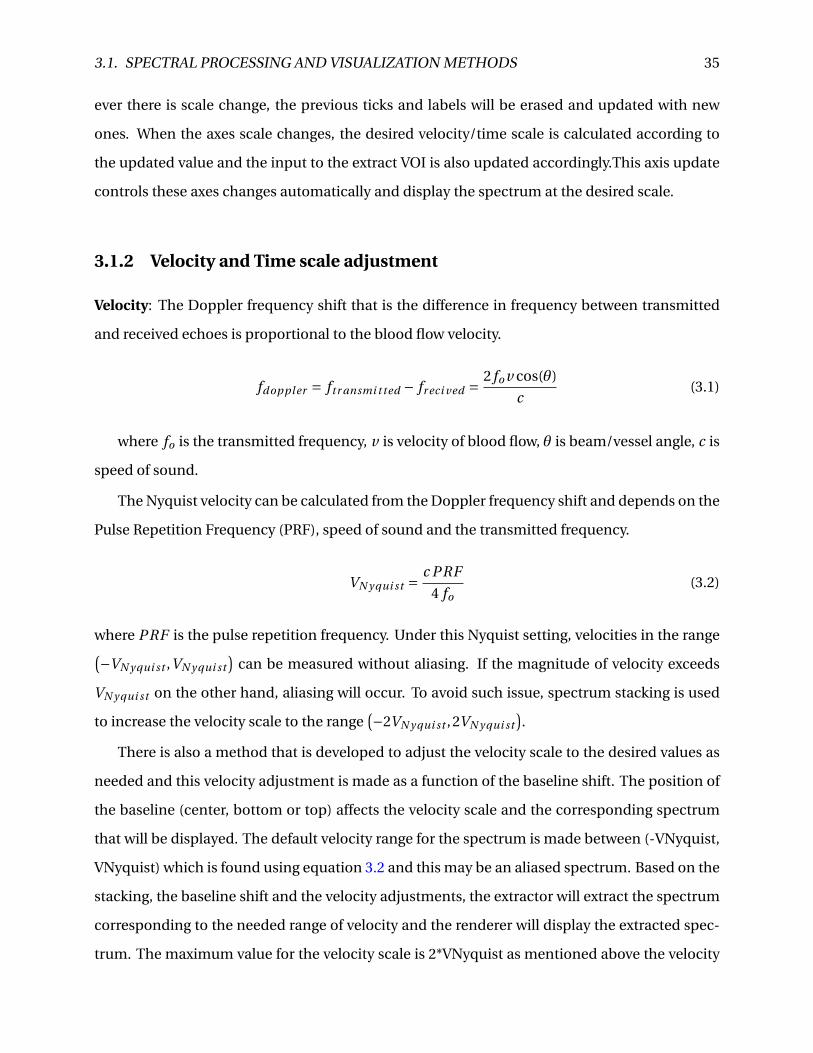
3.1. SPECTRAL PROCESSING AND VISUALIZATION METHODS 35
ever there is scale change, the previous ticks and labels will be erased and updated with new
ones. When the axes scale changes, the desired velocity/time scale is calculated according to
the updated value and the input to the extract VOI is also updated accordingly.This axis update
controls these axes changes automatically and display the spectrum at the desired scale.
3.1.2 Velocity and Time scale adjustment
Velocity: The Doppler frequency shift that is the difference in frequency between transmitted
and received echoes is proportional to the blood flow velocity.
fdoppl er = ftr ansmi t ted − fr eci ved = 2 fo v cos(θ)
c(3.1)
where fo is the transmitted frequency, v is velocity of blood flow, θ is beam/vessel angle, c is
speed of sound.
The Nyquist velocity can be calculated from the Doppler frequency shift and depends on the
Pulse Repetition Frequency (PRF), speed of sound and the transmitted frequency.
VN yqui st = c PRF
4 fo(3.2)
where PRF is the pulse repetition frequency. Under this Nyquist setting, velocities in the range(−VN yqui st ,VN yqui st)
can be measured without aliasing. If the magnitude of velocity exceeds
VN yqui st on the other hand, aliasing will occur. To avoid such issue, spectrum stacking is used
to increase the velocity scale to the range(−2VN yqui st ,2VN yqui st
).
There is also a method that is developed to adjust the velocity scale to the desired values as
needed and this velocity adjustment is made as a function of the baseline shift. The position of
the baseline (center, bottom or top) affects the velocity scale and the corresponding spectrum
that will be displayed. The default velocity range for the spectrum is made between (-VNyquist,
VNyquist) which is found using equation 3.2 and this may be an aliased spectrum. Based on the
stacking, the baseline shift and the velocity adjustments, the extractor will extract the spectrum
corresponding to the needed range of velocity and the renderer will display the extracted spec-
trum. The maximum value for the velocity scale is 2*VNyquist as mentioned above the velocity
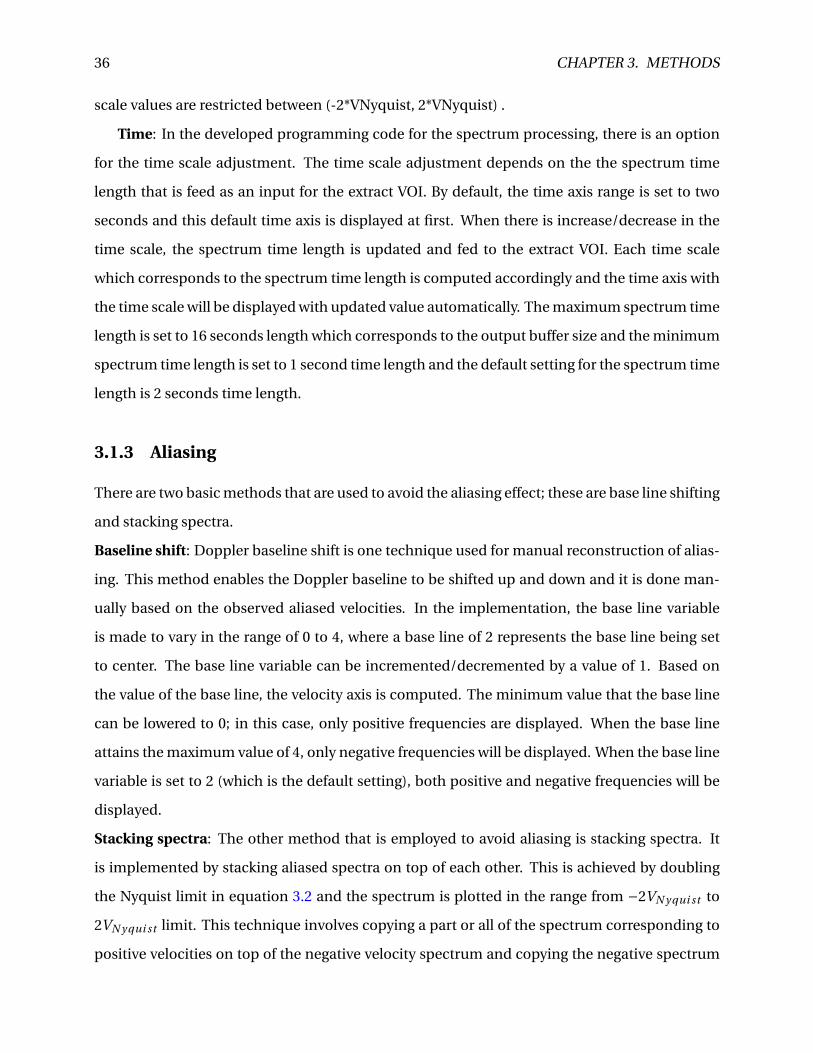
36 CHAPTER 3. METHODS
scale values are restricted between (-2*VNyquist, 2*VNyquist) .
Time: In the developed programming code for the spectrum processing, there is an option
for the time scale adjustment. The time scale adjustment depends on the the spectrum time
length that is feed as an input for the extract VOI. By default, the time axis range is set to two
seconds and this default time axis is displayed at first. When there is increase/decrease in the
time scale, the spectrum time length is updated and fed to the extract VOI. Each time scale
which corresponds to the spectrum time length is computed accordingly and the time axis with
the time scale will be displayed with updated value automatically. The maximum spectrum time
length is set to 16 seconds length which corresponds to the output buffer size and the minimum
spectrum time length is set to 1 second time length and the default setting for the spectrum time
length is 2 seconds time length.
3.1.3 Aliasing
There are two basic methods that are used to avoid the aliasing effect; these are base line shifting
and stacking spectra.
Baseline shift: Doppler baseline shift is one technique used for manual reconstruction of alias-
ing. This method enables the Doppler baseline to be shifted up and down and it is done man-
ually based on the observed aliased velocities. In the implementation, the base line variable
is made to vary in the range of 0 to 4, where a base line of 2 represents the base line being set
to center. The base line variable can be incremented/decremented by a value of 1. Based on
the value of the base line, the velocity axis is computed. The minimum value that the base line
can be lowered to 0; in this case, only positive frequencies are displayed. When the base line
attains the maximum value of 4, only negative frequencies will be displayed. When the base line
variable is set to 2 (which is the default setting), both positive and negative frequencies will be
displayed.
Stacking spectra: The other method that is employed to avoid aliasing is stacking spectra. It
is implemented by stacking aliased spectra on top of each other. This is achieved by doubling
the Nyquist limit in equation 3.2 and the spectrum is plotted in the range from −2VN yqui st to
2VN yqui st limit. This technique involves copying a part or all of the spectrum corresponding to
positive velocities on top of the negative velocity spectrum and copying the negative spectrum

3.1. SPECTRAL PROCESSING AND VISUALIZATION METHODS 37
on top of the positive spectrum. In effect, there will be stacked spectrum both in negative and
positive velocities and this has the advantage of identifying aliased frequencies. Therefore, a
double sided spectrum is obtained after spectrum stacking of the single sided spectrum.
3.1.4 Spectral filtering
There are two methods that are used to affect the temporal variation and smoothness of the
spectrum after FFT computation. These methods are temporal averaging and overlap.
Temporal averaging: A temporal averaging is simple method that is implemented for filtering
of the spectrum . It includes averaging overlapping segments and this method can be used for
reducing speckle without loosing spatial resolution. This filtering technique has a method for
adjusting the filer length. By adjusting the filter length, it is possible to control the smoothness
and appearance of the spectrum. In this particular spectrum processing, a filter order of 5 is
applied, only five data are taken at a time and averaged. A filter length of 1 means, there is no
filtering applied.
Window Overlap: The overlapping factor depends on the window length in samples and the
skip factor that determines after how much samples the next data to be taken. The percentage
overlap can be given by,
Over l ap = W i ndowL − ski p
W i ndowL∗100 (3.3)
where, W i ndowL is the window length in samples. The window length in samples is computed
as the ratio between the window length in seconds to the sampling time interval (time step) and
the skip factor is computed as the ratio between the spectrum time step to time step, which is
equal to 1/PRF. The overlap method is applied after the FFT is computed for a given window
length in samples where the FFT is implemented by column by column manner. Though my
implementation allows for setting any overlap, an overlap of 75 % is applied in obtaining the
results. With this overlap, the spectrum appears to have good quality.
3.1.5 User controls
User controller provides method for controlling different applications that are developed. This
controlling techniques provides a means for interacting the user with the developed applica-

38 CHAPTER 3. METHODS
tion. In this implementation, keyboard based user interaction is used as a control method. A
method called KeypressCallbackFunction is developed and used to handle user interactions us-
ing a keypress listener. A keypress event is sent to the event handler when keyboard input is
registered. It takes the keyboard short-cuts as an input and this key board key is associated with
the event to be executed. Therefore when any particular key is pressed, the desired event occurs
and creates user interactivity in this way.
3.2 User Interface Improvement Methods
vesKiwiText2DRepresentation which is one of the VES class library is mainly used as a method
to implement the text representation. Some of the member functions in this class are used for
the text representations and these includes:
setText: Enables setting of any text properties using vtkTextProperty. It is used to set the text it-
self, text color, opacity, font size, font family, bold/italic/shadow styles.The most frequent prop-
erties used for the text representation are text, font size and font color.
setDisplayPosition: provides the display position of the text representation. The position can
be specified as a Cartesian coordinate system (x and y), therefore it is needed to specify the two
dimensions only. These display positions are calculated with respect to the screen height of the
tablet. It is possible to set the one display position once based on the desired position and the
other display positions are calculated based on the screen height of the tablet with reference to
the previous position if more display positions for text representation are needed.
willRender: this enables continuous rendering process to occur. It is called every time when
the render window is updated. Once the texts are rendered, whenever there is an update or a
change from one text representation to another, then it will automatically update and continue
rendering process. Therefore it keeps the updated information while rendering.
displayPosition: It fixes the positions (x-y coordinates) where the text to be displayed.
3.3 Tablet User Interface Evaluation Methods
The methods used for usability evaluation of the user interface will be discussed.

3.3. TABLET USER INTERFACE EVALUATION METHODS 39
3.3.1 Usability test events
The usability evaluation of the tablet user interface was conducted by trainee midwives at at the
National Center for Fetal Medicine (Nasjonalt senter for fostermedisin), Women and Children’s
Center, St. Olavs University Hospital, Trondheim in 2013. The test was conducted with help
of Nurse-midwife/Associate Professor Eva Tegnander and with the co-operation of three preg-
nant women. The test was conducted in one of the laboratory rooms at the department, and it
was conducted in a way that only one trainee was examining a pregnant woman at a time. In
addition to that, it was not also easy to find free willing participants(pregnant women) for the
testing.
According to Nielsen and Landauer [29], ten users discover about 95 % of the usability issues.
Therefore ten trainee midwives have participated in the usability evaluation process. During
the evaluation, each of the midwives were asked to spend 15-20 minutes on the user interface.
During this time, the trainees were instructed to: complete a user background questionnaire,
answer questions about their impression to the developed user interface, perform a scanning
of the Umbilical Cord, answer questions about their overall satisfaction. In the begging, the
trainees were told to use the help document as guidance or help for performing the task because
the help document contains all the necessary steps for conducting the test. On the other hand,
if they have any medical questions regarding the imaging of the umbilical cord, they were in-
formed to ask Eva Tegnander for help, this option was made because they were new US trainees.
3.3.2 Who is tested
This section describes the users who participated in the test in terms of demographics, profes-
sional experience and special needs.
The users who participated in the usability test were new ultrasound midwife trainees. Each
of the 10 trainees are from different hospitals in Norway. The education (training program) is
offered by Institutt for laboratoriemedisin, barne- og kvinnesykdommer, Det medisinske fakul-
tet, NTNU, but all the teaching takes place at the National Center for Fetal Medicine (Nasjonalt
senter for fostermedisin), St. Olavs Hospital. The education is called Videreutdanning i ultra-
lyddiagnostikk for jordmødre, or Post-graduate ultrasound education for midwives. It lasts for

40 CHAPTER 3. METHODS
1 year and gives 60 credits. The trainees were in their second phase of their training program.
The trainees were trained only for four months as ultrasound midwife by the time the test was
conducted. There were several criteria that are considered to get the admission to the training
program:
• A geographical aspect was considered to make sure that all hospitals in Norway have a
midwife with ultrasound experience.
• Being a certified midwife (3 years nursing school and 2 years midwifery school)
• At least 1 year clinical work as a midwife
The midwives were categorized based on their age, experiences as ultrasound midwives,
experiences as general midwives, and other special needs. This is well described in the table for
demographics, Table 3.1 and 3.2.
General description
• All trainees were females and have widely distributed age range between late 20s and early
50s and all of them have four months of experience as ultrasound midwife.
• Some of the trainees have long experience as a general midwife. However, the number of
years of experience of the midwives are widely distributed as it can be seen from the table.
There are experiences ranging from 2.5 years until maximum of 25 years.
• All the trainees except one have smart phones.
• Seven of the trainees doesn’t own their own tablet; however, more than half of the trainees
are familiar with tablet use and it’s application. The trainees that have their own tablet
( three trainees) had it for a time duration of 4 months to 1.5 years . Most of the trainee
don’t use tablet for internet access. These days the technology is advanced from the old
keyboard applications to touch screen application. The fact that most of them are familiar
with touch screen application has a big effect on the evaluation of the user interface.
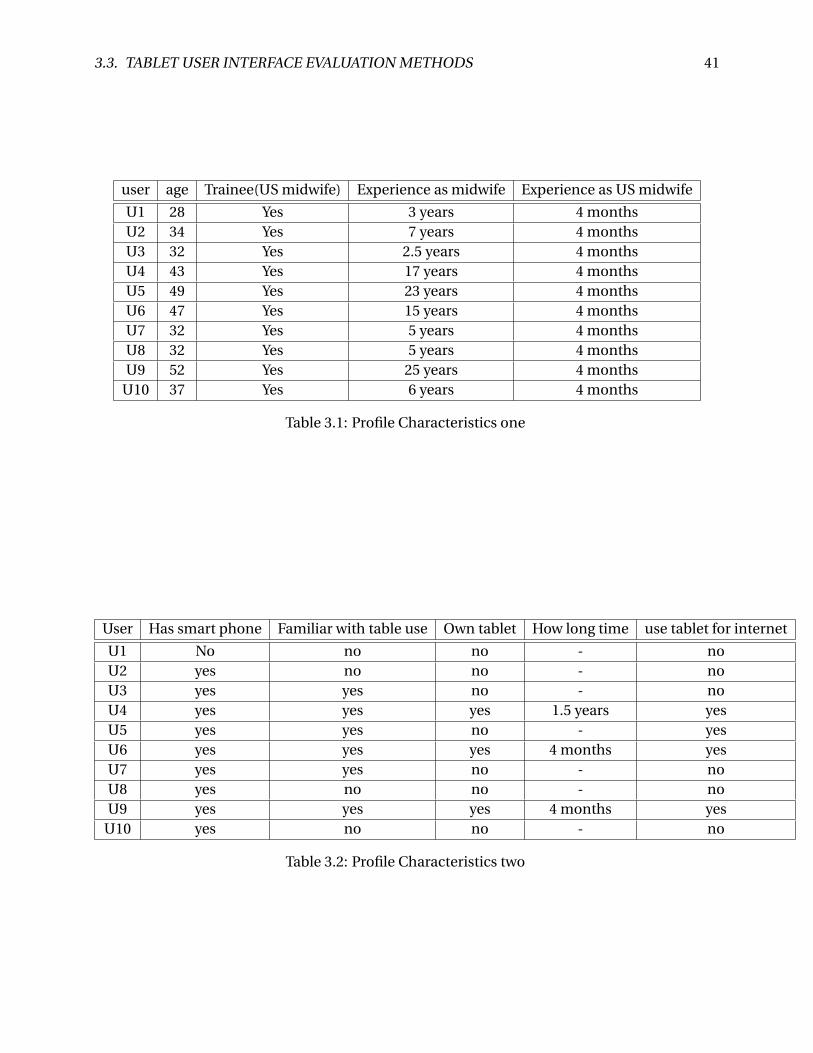
3.3. TABLET USER INTERFACE EVALUATION METHODS 41
user age Trainee(US midwife) Experience as midwife Experience as US midwife
U1 28 Yes 3 years 4 monthsU2 34 Yes 7 years 4 monthsU3 32 Yes 2.5 years 4 monthsU4 43 Yes 17 years 4 monthsU5 49 Yes 23 years 4 monthsU6 47 Yes 15 years 4 monthsU7 32 Yes 5 years 4 monthsU8 32 Yes 5 years 4 monthsU9 52 Yes 25 years 4 months
U10 37 Yes 6 years 4 months
Table 3.1: Profile Characteristics one
User Has smart phone Familiar with table use Own tablet How long time use tablet for internet
U1 No no no - noU2 yes no no - noU3 yes yes no - noU4 yes yes yes 1.5 years yesU5 yes yes no - yesU6 yes yes yes 4 months yesU7 yes yes no - noU8 yes no no - noU9 yes yes yes 4 months yes
U10 yes no no - no
Table 3.2: Profile Characteristics two

42 CHAPTER 3. METHODS
3.3.3 Individual interview
I conducted this individual interview with the trainee face to face before the test and during
break times. I gathered as much information as I can from them that will help me understand
more about them. It gave me a deep understanding of the midwives that evaluated the user
interface. It was possible to probe their attitudes, beliefs, desires and experiences.
Interview with Eva Tegnander I made so many meeting and e-mail conversation with Eva
Tegnander, to get the necessary information about the trainees. The midwives had very tight
schedule, so it was very difficult to have time with them. Eva helped me to know so many con-
textual and practical information about the trainees through different session of our meeting.
3.3.4 Personas
It represents the major(end) user of the developed user interface. It Gives a clear picture of the
midwives expectations and how they’re likely to use the user interface. It provides a method of
describing the real people with backgrounds, goals, and values. Personas development belongs
at the beginning of the project, as personas can provide a method to inform the user interface
functionality, help uncover gaps, or highlight new opportunities and it merely focus on the ma-
jor needs of the most important user groups(the midwives).
3.3.5 Context of product use in the test
In this section the tasks that were part of the evaluation, scenarios, and conditions under which
the tests were performed, and the specific configuration operated by test participants will be
described.
Test facility
The usability evaluation of the tablet user interface by trainee midwives was conducted at one
of the laboratory rooms at the National Center for Fetal Medicine (Nasjonalt senter for foster-
medisin), St. Olavs Hospital. As can be seen in the test facility Figure 3.1 there were different
equipment were used during the test. The test facilities include a web camera that is used for
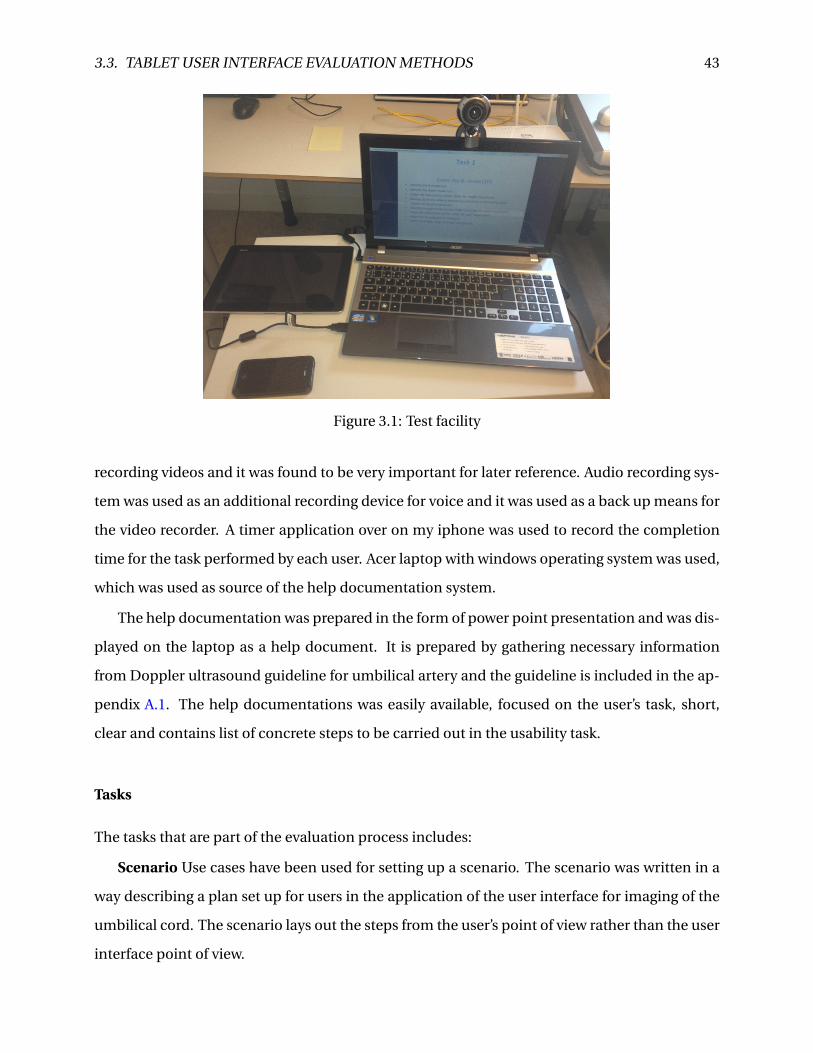
3.3. TABLET USER INTERFACE EVALUATION METHODS 43
Figure 3.1: Test facility
recording videos and it was found to be very important for later reference. Audio recording sys-
tem was used as an additional recording device for voice and it was used as a back up means for
the video recorder. A timer application over on my iphone was used to record the completion
time for the task performed by each user. Acer laptop with windows operating system was used,
which was used as source of the help documentation system.
The help documentation was prepared in the form of power point presentation and was dis-
played on the laptop as a help document. It is prepared by gathering necessary information
from Doppler ultrasound guideline for umbilical artery and the guideline is included in the ap-
pendix A.1. The help documentations was easily available, focused on the user’s task, short,
clear and contains list of concrete steps to be carried out in the usability task.
Tasks
The tasks that are part of the evaluation process includes:
Scenario Use cases have been used for setting up a scenario. The scenario was written in a
way describing a plan set up for users in the application of the user interface for imaging of the
umbilical cord. The scenario lays out the steps from the user’s point of view rather than the user
interface point of view.

44 CHAPTER 3. METHODS
Task(T) number main usability test task
T1 Enter the 2D modeT2 Adjust the gainT3 Adjust the depthT4 Save the imageT5 Open saved imageT6 Go to the scanning operation
Table 3.3: Tasks performed for Usability test
Evaluation(E) number Evaluation Criteria
E1 Does the user enters the 2D modeE2 Did the user adjust the gainE3 Did the user adjust depth values.E4 Can the user save the scanned imageE5 Is the user capable of opening the saved imageE6 Did the user go to the scanning operation successfully
Table 3.4: Usability evaluation criteria
Usability test task
Usability testing is used as a technique(method) used to evaluate the tablet user interface.
The goal is to identify any usability problems, collect quantitative data on midwives perfor-
mance (e.g., time on task, error rates), and determine the midwives satisfaction with the user
interface application.
The usability test task that was conducted was a 2-dimensional (2D) imaging of the umbilical
cord. During the test, the trainees tried tried to complete typical tasks while I watched, listened
and took some notes. During the task, they were provided with help documentation where all
the steps of the task are well described and reference images are well provided. The methods for
conducting the main usability test task are shown in Table 3.3.
Usability test evaluation criteria
There are several evaluation criteria methods that are used and this methods are used to asses
the tasks that are mentioned above(usability test task). The evaluation criteria are shown in
Table 3.4.

3.3. TABLET USER INTERFACE EVALUATION METHODS 45
Task no Task criteria
T1 Knows 2D iconT2 knows the depth iconT3 Knows the interactivity of the sliderT4 Moves the slider and adjust depthT5 Identify change iconT6 knows the gain iconT7 Moves the slider & adjust gainT8 knows how to zoomT9 knows the freeze icon
T10 knows the image save iconT11 save the image successfullyT12 Exit the scan operationT13 open the total commandT14 open the folder patientT15 open the imageT16 exit the total commandT17 Go to scan mode
SuccessCompletion rates(%)
Time(min:sec)
Table 3.5: Usability Metrics
3.3.6 Usability metrics
Different measures have been used in the evaluation metrics. The usability metrics in general
are selected to measure the effectiveness, completion rate, efficiency and satisfaction of the
users(trainees). The usability metrics used with the main task and sub task are summarized
in Table 3.5.
Effectiveness
Effectiveness relates the goals of using the user interface to the accuracy and completeness with
which these goals can be achieved. Some of the measures of effectiveness that are used in the
usability metrics includes percent task completion, frequency of errors, frequency of assists to
the trainee from the tester (me) and frequency of accesses to help documentation by the trainees
during the tasks.

46 CHAPTER 3. METHODS
• Completion Rate: A method of task completion success rate is employed in the usabil-
ity metrics. The task success rate is the number of successes divided by the number of
participants completing the task. The results includes the percentage of participants who
completely and correctly achieve each task goal.
If the task is partially achieved (e.g., by incomplete or sub-optimum results) then the the
average task achievement is reported, scored on a scale of 0 to 100 percent based on spec-
ified criteria related to the value of a partial result.
• Assists: When the trainees cannot proceed on a task, some times they were given some as-
sistance that gives direct procedural help in order to allow the test to proceed. Those that
are assisted are marked with ’H’ symbol which stands for helped in the usability metrics
table.
Efficiency
Efficiency is generally assessed by the mean time taken to achieve the usability test task. A com-
mon measure of efficiency is time spent on each task.
• Task time: is one of the method used for efficiency measure. The time taken by each
trainee to complete the task is reported. The task time is described in terms of minutes
and seconds accordingly(min:sec). It doesn’t include a more detailed breakdown of time
for instance, the time that trainee spent looking for or obtaining help (e.g., including help
system or calls to the help ).
Satisfaction
Satisfaction describes the trainees subjective response when using the user interface. User sat-
isfaction may be an important factor that may affect performance of the system in some cases.
A number of questionnaires are available that are widely used user satisfaction measures.
A questionnaire that is used here is System Usability Scale (SUS). It includes measurements of
satisfaction, usefulness, and ease of use and it is included in the appendix A.3.

Chapter 4
Results
In this chapter, various results obtained in this thesis are shown and discussed. First, results
obtained in Doppler spectrum processing and visualization are discussed in Section 4.1. Then,
the results obtained form improvement of the user interface are discussed in Section 4.2. Finally,
Section 4.3 contains detailed results obtained from the evaluation of the tablet user interface.
4.1 Doppler Spectral Result
Pulsed wave Doppler ultrasound is used to provide a sonogram of the artery or vein under in-
vestigation. The sonogram provides a measure of the magnitude distribution of velocities at a
particular time and the temporal variation of the magnitude of each velocity component with
time. Using the time-frequency Doppler spectrum plot,
• It is possible to measure blood velocities.
• It enables detailed analysis of the distribution of flow and its temporal variation
• It can be used to examine the flow wave forms and patterns
A typical time-frequency Doppler spectrum plot of a carotid artery is shown in Figure 4.1.
During the initial development, some of the spectrum processing methods were implemented
in MATLAB with stored data of carotid artery. Based on that, a C++ code was developed for real
time processing and visualization. The results in this section are obtained from the developed
47
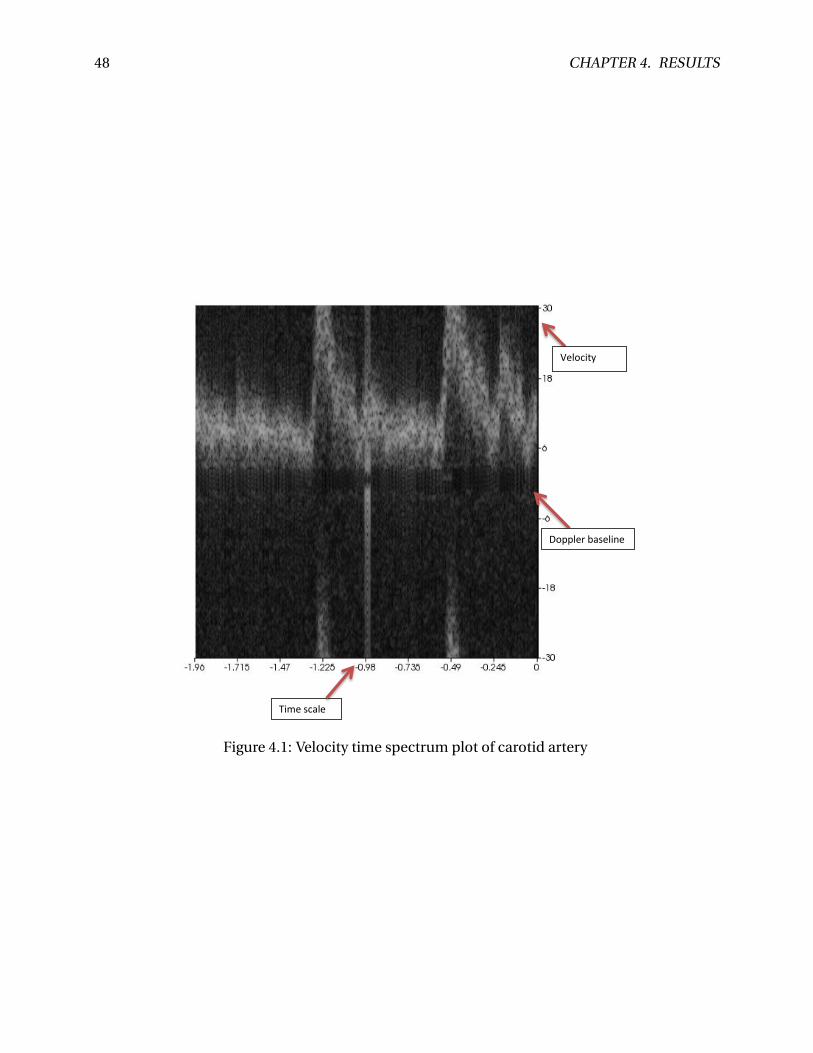
48 CHAPTER 4. RESULTS
!
"#$%!&'()%!
*%)+'#,-!&'()%!
.+//)%0!1(&%)#2%!
Figure 4.1: Velocity time spectrum plot of carotid artery
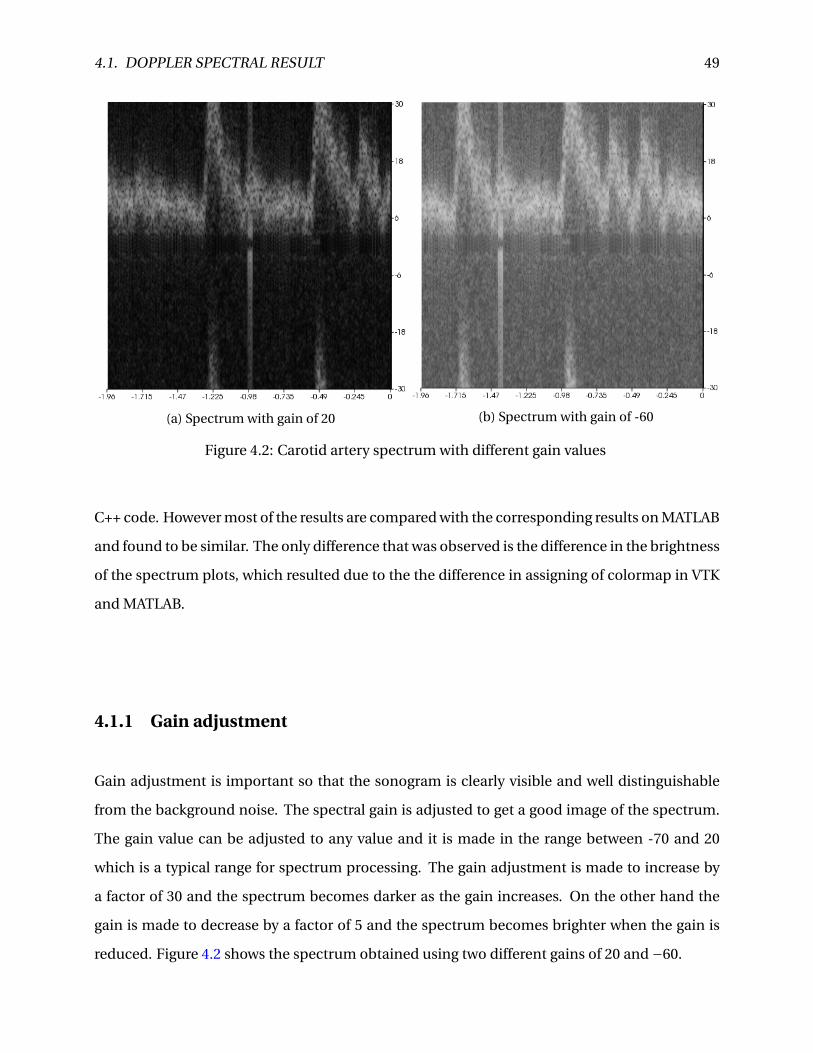
4.1. DOPPLER SPECTRAL RESULT 49
(a) Spectrum with gain of 20 (b) Spectrum with gain of -60
Figure 4.2: Carotid artery spectrum with different gain values
C++ code. However most of the results are compared with the corresponding results on MATLAB
and found to be similar. The only difference that was observed is the difference in the brightness
of the spectrum plots, which resulted due to the the difference in assigning of colormap in VTK
and MATLAB.
4.1.1 Gain adjustment
Gain adjustment is important so that the sonogram is clearly visible and well distinguishable
from the background noise. The spectral gain is adjusted to get a good image of the spectrum.
The gain value can be adjusted to any value and it is made in the range between -70 and 20
which is a typical range for spectrum processing. The gain adjustment is made to increase by
a factor of 30 and the spectrum becomes darker as the gain increases. On the other hand the
gain is made to decrease by a factor of 5 and the spectrum becomes brighter when the gain is
reduced. Figure 4.2 shows the spectrum obtained using two different gains of 20 and −60.

50 CHAPTER 4. RESULTS
4.1.2 Velocity resolution
It possible to determine detailed analysis of the distribution of flow, low velocity flow and high
velocity flow through velocity resolution. One of the parameter adjustments made in spectral
Doppler mode is PRF. In the implementation of this thesis, the PRF is set to a fixed value. The
effect on velocity resolution and SNR achieved by varying PRF is rather obtained by using the
highest possible PRF (given by the sample volume depth) and adjusting the FFT window length
to obtain the corresponding time length in milliseconds. The needed velocity scale can then be
obtained by zooming the vertical axis. This is possible because,
1. The spectral resolution (in Hz) is only dependent of the time span of the window; not the
number of samples
2. Decreasing the PRF will decrease the noise bandwidth, and give a proportional increase
in the spectral noise level. On the other hand; the transmitted energy per pulse can be
increased to obtain the same mean transmitted power. So the spectral signal to noise
level will be independent of PRF.
Velocity measurement
Once the beam/flow angle is known, velocities can be calculated from the Doppler frequency
as shown in the Doppler equation 3.1. It enables the vertical scale of the Doppler spectrum
and the maximal detectable velocity to be modified. Velocity range directly controls the pulse
repetition frequency, which is responsible for the setting of the Nyquist limit (the ability to detect
maximum velocity without aliasing).
Velocity scale
Velocity scale shows the scale of the velocity distribution and it is displayed in cm/s. The velocity
scale of the Doppler spectrum is adjusted automatically based on the minimum and maximum
limits set by the user and the baseline factor. Based on the position of the baseline set by the
user, the corresponding velocity scale is obtained. When the velocity scale is increased or de-
creased, a zooming effect is observed on the spectrum. When the velocity scale is increased,
the spectrum becomes zoomed out and when it is decreased the spectrum becomes zoomed

4.1. DOPPLER SPECTRAL RESULT 51
in. As a consequence of this, in real time scanning, it is possible to detect high and low blood
flows respectively through the zooming effect. For instance, in Figure 4.3, the modification of
the velocity scale and the spectrum of the carotid artery is shown for various velocity ranges.
4.1.3 Time scale adaptation
The time scale adjustment is very important factor in understanding the spectrum waveform.
The time scale increases or decreases by a scale of 1 seconds and the maximum scale value is 16
seconds which corresponds to the output buffer size 4.1.8. The minimum value that time scale
can be lowered to 1 sec and the default(display) setting used for the time scale that is found to
be optimal in the imaging of the uterine artery is 2 seconds. The time scale can be adjusted
with respect to the spectrum automatically and it is possible to observe the spectrum from a
time length of 1 sec until 16 seconds. Time scale adjustment (increasing or decreasing) is made
possible in both scanning mode and freeze mode. During freeze mode, it is possible to display
a spectrum of fixed time buffer length (last 2 sec ) or it is also made possible to adjust the time
buffer length to any desired scale for displaying the spectrum. When the time scale is increased,
a zoom out effect is observed until 16 seconds, whereas when it is decreased, a zoom in effect is
seen with a minimum limit of 1 sec length. The spectrum with different time scale is shown in
Figure 4.4.
4.1.4 Axis update
The velocity time sonogram representation of the Doppler signal is represented by time along
the horizontal axis and frequency (velocity) along the vertical axis. The time and velocity axis
contains the time and the velocity scales respectively. This axis update deals with updating the
axis properties, the time and velocity scale to the desired (needed) value. When the velocity or
time scale is changed (increased or decreased), there is a method that is developed to remove
the old ticks positions and labels and replace it by the new ones. Once the tick positions and
labels are updated, the desired velocity/time scale is calculated and the axis update controls
this axis changes automatically and display the spectrum at the desired scale. Velocity axis up-
date controls the velocity scale changes as well as the baseline changes and the axes update
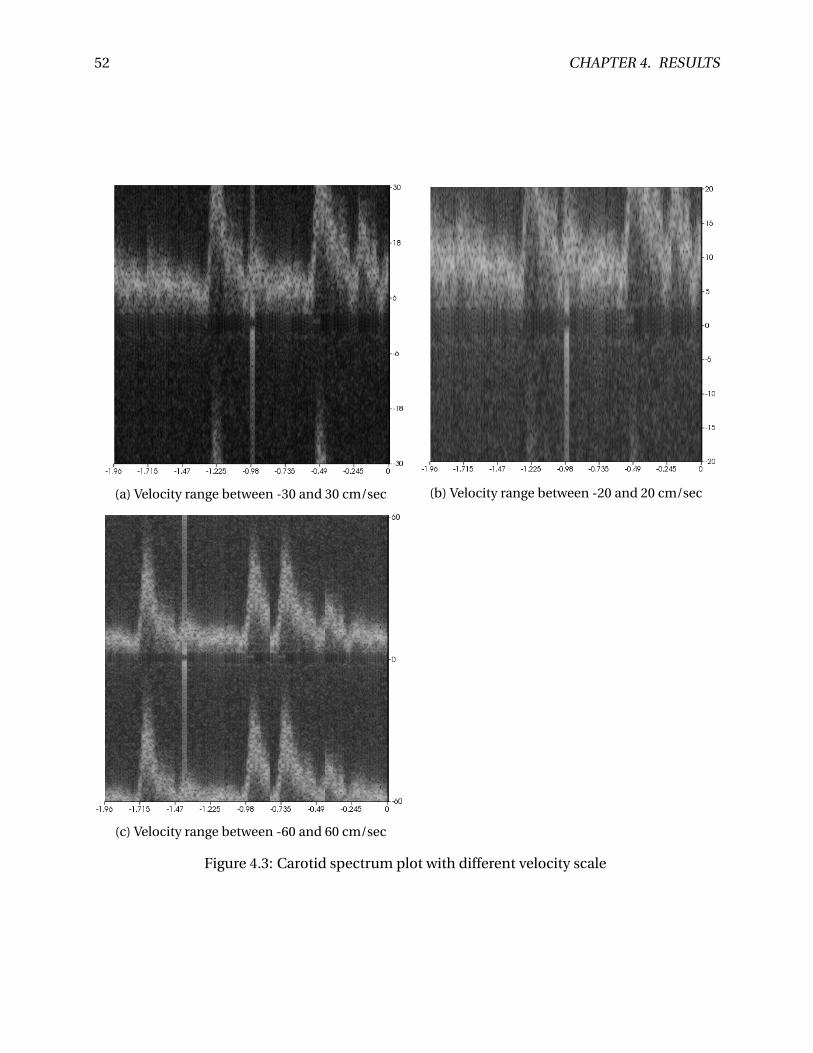
52 CHAPTER 4. RESULTS
(a) Velocity range between -30 and 30 cm/sec (b) Velocity range between -20 and 20 cm/sec
(c) Velocity range between -60 and 60 cm/sec
Figure 4.3: Carotid spectrum plot with different velocity scale

4.1. DOPPLER SPECTRAL RESULT 53
(a) 1 sec display (b) 2 sec display (default setting)
(c) 16 sec display
Figure 4.4: Carotid spectrum plot with various time scale values

54 CHAPTER 4. RESULTS
(both velocity and time) is possible in both scan and freeze modes. Even though it is difficult
to put figures showing the update result, it is observed and tested that the axis update works as
expected and updates correctly according to the different settings.
4.1.5 Aliasing
The spectrum of the carotid artery shown in Figure 4.1 is an aliased spectrum. Aliasing occurs
because the maximum velocity component in the spectrum becomes greater than the Nyquist
velocity for error free reconstruction of a sampled signal. According to Nyquist theorem, the
maximum frequency (velocity) content fmax must be less than the Nyquist frequency, fN yqui st
which is equal to half the sampling frequency. That is, fmax < fs2 = fN yqui st must be satisfied.
This is known as Shannon criterion for error free reconstruction of a sampled real signal.
When aliasing occurs, the positive velocities that exceed VN yqui st will be aliased onto the
negative frequencies components that span from −VN yqui st towards 0. The frequencies just
above VN yqui st will be aliased onto the frequencies just above −VN yqui st . Similarly, when the
negative frequency components exceed below −VN yqui st , they will be aliased onto the positive
frequency components starting from VN yqui st downward. The result of the aliased spectrum
is shown in Figure 4.5. As the figure shows, it is the positive frequency components which are
aliased onto the negative frequencies in this case. In order to remove this aliasing effect, the
methods of Doppler baseline shifting and stacking spectra must be applied.
Stacking spectra
One of the methods that is employed to avoid aliasing is stacking spectra. It is a manual cor-
rection of aliasing. By stacking aliased spectra on top of each other, it is possible to remove a
possible aliasing that may occur in the positive or negative frequency range.
The spectrum result obtained after spectrum stacking is shown in Figure 4.6. As the figure
shows, a new plot having a velocity range of(−2VN yqui st ,2VN yqui st
)is obtained after spectrum
stacking. The aliased spectra are now restored and can be interpreted without ambiguity.

4.1. DOPPLER SPECTRAL RESULT 55
Figure 4.5: The figure illustrates aliased spectrum of Carotid artery
Figure 4.6: Stacked spectrum plot for carotid artery
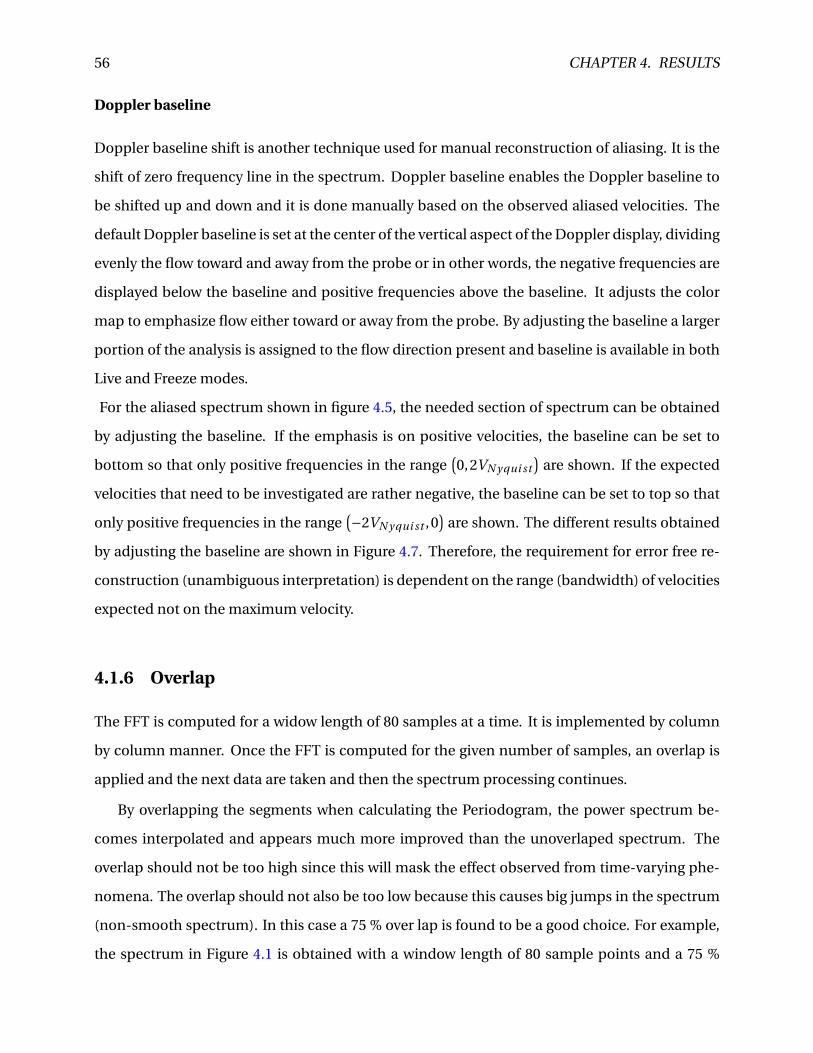
56 CHAPTER 4. RESULTS
Doppler baseline
Doppler baseline shift is another technique used for manual reconstruction of aliasing. It is the
shift of zero frequency line in the spectrum. Doppler baseline enables the Doppler baseline to
be shifted up and down and it is done manually based on the observed aliased velocities. The
default Doppler baseline is set at the center of the vertical aspect of the Doppler display, dividing
evenly the flow toward and away from the probe or in other words, the negative frequencies are
displayed below the baseline and positive frequencies above the baseline. It adjusts the color
map to emphasize flow either toward or away from the probe. By adjusting the baseline a larger
portion of the analysis is assigned to the flow direction present and baseline is available in both
Live and Freeze modes.
For the aliased spectrum shown in figure 4.5, the needed section of spectrum can be obtained
by adjusting the baseline. If the emphasis is on positive velocities, the baseline can be set to
bottom so that only positive frequencies in the range(0,2VN yqui st
)are shown. If the expected
velocities that need to be investigated are rather negative, the baseline can be set to top so that
only positive frequencies in the range(−2VN yqui st ,0
)are shown. The different results obtained
by adjusting the baseline are shown in Figure 4.7. Therefore, the requirement for error free re-
construction (unambiguous interpretation) is dependent on the range (bandwidth) of velocities
expected not on the maximum velocity.
4.1.6 Overlap
The FFT is computed for a widow length of 80 samples at a time. It is implemented by column
by column manner. Once the FFT is computed for the given number of samples, an overlap is
applied and the next data are taken and then the spectrum processing continues.
By overlapping the segments when calculating the Periodogram, the power spectrum be-
comes interpolated and appears much more improved than the unoverlaped spectrum. The
overlap should not be too high since this will mask the effect observed from time-varying phe-
nomena. The overlap should not also be too low because this causes big jumps in the spectrum
(non-smooth spectrum). In this case a 75 % over lap is found to be a good choice. For example,
the spectrum in Figure 4.1 is obtained with a window length of 80 sample points and a 75 %

4.1. DOPPLER SPECTRAL RESULT 57
(a) Baseline shift at the center (b) Baseline shift lowered at bottom
(c) Baseline shift raised at top
Figure 4.7: Carotid spectrum plot with various baseline values

58 CHAPTER 4. RESULTS
overlap.
Frequency and time resolution
In normal FFT analysis, the spectrum time resolution and the frequency resolution are inversely
related and the frequency resolution is given by
4 f = 1
T= fs
N(4.1)
where 4 f is the frequency resolution, T is the time window length, N is sampling points and fs
is sampling frequency.
The time resolution must be increased (and the time window length reduced) in order to view
instantaneous time variations in the spectrum, with a consequent deterioration in frequency
resolution or for a good frequency resolution, the time window length must be increased(T)
or increasing the number of sampling points N. As can be shown in the equation 4.1, the fre-
quency resolution is dependent primarily on the number of sampling points N or window length
in samples and in addition to that the spectrum time resolution and the frequency resolution
are inversely related. The performance of the spectrum sonogram as a function of the win-
dow length is illustrated in figure 4.8a, 4.8b, 4.8c and 4.8d respectively. As shown in figure 4.8a,
window length of 80 points has good frequency resolution and bad temporal resolution. The
window length can be adjusted to any value and a value of 80 point window length is found to
be optimal in this spectrum processing. In figure 4.8c, it has better temporal resolution than the
window length with 80, 60 and 40 points.
4.1.7 Temporal averaging
A simple method that is implemented for filtering of the spectrum is temporal averaging. By
averaging overlapping segments the variance of the spectrum can be reduced or it has the ad-
vantage of reducing the speckle without loosing spatial resolution. It is a method of extracting
the mean values and it is possible to average over any filter length. The spectrum with tempo-
ral averaging is more smooth as compared to the unfiltered spectrum. The optimal filter length
that is applied in the spectrum processing results of this chapter is of length of 5. The spectrum
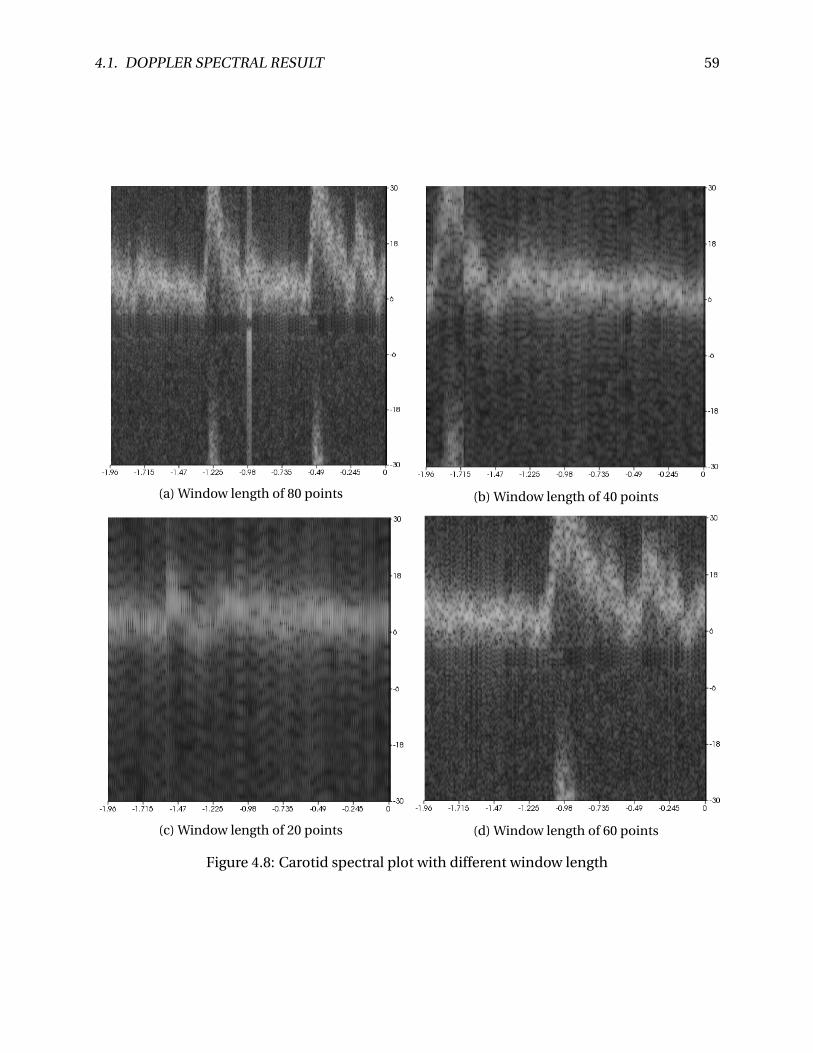
4.1. DOPPLER SPECTRAL RESULT 59
(a) Window length of 80 points (b) Window length of 40 points
(c) Window length of 20 points (d) Window length of 60 points
Figure 4.8: Carotid spectral plot with different window length

60 CHAPTER 4. RESULTS
(a) Spectrum with no smoothing applied (b) Spectrum with filter order 5
Figure 4.9: Carotid spectral plot with and without filter
obtained with and without filtering is shown in Figure 4.9.
Once the spectrum is averaged and then logarithmic scale is applied on it and stored in the
out put buffer.
4.1.8 Output data buffer
Once the raw data is processed through FFT and smoothing, then the output of this processed
data is stored in output vector. The content of the vector is stored in a circular output buffer.
The maximum output buffer size is set to 16 seconds which is optimal for typical applications.
Therefore the output buffer size has a capacity of holding 16 seconds buffer and if the output
vector size is larger than the output buffer size, then the extra elements are calculated and erased
from the output vector. The maximum size that the output vector can hold is the same as the
size of the output buffer size that is 16 seconds. The processed data that is stored in the buffer
can be retrieved for different application during the freeze mode because it requires to play the
the stored data from the buffer. There are different application that can be performed during
the freeze mode and these applications includes time scale up/down, velocity scale up/down,
baseline shift and gain adjustments. Therefore all the applications that are performed in the
4.1. DOPPLER SPECTRAL RESULT 61
freeze mode require the utilization of the stored data. During the scanning mode it is possible
to perform all the application that are performed in the freeze mode as well. Once it is in the
freeze mode, the spectrum freezes and all the applications that are mentioned above can be
performed as needed. When going for new scan from freeze mode, all the stored data in the
buffer is erased and replaced with new ones. Therefore for every new scan, there is method that
is developed that enables the new data to be stored and the old ones to be removed.
4.1.9 Performance of Spectrum generator and it’s issues
ExecuteFft, the method used for FFT computation, is implemented to compute the FFT in col-
umn by column manner (it computes one column at a time and it shifts forward to compute the
next FFT until the given packet size). It is faster as compared to other FFT computation meth-
ods for instance when it is compared to RFFT(Reverse Fast Fourier Transform) that produces an
output with zero imaginary parts that takes time to extract out the zero imaginary from the real
image. Therefore the method of ExecuteFft has resulted in increasing the performance of the
FFT computation.
As compared to the GE simulator, the speed of update both for the spectrum and axes is a bit
slower. The main reason for this is the extraction process(ExtractVOI) that extracts a portion of
the velocity/time spectrum. For instance, it is measured that the average processing times of
ExecuteFft and ExtractVOI are approximately 1 ms and 15ms per FFT window. This shows that
the extraction process is comparatively slow. In terms of quality of the image, the performance
of the spectrum generator is good. For instance, with 75 % overlap, temporal averaging and
window length adjustment for frequency/time resolution has resulted in a good quality image.
4.1.10 User controls
User controller provides ways for controlling different applications that are developed for the
spectrum processing. In this implementation, keyboard based user interaction is made as a con-
trol method and it forms user interaction with the developed application. The various user con-
trols includes controls for gain(up/down), velocity(increase/decrease), time(increase/decrease),
baseline adjustments such as up, down. The user controls function to control the applications

62 CHAPTER 4. RESULTS
in both scan and freeze mode.
4.2 Improvement on the user interface
This section will emphasize on the improvements made on the user interface based on project
idea and the images are taken to show mainly the improvements made, not the quality.
The modification of the user interface includes adding text representation for all the icons
and modifying the image saving method. The text representation for all the icons was made to
make the user interface more user friendly and understandable to the user in addition to the
icons representation. The text representation was found to be very helpful and provide effective
result during the evaluation process because it was easy to be understood by the trainees and it
ease their work when they performed their task. The text representation doesn’t only show the
text representation of the icons, but it provides an information in text form on how to access
the other alternative modes. The user interface with text representation is shown in Figure 4.10,
4.11 and 4.12.
In the improved image saving activity, a default file name with a name for instance "Image01"
will pop out when the save icon is pressed, so the user can directly save the image or change the
file name and save. The file name is developed in an iterative manner and is different for dif-
ferent images. Therefore the user can save as much images as possible. Based on the improved
user interface, user interface evaluation was conducted and the results of the evaluation will be
presented in the next section.
4.3 Main Findings of the Evaluation
4.3.1 Individual interviews
The individual interview with the trainee was conducted face to face during the test and break
times. It was possible to gather as much information as possible from them and the main areas
of the individual interview are listed below:
• All of the midwives have experience as general midwife for several years. But they all are

4.3. MAIN FINDINGS OF THE EVALUATION 63
Figure 4.10: Carotid artery 2D scan with text representation
Figure 4.11: Carotid artery color mode with text representation
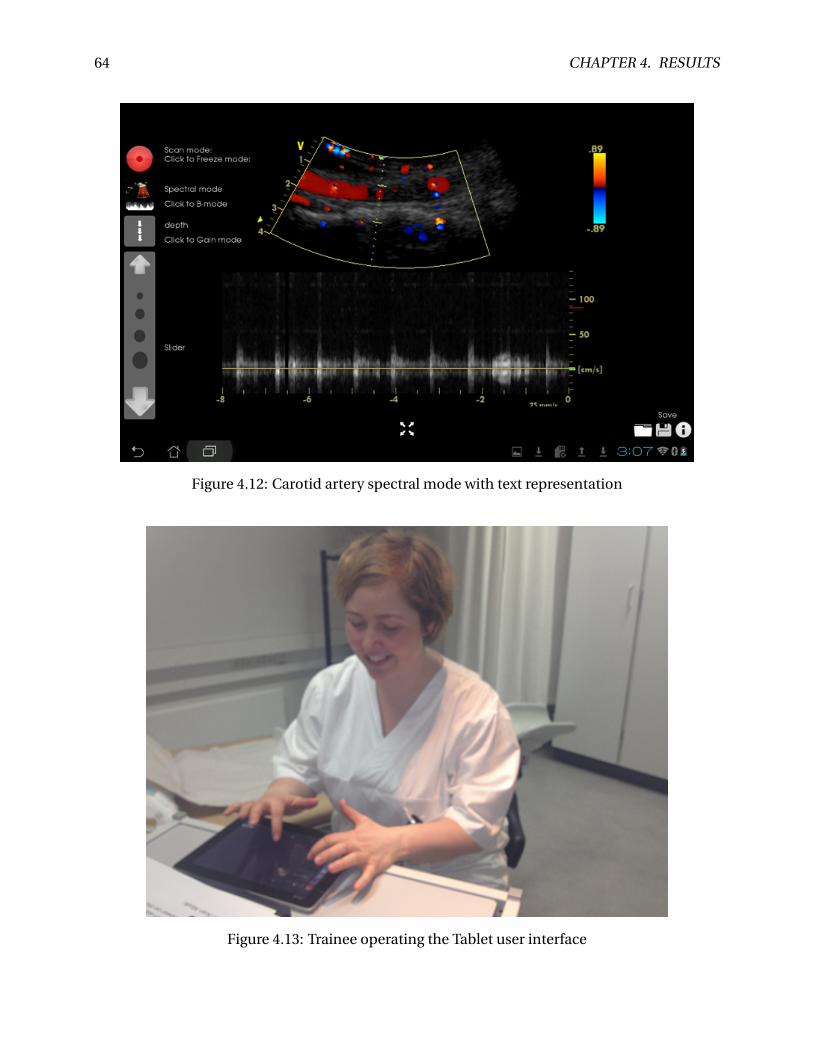
64 CHAPTER 4. RESULTS
Figure 4.12: Carotid artery spectral mode with text representation
Figure 4.13: Trainee operating the Tablet user interface

4.3. MAIN FINDINGS OF THE EVALUATION 65
new as ultrasound midwife, so all of them were new not only to the technology, but also
the scanning techniques and procedures as they are trainees.
• Four of the trainees are married among the others, three of them have a partner, and three
of the trainees that participated in the test are single. Those that are married are in the age
of their late 40th and early 50th, older than the others. The trainees that have partner and
single are in the late 20th and early 30th.
• All of the trainee have completed high school and have attended higher education.
• The connection of these trainee midwives with the technology is very strong. It is not
affected by their age and status, all of the trainee midwives have access to internet and
get update themselves. Most of the midwives use different system to access an internet
and one thing that makes all of them similar is that, all of them use computer as means
of internet access. Some of the midwives use their smart phones, computer and tablet as
source of internet and some of them use only their smart phones and computer as internet
source.
• Even though they are not far from technology, there were some trainee who didn’t have
the exposure to use a tablet before. They told me that they work mostly on computer if it
is work related things and use their smart phone as for other entertainment and browsing
purpose. Therefore there is no need for them to buy a tablet of their own. Despite all, most
of them have exposure to tablet use before and are familiar with some of the applications.
• Most of the trainee never thought that it could be done this much on a tablet, developing
this kind of ultrasound application on it, as most of them used tablet for entertainment,
reading and browsing purpose.
• I asked them how they fell about this developed ultrasound system. Most of them were so
curious about it when they see it for the first time and try to scan using it, but they were
happy at the same time. Most of the midwives were happy and want to use it further and
prefer it over the old key board application. However one trainee was confused which one
of the ultrasound system she wants to use(keyboard/touch screen, tablet), and she said

66 CHAPTER 4. RESULTS
that there are some pros and cons with the new touch screen system even though it is a
lot better than the keyboard application.
The overall individual interview is summarized in the Appendix A.2.
Interview with Eva
Before I conducted the usability test, I made an informal interview with Eva Tegnander. While
discussing about the midwives, Eva informed me that the trainee can scan only in 2D mode and
as a result of that they can scan only a 2D image of the the umbilical cord or umbilical artery.
Initially, me and my supervisors thought that they can scan in Doppler mode. As a result of this,
I modified all the questionnaire and usability test task to adapt their skills. I get to learn that
all of the trainee midwives worked as general midwives for so several years and now they are 4
months since they started to be trained as ultrasound midwives.
4.3.2 Personas
Ultrasound midwife trainee
Maria Carolina
Maria is one of the trainee who participated in the usability test. She is 37 years old and she has
six years of experience as general midwife. She has a partner and came from Finnmark for train-
ing as ultrasound midwife that is offered at the National Center for Fetal Medicine (Nasjonalt
senter for fostermedisin), St. Olavs Hospital. She is very close to technology and like to update
herself with new inventions and systems. She uses her smart phone and computer for commu-
nications, internet based applications and other purposes too. She is not familiar with tablet use
or have some experience with tablet application before, but she has positive attitude towards the
developed ultrasound system and she has the eagerness to learn and work on it in the future.
She said that this system is a lot better than the big ultrasound machine or any ultrasound sys-
tem with key board application. At the end of the test, this was the question that she asked ,"
When is this technology available in the market ?, " Can I take it home now ? ".

4.3. MAIN FINDINGS OF THE EVALUATION 67
4.3.3 Scenario
During the usability test task, there can be various use cases in which the user interface is useful.
Scenario set up : For instance the midwife is so busy to examine the scanned images in detail
online(while scanning), rather she wants to save all the images and examine them offline before
she chooses the best picture to print and give it to the patient. She can follow this procedure set
up in order to act in this scenario:
1. Enter the 2D mode
2. Find and scan the umbilical cord
3. Save the image
4. Open the saved image and check.
The overview of the scenario is illustrated in Figure 4.14. During the imaging of the cord, if
the midwife is inexperienced, then before she saves her image, she can go to the help document
and compare with the reference image if she wants help.
!Figure 4.14: The figure illustrates Set up scenario for 2D umbilical cord imaging

68 CHAPTER 4. RESULTS
4.3.4 Prototype fidelity
Fidelity considerations: The prototype fulfills the the following fidelity dimensions:
Equipment fidelity: The developed tablet user interface fulfills equipment fidelity. The tablet
user interface was properly developed and used to to achieve the goals of any system including
the usability task system.
Environment fidelity: The system is not affected by the environment. Even though the mid-
wives use ultrasound gel during scanning, it was not found to be a problem to operate the touch
screen application on the tablet because the midwives were scanning by their right hand and
using their left hand to operate the tablet user interface.
Task fidelity : The usability test task that was given for the midwives were very precise and
realistic. It enables them not only to test the user interface, but also helps them to advance
themselves in fetal imaging as ultrasound midwife. In other words, it was a way of learning
opportunity for them.
Functional fidelity: The tablet user interface provides high degree of reality. All sorts of scan-
ning modes and methods can be supported based on the need. For example, as in the usability
test task, 2D imaging of the umbilical cord was performed. While imaging the cord, there were
so many tasks and sub-tasks that were accomplished. In each step of the task, there were so
many functional buttons keys and slider application applied each with it’s own functionality to
image the 2D image of umbilical cord.
4.3.5 Usability test result
The usability test result includes both for the main tasks and different sub tasks, the main tasks
are those tasks that generally show the usability test task 4.1 and the sub-tasks show the detailed
tasks, what each user used to accomplish in the usability test. As can be seen on the table from
usability test result 4.1 :
• 80 % of the midwives have accomplished the task of entering in the 2D mode.
• 90 % of them have adjusted the gain.
• All of them have managed to adjust the depth.

4.3. MAIN FINDINGS OF THE EVALUATION 69
Task(T) no Evaluation criteria PercentageT1 The user enters the 2D mode 80%T2 The user adjust the gain 90 %T3 The user adjust the depth 100 %T4 The user can save the scanned image 90%T5 The user is capable of opening the saved image 90%T6 Did the user go to the scanning operation successfully. 80%
Table 4.1: Usability test result for main tasks
• 90 % of them saved the image.
• 90 % were able to open the saved image.
• 80 % of them go to the scan mode successfully.
The main tasks together with sub-tasks are described in the Table 4.2 and the usability test
result for the main and sub-task together is shown in Table 4.3. In Table 4.3, there are various
symbols used and they are defined here; Success(S which is number of successful tasks), per-
centage(% is task completion success rate), User number (U number), Task number (T number),
Yes/correct (Y), No/wrong (N), Helped(H).
Trainee 1-5 scanned 38 weeks old fetus, Trainee 6,7 and 10 scanned 18 weeks old fetus while
Trainee 8 and 9 scanned 40 weeks fetus. Based on Table 4.3, all of the midwives have successfully
finished Task(T4,T6,T13,T14), less than half of the midwives have completed Task3, 90 % of the
midwives have accomplished task(T5,T7,T9,T10,T11,T12,T15,T16) and 80 % have accomplished
T1 and T17.
4.3.6 Usability test observations
When conducting the usability test, there were so many “Aha, wow, where am I ? , how can I find
it ?” moments. All the trainee were so curious of the technology from the begging until the end.
When they were told that that they are going to scan using the tablet, their face turns in to serious
and stare at the tablet user interface looking at it surprisingly, partially feeling insecured. Then
when I inform them that it is not them that I want to test, it is the user interface, then they start
smiling and say "now it feels better". Since they are new students as ultrasound midwife, every
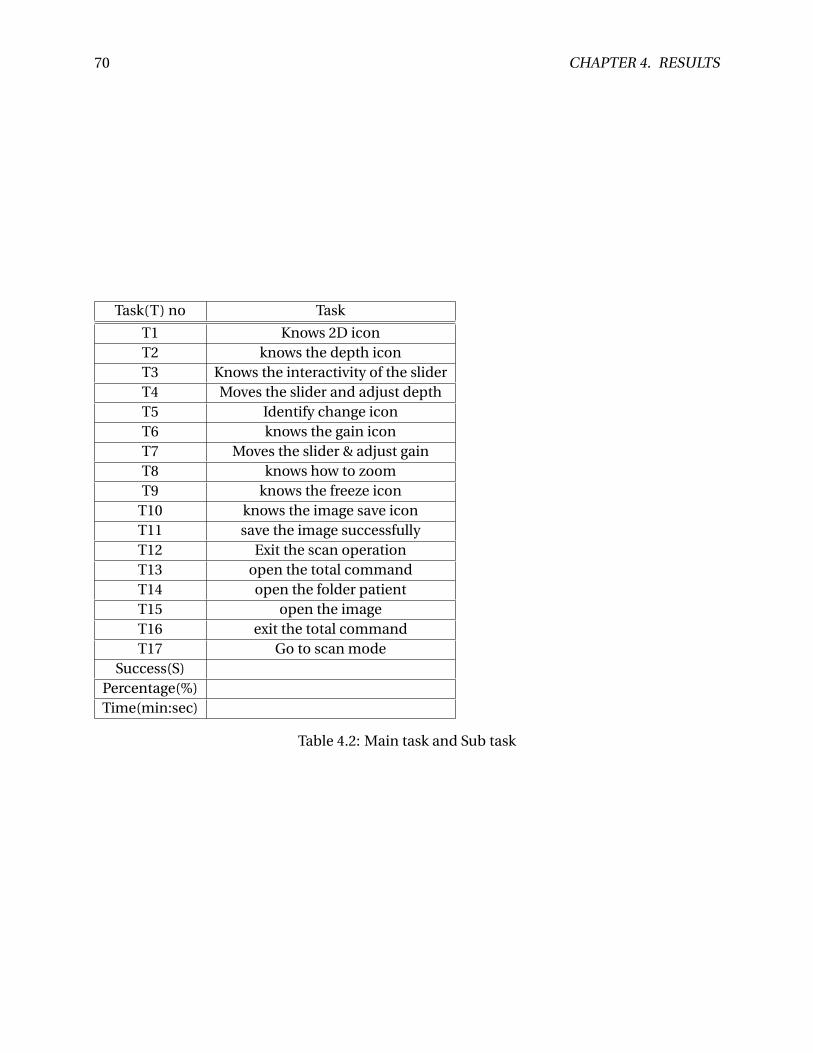
70 CHAPTER 4. RESULTS
Task(T) no Task
T1 Knows 2D iconT2 knows the depth iconT3 Knows the interactivity of the sliderT4 Moves the slider and adjust depthT5 Identify change iconT6 knows the gain iconT7 Moves the slider & adjust gainT8 knows how to zoomT9 knows the freeze icon
T10 knows the image save iconT11 save the image successfullyT12 Exit the scan operationT13 open the total commandT14 open the folder patientT15 open the imageT16 exit the total commandT17 Go to scan mode
Success(S)Percentage(%)Time(min:sec)
Table 4.2: Main task and Sub task

4.3. MAIN FINDINGS OF THE EVALUATION 71
Task no U1 U2 U3 U4 U5 U6 U7 U8 U9 U10 S %
T1 Y Y Y Y Y Y Y H H Y 8 80T2 H H H Y Y H Y H Y Y 5 50T3 H Y N H H Y H Y H H 3 30T4 Y Y Y Y Y Y Y Y Y Y 10 100T5 Y Y Y Y Y Y H Y Y Y 9 90T6 Y Y Y Y Y Y Y Y Y Y 10 100T7 Y Y Y Y Y Y Y N Y Y 9 90T8 Y H Y Y H Y Y Y H H 6 60T9 Y H Y Y Y Y Y Y Y Y 9 90
T10 Y Y Y Y Y Y Y Y Y H 9 90T11 Y Y Y Y Y Y Y Y Y N 9 90T12 Y Y Y Y Y Y Y Y N Y 9 90T13 Y Y Y Y Y Y Y Y Y Y 10 100T14 Y Y Y Y Y Y Y Y Y Y 10 100T15 N Y Y Y Y Y Y Y Y Y 9 90T16 Y Y Y Y Y Y Y Y N Y 9 90T17 Y Y Y Y Y Y N Y Y N 8 80
S 14 14 15 16 15 16 14 14 12 12% 82.3 82.3 88.2 94.1 88.2 94.1 82.3 82.3 70.5 70.5
Time(min:sec) 15: 13: 7: 18: 10: 12: 15: 8: 13: 9:02 00 03 06 00 02 05 02 03 00
Table 4.3: Usability test result summary

72 CHAPTER 4. RESULTS
step of the test that they make was so important for them and take the usability test so seriously.
Most of them were in a rush to touch and see how it works, even though I explain and provide the
help document that indicates them how to conduct the test. In the begging, most of them just
touch any random button and prefer to see what is going on rather than hearing what i am going
to say. I just let them do that, because it was good for me to see their reaction and response,
probably it could be part of their personal behavior on how they respond to new(innovative)
technologies and I enjoyed most of the moments when I worked with them. Some of the trainees
especially those young ones were so free when they were using the tablet for scanning, they were
enjoying their time, not only focusing on getting good image, but admiring the user interface
too. When they perform a task successfully they say “wow” ,”I did it”. On the other hand the
other trainees especially those with a lot of experience as general midwife were serious about it
and they focus on getting the test work done. At the end of each test, it was really inspiring to
see when all of them smiling and so ready to welcome the new technology. Conducting the test
was really fun for me, working with the midwives, seeing their reaction and every situation that
occurred rather than sitting in the office and do the programming code. During the test, even
some of the patients (pregnant women) were asking about the technology and wanted to see
how the it works.
Some of the pregnancies were late pregnancies(40 weeks old fetus), that means there was
less amniotic fluid present that has resulted in difficulties to image the cord. This has affected
the quality of the image that they scanned and the time they took to find good image. The
midwives that scanned normal stage of pregnancy have imaged very good quality image where
as those with late pregnancy imaged fairly good image. In addition to this, they were given short
time of introduction about how the tablet user interface works, but even though it was short
introduction, I have observed that they were fast learners because they get used to the user
interface so easily in less time. During the test, it was very difficult to find free willing participant
pregnant women for the test, but with the strong help of Eva, it was possible to evaluate the user
interface as planned(Umbilical cord) and all the trainees have benefited more experience in 2D
imaging in addition to evaluating the user interface.
Additional observations
• Some of the trainees are curious about the scanner application, they focus more on how

4.3. MAIN FINDINGS OF THE EVALUATION 73
to use the user interface and the procedures and forgets to scan the image.
• Prefer to ask me how the interface works rather than following the guideline(help docu-
ment) and scan according to the guideline.
• Confused with the vertical slider application. It was hard to adjust the depth and gain
easily. I have observed that the slider is very sensitive when touched slightly .
• Some of them in the beginning just touched the freeze icon and asked for help how to get
out.
• One of them prefers to follow her own guideline, for example if one has to adjust depth
first and gain after according to the guideline, she do it the other way around and this
made her to repeat the steeps again. May be this is due to being curious of how this new
technology works and failure to read the guideline as well.
• One user touched the text not the icon or button for user interface interaction and only
one user was helped to identify the change icon.
• One user briefly asked how the vertical slider relates with the a gain or depth adjustment.
• Those that have experience with touch screen application like iPad, easily managed the
user interface interactivity than the inexperienced ones .
• Some of them felt insecure, even though they identify which icon to press according to the
guideline, they need my confirmation to yes or no. This is normal and is due to being new
to the technology.
• The fastest task time taken by a user to conduct the task was 7:03(min:sec) and the slowest
time taken was 18:06(min:sec).
4.3.7 System Usability Scale(SUS)
SUS is calculated out of hundred point scale. It contains 10 questions and each item has a 5 point
scale (i.e. 1 corresponds to "strongly disagree" and 5 corresponds to "strongly agree”; range of a
item =[1,5]).

74 CHAPTER 4. RESULTS
Trainee SQ1 SQ2 SQ3 SQ4 SQ5 SQ6 SQ7 SQ8 SQ9 SQ10 SUS
1 4 1 5 1 4 2 5 1 4 2 87.52 4 2 4 2 4 2 4 1 2 2 72.53 3 2 4 3 3 2 4 1 4 2 704 4 1 5 1 4 1 4 1 4 1 905 3 2 4 3 4 3 4 2 3 2 656 4 1 4 2 4 3 3 2 3 2 707 3 2 5 2 4 3 5 1 2 2 72.58 2 2 4 1 4 2 4 2 4 2 72.59 3 2 4 3 3 3 4 2 3 2 70
10 3 2 4 3 4 2 4 2 4 2 70Average 3.3 1.7 4.3 2.1 3.8 2.3 4.1 1.5 3.3 1.9 74
Table 4.4: SUS score of the trainee
According to Brooke each item contributes to the SUS scale with a range from 0 to 4 [19]. For
positively worded items (1, 3, 5, 7 and 9), the score contribution is the scale position minus 1.
For negatively worded items (2, 4, 6, 8 and 10),it is 5 minus the scale position. To get the overall
SUS score, the sum of the item score contributions were multiplied by 2.5. Thus, SUS scores
range from 0 to 100 in 2.5 point increments. The SUS score is shown in Table 4.4 and in the table
SQ number stands for SUS Question number.
Regarding usability and learnability, it follows the suggestions of Lewis and Sauro [27], and
calculate usability (sum of the items 1, 2, 3, 5, 6, 7, 8, and 9) and learnability (sum of the items 4
and 10) in addition to the total score of SUS. To make the usability and learnability scores com-
parable with the overall SUS value (ranging from 0 to 100), the summed score was multiplied by
3.125 and 12.5, respectively. The Usability and learnability are 80 and 20 point scale respectively
and is shown in Table 4.5.
4.3.8 Usability issue
In the test, there were some usability problems that I observed and they are summarized and
presented as in the Table 4.6.
There were several usability issues that are obtained from the usability test. There are four
main issues that most of the midwives had problem with while they were conducting the test
and it is shown in Table 4.6. More than half of the midwives didn’t know how the vertical slider

4.3. MAIN FINDINGS OF THE EVALUATION 75
Trainee SUS L&S Usability % L&S Learnability %
1 87.5 60 75 17.5 87.52 72.5 57.5 71.8 15 753 70 57.5 71.8 12.5 62.54 90 52.5 65.6 20 1005 65 52.5 65.6 12.5 62.56 70 55 68.75 15 757 72.5 57.5 71.8 15 758 72.5 55 68.75 17.5 87.59 70 50 62.5 12.5 62.5
10 70 57.5 71.8 12.5 62.5Average 74 55.5 15
Table 4.5: SUS, Learnability and Usability scores of the trainee
Issue(I)number Issue description PercentageI1 User don’t know 2D icon 20%I2 User didn’t find the depth icon 50%I3 User don’t know the interactivity of the slider 70%I4 User don’t know to how zoom 40%I5 User fail to manage to enter the scan mode 20%
Table 4.6: Usability issues

76 CHAPTER 4. RESULTS
works and it’s interactivity, 40 % of them don’t know how to zoom and half of them couldn’t find
the depth icon. Less than half percent of the midwives(20 %) don’t know the 2D icon and to go
back to scanning operation after freeze during the test.
Minor issues: Most of the midwives had difficulty to easily adjust the gain and depth values
because the gain/depth scales were so sensitive, it changes so quickly. In addition to this, it was
possible to observe that one midwife couldn’t find the image save icon. Even though almost all
of them except one mange to find it, but for some, it wasn’t that easy task to do.
Chapter 5
Discussion and analysis
This chapter discusses some of the results from Chapter 4 and their possible implications. Sec-
tion 5.1, discusses the results on Doppler spectrum processing and Section 5.2 discusses the
results on user interface improvement and evaluation.
5.1 Doppler Spectrum Processing
In this thesis, various techniques and methods are employed in the spectrum processing that
helps to obtain a good quality spectrum. In the spectrum processing implementation, there is
option to make various adjustments such as gain, velocity and time scale, filter order, window
length and overlap and other parameters. Based on the the scale changes, the developed code
allows automatic update of the velocity/time scale and the spectrum. Even though, there is
option to adjust parameters, optimal parameter values are set by default in order to obtain a
good image. For instance, the window overlap is set to 75 % by default since this value is found
to be optimal. Averaging over three to five consecutive data is also found to be enough to get
good filtering effect in the spectrum plot. These values are based on the data from carotid artery
imaging. In other imaging scenarios such as Umbilical/Uterine artery, it might be necessary to
change this optimal values. The user has various controls for scanning, freezing, adjusting the
time scale, adjusting the velocity scale etc. These controls are important in having an easy to
manipulate and user-friendly spectrum plot system.
Spectral performance : The spectrum generation is mainly affected by the axes and spec-
77
78 CHAPTER 5. DISCUSSION AND ANALYSIS
trum extraction process. The extraction process that filters the desired velocity/time during
scale changes has a bit slow effect in generating the updated spectrum and axes for display. As
described in 4.1.9, the extraction process takes about 15 ms per window length. For spectrum
of 2 seconds length, this extraction could take upto 6 seconds. Therefore this could be a bit far
for real time display. Nevertheless, the spectrum processing and visualization tools discussed
in this thesis can be used as a component block in real time streaming. The FFT computation
is comparatively very fast as mentioned in 4.1.9. During the initial development of this work,
the FFT was implemented by computing more than one column at a time, but it slows the up-
date. The modification to compute one column at a time using the method described 3.1.1 has
brought faster computation performance.
Integration into tablet: As stated in the introduction section 1.4.1, due to time limitation, it
was not possible to integrate the developed code into the tablet application at the end. Instead,
all the methods and components of the spectrum are developed with the stored data and the
developed code was tested for real time streaming to make sure integration into the tablet sys-
tem is possible. By importing some part of the code for instance the filtering and overlap effect
in to the streamer code and it was possible to see that it can be used for real time streaming too.
The initial spectrum processing is done on windows based platform because of its simplicity
for trial implementation and it is easier to debug when there are errors. The developed code
can similarly be integrated for real time streaming on a tablet by adding some android specific
manipulations.
5.2 User Interface Evaluation
Before the user interface evaluation was conducted, user interface improvements were made.
These improvements are text representation for all the icons and image saving methods 4.2. My
earlier project work provides only icon representations [26].
As usability is about effectiveness(success rate), efficiency and the overall satisfaction of the
user, all this goals have been measured in the usability evaluation of the user interface. The
effectiveness can be measured by task completion success rate. In the usability test result 4.3,
each user is assessed by the number of success, task completion success rate and task time. The
5.2. USER INTERFACE EVALUATION 79
highest rate is achieved by user 4 and 6 94.6 % and the lowest rate is achieved by user 9 and 10
70.5 %. The usability test task has 17 tasks, 4 of the tasks are achieved with 100 % success rate , 8
of the tasks are achieved with 90 %, 2 tasks are achieved with 80 % and 3 tasks are accomplished
with 50 %, 30 %, 60 % success rates. The efficiency can be measured by task time. Most of the
midwives have performed good and the fastest time(min:sec) to accomplish the task is 7:03(user
3) and the slowest time to accomplish that task is 18:06 by user 4. This is mainly affected by
the fact that some pregnancy were so late, the body anatomy of the patient(one patient was
over weight). As a result, it was difficult to find the cord, and also lack of experience in fetal
imaging as they are new trainees but they get used to the user interface application in less time
than it was expected mainly due to improvements made 4.2. The satisfaction is measured by
using SUS score and it is calculated out of hundred point scale. The maximum SUS score is
90 and minimum score is 65, and this shows that most midwives agree to have the support of
technical person to be able to use the user interface for ease of use and the midwives that are
satisfied with the integration of the various functions in the user interface is very less. During
the usability test, there were some major and minor issues that were obtained. The major issues
are problems with user interface application such as the depth and 2D icons, the interactivity of
the slider, zoom and entering the scan mode after freeze. More than half of the midwives didn’t
know how the vertical slider works. As the slider icon is two sided arrow, therefore in order to
increase/decrease the depth/gain, they apply one finger single tap on the down/up arrow head,
rather than applying sliding action of their finger downwards/upwards. The other issue was
most of the midwives had difficulty to easily adjust the gain and depth values. The gain/depth
scales were so sensitive, it changes so quickly with small sliding application on the vertical slider.
In addition to this, it was possible to observe that one midwife couldn’t find the image save icon.
Even though almost all of them mange to find it except her, but for some, it wasn’t that easy task
to do.
Interview with Eva, conducted before the test, has helped me to prepare my self well for the
test and gave me good understanding of the midwives. Then, the interview with the midwives
makes it possible to probe their attitudes, beliefs, desires and experiences. Scenario set up pro-
vides opportunity for various cases to be utilized where the user interface can be useful.

80 CHAPTER 5. DISCUSSION AND ANALYSIS

Chapter 6
Conclusions and Future work
In most ultrasound machines, specialized hardware are used to reconstruct images from ac-
quired raw data, which is costly. In this thesis, Doppler spectrum processing is implemented
for application on a tablet ultrasound system. In order to have low cost scanner for applica-
tions in rural areas, as much real-time processing as possible should be done in the tablet. In
the implementation of this thesis work, it is possible to measure velocity, time, and display the
axis update. It is provided that there are methods developed to remove aliasing and it is shown
that any filtering & window overlap effect can be applied. A user controller is developed that en-
ables user interactivity for various controls like gain. The performance of the FFT computation
method used is good and sufficient quality of image is obtained. The only thing that needs im-
provement is the extraction method which is bit slow for real time processing. Nevertheless, the
spectrum processing and visualization tools discussed in this thesis can be used as a component
block in real time streaming.
Usability evaluation of the tablet user interface is conducted by using usability evaluation
methods. From the evaluation, it is learned that the typical usability goals are measured. It
is observed that all the midwives have achieved high task completion success rate and good
task completion time, which is acceptable. The level of the satisfaction that is measured shows
that most of the midwives are satisfied with the application of the user interface. In addition
to this, the fidelity consideration imply that all the fidelity dimensions are fulfilled and good
understanding on the needs of Ultrasound midwives is obtained. Eventually, during the test,
there were some usability issues that are encountered and need to be improved in the future.
81

82 CHAPTER 6. CONCLUSIONS AND FUTURE WORK
6.1 Recommendations for Further Work
The functionality of the developed code with stored data is tested for real time streaming of
spectrum processing based on raw data. Therefore for full functional spectrum processing, it is
recommended to integrate the developed code in to GE streamer code and display the spectrum
on the client side tablet.
During the usability test, there were several usability issues encountered and these issues are
described in usability issues 4.3.8 and are discussed at 5.2as well. Therefore it would be great if
this issues are improved (solved) in the future and conduct the usability evaluation again.

References
[1] Placental blood circulation. http://www.embryology.ch/anglais/fplacenta/
circulplac01.html. Online; accessed July 12, 2013.
[2] Canyearn ultrasound. http://www.canyearn.com/product.php?act=show&classid=
12&id=58.
[3] Circular buffer. http://c2.com/cgi/wiki?CircularBuffer.
[4] Fetal and maternal blood circulation systems. http://www.embryology.ch/anglais/
fplacenta/circulplac01.html. Online; accessed July 12, 2013.
[5] International standards for HCI and usability. http://www.usabilitynet.org/tools/
r_international.htm.
[6] Kiwi Viewer. http://www.kiwiviewer.org/.
[7] Portable antenatal ultrasound platform for village midwives. http://change.
washington.edu/.
[8] Smoothing. http://terpconnect.umd.edu/~toh/spectrum/Smoothing.html.
[9] Usability basics. http://www.usability.gov/basics/. [Online; accessed July 12, 2013].
[10] Usability methods. http://www.usability.gov/methods/. [Online; accessed July 12,
2013].
[11] Usability tools and methods. http://www.usabilitynet.org/tools/13407stds.htm.
[Online; accessed July 12, 2013].
83
84 REFERENCES
[12] VES . http://public.kitware.com/ves-docs/online_resources.html.
[13] VTK 6.0.0 Documentation . http://www.vtk.org/doc/nightly/html/index.html.
[14] Why You Only Need to Test with 5 Users. http://www.nngroup.com/articles/
why-you-only-need-to-test-with-5-users/.
[15] Bjørn A.J. Angelsen and Hans G. Torp. Ultrasound Imaging-Waves, Signals, and Signal Pro-
cessing. 2000.
[16] N. Bevan. Human-computer interaction standards. In Proceedings of the 6th International
Conference on Human Computer Interaction, 1995.
[17] N. Bevan. Measuring usability as quality of use. Software Quality Journal, 1995.
[18] N. Bevan. Usability is quality of use. Proceedings of the 6th International Conference on
Human Computer Interaction, 1995.
[19] J Brooke. Sus-a quick and dirty usability scale, 1996.
[20] Y. Dahl, O.A. Alsos, and D. Svanæs. Fidelity considerations for simulation-based usability
assessments of mobile ict for hospitals. International Journal of Human-Computer Inter-
action, 2010.
[21] Colin Deane. Doppler ultrasound principles and practice. 2000.
[22] G. DeVore. Fetal Diagnostic Centers. http://www.fetal.com/IUGR/_umbilical2.html.
Online; accessed July 12, 2013.
[23] Juhan Morten Dreier. User centered design in rural south africa: How well does current best
practice apply for this setting? Masters thesis, Department of Computer and Information
Science, NTNU, 2012.
[24] G. Eysenbach and T. L Diepgen. Towards quality management of medical information on
the internet: evaluation, labelling, and filtering of information. British medical journal,
Nov. 1998.

REFERENCES 85
[25] International Center for Alcohol Policies Analysis. Balance. Partnership. What is
Evaluation? http://www.icap.org/PolicyTools/Toolkits/EvaluationToolkit/
2WhatIsEvaluation/tabid/441/Default.aspx.
[26] Aida Kumssa. A tablet user interface for doppler ultrasound scanner. Masters project re-
port, Department of Engineering Cybernetics, NTNU, 2012.
[27] J.R. Lewis and J Sauro. The factor structure of the system usability scale. In Proceedings of
Human Centered Design, 2009.
[28] Bevan N and Holdaway K. User needs for user system interaction standards. In User needs
for information technology standards, 1993.
[29] Jakob Nielsen and Thomas K. Landauer. A mathematical model of the finding of usability
problems. In Proceedings of the INTERACT ’93 and CHI ’93 Conference on Human Factors
in Computing Systems, CHI ’93, pages 206–213, New York, NY, USA, 1993. ACM.
[30] U.S. Dept. of Health and Human Services. The Research-Based Web Design & Usability
Guidelines, Enlarged/Expanded edition. Technical report, U.S. Government Printing Of-
fice, Washington, 2006.
[31] Y.C. Tsim, V.W.S. Yeung, and Edgar T.C. Leung. An adaptation to iso 9001:2000 for certified
organisations. Managerial Auditing Journal, 2002.

86 REFERENCES

87

88 APPENDIX A. APPENDICES
Appendix A
Appendices
A.1 Guidelines Doppler Ultrasound
Figure A.1: Guidelines Doppler Ultrasound for umbilical artery

A.2. INDIVIDUAL INTERVIEW 89
A.2 Individual Interview
Figure A.2: Individual Interview

90 APPENDIX A. APPENDICES
A.3 SUS(System Usability Scale)
The word cumbersome was given "difficult" as an equivalent meaning in terms of complexity.
Figure A.3: System Usability Scale

A.4. VTK BASED CODE FOR SPECTRUM GENERATION AND VISUALIZATION 91
A.4 VTK based Code for Spectrum Generation and Visualiza-
tion
This is the code developed for processing and displayed the Doppler spectrum.
Listing A.1: C++ Code for Spectrum Generation and Visualization
1 #ifndef __vtkGenerateDopplerSpectrum_h
2 #define __vtkGenerateDopplerSpectrum_h
3 #include <vtkImageData.h>
4 #include <vtkSmartPointer.h>
5 #include <vtkImageFourierFilter.h>
6 #include <cmath>// is included cos of floor function
7 #include <vtkTimerLog.h>
8 #include <vtkLookupTable.h>
9 #include <vtkNew.h>
10 #include <vtkActor.h>
11 #include <string>
12 #include <sstream>
13 #include <vtkAxis.h>
14 #include <vtkContextScene.h>
15 #include <vtkContextActor.h>
16 #include <vtkAbstractContextItem.h>
17 #include < vtkDoubleArray.h>
18 #include <vtkStringArray.h>
19 #include <vtkImageActor.h>
20 class vtkGenerateDopplerSpectrum : public vtkObject
21 {
22 public:
23 //
−−−−−−−−−−−−−−−−−−−−−−−−−−−−−−−−−−−−−−−−−−−−−−−−−−−−−−−−−−−−−−−−−−−−−
24 static vtkGenerateDopplerSpectrum *New();
25 void Clear();
26 vtkSmartPointer<vtkImageData> GetSpectrumImage()// Getdoppler data is an obeject of a class
vtksmartpointer that returns vtkimagedata.
27 {
28 return DoubleSizedSpectrumImage;// is the spectrun with its copy
29 }
30 vtkSmartPointer<vtkContextActor> Getactoraxis()
31 {
32 return actoraxis;
92 APPENDIX A. APPENDICES
33 }
34 int GetGain()
35 {
36 return Gain;
37 }
38 int Getoffset()
39 {
40 return offset;
41 }
42 double GetVlimMin_Spec()
43 {
44 return VlimMin_Spec ;
45 }
46 double GetVlimMax_Spec()
47 {
48 return VlimMax_Spec ;
49 }
50 double Getprf()
51 {
52 return prf ;
53 }
54 int Getskip()
55 {
56 return skip;
57 }
58 int GetYMax_Spec()
59 {
60 return YMax_Spec;
61 }
62
63 int GetYMin_Spec()
64 {
65 return YMin_Spec;
66 }
67 double Getdt()
68 {
69 return dt;
70 }
71 int GetNs()
72 {
73 return Ns_Spectrum;
74 }
75 int GetInterval()
76 {

A.4. VTK BASED CODE FOR SPECTRUM GENERATION AND VISUALIZATION 93
77 return Interval;
78 }
79 double GetTimeSpectrum()
80 {
81 return TimeSpectrum;
82 }
83 int GetNs_buffer()
84 {
85 return OutputNs;
86 }
87 void SetDopplerData(double* PointerToReal, double* PointerToImag,int NumberOfSamples);
88 void PlayBack();
89 void TimeScaleUp();
90 void TimeScaleDown();
91 void PlayFrames();
92 void Axis();
93 void TimeAxisUpdate();
94 void VelocityAxisUpdate();
95 void clearall () ;
96 void VelocityScaleUp();
97 void VelocityScaleDown();
98 void BaselineUp();
99 void BaselineDown();
100 void GainUp();
101 void GainDown();
102 void prfUp(),prfDown();
103 void clearBuffer();
104 vtkSmartPointer<vtkAxis> axesHorizontal;
105 vtkNew<vtkDoubleArray> positionsX;
106 vtkNew<vtkStringArray> labelsX;
107 protected:
108 //
−−−−−−−−−−−−−−−−−−−−−−−−−−−−−−−−−−−−−−−−−−−−−−−−−−−−−−−−−−−−−−−−−−−−−
109 vtkGenerateDopplerSpectrum();
110 ~vtkGenerateDopplerSpectrum();
111 vtkGenerateDopplerSpectrum(const vtkGenerateDopplerSpectrum&);
112 vtkGenerateDopplerSpectrum& operator=(const vtkGenerateDopplerSpectrum&);
113 vtkSmartPointer<vtkImageData> SpectrumImage;
114 vtkSmartPointer<vtkImageData> DoubleSizedSpectrumImage;
115 vtkSmartPointer<vtkContextActor> actoraxis;
116 vtkSmartPointer<vtkAxis> axesVertical;
117 vtkNew<vtkDoubleArray> positionsY;
118 vtkNew<vtkStringArray> labelsY;
94 APPENDIX A. APPENDICES
119 double* data;
120 double* dataDouble;
121 vtkAxis* axis;
122 vtkImageFourierFilter* FftCompute;
123 vtkImageComplex* in;
124 vtkImageComplex* out;
125 std :: vector<vtkImageComplex> Input;
126 std :: vector<double>::iterator it;
127 std :: vector<double> Output;
128 int BufferSizeInput;
129 int BufferSizeOutput;
130
131 double VlimMin;
132 double VlimMax;
133 double VlimMin_Spec;
134 double VlimMax_Spec;
135 double VlimMin_Delta;
136 double VlimMax_Delta;
137 int Ns2;
138 int nt;
139 int YMax,YMin,YMax_Spec,YMin_Spec,YMax_Delta,YMin_Delta;
140 int noVals;
141 double prf;
142 int skip;
143 double dt;
144 double dtS;
145 double Tw;
146 int Nv;
147 int Nw1;
148 int Ns;
149 int c;
150 int rmax;
151 double vmax;
152 double f0;
153 int k;
154 int offset ;
155 int Gain;
156 int Ending;
157 int ellNoO;
158 int OutputNs;
159 double TimeSpectrum;// length in time of the spectrum axis
160 int Delta; // change
161 int Interval;
162 int TickNumber;
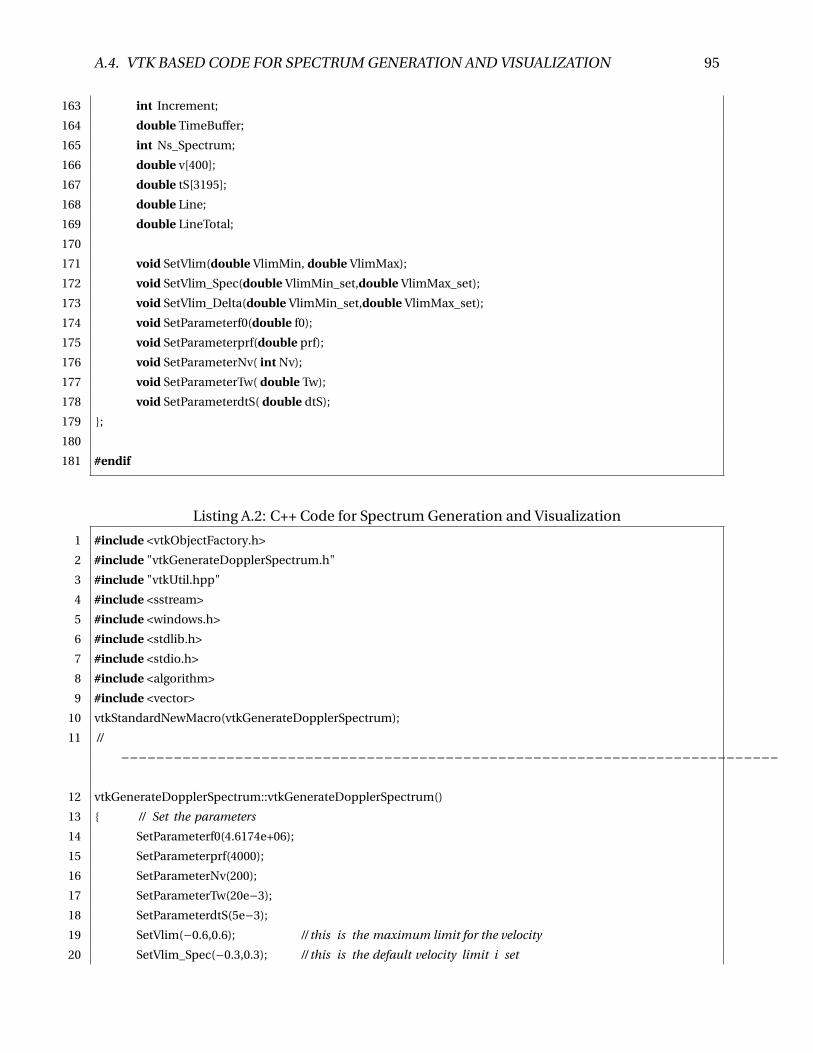
A.4. VTK BASED CODE FOR SPECTRUM GENERATION AND VISUALIZATION 95
163 int Increment;
164 double TimeBuffer;
165 int Ns_Spectrum;
166 double v[400];
167 double tS[3195];
168 double Line;
169 double LineTotal;
170
171 void SetVlim(double VlimMin, double VlimMax);
172 void SetVlim_Spec(double VlimMin_set,double VlimMax_set);
173 void SetVlim_Delta(double VlimMin_set,double VlimMax_set);
174 void SetParameterf0(double f0);
175 void SetParameterprf(double prf);
176 void SetParameterNv( int Nv);
177 void SetParameterTw( double Tw);
178 void SetParameterdtS( double dtS);
179 };
180
181 #endif
Listing A.2: C++ Code for Spectrum Generation and Visualization
1 #include <vtkObjectFactory.h>
2 #include "vtkGenerateDopplerSpectrum.h"
3 #include "vtkUtil.hpp"
4 #include <sstream>
5 #include <windows.h>
6 #include <stdlib.h>
7 #include <stdio.h>
8 #include <algorithm>
9 #include <vector>
10 vtkStandardNewMacro(vtkGenerateDopplerSpectrum);
11 //
−−−−−−−−−−−−−−−−−−−−−−−−−−−−−−−−−−−−−−−−−−−−−−−−−−−−−−−−−−−−−−−−−−−−−−−−−−−
12 vtkGenerateDopplerSpectrum::vtkGenerateDopplerSpectrum()
13 { // Set the parameters
14 SetParameterf0(4.6174e+06);
15 SetParameterprf(4000);
16 SetParameterNv(200);
17 SetParameterTw(20e−3);
18 SetParameterdtS(5e−3);
19 SetVlim(−0.6,0.6); // this is the maximum limit for the velocity
20 SetVlim_Spec(−0.3,0.3); // this is the default velocity limit i set
96 APPENDIX A. APPENDICES
21 SetVlim_Delta(−0.1,0.1); // this is for by how much change to add or subtact the velocity scale
22 Gain=−20; // default gain, can be increased or decreased
23 LineTotal = 4; // this is total baseline length (0−4)
24 Line = LineTotal/2; // this is the default setting for the baseline when start scaning
25 // initialize the internal objects
26 FftCompute = (vtkImageFourierFilter*) vtkImageFourierFilter::New();
27 actoraxis = vtkSmartPointer<vtkContextActor>::New();
28 axesVertical = vtkSmartPointer<vtkAxis>::New();
29 axesHorizontal = vtkSmartPointer<vtkAxis>::New();
30
31 offset = 0;
32 nt = 0;
33 OutputNs = 0;
34 k = 0;
35 c =1540;
36 dt = 1/prf;
37 Nw1 = floor(Tw/dt);
38 std :: cout<<"Nw1"<<Nw1<<endl;
39 skip = floor(dtS/dt);
40 vmax= 2*c*prf/(4*f0);
41 std :: cout<<"vmax"<<vmax<<endl;
42 TimeBuffer = 16;
43 Ns= (((TimeBuffer/dt)−Nw1−1)/skip);// this corresponds to 16 sec
44 TimeSpectrum = 2;//2 seconds length, recommended for uterine artery also;
45 Ns_Spectrum= (((TimeSpectrum/dt)−Nw1−1)/skip);
46 std :: cout<<"Ns"<<Ns<<"Ns_Spectrum"<<Ns_Spectrum<<endl;
47 Delta= (((1/dt)−Nw1−1)/skip);// 1 sec time increment
48 std :: cout<<"Delta"<<Delta<<endl;
49
50 YMin_Spec = (2*Nv−1)*(VlimMin_Spec + vmax)/(2*vmax); //minimum range to be extracted
51 YMax_Spec= (2*Nv−1)*(VlimMax_Spec + vmax)/(2*vmax); //maximum range to be extracted
52 Interval = ((YMax_Spec−YMin_Spec)*40)/Nv;
53 std :: cout<<"YMin_Spec"<<YMin_Spec<<"YMax_Spec"<<YMax_Spec<<endl<<"Interval"<<Interval<<endl;
54 in = NULL;
55 out = NULL;
56 int SpectrumSize[3];
57 SpectrumSize[0] = Ns;
58 SpectrumSize[1] = Nv;
59 SpectrumSize[2] = 1;
60 SpectrumImage = AllocateVtkImageData(SpectrumSize, 1, VTK_DOUBLE); // creates Ns*Nv array of points
and allocated by the spectrumimage
61
62 int DoubleSpecImageSize[3]; // Double sized image
63 DoubleSpecImageSize[0] = Ns;

A.4. VTK BASED CODE FOR SPECTRUM GENERATION AND VISUALIZATION 97
64 DoubleSpecImageSize[1] = 2*Nv;
65 DoubleSpecImageSize[2] = 1;
66 DoubleSizedSpectrumImage = AllocateVtkImageData(DoubleSpecImageSize, 1, VTK_DOUBLE);//this is
vtkimagedata of the original spectrum with its copy
67 }
68 vtkGenerateDopplerSpectrum::~vtkGenerateDopplerSpectrum()
69 {
70 Clear(); // clears everything that is initialized in clear()
71 }
72
73 //
−−−−−−−−−−−−−−−−−−−−−−−−−−−−−−−−−−−−−−−−−−−−−−−−−−−−−−−−−−−−−−−−−−−−−−−−−−−
74 // clear internal data
75 void vtkGenerateDopplerSpectrum::Clear()
76 {
77 SpectrumImage = vtkSmartPointer<vtkImageData>();
78 actoraxis = vtkSmartPointer<vtkContextActor>();
79 axesVertical = vtkSmartPointer<vtkAxis>();
80 axesHorizontal = vtkSmartPointer<vtkAxis>();
81 DoubleSizedSpectrumImage = vtkSmartPointer<vtkImageData>();
82 FftCompute−>Delete();
83 if (in) delete(in);
84 in = NULL;
85 if (out) delete(out);
86 out = NULL;
87 }
88
89 void vtkGenerateDopplerSpectrum :: SetParameterf0(double f0_set)
90 {
91 f0 = f0_set;
92 }
93 void vtkGenerateDopplerSpectrum :: SetParameterprf(double prf_set)
94 {
95 prf = prf_set;
96 }
97 void vtkGenerateDopplerSpectrum :: SetParameterTw(double Tw_set)
98 {
99 Tw = Tw_set;
100 }
101 void vtkGenerateDopplerSpectrum :: SetParameterdtS(double dtS_set)
102 {
103 dtS = dtS_set;
104 }

98 APPENDIX A. APPENDICES
105 void vtkGenerateDopplerSpectrum :: SetParameterNv(int Nv_set)
106 {
107 Nv = Nv_set;
108 }
109
110 void vtkGenerateDopplerSpectrum :: SetVlim(double VlimMin_set,double VlimMax_set)//Myadd
111 {
112 VlimMin = VlimMin_set;
113 VlimMax = VlimMax_set;
114 }
115 void vtkGenerateDopplerSpectrum :: SetVlim_Spec(double VlimMin_set,double VlimMax_set)//Myadd
116 {
117 VlimMin_Spec = VlimMin_set;
118 VlimMax_Spec = VlimMax_set;
119 }
120 void vtkGenerateDopplerSpectrum :: SetVlim_Delta(double VlimMin_set,double VlimMax_set)//Myadd
121 {
122 VlimMin_Delta = VlimMin_set;
123 VlimMax_Delta = VlimMax_set;
124 }
125
126 void vtkGenerateDopplerSpectrum :: SetDopplerData(double* PointerToReal, double* PointerToImag,int
NumberOfSamples)
127
128 {
129 BufferSizeInput = (int) ceil(16/dt);
130 BufferSizeOutput = (int) ceil(2*Nv*((16/dt)−Nw1−1)/skip);
131 double magnitude =0;
132 double val;
133 data = (double*) SpectrumImage−>GetScalarPointer();
134 dataDouble = (double*) DoubleSizedSpectrumImage−>GetScalarPointer();
135 if (in) delete(in);
136 in = new vtkImageComplex[Nv];
137 if (out) delete(out);
138 out = new vtkImageComplex[Nv];
139 // **********************************************************************************140
141 while (Nw1−1+ nt < NumberOfSamples )// condition for calculating the columen
142 {
143 if ( NumberOfSamples < Nw1)
144 Nw1 = NumberOfSamples; //Nw1= 80 WINDOW LENGTH,floor(Tw/dt);
145 for(int j = 0; j < Nw1; j++)
146 {
147 in[j ]. Real = *(PointerToReal+j+nt);

A.4. VTK BASED CODE FOR SPECTRUM GENERATION AND VISUALIZATION 99
148 in[j ]. Imag = *(PointerToImag+j+nt);
149 // ************************** Buffer for raw data *******************************150 Input.push_back(in[j]);
151 // ******************* remove the first elements if they exceed the buffer size
152 if (Input.size() > BufferSizeInput)
153 {
154 // number of elements to pop
155 int ellNo = Input.size()−BufferSizeInput;
156 // remove the elemnts
157 Input.erase (Input.begin(), Input.begin()+ellNo);
158 }
159 // ********************************************************************************160 }
161 for(int j = Nw1; j < Nv; j++)
162 {
163 in[j ]. Real = 0; // zero pad of in until length of Nv since in is < Nv, fft rule
164 in[j ]. Imag = 0; // zero pad of in until length of Nv since in is < Nv
165 }
166
167 // ********************* FFT compute *************************************************168
169 FftCompute−>ExecuteFft(in, out, Nv);// fft is columen by columen.
170
171 for(int i = 0; i< Nv; i++)
172 {
173 magnitude = out[i].Real*out[i].Real + out[i].Imag*out[i].Imag;
174 magnitude = sqrt(magnitude);// taking the absolute
175 magnitude = magnitude*magnitude;// spectrum has to be calculated for all Nv points
176 data [k + i*Ns] = magnitude;// fft output is on data, that fills the spectrum image
177 }
178 nt = nt + skip;
179 // ********** Temporal avaraging of order 3 **************************180
181 int filterL = 5;
182 for (int i=0; i<Nv; i++)
183 {
184 double x =0;
185 for (int j=0; j<filterL ; j++)
186 {
187 if ( j <= k)
188 x = x + data[(−j + k + i*Ns)];
189 }
190 data[(k+i*Ns)]= x/filterL;
191 data[(k+i*Ns)] = 20*log10(data[(k+i*Ns)]);

100 APPENDIX A. APPENDICES
192 }
193
194 // ******** dataDouble is data for the double size spectrum which is the copy of the single side
spectrum, so i have to keep the data of single side spectrum
195
196 for (int i= 0; i<2*Nv;i++)
197 {
198 if ( i<Nv)
199 dataDouble[(k+i*Ns)]= data[(k+ i*Ns)];
200 else
201 dataDouble[(k+i*Ns)]= data[(k+(i−Nv)*Ns)];
202 // *************** Buffer for image **************************************203 Output.push_back(dataDouble[k + i*Ns]);// it is a vector
204 if (Output.size() > BufferSizeOutput)
205 {
206 // number of elements to pop
207 int ellNoO = Output.size()−BufferSizeOutput;
208
209 // remove the elemnts
210 Output.erase (Output.begin(), Output.begin()+ellNoO);
211 }
212 }
213 k = k+1;
214 if (k == Ns_Spectrum)
215 {
216 k=0;
217 }
218 }
219 nt = 0; // preparing for the next no of samples
220 offset = offset + skip; // is used for update checking
221 if (offset>7000)// offset 7000 is approximate length of the data
222 offset =0;
223 }
224
225
226 void vtkGenerateDopplerSpectrum :: PlayFrames()
227 {
228 it = Output.begin();
229 OutputNs= (Output.size()/(2*Nv));
230 for (int k=0;k<OutputNs;k++)// computing the columens until the output size
231 {
232 for (int i=0;i<2*Nv;i++)
233 {
234 dataDouble[k+i*Ns]= *it ;// assigns the value from the buffer
A.4. VTK BASED CODE FOR SPECTRUM GENERATION AND VISUALIZATION 101
235 it = it+1;
236 }
237 }
238 }
239 void vtkGenerateDopplerSpectrum :: clearBuffer()
240 {
241 it = Output.begin();
242 OutputNs= (Output.size()/(2*Nv));
243 for (int k=0;k<OutputNs;k++)// computing the columens until the output size
244 {
245 for (int i=0;i<2*Nv;i++)
246 {
247 dataDouble[k+i*Ns]= −100 ;// assigns the datadouble a very small value so that it is too
black
248 }
249 }
250 Output.clear();// this clear functions clears the previous buffer
251 // intializations after clearing the buffer
252 k= 0;
253 nt=0;
254 offset = 0;
255 OutputNs = 0;
256 }
257 void vtkGenerateDopplerSpectrum :: GainUp()
258 {
259 if (Gain < 20)
260 Gain = Gain + 30;
261 }
262 void vtkGenerateDopplerSpectrum :: GainDown()
263 {
264 if (Gain > −70)
265 Gain = Gain − 5;
266 }
267 void vtkGenerateDopplerSpectrum :: TimeScaleUp()
268 {
269 if (Ns_Spectrum+Delta <= Ns)
270 Ns_Spectrum= Ns_Spectrum +Delta;
271 }
272 void vtkGenerateDopplerSpectrum :: TimeScaleDown()
273 {
274 if (Ns_Spectrum−Delta >= Delta)
275 Ns_Spectrum = Ns_Spectrum−Delta;
276 }
277 void vtkGenerateDopplerSpectrum :: VelocityScaleUp()

102 APPENDIX A. APPENDICES
278 {
279
280 if (VlimMin_Spec + VlimMin_Delta >= VlimMin)
281 VlimMin_Spec = VlimMin_Spec + (2*Line/LineTotal)*VlimMin_Delta;
282
283 if (VlimMax_Spec + VlimMax_Delta <= VlimMax )
284 VlimMax_Spec = VlimMax_Spec + (2*(1−(Line/LineTotal)))*VlimMax_Delta;
285 }
286 void vtkGenerateDopplerSpectrum :: VelocityScaleDown()
287 {
288 if (VlimMin_Spec−VlimMin_Delta <= (2*Line/LineTotal)*VlimMin_Delta)
289 VlimMin_Spec = VlimMin_Spec−(2*Line/LineTotal)*VlimMin_Delta;
290
291 if (VlimMax_Spec−VlimMax_Delta >= (2*(1−(Line/LineTotal)))*VlimMax_Delta)
292 VlimMax_Spec = VlimMax_Spec − (2*(1−(Line/LineTotal)))*VlimMax_Delta;
293 }
294 void vtkGenerateDopplerSpectrum :: BaselineDown()//Base Line goes from 2(default) to 0
295 {
296 double VRange = VlimMax_Spec−VlimMin_Spec;// the range between max and min
297 if (Line > 0)
298 {
299 Line = Line−1;
300 VlimMin_Spec = VlimMin_Spec+ (1/LineTotal)*VRange ;
301 VlimMax_Spec = VlimMax_Spec+ (1/LineTotal)*VRange;
302 std :: cout<<"LineDown"<<Line<<endl;
303 }
304 }
305 void vtkGenerateDopplerSpectrum :: BaselineUp()// Base line goes until 4
306 {
307 double VRange = VlimMax_Spec−VlimMin_Spec;
308 if (Line < LineTotal) // BaseLineTotal in this case is 4, in general it can be any number
309 {
310 Line = Line + 1;
311 VlimMin_Spec = VlimMin_Spec− (1/LineTotal)*VRange ;
312 VlimMax_Spec = VlimMax_Spec− (1/LineTotal)*VRange;
313 std :: cout<<"LineUp"<<Line<<endl;
314 }
315 }
316
317 void vtkGenerateDopplerSpectrum :: Axis()
318 {
319 for (int n=0; n<Nv; n+= Interval)
320 {
321 int t= floor((double)((Nv−1)/Interval))* Interval ;

A.4. VTK BASED CODE FOR SPECTRUM GENERATION AND VISUALIZATION 103
322 v[n]= floor((100*(VlimMax_Spec− n*((VlimMax_Spec−VlimMin_Spec)/(t)))));
323 positionsY−>InsertNextValue(v[n]);
324 std :: ostringstream buff;
325 buff<<v[n];
326 labelsY−>InsertNextValue(buff.str());//displays axiswith the whole v[n]
327 }
328 axesVertical−>SetPosition( vtkAxis::RIGHT);
329 actoraxis−>GetScene()−>AddItem(axesVertical);
330 axesVertical−>SetRange(100*VlimMin_Spec, 100*VlimMax_Spec);
331 axesVertical−>SetTickPositions(positionsY.GetPointer());
332 axesVertical−>SetTickLabels(labelsY.GetPointer());
333 axesVertical−>SetPoint1(vtkVector2f(1* 69 + 845, 138)); // this is for secreen resolution of 1366 X 768
334 axesVertical−>SetPoint2(vtkVector2f(1* 69 + 845, 605));// it sets the initial and final points for the vertical
axis based on the screen coordinate
335 axesVertical−>Update();// displays the tick points
336
337 // ************************** Axis horizontal ***********************************************338
339 TickNumber = 8;
340 Increment = (int) floor((double)(Ns_Spectrum/TickNumber));
341 std :: cout<<"Increment"<<Increment<<endl;
342 int m=0;
343 for (; m<=Ns_Spectrum; m+= Increment)
344 {
345 tS[m]= m*(skip)*dt;//calcualtes the time values until the needed spectrum length of needed interval
346 std :: cout<<"tS[m]"<<tS[m]<<endl;
347 positionsX−>InsertNextValue(tS[m]);
348 std :: ostringstream buff;
349 buff<<−(floor((double)(Ns_Spectrum/Increment))*Increment)*(skip)*dt+tS[m];
350 labelsX−>InsertNextValue(buff.str());
351 }
352 axesHorizontal−>SetPosition( vtkAxis::BOTTOM);
353 axesHorizontal−>SetPoint1(vtkVector2f(1 * 69 + 380, 138)); // this is // this is for secreen resolution of
1366 X 768
354 axesHorizontal−>SetPoint2(vtkVector2f(1 * 69 + 845, 138)); // it sets the initial and final points for the
horizontal axis based on the screen coordinate
355 actoraxis−>GetScene()−>AddItem(axesHorizontal);
356 axesHorizontal−>SetRange(0,tS[m−Increment]);
357 axesHorizontal−>SetTickPositions(positionsX.GetPointer());
358 axesHorizontal−>SetTickLabels(labelsX.GetPointer());
359 axesHorizontal−>Update();//it assigngs the labels
360 }
361
362 void vtkGenerateDopplerSpectrum :: clearall()

104 APPENDIX A. APPENDICES
363 { positionsX−>Reset();
364 labelsX−>Reset();
365 positionsY−>Reset();
366 labelsY−>Reset();
367 }
368
369 void vtkGenerateDopplerSpectrum :: TimeAxisUpdate()
370 {
371 TickNumber = 8;
372 Increment = (int) floor((double)(Ns_Spectrum/TickNumber));
373 std :: cout<<"Increment"<<Increment<<endl;
374 int m=0;
375 for (; m<=Ns_Spectrum; m+= Increment)
376 {
377 tS[m]= m*(skip)*dt;
378 std :: cout<<"tS[m]"<<tS[m]<<endl;
379 positionsX−>InsertNextValue(tS[m]);
380 std :: ostringstream buff;
381 buff<<−(floor((double)(Ns_Spectrum/Increment))*Increment)*(skip)*dt+tS[m];
382 labelsX−>InsertNextValue(buff.str());
383 }
384 axesHorizontal−>SetRange(0,tS[m−Increment]);
385 axesHorizontal−>SetTickPositions(positionsX.GetPointer());
386 axesHorizontal−>SetTickLabels(labelsX.GetPointer());
387 axesHorizontal−>Update();//it assigngs the labels
388 }
389 void vtkGenerateDopplerSpectrum :: VelocityAxisUpdate()
390 {
391 YMin_Spec = (2*Nv−1)*(VlimMin_Spec + vmax)/(2*vmax); //minimum range to be extracted
392 YMax_Spec= (2*Nv−1)*(VlimMax_Spec + vmax)/(2*vmax); //maximum range to be extracted
393 Interval = ((YMax_Spec−YMin_Spec)*100)/Nv;
394 for (int n=0; n<Nv; n+= Interval)
395 {
396 int t= floor((double)((Nv−1)/Interval))* Interval ;
397 v[n]= ((100*(VlimMax_Spec− n*((VlimMax_Spec−VlimMin_Spec)/(t)))));
398 positionsY−>InsertNextValue(v[n]);
399 std :: ostringstream buff;
400 buff<<v[n];
401 if ((( n/Interval)%2) == 0 || n== t ) // if even
402 {
403 labelsY−>InsertNextValue(buff.str());
404 }
405 else
406 labelsY−>InsertNextValue("");

A.4. VTK BASED CODE FOR SPECTRUM GENERATION AND VISUALIZATION 105
407 }
408 axesVertical−>SetRange(100*VlimMin_Spec, 100*VlimMax_Spec);// makes it to increase proportionally
409 axesVertical−>SetTickPositions(positionsY.GetPointer());
410 axesVertical−>SetTickLabels(labelsY.GetPointer());
411 axesVertical−>Update();// updates the velocity values
412 }