Embed Size (px)
Citation preview

Table S1. Genotype of bacterial strains.Strains Histidine mutation LPS Repair (ΔuvrB1) R-factor pAQ1 plasmid TA98 hisD3052 rfa ΔuvrB +R -TA100 hisG46 rfa ΔuvrB +R -TA102 hisG428 rfa +1 +R +2
TA1535 hisG46 rfa ΔuvrB -R -TA1537 hisC3076 rfa ΔuvrB -R -1: "Δ" gene deletion2: Wild type3: Contain the multicopy plasmid pAQ1 carrying hisG428 insertion mutation
Table S2. Result of genotyping of Salmonella typhimurium strains.
Salmonella typhimurium strains
Histidine requirement UV sensitivity Crystal violet sensitivity
Ampicillin resistance
Tetracycline resistance
Spontaneous revertants
His+ Bio+ Plate
His- Bio+
Plate UV irradiated Zone of growth inhibition* Ampicillin plate Ampicillin
Tetracycline plate without S9
+ - - + + - 33.7 ± 3.8TA100 + - - + + - 136.7 ± 2.5TA102 + - + + + + 305.7 ± 4.0TA1535 + - - + - - 8.3 ± 0.6TA1537 + - - + - - 10.7 ± 3.2+: a clear zone of inhibition appeared around the disc
Table S3. Result of dose range finding test for AMES test (in TA100).
Dose (mg/plate) Number of revertants /plate
without S9 mixture Negative control (sterile water, 50 µL/plate) 111.0 ± 1.0Positive control (Sodium azide, 1 µg/plate) 613.3 ± 12.9*Vehicle control (DMSO, 50 µL/plate) 105.0 ± 1.0
T. camphoratus extract
5 102.7 ± 7.11.58 92.0 ± 5.60.50 110.7 ± 4.20.158 112.7 ± 9.30.050 105.0 ± 13.2
All data presented as mean ± SD., n = 3*more than two-fold increase in revertants over the negative control
Table S4. Result of cytotoxicity study for chromosome aberration test.
T. camphoratus extract (µg/mL) Cell viability (%)
Short-term (3-6 hr) Long-term (18-22 hr) - S9 + S9 - S9
1500 -40.03 ± 3.00 -81.17 ± 13.29 -84.15 ± 6.77500 48.40 ± 14.94 -75.69 ± 2.65 -18.16 ± 5.77166.7 89.71 ± 10.08 97.32 ± 9.02 -12.18 ± 6.7055.6 88.19 ± 11.98 91.95 ± 10.94 51.64 ± 7.4118.5 80.26 ± 8.72 92.55 ± 7.03 110.18 ± 17.806.2 92.41 ± 13.39 85.52 ± 19.38 146.82 ± 8.95Negative control (culture medium) 100.00 ± 18.76 100.00 ± 12.03 100.00 ± 15.01Vehicle control (DMSO) 117.91 ± 10.18 87.03 ± 14.24 76.09 ± 16.76Positive control (Mitomycin C) 51.23 ± 3.19 -- 44.65 ± 9.83Positive control (Benzo(a)pyrene) -- 49.04 ± 3.09 --All data presented as mean ± SD.

Table S5. Mortality and ophthalmologic examination in rats treated with T. camphoratus extract for 13 weeks.
Gender Dose (mg/kg/day)Mortality (N/N) 1 Ophthalmologic Examination (N/N) 1
Main study Recovery Before study Before Necropsy (Day 91 or Day119)
Male 0 0/12 0/6 0/18 0/18425 0/12 - 0/12 0/12850 0/12 - 0/12 0/12
1700 0/12 0/6 0/18 0/18Female 0 0/12 0/6 0/18 0/18
425 0/12 - 0/12 1/12#
850 0/12 - 0/12 0/12 1700 0/12 1/6* 0/18 0/171N/N: Number of animals found dead or ophthalmologic abnormality / Total number of animals.-Not available*One female rat from 1700 mg/kg dosage group was found dead due to gavage error.#Corneal opacity in the left eye was observed in one female rat from 425 mg/kg dosage group.
Table S6. Mean body weight gains in rats treated with T. camphoratus extract for 13 weeks.
TimeMain (mg/kg) Recovery (mg/kg)
0 425 850b 1700 0 1700c
MaleWeek 1 59.91 ± 5.14 56.23 ± 4.68 59.24 ± 6.01 56.70 ± 4.83 61.95 ± 9.79 53.63 ± 7.25Week 2 62.72 ± 5.41 59.41 ± 8.07 62.02 ± 5.95 55.57 ± 6.96 63.90 ± 11.69 60.53 ± 4.95Week 3 57.18 ± 7.31 51.60 ± 5.13 53.46 ± 9.19 52.68 ± 7.88 59.30 ± 10.35 55.60 ± 6.04Week 4 45.85 ± 4.35 42.93 ± 7.39 44.53 ± 7.16 42.53 ± 6.97 48.23 ± 14.24 47.23 ± 5.26Week 5 36.85 ± 6.60 32.98 ± 4.12 34.98 ± 7.36 30.60 ± 5.89 39.13 ± 8.16 35.18 ± 4.65Week 6 33.42 ± 8.36 32.61 ± 7.91 39.18 ± 7.49 35.48 ± 6.76 35.58 ± 11.27 34.18 ± 3.97Week 7 22.89 ± 4.36 20.23 ± 6.59 20.56 ± 3.40 20.17 ± 6.05 22.55 ± 4.05 16.48 ± 5.88Week 8 20.73 ± 4.29 17.88 ± 6.73 22.31 ± 6.33 21.11 ± 6.45 22.73 ± 7.68 21.15 ± 4.37Week 9 22.66 ± 6.11 17.38 ± 7.39 17.60 ± 6.43 19.40 ± 4.32 23.20 ± 8.55 22.65 ± 6.83Week 10 14.18 ± 5.37 11.52 ± 7.13 15.15 ± 6.34 12.89 ± 4.25 11.37 ± 10.42 16.05 ± 3.79Week 11 17.08 ± 3.41 15.01 ± 4.64 18.37 ± 6.62 16.46 ± 4.01 19.90 ± 7.65 16.33 ± 4.56Week 12 12.55 ± 3.14 10.48 ± 3.37 13.09 ± 3.77 9.76 ± 4.05 10.25 ± 2.71 10.02 ± 3.49Week 13 9.03 ± 3.76 11.38 ± 4.27 10.85 ± 5.46 9.31 ± 3.32 10.65 ± 3.55 7.88 ± 4.33Week 14 11.33 ± 3.04 9.15 ± 4.57Week 15 8.30 ± 7.09 10.32 ± 2.90Week 16 15.55 ± 4.19 12.10 ± 3.72Week 17 8.12 ± 6.13 7.02 ± 5.42
FemaleWeek 1 21.79 ± 6.12 24.33 ± 8.45 20.27 ± 5.00 24.74 ± 8.61 24.93 ± 9.25 22.54 ± 5.91Week 2 20.64 ± 6.44 22.56 ± 6.07 18.25 ± 5.09 24.30 ± 5.95 26.63 ± 3.22 23.36 ± 8.56Week 3 16.60 ± 6.32 16.71 ± 4.41 16.07 ± 6.67 18.59 ± 7.35 12.77 ± 6.15 20.44 ± 1.78 *Week 4 19.21 ± 5.69 16.68 ± 8.44 16.48 ± 4.39 19.46 ± 8.09 19.03 ± 7.04 15.98 ± 6.63Week 5 10.02 ± 6.48 9.14 ± 7.29 8.45 ± 5.36 10.53 ± 5.77 12.52 ± 7.93 11.38 ± 9.36Week 6 13.33 ± 6.56 11.07 ± 8.81 7.72 ± 8.01 10.70 ± 7.19 12.52 ± 3.38 13.18 ± 4.56Week 7 4.53 ± 6.48 8.29 ± 7.44 9.38 ± 6.31 6.22 ± 4.65 6.02 ± 2.46 6.86 ± 4.55Week 8 7.56 ± 6.81 8.84 ± 6.86 6.68 ± 3.82 7.21 ± 5.52 2.95 ± 3.63 4.58 ± 6.39Week 9 4.48 ± 5.43 2.72 ± 6.38 1.42 ± 4.10 6.95 ± 4.25 9.03 ± 7.18 4.74 ± 7.35Week 10 6.65 ± 5.68 7.51 ± 7.84 4.01 ± 6.57 5.28 ± 5.77 6.02 ± 5.74 3.18 ± 7.53Week 11 7.48 ± 7.99 6.16 ± 3.65 7.50 ± 6.05 9.47 ± 7.02 4.52 ± 4.31 7.96 ± 5.26Week 12 2.42 ± 6.27 0.78 ± 6.14 4.75 ± 5.48 3.21 ± 6.59 2.17 ± 5.86 3.86 ± 4.95Week 13 0.87 ± 5.33 -1.23 ± 5.59 -0.28 ± 4.91 1.03 ± 5.86 -2.35 ± 4.96 0.80 ± 5.93Week 14 10.47 ± 3.13 3.14 ± 5.18 *Week 15 3.00 ± 3.05 5.96 ± 4.77Week 16 1.53 ± 3.66 4.64 ± 3.89Week 17 1.10 ± 4.84 0.86 ± 3.36All data presented as mean ± SD. *p < 0.05 compared to vehicle control.b n = 11; c N = 5 (One female rat was found dead due to gavage error.)Historical control data for female rats: Week 3 (g): 0.63-29.26; Week 14 (g): -5.39- 14.32.

Table S7. Results of food consumption in rats treated with T. camphoratus extract for 13 weeks.Average Food Consumption (g/100 g body weight of rat /day)
Main (mg/kg) Recovery (mg/kg)Time 0 425 850b 1700 0 1700c
MaleWeek 1 14.75 ± 0.68 14.25 ± 0.41 14.28 ± 0.18 13.75 ± 0.63 * 14.57 ± 0.74 13.50 ± 0.70Week 2 12.78 ± 0.81 12.37 ± 0.54 12.40 ± 0.33 11.97 ± 0.48 12.33 ± 0.87 12.07 ± 0.15Week 3 10.72 ± 0.39 10.45 ± 0.18 10.55 ± 0.33 10.47 ± 0.54 10.53 ± 0.65 10.37 ± 0.31Week 4 9.48 ± 0.45 9.25 ± 0.21 9.30 ± 0.32 9.12 ± 0.48 9.23 ± 0.49 9.17 ± 0.40Week 5 8.08 ± 0.29 8.02 ± 0.15 8.05 ± 0.32 7.78 ± 0.31 8.00 ± 0.50 7.77 ± 0.35Week 6 7.27 ± 0.38 7.27 ± 0.12 7.33 ± 0.19 7.15 ± 0.24 7.20 ± 0.40 7.07 ± 0.21Week 7 6.78 ± 0.15 6.85 ± 0.18 6.77 ± 0.15 6.63 ± 0.27 6.77 ± 0.42 6.43 ± 0.25Week 8 6.47 ± 0.27 6.33 ± 0.12 6.48 ± 0.25 6.35 ± 0.32 6.43 ± 0.21 6.10 ± 0.36Week 9 6.08 ± 0.24 5.98 ± 0.28 6.03 ± 0.23 6.00 ± 0.32 6.07 ± 0.35 5.97 ± 0.06Week 10 5.80 ± 0.21 5.67 ± 0.33 5.75 ± 0.21 5.65 ± 0.31 5.70 ± 0.36 5.57 ± 0.06Week 11 5.87 ± 0.20 5.80 ± 0.28 5.85 ± 0.15 5.67 ± 0.39 5.77 ± 0.25 5.57 ± 0.06Week 12 5.65 ± 0.18 5.63 ± 0.23 5.63 ± 0.21 5.53 ± 0.23 5.50 ± 0.36 5.37 ± 0.06Week 13 5.58 ± 0.19 5.60 ± 0.23 5.58 ± 0.15 5.42 ± 0.19 5.17 ± 0.25 4.87 ± 0.12Week 14 5.17 ± 0.21 5.20 ± 0.20Week 15 4.77 ± 0.29 4.87 ± 0.21Week 16 5.00 ± 0.36 4.90 ± 0.17Week 17 4.90 ± 0.26 4.90 ± 0.17
FemaleWeek 1 11.27 ± 0.36 11.38 ± 1.19 10.76 ± 0.63 11.55 ± 0.65 11.17 ± 0.15 11.40 ± 0.28c
Week 2 10.60 ± 0.55 10.55 ± 0.62 10.22 ± 0.23 10.88 ± 0.74 10.60 ± 0.10 10.87 ± 0.70Week 3 9.80 ± 0.49 9.60 ± 0.23 9.44 ± 0.21 9.93 ± 0.27 9.30 ± 0.36 9.70 ± 0.10Week 4 9.88 ± 0.69 9.32 ± 0.69 9.06 ± 0.50 9.52 ± 0.36 9.43 ± 0.35 9.30 ± 0.36Week 5 8.28 ± 0.38 8.33 ± 0.30 8.10 ± 0.19 8.33 ± 0.23 8.47 ± 0.31 8.53 ± 0.15Week 6 8.20 ± 0.36 7.92 ± 0.41 7.68 ± 0.41 7.85 ± 0.42 7.90 ± 0.17 8.03 ± 0.25Week 7 7.68 ± 0.61 7.60 ± 0.38 7.62 ± 0.15 7.45 ± 0.38 7.37 ± 0.40 7.40 ± 0.36Week 8 7.65 ± 0.55 7.45 ± 0.29 7.20 ± 0.21 7.23 ± 0.42 7.23 ± 0.42 7.27 ± 0.46Week 9 7.20 ± 0.69 7.02 ± 0.39 6.80 ± 0.22 6.97 ± 0.40 7.13 ± 0.40 7.00 ± 0.10Week 10 6.95 ± 0.68 6.95 ± 0.20 6.66 ± 0.34 6.77 ± 0.36 6.80 ± 0.00 6.77 ± 0.35Week 11 7.47 ± 0.63 7.03 ± 0.26 6.88 ± 0.29 7.05 ± 0.40 6.97 ± 0.15 7.07 ± 0.31Week 12 7.00 ± 0.66 6.63 ± 0.40 6.42 ± 0.31 6.62 ± 0.39 6.87 ± 0.35 6.87 ± 0.21Week 13 6.73 ± 0.64 6.50 ± 0.21 6.44 ± 0.42 6.37 ± 0.48 6.23 ± 0.15 6.20 ± 0.17Week 14 7.13 ± 0.12 6.87 ± 0.38Week 15 6.87 ± 0.64 6.47 ± 0.21Week 16 6.40 ± 0.26 6.50 ± 0.10Week 17 6.27 ± 0.12 6.17 ± 0.15All data presented as mean ± SD. *p < 0.05 compared to vehicle control.bn = 5; cn = 2; historical control data for male rats: Week 1 (g): 7.60 ~ 14.69.

Table S8. Results of clinical observation in rats treated with T. camphoratus extract for 13 weeks.Main Incidence (n’/n’)1
Dose (mg/kg/day) Clinical signs Day
1-9Day
10-14Day
15-31Day
32-35Day
36-37Day
38-50Day
51-52Day
53-71Day 72
Day 73-83
Day 84
Day 85-91 Total Incidence (n/n)2
Male
0Hair loss 0/12 0/12 0/12 1/12 0/12 0/12 0/12 0/12 0/12 0/12 0/12 0/12 1/12Wounds 0/12 0/12 0/12 1/12 0/12 0/12 0/12 0/12 0/12 0/12 0/12 0/12 1/12
425Hair loss 0/12 0/12 0/12 0/12 0/12 1/12 1/12 1/12 1/12 0/12 0/12 0/12 1/12Wounds 0/12 0/12 0/12 0/12 0/12 0/12 0/12 0/12 1/12 1/12 1/12 1/12 1/12
850 Wounds 0/12 0/12 0/12 0/12 0/12 0/12 1/12 1/12 1/12 1/12 1/12 0/12 1/12
1700Hair loss 0/12 0/12 0/12 0/12 0/12 0/12 0/12 1/12 1/12 1/12 2/12 2/12 1/12Wounds 0/12 0/12 0/12 0/12 0/12 0/12 0/12 1/12 1/12 1/12 1/12 1/12 2/12
Day 1-21
Day 22-28
Day 29-36
Day 37-57
Day 58-70
Day 71-77
Day 78-80
Day 81-83
Day 84
Day 85-89
Day 90-91 Total Incidence (n/n)2
Female
0 No abnormal finding 0/12425 Hair loss 0/12 2/12 2/12 3/12 3/12 3/12 3/12 3/12 4/12 4/12 4/12 4/12
850
Hair loss 0/12 0/12 0/12 0/12 0/12 1/12 1/12 1/12 1/12 1/12 1/12 1/12Dyspnea 0/12 0/12 0/12 0/12 0/12 0/12 1/12 1/12 1/12 1/12 1/12 1/12Audible
respiration 0/12 0/12 0/12 0/12 0/12 0/12 0/12 1/12 1/12 1/12 1/12 1/12
Soft feces 0/12 0/12 0/12 0/12 0/12 0/12 0/12 0/12 0/12 1/12 0/12 1/121700 Wounds 0/12 0/12 1/12 1/12 3/12 3/12 3/12 3/12 3/12 3/12 3/12 3/12
Recovery
Day 1-9
Day 10-14
Day 15-31
Day 32-35
Day 36-37
Day 38-50
Day 51-58
Day 59-72
Day 73-83
Day 84-91
Day 92-119 Total Incidence (n/n)2
Male0 No abnormal finding 0/6
1700 Teeth damage 0/6 0/6 0/6 0/6 0/6 0/6 1/6 0/6 0/6 0/6 0/6 1/6
Day 1-5
Day 6
Day 7-31
Day 32-35
Day 36-37
Day 38-50
Day 51-58
Day 59-72
Day 73-79
Day 80-91
Day 92-119 Total Incidence (n/n)2
Female0 Hair loss 0/6 0/6 0/6 0/6 0/6 0/6 0/6 0/6 0/6 1/6 1/6 1/6
1700 Found dead 0/6 1/5 0/5 0/5 0/5 0/5 0/5 0/5 0/5 0/5 0/5 1/61 n’/n’: Number of animals with observed sign / Number of animals alive.2 n/n: Total number of animals with observable sign / Total number of animals examined.

Table S9. Results of histopathologic findings in rats treated with T. camphoratus extract for 13 weeks. Vehicle control 1700 mg/kgGender Male Female Male FemaleHistopathologic findings Sa N/Nc (mean severity score ± SD)b
Thyroid
Cyst, ultimobranchial, focal 1 0/12 (0)3
0/12 (0)
1/12 (0.08 ± 0.29)
0/12 (0)
Liver
Necrosis, focal 1 1/12 (0.08 ± 0.29)
0/12 (0)
1/12 (0.08 ± 0.29)
0/12 (0)
Infiltration, mononuclear cell, focal 1 0/12 (0)
2/12 (0.17 ± 0.39)
0/12 (0)
0/12 (0)
Kidneys
Infiltration, mononuclear cell, focal 1 0/12 (0)
0/12 (0)
1/12 (0.08 ± 0.29)
0/12 (0)
Mineralization, cortex, multifocal 1-3 0/12 (0)
6/12 (0.67 ± 0.78)
0/12 (0)
9/12 (1.08 ± 0.90)
Adrenals
Hypertrophy, cortex, diffuse 1 0/12 (0)
0/12 (0)
0/12 (0)
2/12 (0.17 ± 0.39)
Prostate
Infiltration, mononuclear cell, focal 1-2 6/12 (0.67 ± 0.78) N/A 3/12
(0.42 ± 0.79) N/A
Recovery-Vehicle control Recovery -1700 mg/kgGender Male Female Male FemaleHistopathologic findings Sa N/Nc (mean severity score ± SD) c
Harderian glands
Infiltration, mononuclear cell, focal 1 0/6 (0)3
1/6 (0.17 ± 0.41)
0/6 (0)
0/5 (0)
Pituitary
Cyst, focal 1 0/6 (0)
0/6 (0)
1/6 (0.17 ± 0.41)
0/5 (0)
Thymus
Atrophy, diffuse 3 0/6 (0)
1/6 (0.17 ± 0.41)
0/6 (0)
0/5 (0)
Pancreas
Degeneration/necrosis, focal 1 1/6 (0.17 ± 0.41)
0/6 (0)
0/6 (0)
0/5 (0)
Liver
Necrosis, focal 1 1/6 (0.17 ± 0.41)
0/6 (0)
0/6 (0)
1/5 (0.20 ± 0.45)
Kidneys
Mineralization, cortex, multifocal 1-3 0/6 (0)
3/6 (0.50 ± 0.55)
1/6 (0.17 ± 0.41)
3/5 (1.00 ± 1.22)
Prostate
Infiltration, mononuclear cell, focal 1-2 2/6 (0.33 ± 0.52) N/A 2/6
(0.50 ± 0.84) N/A
N/A: Not applicableaThe severity grading scheme: 1=minimal (< 10%), 2=mild (10-39%), 3=moderate (40-79%), 4= marked (80-100%).bThe final numerical score was calculated by dividing the sum of the score of affected dogs by the total number of examined rats.c (N/N) Incidence rate=Animal numbers of histopathologic findings / Animal numbers of histopathologic examination
Table S10. Mortality and ophthalmologic examination in rats treated with T. camphoratus extract for 26 weeks.
GenderDose (mg/kg/day) Mortality (N/N) 1 Ophthalmologic Examination (N/N) 1
Main study Recovery Before study Before NecropsyMale 0 0/22 0/12 0/34 0/34
850 0/22 - 0/22 0/221700 0/22 - 0/22 0/22
3400 0/22 0/12 0/34 0/34Female 0 0/22 0/12 0/34 0/34
425 0/22 - 0/22 0/22850 0/22 - 0/22 0/22
1700 0/22 0/12 0/34 0/341N/N: Number of animals found dead or ophthalmologic abnormality / Total number of animals.-Not available

Table S11. Mean body weight gains in rats treated with T. camphoratus extract for 26 weeks.
Time Main (mg/kg) Recovery (mg/kg)0 850 1700 3400 0 3400
MaleWeek 1 53.36 ± 5.85 54.86 ± 4.78 57.33 ± 5.75 57.06 ± 7.42 52.66 ± 3.31 58.82 ± 5.91*Week 2 56.25 ± 6.25 53.57 ± 5.97 54.03 ± 6.32 55.07 ± 8.11 52.39 ± 5.28 53.59 ± 7.31Week 3 44.62 ± 6.63 46.40 ± 7.08 45.85 ± 6.52 44.65 ± 7.44 44.94 ± 4.35 48.57 ± 6.55Week 4 41.86 ± 6.69 44.53 ± 3.69 41.78 ± 7.73 41.62 ± 6.83 40.15 ± 4.54 42.92 ± 6.59Week 5 27.30 ± 5.57 28.10 ± 5.50 28.05 ± 6.05 26.40 ± 6.95 25.33 ± 3.85 27.19 ± 9.34Week 6 27.47 ± 5.88 26.90 ± 4.84 27.70 ± 4.55 24.07 ± 6.80 26.70 ± 3.95 28.67 ± 4.16Week 7 24.75 ± 5.66 25.37 ± 4.42 24.30 ± 4.74 24.35 ± 5.33 24.28 ± 4.39 23.12 ± 10.88Week 8 19.59 ± 4.87 18.57 ± 4.31 19.54 ± 6.19 17.42 ± 8.18 22.05 ± 5.47 18.06 ± 9.54Week 9 15.80 ± 5.00 14.87 ± 4.46 15.43 ± 4.96 17.62 ± 5.04 14.81 ± 4.64 18.24 ± 5.44Week 10 12.60 ± 4.50 13.26 ± 5.02 14.18 ± 4.97 13.25 ± 7.24 15.05 ± 4.52 12.63 ± 8.85Week 11 7.43 ± 4.88 7.75 ± 3.81 8.50 ± 5.15 8.55 ± 5.82 8.28 ± 3.59 9.66 ± 5.38Week 12 10.10 ± 3.69 10.48 ± 5.91 8.50 ± 4.09 11.90 ± 4.39 11.79 ± 3.30 12.69 ± 5.80Week 13 -1.69 ± 4.55 -1.32 ± 6.42 -4.08 ± 6.06 -9.39 ± 11.80* -7.53 ± 7.51 -8.71 ± 7.50Week 14 12.16 ± 4.97 12.80 ± 7.98 11.99 ± 5.50 14.28 ± 5.76 16.20 ± 4.21 17.19 ± 4.61Week 15 12.42 ± 3.86 11.81 ± 4.59 9.75 ± 8.36 6.53 ± 10.71* 10.37 ± 4.52 4.01 ± 9.62Week 16 9.05 ± 4.76 8.55 ± 3.81 8.29 ± 6.09 9.70 ± 6.85 9.16 ± 3.49 11.09 ± 4.76Week 17 8.05 ± 3.83 10.02 ± 4.81 10.20 ± 4.69 11.09 ± 5.61 8.40 ± 4.83 12.52 ± 2.98*Week 18 7.88 ± 4.65 7.37 ± 4.32 7.83 ± 3.81 9.45 ± 5.13 8.18 ± 3.21 9.05 ± 6.02Week 19 5.62 ± 3.23 6.67 ± 3.73 7.94 ± 6.10 6.48 ± 9.48 5.27 ± 5.61 6.52 ± 8.47Week 20 6.36 ± 4.80 6.74 ± 4.79 6.13 ± 6.07 8.19 ± 5.12 6.91 ± 3.08 4.98 ± 8.56Week 21 9.07 ± 3.67 8.12 ± 3.71 8.60 ± 5.11 8.90 ± 5.76 8.16 ± 5.20 8.90 ± 3.83Week 22 6.26 ± 3.21 6.04 ± 4.77 8.47 ± 3.22 4.55 ± 6.74 2.44 ± 4.47 6.01 ± 4.82Week 23 2.52 ± 5.85 7.11 ± 3.63 * 5.75 ± 5.48 4.81 ± 5.23 3.76 ± 2.70 1.23 ± 8.50Week 24 4.95 ± 5.14 4.19 ± 4.12 4.68 ± 6.52 5.57 ± 5.91 4.57 ± 3.52 3.78 ± 6.27Week 25 1.67 ± 6.42 2.91 ± 2.95 1.84 ± 4.21 3.40 ± 5.30 2.57 ± 3.67 4.27 ± 4.10Week 26 1.17 ± 6.21 -2.00 ± 3.52 -0.35 ± 5.97 0.33 ± 8.10 -0.18 ± 6.29 -0.41 ± 4.43Week 27 3.47 ± 3.22 -5.33 ± 6.42 *Week 28 15.68 ± 4.44 14.65 ± 8.10Week 29 3.75 ± 7.28 7.02 ± 5.45Week 30 11.58 ± 3.57 9.85 ± 6.06
Female 0 425 850 1700 0 1700Week 1 24.31 ± 4.22 25.23 ± 5.41 22.18 ± 3.88 25.42 ± 6.63 23.51 ± 3.35 26.98 ± 5.89Week 2 22.13 ± 5.08 21.53 ± 5.86 20.26 ± 5.02 20.89 ± 4.75 21.23 ± 4.50 22.63 ± 4.65Week 3 19.34 ± 3.42 19.08 ± 4.76 17.93 ± 6.81 17.48 ± 5.94 20.67 ± 5.91 20.08 ± 7.73Week 4 16.99 ± 6.25 15.76 ± 4.52 15.21 ± 4.27 16.10 ± 4.52 13.16 ± 4.06 15.60 ± 7.36Week 5 11.36 ± 4.47 12.82 ± 4.60 9.41 ± 3.97 11.91 ± 5.61 13.96 ± 4.25 12.65 ± 3.32Week 6 12.15 ± 3.70 11.26 ± 3.57 10.43 ± 5.98 10.22 ± 5.15 8.90 ± 2.77 9.55 ± 4.66Week 7 8.03 ± 4.09 6.52 ± 3.98 8.46 ± 5.48 8.04 ± 5.05 9.09 ± 3.31 10.31 ± 4.24Week 8 4.65 ± 5.73 7.47 ± 4.08 5.47 ± 3.69 6.71 ± 4.23 6.93 ± 3.81 5.28 ± 3.86Week 9 6.05 ± 4.06 6.42 ± 3.76 3.85 ± 4.41 5.66 ± 4.39 5.88 ± 3.63 6.56 ± 3.92Week 10 4.85 ± 4.29 4.43 ± 4.10 4.60 ± 3.42 5.62 ± 4.55 5.72 ± 3.57 3.88 ± 6.07Week 11 4.31 ± 4.32 3.94 ± 3.69 3.87 ± 4.28 4.21 ± 4.09 4.27 ± 3.82 3.36 ± 3.60Week 12 2.93 ± 6.17 5.09 ± 5.42 6.43 ± 5.36 3.53 ± 5.52 5.43 ± 3.71 6.33 ± 5.76Week 13 -1.24 ± 5.94 -2.15 ± 5.75 -1.18 ± 5.95 0.32 ± 5.48 -3.63 ± 5.64 -5.59 ± 4.30Week 14 4.81 ± 5.00 3.40 ± 4.34 3.65 ± 6.49 5.04 ± 3.61 5.43 ± 3.85 5.88 ± 5.22Week 15 4.65 ± 5.57 5.92 ± 2.99 5.15 ± 5.42 4.33 ± 5.39 2.85 ± 4.11 4.08 ± 4.57Week 16 3.52 ± 4.36 3.85 ± 4.56 2.52 ± 3.80 1.25 ± 4.84 5.08 ± 4.47 4.66 ± 3.69Week 17 2.39 ± 5.16 3.13 ± 4.29 3.21 ± 3.71 2.40 ± 4.83 2.05 ± 4.52 3.05 ± 6.34Week 18 2.05 ± 5.74 1.87 ± 3.99 2.37 ± 5.78 3.65 ± 4.92 3.46 ± 3.87 5.18 ± 5.80Week 19 2.58 ± 3.97 1.97 ± 4.08 2.08 ± 5.74 2.87 ± 5.72 3.13 ± 3.98 2.24 ± 4.45Week 20 2.64 ± 4.64 2.15 ± 4.02 2.21 ± 4.88 4.95 ± 5.96 2.78 ± 4.01 2.44 ± 4.22Week 21 3.03 ± 3.58 0.82 ± 4.08 2.92 ± 4.01 0.65 ± 4.84 2.35 ± 2.89 1.71 ± 5.72Week 22 1.01 ± 5.33 3.91 ± 3.35 3.24 ± 3.93 5.50 ± 4.98 * 3.75 ± 3.22 3.15 ± 5.90Week 23 4.95 ± 5.24 2.21 ± 3.47 2.73 ± 4.45 0.81 ± 5.22 * -0.16 ± 2.95 1.22 ± 4.16Week 24 0.55 ± 6.03 2.85 ± 4.44 1.81 ± 3.74 1.54 ± 5.58 1.54 ± 5.52 3.62 ± 4.67Week 25 4.62 ± 8.52 1.31 ± 4.79 1.76 ± 4.67 2.45 ± 6.53 1.73 ± 4.28 0.77 ± 5.96Week 26 -1.41 ± 6.37 -0.87 ± 4.81 -0.15 ± 3.01 -0.25 ± 4.25 -1.93 ± 3.04 -0.08 ± 3.91Week 27 4.15 ± 4.22 0.82 ± 4.28Week 28 6.55 ± 6.93 5.09 ± 6.06Week 29 2.86 ± 4.45 1.05 ± 4.95Week 30 0.60 ± 8.24 0.89 ± 4.77All data presented as mean ± SD. *p < 0.05 compared to negative control.Historical control data for male rats: Week 13 (g): -13.71-9.38; Week 15 (g): -2.72-24.99; Week 23 (g): -5.92-14.38; Week 1 (g): 43.20-66.65; Week 17 (g): -0.69-16.87; Week 27 (g): -2.98-9.91Historical control data for female rats: Week 22 (g): -7.40-11.72; Week 23 (g): -6.54-13.08
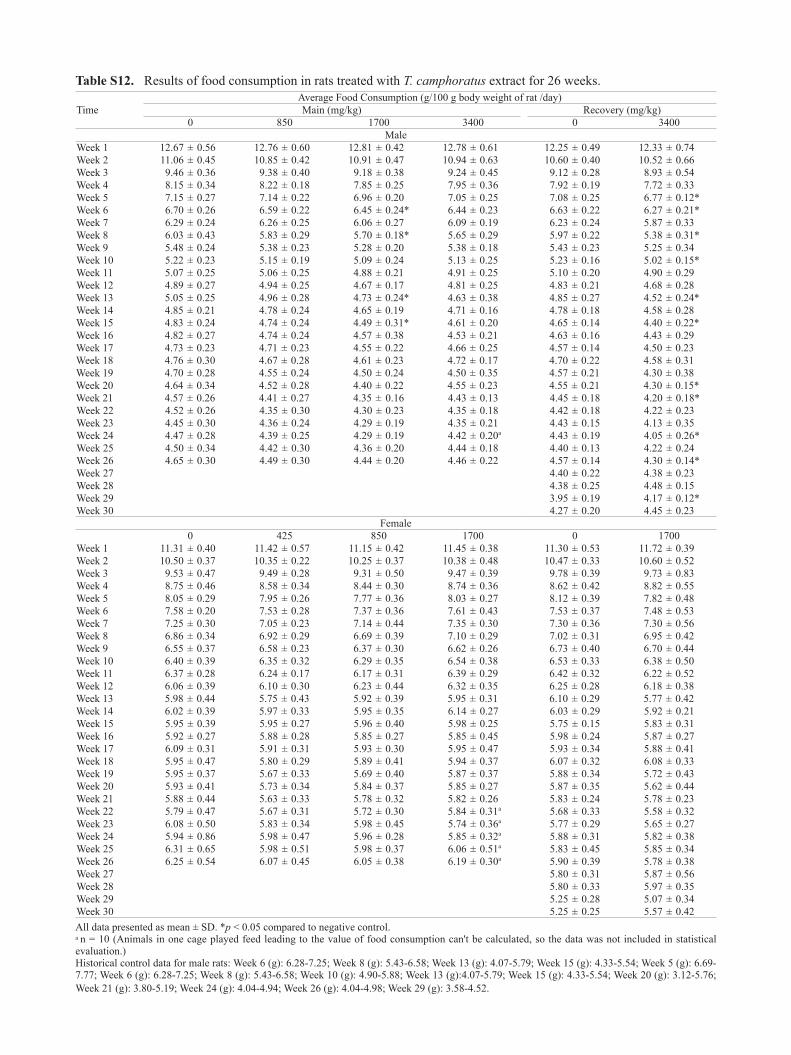
Table S12. Results of food consumption in rats treated with T. camphoratus extract for 26 weeks.
TimeAverage Food Consumption (g/100 g body weight of rat /day)Main (mg/kg) Recovery (mg/kg)
0 850 1700 3400 0 3400Male
Week 1 12.67 ± 0.56 12.76 ± 0.60 12.81 ± 0.42 12.78 ± 0.61 12.25 ± 0.49 12.33 ± 0.74Week 2 11.06 ± 0.45 10.85 ± 0.42 10.91 ± 0.47 10.94 ± 0.63 10.60 ± 0.40 10.52 ± 0.66Week 3 9.46 ± 0.36 9.38 ± 0.40 9.18 ± 0.38 9.24 ± 0.45 9.12 ± 0.28 8.93 ± 0.54Week 4 8.15 ± 0.34 8.22 ± 0.18 7.85 ± 0.25 7.95 ± 0.36 7.92 ± 0.19 7.72 ± 0.33Week 5 7.15 ± 0.27 7.14 ± 0.22 6.96 ± 0.20 7.05 ± 0.25 7.08 ± 0.25 6.77 ± 0.12*Week 6 6.70 ± 0.26 6.59 ± 0.22 6.45 ± 0.24* 6.44 ± 0.23 6.63 ± 0.22 6.27 ± 0.21*Week 7 6.29 ± 0.24 6.26 ± 0.25 6.06 ± 0.27 6.09 ± 0.19 6.23 ± 0.24 5.87 ± 0.33Week 8 6.03 ± 0.43 5.83 ± 0.29 5.70 ± 0.18* 5.65 ± 0.29 5.97 ± 0.22 5.38 ± 0.31*Week 9 5.48 ± 0.24 5.38 ± 0.23 5.28 ± 0.20 5.38 ± 0.18 5.43 ± 0.23 5.25 ± 0.34Week 10 5.22 ± 0.23 5.15 ± 0.19 5.09 ± 0.24 5.13 ± 0.25 5.23 ± 0.16 5.02 ± 0.15*Week 11 5.07 ± 0.25 5.06 ± 0.25 4.88 ± 0.21 4.91 ± 0.25 5.10 ± 0.20 4.90 ± 0.29Week 12 4.89 ± 0.27 4.94 ± 0.25 4.67 ± 0.17 4.81 ± 0.25 4.83 ± 0.21 4.68 ± 0.28Week 13 5.05 ± 0.25 4.96 ± 0.28 4.73 ± 0.24* 4.63 ± 0.38 4.85 ± 0.27 4.52 ± 0.24*Week 14 4.85 ± 0.21 4.78 ± 0.24 4.65 ± 0.19 4.71 ± 0.16 4.78 ± 0.18 4.58 ± 0.28Week 15 4.83 ± 0.24 4.74 ± 0.24 4.49 ± 0.31* 4.61 ± 0.20 4.65 ± 0.14 4.40 ± 0.22*Week 16 4.82 ± 0.27 4.74 ± 0.24 4.57 ± 0.38 4.53 ± 0.21 4.63 ± 0.16 4.43 ± 0.29Week 17 4.73 ± 0.23 4.71 ± 0.23 4.55 ± 0.22 4.66 ± 0.25 4.57 ± 0.14 4.50 ± 0.23Week 18 4.76 ± 0.30 4.67 ± 0.28 4.61 ± 0.23 4.72 ± 0.17 4.70 ± 0.22 4.58 ± 0.31Week 19 4.70 ± 0.28 4.55 ± 0.24 4.50 ± 0.24 4.50 ± 0.35 4.57 ± 0.21 4.30 ± 0.38Week 20 4.64 ± 0.34 4.52 ± 0.28 4.40 ± 0.22 4.55 ± 0.23 4.55 ± 0.21 4.30 ± 0.15*Week 21 4.57 ± 0.26 4.41 ± 0.27 4.35 ± 0.16 4.43 ± 0.13 4.45 ± 0.18 4.20 ± 0.18*Week 22 4.52 ± 0.26 4.35 ± 0.30 4.30 ± 0.23 4.35 ± 0.18 4.42 ± 0.18 4.22 ± 0.23Week 23 4.45 ± 0.30 4.36 ± 0.24 4.29 ± 0.19 4.35 ± 0.21 4.43 ± 0.15 4.13 ± 0.35Week 24 4.47 ± 0.28 4.39 ± 0.25 4.29 ± 0.19 4.42 ± 0.20a 4.43 ± 0.19 4.05 ± 0.26*Week 25 4.50 ± 0.34 4.42 ± 0.30 4.36 ± 0.20 4.44 ± 0.18 4.40 ± 0.13 4.22 ± 0.24Week 26 4.65 ± 0.30 4.49 ± 0.30 4.44 ± 0.20 4.46 ± 0.22 4.57 ± 0.14 4.30 ± 0.14*Week 27 4.40 ± 0.22 4.38 ± 0.23Week 28 4.38 ± 0.25 4.48 ± 0.15Week 29 3.95 ± 0.19 4.17 ± 0.12*Week 30 4.27 ± 0.20 4.45 ± 0.23
Female 0 425 850 1700 0 1700Week 1 11.31 ± 0.40 11.42 ± 0.57 11.15 ± 0.42 11.45 ± 0.38 11.30 ± 0.53 11.72 ± 0.39Week 2 10.50 ± 0.37 10.35 ± 0.22 10.25 ± 0.37 10.38 ± 0.48 10.47 ± 0.33 10.60 ± 0.52Week 3 9.53 ± 0.47 9.49 ± 0.28 9.31 ± 0.50 9.47 ± 0.39 9.78 ± 0.39 9.73 ± 0.83Week 4 8.75 ± 0.46 8.58 ± 0.34 8.44 ± 0.30 8.74 ± 0.36 8.62 ± 0.42 8.82 ± 0.55Week 5 8.05 ± 0.29 7.95 ± 0.26 7.77 ± 0.36 8.03 ± 0.27 8.12 ± 0.39 7.82 ± 0.48Week 6 7.58 ± 0.20 7.53 ± 0.28 7.37 ± 0.36 7.61 ± 0.43 7.53 ± 0.37 7.48 ± 0.53Week 7 7.25 ± 0.30 7.05 ± 0.23 7.14 ± 0.44 7.35 ± 0.30 7.30 ± 0.36 7.30 ± 0.56Week 8 6.86 ± 0.34 6.92 ± 0.29 6.69 ± 0.39 7.10 ± 0.29 7.02 ± 0.31 6.95 ± 0.42Week 9 6.55 ± 0.37 6.58 ± 0.23 6.37 ± 0.30 6.62 ± 0.26 6.73 ± 0.40 6.70 ± 0.44Week 10 6.40 ± 0.39 6.35 ± 0.32 6.29 ± 0.35 6.54 ± 0.38 6.53 ± 0.33 6.38 ± 0.50Week 11 6.37 ± 0.28 6.24 ± 0.17 6.17 ± 0.31 6.39 ± 0.29 6.42 ± 0.32 6.22 ± 0.52Week 12 6.06 ± 0.39 6.10 ± 0.30 6.23 ± 0.44 6.32 ± 0.35 6.25 ± 0.28 6.18 ± 0.38Week 13 5.98 ± 0.44 5.75 ± 0.43 5.92 ± 0.39 5.95 ± 0.31 6.10 ± 0.29 5.77 ± 0.42Week 14 6.02 ± 0.39 5.97 ± 0.33 5.95 ± 0.35 6.14 ± 0.27 6.03 ± 0.29 5.92 ± 0.21Week 15 5.95 ± 0.39 5.95 ± 0.27 5.96 ± 0.40 5.98 ± 0.25 5.75 ± 0.15 5.83 ± 0.31Week 16 5.92 ± 0.27 5.88 ± 0.28 5.85 ± 0.27 5.85 ± 0.45 5.98 ± 0.24 5.87 ± 0.27Week 17 6.09 ± 0.31 5.91 ± 0.31 5.93 ± 0.30 5.95 ± 0.47 5.93 ± 0.34 5.88 ± 0.41Week 18 5.95 ± 0.47 5.80 ± 0.29 5.89 ± 0.41 5.94 ± 0.37 6.07 ± 0.32 6.08 ± 0.33Week 19 5.95 ± 0.37 5.67 ± 0.33 5.69 ± 0.40 5.87 ± 0.37 5.88 ± 0.34 5.72 ± 0.43Week 20 5.93 ± 0.41 5.73 ± 0.34 5.84 ± 0.37 5.85 ± 0.27 5.87 ± 0.35 5.62 ± 0.44Week 21 5.88 ± 0.44 5.63 ± 0.33 5.78 ± 0.32 5.82 ± 0.26 5.83 ± 0.24 5.78 ± 0.23Week 22 5.79 ± 0.47 5.67 ± 0.31 5.72 ± 0.30 5.84 ± 0.31a 5.68 ± 0.33 5.58 ± 0.32Week 23 6.08 ± 0.50 5.83 ± 0.34 5.98 ± 0.45 5.74 ± 0.36a 5.77 ± 0.29 5.65 ± 0.27Week 24 5.94 ± 0.86 5.98 ± 0.47 5.96 ± 0.28 5.85 ± 0.32a 5.88 ± 0.31 5.82 ± 0.38Week 25 6.31 ± 0.65 5.98 ± 0.51 5.98 ± 0.37 6.06 ± 0.51a 5.83 ± 0.45 5.85 ± 0.34Week 26 6.25 ± 0.54 6.07 ± 0.45 6.05 ± 0.38 6.19 ± 0.30a 5.90 ± 0.39 5.78 ± 0.38Week 27 5.80 ± 0.31 5.87 ± 0.56Week 28 5.80 ± 0.33 5.97 ± 0.35Week 29 5.25 ± 0.28 5.07 ± 0.34Week 30 5.25 ± 0.25 5.57 ± 0.42All data presented as mean ± SD. *p < 0.05 compared to negative control.a n = 10 (Animals in one cage played feed leading to the value of food consumption can't be calculated, so the data was not included in statistical evaluation.)Historical control data for male rats: Week 6 (g): 6.28-7.25; Week 8 (g): 5.43-6.58; Week 13 (g): 4.07-5.79; Week 15 (g): 4.33-5.54; Week 5 (g): 6.69-7.77; Week 6 (g): 6.28-7.25; Week 8 (g): 5.43-6.58; Week 10 (g): 4.90-5.88; Week 13 (g):4.07-5.79; Week 15 (g): 4.33-5.54; Week 20 (g): 3.12-5.76; Week 21 (g): 3.80-5.19; Week 24 (g): 4.04-4.94; Week 26 (g): 4.04-4.98; Week 29 (g): 3.58-4.52.

Table S13. Results of clinical observation in rats treated with T. camphoratus extract for 26 weeks.Male Incidence (n’/n’)1
Dose (mg/kg/day)
Clinical signs
Day 1-13
Day 14-23
Day 24-31
Day 32-33
Day 34
Day 35
Day 36-42
Day 43-47
Day 48-49
Day 50-54
Day 55-56
Day 57-65
Day 66-96
0
Hair loss 0/22 0/22 0/22 1/22 2/22 1/22 2/22 1/22 1/22 1/22 2/22 2/22 3/22Wounds 0/22 0/22 0/22 1/22 1/22 1/22 1/22 0/22 0/22 0/22 0/22 0/22 0/22
Teeth damage 0/22 0/22 0/22 0/22 0/22 0/22 0/22 0/22 0/22 0/22 0/22 0/22 0/22
850Hair loss 0/22 0/22 0/22 0/22 0/22 0/22 0/22 0/22 0/22 0/22 0/22 0/22 0/22
Chromoda cryorrhea 0/22 0/22 0/22 0/22 0/22 0/22 0/22 0/22 0/22 0/22 0/22 0/22 0/22
1700Hair loss 0/22 1/22 0/22 2/22 2/22 2/22 2/22 2/22 1/22 2/22 2/22 1/22 1/22Wounds 0/22 0/22 0/22 2/22 2/22 2/22 2/22 2/22 1/22 2/22 2/22 1/22 1/22Swelling 0/22 0/22 0/22 0/22 0/22 0/22 0/22 0/22 0/22 0/22 0/22 0/22 0/22
3400Hair loss 0/22 0/22 0/22 0/22 0/22 0/22 0/22 0/22 0/22 0/22 0/22 0/22 0/22
Teeth damage 0/22 0/22 0/22 0/22 0/22 0/22 0/22 0/22 0/22 0/22 0/22 0/22 0/22
Day
97-100Day
101-102Day
103-107Day
108-137Day
138-139Day
140-141Day
142-144Day
145-147Day
148-168Day
169-174Day
175-181Day 182
Total Incidence
(n/n)2
0
Hair loss 3/22 3/22 3/22 3/22 3/22 3/22 3/22 3/22 3/22 3/22 3/22 3/22 5/22Wounds 0/22 0/22 0/22 0/22 0/22 0/22 1/22 1/22 0/22 0/22 0/22 0/22 2/22
Teeth damage 0/22 0/22 0/22 0/22 0/22 0/22 0/22 0/22 0/22 0/22 1/22 0/22 1/22
850Hair loss 1/22 1/22 1/22 1/22 1/22 1/22 1/22 1/22 1/22 1/22 1/22 1/22 1/22
Chromoda cryorrhea 0/22 1/22 0/22 1/22 1/22 1/22 1/22 1/22 1/22 1/22 1/22 1/22 1/22
1700Hair loss 1/22 1/22 1/22 1/22 1/22 1/22 1/22 1/22 1/22 1/22 1/22 1/22 2/22Wounds 1/22 1/22 1/22 1/22 1/22 1/22 1/22 1/22 1/22 1/22 1/22 1/22 2/22Swelling 0/22 0/22 0/22 0/22 1/22 1/22 1/22 1/22 1/22 0/22 0/22 0/22 1/22
3400Hair loss 0/22 0/22 0/22 0/22 0/22 1/22 1/23 0/22 0/22 0/22 0/22 0/22 1/22
Teeth damage 0/22 0/22 0/22 0/22 0/22 0/22 0/23 0/22 0/22 0/22 0/22 1/22 1/22
Female Incidence (n’/n’)1
Dose (mg/kg/day)
Clinical signs
Day 1-33
Day 34-39
Day 40-52
Day 53-55
Day 56-57
Day 58
Day 59-60
Day 61-68
Day 69-72
Day 73-86
Day 87-88
Day 89-90
Day 91-102
Day 103
0
Hair loss 0/22 1/22 1/22 1/22 1/22 1/22 2/22 2/22 2/22 2/22 2/22 2/22 2/22 2/22Wounds 0/22 1/22 1/22 1/22 0/22 0/22 0/22 0/22 0/22 0/22 0/22 0/22 0/22 0/22
Teeth damage 0/22 0/22 0/22 0/22 0/22 0/22 0/22 0/22 0/22 0/22 0/22 0/22 0/22 0/22
425Hair loss 0/22 0/22 0/22 0/22 0/22 0/22 0/22 0/22 0/22 0/22 2/22 3/22 2/22 1/22Wounds 0/22 0/22 0/22 0/22 0/22 0/22 0/22 0/22 0/22 0/22 0/22 0/22 0/22 0/22
Mass 0/22 0/22 0/22 0/22 0/22 0/22 0/22 0/22 0/22 0/22 0/22 0/22 0/22 0/22
850Hair loss 0/22 0/22 0/22 1/22 1/22 2/22 2/22 3/22 3/22 4/22 4/22 4/22 4/22 4/22Wounds 0/22 0/22 0/22 0/22 0/22 0/22 0/22 1/22 1/22 1/22 1/22 1/22 1/22 1/22
1700Hair loss 0/22 0/22 1/22 1/22 1/22 1/22 1/22 1/22 2/22 2/22 2/22 3/22 2/22 2/22Wounds 0/22 0/22 0/22 0/22 0/22 0/22 0/22 0/22 0/22 0/22 0/22 0/22 0/22 0/22Swelling 0/22 0/22 0/22 0/22 0/22 0/22 0/22 0/22 0/22 0/22 0/22 0/22 0/22 0/22
Day
104-112Day
113-123Day
124-125Day 126
Day 127-136
Day 137-141
Day 142-145
Day 146-150
Day 151-158
Day 159-161
Day 162-171
Day 172-182
Total Incidence
(n/n)2
0
Hair loss 2/22 2/22 2/22 2/22 1/22 1/22 2/22 2/22 2/22 2/22 2/22 2/22 3/22
Wounds 0/22 0/22 0/22 0/22 0/22 0/22 1/22 1/22 1/22 1/22 1/22 1/22 2/22Teeth
damage 0/22 0/22 0/22 0/22 0/22 0/22 0/22 0/22 0/22 0/22 1/22 0/22 1/22
425Hair loss 1/22 1/22 1/22 1/22 1/22 1/22 1/22 1/22 1/22 1/22 1/22 1/22 3/22
Wounds 1/22 2/22 2/22 2/22 2/22 2/22 2/22 2/22 1/22 1/22 1/22 1/22 2/22Mass 0/22 0/22 0/22 0/22 0/22 0/22 1/22 1/22 1/22 1/22 1/22 1/22 1/22
850Hair loss 4/22 4/22 4/22 4/22 4/22 4/22 4/22 4/22 4/22 5/22 5/22 5/22 5/22
Wounds 1/22 1/22 1/22 1/22 1/22 1/22 1/22 1/22 1/22 1/22 1/22 1/22 1/22
1700Hair loss 2/22 2/22 3/22 5/22 7/22 7/22 7/22 7/22 7/22 7/22 7/22 7/22 9/22
Wounds 0/22 0/22 0/22 0/22 0/22 1/22 1/22 0/22 0/22 0/22 0/22 0/22 1/22Swelling 0/22 0/22 0/22 0/22 0/22 1/22 1/22 0/22 0/22 0/22 0/22 0/22 1/22

Male-Recovery Incidence (n’/n’)1
Dose (mg/kg/day)
Clinical signs
Day 1-11
Day 12-31
Day 32-33
Day 34-41
Day 42-49
Day 50-81
Day 82-90
Day 91-98
Day 99-112
Day 113-142
Day 143-168
Day 169-210
Total Incidence (n/n)2
0
Hair loss 0/12 0/12 1/12 1/12 1/12 1/12 2/12 2/12 2/12 1/12 2/12 1/12 4/12Wounds 0/12 0/12 0/12 1/12 1/12 1/12 2/12 2/12 2/12 1/12 1/12 1/12 3/12
Teeth damage 0/12 1/12 1/12 1/12 1/12 1/12 1/12 1/12 1/12 1/12 1/12 1/12 1/12
3400 Hair loss 0/12 0/12 0/12 0/12 0/12 1/12 1/12 1/12 1/12 1/12 0/12 0/12 1/12Wounds 0/12 0/12 0/12 0/12 1/12 1/12 1/12 1/12 1/12 1/12 0/12 0/12 1/12
Female-Recovery Day 1-63
Day 64-69
Day 70-110
Day 111-120
Day 120-139
Day 140-191
Day 193-210
Total Incidence
(n/n)2
0 Hair loss 0/12 1/12 1/12 1/12 1/12 2/12 2/12 2/12
1700 Hair loss 0/12 0/12 0/12 1/12 1/12 1/12 0/12 1/12 Wounds 0/12 0/12 1/12 1/12 1/12 1/12 1/12 1/12
1n’/n’: Number of animals with observed sign / Number of animals alive.2 n/n: Total number of animals with observable sign / Total number of animals examined.Note: Ceased of two days of clinical observation, due to the effect of typhoon.
Table S13. (Continued).

Table S14. Results of histopathologic findings in rats treated with T. camphoratus extract for 26 weeks. Gender
Vehicle control High-doseMale Female Male Female
Histopathologic findings a N/Nb
Harderian glandsInfiltration, mononuclear cell, focal, minimal to mild 4/22 8/22 4/22 3/22 Score value c 0.23 ± 0.53 0.36 ± 0.49 0.18 ± 0.39 0.14 ± 0.35 PituitaryCyst, focal, minimal 2/22 1/22 - 1/22 Score value c 0.09 ± 0.29 0.05 ± 0.21 0 0.05 ± 0.21 Lymph nodes, mandibularHyperplasia, diffuse, minimal - - 1/22 -Score value c 0 0 0.05 ± 0.21 0 ThyroidCyst, ultimobranchial, focal, minimal 2/22 1/22 2/22 2/22 Score value c 0.09 ± 0.29 0.05 ± 0.21 0.09 ± 0.29 0.09 ± 0.29 Ectopic thymic tissue, focal, minimal - 1/22 - -Score value c 0 0.05 ± 0.21 0 0 LungInfiltration, histocyte, focal, minimal 2/22 - 1/22 -Score value c 0.09 ± 0.29 0 0.05 ± 0.21 0 Infiltration, crystal, focal, minimal 1/22 - - -Score value c 0.05 ± 0.21 0 0 0 PancreasNecrosis, focal, minimal 2/22 - 1/22 -Score value c 0.09 ± 0.29 0 0.05 ± 0.21 0 LiverInfiltration, mononuclear cell, focal, minimal 5/22 4/22 3/22 5/22 Score value c 0.23 ± 0.43 0.18 ± 0.39 0.14 ± 0.35 0.23 ± 0.43 Necrosis, focal, minimal to mild 1/22 1/22 2/22 -Score value c 0.09 ± 0.43 0.05 ± 0.21 0.09 ± 0.29 0 Infiltration, fatty droplet, diffuse, mild - - 1/22 -Score value c 0 0 0.09 ± 0.43 0 Cyst, focal, minimal - - - 1/22 Score value c 0 0 0 0.05 ± 0.21 KidneysCyst, cortex, focal, minimal 1/22 3/22 - -Score value c 0.05 ± 0.21 0.14 ± 0.35 0 0 Infiltration, mononuclear cell, focal, minimal 3/22 1/22 1/22 -Score value c 0.14 ± 0.35 0.05 ± 0.21 0.05 ± 0.21 0 Hyaline cast, cortex, multifocal, minimal to mild 1/22 1/22 2/22 1/22 Score value c 0.09 ± 0.43 0.09 ± 0.43 0.14 ± 0.47 0.09 ± 0.43 Mineralization, cortex, multifocal, minimal to moderate 1/22 11/22 - 11/22 Score value c 0.05 ± 0.21 0.68 ± 0.89 0 0.77 ± 0.92 Degeneration/necrosis, cortex, focal, minimal to mild - - 2/22 4/22 Score value c 0 0 0.09 ± 0.29 0.23 ± 0.53 AdrenalsHypertrophy, cortex, diffuse, minimal - - - 3/22 Score value c 0 0 0 0.14 ± 0.35 Vascuolation, cortex, focal, minimal to mild - - 1/22 2/22 Score value c 0 0 0.05 ± 0.21 0.14 ± 0.47 Ovaries and oviductFollicle-cyst, focal, minimal N/A 2/22 N/A 1/22 Score value c N/A 0.09 ± 0.29 N/A 0.05 ± 0.21 TestesAtrophy, diffuse, minimal to moderate 1/22 N/A 1/22 N/A Score value c 0.05 ± 0.21 N/A 0.14 ± 0.64 N/A EpididymisAtrophy, diffuse, minimal to moderate 1/22 N/A 1/22 N/A Score value c 0.05 ± 0.21 N/A 0.14 ± 0.64 N/A
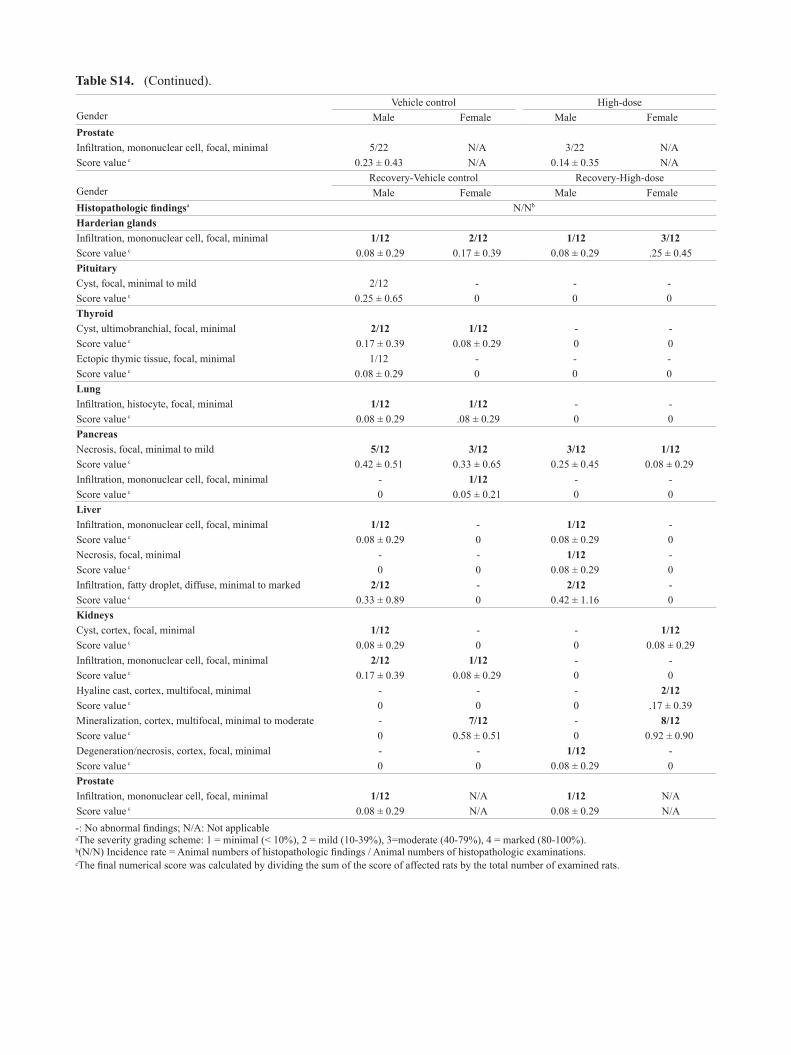
Gender
Vehicle control High-doseMale Female Male Female
ProstateInfiltration, mononuclear cell, focal, minimal 5/22 N/A 3/22 N/A Score value c 0.23 ± 0.43 N/A 0.14 ± 0.35 N/A Gender
Recovery-Vehicle control Recovery-High-doseMale Female Male Female
Histopathologic findingsa N/Nb
Harderian glandsInfiltration, mononuclear cell, focal, minimal 1/12 2/12 1/12 3/12 Score value c 0.08 ± 0.29 0.17 ± 0.39 0.08 ± 0.29 .25 ± 0.45 PituitaryCyst, focal, minimal to mild 2/12 - - -Score value c 0.25 ± 0.65 0 0 0ThyroidCyst, ultimobranchial, focal, minimal 2/12 1/12 - - Score value c 0.17 ± 0.39 0.08 ± 0.29 0 0 Ectopic thymic tissue, focal, minimal 1/12 - - -Score value c 0.08 ± 0.29 0 0 0LungInfiltration, histocyte, focal, minimal 1/12 1/12 - - Score value c 0.08 ± 0.29 .08 ± 0.29 0 0 PancreasNecrosis, focal, minimal to mild 5/12 3/12 3/12 1/12 Score value c 0.42 ± 0.51 0.33 ± 0.65 0.25 ± 0.45 0.08 ± 0.29 Infiltration, mononuclear cell, focal, minimal - 1/12 - - Score value c 0 0.05 ± 0.21 0 0 LiverInfiltration, mononuclear cell, focal, minimal 1/12 - 1/12 - Score value c 0.08 ± 0.29 0 0.08 ± 0.29 0 Necrosis, focal, minimal - - 1/12 - Score value c 0 0 0.08 ± 0.29 0 Infiltration, fatty droplet, diffuse, minimal to marked 2/12 - 2/12 - Score value c 0.33 ± 0.89 0 0.42 ± 1.16 0 KidneysCyst, cortex, focal, minimal 1/12 - - 1/12 Score value c 0.08 ± 0.29 0 0 0.08 ± 0.29 Infiltration, mononuclear cell, focal, minimal 2/12 1/12 - - Score value c 0.17 ± 0.39 0.08 ± 0.29 0 0 Hyaline cast, cortex, multifocal, minimal - - - 2/12 Score value c 0 0 0 .17 ± 0.39 Mineralization, cortex, multifocal, minimal to moderate - 7/12 - 8/12 Score value c 0 0.58 ± 0.51 0 0.92 ± 0.90 Degeneration/necrosis, cortex, focal, minimal - - 1/12 - Score value c 0 0 0.08 ± 0.29 0 ProstateInfiltration, mononuclear cell, focal, minimal 1/12 N/A 1/12 N/A Score value c 0.08 ± 0.29 N/A 0.08 ± 0.29 N/A -: No abnormal findings; N/A: Not applicableaThe severity grading scheme: 1 = minimal (< 10%), 2 = mild (10-39%), 3=moderate (40-79%), 4 = marked (80-100%).b(N/N) Incidence rate = Animal numbers of histopathologic findings / Animal numbers of histopathologic examinations.cThe final numerical score was calculated by dividing the sum of the score of affected rats by the total number of examined rats.
Table S14. (Continued).

Table S15. Summary of the gross findings in beagle dogs.Dose (mg/kg) 0 540 900 1500Gender Male Female Male Female Male Female Male FemaleGross findings N/NEpididymides
Absence, right 0/5 N/A 0/4 N/A 0/3 N/A 1/5 N/ALungDiscoloration, yellow, diffuse 0/5 0/5 1/4 0/3 0/3 0/3 0/5 0/5Abnormal consistency, firm, diffuse 0/5 0/5 1/4 0/3 0/3 0/3 0/5 0/5N/N: Animal numbers of pathologic findings / Animal numbers of gross pathologic examinationsN/A: Not applicable.
Table S16. Summary of histopathologic findings in beagle dogs. Vehicle control High-doseGender Male Female Male FemaleHistopathologic findings Sa N/Nc (mean severity score ± SD)b
Salivary gland, mandibular
Infiltration, mononuclear cell, focal 1 0/3 (0) 0/3 (0) 1/3 (0.33 ± 0.58) 0/3 (0)
LungInfiltration, mononuclear cell, multifocal 1 1/3
(0.33 ± 0.58) 0/3 (0) 1/3 (0.33 ± 0.58)
1/3 (0.33 ± 0.58)
Kidneys
Infiltration, mononuclear cell, focal 1 0/3 (0) 0/3 (0) 1/3 (0.33 ± 0.58) 0/3 (0)
Epididymides
Aplasia, right N/A 0/3 (N/A) N/A 1/3 (N/A) N/ARecovery Animals
Gender
Vehicle control High-dose Male Female Male Female
Histopathologic findings Sb N/N d (mean severity score ± SD) c
Lung
Infiltration, mononuclear cell, multifocal 1 0/2 (0) 0/2 (0) 0/2 (0) 1/2
(0.50 ± 0.71)N/A: Not applicableaThe severity grading scheme: 1=minimal (< 10%), 2=mild (10-39%), 3=moderate (40-79%), 4= marked (80-100%).bThe final numerical score was calculated by dividing the sum of the score of affected dogs by the total number of examined dogs.c(N/N) Incidence rate=Animal numbers of histopathologic findings / Animal numbers of histopathologic examination